Embed Size (px)
Citation preview

www.nvf.cz/observatory
Barriers Barriers toto participation in participation in continuing education: continuing education:
The Czech Republic caseThe Czech Republic case
Věra CzesanáVěra Czesaná
National Training Fund
Lille, May 21th – 23th, 2008
1

www.nvf.cz/observatory
National Observatory of Employment and Training
NOET provides information, carries out research, collects data including field surveys, and analyses development trends in the labour market and education in the following main areas: analyses of mutual links between LM and education (especially
access to education, role of education in increasing employability);
analyses of the HRD as a resource and result of competitiveness of the economy (quality of HR, HR in knowledge and technology intensive industries);
development of methodology and provision of forecasting of labour market qualification needs at the national, sectoral and regional levels;
NOET co-operates closely with national ministries, EC, OECD, Cedefop (European Centre for the Development of Vocational Training) and other partner institutions. It takes part in the expert European networks: ReferNet (national co-ordinator) and SkillsNet (international network for co-operation in forecasting skills needs).
2

www.nvf.cz/observatory
Structure of presentation
Participation in continuing education in the CR
Survey on barriers to participation – methodology
Reasons for not participating
Factor analysis approach
What are the main barriers for different social groups
Conclusions
3
www.nvf.cz/observatory
Participation in continuing education in the CR
1.4
1.6
2.1
4.2
4.4
4.4
5.0
5.0
5.3
5.5
6.1
6.3
6.8
7.8
8.0
8.4
8.6
8.7
9.9
11.4
11.6
14.4
16.4
17.5
17.6
23.0
27.5
28.7
0.0 10.0 20.0 30.0 40.0
BG
ROGR
HU
PT
SKLT
PL
EE
MTCZ
IT
LV
DEFR
BE
CY
IEEU-27
EU-15
ES
ATNL
SE
SI
FIUK
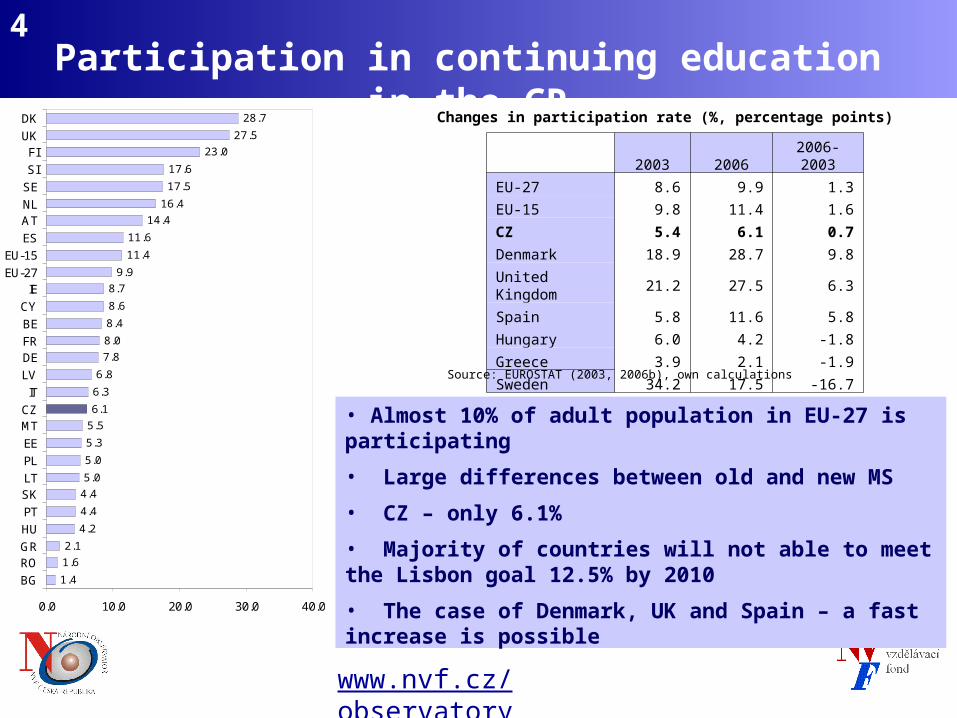
DK Changes in participation rate (%, percentage points)
2003 2006 2006-2003
EU-27 8.6 9.9 1.3
EU-15 9.8 11.4 1.6
CZ 5.4 6.1 0.7
Denmark 18.9 28.7 9.8
United Kingdom 21.2 27.5 6.3
Spain 5.8 11.6 5.8
Hungary 6.0 4.2 -1.8
Greece 3.9 2.1 -1.9
Sweden 34.2 17.5 -16.7
Source: EUROSTAT (2003, 2006b), own calculations
• Almost 10% of adult population in EU-27 is participating
• Large differences between old and new MS
• CZ – only 6.1%
• Majority of countries will not able to meet the Lisbon goal 12.5% by 2010
• The case of Denmark, UK and Spain – a fast increase is possible
4

www.nvf.cz/observatory
Survey on barriers - methodology
Unemploy ed
4,7
Enterpreuners
10,7Employ ees
63,6
Unknown
0,2Inactiv e
20,8
Characteristics of the sample:
• 2 987 persons aged 25 to 64 (quota selection corresponding to the census)
• participation, barriers - all types of education (EUROSTAT definition),12 months
• identification following gender, age, educational attainment, LM position, profession, income, size of the residence place, company size, industry, foreign capital stake)
Method: face to face interview, 11 factual questions + 10 identification questions
5

www.nvf.cz/observatory
Survey - participation in education I.
48
46
43
26
41
39
19
30
48
71
25
46
58
36
43
43
40
-52
-54
-57
-74
-59
-61
-81
-70
-52
-29
-75
-54
-42
-64
-57
-57
-60
-90-80-70-60-50-40-30-20-1001020304050607080
25-34
35-4445-54
55-64Male
Female0-2
3c3a
5+6
1-10.000 CZK10.001-15.000 CZK
over 15.000 CZK0-5 th.
5-100 th.over 100 th.
TOTAL
Ag
eG
en
der
ISC
ED
Inco
me
Pla
ce o
f
livin
g -
siz
e
participate %
not part. %
Source: NOZV-NVF, CVVM 2005
• Disadvantaged people in pre-retirement age
• Large differences according to education attainment and income (very low participation for people with basic as well as secondary levels)
• Small differences according to the size of living place (except vilages)
6
www.nvf.cz/observatory
Survey - participation in education II.
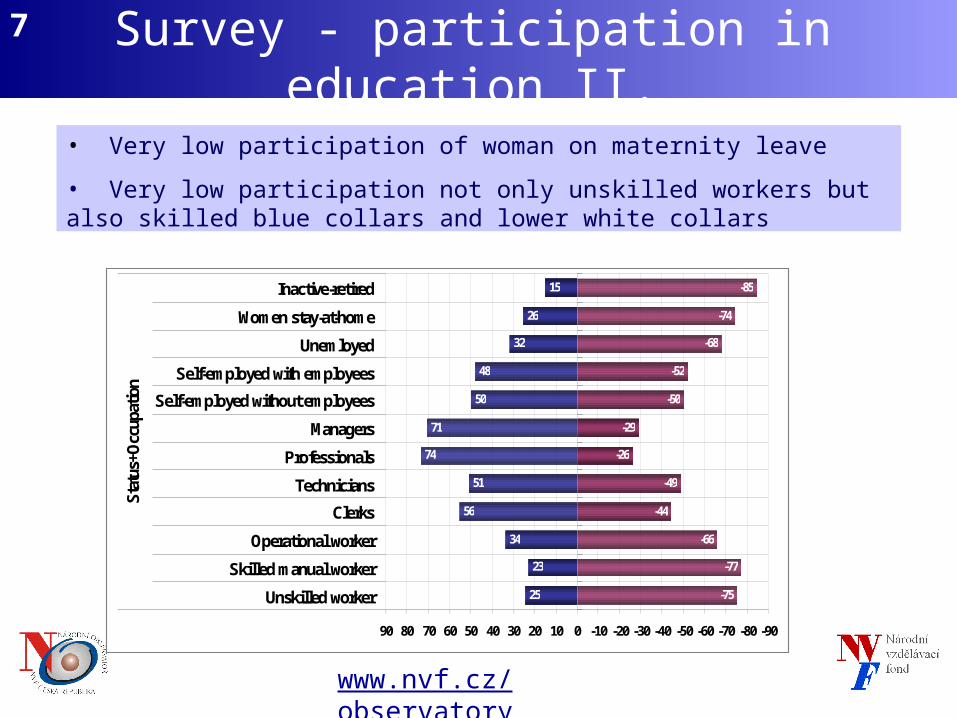
Source: NOZV-NVF, CVVM 2005
15
26
32
48
50
71
74
51
56
34
23
25
-85
-74
-68
-52
-50
-29
-26
-49
-44
-66
-77
-75
-90-80-70-60-50-40-30-20-100102030405060708090
Inactive-retired
Women stay-at-home
Unemloyed
Self-employed with employees
Self-employed without employees
Managers
Professionals
Technicians
Clerks
Operational worker
Skilled manual worker
Unskilled worker
Stat
us+O
ccup
atio
n• Very low participation of woman on maternity leave
• Very low participation not only unskilled workers but also skilled blue collars and lower white collars
7
www.nvf.cz/observatory
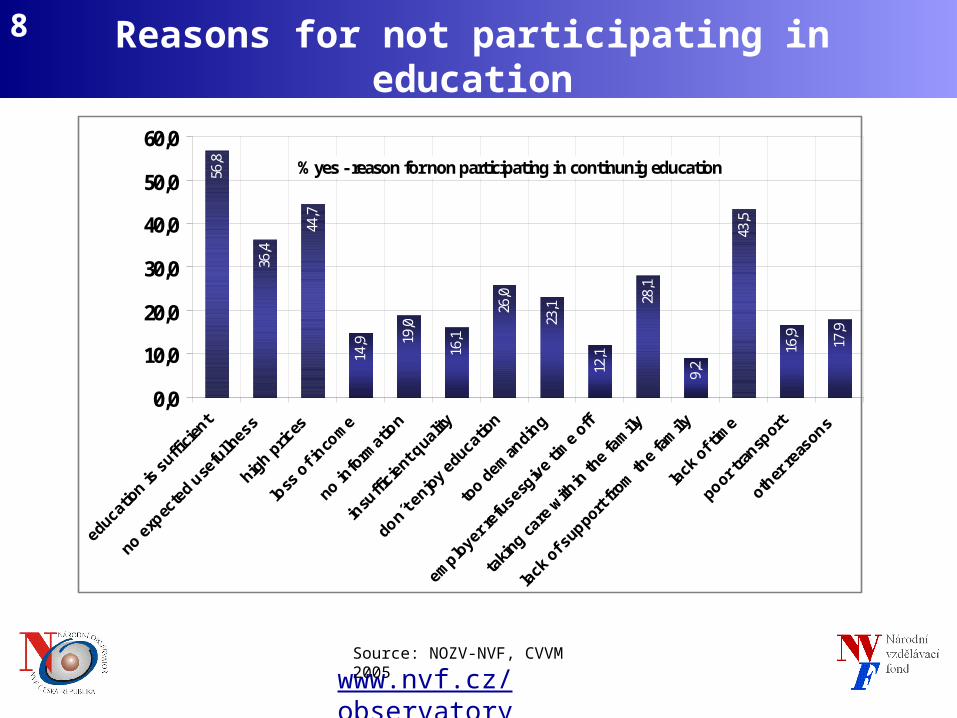
Reasons for not participating in education
Source: NOZV-NVF, CVVM 2005
% yes - reason for non participating in continunig education
56,8
36,4
44,7
14,9 19
,0
16,1
26,0
23,1
12,1
28,1
9,2
43,5
16,9 17,9
0,0
10,0
20,0
30,0
40,0
50,0
60,0
8
www.nvf.cz/observatory
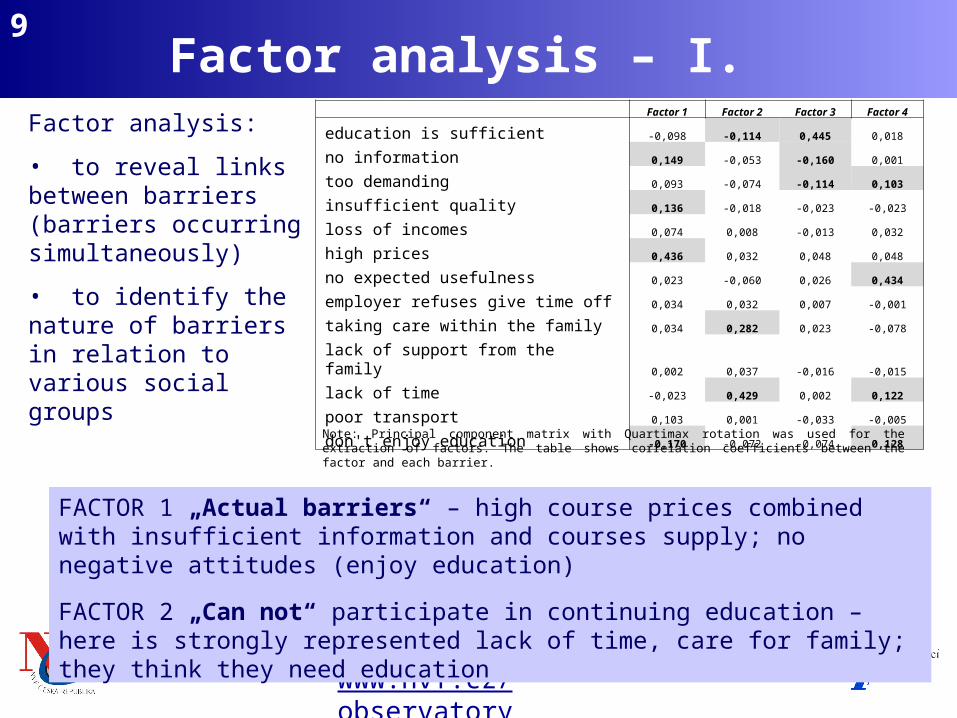
Factor analysis – I.Factor analysis:
• to reveal links between barriers (barriers occurring simultaneously)
• to identify the nature of barriers in relation to various social groups
Factor 1 Factor 2 Factor 3 Factor 4
education is sufficient -0,098 -0,114 0,445 0,018
no information 0,149 -0,053 -0,160 0,001
too demanding 0,093 -0,074 -0,114 0,103
insufficient quality 0,136 -0,018 -0,023 -0,023
loss of incomes 0,074 0,008 -0,013 0,032
high prices 0,436 0,032 0,048 0,048
no expected usefulness 0,023 -0,060 0,026 0,434
employer refuses give time off 0,034 0,032 0,007 -0,001
taking care within the family 0,034 0,282 0,023 -0,078
lack of support from the family 0,002 0,037 -0,016 -0,015
lack of time -0,023 0,429 0,002 0,122
poor transport 0,103 0,001 -0,033 -0,005
don't enjoy education -0,170 -0,072 -0,074 0,128
Note: Principal component matrix with Quartimax rotation was used for the extraction of factors. The table shows correlation coefficients between the factor and each barrier.
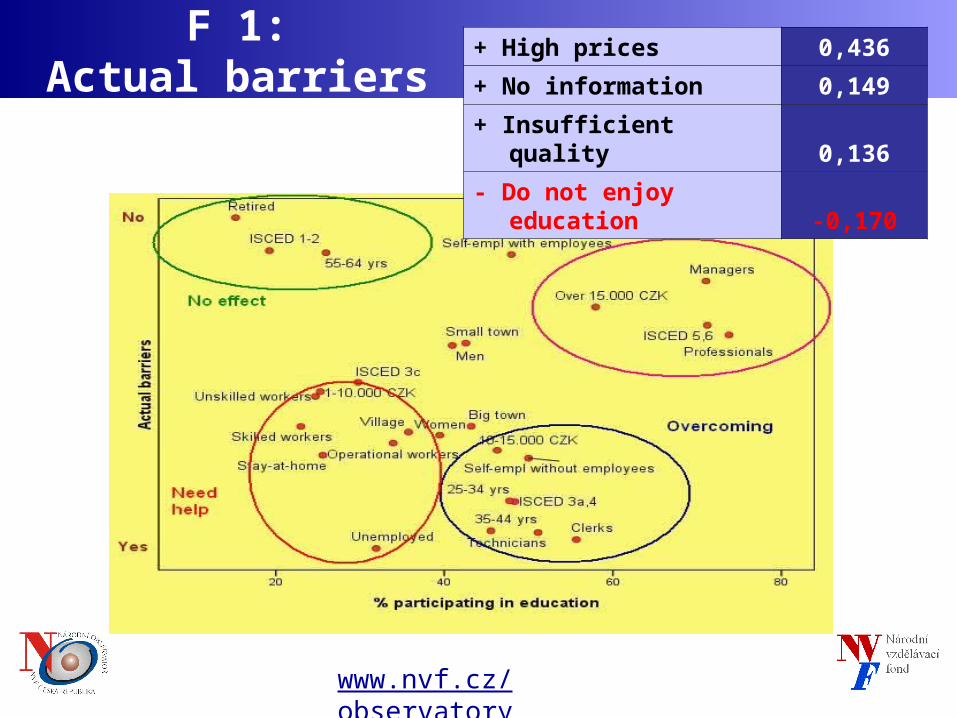
FACTOR 1 „Actual barriers“ – high course prices combined with insufficient information and courses supply; no negative attitudes (enjoy education)
FACTOR 2 „Can not“ participate in continuing education – here is strongly represented lack of time, care for family; they think they need education
9

www.nvf.cz/observatory
Factor analysis – II.
FACTOR 3 „Does not need“ continuing education – considering qualification to be sufficient, no lack of information, no fear of education
FACTOR 4 „Given up“ – clearly headed by the barrier „education does not offer the expected usefulness, negative attitude (does not enjoy), fear of education (education is too demanding)
Factor 1 Factor 2 Factor 3 Factor 4
education is sufficient -0,098 -0,114 0,445 0,018
no information 0,149 -0,053 -0,160 0,001
too demanding 0,093 -0,074 -0,114 0,103
insufficient quality 0,136 -0,018 -0,023 -0,023
loss of incomes 0,074 0,008 -0,013 0,032
high prices 0,436 0,032 0,048 0,048
no expected usefulness 0,023 -0,060 0,026 0,434
employer refuses give time off 0,034 0,032 0,007 -0,001
taking care within the family 0,034 0,282 0,023 -0,078
lack of support from the family 0,002 0,037 -0,016 -0,015
lack of time -0,023 0,429 0,002 0,122
poor transport 0,103 0,001 -0,033 -0,005
don't enjoy education -0,170 -0,072 -0,074 0,128
Note: Principal component matrix with Quartimax rotation was used for the extraction of factors. The table shows correlation coefficients between the factor and each barrier.
10
www.nvf.cz/observatory
F 1:Actual barriers
+ High prices 0,436
+ No information 0,149
+ Insufficient quality 0,136
- Do not enjoy education -0,170
11

www.nvf.cz/observatory
F2: Can not
participate
+ Lack of time 0,429
+ Taking care within the family 0,282
- Education is sufficient -0,114
12

www.nvf.cz/observatory
F3: Does not need education
+ Education is sufficient 0,445
- No information -0,160
- Too demanding -0,114
13

www.nvf.cz/observatory
F4: Has given up on education
+ No expected usefulness 0,434
+ Do not enjoy education 0,128
+ Lack of time 0,122
+ Too demanding 0,103
14

www.nvf.cz/observatory
Conclusions15
• The situation in the CR is characterised by low participation in continuing education which is a danger not only for disadvantaged groups but also for large groups people with medium qualification and income
• Different combination of factors is typical for individual social groups – policy measures must respect specificities if they are to be effective
• Factor analysis identified 4 groups of barriers that people are facing: - actual barriers, - can not participate, - do not need education, - given-up.
•The factor analysis in combination with participation characteristics helps to reveal the right policy measures tailored made for individual social groups
• Special measures for social groups they need help; some support for people that try to overcome barriers (the results could be probably the most effective ones); activation measures for people that have given-up (large group of people)