Embed Size (px)
Citation preview

ww
w.li
rnea
sia.
net
ww
w.li
rnea
sia.
net
Integrating ICT questions in the work of National Statistical Organizations
Harsha de SilvaLead Economist, LIRNEasia
WDR Expert Forum
some thoughts for discussion

ww
w.li
rnea
sia.
net
The digital divide
Is the digital divide Closing? Widening?
Or, does it depends on how you look at it?
ww
w.li
rnea
sia.
net
Looks like it is closing?
“80% of the people in the world have never heard a dial tone” Kofi Annan, 1999
“More than 80% of people in Pakistan, India, Sri Lanka, Thailand and the Philippines have used a phone in the last 3 months” LIRNEasia, 2006
ww
w.li
rnea
sia.
net
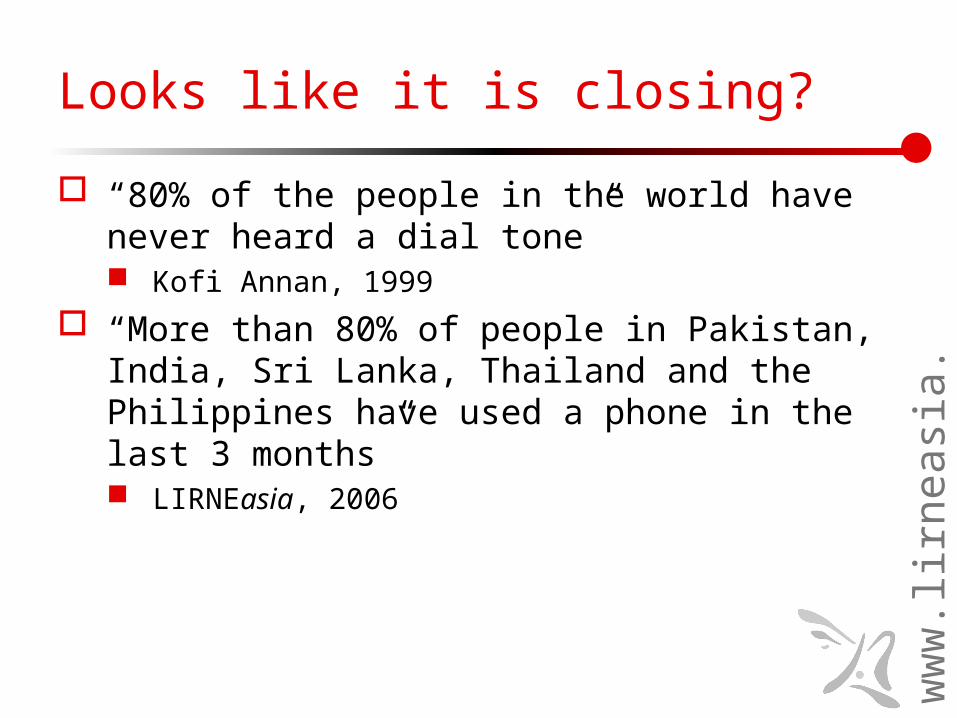
Looks like it is widening?
India teledensity: urban vs. rural story
0
5
10
15
20
25
30
35
2000 2001 2002 2003 2004 2005 2006
Pho
nes
per
100
inha
bita
nts
Urban
Rural
ww
w.li
rnea
sia.
net
How much do we really know?
What data do we have? Lot of supply side data Very little on the demand side
Who is collecting data? Operators; subscribers or owners National Regulatory Agencies [through network
operators]; owners Central Banks; users, but limited International bodies like ITU [through NRAs]; owners Research agencies; users [owners and non owners]
What about National Statistical Organizations?
ww
w.li
rnea
sia.
net
National Statistical Organizations
Census Information collected from every member of the
population Population and household census; every 10 years Industry census, agriculture census etc.
Sample surveys Information only from a sub-sector of a population
ww
w.li
rnea
sia.
net
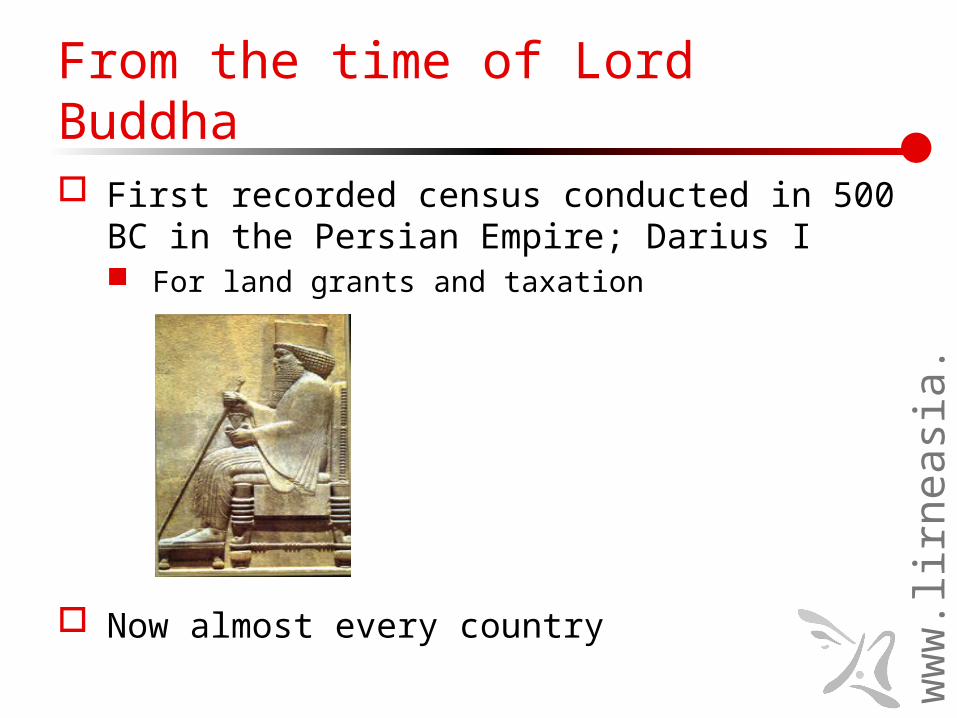
From the time of Lord Buddha
First recorded census conducted in 500 BC in the Persian Empire; Darius I For land grants and taxation
Now almost every country
ww
w.li
rnea
sia.
net
Has legal authority
India Census
Since 1872; every 10 years; 2001 Compulsory for every citizen to answer the entire
questionnaire truthfully; penalties possible Sample surveys
Household Income and Expenditure surveys Communication expenditure
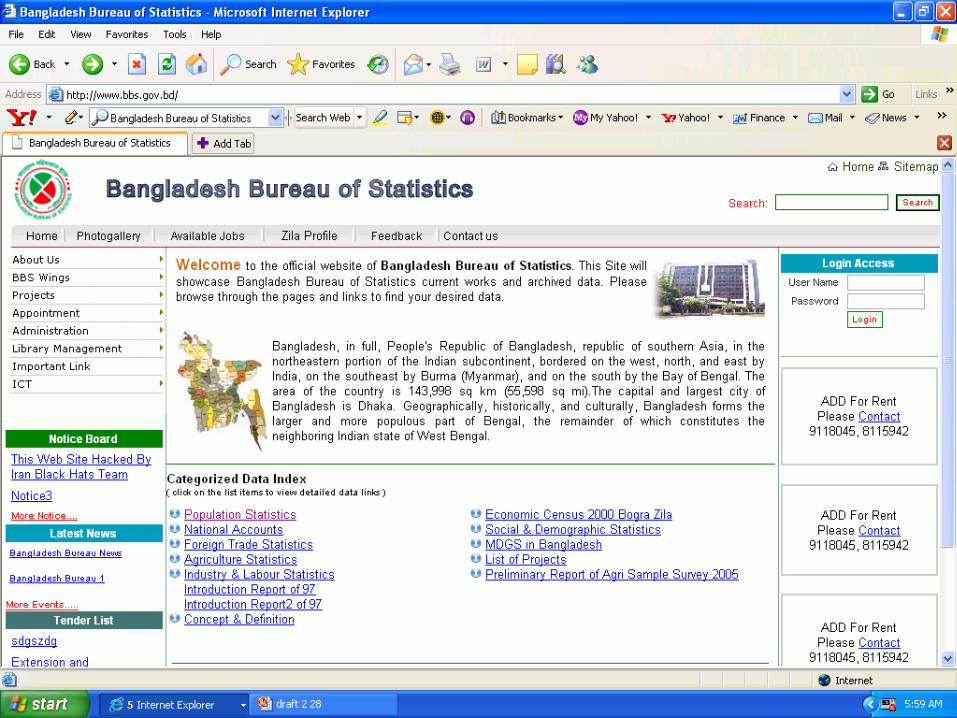
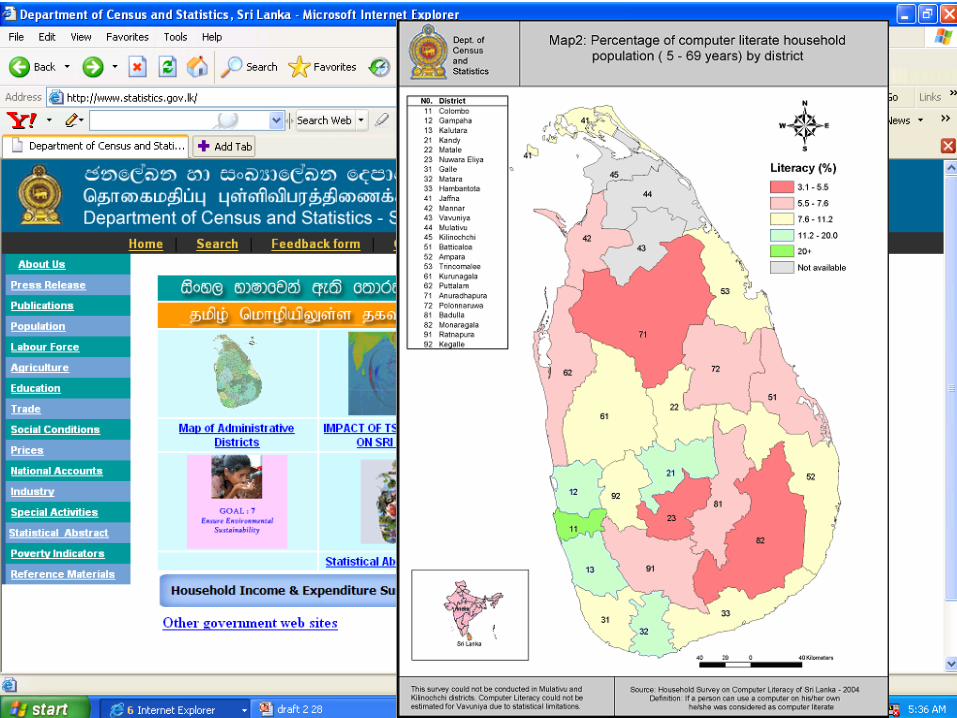
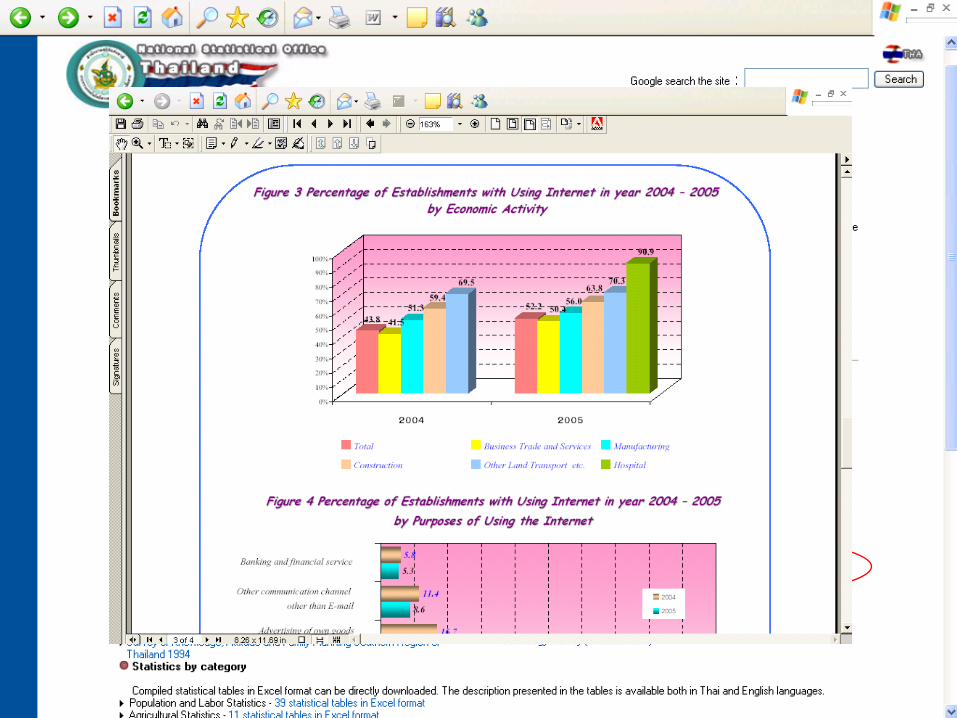
Some other countries in the region
ww
w.li
rnea
sia.
net
ww
w.li
rnea
sia.
net
ww
w.li
rnea
sia.
net
ww
w.li
rnea
sia.
net
ww
w.li
rnea
sia.
net
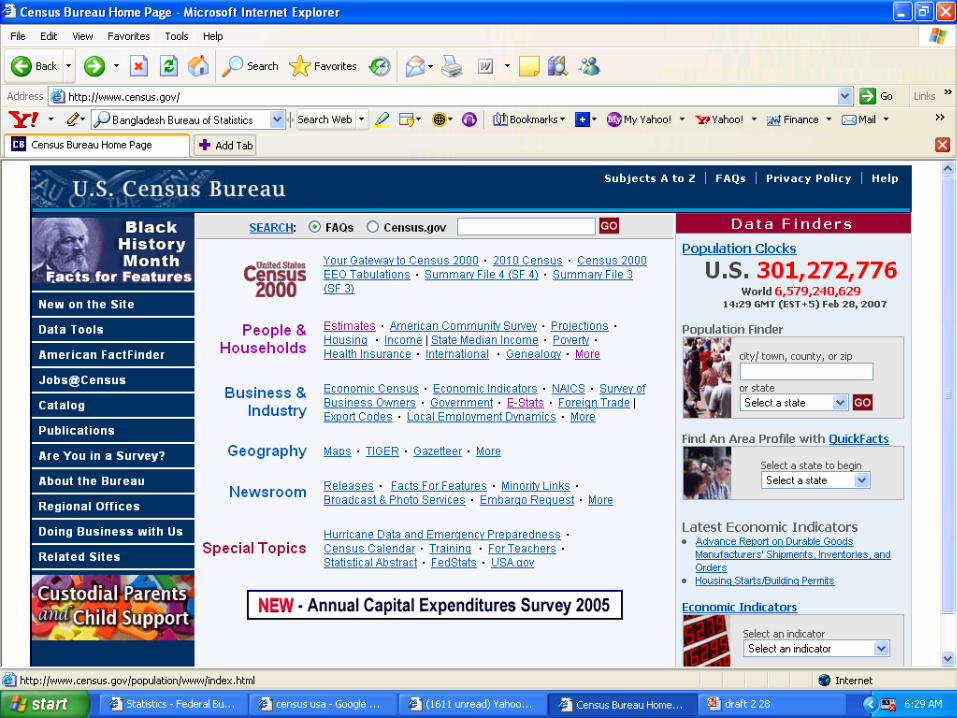
Developed country examples
US Canada
ww
w.li
rnea
sia.
net
ww
w.li
rnea
sia.
net
ww
w.li
rnea
sia.
net
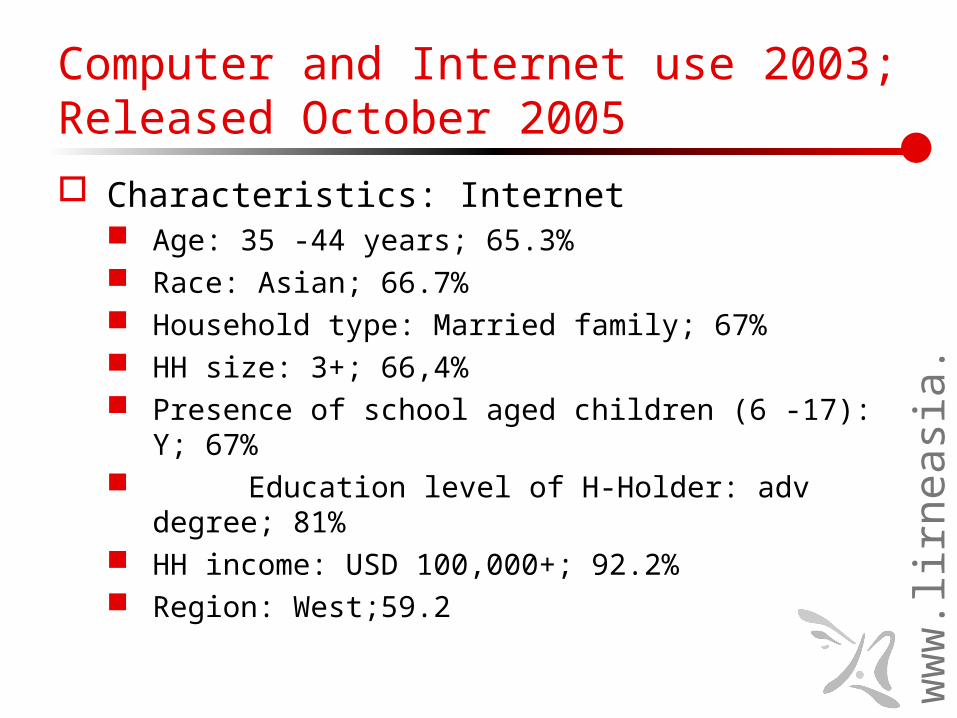
Computer and Internet use 2003; Released October 2005
Characteristics: Internet Age: 35 -44 years; 65.3% Race: Asian; 66.7% Household type: Married family; 67% HH size: 3+; 66,4% Presence of school aged children (6 -17): Y; 67% Education level of H-Holder: adv degree;
81% HH income: USD 100,000+; 92.2% Region: West;59.2

ww
w.li
rnea
sia.
net
ww
w.li
rnea
sia.
net
ww
w.li
rnea
sia.
net
ww
w.li
rnea
sia.
net
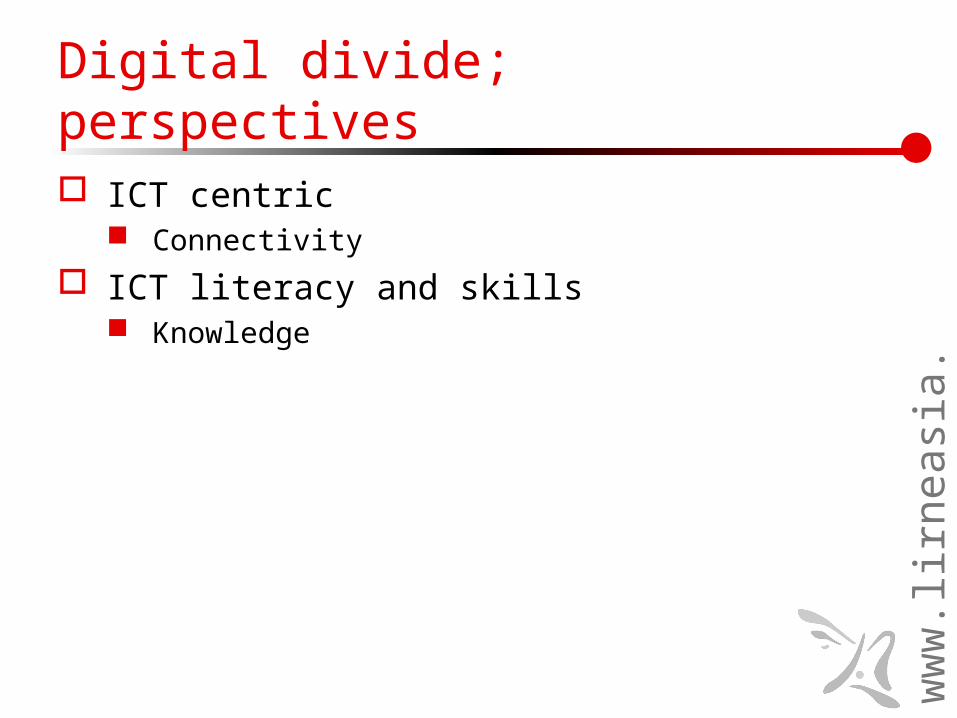
Digital divide; perspectives
ICT centric Connectivity
ICT literacy and skills Knowledge
ww
w.li
rnea
sia.
net
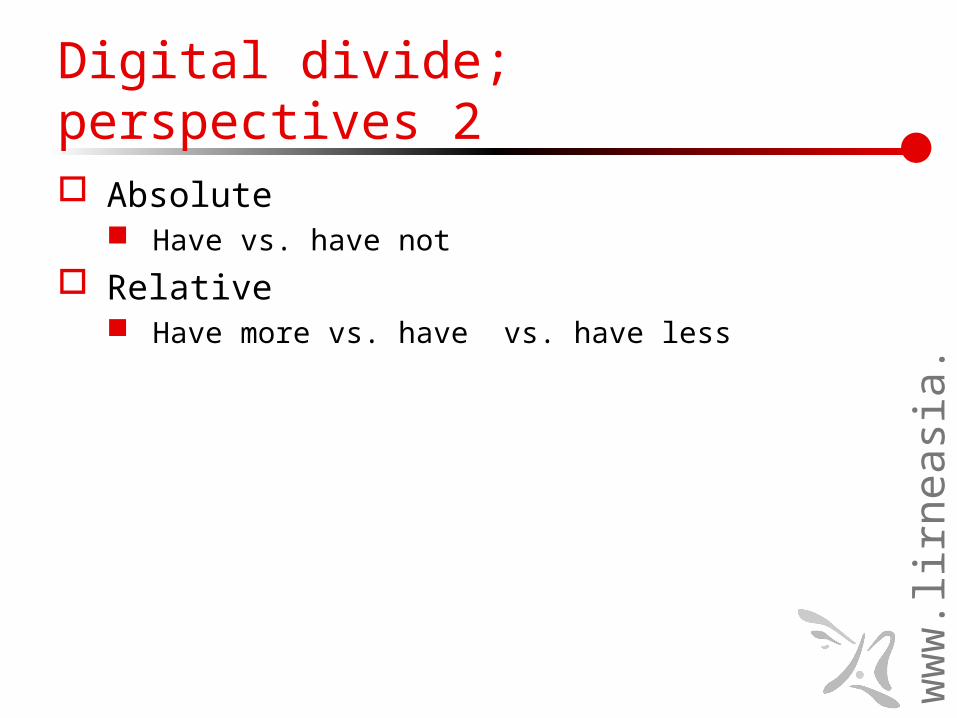
Digital divide; perspectives 2
Absolute Have vs. have not
Relative Have more vs. have vs. have less
ww
w.li
rnea
sia.
net
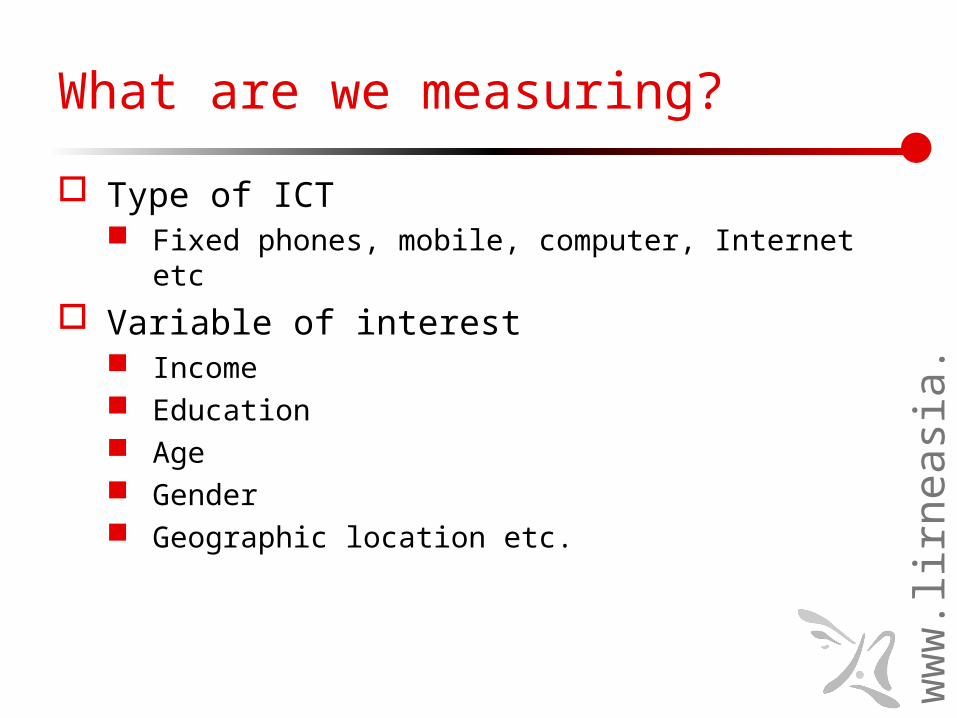
What are we measuring?
Type of ICT Fixed phones, mobile, computer, Internet etc
Variable of interest Income Education Age Gender Geographic location etc.
ww
w.li
rnea
sia.
net
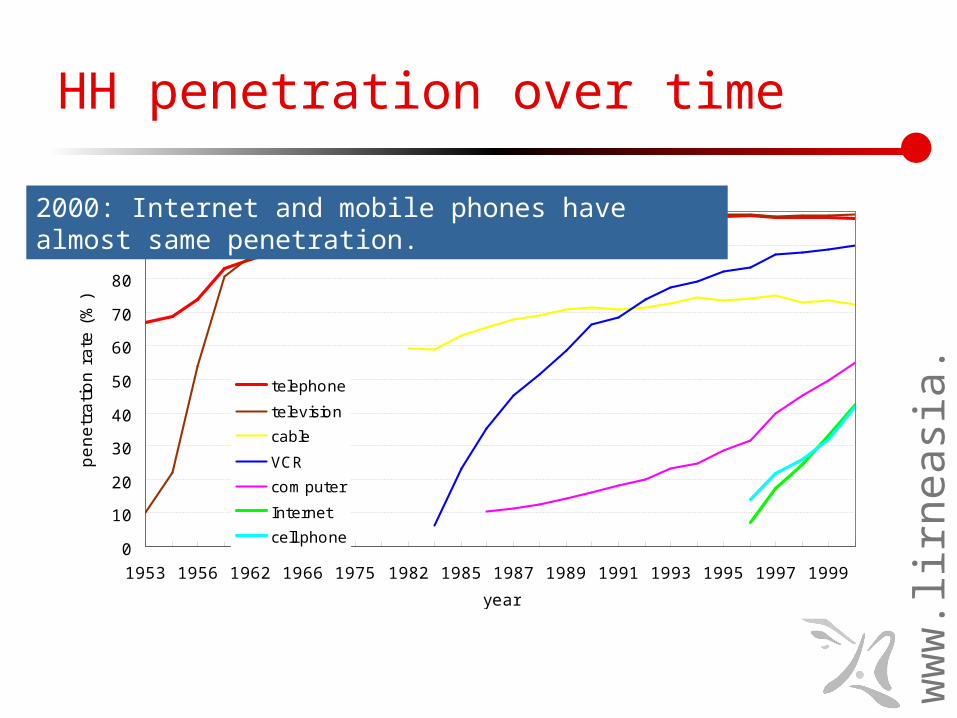
HH penetration over time
0
10
20
30
40
50
60
70
80
90
100
1953 1956 1962 1966 1975 1982 1985 1987 1989 1991 1993 1995 1997 1999
year
penetr
ation r
ate
(%
)
telephone
television
cable
VCR
computer
Internet
cell phone
2000: Internet and mobile phones have almost same penetration.
ww
w.li
rnea
sia.
net
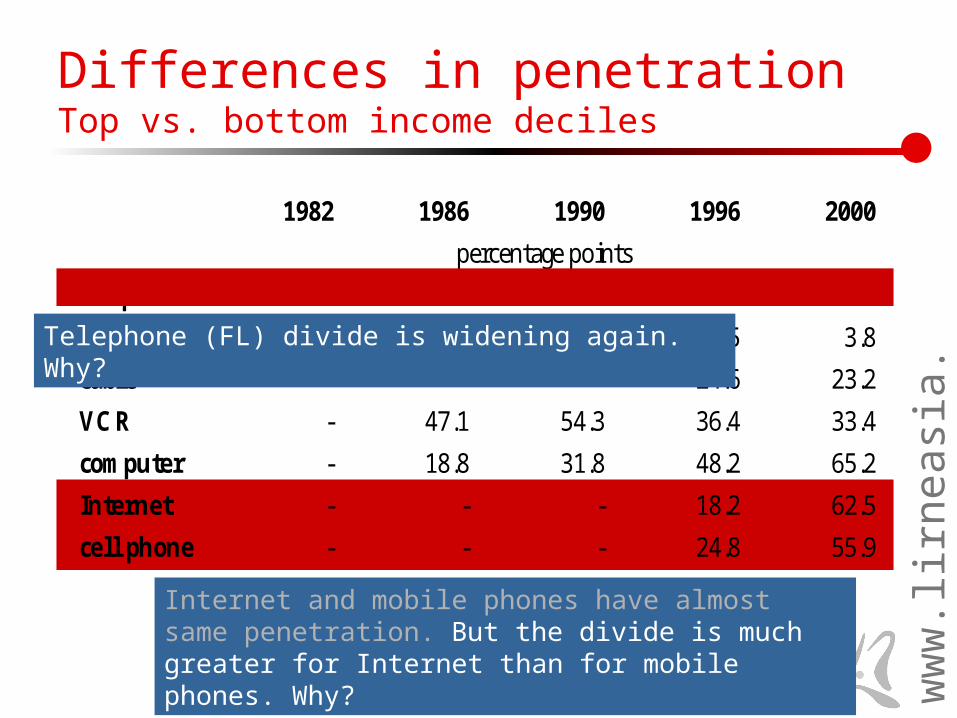
Differences in penetrationTop vs. bottom income deciles
1982 1986 1990 1996 2000
percentage points
te lephone 7.4 7.5 4.6 5.2 11.9
te levision 3.9 2.9 2.2 1.5 3.8
cable - - - 24.6 23.2
VCR - 47.1 54.3 36.4 33.4
computer - 18.8 31.8 48.2 65.2
Internet - - - 18.2 62.5
cell phone - - - 24.8 55.9
Internet and mobile phones have almost same penetration. But the divide is much greater for Internet than for mobile phones. Why?
Telephone (FL) divide is widening again. Why?
ww
w.li
rnea
sia.
net
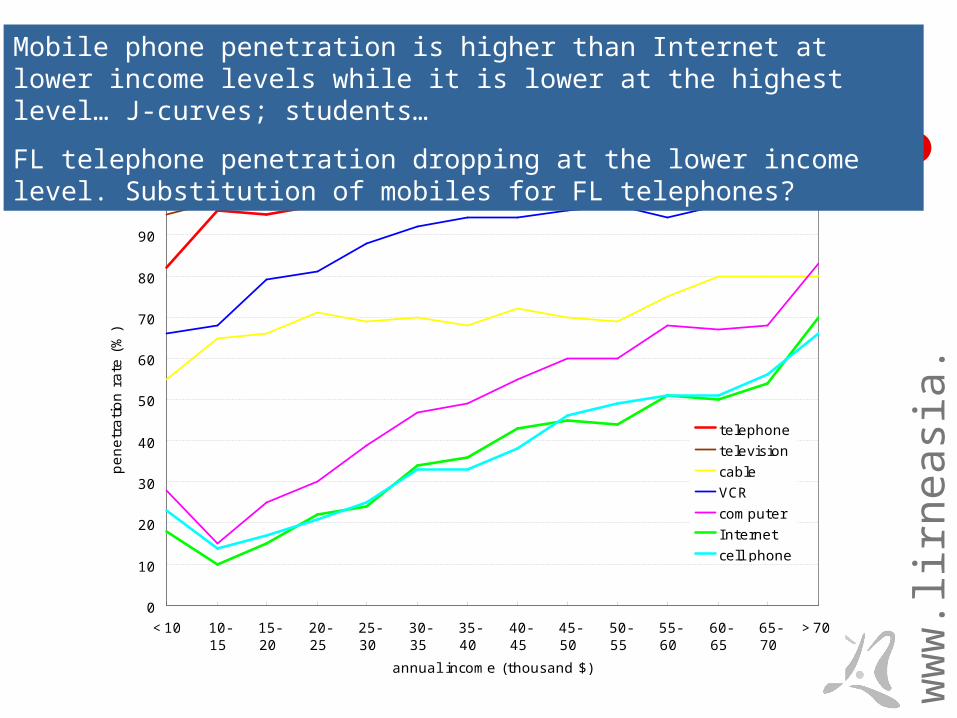
HH penetration, by income, 2000*
0
10
20
30
40
50
60
70
80
90
100
<10 10-15
15-20
20-25
25-30
30-35
35-40
40-45
45-50
50-55
55-60
60-65
65-70
>70
annual income (thousand $)
penetr
ation r
ate
(%
)
telephone
television
cable
VCR
computer
Internet
cell phone
Mobile phone penetration is higher than Internet at lower income levels while it is lower at the highest level… J-curves; students…
FL telephone penetration dropping at the lower income level. Substitution of mobiles for FL telephones?
ww
w.li
rnea
sia.
net
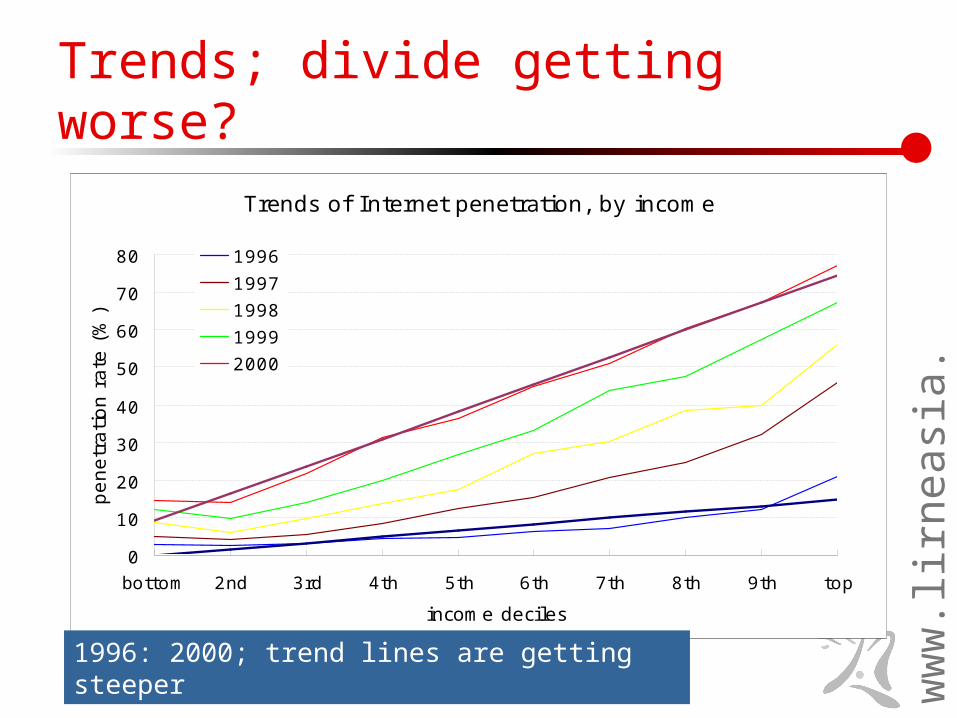
Trends; divide getting worse?
Trends of Internet penetration, by income
0
10
20
30
40
50
60
70
80
bottom 2nd 3rd 4th 5th 6th 7th 8th 9th top
income deciles
penetr
ation r
ate
(%
)
1996
1997
1998
1999
2000
1996: 2000; trend lines are getting steeper
ww
w.li
rnea
sia.
net
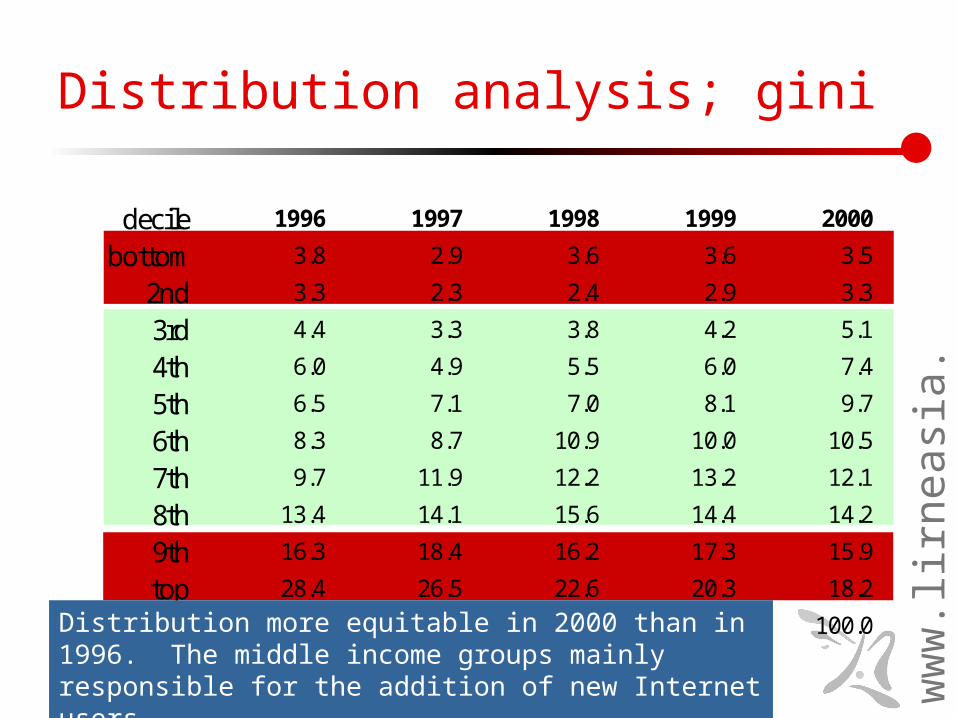
Distribution analysis; gini
decile 1996 1997 1998 1999 2000
bottom 3.8 2.9 3.6 3.6 3.5
2nd 3.3 2.3 2.4 2.9 3.3
3rd 4.4 3.3 3.8 4.2 5.1
4th 6.0 4.9 5.5 6.0 7.4
5th 6.5 7.1 7.0 8.1 9.7
6th 8.3 8.7 10.9 10.0 10.5
7th 9.7 11.9 12.2 13.2 12.1
8th 13.4 14.1 15.6 14.4 14.2
9th 16.3 18.4 16.2 17.3 15.9
top 28.4 26.5 22.6 20.3 18.2
all 100.0 100.0 100.0 100.0 100.0Distribution more equitable in 2000 than in 1996. The middle income groups mainly responsible for the addition of new Internet users.

ww
w.li
rnea
sia.
net
Why is this information important?
To dig deeper More than what meets the eye Problems are not the same across all variables Solution are not ‘one size fits all’
To get a user perspective Not all users are owners [US, Canada examples
were for owners] Bottom of the Pyramid in India: 80% of telephone
users do not own a phone Internet is much worse
To understand technology adoption VoIP, Wi-MAX and a host of others
And much more…
ww
w.li
rnea
sia.
net
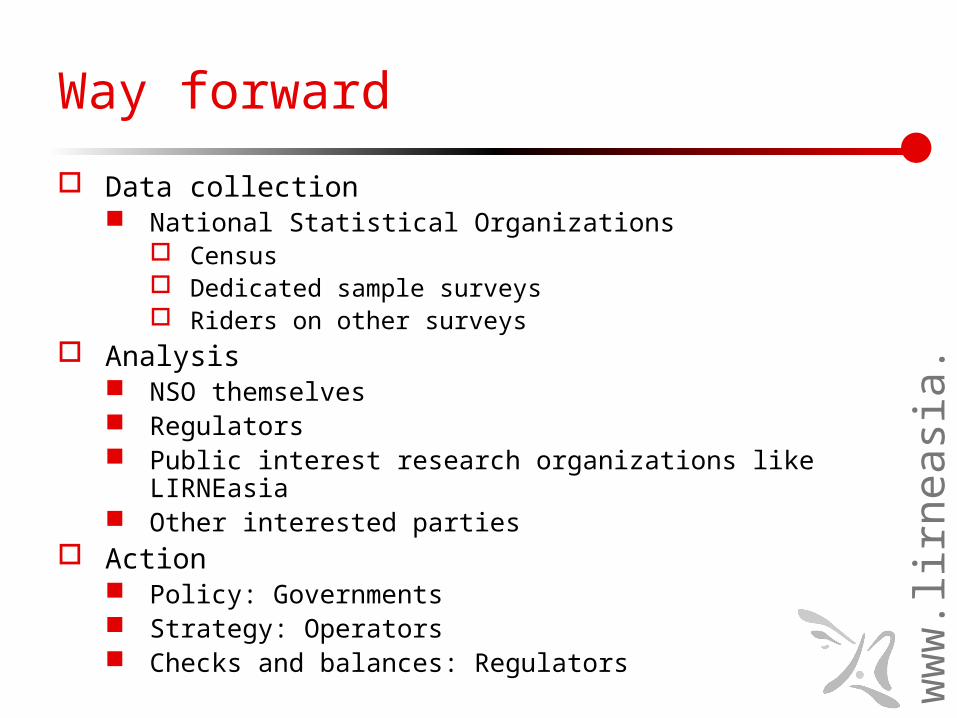
Way forward
Data collection National Statistical Organizations
Census Dedicated sample surveys Riders on other surveys
Analysis NSO themselves Regulators Public interest research organizations like LIRNEasia Other interested parties
Action Policy: Governments Strategy: Operators Checks and balances: Regulators