Embed Size (px)
Citation preview
www.fludb.org
Sequence Feature Variant Type and Evolutionary Trajectory Analysis using the
Influenza Research Database (IRD)
19 July 2011
Richard H. Scheuermann, Ph.D.
Department of Pathology
U.T. Southwestern Medical Center
www.fludb.orgOutline
• Brief overview of NIAID-Sponsored Influenza Research Database (IRD)– Comprehensive integrated database– Analysis and visualization tools– U.S. NIH-funded, free access, open to all– Developed by a team of research scientists, bioinformaticians and
professional software developers– www.fludb.org– www.viprbrc.org for other human viral pathogens
• Novel approach to genotype-phenotype association studies – Sequence Feature Variant Type (SFVT) analysis
• Evolutionary Trajectory analysis of the pandemic (H1N1) 2009 strain
www.fludb.orgPublic Health Impact of Influenza
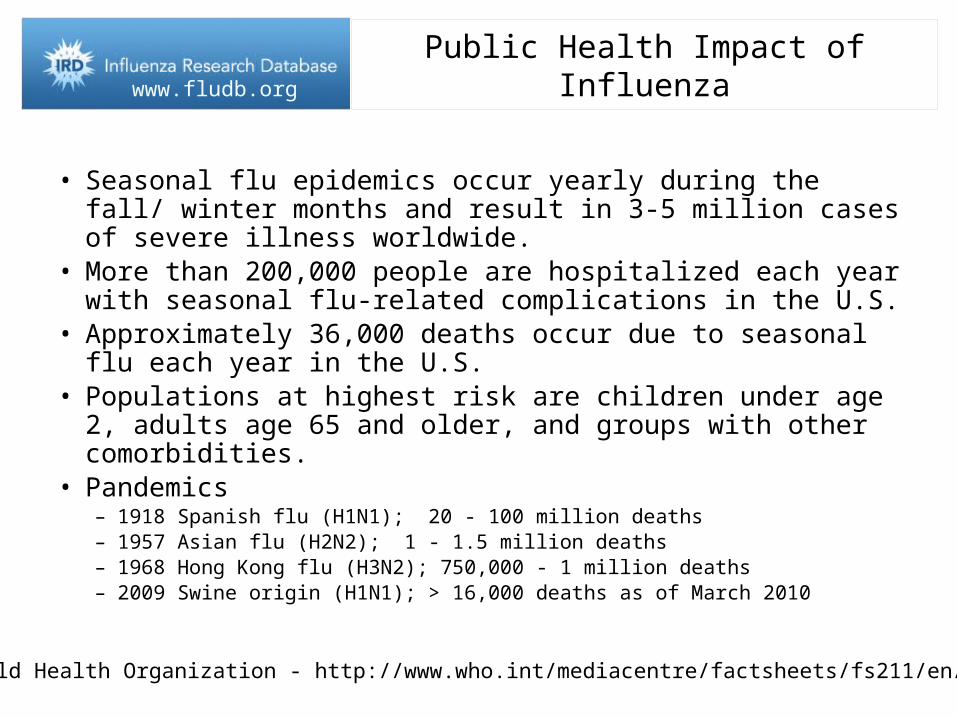
• Seasonal flu epidemics occur yearly during the fall/ winter months and result in 3-5 million cases of severe illness worldwide.
• More than 200,000 people are hospitalized each year with seasonal flu-related complications in the U.S.
• Approximately 36,000 deaths occur due to seasonal flu each year in the U.S.
• Populations at highest risk are children under age 2, adults age 65 and older, and groups with other comorbidities.
• Pandemics– 1918 Spanish flu (H1N1); 20 - 100 million deaths– 1957 Asian flu (H2N2); 1 - 1.5 million deaths– 1968 Hong Kong flu (H3N2); 750,000 - 1 million deaths– 2009 Swine origin (H1N1); > 16,000 deaths as of March 2010
Source: World Health Organization - http://www.who.int/mediacentre/factsheets/fs211/en/index.html
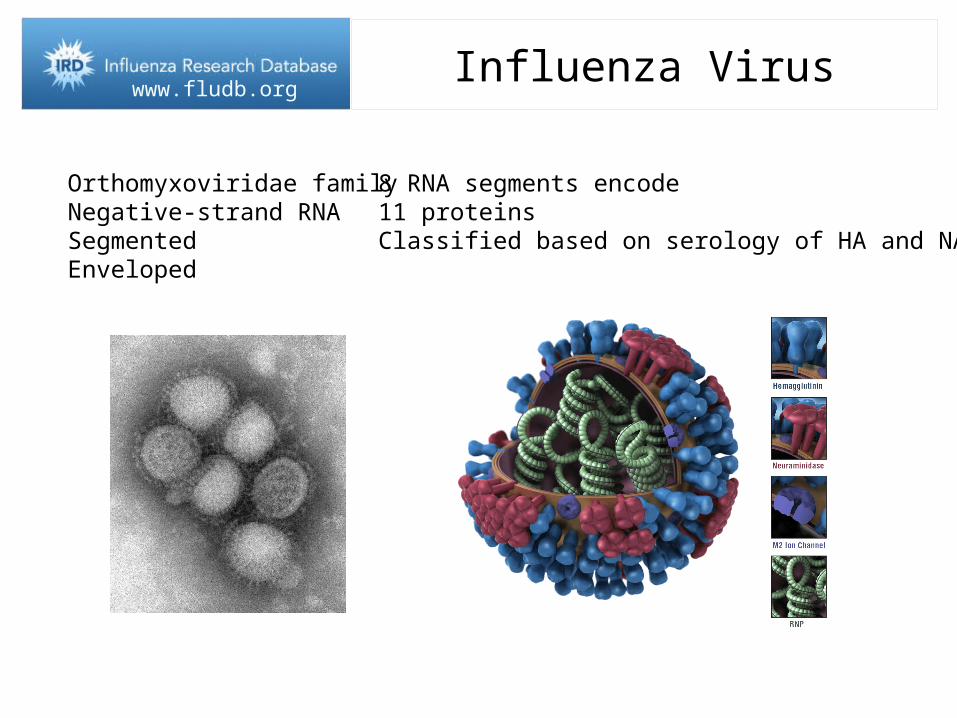
www.fludb.orgInfluenza Virus
Orthomyxoviridae familyNegative-strand RNASegmentedEnveloped
8 RNA segments encode11 proteinsClassified based on serology of HA and NA
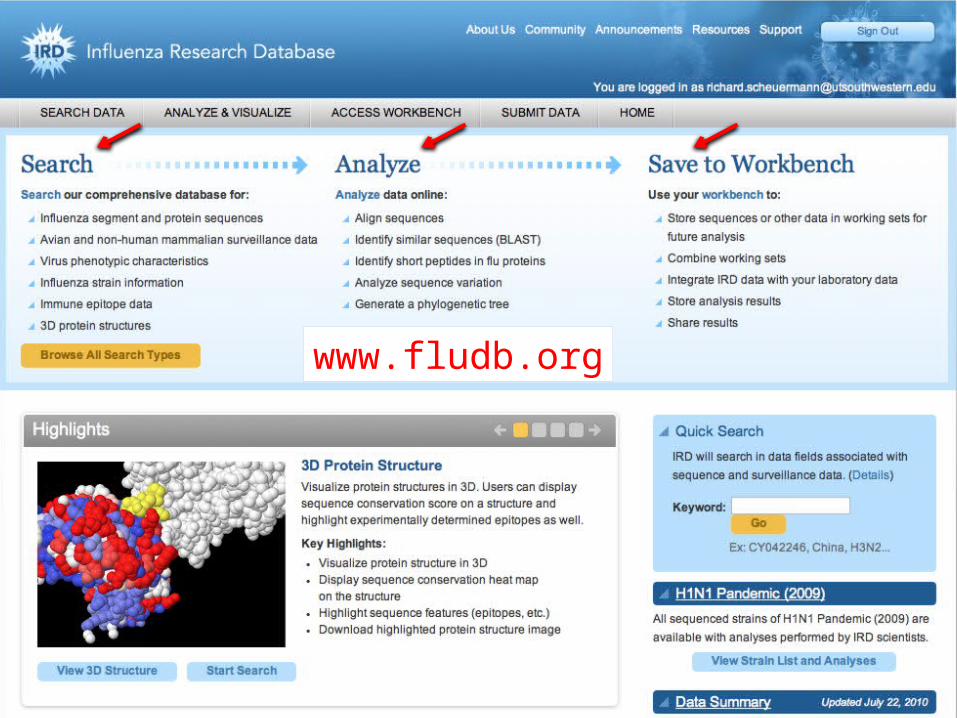
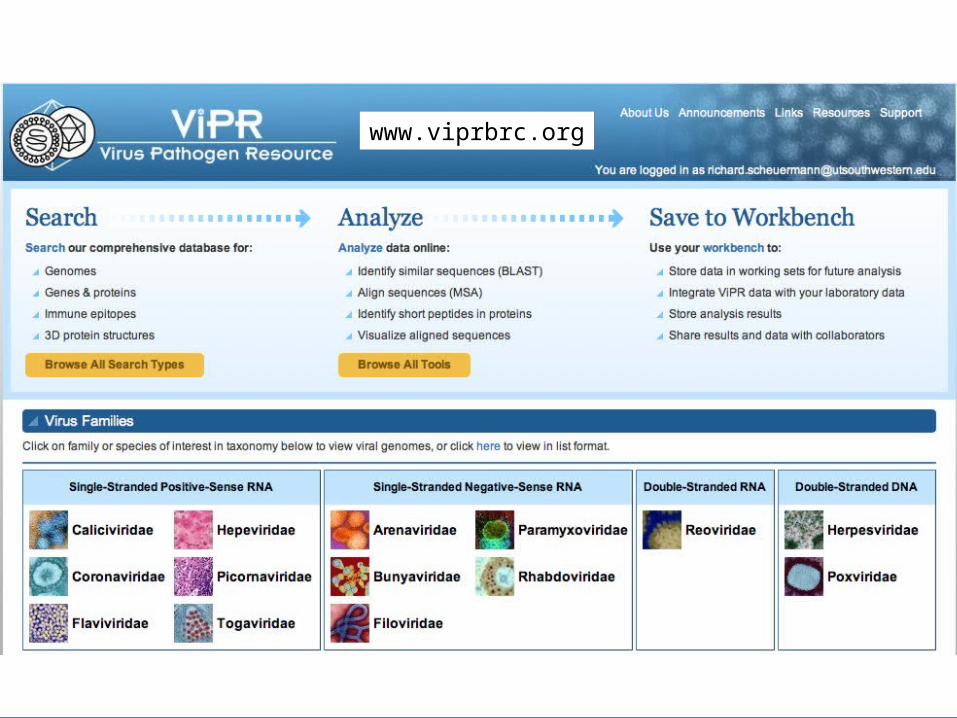
www.fludb.orgIRD Overview
www.fludb.org
www.fludb.org
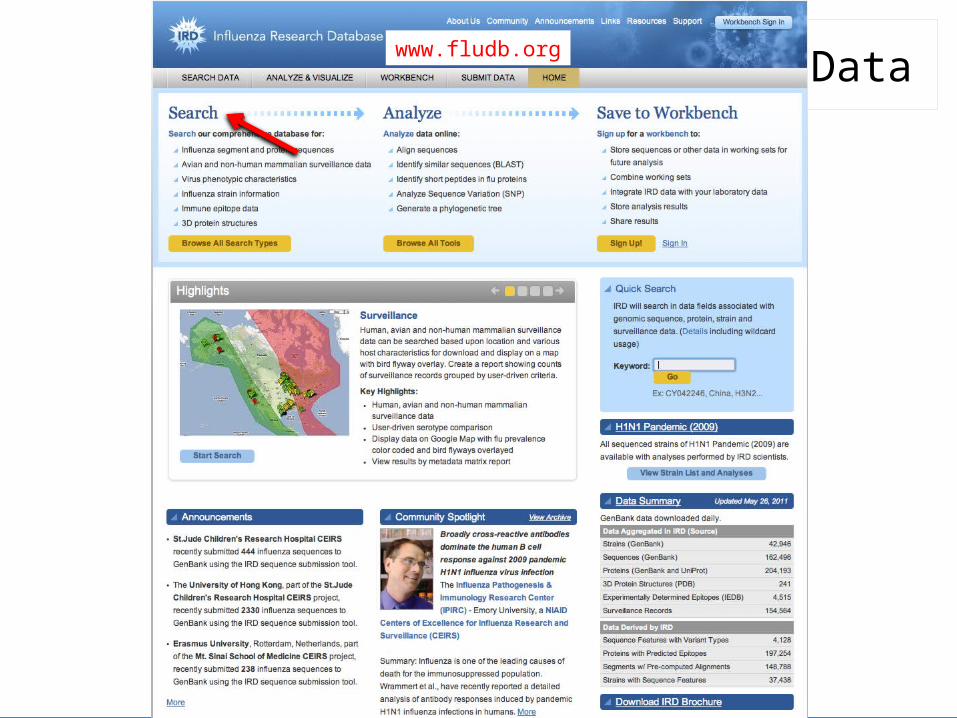
www.fludb.orgSearch Access to Data
www.fludb.org
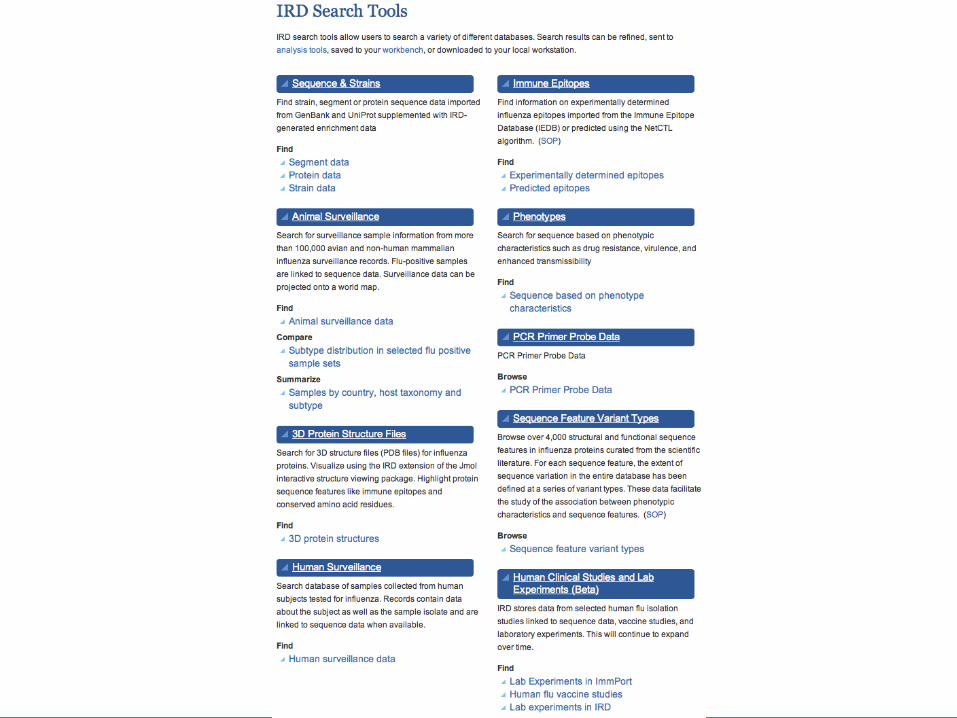
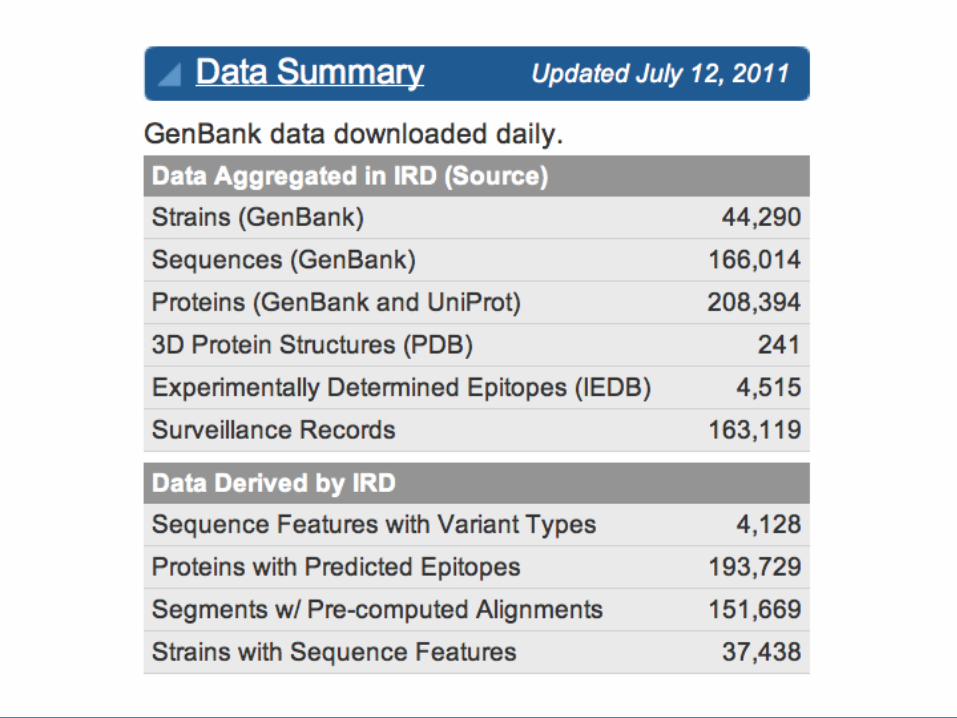
www.fludb.orgData Types
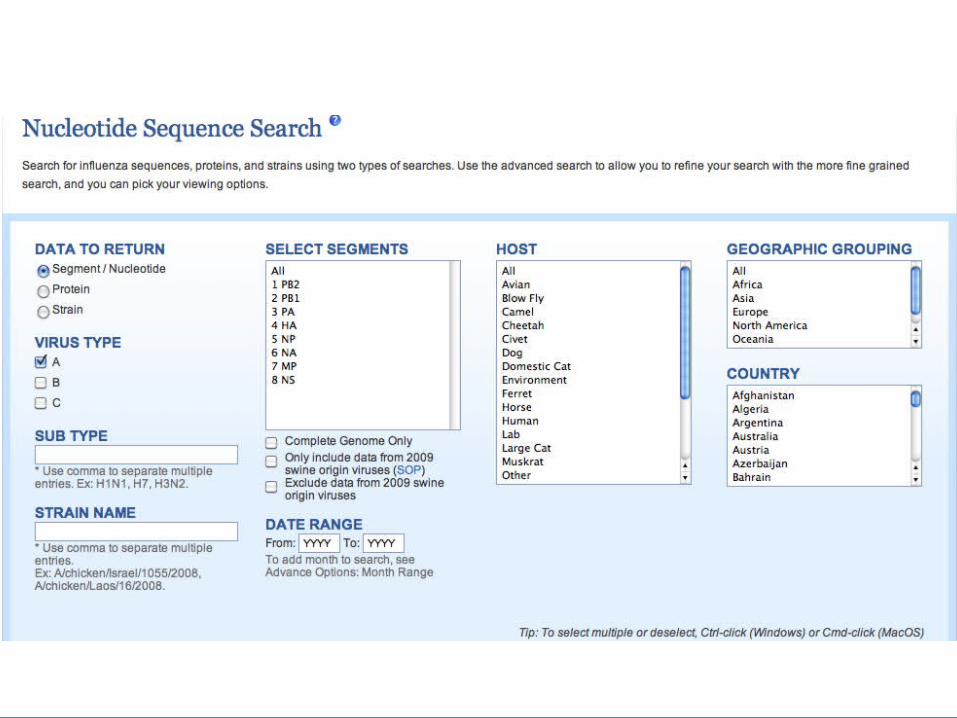
www.fludb.orgCore Query Attributes
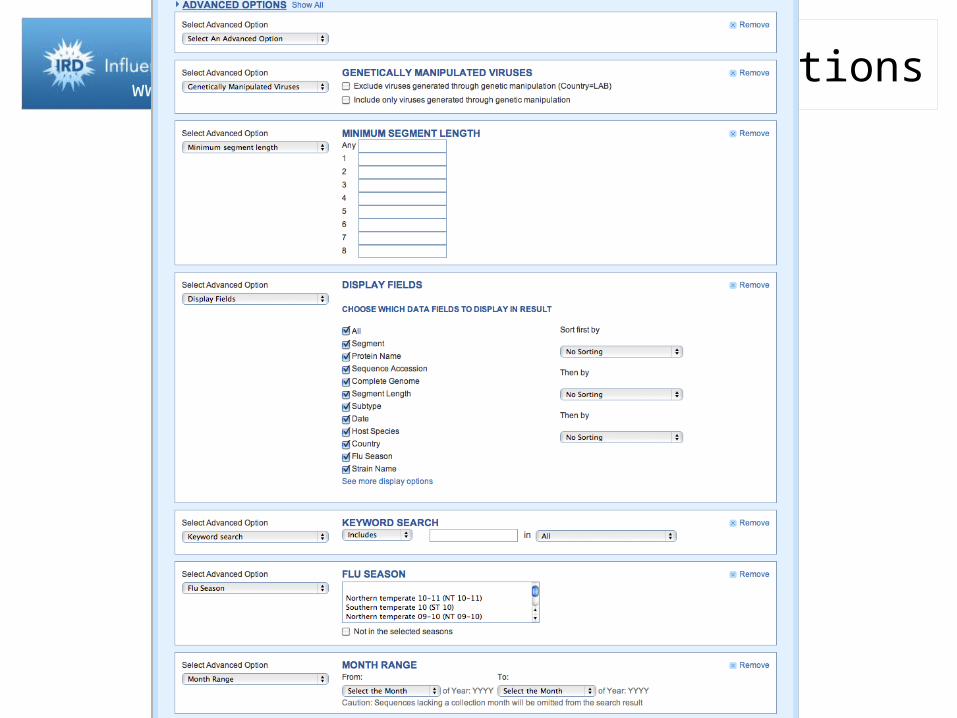
www.fludb.orgAdvanced Query Options
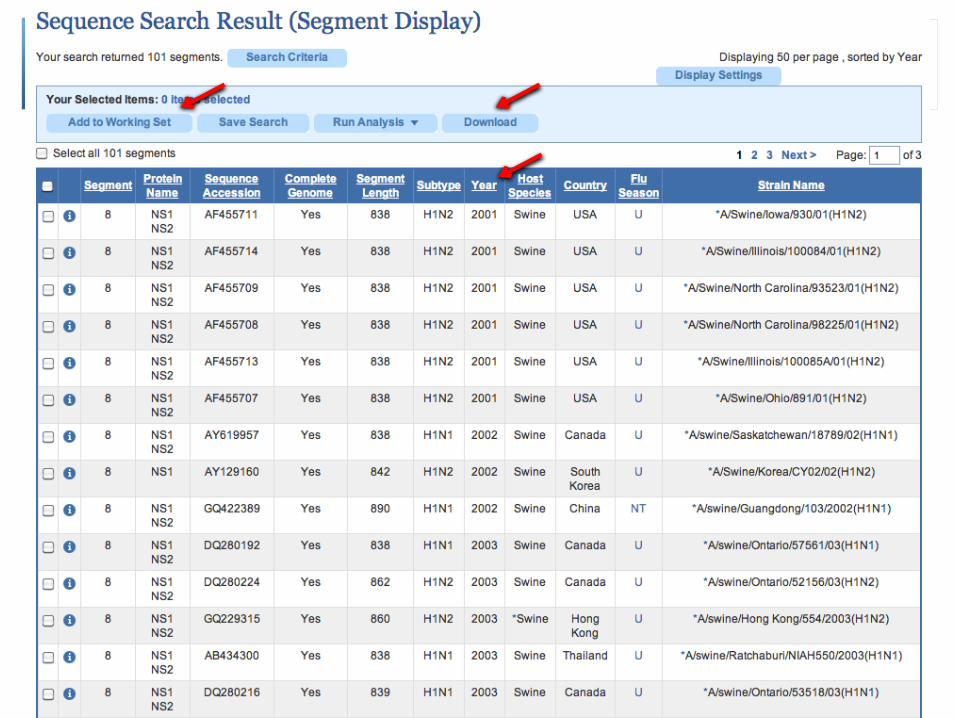
www.fludb.orgSegment search results
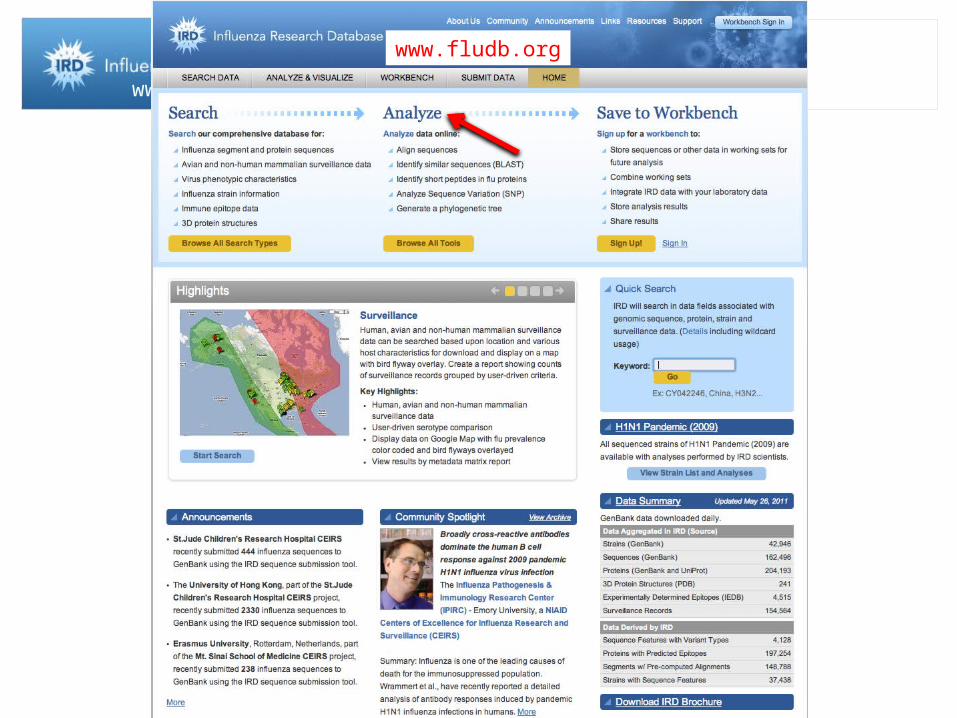
www.fludb.orgAnalysis and Visualizationwww.fludb.org
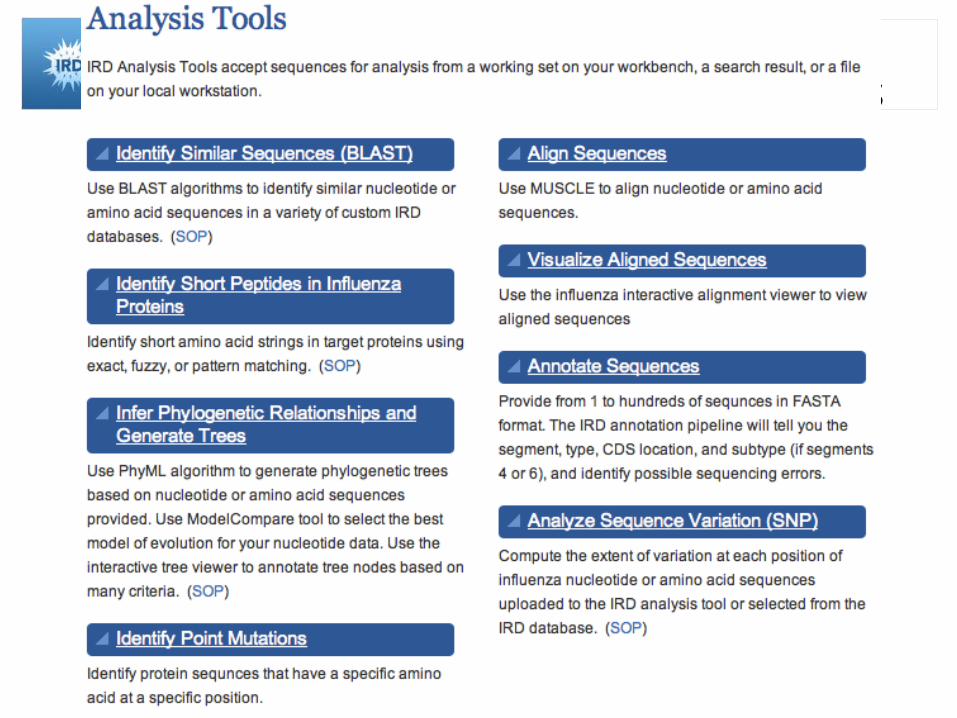
www.fludb.orgAnalysis and Visualization Tools
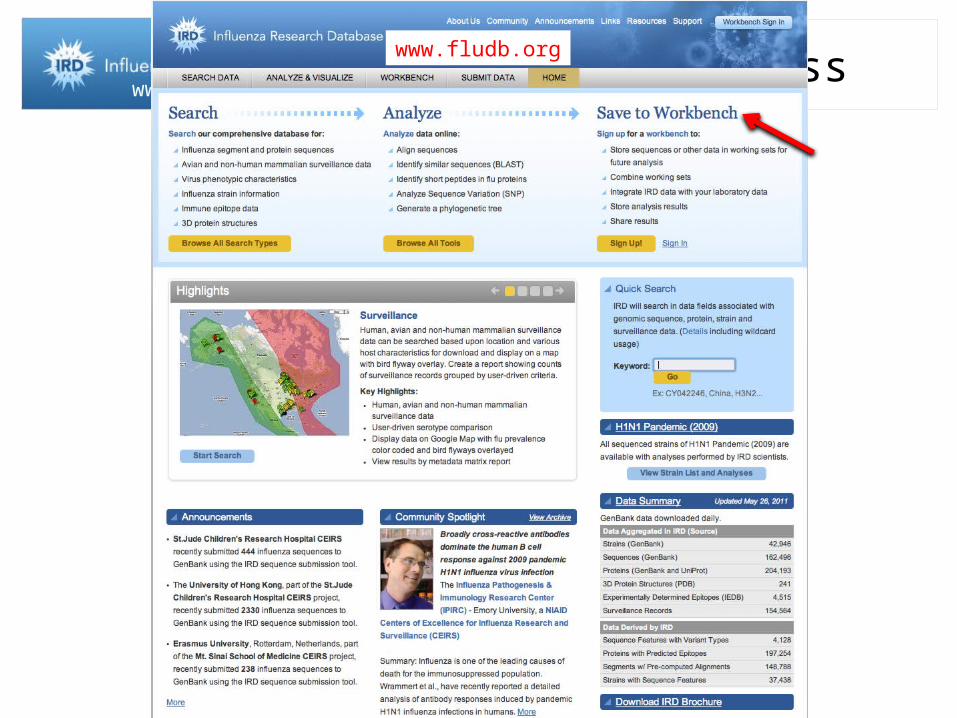
www.fludb.orgWorkbench Access
www.fludb.org
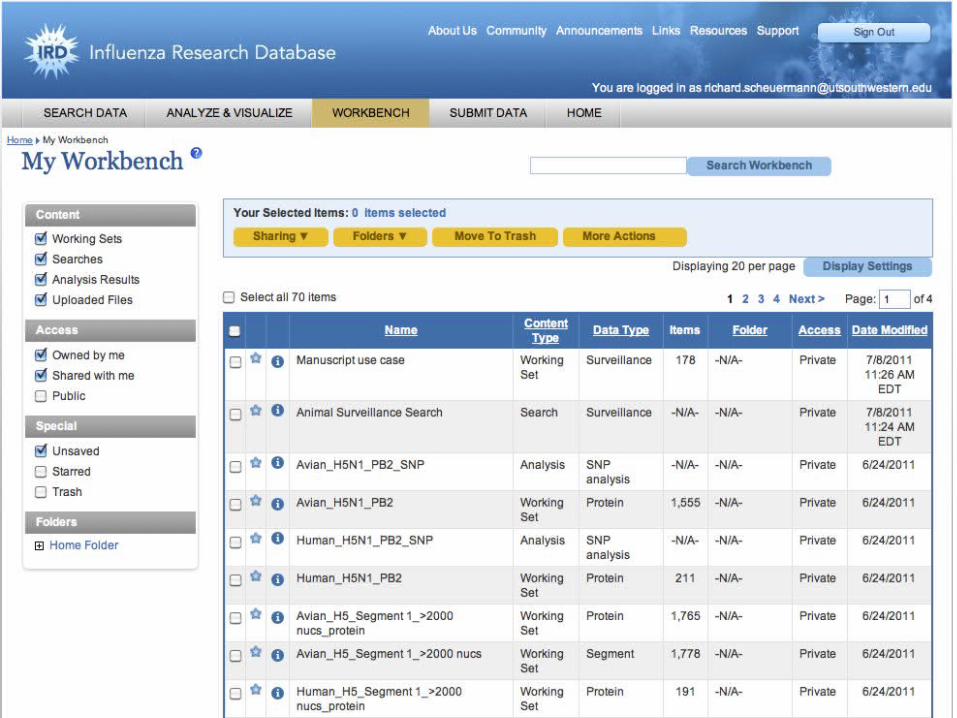
www.fludb.orgMy Private Workbench
www.fludb.org
www.fludb.org
www.fludb.org
www.fludb.org
www.fludb.org
www.viprbrc.org
www.fludb.orgIRD Summary
• Funded by U.S. National Institute of Allergy and Infectious Diseases (NIAID)
• Free and open access with no use restrictions
• Developed by a team of research scientists, bioinformaticians and professional software developers
• Comprehensive collection of public data
• Novel derived data, novel analytical tools, unique functions
• Integration – Integration – Integration
• www.fludb.org
• www.viprbrc.org
www.fludb.org
NOVEL APPROACH TO GENOTYPE-PHENOTYPE ASSOCIATION STUDIES – SEQUENCE FEATURE VARIANT TYPE (SFVT) ANALYSIS
www.fludb.orgLimitations to Phylogenetics
• Traditional virus phylogenetics focuses on comparative analysis of whole genome/genome segments, and is most useful to understand virus evolution
• However, the genetic determinants of important viral phenotypes, e.g. virulence, host range, replication efficiency, immune response evation, etc., are determined by focused functional regions of viral proteins
• Therefore, specific genotype-phenotype association can be masked by other evolutionary factors that contribute to traditional phylogenetic analysis
www.fludb.orgSFVT approach
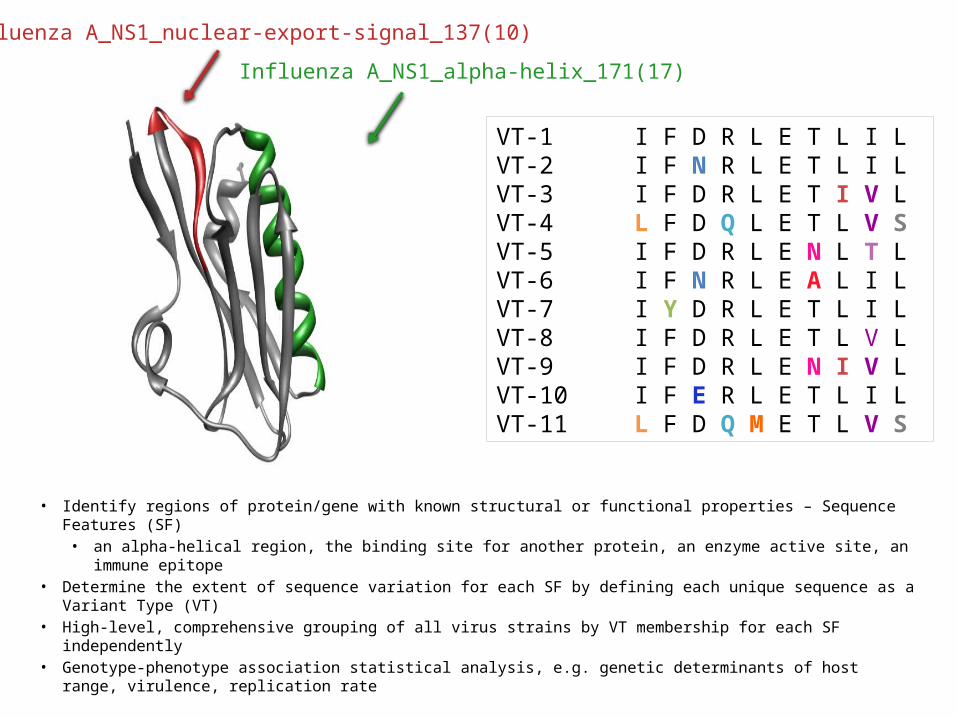
VT-1 I F D R L E T L I LVT-2 I F N R L E T L I LVT-3 I F D R L E T I V LVT-4 L F D Q L E T L V SVT-5 I F D R L E N L T LVT-6 I F N R L E A L I LVT-7 I Y D R L E T L I LVT-8 I F D R L E T L V LVT-9 I F D R L E N I V LVT-10 I F E R L E T L I LVT-11 L F D Q M E T L V S
Influenza A_NS1_nuclear-export-signal_137(10)
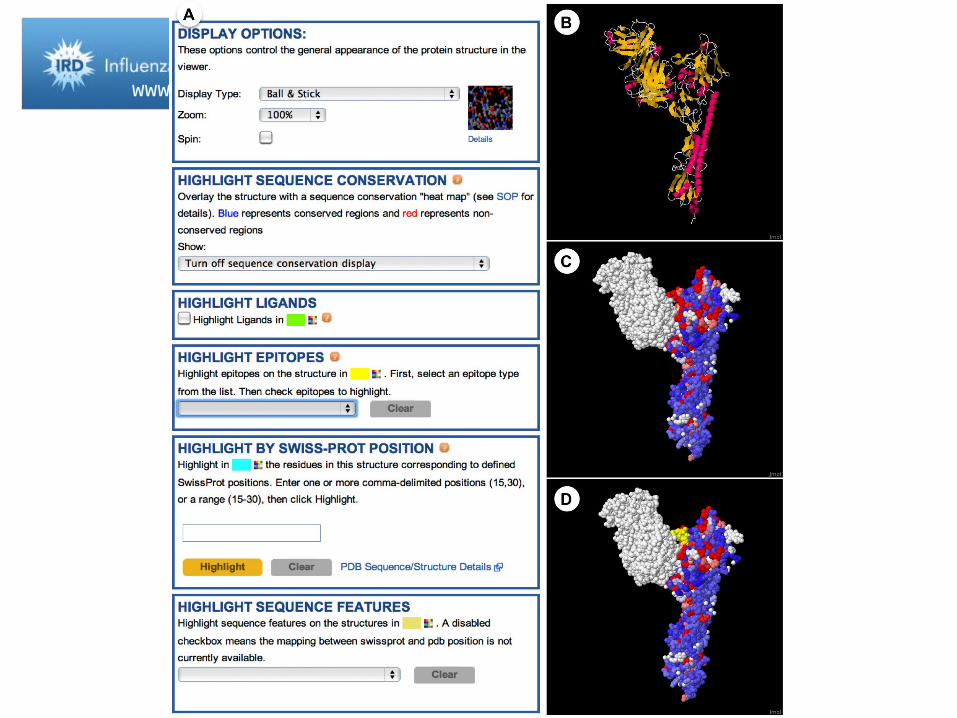
• Identify regions of protein/gene with known structural or functional properties – Sequence Features (SF)• an alpha-helical region, the binding site for another protein, an enzyme active site, an immune epitope
• Determine the extent of sequence variation for each SF by defining each unique sequence as a Variant Type (VT)
• High-level, comprehensive grouping of all virus strains by VT membership for each SF independently• Genotype-phenotype association statistical analysis, e.g. genetic determinants of host range, virulence,
replication rate
Influenza A_NS1_alpha-helix_171(17)
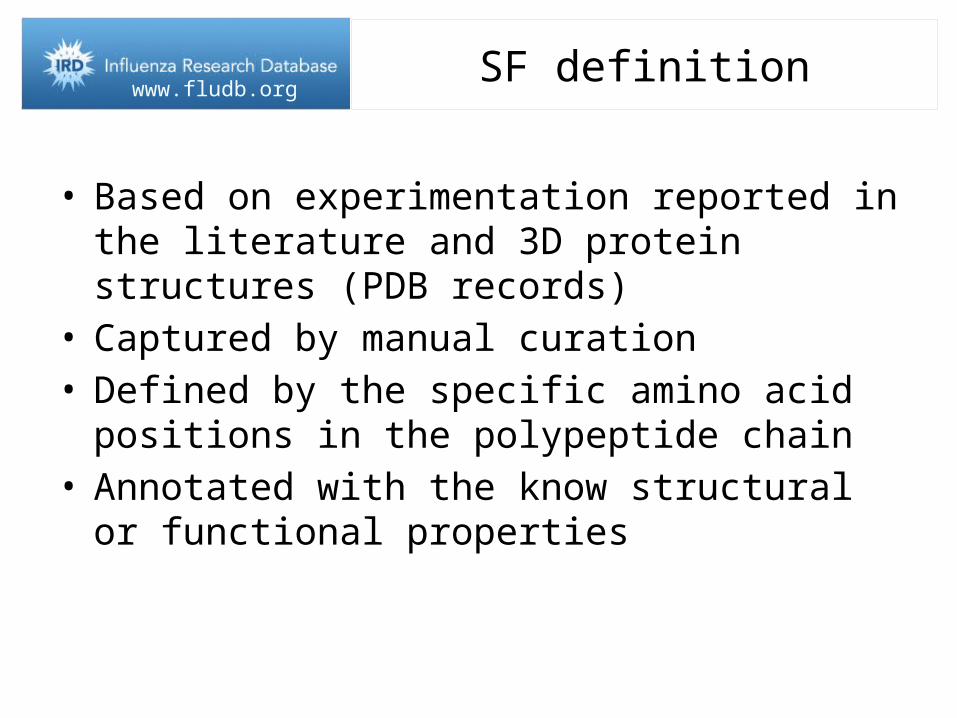
www.fludb.orgSF definition
• Based on experimentation reported in the literature and 3D protein structures (PDB records)
• Captured by manual curation• Defined by the specific amino acid positions in the
polypeptide chain• Annotated with the know structural or functional
properties
www.fludb.org
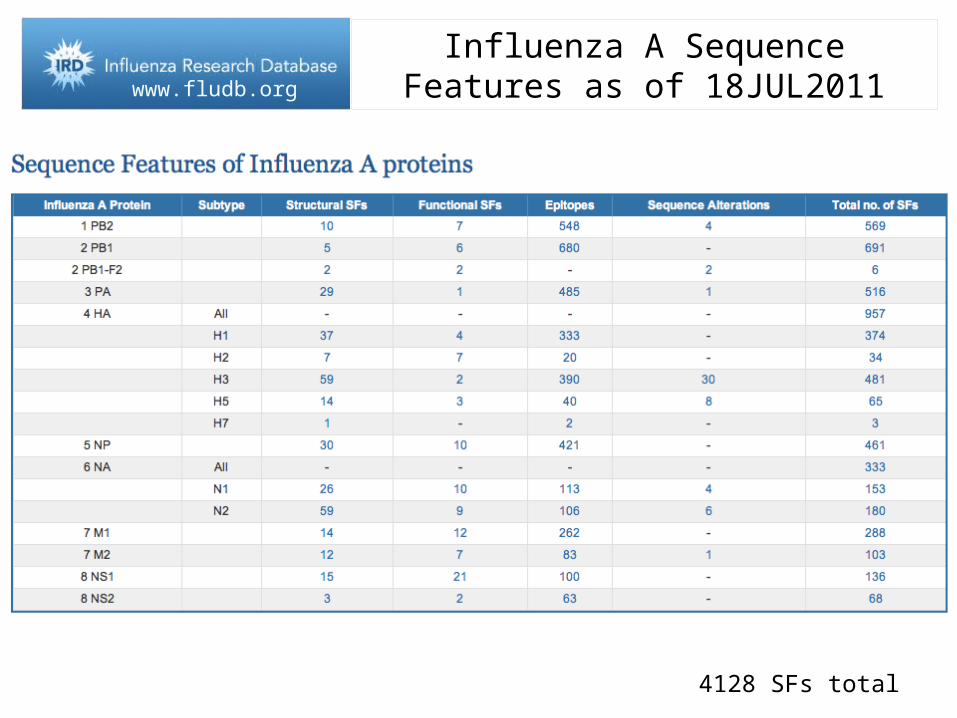
Influenza A Sequence Features as of 18JUL2011
4128 SFs total
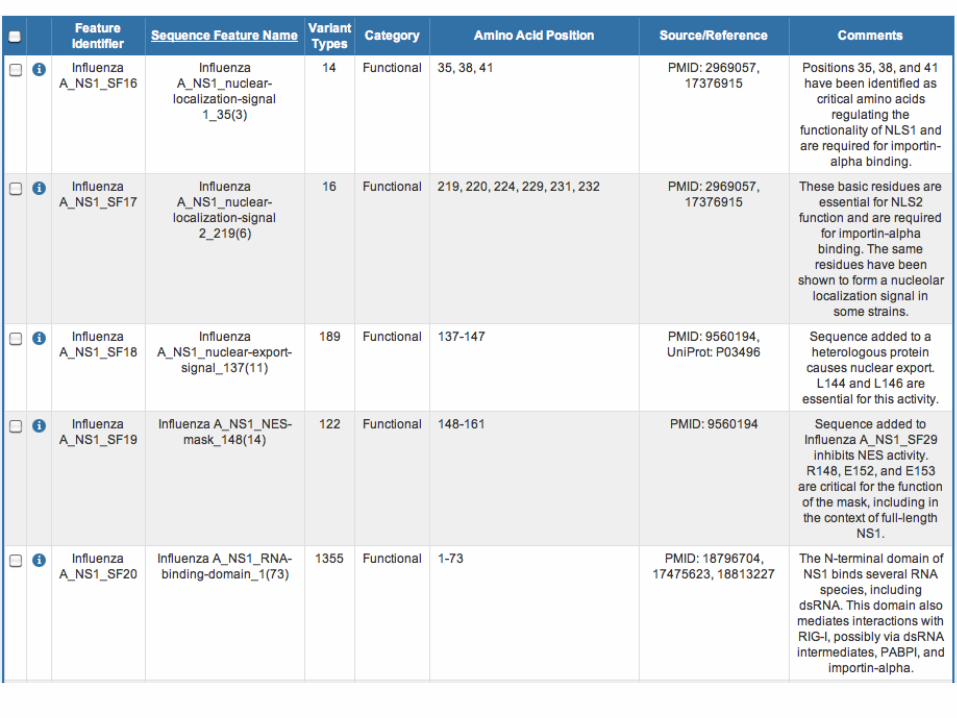
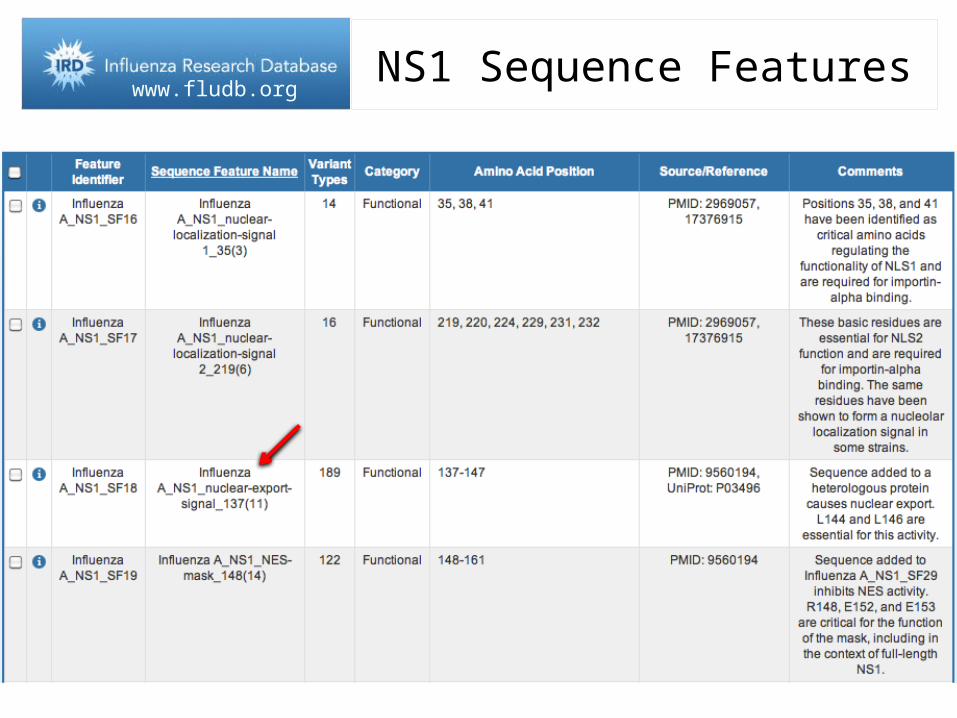
www.fludb.orgNS1 Sequence Features
www.fludb.orgSF8 (nuclear export signal)
www.fludb.orgVT for SF8 (nuclear export signal)
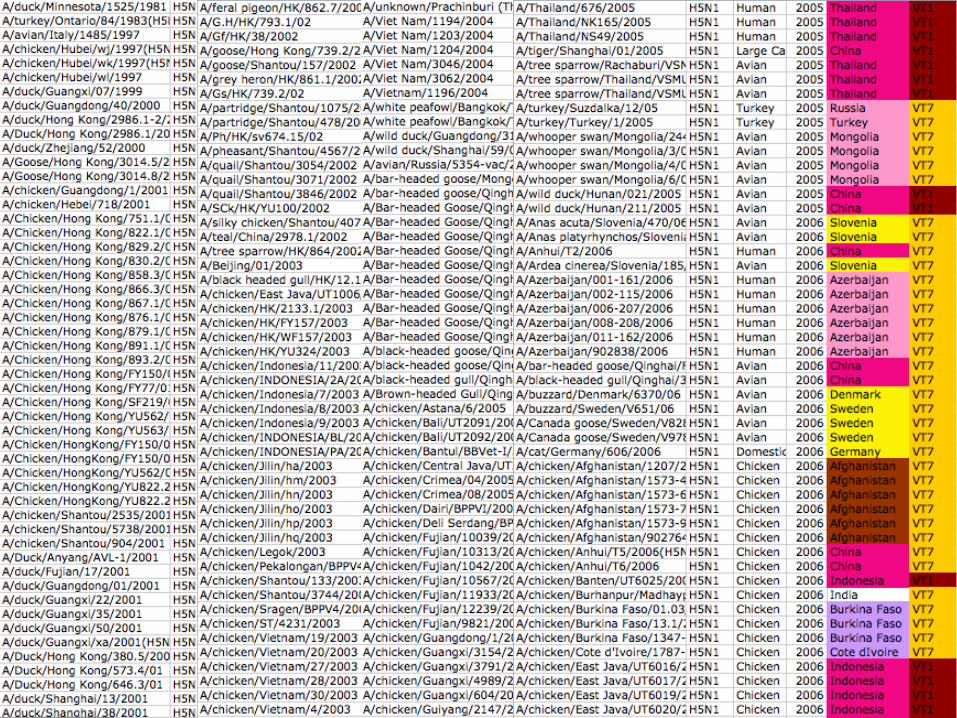
www.fludb.orgVT-1 strains
www.fludb.org
DO VARIATIONS IN NS1 SEQUENCE FEATURES INFLUENCE INFLUENZA VIRUS HOST RANGE?
www.fludb.orgNS1 Sequence Features
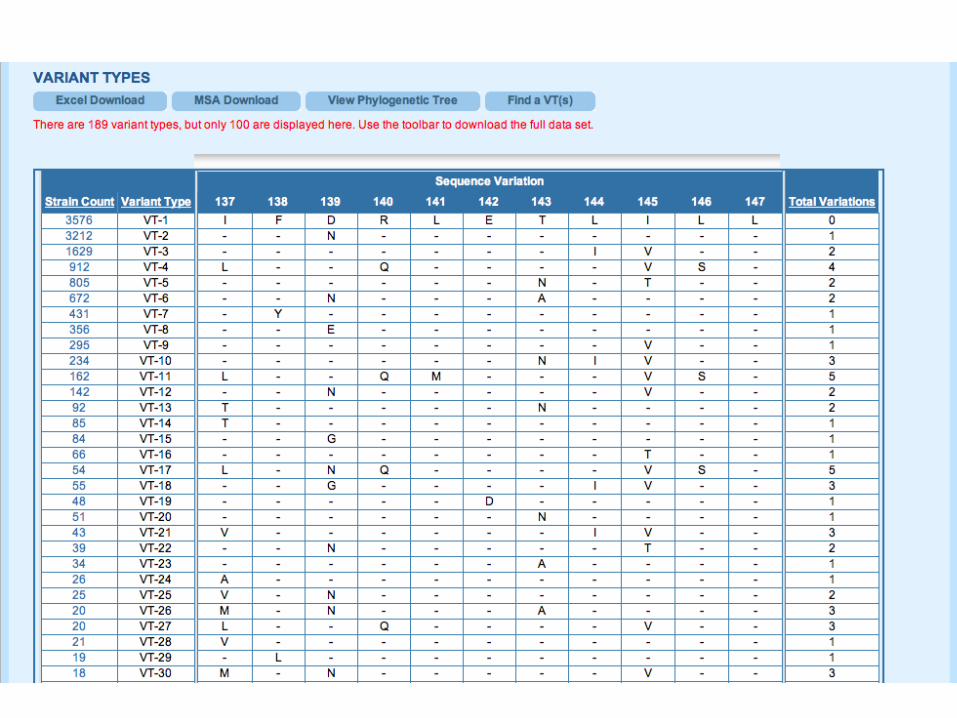
www.fludb.orgVT for SF8 (nuclear export signal)
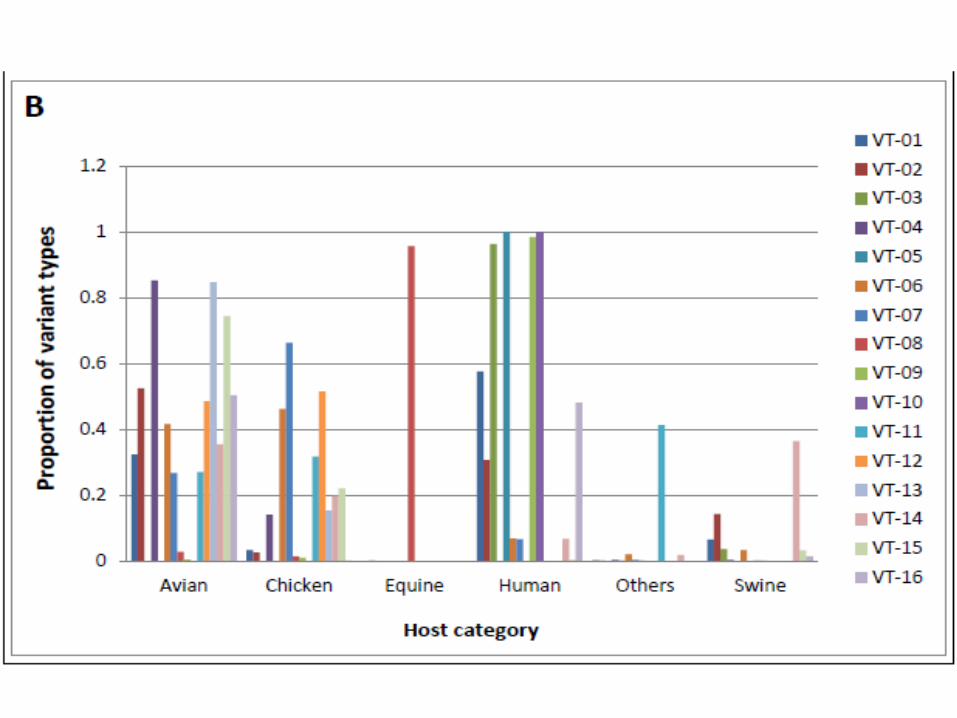
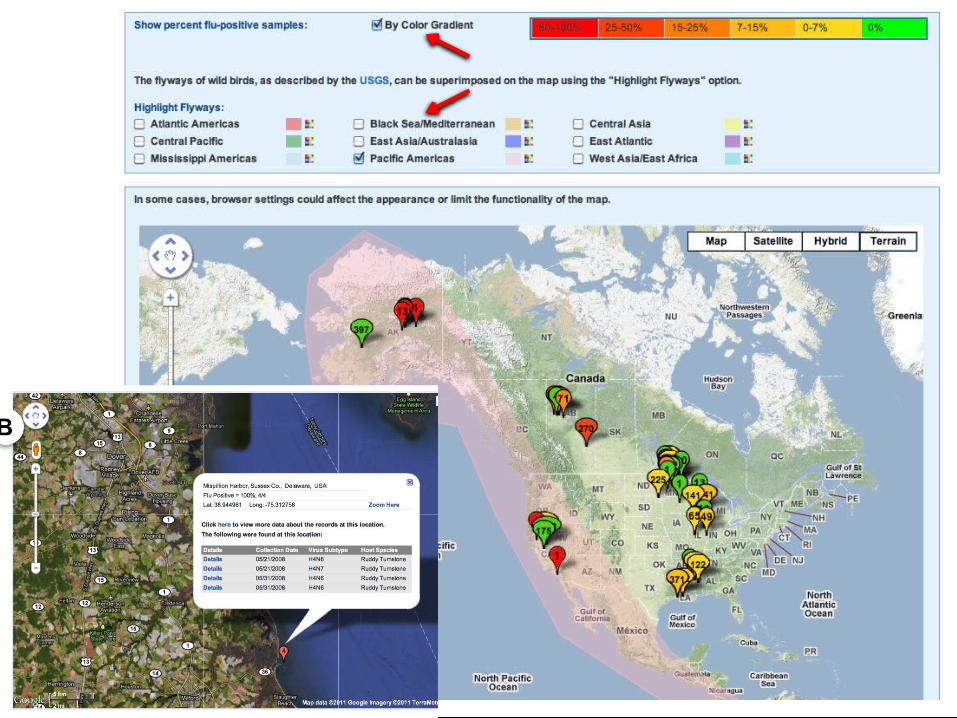
www.fludb.orgVT distribution by host
www.fludb.org
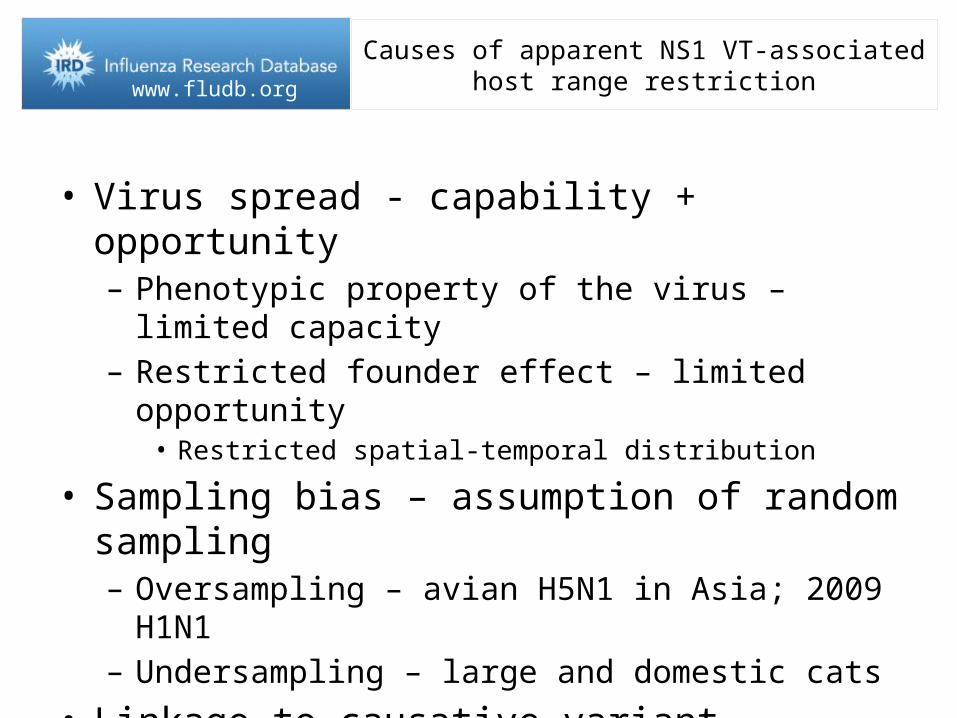
Causes of apparent NS1 VT-associated host range restriction
• Virus spread - capability + opportunity– Phenotypic property of the virus – limited capacity– Restricted founder effect – limited opportunity
• Restricted spatial-temporal distribution
• Sampling bias – assumption of random sampling– Oversampling – avian H5N1 in Asia; 2009 H1N1– Undersampling – large and domestic cats
• Linkage to causative variant
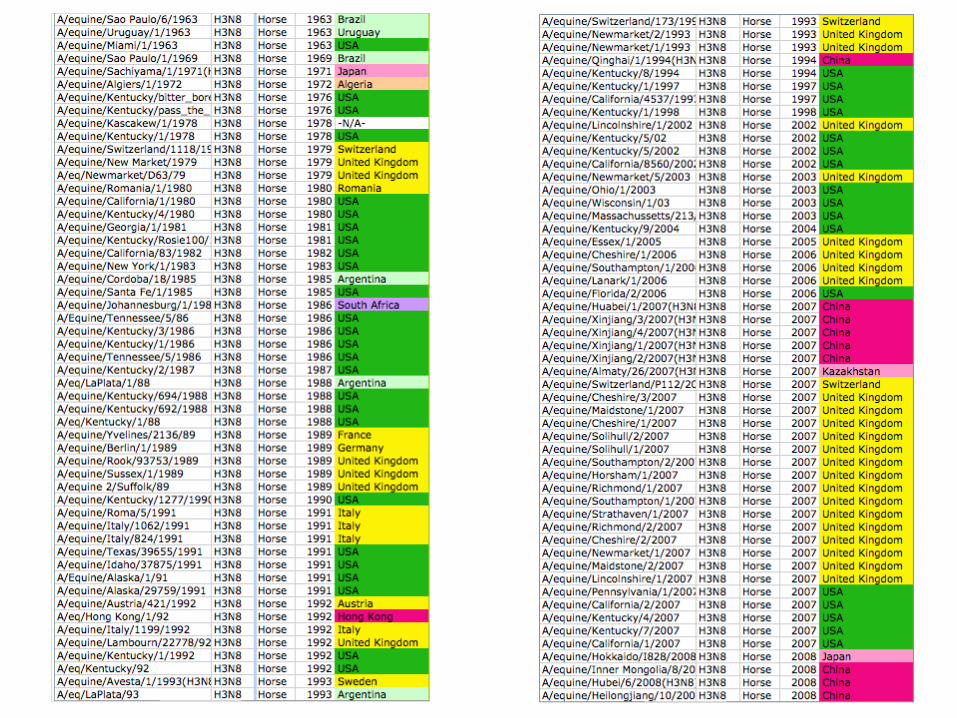
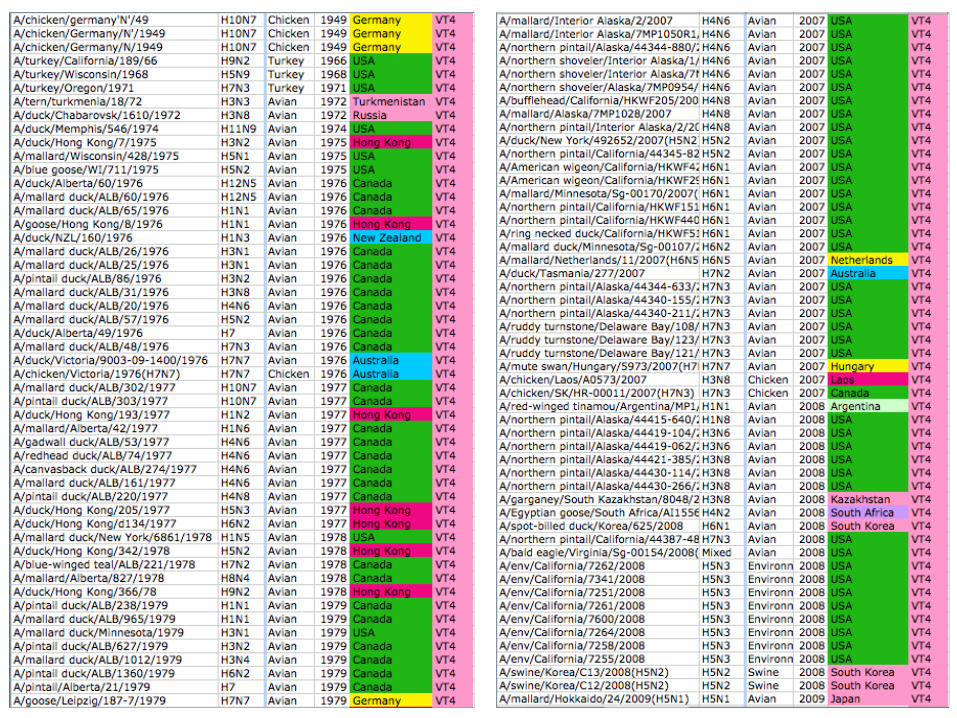
www.fludb.orgVT-11 strains
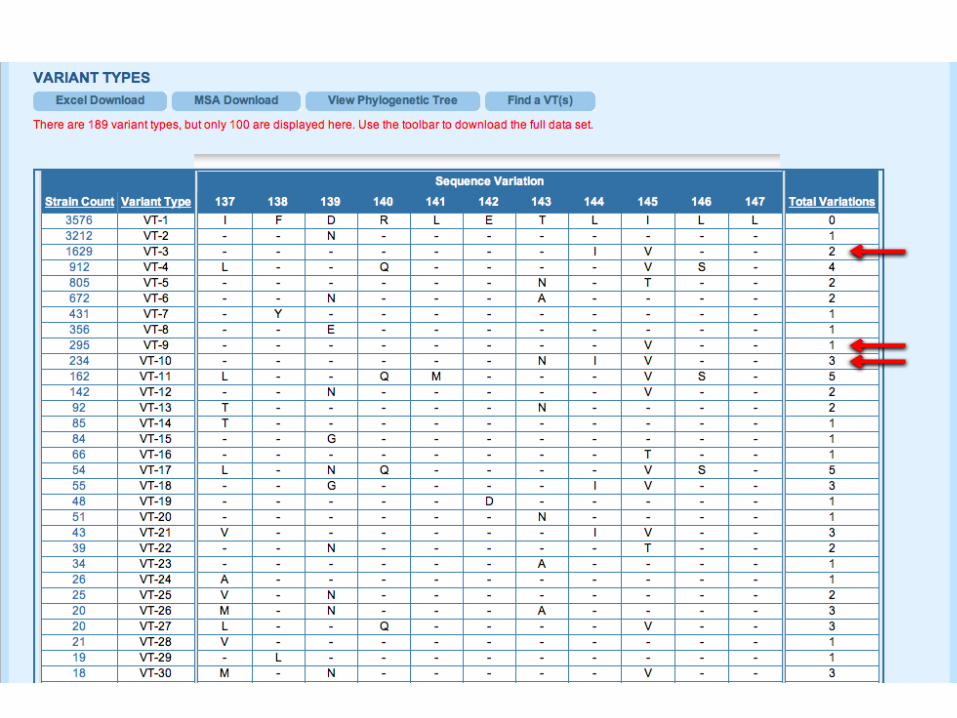
www.fludb.orgVT for SF8 (nuclear export signal)
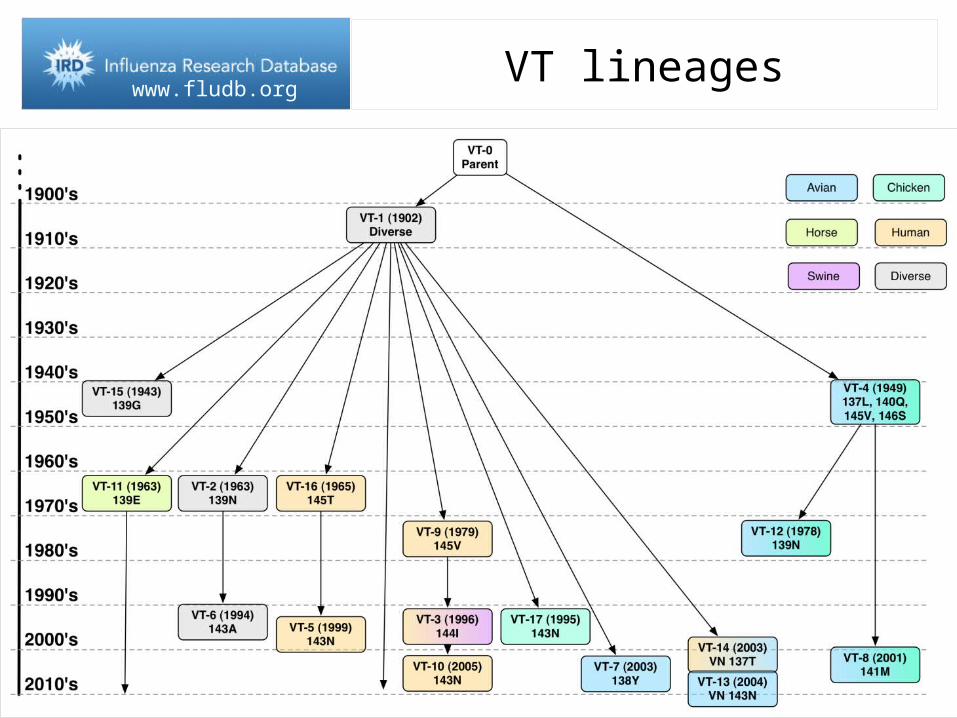
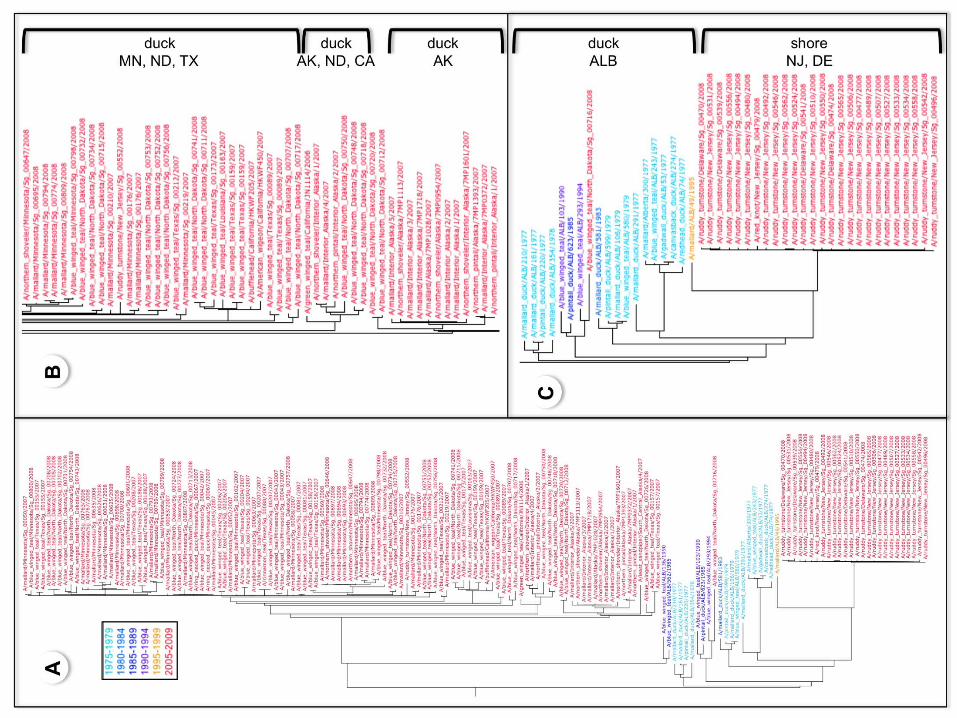
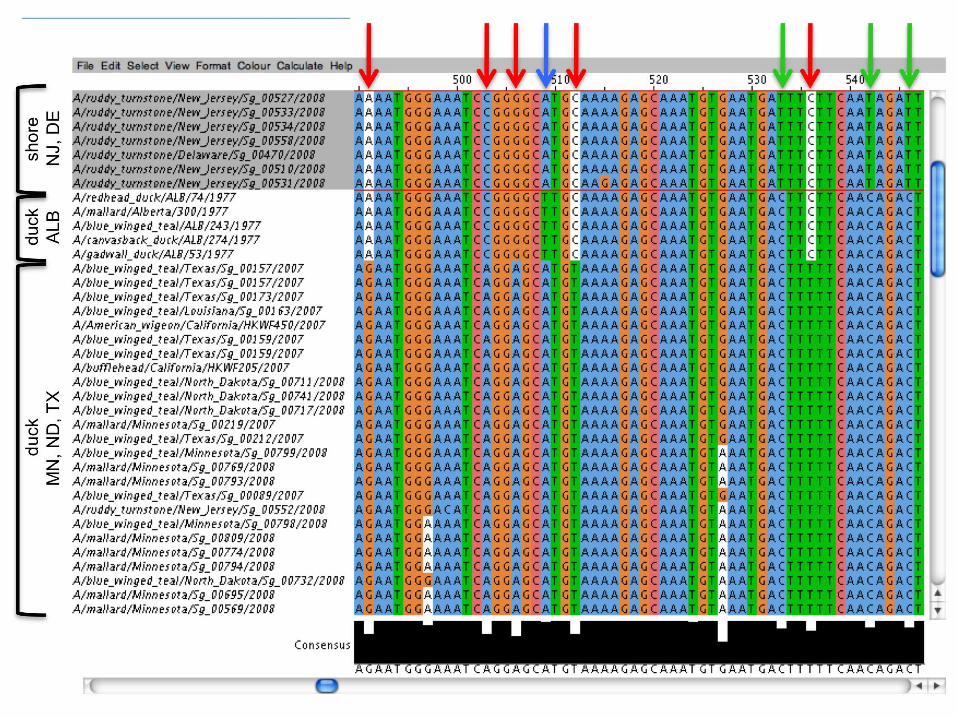
www.fludb.orgVT lineages
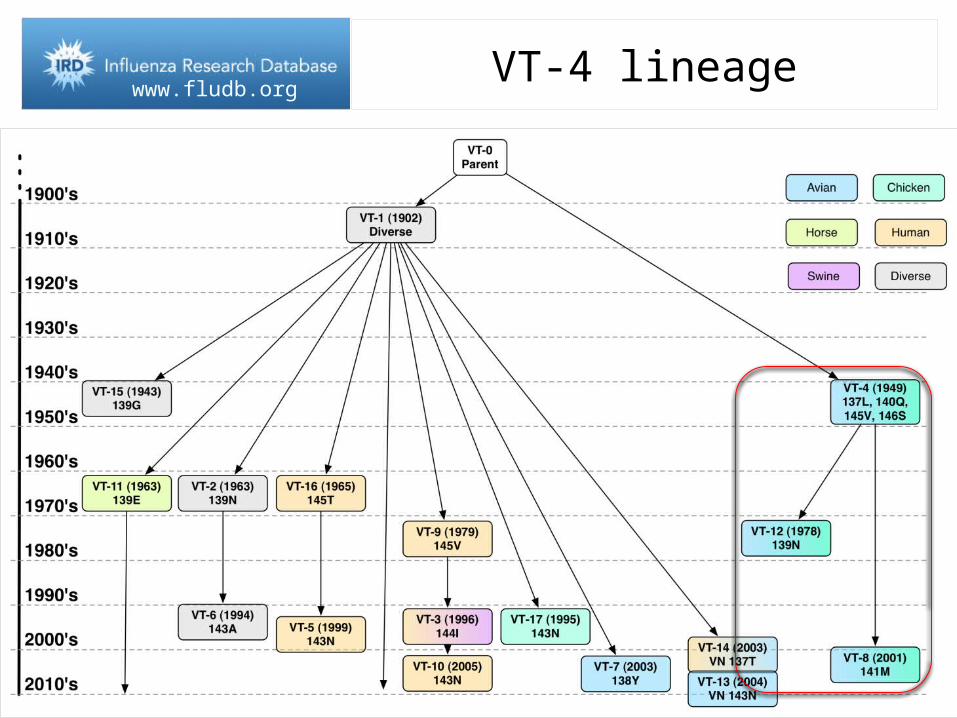
www.fludb.orgVT-4 lineage
www.fludb.org
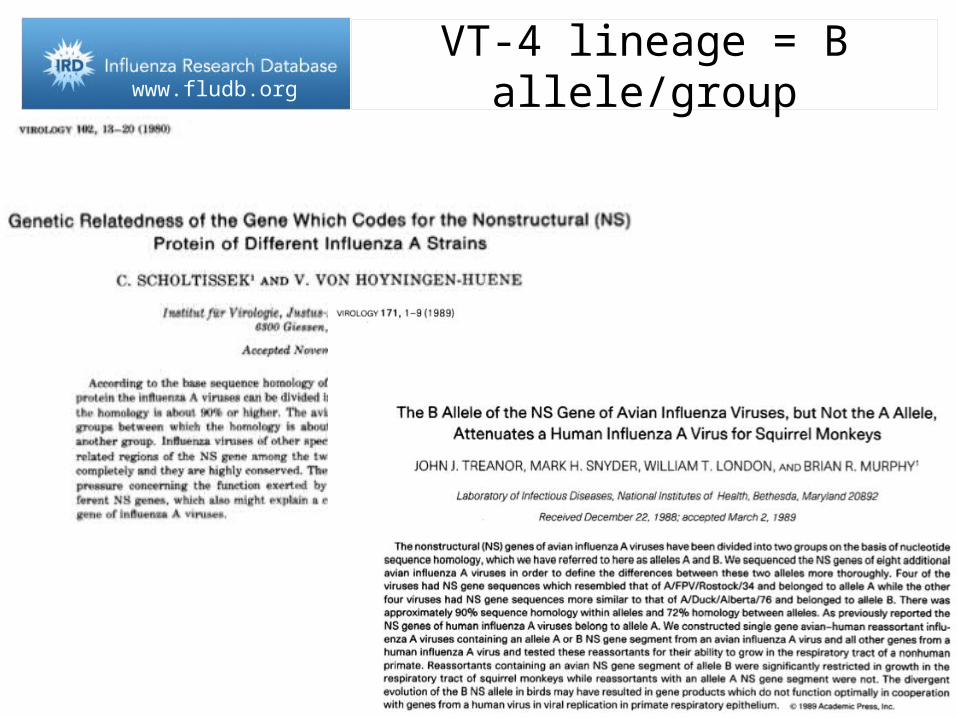
www.fludb.orgVT-4 lineage = B allele/group
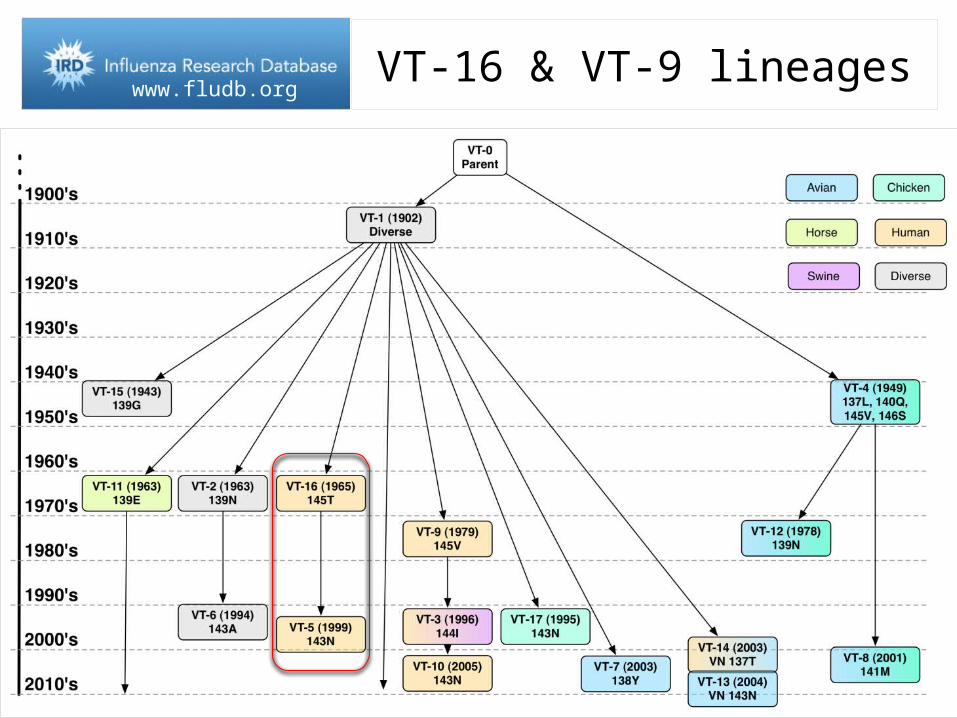
www.fludb.orgVT-16 & VT-9 lineages
www.fludb.org
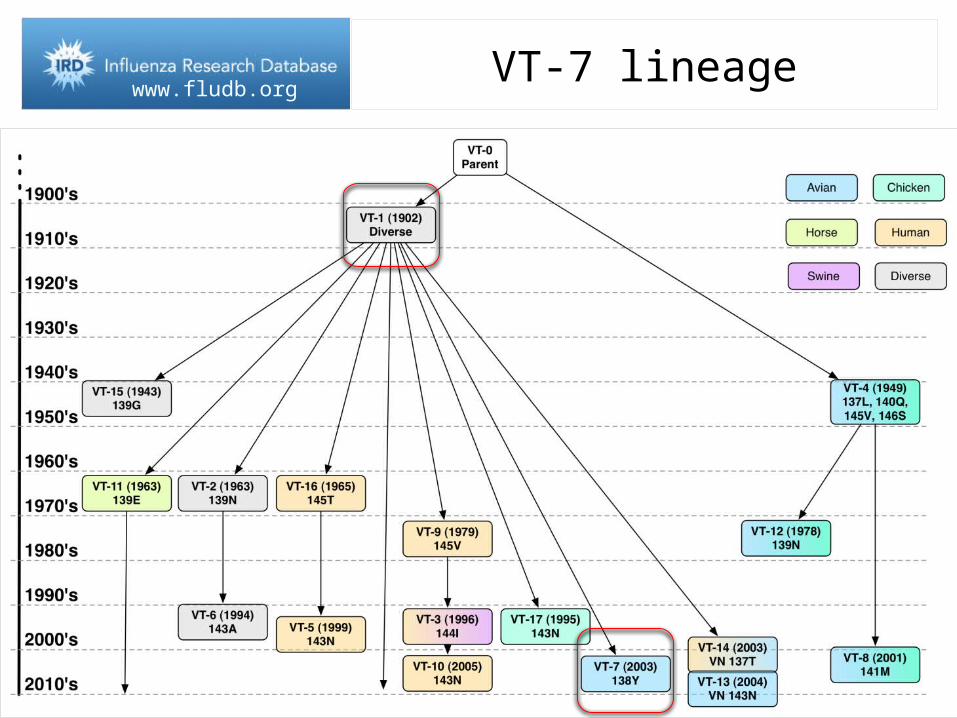
www.fludb.orgVT-7 lineage
www.fludb.org
www.fludb.org
EVOLUTIONARY TRAJECTORY ANALYSIS OF THE PANDEMIC (H1N1) 2009 STRAIN
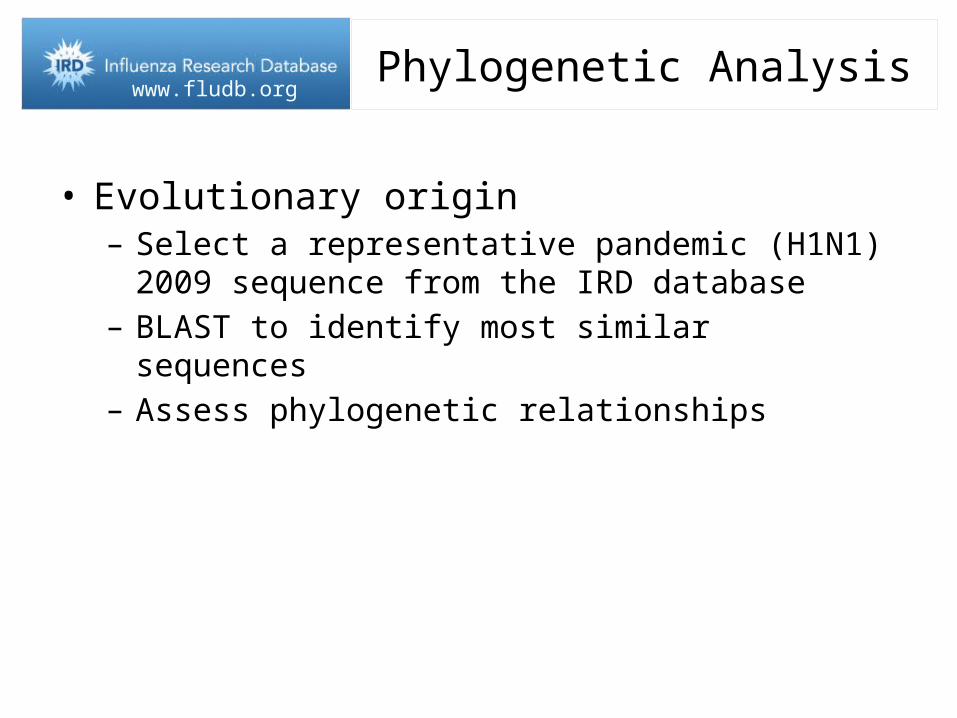
www.fludb.orgPhylogenetic Analysis
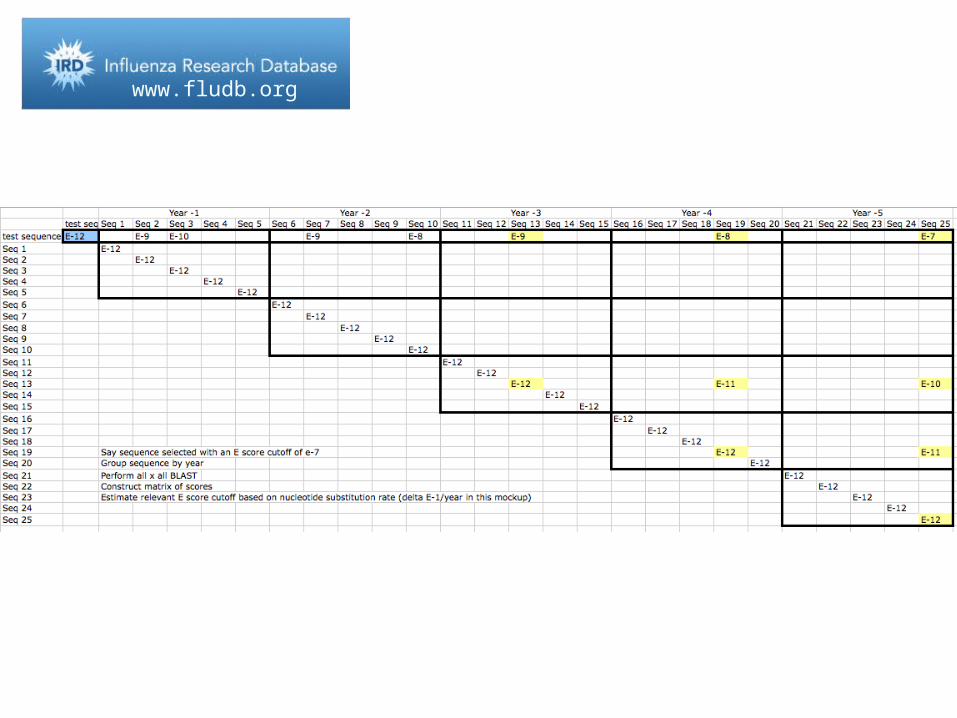
• Evolutionary origin– Select a representative pandemic (H1N1) 2009 sequence
from the IRD database– BLAST to identify most similar sequences– Assess phylogenetic relationships
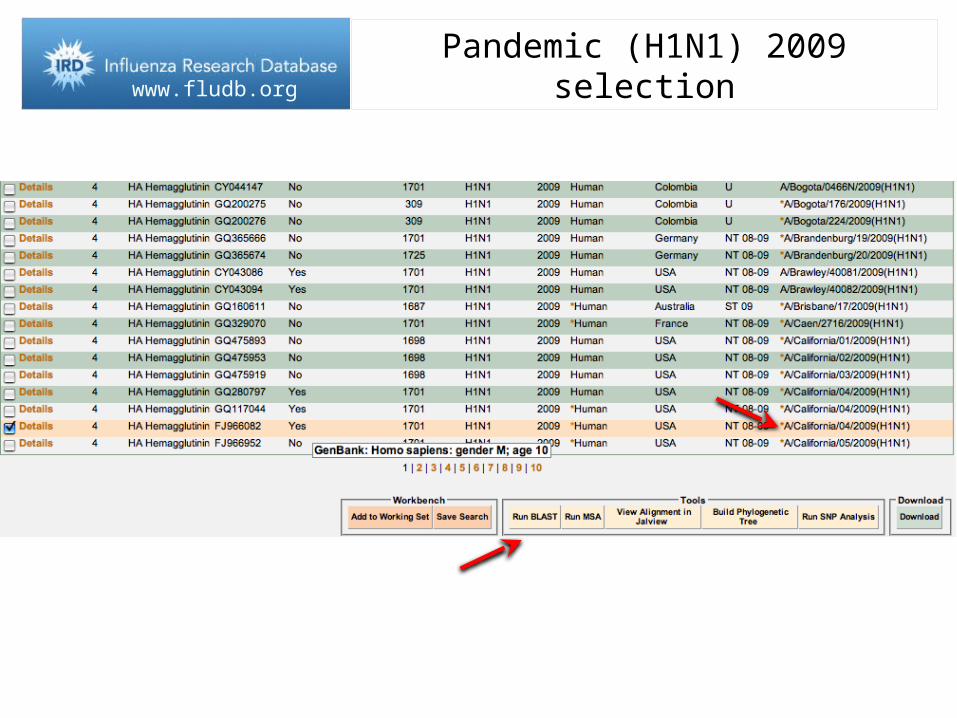
www.fludb.orgPandemic (H1N1) 2009 selection
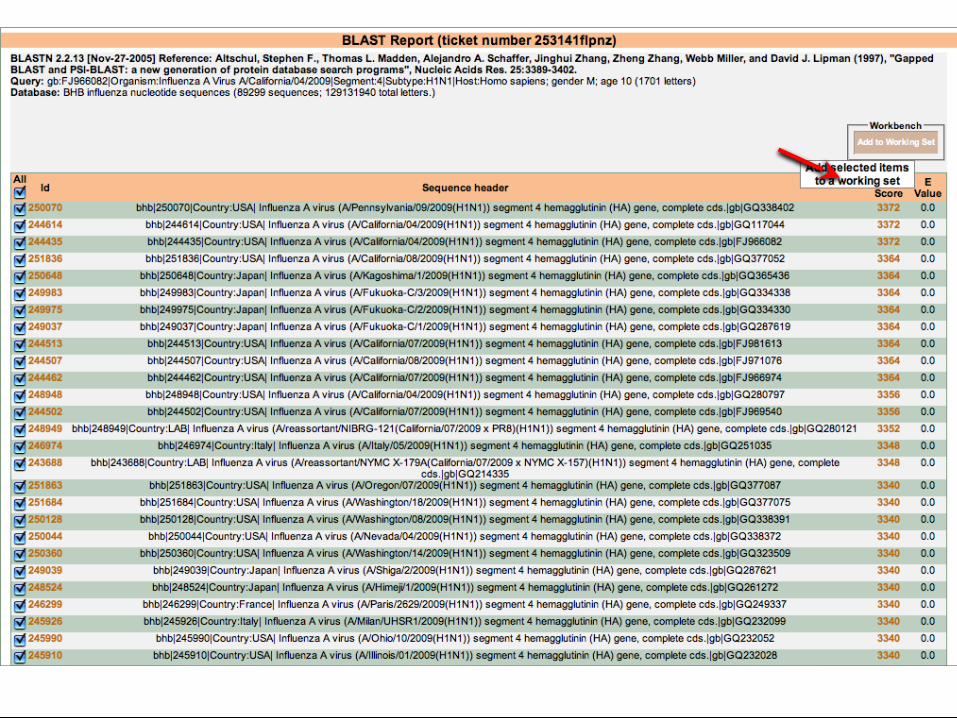
www.fludb.orgBLAST Result
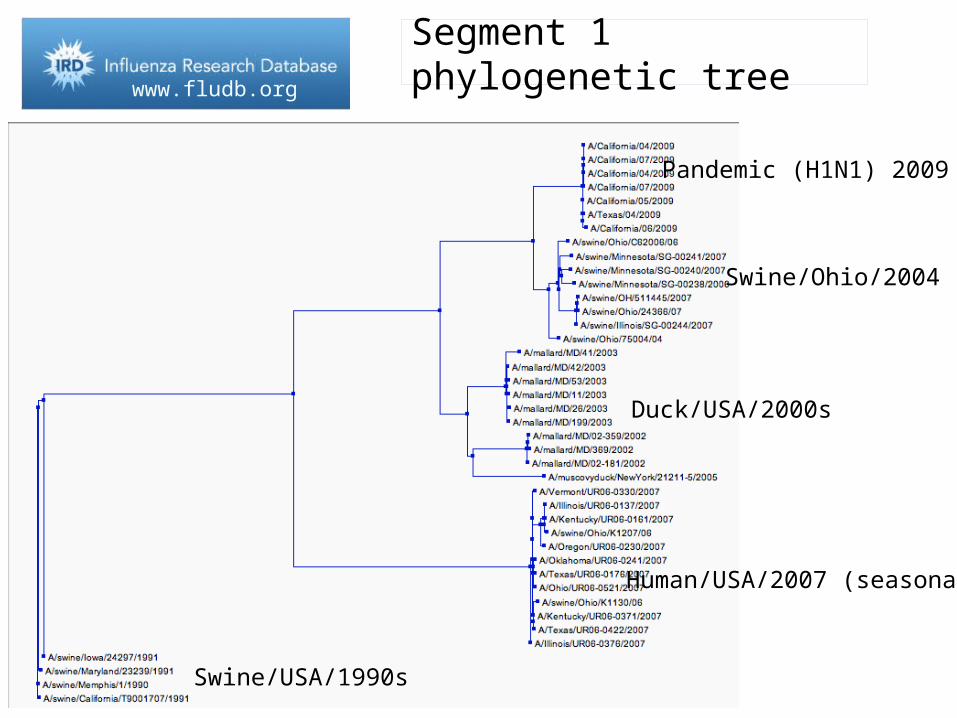
www.fludb.orgSegment 1 phylogenetic tree
Swine/Ohio/2004
Duck/USA/2000s
Human/USA/2007 (seasonal)
Swine/USA/1990s
Pandemic (H1N1) 2009
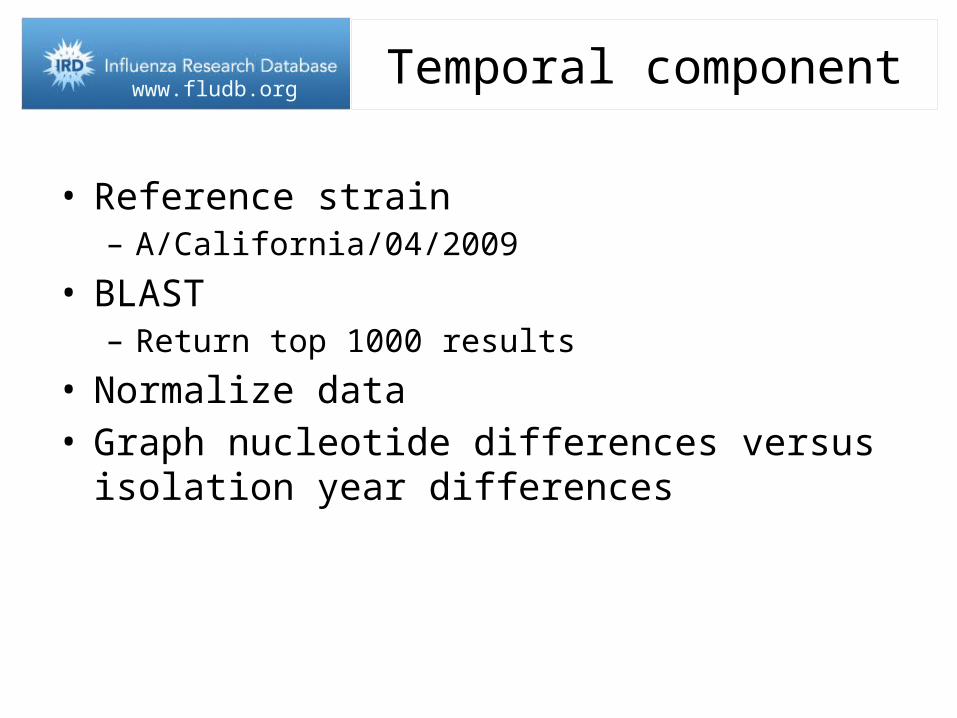
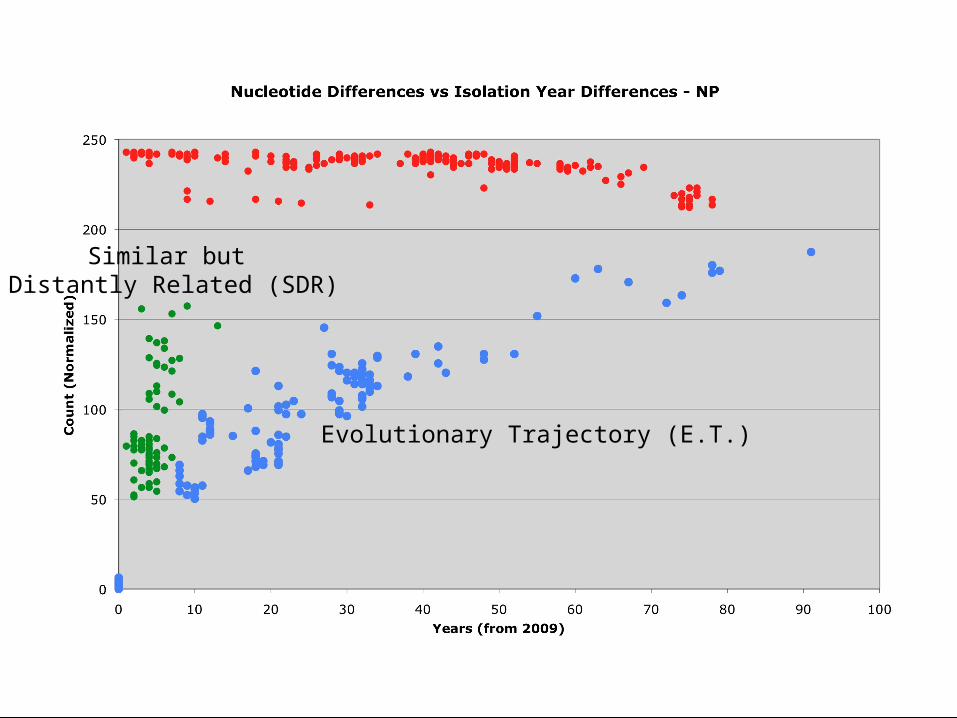
www.fludb.orgTemporal component
• Reference strain– A/California/04/2009
• BLAST– Return top 1000 results
• Normalize data• Graph nucleotide differences versus isolation year
differences
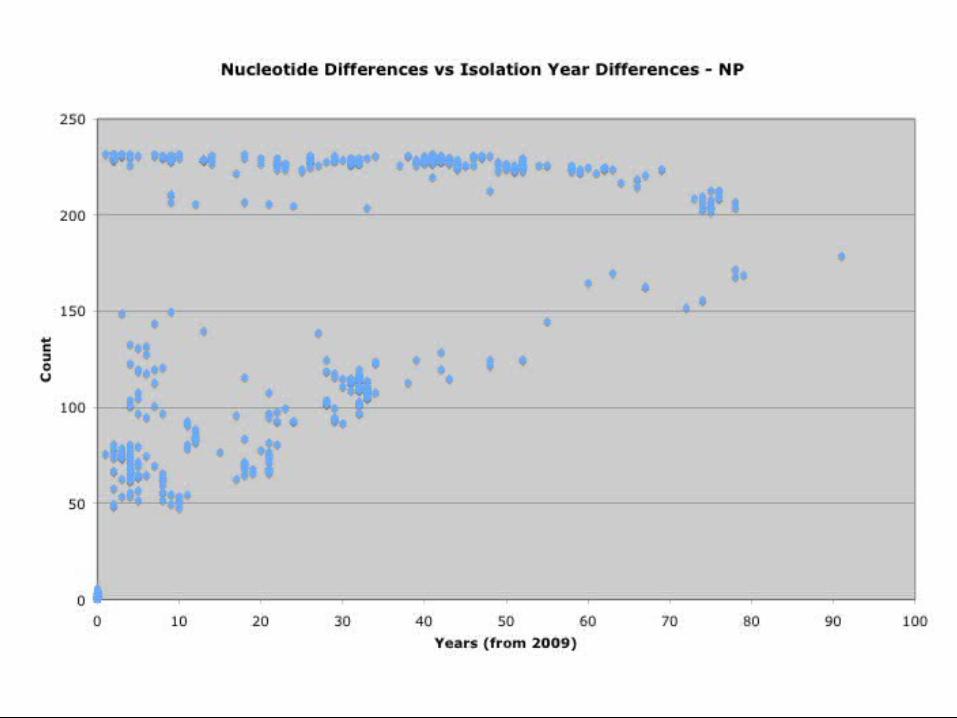
www.fludb.orgNP chart
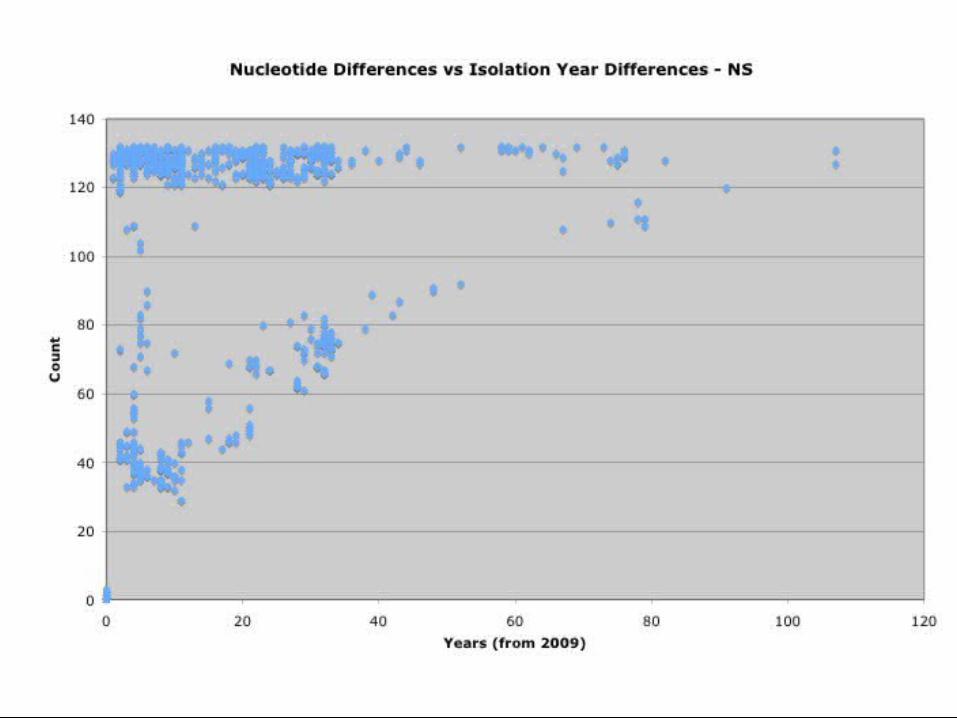
www.fludb.orgNS chart
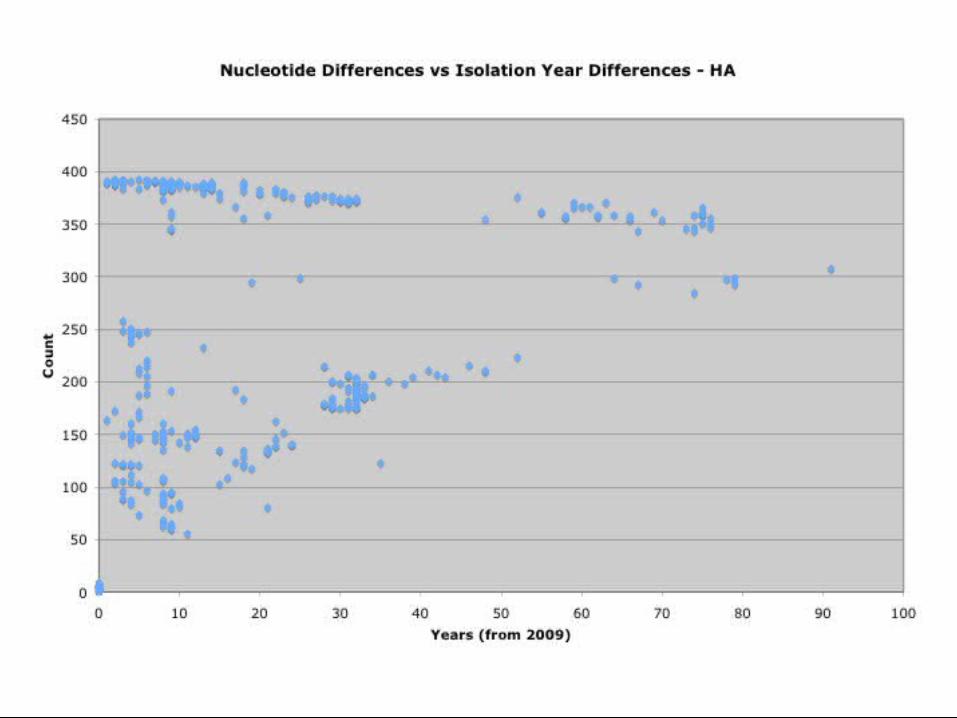
www.fludb.orgHA chart
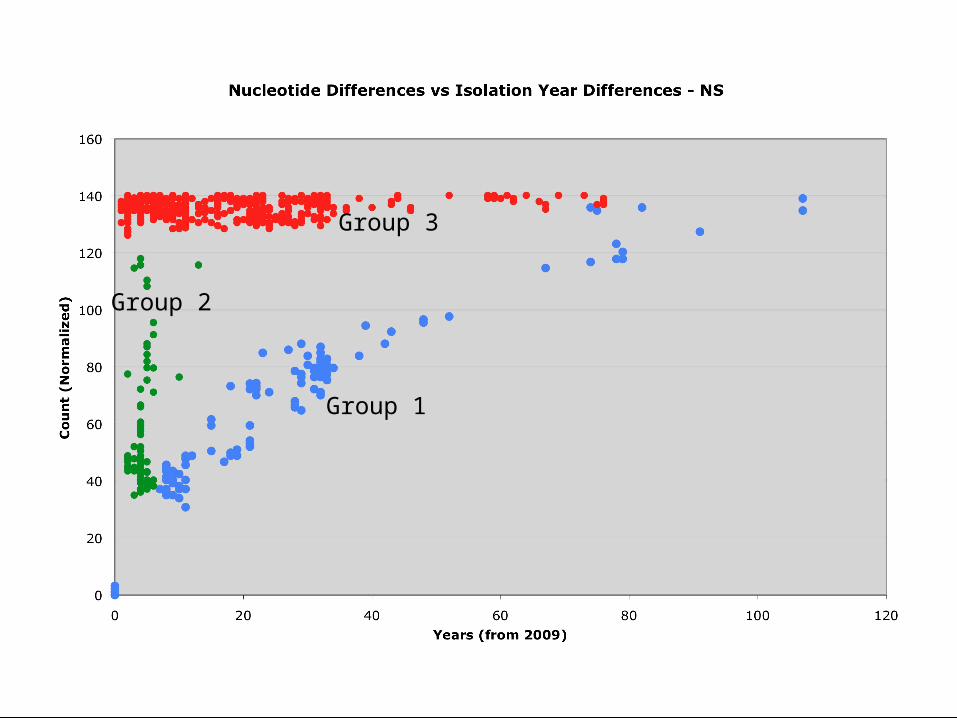
www.fludb.org
Group 1
Group 3
Group 2
www.fludb.org
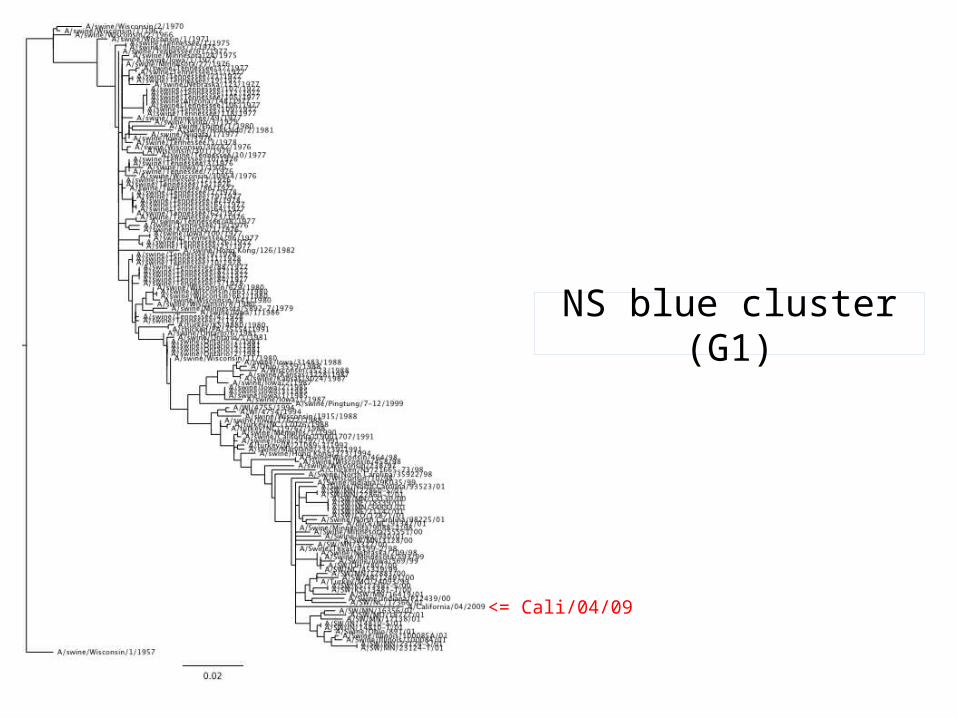
<= Cali/04/09
NS blue cluster (G1)
www.fludb.org
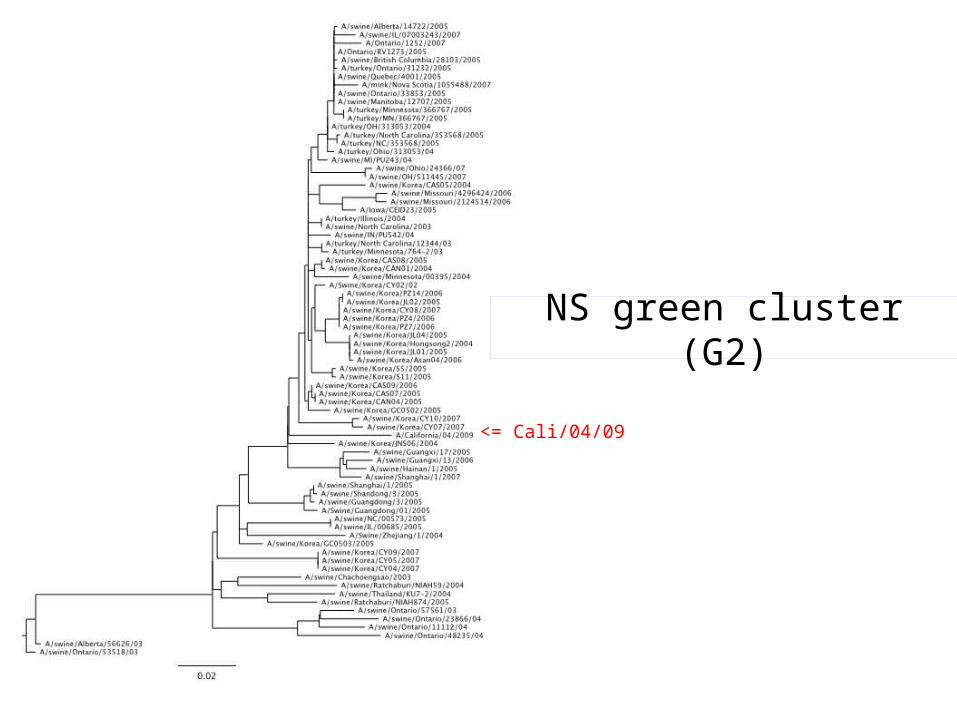
<= Cali/04/09
NS green cluster (G2)
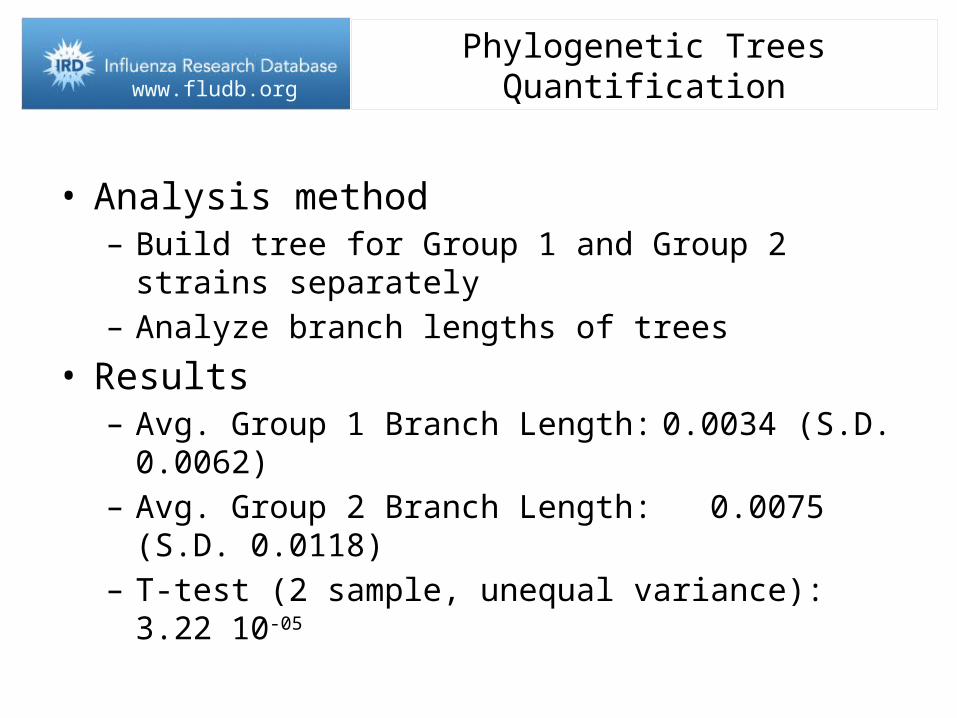
www.fludb.orgPhylogenetic Trees Quantification
• Analysis method– Build tree for Group 1 and Group 2 strains separately– Analyze branch lengths of trees
• Results– Avg. Group 1 Branch Length:0.0034 (S.D. 0.0062)– Avg. Group 2 Branch Length: 0.0075 (S.D. 0.0118)– T-test (2 sample, unequal variance): 3.22 10-05

www.fludb.org
Group 1
Group 3
Group 2
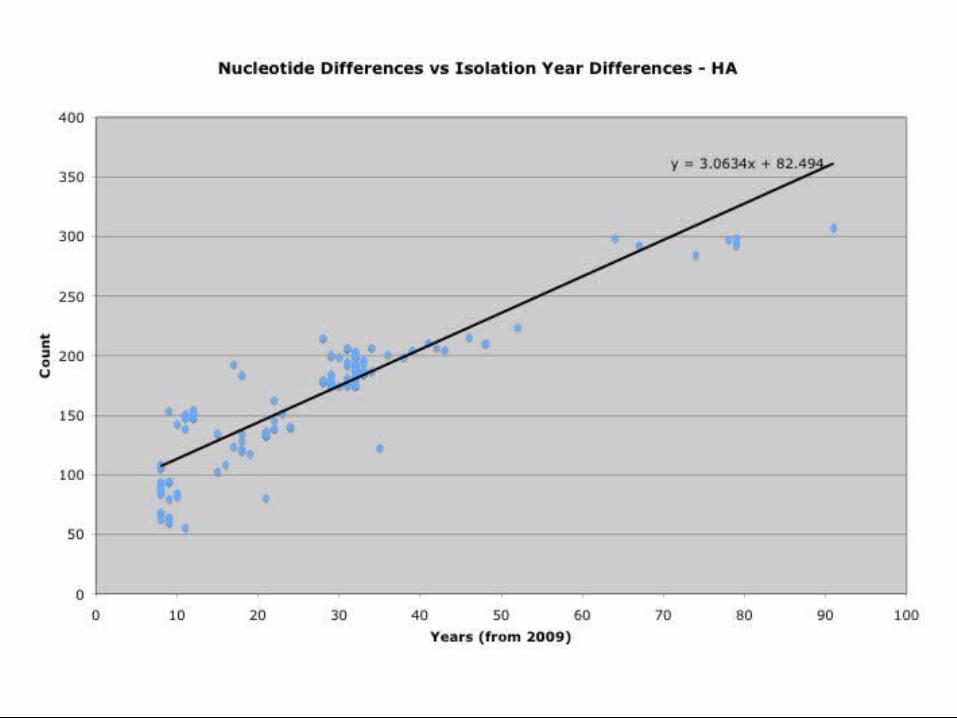
www.fludb.orgHA trendline
www.fludb.org
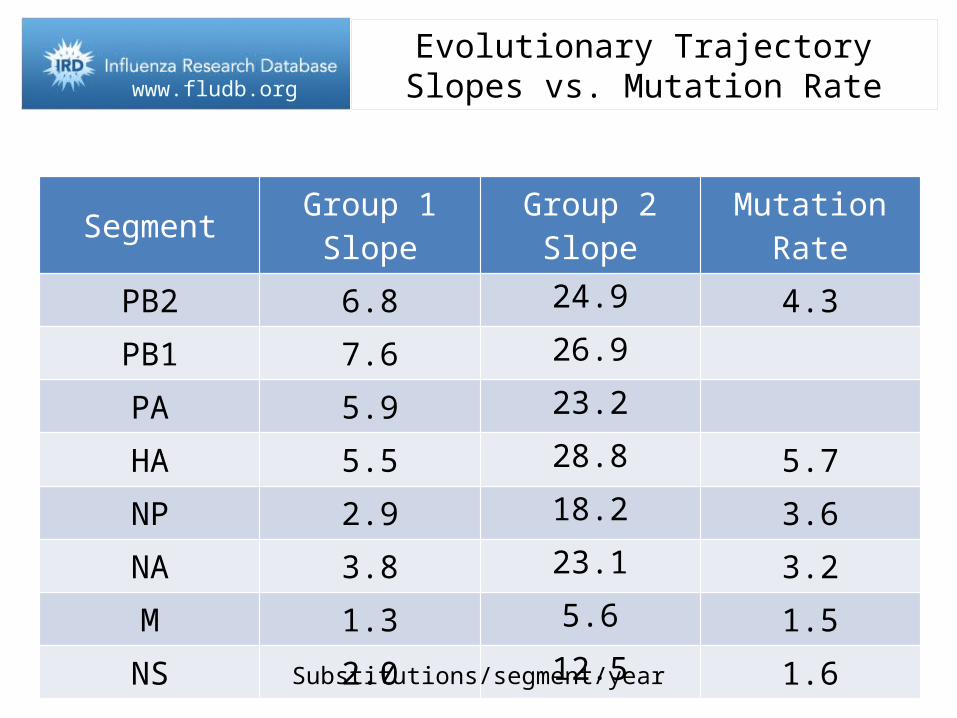
Evolutionary Trajectory Slopes vs. Mutation Rate
Segment Group 1 Slope Group 2 Slope Mutation Rate
PB2 6.8 24.9 4.3
PB1 7.6 26.9
PA 5.9 23.2
HA 5.5 28.8 5.7
NP 2.9 18.2 3.6
NA 3.8 23.1 3.2
M 1.3 5.6 1.5
NS 2.0 12.5 1.6
Substitutions/segment/year
www.fludb.org
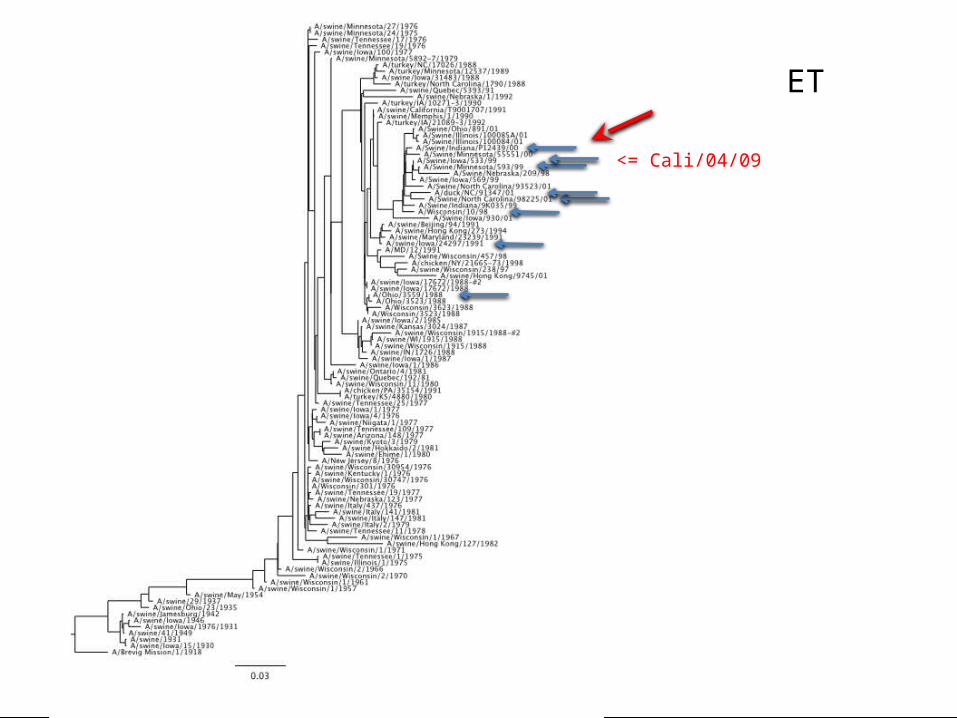
Evolutionary Trajectory (E.T.)
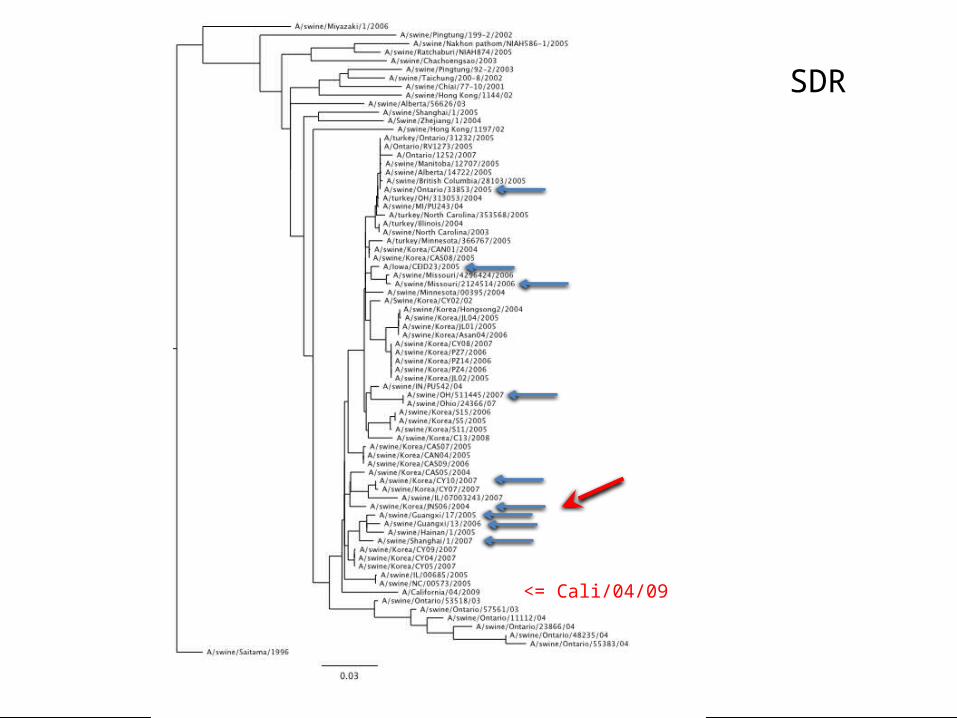
Similar but Distantly Related (SDR)
www.fludb.org
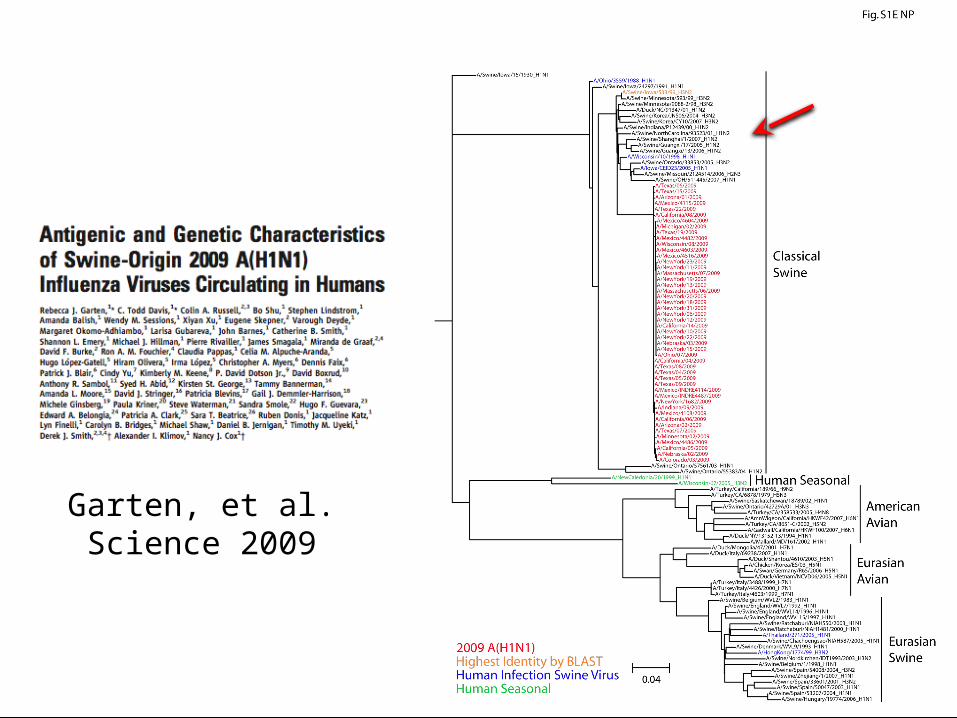
Garten, et al. Science 2009
www.fludb.org
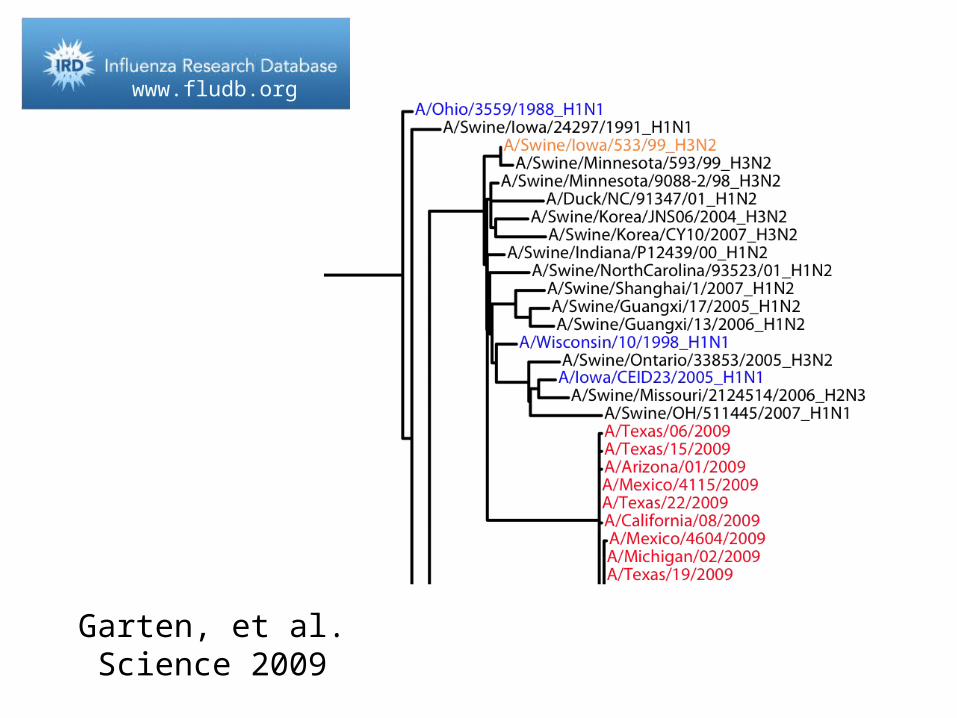
Garten, et al. Science 2009
www.fludb.org
<= Cali/04/09
ET
www.fludb.org
<= Cali/04/09
SDR
www.fludb.org
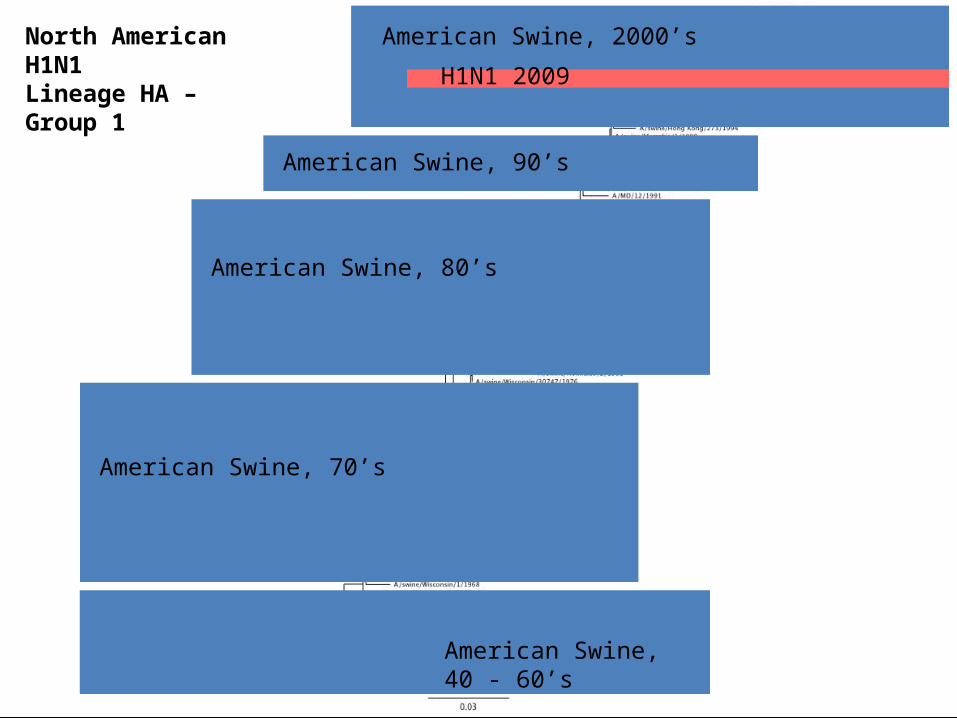
North American H1N1 Lineage - HAH1N1 2009
American Swine, 2000’sNorth American H1N1Lineage HA – Group 1
American Swine, 90’s
American Swine, 80’s
American Swine, 70’s
American Swine, 40 - 60’s
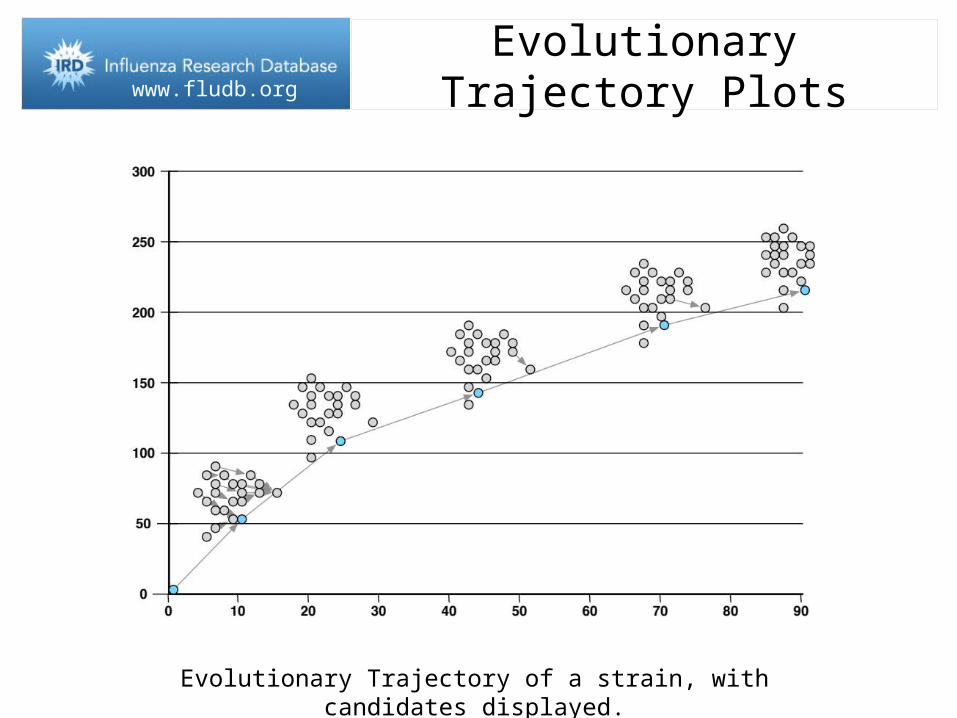
www.fludb.orgEvolutionary Trajectory Plots
Evolutionary Trajectory of a strain, with candidates displayed.
www.fludb.org

www.fludb.org
www.fludb.orgSummary
• The Influenza Research Database (IRD) provides a comprehensive resource of data, analysis and visualization tools about influenza virus – www.fludb.org
• SFVT represents a novel tool that can be used to better understand genotype-phenotype relationships for flu
• Use of IRD to illuminate the viral origins of the pandemic (H1N1) 2009 virus
• IRD is continually evolving to capture and integrate addition data and analytical tools to support the needs of the influenza research community
www.fludb.org
72
• U.T. Southwestern– Richard Scheuermann (PI)– Burke Squires– Jyothi Noronha– Victoria Hunt– Shubhada Godbole– Brett Pickett– Yun Zhang
• MSSM– Adolfo Garcia-Sastre– Eric Bortz– Gina Conenello– Peter Palese
• Vecna– Chris Larsen– Al Ramsey
• LANL– Catherine Macken– Mira Dimitrijevic
• U.C. Davis– Nicole Baumgarth
• Northrop Grumman– Ed Klem– Mike Atassi– Kevin Biersack– Jon Dietrich– Wenjie Hua– Wei Jen– Sanjeev Kumar– Xiaomei Li– Zaigang Liu– Jason Lucas– Michelle Lu– Bruce Quesenberry– Barbara Rotchford– Hongbo Su– Bryan Walters– Jianjun Wang– Sam Zaremba– Liwei Zhou
• IRD SWG– Gillian Air, OMRF– Carol Cardona, Univ. Minnesota– Adolfo Garcia-Sastre, Mt Sinai– Elodie Ghedin, Univ. Pittsburgh– Martha Nelson, Fogarty– Daniel Perez, Univ. Maryland– Gavin Smith, Duke Singapore– David Spiro, JCVI– Dave Stallknecht, Univ. Georgia– David Topham, Rochester– Richard Webby, St Jude
• USDA– David Suarez
• Sage Analytica– Robert Taylor– Lone Simonsen
• CEIRS Centers
Acknowledgments
N01AI40041
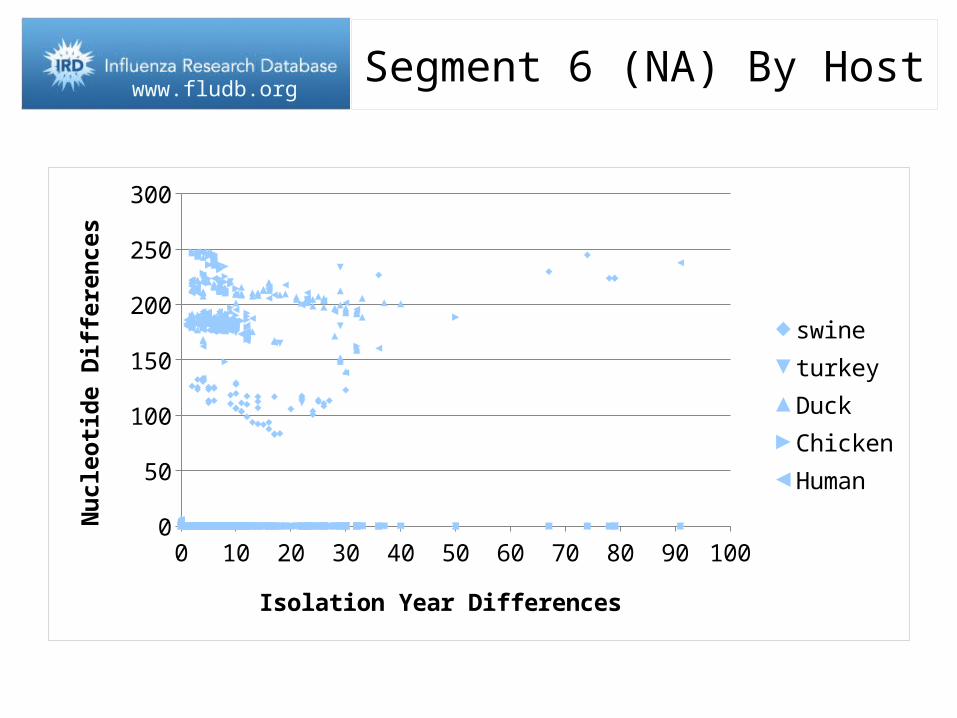
www.fludb.orgSegment 6 (NA) By Host
0 10 20 30 40 50 60 70 80 90 1000
50
100
150
200
250
300
swineturkeyDuckChickenHuman
Isolation Year Differences
Nuc
leoti
de D
iffer
ence
s