Embed Size (px)
Citation preview
www.conferenceboard.org© 2012 The Conference Board, Inc. |1
Recent Changes in Europe’s Competitive Landscape How the Sources of Demand and Supply Are Shaping Up
January 2013
Bart van Ark, Vivian Chen, Bert Colijn, Kirsten Jaeger, Wim Overmeer and Marcel Timmer
www.conferenceboard.org© 2012 The Conference Board, Inc. |2
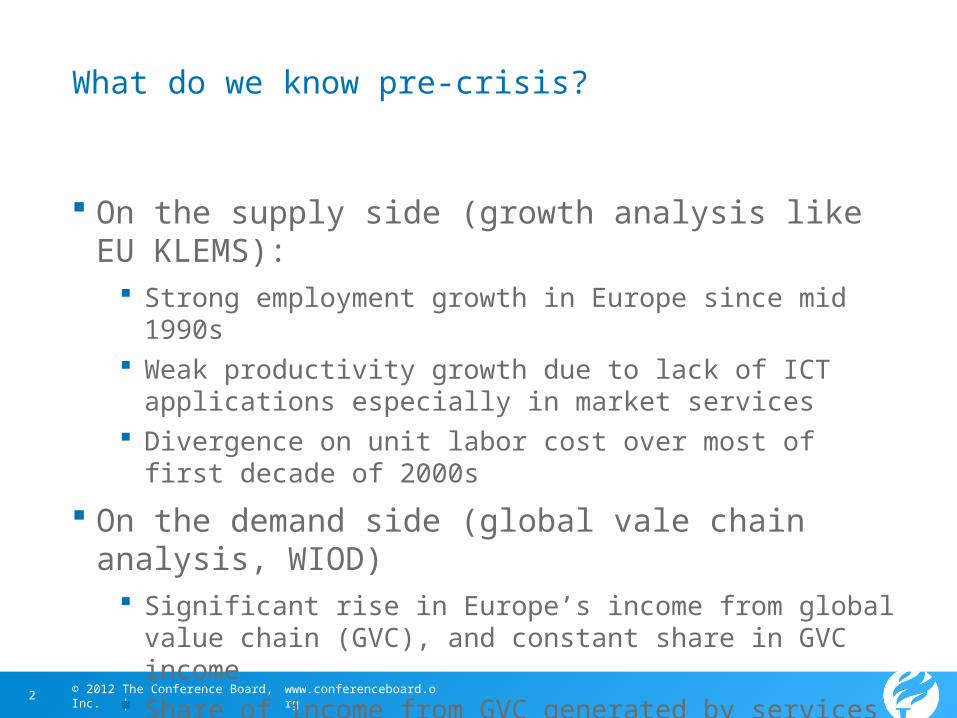
What do we know pre-crisis?
On the supply side (growth analysis like EU KLEMS): Strong employment growth in Europe since mid 1990s Weak productivity growth due to lack of ICT applications
especially in market services Divergence on unit labor cost over most of first decade of
2000s
On the demand side (global vale chain analysis, WIOD) Significant rise in Europe’s income from global value chain
(GVC), and constant share in GVC income Share of income from GVC generated by services in Europe
increased Increased share of GVC income goes to high and medium-
skilled labor
www.conferenceboard.org© 2012 The Conference Board, Inc. |3
The key questions asked in this paper
How do we reconcile the old story of Europe’s slow productivity performance, relative to the newly emerging evidence from the value chain analysis?
Has Europe, despite its weak aggregate productivity performance, become more of a stronghold in the global value chain?
What does this imply for the future performance of the aggregate and the larger domestic sectors?
How do these patterns evolve between the different economies in Europe?

www.conferenceboard.org© 2012 The Conference Board, Inc. |4
Key insights
Updated aggregate and sectoral growth accounts to 2011 show the productivity problem has spread
Goods sector is recovering faster than market services
Market services further increased contribution to global value chains, both in terms of job creation as well as productivity
A multi-tiered Europe emerging? German and Poland are optimizing supply chain in
manufacturing and market services French inward-looking economic characteristics are more alike
that other Mediterranean economies A diverse group include Nordic/Benelux/UK and Ireland has
ability to rapidly recover in less rigid labor and product markets
www.conferenceboard.org© 2012 The Conference Board, Inc. |5
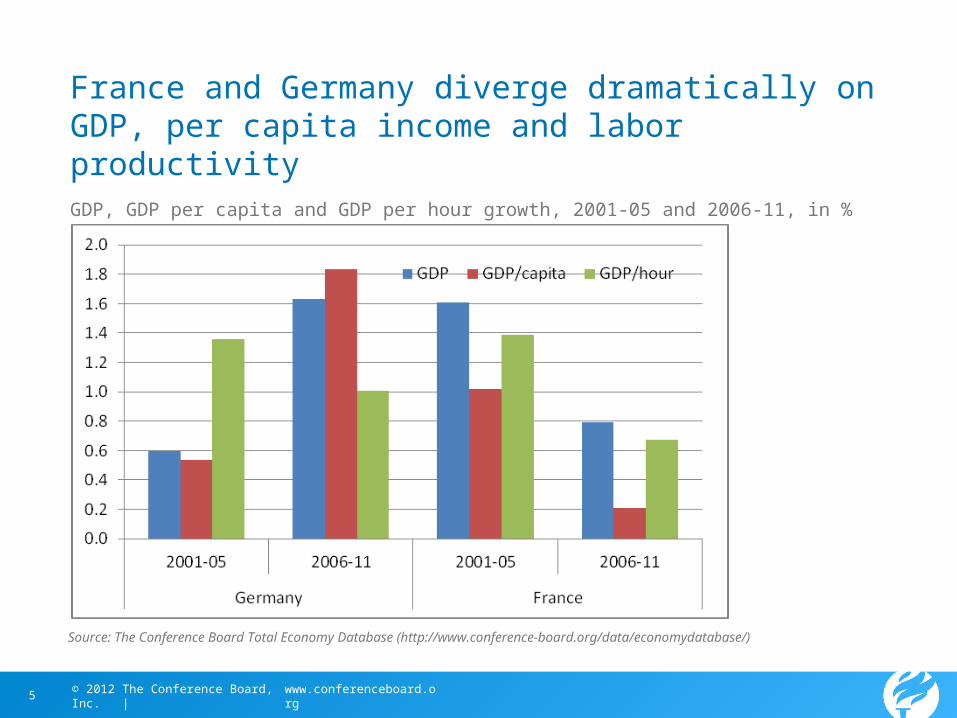
France and Germany diverge dramatically on GDP, per capita income and labor productivity
GDP, GDP per capita and GDP per hour growth, 2001-05 and 2006-11, in %
Source: The Conference Board Total Economy Database (http://www.conference-board.org/data/economydatabase/)
www.conferenceboard.org© 2012 The Conference Board, Inc. |6
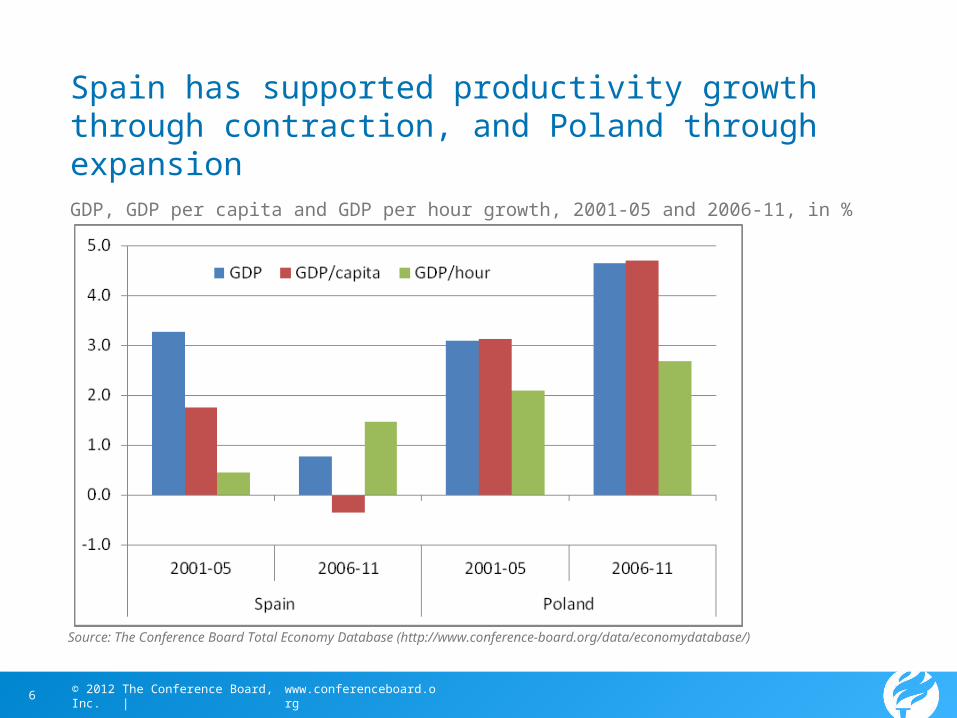
Spain has supported productivity growth through contraction, and Poland through expansion
GDP, GDP per capita and GDP per hour growth, 2001-05 and 2006-11, in %
Source: The Conference Board Total Economy Database (http://www.conference-board.org/data/economydatabase/)
www.conferenceboard.org© 2012 The Conference Board, Inc. |7
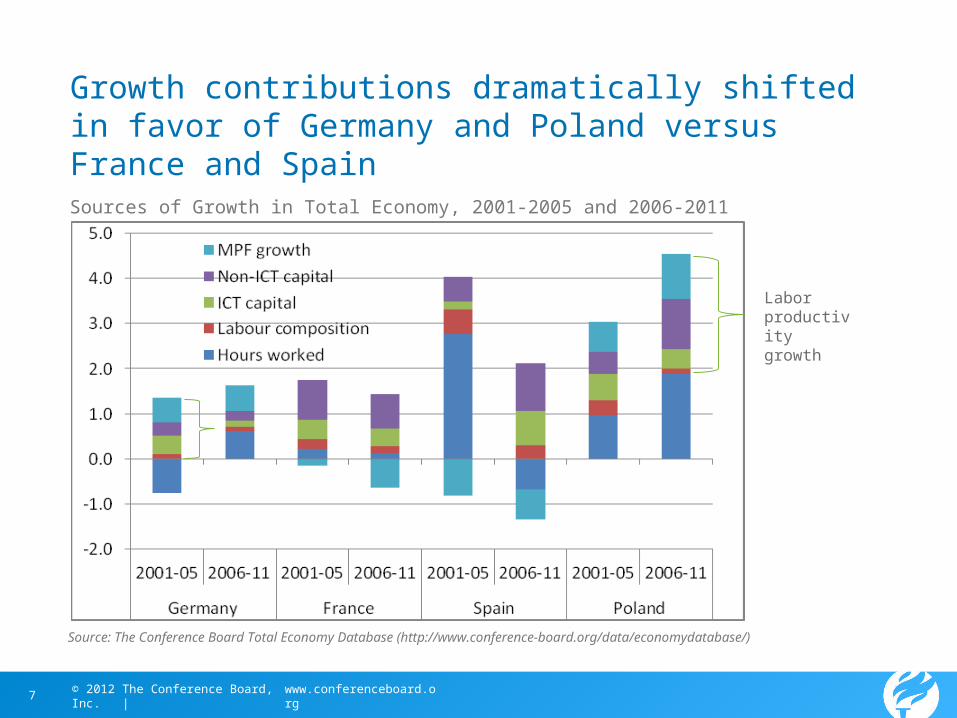
Growth contributions dramatically shifted in favor of Germany and Poland versus France and Spain
Source: The Conference Board Total Economy Database (http://www.conference-board.org/data/economydatabase/)
Sources of Growth in Total Economy, 2001-2005 and 2006-2011
Labor productivity growth
www.conferenceboard.org© 2012 The Conference Board, Inc. |8
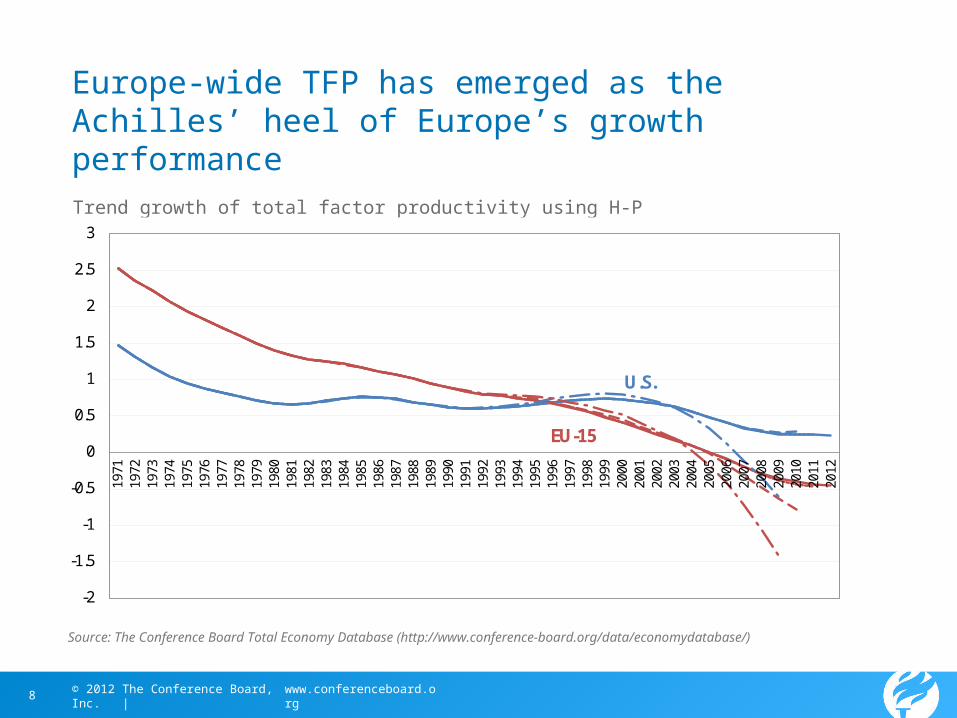
Europe-wide TFP has emerged as the Achilles’ heel of Europe’s growth performance
Trend growth of total factor productivity using H-P filter
-2
-1.5
-1
-0.5
0
0.5
1
1.5
2
2.5
3
1971
1972
1973
1974
1975
1976
1977
1978
1979
1980
1981
1982
1983
1984
1985
1986
1987
1988
1989
1990
1991
1992
1993
1994
1995
1996
1997
1998
1999
2000
2001
2002
2003
2004
2005
2006
2007
2008
2009
2010
2011
2012
U.S.
EU-15
Source: The Conference Board Total Economy Database (http://www.conference-board.org/data/economydatabase/)
www.conferenceboard.org© 2012 The Conference Board, Inc. |9
How can negative TFP growth happen and can it last for long?
Negative effects from recession should be short-lived
Longer-term, TFP signals weaker technological progress and innovation – an ongoing trend since decades
Increased rigidities in labor, product and capital markets lead to greater misallocation to less productive firms
Negative reallocation effects with more resources going to less productive sectors in the economy (EU KLEMS)
Caveat: TFP is a residual, so measurement error in output or inputs and unmeasured effects end up here
www.conferenceboard.org© 2012 The Conference Board, Inc. |10
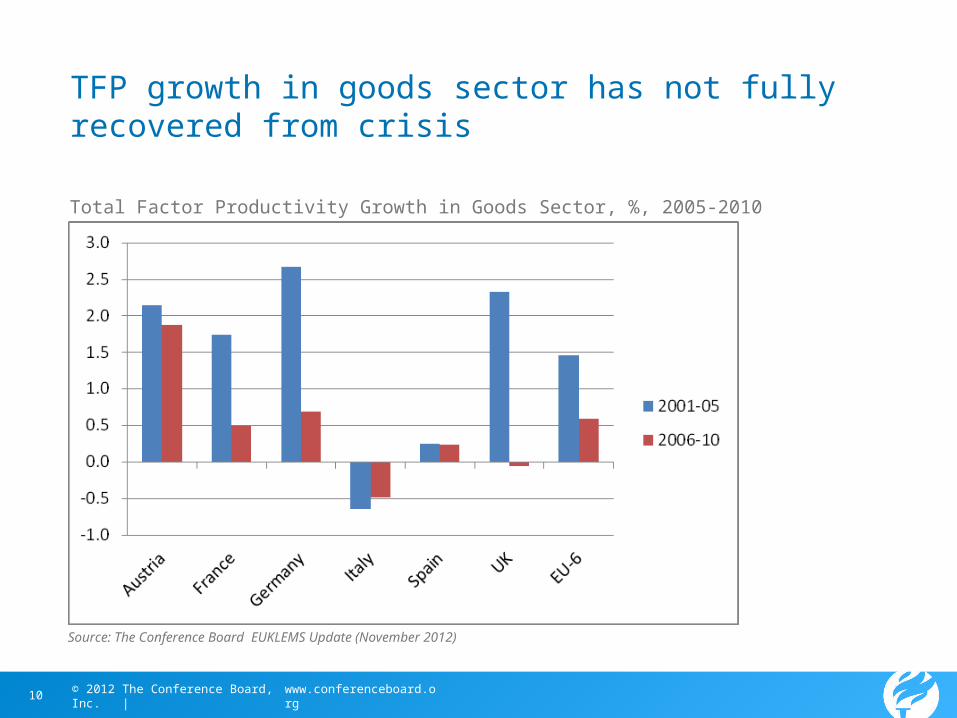
TFP growth in goods sector has not fully recovered from crisis
Source: The Conference Board EUKLEMS Update (November 2012)
Total Factor Productivity Growth in Goods Sector, %, 2005-2010
www.conferenceboard.org© 2012 The Conference Board, Inc. |11
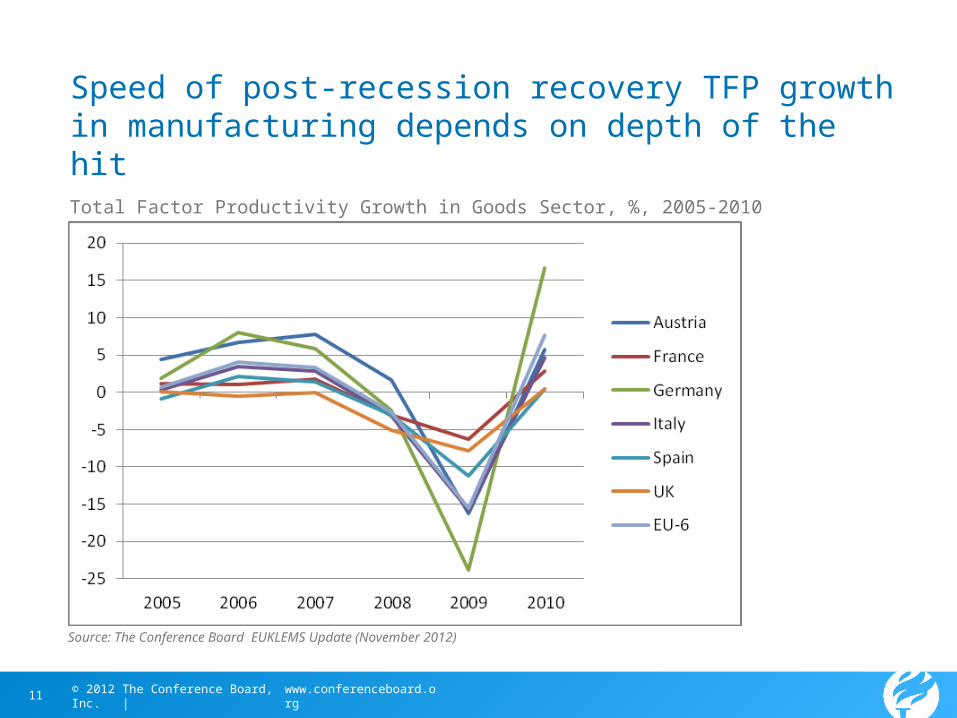
Speed of post-recession recovery TFP growth in manufacturing depends on depth of the hit
Source: The Conference Board EUKLEMS Update (November 2012)
Total Factor Productivity Growth in Goods Sector, %, 2005-2010
www.conferenceboard.org© 2012 The Conference Board, Inc. |12
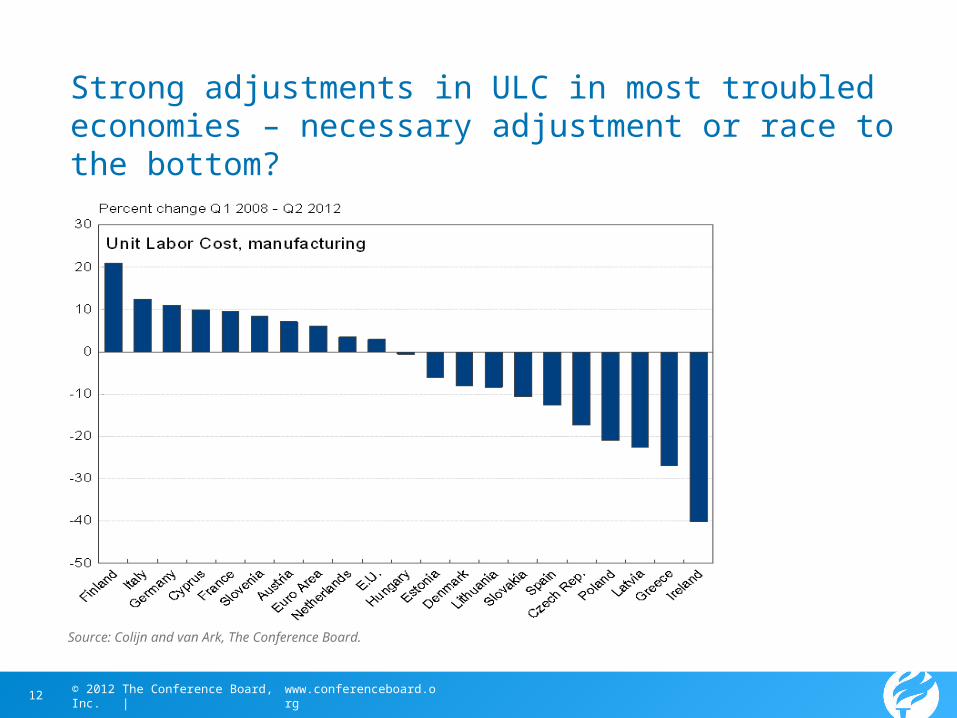
Strong adjustments in ULC in most troubled economies – necessary adjustment or race to the bottom?
Source: Colijn and van Ark, The Conference Board.
www.conferenceboard.org© 2012 The Conference Board, Inc. |13
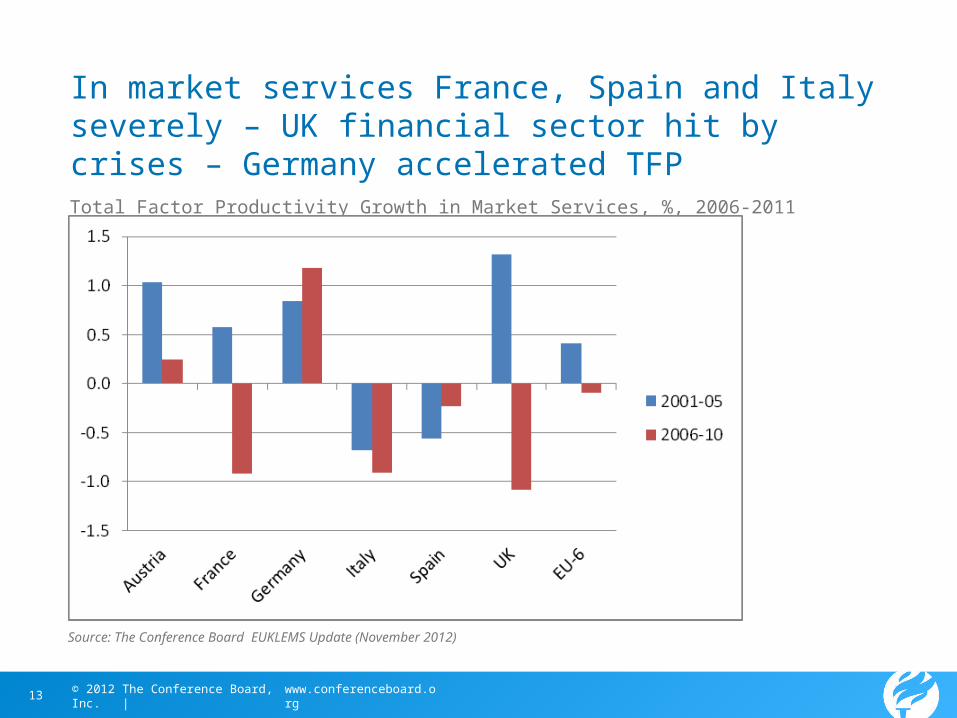
In market services France, Spain and Italy severely – UK financial sector hit by crises – Germany accelerated TFP
Source: The Conference Board EUKLEMS Update (November 2012)
Total Factor Productivity Growth in Market Services, %, 2006-2011
www.conferenceboard.org© 2012 The Conference Board, Inc. |14
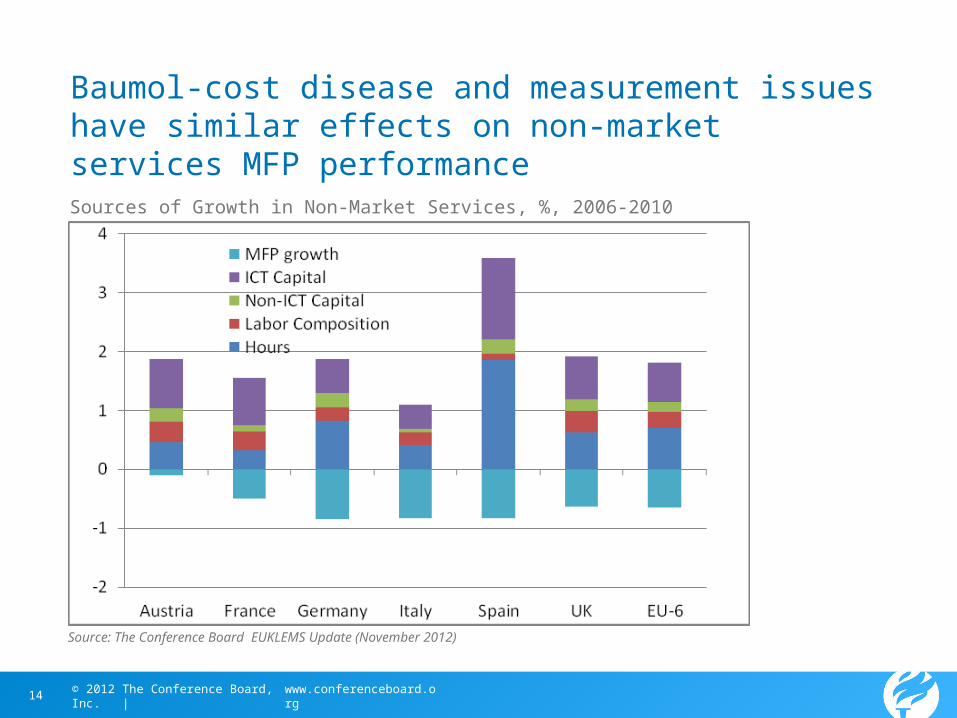
Baumol-cost disease and measurement issues have similar effects on non-market services MFP performance
Source: The Conference Board EUKLEMS Update (November 2012)
Sources of Growth in Non-Market Services, %, 2006-2010

www.conferenceboard.org© 2012 The Conference Board, Inc. |15
Employment for foreign demand has increased in Germany but stalled in France
Source: World Input-Output Database (WIOD)
Employment Distribution Resulting from Sources of Global and Domestic Demand for Goods and Services in Germany and France
www.conferenceboard.org© 2012 The Conference Board, Inc. |16
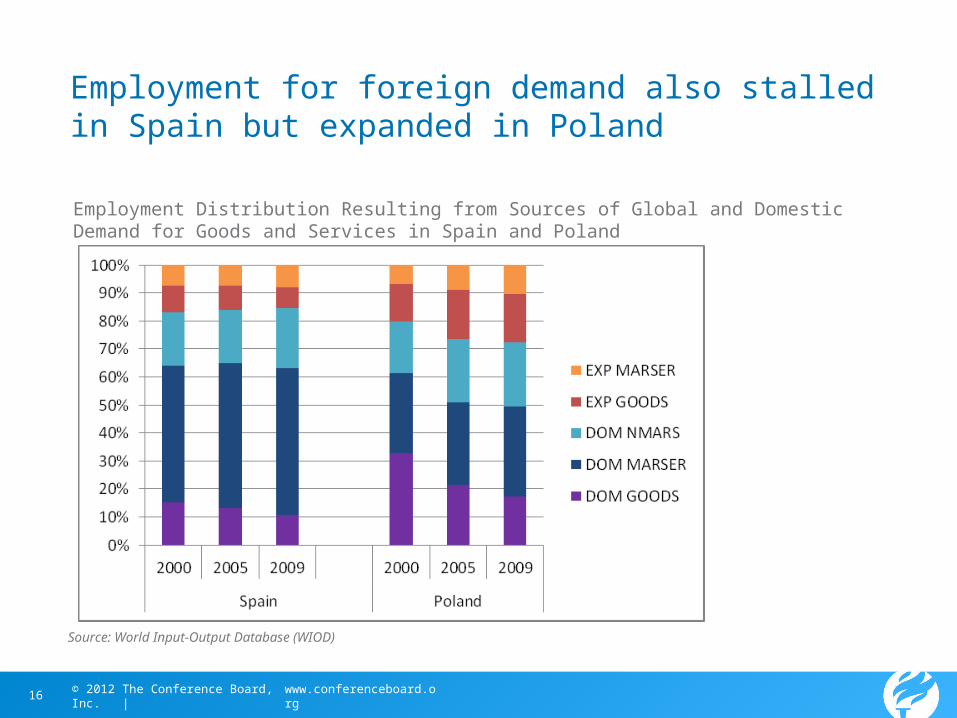
Employment for foreign demand also stalled in Spain but expanded in Poland
Source: World Input-Output Database (WIOD)
Employment Distribution Resulting from Sources of Global and Domestic Demand for Goods and Services in Spain and Poland
www.conferenceboard.org© 2012 The Conference Board, Inc. |17
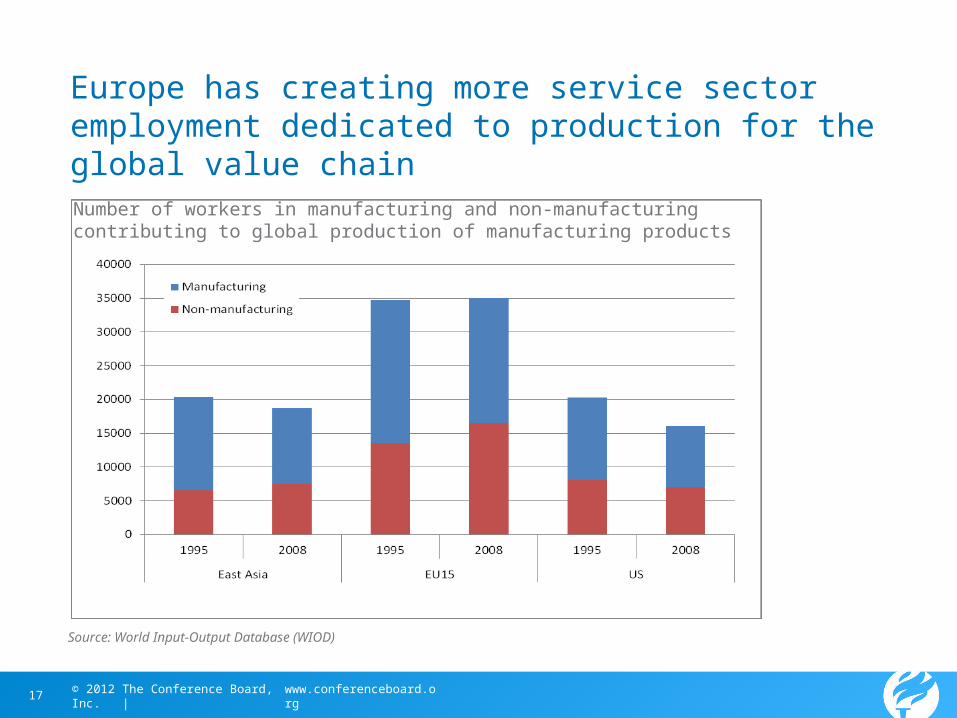
Europe has creating more service sector employment dedicated to production for the global value chain
Source: World Input-Output Database (WIOD)
Number of workers in manufacturing and non-manufacturing contributing to global production of manufacturing products
www.conferenceboard.org© 2012 The Conference Board, Inc. |18
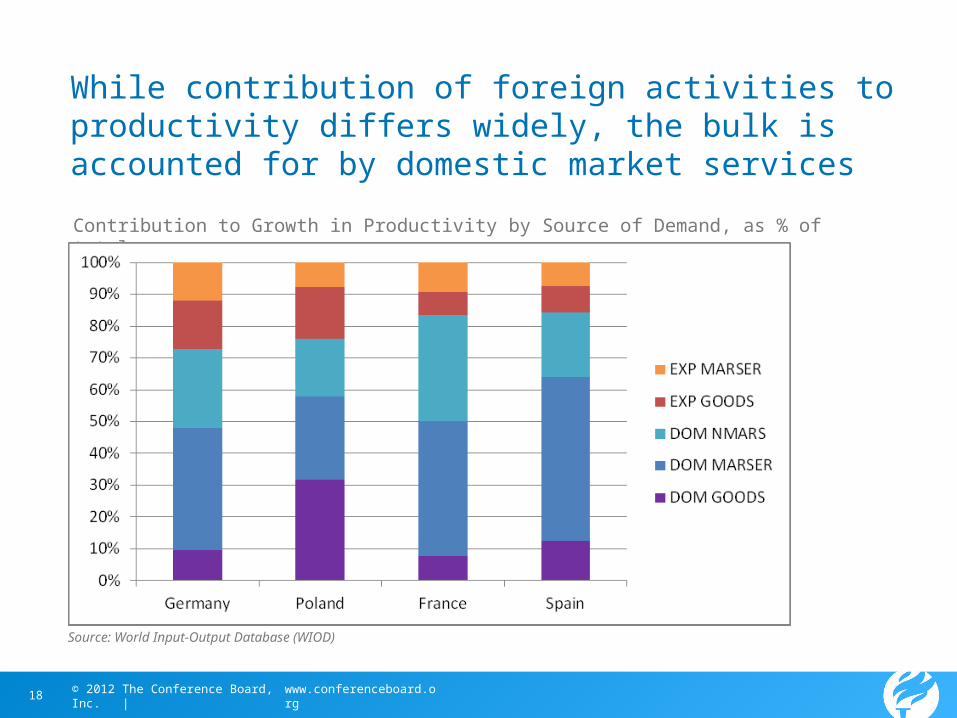
While contribution of foreign activities to productivity differs widely, the bulk is accounted for by domestic market services
Source: World Input-Output Database (WIOD)
Contribution to Growth in Productivity by Source of Demand, as % of total
www.conferenceboard.org© 2012 The Conference Board, Inc. |19
Growth projections are based on measurement of trend growth (as proxy for potential output growth) Projections of Gross Domestic Product (GDP) used in The Conference Board Global
Economic Outlook, are based on trend growth (as proxy for potential output growth)
Potential output represents the level of output an economy can produce in a noninflationary way, given the size of its labor force and its potential to invest in and create technological progress
Projections for medium- (2013-2018) and long-term (2019-2025) trend growth cover 11 regions, including 33 advanced economies and 22 major emerging economies.
Model uses a production-based growth accounting framework which measures supply side contributions of labor, capital and productivity.
― Labor is projected by demographic information― Capital services growth and total factor productivity growth are estimates by
regression approach using relevant variables (savings, trade openness, education, population dependency ratios, etc.)
Smooth adjustment from actual 2012 growth rate to medium-term trend growth rates
Optimistic and pessimistic deviation from base case projections are based on assumptions with regard to productivity as key driver of long term growth
www.conferenceboard.org© 2012 The Conference Board, Inc. |20
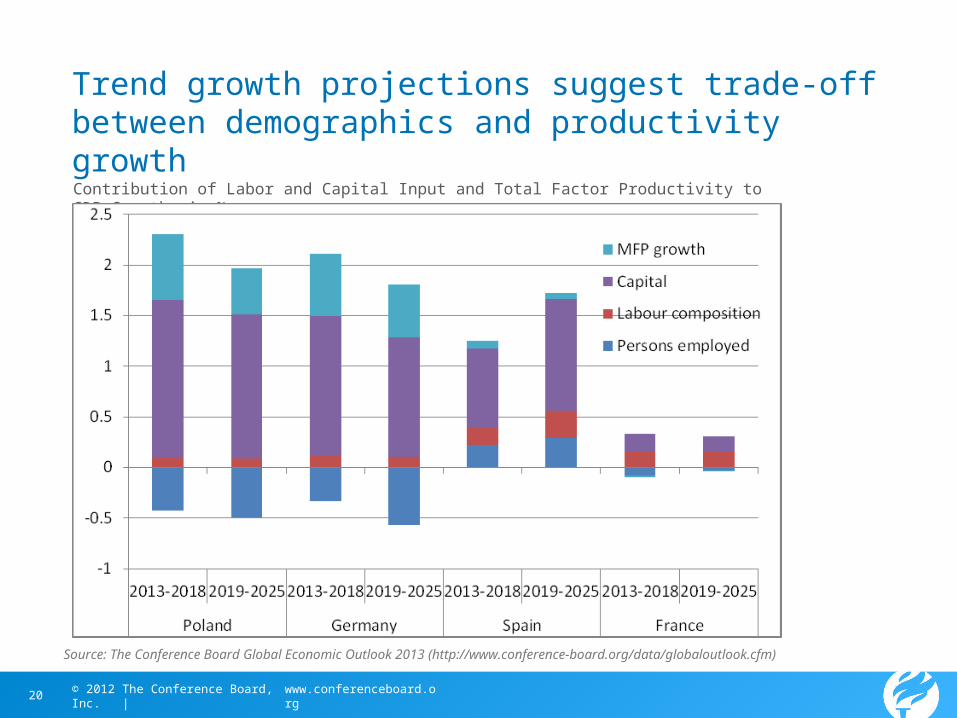
Trend growth projections suggest trade-off between demographics and productivity growth
Source: The Conference Board Global Economic Outlook 2013 (http://www.conference-board.org/data/globaloutlook.cfm)
Contribution of Labor and Capital Input and Total Factor Productivity to GDP Growth, in %
www.conferenceboard.org© 2012 The Conference Board, Inc. |21
A new grouping of European economies emerging?
Germany and Central & Eastern Europe (incl. Austria) have created a strong value chain amongst themselves, and tied into Global Value Chain
Club Med (France, Italy, Spain, Portugal, Greece) remain more dependent on slower growing domestic economies
Nordic and Benelux countries as well as UK and Ireland have highly competitive export sectors, and larger and more flexible services sectors
www.conferenceboard.org© 2012 The Conference Board, Inc. |22
Implications of productivity developments for recovery growth agenda
Only jobs is not enough to sustain growth – the focus needs to be on productive jobs
Productivity gains in recovery need to be exploited to reallocate resources to more productive uses
Manufacturing production for foreign sector is most beneficial when integrated in global supply chain
Services sector (domestic and foreign) creates biggest scope for productivity gains.
Opportunity for structural reforms in key markets should not go wasted – single market, especially in services, is key element
Investment in intangibles is key investment strategy in knowledge-based economy, especially to strengthen services economy