Embed Size (px)
Citation preview

www.comascience.org
Impaired top-down processes in the vegetative state revealed by SPM analysis of EEG data
Mélanie Boly, MD, PhD
Wellcome Trust Centre for Neuroimaging,Functional Imaging Laboratory, University College London
Coma Science GroupCyclotron Research Centre & Neurology DepartmentCHU Sart Tilman, Liège, Belgium

Consciousness
Coma
General Anesthesia
Locked-in syndrome
Minimally Conscious State
Vegetative state
Conscious Wakefulness
Drowsiness
Light sleep
Deep Sleep
REM Sleep
Altered states of consciousness
Laureys & Boly, Current Opinion in Neurology 2007Laureys & Boly, Nature Clinical Practice 2008
SomnambulismEpilepsy
40 % misdiagnosis!
Schnakers et al., BMC Neurology 2009
introduction | scalp level analysis| DCM | conclusion

Consciousness
Coma
General Anesthesia
Locked-in syndrome
Minimally Conscious State
Vegetative state
Conscious Wakefulness
Drowsiness
Light sleep
Deep Sleep
REM Sleep
Diagnosing consciousness: the challenge
Boly, Massimini & Tononi, Progress in Brain Research 2009 Boly, Current Opinion in Neurology, in press
SomnambulismEpilepsy
Neural correlates of consciousness (NCC)
Functional neuroimaging
introduction | scalp level analysis| DCM | conclusion

Auditory NCC
Boly et al., Archives of Neurology 2004
Dehaene et al., TICS 2006
subliminal
conscious
preconscious
Diatz et al., JCognNsci 2007
Di et al., Neurology 2007
VS MCS
?

NCC in healthy volunteers
Del Cul et al., PLOS Biol 2007
Garrido et al., PNAS 2007
Garrido et al., Neuroimage 2008
Best correlate of conscious perception = long latency ERP componentsSuggested involvement of backward connections in their generation
introduction | scalp level analysis| DCM | conclusion

MMN design – roving paradigm
Garrido et al., Neuroimage 2008, 2009
introduction | scalp level analysis| DCM | conclusion

www.comascience.org
Scalp level analysis
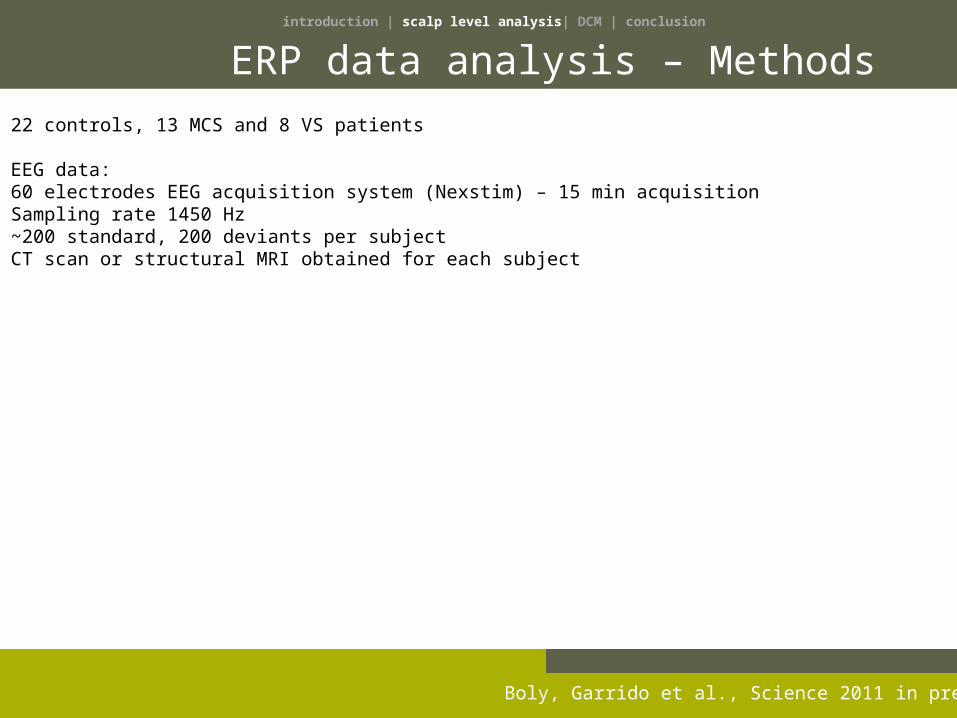
ERP data analysis – Methods22 controls, 13 MCS and 8 VS patients
EEG data:60 electrodes EEG acquisition system (Nexstim) – 15 min acquisitionSampling rate 1450 Hz~200 standard, 200 deviants per subjectCT scan or structural MRI obtained for each subject
introduction | scalp level analysis| DCM | conclusion
Boly, Garrido et al., Science 2011 in press

ERP data analysis – Methods22 controls, 13 MCS and 8 VS patients
EEG data:60 electrodes EEG acquisition system (Nexstim) – 15 min acquisitionSampling rate 1450 Hz~200 standard, 200 deviants per subjectCT scan or structural MRI obtained for each subject
SPM data analysis:
High pass filtering 0.5 HzLow pass filtering 20 Hz (to decrease EMG-related noise in the signal)Downsampling at 200 HzCorrection for ocular artifacts (Berg method from SPM) on continuous signalEpoching -100 to 400 msAveraging data at the single subject level – standard & deviant (11th repetition) conditionsConvert to images in SPM
Random effects analysis – 3 groups x 2 conditionsPatient’s prognosis entered as a covariate of no interestF test for differential response to standard versus deviants in each groupF test for an effect of consciousness level on the amplitude of this responseThreshold FWE corrected p<0.05 at the voxel level
introduction | scalp level analysis| DCM | conclusion
Boly, Garrido et al., Science 2011 in press

MMN results – scalp levelRESPONSE TO DEVIANTS
Controls
introduction | scalp level analysis| DCM | conclusion

MMN results – scalp levelRESPONSE TO DEVIANTS
Controls MCS
introduction | scalp level analysis| DCM | conclusion

MMN results – scalp levelRESPONSE TO DEVIANTS
Controls MCS VS
introduction | scalp level analysis| DCM | conclusion

MMN results – scalp levelRESPONSE TO DEVIANTS
Controls MCS VS
introduction | scalp level analysis| DCM | conclusion

MMN results – scalp levelRESPONSE TO DEVIANTS
Controls MCS VS
introduction | scalp level analysis| DCM | conclusion

MMN results – scalp levelintroduction | scalp level analysis| DCM | conclusion
Boly, Garrido et al., Science 2011 in press

MMN results – scalp levelintroduction | scalp level analysis| DCM | conclusion
Boly, Garrido et al., Science 2011 in press

MMN results – scalp level
RESPONSE TO DEVIANTS
Correlation between the level of consciousness and:
- Global amplitude of the ERP response- Predominant late components in latency of ERP- Involvement of frontal topography at the scalp level
introduction | scalp level analysis| DCM | conclusion

www.comascience.org
Connectivity analysisusing DCM

DCM for EEG - principles
Which brain network creates this ERP?
And how?
Explain a given M/EEG signal at the neuronal level
introduction | scalp level analysis| DCM | conclusion

MMN design – roving paradigm
Garrido et al., Neuroimage 2008, 2009
introduction | scalp level analysis| DCM | conclusion

DCM for EEG - principles
Electromagnetic forward model for M/EEG
Depolarisation of
pyramidal cells
Forward model:lead field & gain
matrixScalp data
),,(0 uxfx LK 0),( LKxxgy
Forward model
introduction | scalp level analysis| DCM | conclusion

www.comascience.org

Spatial Forward Model
),( 00 xgxLy L
Default: Each area that is part of the model is modeled by one equivalent current dipole (ECD).
Depolarisation ofpyramidal cells
Sensor data
),,( uxfx LL
Spatial model

Neural mass model of a cortical macrocolumn =
ExcitatoryInterneurons
PyramidalCells
InhibitoryInterneurons
Extrinsic inputs
Excitatory connection
Inhibitory connection
MEG/EEGsignal
MEG/EEGsignal
mean firing rate
mean
postsynaptic potential
(PSP)
mean PSP
mean firing rate
Function P
Function S
CONNECTIVITY ORGANISATION POPULATION DYNAMICS

Excitatory IN
Inhibitory IN
Pyramidal cells
IntrinsicForward
BackwardLateral
Input u
1
32
Extrinsic
David et al., 2005David and Friston, 2003
Between-area connectivity
1 2

Model Inversion: fit the data
DataData
We need to estimate the extrinsic connectivity parameters and their
modulation from data.
We need to estimate the extrinsic connectivity parameters and their
modulation from data.input
0 50 100 150 200 250-8
-6
-4
-2
0
2
4
6
time (ms)
Observed (adjusted) 1
0 50 100 150 200 250-8
-6
-4
-2
0
2
4
6
time (ms)
Predicted
Predicted dataPredicted data
DCM for EEG – principlesintroduction | scalp level analysis| DCM | conclusion

DCM for EEG - principles
Balance betweenmodel fit &
model complexity
introduction | scalp level analysis| DCM | conclusion

Alternative Models for Comparison

DCM for EEG – group analysis
-35 -30 -25 -20 -15 -10 -5 0 5
Su
bje
cts
Log model evidence differences
MOG
LG LG
RVFstim.
LVFstim.
FGFG
LD|RVF
LD|LVF
LD LD
MOGMOG
LG LG
RVFstim.
LVFstim.
FGFG
LD
LD
LD|RVF LD|LVF
MOG
m2 m1
Stephan et al. 2009
Group level random effects BMS resistant to outliers
introduction | scalp level analysis| DCM | conclusion

Bayesian model comparisonintroduction | scalp level analysis| DCM | conclusion
Boly, Garrido et al., 2011

Bayesian model comparisonintroduction | scalp level analysis| DCM | conclusion
Boly, Garrido et al., 2011

Bayesian model comparisonintroduction | scalp level analysis| DCM | conclusion
Boly, Garrido et al., 2011

Bayesian model comparisonintroduction | scalp level analysis| DCM | conclusion
Boly, Garrido et al., 2011

Bayesian model comparisonintroduction | scalp level analysis| DCM | conclusion
Boly, Garrido et al., 2011

DCM – quantitative connectivity analysis
introduction | scalp level analysis| DCM | conclusion
Boly, Garrido et al., 2011

DCM – quantitative connectivity analysis
Impairment of BACKWARD connection from frontal to temporal corticesis the only significant difference between VS and controls
* (p = 0.012)
* (p = 0.006)ns
Ctrls VSMCS
introduction | scalp level analysis| DCM | conclusion
Boly, Garrido et al., 2011

DCM – quantitative connectivity analysis
Impairment of BACKWARD connection from frontal to temporal corticesis the only significant difference between VS and controls
introduction | scalp level analysis| DCM | conclusion
12
3
12
3
CONTROLS/MCS VS

DCM – quantitative connectivity analysis
Impairment of BACKWARD connection from frontal to temporal corticesis the only significant difference between VS and controls
Del Cul et al., PLOS Biol 2007
introduction | scalp level analysis| DCM | conclusion
12
3
VS

www.comascience.org
Conclusions

Conclusion
introduction | scalp level analysis| DCM | conclusion
Boly, Garrido et al., Science 2011 in press
SCALP LEVEL:Correlation between response amplitude (latency >100 ms, involving frontal component) with the level of consciousness

Conclusion
introduction | scalp level analysis| DCM | conclusion
Boly, Garrido et al., Science 2011 in press
SCALP LEVEL:Correlation between response amplitude (latency >100 ms, involving frontal component) with the level of consciousness
DCM ANALYSIS:- Selective impairment in backward connectivity from frontal to temporal cortices in VS- MCS patients show a pattern similar to controls
Fits very well with NCC in healthy volunteers (though only indirect evidence there for backward processes being important beforehand)First direct demonstration of a link between preserved top-down processes and the level of consciousness in these patientsFuture studies on a larger patient population to assess diagnostic utility and prognostic value

Conclusion
introduction | scalp level analysis| DCM | conclusion
SCALP LEVEL:Correlation between response amplitude (latency >100 ms, involving frontal component) with the level of consciousness
DCM ANALYSIS:- Selective impairment in backward connectivity from frontal to temporal cortices in VS- MCS patients show a pattern similar to controls
Fits very well with NCC in healthy volunteers (though only indirect evidence there for backward processes being important beforehand)First direct demonstration of a link between preserved top-down processes and the level of consciousness in these patientsFuture studies on a larger patient population to assess diagnostic utility and prognostic value
Boly, Current Opinion in Neurology, in pressBuckner et al., J Neurosci 2009, Hagmann et al., PLOS Biology 2008
Impairment in unconsciousness
functional structural
Hierarchy ofbrain connectivity
?

www.comascience.org
We thank the participating patients and their families
University of LiègeSteven Laureys Olivia GosseriesCaroline SchnakersMarie-Aurélie BrunoPierre BoverouxAudrey VanhaudenhuyseDidier LedouxJean-Flory TshibandaQuentin NoirhommeRemy LehembreAndrea SodduAthena DemertziRémy LehembreChristophe PhillipsPierre Maquet
Stanford University Michael Greicius
University of Cambridge, UKAdrian OwenMartin ColemanJohn PickardMartin Monti
University of MilanMarcello MassiminiMario RosanovaAdenauer Casali Silvia Casarotto
University of Wisconsin - MadisonGiulio TononiBrady RiednerEric LandsnessMichael MurphyFabio Ferrarelli
Marie-Curie University, ParisLouis PuybassetHabib BenaliGiullaume MarrelecVincent PerlbargMelanie Pellegrini
Cornell University, NYNicholas Schiff
JFK Rehabilitation Center, NJJoseph Giacino
University College London, UKKarl FristonMarta GarridoVladimir LitvakRosalyn Moran

www.comascience.org
Any questions?..