Embed Size (px)
Citation preview
www.bea.gov
The Importance of, and Challenges to, Incorporating
Distributional Information Into Macroeconomic DataJ. Steven Landefeld, Director
NABE Statistics Committee MeetingNovember 8, 2012
www.bea.gov
Why It’s Important
▪ Existing national accounts and other macro-economic data fail to present a consistent picture of the differential impact of economic growth and change across households, regions, and industries.
Such data are important for understanding the economy and the political economy.
Such data are, in turn, important in informing economic policy, business planning, and social policy.
The causes of, and response to, the “Great Recession” and the recent election are just two examples of the importance of such data.
2
www.bea.gov
Why It’s Important
▪ In a time of scarce statistical resources and increasing demand for data, we need to more effectively integrate household survey and tax and other administrative data into our national accounts.
BEA/Census/SOI Data - Reconciliation of aggregates and distribution of income
BEA/BLS/SOI Data – Reconciliation of aggregates and distribution of consumer spending
Future work FRB/BEA Data – Distribution of household assets and
liabilities3
www.bea.gov
Distributional Information Needed for Effective Economic Policy
Analysis▪ Potential impact of changes in the distribution of income
on the economy: According to research by Dynan, Skinner, and Zeldes, MPS of the
top 1% is about 50%, rest is about 10% (including capital gains). According to CEA, increase in top 1% share might have lowered PCE by
5%. Expansion of credit and changes in underwriting standards and the
recipients of that credit may have played a role in the housing bubble.
Housing losses and restrictions on credit may have disproportionally affected lower income groups’ spending during the contraction and expansion.
▪ In an attempt to get at what “most” households are experiencing, several investment banks developed measures of discretionary spending.
▪ ACCRA has developed a rough regional price to better assess the health of the economy across MSAs.
4

www.bea.gov 5
Are You Better Off?
CP
S-A
SE
CH
ou
seh
old
In
com
e
Dis
po
sab
le h
ou
seh
old
In
co
me
1999-2009-6.0
-4.0
-2.0
0.0
2.0
4.0
6.0
8.0
10.0
12.0
9.6
-5.0
Real personal income per capita Real median household income (Census Bureau)
Chan
ge (%
)
Source: BEA, Census Bureau
www.bea.gov 6
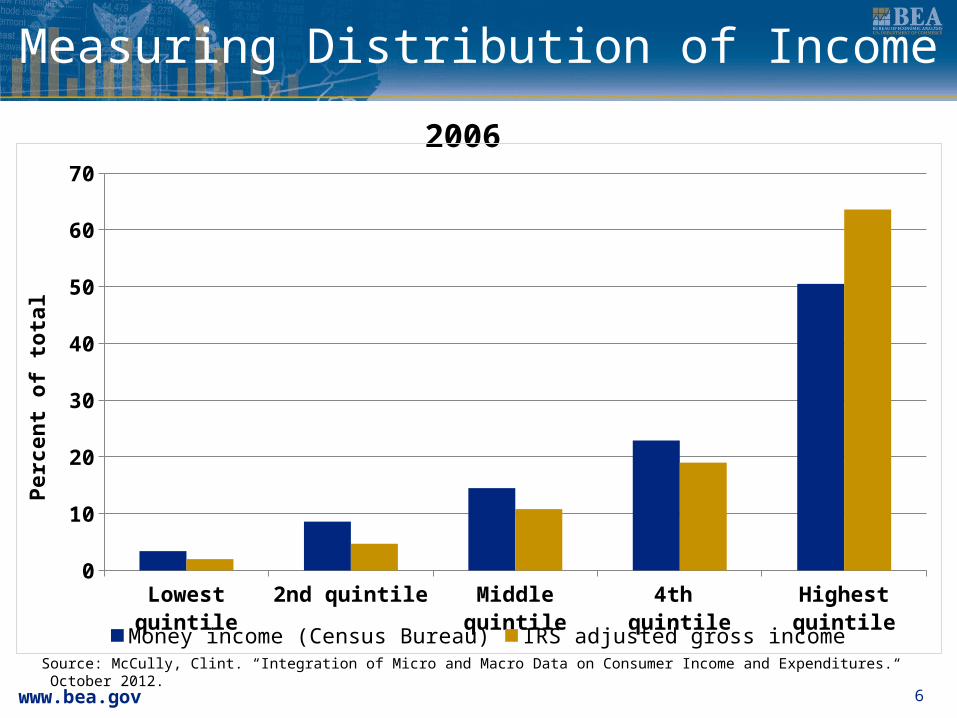
Measuring Distribution of Income
CP
S-A
SE
CH
ou
seh
old
In
com
e
Dis
po
sab
le h
ou
seh
old
In
co
me
2006
Lowest quintile 2nd quintile Middle quintile 4th quintile Highest quintile0
10
20
30
40
50
60
70
Money income (Census Bureau) IRS adjusted gross income
Perc
ent o
f tot
al
Source: McCully, Clint. “Integration of Micro and Macro Data on Consumer Income and Expenditures.“ October 2012.

www.bea.gov 7
Measuring Distribution of Income
CP
S-A
SE
CH
ou
seh
old
In
com
e
Dis
po
sab
le h
ou
seh
old
In
co
me
Lowest quintile 2nd quintile Middle quintile 4th quintile Highest quintile0
10
20
30
40
50
60
70
Money income (Census Bureau) IRS adjusted gross income
Perc
ent o
f tot
al
2009
Source: McCully (2012)
www.bea.gov 8
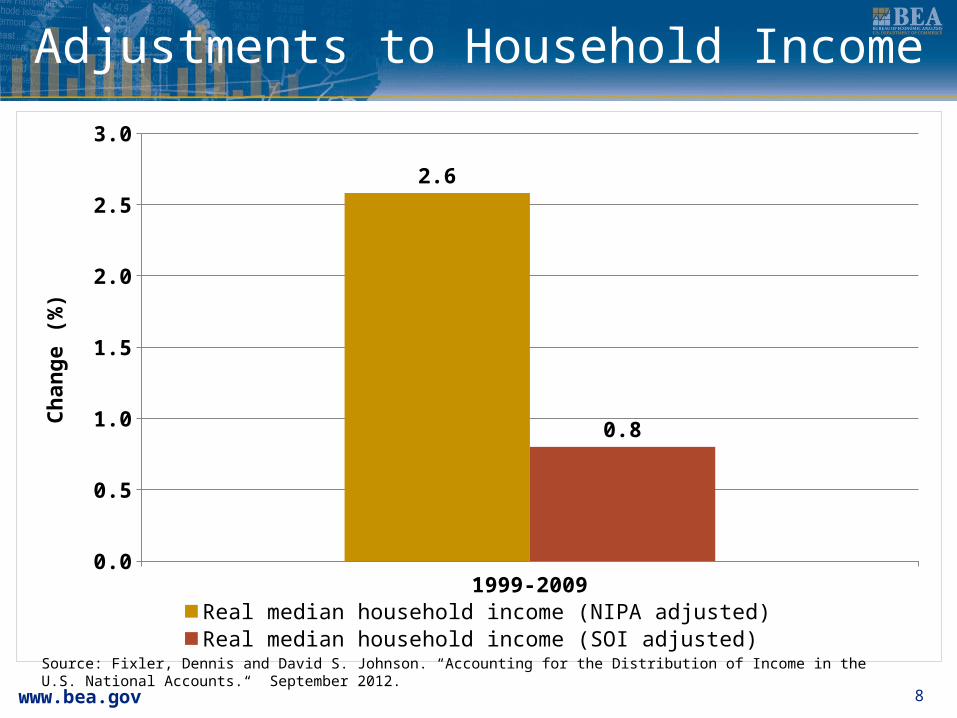
Adjustments to Household Income
CP
S-A
SE
CH
ou
seh
old
In
com
e
Dis
po
sab
le h
ou
seh
old
In
co
me
1999-20090.0
0.5
1.0
1.5
2.0
2.5
3.0
2.6
0.8
Real median household income (NIPA adjusted) Real median household income (SOI adjusted)
Chan
ge (%
)
Source: Fixler, Dennis and David S. Johnson. “Accounting for the Distribution of Income in the U.S. National Accounts.“ September 2012.
www.bea.gov
0
0.2
0.4
0.6
0.8
1
9
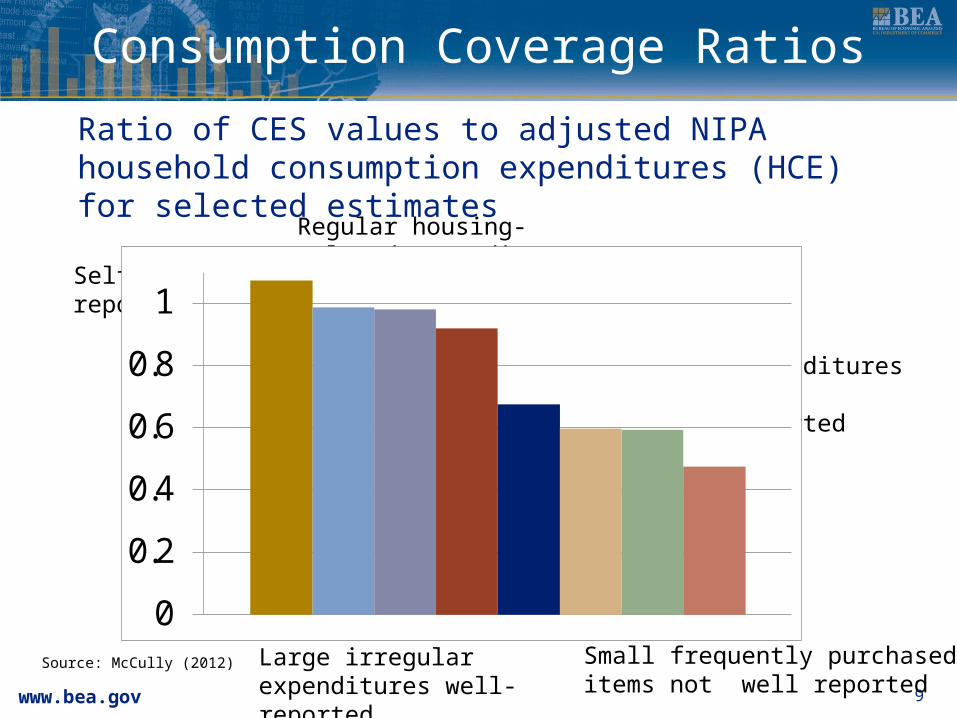
Consumption Coverage Ratios
Ratio of CES values to adjusted NIPA household consumption expenditures (HCE) for selected estimates
Ow
ner-
occu
pie
d
ren
t
Hou
seh
old
fu
els
Pu
rch
ase
s of
veh
icle
s
Ten
an
t-occu
pie
d
ren
tFood
at
hom
eC
loth
ing
&
footw
ear
Rest
au
ran
ts/
hote
ls
Alc
oh
ol/
hom
e
Self-reported
Regular housing-related expenditures well reported
Large irregular expenditures well-reported
“Sin” expenditures not well-reported
Small frequently purchased items not well reported
Source: McCully (2012)
www.bea.gov
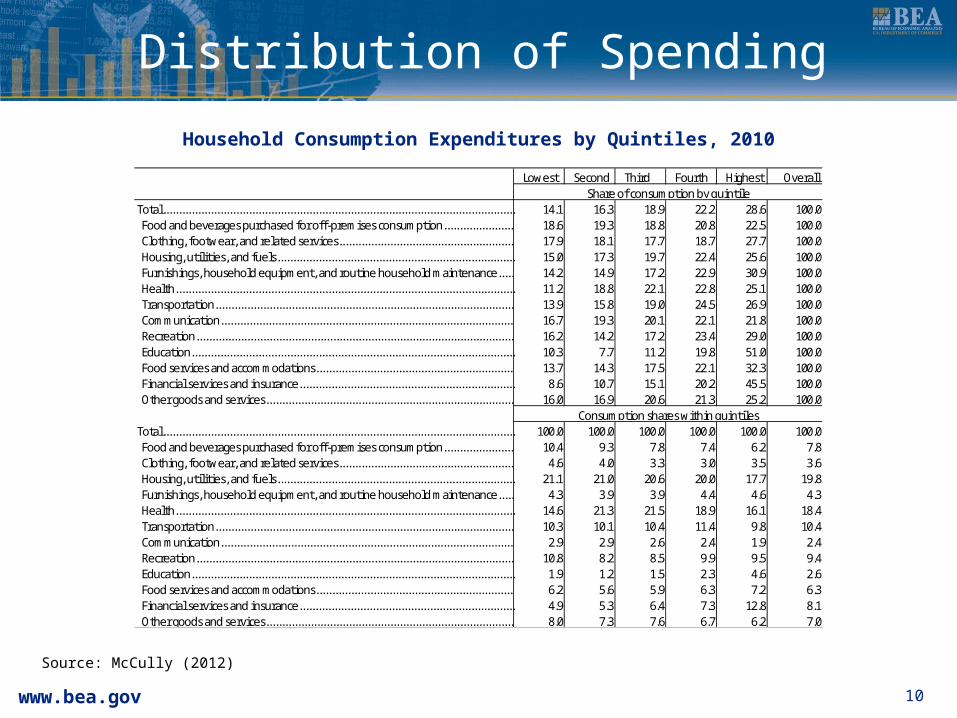
Distribution of Spending
10
Household Consumption Expenditures by Quintiles, 2010
Lowest Second Third Fourth Highest Overall
Total............................................................................................................... 14.1 16.3 18.9 22.2 28.6 100.0 Food and beverages purchased for off-premises consumption...................... 18.6 19.3 18.8 20.8 22.5 100.0 Clothing, footwear, and related services....................................................... 17.9 18.1 17.7 18.7 27.7 100.0 Housing, utilities, and fuels........................................................................... 15.0 17.3 19.7 22.4 25.6 100.0 Furnishings, household equipment, and routine household maintenance..... 14.2 14.9 17.2 22.9 30.9 100.0 Health........................................................................................................... 11.2 18.8 22.1 22.8 25.1 100.0 Transportation.............................................................................................. 13.9 15.8 19.0 24.5 26.9 100.0 Communication............................................................................................ 16.7 19.3 20.1 22.1 21.8 100.0 Recreation.................................................................................................... 16.2 14.2 17.2 23.4 29.0 100.0 Education...................................................................................................... 10.3 7.7 11.2 19.8 51.0 100.0 Food services and accommodations.............................................................. 13.7 14.3 17.5 22.1 32.3 100.0 Financial services and insurance.................................................................... 8.6 10.7 15.1 20.2 45.5 100.0 Other goods and services.............................................................................. 16.0 16.9 20.6 21.3 25.2 100.0
Total............................................................................................................... 100.0 100.0 100.0 100.0 100.0 100.0 Food and beverages purchased for off-premises consumption...................... 10.4 9.3 7.8 7.4 6.2 7.8 Clothing, footwear, and related services....................................................... 4.6 4.0 3.3 3.0 3.5 3.6 Housing, utilities, and fuels........................................................................... 21.1 21.0 20.6 20.0 17.7 19.8 Furnishings, household equipment, and routine household maintenance..... 4.3 3.9 3.9 4.4 4.6 4.3 Health........................................................................................................... 14.6 21.3 21.5 18.9 16.1 18.4 Transportation.............................................................................................. 10.3 10.1 10.4 11.4 9.8 10.4 Communication............................................................................................ 2.9 2.9 2.6 2.4 1.9 2.4 Recreation.................................................................................................... 10.8 8.2 8.5 9.9 9.5 9.4 Education...................................................................................................... 1.9 1.2 1.5 2.3 4.6 2.6 Food services and accommodations.............................................................. 6.2 5.6 5.9 6.3 7.2 6.3 Financial services and insurance.................................................................... 4.9 5.3 6.4 7.3 12.8 8.1 Other goods and services.............................................................................. 8.0 7.3 7.6 6.7 6.2 7.0
Share of consumption by quintile
Consumption shares within quintiles
Source: McCully (2012)
www.bea.gov
Relevant BEA Projects
Research on the reconciliation and incorporation of income distribution data as supplemental annual data on personal income
Research on the reconciliation and incorporation of consumer spending distribution data as supplemental annual data on personal outlays and spending
Quarterly data on the distribution of GDP by industry
Prototype annual real personal income by state
Longer-term: Integrated distributional information on the distribution of
production, spending, and wealth
11