Embed Size (px)
Citation preview

www.bea.gov
Summary Estimates for Multinational Companies
Released 4/19/10
J. Steve Landefeld, DirectorApril 22, 2010

2www.bea.gov
Summary Table - U.S. Multinational Companies
2007 2008 Change
Employment (millions)
U.S. Parents 23.2 22.9 -1.3%
Foreign affiliates
10.3 10.5 1.7%
Capital expenditures ($ billions)
U.S. Parents 507.7 519.7 2.3%
Foreign affiliates
172.7 188.5 9.1%
Sales ($ billions)
U.S. Parents 9,215.5 9,509.0 3.2%
Foreign affiliates
4,978.3 5,520.2 10.9%Source: BEA

3www.bea.gov
Employment Growth Fastest Abroad
0
5
10
15
20
25
30
35
40
1989 1994 1999 2004 2007 2008
Million
s of
em
plo
yees
U.S. MNCsU.S. ParentsForeign affiliates
Source: BEA
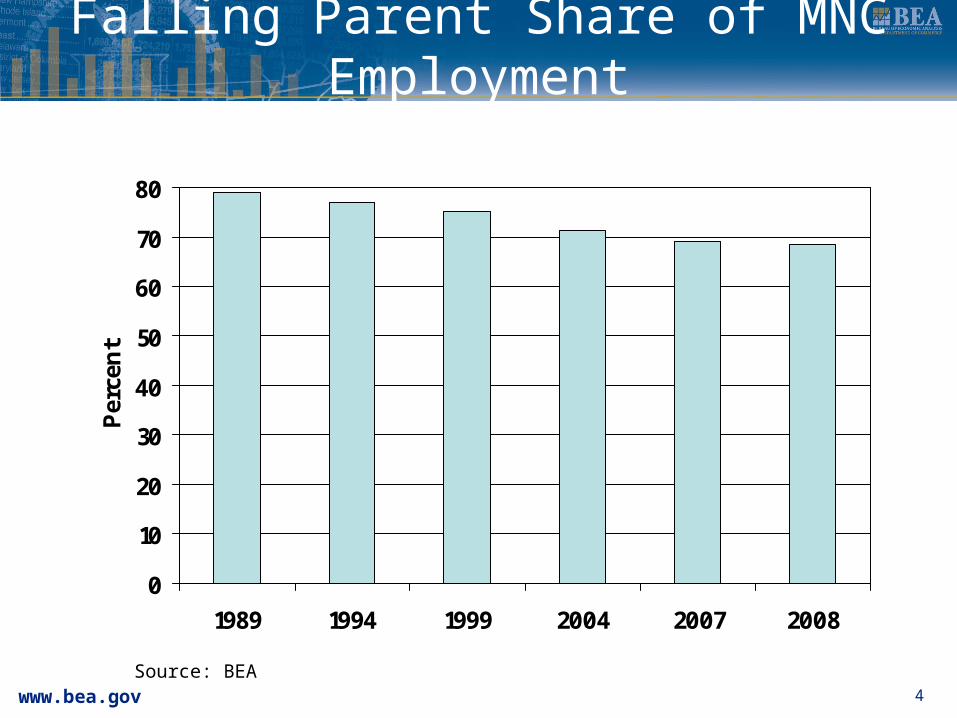
4www.bea.gov
Falling Parent Share of MNC Employment
Source: BEA
0
10
20
30
40
50
60
70
80
1989 1994 1999 2004 2007 2008
Per
cent

5www.bea.gov
Possible Explanations
▪Resource-seeking Lower-wage labor More abundant natural resources
▪Market-seeking Liberalization in host government
policies toward direct investment Faster rates of economic growth
abroad
A shift in the location of production that is:

6www.bea.gov
Affiliates Sell Abroad What They Produce Abroad
0
10
20
30
40
50
60
70
80
1966 1977 1982 1989 1994 1999 2004 2007
Per
cent of
tot
al s
ales
United States
Local
Other ForeignCountries
Source: BEA
Destination of Sales by Foreign Affiliates

7www.bea.gov
Markets Growing Faster Abroad
0
5
10
15
20
25
30
35
40
45
1960 1965 1970 1975 1980 1985 1990 1995 2000 2005 2008
Per
cent
trendline
Sources: World Bank and BEA
U.S. Share of World GDP

8www.bea.gov
Local Markets Important Where Employment is Growing
Country of affiliate Employment increase in 1989-2007
% of sales to local market
All countries +4.9 million
59%
China +676,000 72%
Mexico +613,000 68%
United Kingdom +443,000 67%
France +283,000 67%
India +266,000 77%
Canada +196,000 75%Source: BEA

9www.bea.gov
Summary Table - U.S. Affiliates of Foreign Multinational Companies
2007 2008 Change
Employment (millions) 5.6 5.5 -1.0%
Capital expenditures ($ billions) 190.2 190.7 0.3%
Sales ($ billions)
3,353.1 3,406.5 1.6%
Source: BEA

10www.bea.gov
Little Recent Growth for U.S. Affiliates
0
1
2
3
4
5
6
1997 2002 2007 2008
Employment (millions) Share of private U.S. employment (percent)
Source: BEA
Employment by U.S. Affiliates of Foreign MNCs

11www.bea.gov
Most Growth Occurred in Late 1990’s
0
50
100
150
200
250
300
350
400
1997 1998 1999 2000 2001 2002 2003 2004 2005 2006 2007 2008
Billion
s of
(20
05) dol
lars
* Equals nominal outlays deflated by the U.S. GDP deflator; source: BEA.
Real Outlays* for New U.S. Affiliates

12www.bea.gov
But Output of U.S. Affiliates Continues to Rise
0
20
40
60
80
100
120
1997 2002 2007
Thou
sands
of (20
05) dol
lars
0
1
2
3
4
5
6
Per
cent
Real value added per employee Share of U.S. private GDP

13www.bea.gov
EU-Owned Companies Account for Most of Growth
Country of UBO Employment increase in 1997-2007
Share of increase
All countries +814,000 100%
France +148,000 18%
Sweden +81,000 10%
Italy +69,000 8%
Germany +66,000 8%
Switzerland +65,000 8%
United Kingdom +44,000 5%
UBO: Ultimate beneficial owner; Source: BEA