Embed Size (px)
Citation preview

www.bea.gov
Revisions to BEA’s Estimates of GDP and GDI
Dennis FixlerBEA Advisory Committee Meeting
November 4th, 2011
www.bea.gov
Assessing accuracy
▪ BEA judges the accuracy of its early estimates by whether they present the same picture of the economy as its latest estimates in terms of:1. Long-term growth rates.2. Trends in saving, investment, government spending
, corporate profits, and other key components of GDP and GDI.
3. Broad features of business cycles, including the timing and depth of recessions, the strength of recoveries, and the major components contributing to growth and contractions.
4. Patterns of quarterly growth, including whether it is high or low relative to trend, acceleration or deceleration, and whether it is positive or negative.
2
www.bea.gov
Long-run patterns
▪ Revisions to GDP growth average less than 0.1 percentage points over the comprehensive revisions in the period 1985-2009.
▪ Revisions to the contributions of key components of GDP growth are relatively small and do not substantially change the ordinal rankings of the contributions.
▪ The overall pattern of change in GDP over business cycles is little changed by revisions.
3
www.bea.gov
Long-run patterns (continued)
▪For the period 1983-2009, real GDP successfully indicated:
1.The direction of change in real GDP 97 percent of the time.2.The acceleration of growth about 72 percent of the time.3.Whether growth was above, near, or below trend four-fifths
of the time.4.The cyclical peaks before 5 of the 6 recessions in 1969-
2006.5.The cyclical troughs of 4 of the recessions.
▪ Source: Fixler, Greenaway-McGrevy and Grimm, “Revisions to GDP, GDI, and Their Major Components, July 2011 Survey of Current Business
4

www.bea.gov
Long-run patterns (continued)
5
www.bea.gov
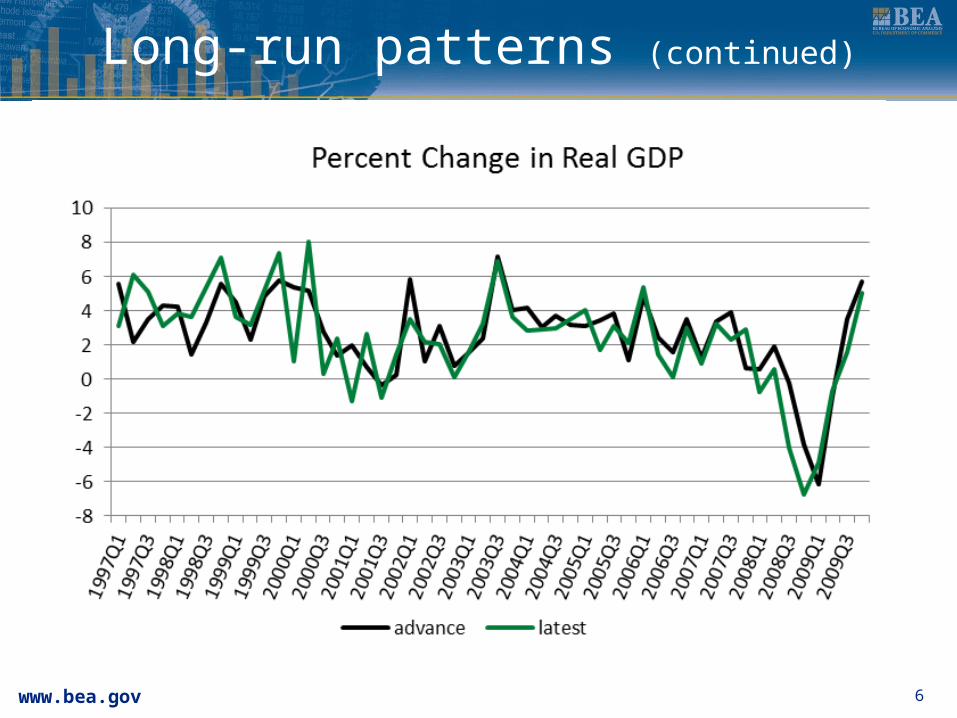
Long-run patterns (continued)
6
www.bea.gov
Long-run patterns (c0ntinued)
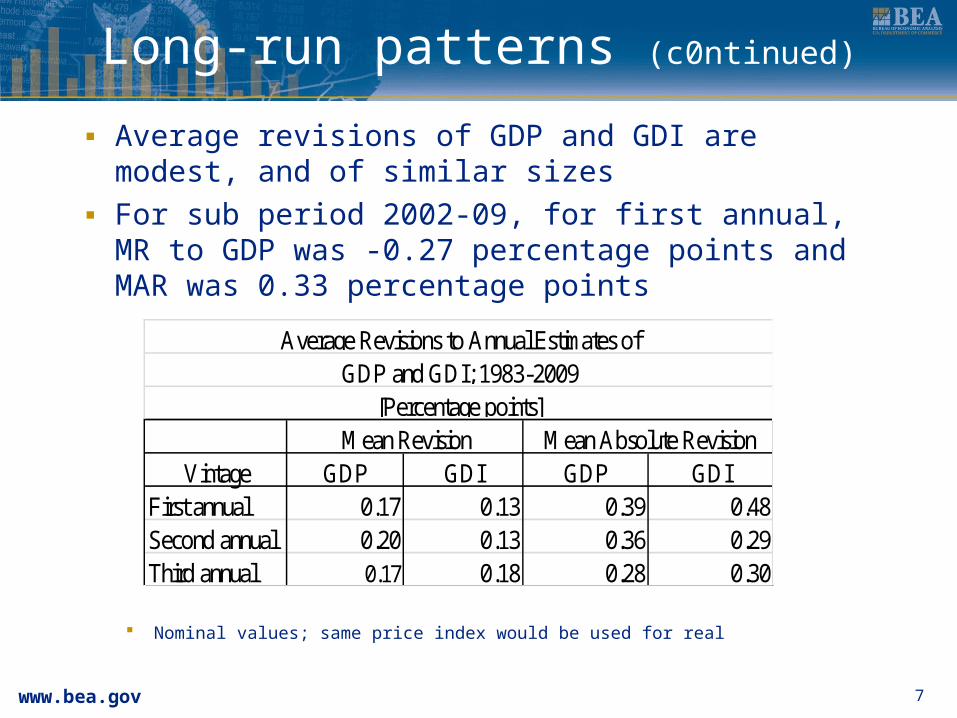
▪ Average revisions of GDP and GDI are modest, and of similar sizes
▪ For sub period 2002-09, for first annual, MR to GDP was -0.27 percentage points and MAR was 0.33 percentage points
Nominal values; same price index would be used for real
7
Vintage GDP GDI GDP GDIFirst annual 0.17 0.13 0.39 0.48Second annual 0.20 0.13 0.36 0.29Third annual 0.17 0.18 0.28 0.30
Mean Revision Mean Absolute Revision[Percentage points]
GDP and GDI; 1983-2009Average Revisions to Annual Estimates of

www.bea.gov
Long-run patterns (c0ntinued)
8
-10
-5
0
5
10
15
1997
Q1
1997
Q3
1998
Q1
1998
Q3
1999
Q1
1999
Q3
2000
Q1
2000
Q3
2001
Q1
2001
Q3
2002
Q1
2002
Q3
2003
Q1
2003
Q3
2004
Q1
2004
Q3
2005
Q1
2005
Q3
2006
Q1
2006
Q3
2007
Q1
2007
Q3
2008
Q1
2008
Q3
2009
Q1
2009
Q3
Percent Change in Real GDP and GDI
GDP: Third GDP: Latest GDI: Third GDI:Latest

www.bea.gov
Long-run patterns (continued)
Revisions to Annual Estimates of GDP and Its Major Components in 1983 to 2009
[Percentage points]
Mean Revision Mean Absolute Revision
Current-dollar GDP Real GDP Current-dollar GDP Real GDP
Gross domestic product
First annual 0.17 0.27 0.39 0.53
Second annual 0.20 0.34 0.30 0.48
Third annual 0.17 0.35 0.28 0.39
Personal consumption expenditures
First annual 0.23 0.35 0.42 0.54
Second annual 0.21 0.36 0.40 0.36
Third annual 0.21 0.39 0.31 0.39
Gross private domestic investment
First annual -0.17 -0.38 1.84 1.74
Second annual 0.23 0.25 1.39 1.35
Third annual 0.15 0.24 1.09 1.13
Exports
First annual 0.47 0.35 0.68 1.04
Second annual 0.19 0.00 0.56 0.82
Third annual -0.10 -0.22 0.59 0.79
Imports
First annual 0.24 -0.10 0.41 0.73
Second annual 0.13 0.16 0.35 0.86
Third annual 0.03 -0.34 0.35 0.82
Government consumption expenditures
and gross investment
First annual 0.07 0.24 0.57 0.65
Second annual 0.11 0.22 0.59 0.66
Third annual 0.04 0.14 0.46 0.49
9
www.bea.gov
Long-run patterns (continued)
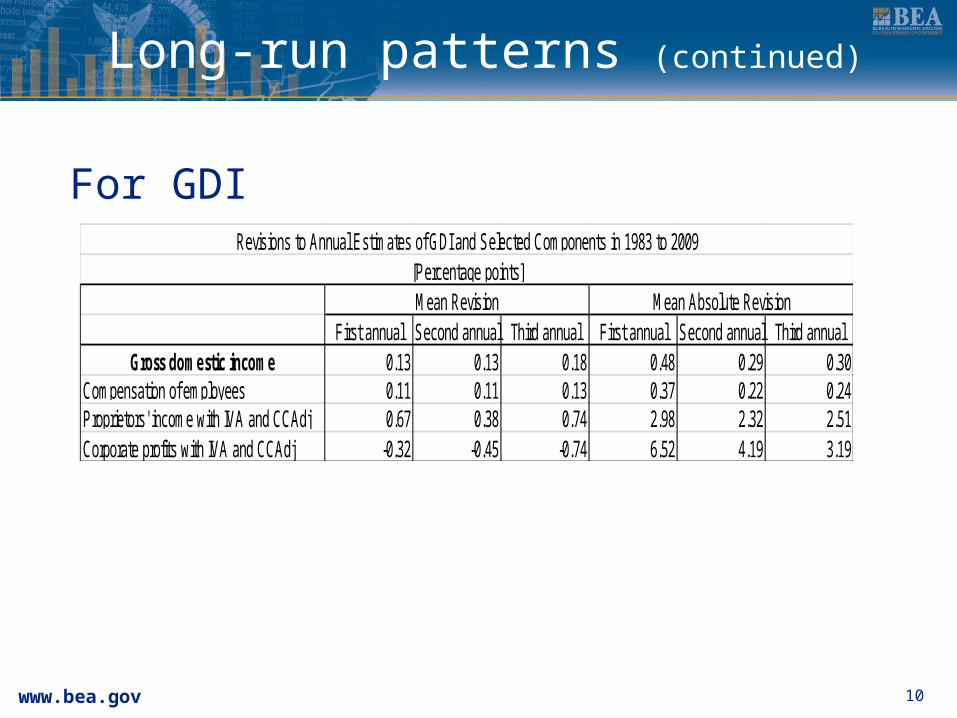
For GDI
10
First annual Second annual Third annual First annual Second annual Third annualGross domestic income 0.13 0.13 0.18 0.48 0.29 0.30
Compensation of employees 0.11 0.11 0.13 0.37 0.22 0.24Proprietors' income with IVA and CCAdj 0.67 0.38 0.74 2.98 2.32 2.51Corporate profits with IVA and CCAdj -0.32 -0.45 -0.74 6.52 4.19 3.19
Revisions to Annual Estimates of GDI and Selected Components in 1983 to 2009[Percentage points]Mean Revision Mean Absolute Revision
www.bea.gov
Short-term patterns
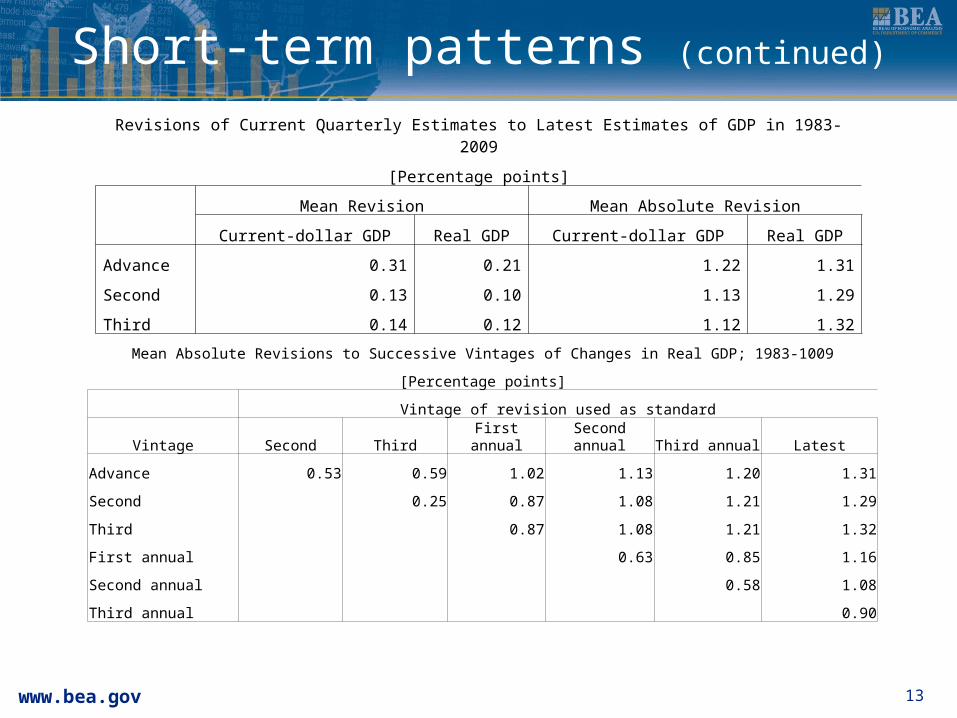
▪ Revisions to the three current quarterly vintages tend to be larger due to revisions to seasonal adjustments, the use of incomplete source data, and because rates are shown at annual rather than quarterly rates.
▪ Mean revisions are about 0.1 to 0.3 percentage points for all three vintages.
▪ Mean absolute revisions of current-dollar GDP are 1.1 to 1.2 percentage points, with a very slight reduction in the second and third estimates relative to the advance estimates.
▪ Mean absolute revisions of real GDP are about 1.3 percentage points, with no tendency to decline in the later vintages.
11

www.bea.gov
Short-term patterns (continued)
▪ The general lack of declines in later vintages has been the result of all of BEA’s previous revisions studies.
▪ In comparison, the MARs for the average forecasts of the Philadelphia Federal Reserve Bank’s Survey of Professional Forecasters , which are made early in the quarter, are 1.9 percentage points for current-dollar GDP, and 1.6 percentage points for real GDP.
12
www.bea.gov
Short-term patterns (continued)
Revisions of Current Quarterly Estimates to Latest Estimates of GDP in 1983-2009
[Percentage points]
Mean Revision Mean Absolute Revision
Current-dollar GDP Real GDP Current-dollar GDP Real GDP
Advance 0.31 0.21 1.22 1.31
Second 0.13 0.10 1.13 1.29
Third 0.14 0.12 1.12 1.32
13
Mean Absolute Revisions to Successive Vintages of Changes in Real GDP; 1983-1009
[Percentage points]
Vintage of revision used as standard
Vintage Second Third First annual Second annual Third annual Latest
Advance 0.53 0.59 1.02 1.13 1.20 1.31
Second 0.25 0.87 1.08 1.21 1.29
Third 0.87 1.08 1.21 1.32
First annual 0.63 0.85 1.16
Second annual 0.58 1.08
Third annual 0.90
www.bea.gov
Short-term patterns (continued)
▪ Revisions to seasonal adjustment factors can play a large role.
▪ Fixler and Grimm (December 2003 Survey of Current Business) examined the effects of revisions to seasonal adjustment factors on revisions to current-dollar GDP. 1. Revisions to seasonal factors accounted for 1.0
percentage point, slightly larger than the MAR for GDP of 0.7 percentage points.
2. Revisions to seasonal factors occur with the passage of time; even if there are no revisions to the underlying unadjusted data.
3. This suggests that the MAR for GDP cannot be zero.
14

www.bea.gov
Short-term patterns (continued)
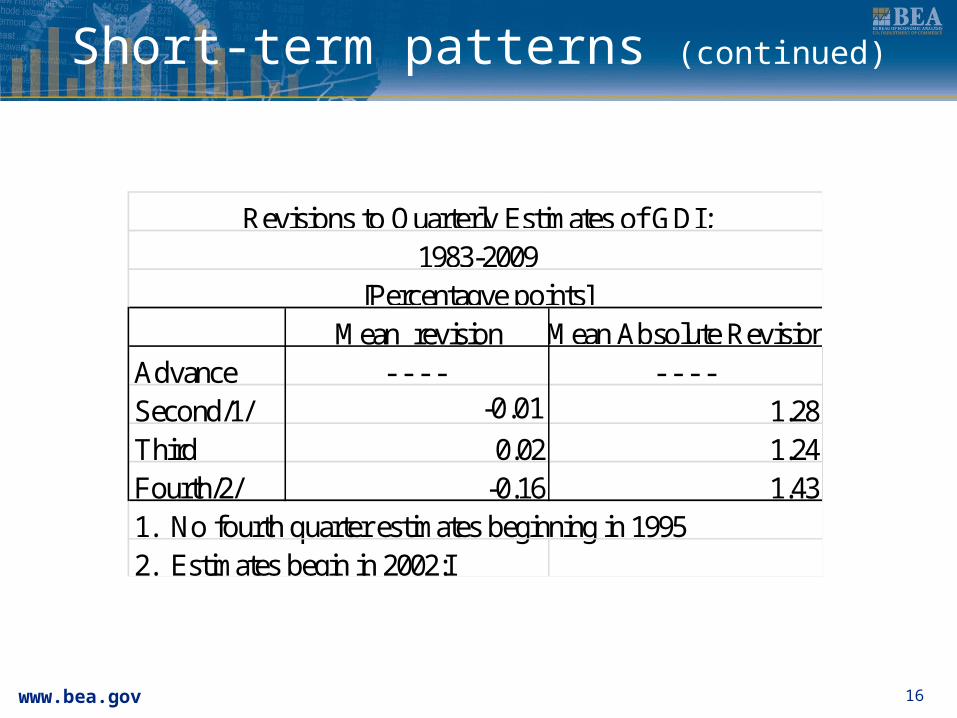
▪ For the averages for revisions to GDI:1. There are no advance estimates for GDI
because some components are not yet estimated.
2. There is a fourth current quarterly estimate, appearing 2 months after the third and incorporating information from the Quarterly Census of Employment and Wages.
3. The mean revisions are quite small, and two have small negative values.
4. The MARs range from 1.2 to 1.4 percentage points, again with no tendency to get smaller with later vintages.
15
www.bea.gov
Short-term patterns (continued)
16
Mean revision Mean Absolute RevisionAdvance - - - - - - - - Second/1/ -0.01 1.28Third 0.02 1.24Fourth/2/ -0.16 1.431. No fourth quarter estimates beginning in 19952. Estimates begin in 2002:I
Revisions to Quarterly Estimates of GDI;1983-2009
[Percentagve points]

www.bea.gov
The 2011 annual revision
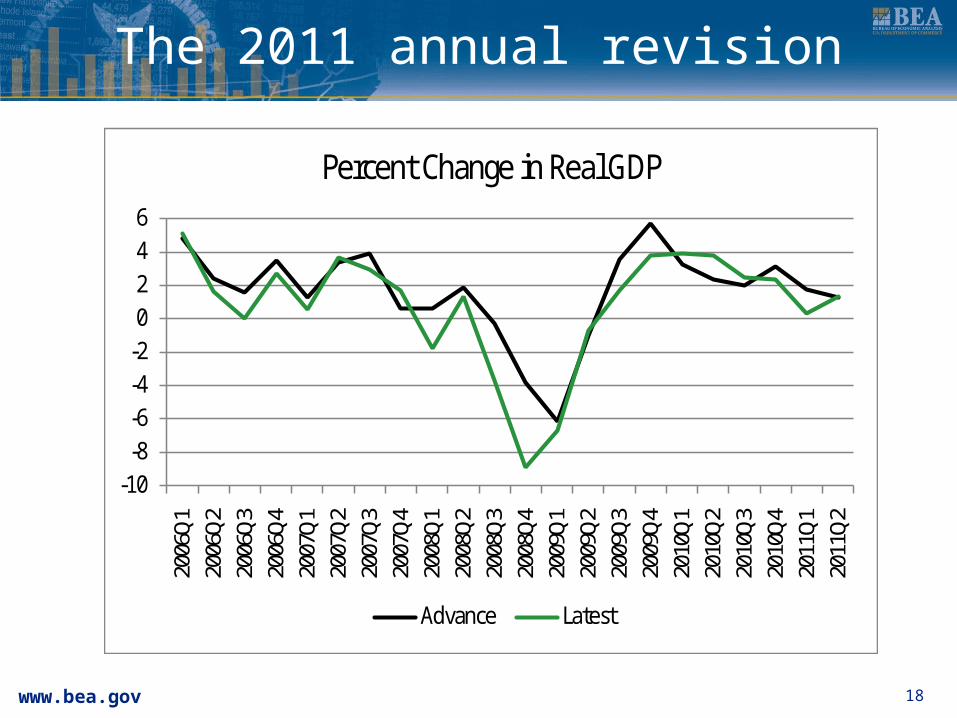
▪ The annual revision that was published in July had large downward revisions in the growth rates of real GDP in 2008, and especially in the fourth quarter.
17
-10-8-6-4-20246
2006
Q1
2006
Q2
2006
Q3
2006
Q4
2007
Q1
2007
Q2
2007
Q3
2007
Q4
2008
Q1
2008
Q2
2008
Q3
2008
Q4
2009
Q1
2009
Q2
2009
Q3
2009
Q4
2010
Q1
2010
Q2
2010
Q3
2010
Q4
2011
Q1
Percent Change In Real GDP
July 2011 August 2011
www.bea.gov
The 2011 annual revision
18
-10-8-6-4-2024620
06Q1
2006
Q220
06Q3
2006
Q420
07Q1
2007
Q220
07Q3
2007
Q420
08Q1
2008
Q220
08Q3
2008
Q420
09Q1
2009
Q220
09Q3
2009
Q420
10Q1
2010
Q220
10Q3
2010
Q420
11Q1
2011
Q2
Percent Change in Real GDP
Advance Latest

www.bea.gov
The 2011 annual revision (continued)
▪ The downward revision over the recent cycle was significant, lowering the cumulative decline over the six quarters of the recession from -4.1 percent to -5.1 percent and lowering growth during the expansion from a cumulative increase of 17.8 percent to 17.6 percent. While the revision was large, the general
picture was unchanged. Before and after revision this recession was the deepest since the great depression and the recovery was the weakest of the post WWII era.
19

www.bea.gov
The 2011 annual revision (continued)
▪ The large cumulative revision in 2008:IV, from -3.8 percent in the advance estimate to -8.9 percent in the latest estimates has also received a lot of attention as has the downward revision of growth in 2011:I. Most of the revision for 2008:IV was made in
the second estimate, which reduced the estimate by 2.45 percentage points and the third estimate, which reduced the estimate by a further .09 percentage points.
These two revisions incorporated a large drop in newly available retail sales and other source data that had not been fully anticipated by BEA or by forecasters.
20

www.bea.gov
The 2011 annual revision (continued)
▪ Most of the rest of the downward revision of 2008:IV was from the second to third annual revision estimates; a reduction of 2.12 percentage points.
▪ This downward revision occurred as downward revisions to the contributions of personal consumption expenditures and imports more than offset an upward revision of inventories.
▪ The PCE revisions were due to the use of data benchmarked to the Economic Census and the availability of more detail.
▪ Also due to the seasonal adjustment of petroleum imports.
21
www.bea.gov
The 2011 annual revision (continued)
▪ This annual revision is different than others because it allowed a wider set of source data improvements than in the past—implementation of flexible annual revisions. 1. Real GDI had an even larger downward
revision in the third annual estimates.2. This was due to downward revisions in PCE
and imports that reflected new source data, including the 2007 economic census, as well as a new seasonal adjustment process for petroleum imports. An upward revision in inventories partially offset these.
22
www.bea.gov
Possible improvements to revision process
▪Source data1.GDP: finish services expansion;
acceleration of receipt of data; work with Census on reconciling differences between monthly and annual estimates.
2.GDI: afternoon session discussions.
23
www.bea.gov
Possible improvements to revision process
▪Methods1.Working with agencies on
improving seasonal adjustment.2.Use of forecasting models for
missing months and trends?3.Waiting for more data—drop
Advance estimate? Analysis suggests that this would provide only a small gain in accuracy.
24

www.bea.gov
Possible improvements to revision process
▪Presentation1.Drop annual rates of change;
show quarterly change and same quarter from previous year.
2.Expand the discussion about revisions in the press releases.
3.Canvass media outlets/uses about what they would like to see.
25