Embed Size (px)
Citation preview

MO
UN
T G
IBSO
N IR
ON
LIMIT
ED
2019 A
NN
UAL R
EPO
RT
2019 Annual Reportwww.mtgibsoniron.com.au
2 99MOUNT GIBSON IRON LIMITED 2019 Annual Report MOUNT GIBSON IRON LIMITED 2019 Annual Report
COURAGE INTEGRITY SAFETY AGILITY RESPECT
Taking and giving feedback Do what you say you will doGenuine care for self
and othersMake timely decisions
Be approachable and opento other points of view
Treat others as you wouldexpect to be treated
Encourage and develop people
Be dynamic andembrace change
Grab the opportunity
Constant concern(hazard identification)
Actively interveneto improve
Do the right thing, even when no one is looking
“walk the talk”
Be prepared to admitbeing wrong
Challenge the normconstructively
Make the hard calls
MGX Values
Mount Gibson Iron Limited is an established Australian producer and exporter of iron ore.
The Company was incorporated in 1996 and was listed on the Australian Securities
Exchange in 2002. The Company was admitted to the Standard & Poor's ASX-300 Index
in March 2019.
Mount Gibson seeks to provide sustainable, long-term returns to shareholders by
optimising its existing operations and growing long-term profitability through the
discovery, development and acquisition of mineral resources.
Headquartered in Perth, Mount Gibson owns the Extension Hill/Iron Hill operations in the
Mount Gibson Range south-east of Geraldton, and the high grade Koolan Island mine off
the Kimberley coast in the remote north-west of the State.
High grade ore sales resumed from Koolan Island in April 2019, making Mount Gibson the
highest grade producer of direct-shipping (DSO) hematite in Australia.
Our MGX Values provide us with a behavioural guide on how to sustainably deliver
shareholder value. We always put the health and safety of our people first, work together
with the communities in which we operate, and undertake our activities in an
environmentally responsible and sustainable manner.
Auditors
Ernst & Young
Ernst & Young Building
11 Mounts Bay Road
Perth 6000, Western Australia
Bankers
HSBC Bank Australia Ltd
188-190 St George’s Terrace
Perth 6000, Western Australia
Stock Exchange ListingThe company’s shares are listed on the Australian Securities Exchange.
ASX Code: MGX
Share Registry
Computershare Investor Services Pty Ltd
Level 11, 172 St George’s Terrace
Perth 6000, Western Australia
Telephone: 1300 787 272
Facsimile: +61 8 9323 2033
Annual General Meeting of Shareholders
Scheduled to be held at 12.00 Midday on 13 November 2019
at the Parmelia Hilton Hotel, 14 Mill St, Perth WA.
Easy Access to Information
See our website at www.mtgibsoniron.com.au for regular quarterly
reports and financial results. Additionally, shareholders or interested
parties can register to receive emailed updates shortly after the
company makes any regular or major announcement.
Board of Directors
Lee Seng Hui
Chairman, Non-Executive Director
Alan Jones
Non-Executive Director
Li Shaofeng
Non-Executive Director
Russell Barwick
Non-Executive Director
Paul Dougas
Non-Executive Director
Simon Bird
Non-Executive Director
Company SecretaryDavid Stokes
Registered Office
Level 1, 2 Kings Park Road
West Perth 6005, Western Australia
Telephone: +61 8 9426 7500
Facsimile: +61 8 9485 2305
Email: [email protected]
Website: www.mtgibsoniron.com.au
Solicitors
Herbert Smith Freehills
Level 36, QV1 Building
250 St George’s Terrace
Perth 6000, Western Australia
Corporate Directory
All information correct as at 30 June 2019

2018/19 Performance Summary
=
=
=
=
=
=
=
=
=
=
Strong safety performance maintained, recording a Lost Time Injury Frequency Rate (LTIFR) of 0.9 incidents per million manhours and a Total Recordable Injury Frequency Rate (TRIFR) of 3.7.
Total revenue of $289.5 million on iron ore sales of 3.2 million tonnes.
Net profit before tax from all operations of $70.5 million.
Net profit after tax of $133.4 million, after recognition of deferred tax assets.
Year-end cash, term deposits and liquid investments of $384.5 million.
Fully franked final dividend of 4.0 cents per share.
Net assets increased to $612.8 million at 30 June 2019, up from $496.8 million in the prior year.
Operating cashflow of $59.4 million and interest income of $11.6 million.
High grade Koolan Island mine successfully redeveloped and first ore sales achieved in April 2019.
Mid-West business life extended via sales of stockpiled low-grade ore and the right earned to a future income stream based on third party Mid-West rail volumes.
Contents
2018/19 Performance Summary 3
Chairman’s Report 4
Chief Executive Officer’s Report 5
Health & Safety 6
Operational Review 7
Environment and Community Affairs 8
Resources and Reserves Statement 9
Financial Report 11
Directors’ Report 12
Corporate Governance 93
Additional ASX Information 94
Corporate Directory 99
MOUNT GIBSON IRON LIMITED 2019 Annual Report3 3

Chairman’s Report
It is with pleasure that I present to you Mount
Gibson Iron's 2019 Annual Report.
The Company reported further improvement
in profitability by its core operating business
during the year, as our operational focus
transitioned from our Mid-West operation to
Koolan Island in the Kimberley region. Net
profit after tax totalled $133.4 million,
compared with $99.1 million in the prior year,
reflecting improved pre-tax profit from all sites
of $70.5 million and the recognition of
deferred tax assets totalling $62.9 million. The
profit before tax of $70.5 million was
significantly higher than the $34.8 million from
continuing operations reported in 2017/18,
excluding that year’s Koolan Island business
interruption insurance settlement.
Our financial result reflected the Company's
continued focus on cost reduction and
financial discipline, and the benefits of
improved iron ore prices in the second half of
the year. Consequently, cash and liquid
investments were $384.5 million at the end of
June, a reduction of $73.0 million over the
year, as operating cashflow helped to offset
investment incurred while bringing our
flagship Koolan Island mine back into
production.
In light of these factors, and the strong
underlying performance by our existing
business in 2018/19, the Board was pleased to
declare a fully franked final dividend of
4.0 cents per share for the year. On payment,
Mount G ibson w i l l have d i s t r i bu ted
approximately $274 million in fully franked
dividends since late 2011, whilst retaining
substantial capital for reinvestment in its
exist ing business and new resources
investment opportunities.
The successful restart of high-grade ore sales
from Koolan Island in April 2019 was a
significant milestone for the Company during
the year and has positioned this unique
operation to provide a strong foundation for
generating cashflow for Mount Gibson well into
the next decade.
In the Mid-West, we concluded mining
operations at the Iron Hill deposit as planned
in late 2018 and completed our final direct
shipping grade ores in February 2019 after
fifteen years of continuous production in the
region. The subsequent rise in iron ore prices
then enabled the Company to successfully
implement an opportunistic program to sell
remnant low grade material stockpiled at the
Extension Hill minesite, sales of which
commenced in June and will continue into
late 2019.
This program, together with anticipated
income from our entitlement to a partial refund
of historical rail access charges triggered
during the year, will see our Mid West business
continue to make a contribution well into the
future.
The Company is now well positioned to deliver
on the Board's objective of creating long term
value through investment in exploration,
development and efficient operational
extraction of mineral resources.
Looking to the year ahead, the Board has
determined the following key business
objectives for the 2019/20 financial year:
Ÿ Koolan Island – complete the ramp-up of
ore production and sales in line with the
mine plan to maximise cashflow and
capitalise on favourable market conditions.
Ÿ Mid-West operations – complete the
current program of Extension Hill low
grade sales and extend the program should
favourable market prices continue.
Thereafter, transition the site to final
closure.
Ÿ Cost reductions - continue to drive for
sustainable cost improvements across the
existing business.
Ÿ Treasury returns - mainta in an appropriate yield on the Group's cash and investment reserves.
Ÿ Growth projects - continue the search
for acquisition opportunities in the
resources sector.
By focusing on these priorities, we are
confident that Mount Gibson will continue to
navigate fluid market conditions and capitalise
on its financial strength to deliver strong long
term returns for our shareholders.
In summary, I would like to thank my fellow
Directors and the employees of Mount Gibson
for their efforts over the year. I look forward to
reporting another successful year in 2020.
Lee Seng Hui
Chairman
4 MOUNT GIBSON IRON LIMITED 2019 Annual Report

Chief Executive Officer’s Report
Mount Gibson's performance in the 2018/19
financial year, from a safety, operating and
financial perspective, was very satisfying in a
period of rapidly changing market conditions as
the operational centre of gravity shifted from
our Mid-West operations to our high grade
Koolan Island mining operation in the
Kimberley.
The safety of our people remains our priority, so
it is of credit to our workforce that Mount
Gibson achieved a significant reduction in the
Total Recordable Injury Frequency Rate from
5.6 to 3.7 incidents per million manhours
during 2018/19. This was especially
noteworthy given the substantial increase in
the size of the Company's workforce as the
Koolan Island mine was brought back into
production.
It was however disappointing to record the
Company's first Lost Time Injury for a number
of years in April 2019 when an employee
suffered a hand injury at Koolan Island,
resulting in a Lost Time Injury Frequency Rate
of 0.9 incidents per million manhours at
30 June 2019. Safety can never be taken for
granted, and we continually seek to improve
our safety culture and performance.
Our financial and operating performance was
also satisfying. Profit before tax of
$70.5 million across all sites was well in excess
of the $34.8 million reported in 2017/18
excluding that year's Koolan Island business
interruption insurance settlement. This
reflected a 41% increase in average realised
prices and the commencement of high grade
sales from Koolan Island, offsetting lower total
sales volumes of 3.2 million wet metric tonnes
(Mwmt) compared with sales of 3.6 Mwmt in
the prior year.
Mount Gibson also continued to demonstrate
its ability to manage costs, achieving all-in
group cash costs of $53 per wmt sold Free on
Board (FOB), excluding Koolan Island
development expenditure, at the lower end of
guidance. This underpinned robust operating
cashflow of $59.4 million, before interest
income of $11.6 million. Cash outflows for
development expenditure at Koolan Island
totalled $109.1 million, in addition to plant and
equipment purchases of $18.5 million.
The Mid-West Operations were the primary
driver of our financial result for 2018/19,
generating earnings before interest and tax of
$60.8 million on total ore sales of 2.8 Mwmt,
comprising 2.6 Mwmt of direct-shipping grade
ore (DSO) and 0.2 Mwmt of stockpiled low
grade material.
DSO sales from the Iron Hill deposit at the
Extension Hill mine site concluded in line with
plan in February 2019, after which renewed
market interest in lower grade material enabled
the Company to institute an opportunistic
program to sell previously uneconomic
stockpiled low-grade material from the
Extension Hill mine site. Site cash costs for the
year averaged $39/wmt FOB, in line with
guidance.
We also triggered our entitlement to a partial
cash refund of historical rail access charges, up
to a total of $35 million (subject to future
indexation), based on third party volumes
railed on the relevant segments of the
Mid-West rail network. The refund is currently
accruing at a rate of approximately $1.8-2.0
million per quarter, with payments to be
received in six monthly intervals commencing
in September 2019.
Completing the extensive work needed to bring
Koolan Island back into production was a key
priority during the year. This work included the
successful completion of the impermeable
barrier in the seawall embankment, installation
of extensive monitoring instrumentation in the
seawall, progressive dewatering of the Main
Pit, footwall refurbishment and initial waste
m i n i n g a c t i v i t y. I m p o r t a n t l y, a l l
instrumentation and monitoring data continues
to demonstrate the seawall is performing
according to design.
It was therefore very satisfying to ship our first
cargo of high grade ore, grading 65% Fe, in late
April 2019. Commercial production was
declared at the end of May and the site was
cashflow positive in in the month of June,
having completed total shipments since restart
of 0.4 Mwmt. At year end, production was
ramping up to achieve 3-4 Panamax shipments
per month, consistent with the initial period
mine plan.
The restart of Koolan Island complements our
continuing efforts to utilise our healthy balance
sheet and cash reserves to grow and diversify
our business through quality resources
development opportunities. We enter the new
financial year in good shape and with
confidence of continuing to deliver value for
shareholders.
I would like to take this opportunity to thank the
Chairman and other Board members for their
ongoing support and guidance, and in
particular I thank all Mount Gibson's hard
working employees and contractors for their
efforts and commitment. I am proud of what
the team has achieved and look forward to the
year ahead.
Peter Kerr
Chief Executive Officer
MOUNT GIBSON IRON LIMITED 2019 Annual Report 5

Health and Safety
Mount Gibson's ongoing commitment to
maintaining a safe work environment
and taking responsibility for the safety of its
people remains a primary focus, with the
Company committed to achieving continuous
improvement in its safety culture and
performance.
The Company was pleased to report a
significant reduction in the Total Recordable
Injury Frequency Rate (TRIFR) from 5.6 to 3.7
incidents per million manhours during
2018/19. This continues the trend of a
significant reduction since 2012/13.
The Company recorded a Lost Time Injury
Frequency Rate (LTIFR) of 0.9 incidents per
million manhours at 30 June 2019, after
reporting its first Lost Time Injury since the
2016/17 financial year in April 2019 when an
employee suffered a hand injury at Koolan
Island.
For deta i ls of the Company's safety
performance, including statistics for each site,
please refer to Mount Gibson's 2019
Sustainability Report, published on the Mount
Gibson website.
0.00 0.00
FY2013 FY2014 FY2015 FY2016
FY2013 FY2014 FY2015 FY2016FY2016 FY2017 FY2019
FY2017 FY2018 FY2019
6.806.805.30
5.60
3.70
1.80 1.80
0.00 0.90
6
5
4
3
2
1
0
3.43
5.57
14
12
16
10
8
6
4
2
0
TRIFR
LTIFR
9.40
13.31
15.01
*LTIFR and TRIFR each represent incidents per million manhours
FY2018
6 MOUNT GIBSON IRON LIMITED 2019 Annual Report

Operational Review
During the 2018/19 financial year, Mount
Gibson achieved total ore sales of 3.2 million
wet metric tonnes (Mwmt), being an 11%
decrease from the previous year, reflecting the
completion of production and sales from the
Iron Hill mine in the Mid-West in early 2019 and
the commencement of high grade production at
Koolan Island in the June quarter of 2019. A
more detailed summary is contained in the
Directors' Report.
Koolan Island
Koolan Island is located approximately 140km
north of Derby in the Kimberley region of
Western Australia. Development activities
necessary for the restart of the Koolan Island
operation commenced in May 2017.
The primary focus of activity in the 2018/19
financial year was completion of all restart
works and pre-production activities to
recommence high grade ore production and
sales from the Main Pit. Completion of the
impermeable seepage barrier in the seawall
embankment was achieved in July 2018, after
which dewatering and refurbishment of the
Main Pit footwall commenced. The seawall
came under tidal loads in November 2018, after
which blasting and waste mining commenced in
the upper levels of Main Pit.
The first shipment of high grade ore, averaging
65% Fe, was completed in late April 2019.
Mining and ore production progressively
ramped up in the remaining two months of the
financial year, and the site attained commercial
production for reporting purposes at the end of
May 2019.
Five ore shipments totalling 0.4 Mwmt of high
grade ore from Main Pit were completed during
the June quarter. At year end, the site was on
track to average 3-4 Panamax shipments per
month, consistent with the initial period mine
plan.
Development expenditure during the year
totalled $109.1 million, in addition to plant and
equipment purchases totalling $17.6 million.
The Ore Reserve for the Koolan Island operation
as at 30 June 2019 totals 20.3 million tonnes at
an average grade of 65.5% Fe with an expected
mine life of 5-6 years. Movement of
unmineralised waste is highest in the first two
years, with waste mining movement and
associated cash costs to reduce substantially
over the balance of the mine life.
Mid West Operations -
Extension Hill/Iron Hill
The Extension Hill mine and adjacent Iron Hill
deposit are located in the Mount Gibson
Ranges, 85km east of Perenjori and 260km east
south east of Geraldton in the Mid-West region
of Western Australia.
The Mid-West Operations delivered a solid
financial and operating performance in
2018/19, exporting approximately 2.8 Mwmt of
ore from Geraldton Port, comprising 2.6 Mwmt
of high grade direct-ship ore (DSO) and
0.2 Mwmt of low grade material. The operation
generated earnings before interest and tax of
$60.8 million for the year.
Mining operations were completed at Iron Hill in
December 2018 as planned, with the final
shipment of high-grade DSO exported from the
Geraldton Port in late February 2019. Following
renewed market interest in lower grade
mater ia l , the Company subsequent ly
commenced sh ipments of prev ious ly
uneconomic stockpiled low-grade remnant
material from the completed Extension Hill mine
in June 2019.
Four shipments totalling approximately
0.2 Mwmt were completed in the month of
June. This program envisages total low grade
shipments in the order of 1.0 Mwmt over a six
month period, with the potential for any
additional sales being dependent on future iron
ore prices. Cashflow from the program is
expected to be modest and will assist in final
site rehabilitation works.
Following achievement of a contractual rail
volume threshold at Extension Hill in 2018, the
Company became entitled to receive a partial
cash refund of historical rail access charges
based upon the future usage by certain third
parties over specific segments of the Perenjori
to Geraldton railway line. This refund is
calculated at various volume-related rates and
capped at a total of approximately $35 million
(subject to indexation) and a time limit expiring
in 2031. Receipt of the first payment is
anticipated to occur at the end of September
2019, and at six month intervals thereafter, with
payments dependent on the volumes railed by
third parties on the specified rail segments. As
at 30 June 2019, a refund totalling $2.5 million
was accrued.
MOUNT GIBSON IRON LIMITED 2019 Annual Report 7

The key elements of health, safety, environment
and community affairs form the basis for Mount
Gibson's drive towards sustainable outcomes.
Sustainability refers to the conditions under
which humans and nature can coexist in a
productive manner and permit the environ-
mental, social and economic requirements of
present and future generations. The social
perspective also remained a significant focus
throughout the 2018/19 year. This includes
always putting the health, safety and wellbeing
of our people first.
ENVIRONMENT
Mount Gibson has placed significant emphasis
on environmental management at its operations
over the past year. We have focused strongly on
continuous improvement and innovation, always
performing in an environmentally responsible
manner and ensuring a high standard of
environmental management at all operating
locations.
Environmental reporting is a significant element
of sound environmental management with many
regulatory organisations requiring quarterly or
annual reports. These include the federal
Department of the Environment, the state
Environmental Protection Authority, the
Department of Water & Environmental
Regulation (DWER) and the Department of
Mines, Industry Regulation and Safety (DMIRS).
A key reporting obligation is the National Energy
and Greenhouse Reporting Scheme which
provides data on greenhouse gas emissions and
energy production. Diesel combustion is Mount
Gibson's single largest source of greenhouse gas
emissions. The latest report reflects the
transition to production and resulting ramp-up of
mining activity at Koolan Island, and ramp-down
of mining activity at the Company's Mid-West
operations.
The Group holds various environmental licences
and authorities, issued under both State and
Federal laws, to regulate its mining and
exploration activities in Australia. In June 2019,
the Company received a Notice of Non-
Compliance from DWER relating to marine
factors at Koolan Island during the Main Pit
seawall development and dewatering phases.
The Company has responded to DWER providing
additional information and DWER has specified
certain actions to resolve the notified matters
which the Company is now implementing.
For details of the Company's environmental performance, including information relating to each site, please refer to Mount Gibson's 2019 Sustainability Report, published on the Mount Gibson website.
COMMUNITY AFFAIRS
Mount Gibson values its relationship with key
stakeholders and works to ensure a clear mutual
understanding of the impacts of its operations.
To do this, Mount Gibson has an ongoing
program of regular stakeholder consultation
working with the general communities in which
we operate with an additional emphasis on the
recognition of the Traditional Owners at our
locations and areas of special heritage and
cultural significance.
Mount Gibson's stakeholders include its
customers, shareholders, employees, suppliers,
landowners, Traditional Owners, regulators,
local governments, interest groups and the
broader community. The level of consultation is
dependent on the interest noted by stakeholders
and the proximity of a site to closure.
Investing in the creativity, education and health
of our local communities is an important
component of Mount Gibson's community
engagement program. In line with our
commitments, the Company has invested
heavily in these areas in the last 12 months,
including through direct contributions to
community organisations, sponsorships,
educational scholarships and support for
community events and other initiatives.
For details of Mount Gibson Iron's community investment activities and engagement with communities and stakeholders, including total expenditure and information relating to each site, please refer to Mount Gibson's 2019 Sustainability Report, published on the Mount Gibson website.
Environment and Community
8 MOUNT GIBSON IRON LIMITED 2019 Annual Report

Resources and Reserves
Total Mineral Resources and Ore Reserves by Project as at 30 June 2019
Koolan Island
Extension Hill
Iron Hill
Tallering Peak
Mineral Resources, above 50% Fe
Measured
Indicated
Inferred
Total at 30 June 2018
Ore Reserves, above 50% Fe
Proved
Probable
Total at 30 June 2018
Mineral Resources, above 50% Fe
Measured
Indicated
Inferred
Total at 30 June 2019
Total at 30 June 2018
Mineral Resources, above 50% Fe
Measured
Indicated
Inferred
Total at 30 June 2019
Total at 30 June 2018
Mineral Resources, above 50% Fe
Measured
Indicated
Inferred
Total at 30 June 2019
Total at 30 June 2018
millions % % % %
Tonnes Fe SiO Al O P2 2 3
Total at 30 June 2019
Total at 30 June 2019
2.97 60.2 13.29 0.30 0.007
37.51 65.1 5.51 0.65 0.013
9.97 60.6 12.21 0.59 0.013
51.18 63.8 7.38 0.61 0.013
51.91 63.9 7.33 0.62 0.013
1.27 55.3 9.16 2.76 0.077
0.31 57.3 10.42 1.62 0.076
0.20 56.6 10.49 1.66 0.055
1.79 55.8 9.53 2.44 0.074
1.79 55.8 9.53 2.44 0.074
0.41 58.9 6.26 3.50 0.082
1.03 58.1 11.70 1.66 0.066
0.20 54.7 17.89 1.93 0.056
1.65 57.9 11.10 2.15 0.069
1.65 57.9 11.10 2.15 0.069
2.65 55.0 13.94 1.74 0.074
1.07 55.0 9.86 2.61 0.081
3.72 55.0 12.76 1.99 0.076
5.17 56.2 11.73 1.79 0.076
0.1 63.3 7.28 1.11 0.013
20.2 65.5 4.55 0.88 0.012
20.3 65.5 4.56 0.88 0.012
21.0 65.5 4.58 0.89 0.012
MOUNT GIBSON IRON LIMITED 2019 Annual Report 9

Resources and Reserves Continued
No Material Change
There were no significant changes in the annual reporting period other than mining depletion at Iron Hill and Koolan Island.
Competent Persons and Responsibilities
Mineral Resources:
The information in this report relating to Mineral Resources is based on information compiled by Elizabeth Haren, a Competent Person who is a member and Chartered Professional of the Australasian Institute of Mining and Metallurgy and a member of the Australian Institute of Geoscientists. Ms Haren was previously a full-time employee of, and is now a consultant to, Mount Gibson Iron Limited, and has sufficient experience that is relevant to the style of mineralisation and type of deposit under consideration and to the activity being undertaken to qualify as a Competent Person as defined in the 2012 Edition of the ‘Australasian Code for Reporting of Exploration Results, Mineral Resources and Ore Reserves’. Ms Haren consents to the inclusion in this report of the matters based on her information in the form and context in which it appears.
Ore Reserves:
The information in this report relating to Ore Reserves at Koolan Island is based on information compiled by Brett Morey, a Competent Person who is a member of the Australasian Institute of Mining and Metallurgy. Mr Morey is a full-time employee of Mount Gibson Iron Limited and has sufficient experience that is relevant to the style of mineralisation and type of deposit under consideration and to the activity being undertaken to qualify as a Competent Person as defined in the 2012 Edition of the ‘Australasian Code for Reporting of Exploration Results, Mineral Resources and Ore Reserves’. Mr Morey consents to the inclusion in the report of the matters based on his information in the form and context in which it appears.
For more information, refer to Mount Gibson's Annual Statement of Mineral Resources and Ore Reserves at 30 June 2019 on the Mount Gibson website.
Mineral Resources, above 50% Fe
Measured
Indicated
Total Mineral Resources at 30 June 2019
Inferred
Total Ore Reserves at 30 June 2019
Total at 30 June 2019
Total at 30 June 2018
Total Ore Reserves at 30 June 2018
Discrepancies may appear due to rounding. Mineral Resources are reported inclusive of Ore Reserves. All tonnages have been
Discrepancies may appear due to rounding. Mineral Resources are reported inclusive of Ore Reserves. All tonnages have been
estimated as dry tonnages.
estimated as dry tonnages.
Shine
Total Group Mineral Resources and Ore Reserves as at 30 June 2019 (above 50% Fe)
Total Mineral Resources at 30 June 2018
5.73 58.9 9.04 1.81 0.076
6.57 58.0 10.01 1.35 0.070
3.59 56.8 9.61 1.18 0.063
15.89 58.1 9.57 1.48 0.071
15.89 58.1 9.57 1.48 0.071
millions % % % %
Tonnes Fe SiO Al O P2 2 3
millions % % % %
Tonnes Fe SiO Al O P2 2 3
74.2 61.8 8.25 0.95 0.031
20.3 65.5 4.56 0.88 0.013
76.4 61.8 8.23 0.95 0.032
21.0 65.5 4.58 0.89 0.012
10 MOUNT GIBSON IRON LIMITED 2019 Annual Report

Financial Report
MOUNT GIBSON IRON LIMITED AND CONTROLLED ENTITIES
ABN 87 008 670 817
ANNUAL FINANCIAL REPORT FOR THE YEAR ENDED 30 JUNE 2019
Directors’ Report 12
Consolidated Income Statement 28
Consolidated Statement of Comprehensive Income 29
Consolidated Balance Sheet 30
Consolidated Cash Flow Statement 31
Consolidated Statement of Changes in Equity 32
Notes to the Consolidated Financial Report 33
1. Introduction 33 2. Other Significant Accounting Policies 34 3. Revenue and Other Income 35 4. Expenses 37 5. Taxation 39 6. Cash and Cash Equivalents 43 7. Term Deposits and Subordinated Notes 44 8. Financial Assets Held for Trading 44 9. Trade and Other Receivables 45 10. Inventories 46 11. Derivative Financial Assets 46 12. Interests in Subsidiaries 47 13. Property, Plant and Equipment 49 14. Deferred Acquisition, Exploration and Evaluation Costs 51 15. Mine Properties 52 16. Impairment of Non-Current Assets 54 17. Trade and Other Payables 55 18. Interest-Bearing Loans and Borrowings 55 19. Derivative Financial Liabilities 55 20. Provisions 56 21. Issued Capital 58 22. Reserves 59 23. Accumulated Losses 60 24. Expenditure Commitments 60 25. Share-Based Payment Plans 61 26. Earnings Per Share 63 27. Dividends Paid and Proposed 64 28. Contingent Liabilities 64 29. Key Management Personnel 65 30. Related Party Transactions 65 31. Auditor’s Remuneration 66 32. Discontinued Operations 67 33. Segment Information 68 34. Events After the Balance Sheet Date 71 35. Financial Instruments 71 36. Parent Entity Information 79 37. New and Amended Accounting Standards and Interpretations 81
Directors’ Declaration 85
Independent Audit Report 86
MOUNT GIBSON IRON LIMITED 2019 Annual Report 11

Directors’ Report Your Directors submit their report for the year ended 30 June 2019 for Mount Gibson Iron Limited (Company or Mount Gibson) and the consolidated group incorporating the entities that it controlled during the financial year (Group).
DIRECTORS
The names and details of the Company’s Directors in office during the financial period and until the date of this report are set out below. Directors were in office for the entire period unless otherwise stated.
Names, Qualifications, Experience and Special Responsibilities
Lee Seng Hui LLB (Hons) Chairman, Non-Executive Director
Mr Lee was appointed as a Non-Executive Director on 29 January 2010, Non-Executive Deputy Chairman on 14 December 2012, and Chairman on 18 February 2014. Mr Lee graduated with Honours from the University of Sydney Law School. Mr Lee is the Chief Executive and an Executive Director of Allied Group Limited and Allied Properties (H.K.) Limited both of which are listed on the Hong Kong Stock Exchange. He is also the Chairman and a Non-Executive Director of Tian An China Investments Company Limited, and a Non-Executive Director of APAC Resources Limited, one of Mount Gibson’s substantial shareholders. Mr Lee was previously the Chairman and a Non-Executive Director of Asiasec Properties Limited. Mr Lee has not served as a director of any other ASX or Hong Kong listed companies during the past three years. Alan Jones CA Independent Non-Executive Director
Mr Jones was appointed as an Independent Non-Executive Director on 28 July 2006 and is the current Chairman of the Nomination, Remuneration and Governance Committee. Mr Jones is a Chartered Accountant with extensive senior management and board experience in listed and unlisted Australian public companies, particularly in the construction, engineering, finance and investment industries. Mr Jones has been involved in the successful merger and acquisition of a number of public companies in Australia and internationally. He is a Non-Executive Director of Mulpha Australia Ltd, Sun Hung Kai & Co Ltd (Hong Kong), Allied Group Ltd (Hong Kong), Allied Properties (H.K.) Limited and Air Change International Limited. Li Shaofeng B.Automation Non-Executive Director
Mr Li was appointed as a Non-Executive Director on 23 February 2012. Mr Li has extensive experience in enterprise management and investments. He holds a bachelor degree in Automation from University of Science and Technology Beijing. Mr. Li was appointed an Executive Director and the Managing Director of Shougang Concord International Enterprises Co. Ltd in May 2010 and was re-designated as the Vice Chairman of the Board from 6 January 2018. Mr. Li is the managing director of Shougang Fushan Resources Group Limited (“Shougang Resources”), a substantial shareholder of Mount Gibson, and an executive director of BeijingWest Industries International Limited. Mr. Li was the chairman of Shougang Resources from October 2011 to January 2018, the chairman of Shougang Concord Century Holdings Limited (“Shougang Century”) from March 2000 to January 2018, the chairman of each of Shougang Concord Grand (Group) Limited (“Shougang Grand”) and Global Digital Creations Holdings Limited (“GDC”) from May 2010 to June 2017, all of which are companies listed on the Hong Kong Stock Exchange. Russell Barwick Dip.Min.Eng., FAICD, FAusIMM Independent Non-Executive Director
Mr Barwick was appointed as an Independent Non-Executive Director on 16 November 2011 and is Chairman of the Operational Risk and Sustainability Committee. Mr Barwick is a mining engineer with 45 years of technical, operational, managerial and corporate experience in international mining companies covering various commodities. He has worked for Bougainville Copper Limited (CRA), Pancontinental Mining Ltd (Jabiluka Uranium) and CSR Limited (coal). He has spent 16 years with Placer Dome Asia Pacific in key development, operational and corporate roles in numerous countries culminating in his appointment as Managing Director of Placer Niugini Ltd. He then served as Managing Director of Newcrest Mining Limited (2000 to 2001). For the four years to the end of 2006, Mr Barwick was the Chief Operating Officer of Wheaton River Minerals Ltd and Goldcorp Inc., based in Vancouver, Canada. He was subsequently the Chief Executive Officer of Canada-based Gammon Gold Inc. before returning to Australia in 2008. His extensive geographic and corporate mining experience ranges from: Latin America, North America, Europe, Africa and Asia Pacific. He is currently the Chairman of Red Metal Ltd and a director of Lithium Power International. Simon Bird B.Acc.Science (Hons) CA, FCPA, FAICD Lead Independent Non-Executive Director
Mr Bird was appointed as an Independent Non-Executive Director on 23 February 2012. Mr Bird is the Lead Independent Director and Chairman of the Audit and Financial Risk Management Committee. Mr Bird has over 30 years of international corporate experience, including holding the positions of General Manager Finance at Stockland Limited, Chief Financial Officer of GrainCorp Limited, and Chief Financial Officer of Wizard Mortgage Corporation. He was also Chief Executive Officer of ASX-listed King Island Scheelite Limited, a former Managing Director of ASX-listed Sovereign Gold Limited, a former Chairman of ASX-listed Rawson Resources Limited and a former Director of CPA Australia Limited. Mr Bird is currently a director of ASX-listed company Pacific American Holdings Limited.
12 MOUNT GIBSON IRON LIMITED 2019 Annual Report

Paul Dougas B.Eng (Chem), M.Eng.Science, FAICD, CEng., Hon Fellow Engineers Australia, FATSE Independent Non-Executive Director
Professor Dougas was appointed as an Independent Non-Executive Director on 16 November 2011 and is Chairman of the Contracts Committee. He has 40 years of design, process, project engineering, managerial, commercial and corporate experience having commenced his career in the Melbourne & Metropolitan Board of Works before joining engineering firm Sinclair Knight Merz (SKM) in 1978. From initial technical roles, he assumed leadership roles in Sydney before returning to Melbourne as Associate Director and Victorian Branch Manager in 1985. In 1995 he was appointed Managing Director Elect and Director of Marketing before becoming Chief Executive Officer and Managing Director in 1996. For the following 15 years, he led a significant expansion of SKM locally and internationally involving more than 50 local and international acquisitions. Professor Dougas was a Non-Executive Director of ConnectEast Ltd from 2009 until its takeover in September 2011 and was also on the SKM Board from 1990 until 2011. He is currently a Non-Executive Director of Epworth Healthcare and is a former Chairman of the Global Carbon Capture and Storage Institute, and Norman, Disney & Young and a former Non-Executive Director of Beacon Foundation and Calibre Group Limited. Professor Dougas is also a Professorial Fellow in the School of Engineering at Melbourne University and a staff member. Andrew Ferguson Alternate Director to Lee Seng Hui
Mr Ferguson was appointed Alternate Director to Lee Seng Hui on 24 September 2012. Mr Ferguson is Chief Executive Officer and an Executive Director of APAC Resources Ltd, one of Mount Gibson’s substantial shareholders. Mr Ferguson holds a Bachelor of Science Degree in Natural Resource Development and worked as a mining engineer in Western Australia in the mid 1990’s. He has over 20 years of experience in the finance industry specialising in global natural resources. In 2003, Mr Ferguson co-founded New City Investment Managers in the United Kingdom. He was the former co-fund manager of City Natural Resources High Yield Trust, and managed New City High Yield Trust Ltd and Geiger Counter Ltd. He has also worked as Chief Investment Officer for New City Investment Managers CQS Hong Kong. Mr Ferguson is a former Non-Executive Director of Metals X Limited and ABM Resources NL, both of which are listed on the Australian Securities Exchange.
COMPANY SECRETARY
David Stokes B.Bus, LLB, ACIS Company Secretary & General Counsel
Mr Stokes was appointed Company Secretary and General Counsel on 2 April 2012. He is a corporate lawyer with a diverse range of mining, commercial and governance experience having worked at a corporate and operational level in the energy and resources sectors for over 20 years. Prior to joining Mount Gibson, Mr Stokes was General Counsel and Company Secretary at Gindalbie Metals Limited, Corporate Counsel for Iluka Resources Limited and Resolute Mining Limited, and has also worked in private practice for a number of years.
CORPORATE INFORMATION
Corporate Structure
Mount Gibson is a company limited by shares that is incorporated and domiciled in Australia. It is the ultimate parent entity and has prepared a consolidated financial report incorporating the entities that it controlled during the financial year. The structure of the Group as at 30 June 2019 was as follows:
MOUNT GIBSON IRON LIMITED 2019 Annual Report 13

Nature of Operations and Principal Activities
The principal activities of the entities within the Group during the year were:
mining and processing of hematite iron ore at the Extension Hill mine site in the Mid-West region of Western Australia, and haulage of the ore via road and rail for export from the Geraldton Port;
recommencement of operational activities, including the mining and direct shipment of hematite iron ore at the Koolan Island mine site in the Kimberley region of Western Australia;
treasury management; and the pursuit of mineral resources acquisitions and investments.
Employees
The Group employed 297 employees (excluding contractors) as at 30 June 2019 (2018: 163 employees).
OPERATING AND FINANCIAL REVIEW
Introduction
The Board presents the 2018/19 Operating and Financial Review which has been prepared to provide shareholders with a clear and concise overview of Mount Gibson’s operations, financial position, business strategies and prospects. This review also provides a summary of the impact of key events which occurred in 2018/19 and the material business risks so that shareholders can make an informed assessment of the results and prospects of the Group.
The review complements Mount Gibson’s financial statements for the year ended 30 June 2019 and has been prepared in accordance with Regulatory Guidance 247 published by the Australian Securities and Investments Commission (ASIC).
Overview of the 2018/19 Financial Year
The Group’s financial performance for the year ended 30 June 2019 was strong in a year of significant operational transition as the Company’s Mid-West operations wound down, and Koolan Island became the principal longer term source of production and revenue following the successful restart of ore sales from Main Pit in late April 2019. This transition encompassed steady production and sales in the final months of operations at the Iron Hill deposit at Extension Hill, investment of significant capital to complete restart and pre-production activities at Koolan Island, the commencement of sales of remnant low-grade material held in stockpiles at Extension Hill in June 2019, and continued management of the Group’s treasury reserves. The Group recorded a net profit before tax from continuing operations of $70,285,000 and, following the recognition of deferred tax assets, a net profit after tax of $133,369,000.
The Company’s performance was assisted by a substantial rise in iron ore prices over the year. At the beginning of the year, the Platts Index for delivery of 62% Fe iron ore fines to northern China was approximately US$64 per dry metric tonne (dmt) and traded within a band of US$62-78/dmt in the first half of the financial year. The price then rose dramatically over the first six months of 2019 following a tragic tailings dam collapse in Brazil in late January, which resulted in substantial production from Brazil being halted for an indefinite period. The Platts 62% Index price consequently averaged US$83/dmt in the March 2019 quarter and US$100/dmt in the June 2019 quarter, ending the year at US$118/dmt to average US$80/dmt over the full financial year.
This coincided with a significant narrowing of the discounts and premiums on ores grading below and above 62% Fe respectively. For ores grading 58%, the discount narrowed from over 40% in mid-2018 to approximately 5% in mid-2019, while the premium for higher grade ores grading 65% Fe reduced from over 30% to around 3% over the same period.
The Australian dollar also consistently traded lower than in the prior year, averaging A$1.00/US$0.715 for the financial year, compared with US$0.775 in the prior year. The dollar ended the year at US$0.701, after trading between a high of US$0.747 in July 2018 and a low of US$0.688 in May 2019.
Group ore sales for the year totalled 3.2 million wet metric tonnes (Mwmt). Sales revenue totalled $285,444,000 including shipping freight services and provisional pricing adjustments, and $239,823,000 on a Free on Board (FOB) basis (excluding shipping freight services), before $7,080,000 of realised foreign exchange hedging and commodity forward contract net losses reflecting significantly higher iron ore prices following the unanticipated Brazilian supply disruptions in early 2019.
Mount Gibson achieved an average realised price for all products sold in the year (before realised foreign exchange hedging and commodity forward contract net losses) of $76/wmt Free on Board (FOB), net of shipping freight, compared with $53/wmt FOB in 2017/18. This reflected higher average realised prices for Mid-West standard grade products, which comprised the bulk of sales volumes, as well as significantly higher realised prices for the initial Koolan Island sales. The average price for standard Mid-West iron ore fines product was US$37/dmt FOB after grade and provisional pricing adjustments and penalties for impurities, compared with an average of US$30/dmt FOB in 2017/18. The average price received for initial sales of high grade Koolan Island fines was US$106/dmt FOB. Remnant low grade material from Extension Hill was sold on a fixed price basis realising an average of US$29/dmt FOB for fines and US$36/dmt FOB for lump.
The total cost of sales for the year was $204,286,000 including royalties and shipping freight costs. On a FOB basis, excluding shipping freight, the total cost of sales was $158,665,000 which equated to $50/wmt sold, compared with $44/wmt sold in the prior financial year. This increase reflected higher royalty costs of approximately $2/wmt arising from higher realised prices, as well as the impacts of the wind-down of sales in the Mid-West operation and initial higher cost sales from the Koolan Island operation.
Total cash reserves, comprising cash and cash equivalents, term deposits and subordinated notes, and financial assets held for trading, reduced by $73,003,000 over the year to a total of $384,531,000 as at 30 June 2019. The cashflow movement was primarily attributable to expenditure on the rebuild of the Main Pit seawall and associated pre-production activities at Koolan Island, operating cashflows from the Mid-West business, and payment in October 2018 of the $18,347,000 cash component of the final dividend for 2017/18.
14 MOUNT GIBSON IRON LIMITED 2019 Annual Report

Operating Results for the Financial Year
The summarised operating results for the Group for the year ended 30 June 2019 are tabulated below:
Year ended: 30 June 2019 30 June 2018 30 June 2017 30 June 2016 30 June 2015
Net profit/(loss) before tax* $’000 70,462 99,129 24,841 85,536 (1,008,505)
Taxation benefit $’000 62,907 - 1,481 761 97,083
Net profit/(loss) after tax $’000 133,369 99,129 26,322 86,297 (911,422)
Earnings/(loss) per share cents/share 11.98 9.08 2.41 7.91 (83.56)
* Inclusive of discontinued operations. Refer the attached financial statements for further details.
Consolidated quarterly operating and sales statistics for the 2018/19 financial year are tabulated below:
Consolidated Group Unit Sept
Quarter 2018
DecQuarter
2018
MarQuarter
2019
Jun Quarter
2019 2018/19 2017/18
Mining & Crushing Total waste mined kwmt 195 2,507 4,148 3,588 10,438 1,659 Total ore mined# kwmt 1,081 810 8 544 2,443 4,085 Total ore crushed kwmt 1,052 980 62 810 2,904 3,507 Shipping/Sales Standard DSO Lump kwmt 607 475 254 - 1,336 1,627 Standard DSO Fines kwmt 542 537 148 370 1,597 1,576 Low Grade Lump kwmt - - - 120 120 419 Low Grade Fines kwmt - - - 118 118 - Total kwmt 1,149 1,012 402 607 3,170 3,622 Ave. Platts 62% Fe CFR northern China price US$/dmt 67 72 83 100 80 69 MGX Free on Board (FOB) average realised fines price – Mid-West^ US$/dmt 28 41 44 29 37 30 MGX Free on Board (FOB) average realised lump price – Mid-West^ US$/dmt 56 70 58 36 61 59 MGX Free on Board (FOB) average realised fines price – Koolan* US$/dmt - - - 106 106 - kwmt = thousand wet metric tonnes US$/dmt = USD per dry metric tonne # Includes low-grade ore at Extension Hill grading 50-55% Fe that is considered to be saleable. This material was stockpiled for future sale and
treated as waste for accounting purposes. ^ Reflects the realised price after shipping freight and specification adjustments and penalties. Mid-West sales in the June 2019 quarter comprised
only shipments of low grade cargoes. * Reflects the realised fines price for Koolan comprising a mix of month of shipping (M) and M+2 averages, referencing the Platts 65% Fe Index,
and after adjustments for shipping freight, grade, provisional invoicing adjustments and penalties for impurities. Minor discrepancies may appear due to rounding.
Koolan Island
The Koolan Island mine is located in the Buccaneer Archipelago, approximately 140km north of Derby, in the Kimberley region of Western Australia. The primary focus of activity in the 2018/19 financial year was completion of all restart works and pre-production activities to recommence high grade ore production and sales from the Main Pit. Completion of the impermeable seepage barrier in the seawall embankment was achieved in July 2018, enabling pit dewatering to commence in August 2018, along with refurbishment of the Main Pit footwall and re-profiling of the Main Pit hanging wall.
Dewatering proceeded generally to plan, with the seawall coming under full tidal loads in November 2018. Blasting and waste mining in the upper levels of Main Pit also commenced at this time. All instrumentation and monitoring data continue to demonstrate the seawall is performing according to expectations. Mining access was gained to the first benches of high-grade ore in March 2019. The first shipment of high grade ore, averaging 65% Fe, was completed in late April 2019. Mining and ore production were progressively ramped up in the remaining two months of the financial year, and the site attained commercial production for reporting purposes at the end of May 2019. Five ore shipments totalling 370,000 wmt of high grade ore from Main Pit were completed during the June quarter. At year end, the site was on track to average 3-4 Panamax shipments per month, consistent with the initial period mine plan.
Total expenditure (cash and non-cash) on the Koolan restart project in the year comprised capitalised construction and pre-production costs of $38,799,000, capitalised waste mining costs of $65,615,000, the purchase of plant and equipment totalling $17,563,000 and the cost of sales of $34,572,000 FOB.
MOUNT GIBSON IRON LIMITED 2019 Annual Report 15

Production and shipping statistics for Koolan Island for the 2018/19 financial year are tabulated below:
Koolan Island Production Summary
Unit
SeptQuarter
2018 ’000
DecQuarter
2018 ’000
MarQuarter
2019 ’000
JunQuarter
2019 ’000
Year
2018/19 ’000
Year 2017/18
’000 Mining Waste mined wmt - 2,450 4,148 3,588 10,185 -Standard Ore mined wmt - - 8 544 552 - Crushing Lump wmt - - 1 133 134 -Fines wmt - - 4 292 297 - - - 5 425 431 -Shipping Lump wmt - - - - - -Fines wmt - - - 370 370 - - - - 370 370 -
Minor discrepancies may appear due to rounding.
Mid-West Operations - Extension Hill/Iron Hill
The Extension Hill mine and adjacent Iron Hill Deposit are located in the Mount Gibson Ranges, 85km east of Perenjori and 260km east south east of Geraldton in the Mid-West region of Western Australia. Mining was completed in the Extension Hill pit in late 2016, and commenced at the nearby Iron Hill deposit in early 2017.
Mining operations at Iron Hill were completed as planned in December 2018. The final shipment of high-grade direct-ship ore (DSO) was exported from Geraldton Port in late February 2019. Following renewed market interest in lower grade material, the Company commenced shipments of previously uneconomic stockpiled low-grade material from the Extension Hill mine site in June 2019. Four shipments totalling approximately 237,000 wmt were completed in the month of June. The program envisages total low grade shipments in the order of 1.0 Mwmt over a six month period, with the potential for any additional sales being dependent on future iron ore prices. The resulting cashflow from these sales is modest but assists in final site rehabilitation works.
Given the site rehabilitation activities completed to date, total site closure provisions have been revised down from $11,824,000 at 30 June 2018 to $9,853,000 at 30 June 2019.
The Mid-West Operations delivered a solid financial and operating performance in 2018/19. Ore shipments from Geraldton Port totalled 2,800,000 wmt, comprising 1,336,000 wmt of DSO lump, 1,227,000 wmt of DSO fines and 237,000 wmt of low grade material. The mine generated earnings before interest and tax of $60,801,000 reflecting the successful completion of mining in the Iron Hill open pit and the commencement of low grade sales.
Production and shipping statistics for Extension Hill for the 2018/19 financial year are tabulated below:
Extension Hill Production Summary
Unit
SeptQuarter
2018 ’000
DecQuarter
2018 ’000
MarQuarter
2019 ’000
JunQuarter
2019 ’000
Year 2018/19
’000
Year
2017/18 ’000
% Incr/(Decr)
Mining Waste mined wmt 195 57 - - 252 1,659 (85) Standard Ore mined wmt 959 757 - - 1,716 3,484 (51)Low Grade Ore mined* wmt 122 54 - - 176 601 (71)Total Ore Mined wmt 1,081 810 - - 1,892 4,085 (54) Crushing Lump wmt 542 535 32 248 1,357 1,874 (28)Fines wmt 510 445 24 137 1,116 1,633 (32) 1,052 980 57 385 2,474 3,507 (29)Transported to Perenjori Railhead
Lump wmt 531 504 73 156 1,264 1,867 (32)Fines wmt 504 463 70 174 1,211 1,622 (25) 1,035 967 143 330 2,475 3,489 (29)Transported to Geraldton Port Lump (Rail) wmt 540 508 146 135 1,329 2,058 (35)Fines (Rail) wmt 509 516 106 155 1,286 1,582 (19) 1,049 1,024 252 290 2,615 3,640 (28)Shipping Lump wmt 607 475 254 - 1,336 1,627 (18)Fines wmt 542 537 148 - 1,227 1,576 (22)Low Grade Lump wmt - - - 120 120 419 (71)Low Grade Fines wmt - - - 118 118 - - 1,149 1,012 402 237 2,800 3,622 (23)
* Low grade ore is material grading 50-55% Fe considered to be potentially saleable. This material was stockpiled for future sale and treated as waste for accounting purposes. Minor discrepancies may appear due to rounding.
16 MOUNT GIBSON IRON LIMITED 2019 Annual Report

Financial Position
The Group’s cash and cash equivalents, term deposits and subordinated notes and financial assets held for trading totalled $384,531,000 at 30 June 2019, a decrease of $73,003,000 from the balance at 30 June 2018 of $457,534,000.
The key components of the decrease included operating cashflows of $59,384,000, interest received of $11,628,000, Koolan Island mine development expenditure of $109,184,000, purchase of property, plant and equipment of $18,540,000 and payment of the $18,347,000 cash component of a fully franked dividend to shareholders.
As at the balance date, the Company’s current assets totalled $447,694,000 and its current liabilities totalled $73,143,000. As at the date of this report, the Group has sufficient funds in addition to access to further equity and debt funding to maintain its existing operations and to advance its growth objectives.
Derivatives
As at 30 June 2019, the Group held foreign exchange collar option contracts covering the conversion of US$11,500,000 into Australian dollars over the period July to October 2019 with an average cap price of A$1.00/US$0.7255 and an average floor price of A$1.00/US$0.6722. These collar contracts had a marked-to-market unrealised net gain at balance date of $33,000.
As at 30 June 2019, the Group held forward iron ore sales contracts covering three shipments totalling 210,000 dmt of iron ore, with maturity dates over the period July to September 2019. The average price for 62% Fe fines (CFR) at each maturity date is between US$86 and US$90 per tonne. These forward sales contracts had a marked-to-market unrealised loss of $6,039,000 at balance date.
Extension Hill Rail Refund/Credit
Following achievement of a contractual rail volume threshold at Extension Hill in 2018, the Group became entitled to receive a partial cash refund of historical rail access charges from the Mid-West railway leaseholder based upon the future usage by certain third parties of specific segments of the Perenjori to Geraldton railway line. This refund is calculated at various volume-related rates, and capped at a total of approximately $35 million (subject to indexation) and a time limit expiring in 2031. Receipt of the first payment is anticipated to occur at the end of September 2019, and at six month intervals thereafter, with payments dependent on the volumes railed by third parties on the specified rail segments. As at 30 June 2019, a refund totalling $2,458,000 relating to the period February 2019 to June 2019 was accrued.
CEO Succession and Executive Management Appointments
In September 2018, Mount Gibson announced the appointment of Mr Peter Kerr as Chief Executive Officer, succeeding Mr Jim Beyer, who tendered his resignation after almost seven years in the role to pursue another opportunity in the resources industry.
Mr Kerr commenced in the role of CEO on 1 October 2018, having initially joined Mount Gibson as Chief Financial Officer in September 2012. Mr Kerr has over 20 years’ experience in the resources sector, including past roles as CFO of ASX-listed uranium development company Bannerman Resources, managing director of ASX-listed gold developer Northern Gold NL and senior executive roles with Canadian miner Teck Cominco Ltd and Australian gold miner PacMin Mining Corporation Ltd.
Mount Gibson subsequently announced the promotion of Ms Gill Dobson to the positon of Chief Financial Officer, and Mr Scott de Kruijff as Chief Operating Officer. Ms Dobson is a highly experienced accountant and had been Group Commercial Manager at Mount Gibson since May 2013. Mr de Kruijff had been Mount Gibson’s General Manager Operations since July 2015, and initially joined the Company as General Manager Koolan Island in September 2013. Both Ms Dobson and Mr de Kruijff have a detailed knowledge of Mount Gibson’s operational and commercial activities, and sit on the Company’s Executive Management Committee.
Koolan Island Offtake Agreement
In June 2019, Mount Gibson approved the novation of the interests of Shougang Concord International Enterprises Company Limited and SCIT Trading Limited as guarantor and buyer respectively under their existing Koolan Island offtake agreement to HKSE-listed entity Newton Resources Ltd and its subsidiary Ace Profit Investment Limited. The novation was approved by Newton shareholders at a meeting in Hong Kong subsequent to year end on 24 July 2019. More details regarding the novation agreement were provided in the Company’s ASX release dated 3 June 2019.
Likely Developments and Expected Results
Mount Gibson’s overall objective is to grow long-term profitability through the discovery, development, operation and acquisition of mineral resources. As an established producer and exporter of hematite iron ore, Mount Gibson’s strategy is to expand its profile as a successful and profitable supplier of raw materials.
Key influences on the success of Mount Gibson are not only iron ore prices and foreign exchange rates but also operational performance, consistency in government policy, the continued attainment of regulatory approvals, the ability to delineate new mineral resources and ore reserves, and the continued control of operating and capital costs.
The Board’s corporate objective is to grow the Company’s cash reserves and continue to pursue an appropriate balance between the retention and utilisation of cash reserves for value-accretive investments. The Board has determined the following key business objectives for the 2019/20 financial year:
• Extension Hill - complete the current program of Extension Hill low-grade sales, and extend the program should favourable market prices continue. Thereafter, transition the site to final closure.
• Koolan Island - complete the ramp-up of ore production and sales in line with the mine plan to maximise cashflow and capitalise on favourable market conditions.
• Cost reductions - continue to drive for sustainable cost improvements across the existing business.
• Treasury returns - maintain an appropriate yield on the Group’s cash and investment reserves.
• Growth projects - continue the search for acquisition opportunities in the resources sector.
MOUNT GIBSON IRON LIMITED 2019 Annual Report 17

Group Sales Guidance and Cash Costs Guidance
Mount Gibson expects total sales of 3.7-4.0 Mwmt of iron ore at an average all-in group cash cost of $70-75/wmt FOB for the 2019/20 financial year. Group cash costs are reported FOB and include all operating, capital, royalties and corporate costs.
Koolan Island is expected to contribute 2.7-3.0 Mwmt of high grade DSO ore based on the current schedule, with site cash costs expected to average $72-77/wmt FOB. Unit costs at Koolan Island are projected to progressively decline over the mine life in line with the mine schedule as the strip ratio reduces each year.
The Mid-West business is expected to contribute 1.0 Mwmt at an average cash cost of $40-45/wmt FOB, comprising the sale of remnant low grade material from stockpiles at Extension Hill.
DIVIDENDS
During the year, a final dividend of $0.03 per share fully franked ($32,987,000) in respect of the 2017/18 financial year was distributed by way of $18,347,000 in cash and the issue of 29,883,486 new shares under the Company’s Dividend Reinvestment Plan.
On 20 August 2019, the Company declared a final dividend on ordinary shares in respect of the 2018/19 financial year of $0.04 per share fully franked, payable either in cash or in shares to eligible shareholders as part of the Company’s Dividend Reinvestment Plan. The total amount of the dividend is $45,203,000. The dividend has not been provided for in the 30 June 2019 financial statements.
SIGNIFICANT EVENTS AFTER BALANCE DATE
Other than the final dividend declared by the Company on 20 August 2019 noted above, as at the date of this report there are no significant events after balance date of the Company or of the Group that require adjustment of or disclosure in this report.
INDEMNIFICATION AND INSURANCE OF DIRECTORS, OFFICERS AND AUDITORS
The Company has, during current or previous financial periods, entered into deeds of access and indemnity with certain Directors. These deeds provide access to documentation and indemnification against liability for loss suffered, as a result of any act or omission, to the extent permitted by the Corporations Act 2001, from conduct of the Group’s business.
During the financial year, the Company paid a premium in respect of a contract insuring the Directors of the Company, the Company Secretary and all Executive Officers of the Company and of any related body corporate against a liability incurred as such a Director, Company Secretary or Executive Officer to the extent permitted by the Corporations Act 2001.
The Directors have not included details of the nature of the liabilities covered or the amount of the premium paid in respect of the directors’ and officers’ liability and legal expenses’ insurance contracts, as such disclosure is prohibited under the terms of the contracts.
The Company has agreed to indemnify its auditors, EY, to the fullest extent possible as part of the terms of its audit engagement agreement against claims by third parties arising from the audit (for an unspecified amount). No payment has been made to indemnify EY during or since the financial year.
The Company has not otherwise, during or since the end of the financial year, except to the extent permitted by law, indemnified or agreed to indemnify an officer or auditor of the Company or any related body corporate against a liability incurred as such an officer or auditor.
SHARE OPTIONS, PERFORMANCE RIGHTS AND RESTRICTED SHARES
There were no options exercised or forfeited during the financial year or prior to the date of this Report. There are no options over ordinary shares in the Company on issue as at balance date and as at the date of this Report.
There were no Performance Rights vested and exercised during the year. There are no Performance Rights on issue as at balance date and as at the date of this Report.
On 2 July 2018, the Company issued 2,998,351 restricted shares and subsequently, 1,074,623 restricted shares were forfeited upon the resignation of Mr Jim Beyer on 30 September 2018. There were 4,504,295 restricted shares on issue at balance date and, following an issue made after balance date, there are 6,210,095 restricted shares on issue as at the date of this report.
Refer to the Remuneration Report for further details of shares outstanding.
DIRECTORS’ INTERESTS IN THE SHARES, OPTIONS AND PERFORMANCE RIGHTS OF THE COMPANY
As at the date of this report, the interests of the Directors in the Shares and Options of the Company were:
Ordinary Shares Options over Shares Performance Rights over Shares
Lee Seng Hui(i) - - -A Jones 300,000 - -Li Shaofeng - - -R Barwick - - -S Bird 45,239 - -P Dougas 702,605 - -A Ferguson (Alternate for Mr Lee) - - -
(i) For the purposes of Corporations Act Regulation 2M.3.03(1)-Item 18, Mr Lee does not have a disclosable shareholding. However, we note that for purposes of ASX Listing Rule 3.19A.2, Mr Lee has previously declared an indirect “relevant interest” in 374,926,081 ordinary shares in the Company through his association with Allied Group Limited, a substantial shareholder of the Company – refer ASX announcement dated 15 October 2018.
18 MOUNT GIBSON IRON LIMITED 2019 Annual Report
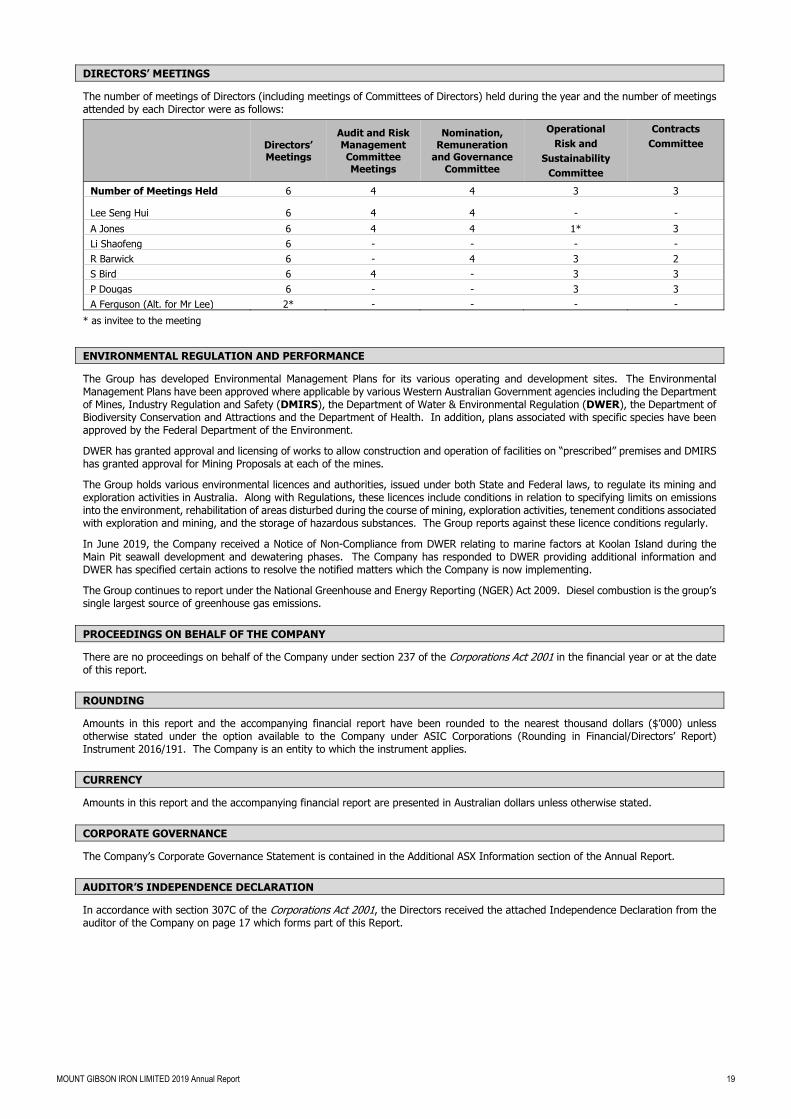
DIRECTORS’ MEETINGS
The number of meetings of Directors (including meetings of Committees of Directors) held during the year and the number of meetings attended by each Director were as follows:
Directors’ Meetings
Audit and Risk Management Committee Meetings
Nomination, Remuneration
and Governance Committee
Operational Risk and
Sustainability Committee
Contracts Committee
Number of Meetings Held 6 4 4 3 3
Lee Seng Hui 6 4 4 - - A Jones 6 4 4 1* 3Li Shaofeng 6 - - - -R Barwick 6 - 4 3 2S Bird 6 4 - 3 3P Dougas 6 - - 3 3A Ferguson (Alt. for Mr Lee) 2* - - - -
* as invitee to the meeting
ENVIRONMENTAL REGULATION AND PERFORMANCE
The Group has developed Environmental Management Plans for its various operating and development sites. The Environmental Management Plans have been approved where applicable by various Western Australian Government agencies including the Department of Mines, Industry Regulation and Safety (DMIRS), the Department of Water & Environmental Regulation (DWER), the Department of Biodiversity Conservation and Attractions and the Department of Health. In addition, plans associated with specific species have been approved by the Federal Department of the Environment.
DWER has granted approval and licensing of works to allow construction and operation of facilities on “prescribed” premises and DMIRS has granted approval for Mining Proposals at each of the mines.
The Group holds various environmental licences and authorities, issued under both State and Federal laws, to regulate its mining and exploration activities in Australia. Along with Regulations, these licences include conditions in relation to specifying limits on emissions into the environment, rehabilitation of areas disturbed during the course of mining, exploration activities, tenement conditions associated with exploration and mining, and the storage of hazardous substances. The Group reports against these licence conditions regularly.
In June 2019, the Company received a Notice of Non-Compliance from DWER relating to marine factors at Koolan Island during the Main Pit seawall development and dewatering phases. The Company has responded to DWER providing additional information and DWER has specified certain actions to resolve the notified matters which the Company is now implementing.
The Group continues to report under the National Greenhouse and Energy Reporting (NGER) Act 2009. Diesel combustion is the group’s single largest source of greenhouse gas emissions.
PROCEEDINGS ON BEHALF OF THE COMPANY
There are no proceedings on behalf of the Company under section 237 of the Corporations Act 2001 in the financial year or at the date of this report.
ROUNDING
Amounts in this report and the accompanying financial report have been rounded to the nearest thousand dollars ($’000) unless otherwise stated under the option available to the Company under ASIC Corporations (Rounding in Financial/Directors’ Report) Instrument 2016/191. The Company is an entity to which the instrument applies.
CURRENCY
Amounts in this report and the accompanying financial report are presented in Australian dollars unless otherwise stated.
CORPORATE GOVERNANCE
The Company’s Corporate Governance Statement is contained in the Additional ASX Information section of the Annual Report.
AUDITOR’S INDEPENDENCE DECLARATION
In accordance with section 307C of the Corporations Act 2001, the Directors received the attached Independence Declaration from the auditor of the Company on page 17 which forms part of this Report.
MOUNT GIBSON IRON LIMITED 2019 Annual Report 19

AUDIT PARTNER ROTATION
On 13 November 2018, the Board granted approval pursuant to section 324DAC of the Corporations Act 2001 (Cth), for Mr Gavin Buckingham of Ernst & Young to play a significant role in the audit of the Company for an additional two financial years through to the financial year ending 30 June 2021.
The Board considered the matters set out in section 324DAB(3) of the Act and is satisfied that the approval: [i] is consistent with maintaining the quality of the audit provided to the Company; and [ii] would not give rise to a conflict of interest situation.
Reasons supporting this decision include: o the benefits associated with the continued retention of knowledge regarding key audit matters; o the Board being satisfied with the quality of Ernst & Young and Mr Buckingham’s work as auditor; and o the Company’s ongoing governance processes to ensure the independence of the auditor is maintained.
NON-AUDIT SERVICES
The Directors are satisfied that the provision of non-audit services is compatible with the general standard of independence for auditors imposed by the Corporations Act 2001. There were no non-audit services provided by Ernst & Young during the financial year ended 30 June 2019.
20 MOUNT GIBSON IRON LIMITED 2019 Annual Report

REMUNERATION REPORT (AUDITED)
This Remuneration Report outlines the remuneration arrangements in place for Directors and Key Management Personnel of the Group in accordance with the requirements of the Corporations Act 2001 and its Regulations.
For the purposes of this report Key Management Personnel of the Group are defined as those persons having authority and responsibility for planning, directing and controlling the major activities of the Group, directly or indirectly, including any directors of the Company.
Nomination, Remuneration and Governance Committee (NRGC)
The NRGC comprises two independent Non-Executive Directors, being Messrs Jones (Chairman) and Barwick, and one non-independent Non-Executive Director, being Mr Lee, the Chairman of the Board.
The NRGC of the Board of Directors of the Company is responsible for determining and reviewing remuneration arrangements for the Board and Key Management Personnel.
The NRGC assesses the appropriateness of the nature and amount of remuneration of Key Management Personnel on a periodic basis by reference to relevant employment market conditions with the overall objective of ensuring maximum stakeholder benefit from the retention of a high quality, high performing Board and executive team.
Remuneration Policy
The Remuneration Policy of the Group has been put in place to ensure that:
remuneration policies and systems support the Company’s wider objectives and strategies;
Directors’ and senior executives’ remuneration is aligned to the long-term interests of shareholders within an appropriate control framework; and
there is a clear relationship between the executives’ performance and remuneration.
Remuneration Structure
In accordance with best practice corporate governance, the structure of Non-Executive Director and senior executive management remuneration is separate.
Non-Executive Director Remuneration
Objective
The Board seeks to set aggregate remuneration at a level which provides the Company with the ability to attract and retain Directors of the highest calibre, whilst incurring a cost which is acceptable to shareholders.
Structure
The Constitution and the ASX Listing Rules specify that the aggregate remuneration of Non-Executive Directors shall be determined from time to time by a general meeting of shareholders. An amount not exceeding the amount determined is then divided between the Non-Executive Directors as agreed. The latest determination was at the Annual General Meeting held on 16 November 2011 when Shareholders approved an aggregate remuneration of $1,250,000 per year. Total Non-Executive Director fees of $513,125 were paid in the 2018/19 financial year.
Each Non-Executive Director receives a fee for being a Director of the Company.
Non-Executive Directors should be adequately remunerated for their time and effort and the risks involved. Non-Executive Directors are remunerated to recognise the responsibilities, accountabilities and associated risks of Directors.
Each Non-Executive Director’s performance and remuneration is reviewed on an annual basis by the Chairman and NRGC.
Non-Executive Directors’ fixed remuneration comprises the following elements:
cash remuneration; and
superannuation contributions made by the Company.
Board operating costs do not form part of Non-Executive Directors’ remuneration.
Senior Executives’ Remuneration
Objective
The Company aims to reward senior executives with a level and mix of remuneration commensurate with their position and responsibilities within the Company and so as to:
reward senior executives for Company and individual performance contributing towards key Company objectives;
align the interests of senior executives with those of shareholders;
link reward with the strategic goals and performance of the Company; and
ensure total remuneration is competitive by market standards.
Use of Remuneration Consultants
The NRGC from time to time seeks advice from independent remuneration consultants regarding senior executives’ remuneration structures and levels. Such consultants are engaged by, and report directly to, the NRGC, and are required to confirm in writing their independence from the Group’s senior and other executives. No remuneration consultants were appointed for this purpose during the 2018/19 financial year.
MOUNT GIBSON IRON LIMITED 2019 Annual Report 21

Fixed Remuneration
The components of the senior executives’ fixed remuneration are determined individually and may include:
cash remuneration;
superannuation;
accommodation and travel benefits;
motor vehicle, parking and other benefits; and
reimbursement of entertainment, home office and telephone expenses.
The senior executives’ remuneration is reviewed on an annual basis by the Chief Executive Officer, whose remuneration is reviewed annually by the NRGC.
In determining the remuneration package, the NRGC reviews the individual’s remuneration with the use of market data for positions with comparable companies. Where appropriate, the package is adjusted so as to keep pace with market trends and ensure continued remuneration competitiveness. In conducting a comparative analysis, the Company’s expected performance for the year is considered in the context of the Company’s capacity to fund remuneration budgets.
Variable Remuneration
Short-term Incentives (STI)
Senior executives may receive variable remuneration in the form of STI of up to 50% of their annual salary package. STI payments are based on the Board’s assessment of the executive’s performance towards achieving key Company objectives over the relevant period. Whilst no specific performance hurdles are set, the primary focus for the 2018/19 financial year was on achieving key milestones towards restart of the Koolan Island operation. The total potential STI available for award is ultimately at the Board’s discretion.
On an annual basis, the performance of each senior executive is reviewed immediately prior to or just after the reporting date. The NRGC then determines the amount of STI to be allocated to each executive with approval from the Board. Payments are made in cash after the reporting date.
The Board exercised its discretion to make an award for the 2018/19 financial year based on the achievement of a number of milestones including the commencement of mining operations at Koolan Island and the commencement of shipments of the low grade material from the Extension Hill mine site.
Accordingly, for the 2018/19 financial year, a total STI cash incentive of $712,300 was awarded to Key Management Personnel, representing 80% of the total STI cash incentives available to Mr Kerr, Mr de Kruijff, Mr Stokes and Ms Dobson. The amount of the STI is included in the Company’s financials for the year and was paid after year-end.
In addition to the 2018/19 STI award, during the year, a total STI cash incentive of $397,639 in relation to the 2017/18 financial year was awarded to Key Management Personnel, representing 65% of the total STI cash incentives available to Messrs Kerr, de Kruijff and Stokes. The 2017/18 STI award was deferred from the prior year to take into account the activities associated with the completion of the Koolan Island Main Pit seawall and return of the site to operational status, and was paid in December 2018.
Long-term Incentives (LTI)
The Company previously established a Performance Rights Plan (PRP) in the 2008 financial year. Under the PRP, the Board may invite eligible executives to apply for Performance Rights, which are an entitlement to receive ordinary shares in the Company, subject to satisfaction by the executive of specified performance hurdles set by the Board. The last grant of performance rights under the PRP was made in the 2015/16 financial year. There were no performance rights on issue at the start of the 2018/19 financial year, and no grants of new performance rights under the PRP were made during the year.
A new LTI plan, known as the Loan Share Plan (LSP), was established in August 2016. Under the LSP, ordinary shares in the Company may be issued to eligible participants, with vesting of the shares being subject to the satisfaction of stipulated performance conditions. The shares are issued at their market value with the recipient required to pay this market value in order to take up the share offer. The Company or any of its subsidiaries will provide a loan to fund the acquisition price. The loan is interest-free and is secured against the shares in the form of a holding lock preventing all dealing in the shares. The loan is limited recourse such that if the shares do not ultimately vest and are therefore forfeited, this is treated as full repayment of the loan balance. While the loan balance remains outstanding, any dividends paid on the shares, net of the tax on the dividends, will be automatically applied towards repayment of the loan. In making the loan in respect of the newly issued shares, there is no cash cost to the Company as the shares are newly issued.
On 2 July 2018, the Company issued a total of 2,998,351 shares to Messrs Beyer, Kerr, Stokes and de Kruijff under the LSP, representing 75% of their entitlement for LTI awards equating to one third of their base salaries (including superannuation). In accordance with the terms of the LSP, the shares were issued at a market price of $0.443 per share. In order for the shares to vest, the participants must remain continuously employed by the Group to at least the end of the 2018/19 financial year and the Company’s share price, as measured by a rolling five day volume weighted average price of the Company’s shares traded on the ASX, must on 1 July 2019 or at any time during the following four year period be above a 10% premium to the issue price of the shares. The award was accounted for as an in-substance option award, with the fair value at grant date assessed at $0.159 per share. These performance conditions were selected in order to maximise shareholder returns.
On 30 September 2018, 1,074,623 shares under the LSP were forfeited upon the resignation of Mr Jim Beyer. A total of 1,923,728 shares vested after balance date in July 2019 as the participants had remained continuously employed by the Group since issue and the Company’s share price, as measured by a rolling five day volume weighted average price of the Company’s shares traded on the ASX on 2 July 2019, was above a 10% premium to the issue price of the shares.
The Company has a policy restricting executives from entering into arrangements to protect the value of unvested LTI entitlements under equity-based remuneration plans.
22 MOUNT GIBSON IRON LIMITED 2019 Annual Report

Employment Contracts
As at the date of this report, the Group had entered into employment contracts with the following executives:
Peter Kerr
The key terms of his contract include: Commenced as Chief Financial Officer on 19 September 2012 and subsequently appointed as Chief Executive Officer 1 October 2018
with no set term; Annual Salary Package increase by minimum of CPI from 1 July every year; STI Bonus of up to one half of Annual Salary Package; LTI Bonus of up to one third of Annual Salary Package; and If the Company wishes to terminate the contract other than if Mr Kerr is guilty of any grave misconduct, serious or persistent
breach of the terms of the contract or wilful neglect in the discharge of his duties, the Company is obliged to pay out 12 months Annual Salary Package plus any other accrued entitlements and bonuses. If Mr Kerr wishes to terminate the contract, he must provide six months’ notice.
David Stokes
The key terms of his contract include: Commenced 2 April 2012 with no set term; Annual Salary Package increase by minimum of CPI from 1 July every year; STI Bonus of up to one half of Annual Salary Package; LTI Bonus of up to one third of Annual Salary Package; and If the Company wishes to terminate the contract other than if Mr Stokes is guilty of any grave misconduct, serious or persistent
breach of the terms of the contract or wilful neglect in the discharge of his duties, the Company is obliged to pay out 12 months Annual Salary Package plus any other accrued entitlements and bonuses. If Mr Stokes wishes to terminate the contract, he must provide six months’ notice.
Scott de Kruijff
The key terms of his contract include: Commenced as General Manager Koolan Island on 17 September 2013, appointed General Manager Operations on 1 July 2015 and
subsequently appointed as Chief Operating Officer on 1 October 2018 with no set term; Annual Salary Package increase by minimum of CPI from 1 July every year; STI Bonus of up to one half of Annual Salary Package; LTI Bonus of up to one third of Annual Salary Package; and If the Company wishes to terminate the contract other than if Mr de Kruijff is guilty of any grave misconduct, serious or persistent
breach of the terms of the contract or wilful neglect in the discharge of his duties, the Company is obliged to pay out 6 months Annual Salary Package plus any other accrued entitlements and bonuses. If Mr de Kruifff wishes to terminate the contract, he must provide three months’ notice.
Gillian Dobson
The key terms of her contract include: Commenced as Group Commercial Manager on 23 April 2013 and subsequently appointed as Chief Financial Officer on 1 October
2018 with no set term; Annual Salary Package increase by minimum of CPI from 1 July every year; STI Bonus of up to one half of Annual Salary Package; LTI Bonus of up to one third of Annual Salary Package; and If the Company wishes to terminate the contract other than if Ms Dobson is guilty of any grave misconduct, serious or persistent
breach of the terms of the contract or wilful neglect in the discharge of his duties, the Company is obliged to pay out 6 months Annual Salary Package plus any other accrued entitlements and bonuses. If Ms Dobson wishes to terminate the contract, she must provide three months’ notice.
Details of directors and key management personnel disclosed in this report
[i] Directors
Lee Seng Hui Chairman A Jones Non-Executive Director Li Shaofeng Non-Executive Director R Barwick Non-Executive Director S Bird Lead Non-Executive Director P Dougas Non-Executive Director A Ferguson Alternate Director to Mr Lee [ii] Key Management Personnel P Kerr Chief Executive Officer (from 1 October 2018), previously Chief Financial Officer (until 30 September 2018) D Stokes Company Secretary and General Counsel S de Kruijff Chief Operating Officer (from 1 October 2018), previously General Manager – Operations (until 30 September 2018) G Dobson Chief Financial Officer (from 1 October 2018), previously Group Commercial Manager (until 30 September 2018) J Beyer Chief Executive Officer (resigned 30 September 2018)
MOUNT GIBSON IRON LIMITED 2019 Annual Report 23

Remuneration of Key Management Personnel for the year ended 30 June 2019
Short Term Post Employment Long Term Share Based
Payment
Salary & Fees
Non Monetary
(a) Cash
Incentives
Accrued Annual
Leave(c) Super-
annuation Long Service
Leave(d) Loan Share
Plan(e) Total
% Perform-
ance Related
30 June 2019 $ $ $ $ $ $ $ $
Directors Lee Seng Hui 95,548 - - - 9,077 - - 104,625 - A Jones 94,521 - - - 8,979 - - 103,500 - Li Shaofeng - - - - - - - - - R Barwick 94,521 - - - 8,979 - - 103,500 - S Bird 101,370 - - - 9,630 - - 111,000 - P Dougas 90,500 - - - - - - 90,500 - A Ferguson (Alt) - - - - - - - - - Sub-total 476,460 - - - 36,665 - - 513,125 Other KMP P Kerr 541,793 15,624 390,090(b) 12,657 25,000 50,953 114,760 1,150,877 44 D Stokes 326,337 13,351 257,999(b) - 31,002 27,700 88,537 744,926 47 S de Kruijff 408,958 14,568 317,350(b) - 38,851 15,727 102,576 898,030 47 G Dobson 306,574 11,109 144,500 9,493 29,125 14,500 - 515,301 28 J Beyer(f) 417,688 17,650 - - 39,680 - - 475,018 - Sub-total 2,001,350 72,302 1,109,939 22,150 163,658 108,880 305,873 3,784,152 Totals 2,477,810 72,302 1,109,939 22,150 200,323 108,880 305,873 4,297,277
(a) Non-Monetary items include the value (where applicable) of benefits such as group life insurance cover that are available to all employees of Mount Gibson and car parking, and are inclusive of Fringe Benefits Tax where applicable.
(b) Cash incentives represent the cash value of the executives’ short-term incentive awards for the 2018/19 year of $712,300 and also include the deferred short term incentive award from the prior 2017/18 financial year of $397,639 (P Kerr $149,190, D Stokes $115,099, S de Kruijff $133,350). Refer to “Short-term Incentives” section above.
(c) Annual leave has been separately categorised and is measured on an accrual basis and reflects the movement in the accrual over the twelve-month period. Any reduction in accrued leave reflects more leave taken or cashed out than that which accrued in the period.
(d) Represents the accrual for long service leave over the twelve-month period. (e) The fair values of the awards under the Loan Share Plan (restricted shares), which are inclusive of an assumed dividend yield, were calculated as at the grant date and represent
the accounting expense incurred by the Company for the stated financial period, reflecting the terms of the particular restricted shares. The amount included as remuneration is not related to or indicative of the benefit (if any) that individual executives may in fact receive.
(f) Mr Jim Beyer resigned effective 30 September 2018.
Options
There were no options granted to Directors or Executives during the year ended 30 June 2019 and there were no options outstanding as at 30 June 2019. There were no shares issued on the exercise of options during the year ended 30 June 2019 (2018: nil).
24 MOUNT GIBSON IRON LIMITED 2019 Annual Report

Shares
On 2 July 2018, a total of 2,998,351 restricted shares were granted under the LSP. The award has been accounted for as an in-substance option award with the fair value assessed at grant date as $0.159 per LSP share. On 30 September 2018, 1,074,623 shares under the LSP were forfeited upon the resignation of Mr Jim Beyer. Refer section above titled “Long-term Incentives” for details of the shares issued under the LSP.
Grant Date
LSP Shares
Granted (#)
Fair Value at Grant
Date1 ($/LSP share)
Value of LSP
Shares Granted
($)
Exercise Price ($)
Vesting Date & Condit-
ions Expiry Date
LSP Shares Vested in Year
(#)
Value of LSP Shares Vested in
Year3 ($)
J Beyer 2-Jul-18 1,074,623 $0.159 -4 -4 Note 2 1-Jul-24 - -P Kerr 2-Jul-18 721,762 $0.159 $114,760 $0.443 Note 2 1-Jul-24 - -D Stokes 2-Jul-18 556,835 $0.159 $88,537 $0.443 Note 2 1-Jul-24 - -S de Kruijff 2-Jul-18 645,131 $0.159 $102,576 $0.443 Note 2 1-Jul-24 - -Total 2,998,351 $305,873 - - 1. Determined at the time of grant per AASB 2, refer note 25(d) in the financial statements. 2. In order for the LSP shares to vest, participants must remain continuously employed by the Group to at least the end of the financial year and the Company’s
share price, as measured by a rolling 5-day volume weighted average price of the Company’s shares traded on the ASX, must on 1 July 2019 or at any time prior to expiry, be above a 10% premium to the issue price of the LSP shares.
3. Determined at the time of exercise at the intrinsic value of the LSP share. 4. LSP shares forfeited upon the resignation of Mr Jim Beyer on 30 September 2018.
During the year ended 30 June 2019, there were no alterations to the terms and conditions of LSP shares after their grant date.
Performance Rights
There were no performance rights granted as part of remuneration, or vested and exercised, during the year ended 30 June 2019. At 30 June 2019, there were no Performance Rights on issue. There were no shares issued on the exercise of Performance Rights during the year ended 30 June 2019 (2018: nil).
Shareholdings of Key Management Personnel as at 30 June 2019
Balance
1 July 2018 Granted as
Remuneration Forfeited Net Change
Other Balance
30 June 2019 Ord Ord Ord Ord OrdDirectors Lee Seng Hui(i) - - - - -A Jones 300,000 - - - 300,000Li Shaofeng - - - - -R Barwick - - - - -S Bird 20,000 - - 25,239 45,239P Dougas 284,944 - - 417,661 702,605A Ferguson (Alt. for Mr Lee) - - - - -
Other KMP(ii) P Kerr 1,739,681 721,762 - - 2,461,443D Stokes 1,347,336 556,835 - - 1,904,171S de Kruijff - 645,131 - - 645,131G Dobson - - - - -J Beyer 2,911,068 1,074,623 (1,074,623) (2,571,151) 339,917Total 6,603,029 2,998,351 (1,074,623) (2,128,251) 6,398,506
(i) For the purposes of Corporations Act Regulation 2M.3.03(1)-Item 18, Mr Lee does not have a disclosable shareholding. However, we note that for purposes of ASX Listing Rule 3.19A.2, Mr Lee has previously declared an indirect “relevant interest” in 374,926,081 ordinary shares in the Company through his association with Allied Group Limited, a substantial shareholder of the Company – refer ASX announcement dated 15 October 2018.
(ii) The closing balance at 30 June 2019 for Other KMP includes 4,504,295 LSP shares (in-substance options) held by Messrs. Kerr (2,178,478 LSP shares), Stokes (1,680,686 LSP shares) and de Kruijff (645,131 LSP shares), of which 2,580,567 LSP shares held by Messrs. Kerr (1,456,716 LSP shares) and Stokes (1,123,851 LSP shares) had vested as at balance date. The balance of the LSP shares vested shortly after balance date.
MOUNT GIBSON IRON LIMITED 2019 Annual Report 25

Remuneration of Key Management Personnel for the year ended 30 June 2018
Short Term Post Employment Long Term
Salary & Fees
Non Monetary(a)
Cash Incentives(b)
Accrued Annual
Leave(c) Super-
annuation Long Service
Leave(d) Total(e)
% Perform-
ance Related
30 June 2018 $ $ $ $ $ $ $
Directors Lee Seng Hui 95,548 - - - 9,077 - 104,625 - A Jones 90,868 - - - 8,632 - 99,500 - Li Shaofeng - - - - - - - - R Barwick 90,868 - - - 8,632 - 99,500 - S Bird 97,717 - - - 9,283 - 107,000 - P Dougas 86,500 - - - - - 86,500 - K Chan 37,987 - - - 3,646 - 41,633 - A Ferguson (Alt) - - - - - - - - Sub-total 499,488 - - - 39,270 - 538,758 Other KMP J Beyer 624,171 17,510 170,865 4,788 59,296 46,409 923,039 19 P Kerr 434,045 12,778 114,760 (3,216) 25,000 13,641 597,008 19 D Stokes 323,426 10,566 88,537 4,962 30,725 11,249 469,465 19 S de Kruijff 374,710 11,750 237,989 (4,312) 35,597 4,468 660,202 36 Sub-total 1,756,352 52,604 612,151 2,222 150,618 75,767 2,649,714 Totals 2,255,840 52,604 612,151 2,222 189,888 75,767 3,188,472
(a) Non-Monetary items include the value (where applicable) of benefits such as group life insurance that are available to all employees of Mount Gibson and car parking, and are inclusive of Fringe Benefits Tax where applicable.
(b) Cash incentives represent short term incentives awarded during the year and paid after year-end. Consideration of the formal short term incentive for the 2017/18 year was deferred to 2018/19.
(c) Annual leave has been separately categorised and is measured on an accrual basis and reflects the movement in the accrual over the twelve-month period. Any reduction in accrued leave reflects more leave taken or cashed out than that which accrued in the period.
(d) Represents the accrual for long service leave over the twelve-month period. (e) The amount of dividends paid to KMP disclosed in the 30 June 2018 financial report was $94,989. The comparative figure has been adjusted to remove the dividends
paid to KMPs as these were embedded in the calculation of the fair value of the LSP shares at grant date.
Other Transactions and Balances with Key Management Personnel
There were no other transactions and balances with key management personnel during the years ended 30 June 2019 and 30 June 2018.
Company Performance
The table below shows the performance of the Group over the last 5 years:
30 June 2019 30 June 2018 30 June 2017 30 June 2016 30 June 2015
Net profit/(loss) after tax $’000 133,369 99,129 26,322 86,297 (911,422) Earnings/(loss) per share $/share 0.1198 0.0908 0.0241 0.0791 (0.8356) Closing share price $ 1.02 0.43 0.33 0.26 0.20
End of remuneration report.
Signed in accordance with a resolution of the Directors.
LEE SENG HUI Chairman Sydney, 20 August 2019
26 MOUNT GIBSON IRON LIMITED 2019 Annual Report

A member firm of Ernst & Young Global Limited GB:JG:MGI:258 Liability limited by a scheme approved under Professional Standards Legislation
Ernst & Young 11 Mounts Bay Road Perth WA 6000 Australia GPO Box M939 Perth WA 6843
Tel: +61 8 9429 2222 Fax: +61 8 9429 2436 ey.com/au
Auditor’s Independence Declaration to the Directors of Mount Gibson Iron Limited
As lead auditor for the audit of the financial report of Mount Gibson Iron Limited for the financial year ended 30 June 2019, I declare to the best of my knowledge and belief, there have been:
a) no contraventions of the auditor independence requirements of the Corporations Act 2001 inrelation to the audit; and
b) no contraventions of any applicable code of professional conduct in relation to the audit.
This declaration is in respect of Mount Gibson Iron Limited and the entities it controlled during the financial year.
Ernst & Young
Gavin BuckinghamPartner20 August 2019
MOUNT GIBSON IRON LIMITED 2019 Annual Report 27
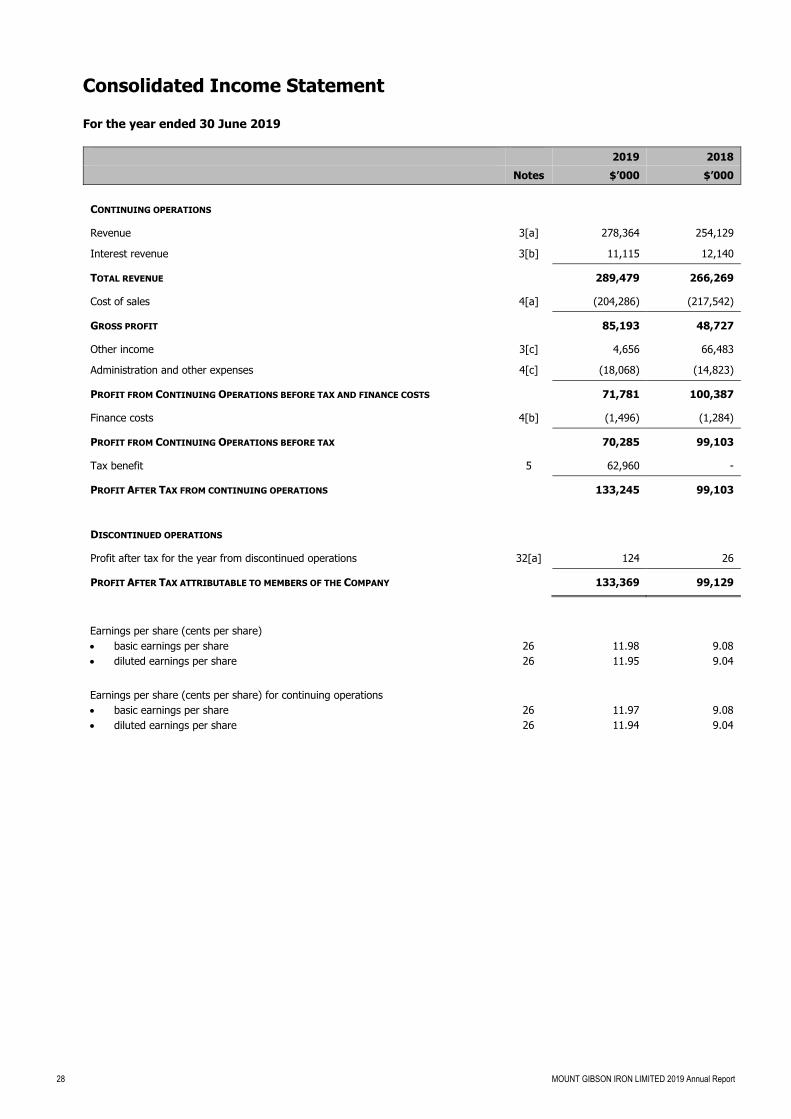
Consolidated Income Statement For the year ended 30 June 2019
2019 2018 Notes $’000 $’000
CONTINUING OPERATIONS
Revenue 3[a] 278,364 254,129
Interest revenue 3[b] 11,115 12,140
TOTAL REVENUE 289,479 266,269
Cost of sales 4[a] (204,286) (217,542)
GROSS PROFIT 85,193 48,727
Other income 3[c] 4,656 66,483
Administration and other expenses 4[c] (18,068) (14,823)
PROFIT FROM CONTINUING OPERATIONS BEFORE TAX AND FINANCE COSTS 71,781 100,387
Finance costs 4[b] (1,496) (1,284)
PROFIT FROM CONTINUING OPERATIONS BEFORE TAX 70,285 99,103
Tax benefit 5 62,960 -
PROFIT AFTER TAX FROM CONTINUING OPERATIONS 133,245 99,103
DISCONTINUED OPERATIONS
Profit after tax for the year from discontinued operations 32[a] 124 26
PROFIT AFTER TAX ATTRIBUTABLE TO MEMBERS OF THE COMPANY 133,369 99,129
Earnings per share (cents per share) basic earnings per share 26 11.98 9.08 diluted earnings per share 26 11.95 9.04 Earnings per share (cents per share) for continuing operations basic earnings per share 26 11.97 9.08 diluted earnings per share 26 11.94 9.04
28 MOUNT GIBSON IRON LIMITED 2019 Annual Report

Consolidated Statement of Comprehensive Income For the year ended 30 June 2019
2019 2018 $’000 $’000
PROFIT FOR THE PERIOD AFTER TAX 133,369 99,129
OTHER COMPREHENSIVE INCOME
Items that may be subsequently reclassified to profit or loss
Change in fair value of cash flow hedges (179) (325)
Reclassification adjustments for loss on cash flow hedges transferred to the Income Statement 358 (86)
Change in fair value of available for sale financial assets - 982
Change in fair value of debt instruments classified as financial assets at fair value through other comprehensive income (122) -
OTHER COMPREHENSIVE INCOME FOR THE YEAR, NET OF TAX 57 571
TOTAL COMPREHENSIVE INCOME FOR THE YEAR 133,426 99,700
MOUNT GIBSON IRON LIMITED 2019 Annual Report 29

Consolidated Balance Sheet As at 30 June 2019
2019 2018 Notes $’000 $’000
ASSETS
Current Assets
Cash and cash equivalents 6 48,850 46,547 Term deposits and subordinated notes 7 297,482 377,030 Financial assets held for trading 8 38,199 33,957 Trade and other receivables 9 34,640 7,843 Inventories 10 24,289 23,321 Prepayments 4,198 3,374 Derivative financial assets 11 36 - Total Current Assets 447,694 492,072
Non-Current Assets Property, plant and equipment 13 21,717 7,734 Mine properties 15 194,994 87,781 Prepayments 1,929 2,370 Deferred tax assets 5 62,907 - Total Non-Current Assets 281,547 97,885 TOTAL ASSETS 729,241 589,957
LIABILITIES Current Liabilities Trade and other payables 17 55,194 42,078 Employee benefits 3,495 3,336 Interest-bearing loans and borrowings 18 1,753 - Derivative financial liabilities 19 6,042 325 Provisions 20 6,659 6,539 Total Current Liabilities 73,143 52,278
Non-Current Liabilities Employee benefits 283 489 Provisions 20 43,003 40,366 Total Non-Current Liabilities 43,286 40,855 TOTAL LIABILITIES 116,429 93,133 NET ASSETS 612,812 496,824
EQUITY Issued capital 21 583,395 568,328 Accumulated losses 23 (953,350) (1,053,908) Reserves 22 982,767 982,404 TOTAL EQUITY 612,812 496,824
30 MOUNT GIBSON IRON LIMITED 2019 Annual Report

Consolidated Cash Flow Statement For the year ended 30 June 2019
2019 2018 Notes $’000 $’000
CASH FLOWS FROM OPERATING ACTIVITIES
Receipts from customers 253,860 255,814 Payments to suppliers and employees (194,052) (220,566) Proceeds from Koolan Island seawall business interruption insurance claim - 64,287 Interest paid (424) (308)
NET CASH FLOWS PROVIDED BY OPERATING ACTIVITIES 6[b] 59,384 99,227
CASH FLOWS FROM INVESTING ACTIVITIES
Interest received 11,628 12,205 Proceeds from sale of property, plant and equipment 327 128 Purchase of property, plant and equipment (18,540) (5,998) Payment (for)/from term deposits 70,400 (10,500) Proceeds from sale of subordinated notes 35,000 10,020 Payment for subordinated notes (25,974) (10,047) Proceeds from sale of financial assets held for trading 16,140 23,889 Payment for financial assets held for trading (20,256) (25,104) Payment for deferred exploration and evaluation expenditure (223) (324) Payment for mine development (109,184) (74,005)
NET CASH FLOWS (USED IN) INVESTING ACTIVITIES (40,682) (79,736)
CASH FLOWS FROM FINANCING ACTIVITIES
Proceeds from issue of ordinary shares 603 - Proceeds from insurance premium funding facility 1,753 - Payment of borrowing costs (163) (124) Dividends paid (18,347) (21,859)
NET CASH FLOWS (USED IN) FINANCING ACTIVITIES (16,154) (21,983)
NET INCREASE/(DECREASE) IN CASH AND CASH EQUIVALENTS 2,548 (2,492)
Net foreign exchange difference (245) 283 Cash and cash equivalents at beginning of year 46,547 48,756
CASH AND CASH EQUIVALENTS AT END OF YEAR 6[a] 48,850 46,547
MOUNT GIBSON IRON LIMITED 2019 Annual Report 31

Cons
olid
ated
Sta
tem
ent o
f Cha
nges
in E
quity
Fo
r the
yea
r end
ed 3
0 Ju
ne 2
019
Attr
ibut
able
to E
quity
Hol
ders
of t
he P
aren
tTo
tal E
quity
Issu
ed C
apita
l Ac
cum
ulat
ed L
osse
s
Shar
e Ba
sed
Paym
ents
Re
serv
e
Net
Unr
ealis
ed
Gai
ns /
(Lo
sses
) Re
serv
e
Div
iden
d D
istr
ibut
ion
Rese
rve
Equi
ty
Rese
rves
$’
000
$’00
0 $’
000
$’00
0 $’
000
$’00
0 $’
000
At 1
Jul
y 20
17
568,
328
(1,1
31,1
78)
20,5
31
232
964,
262
(3,1
92)
418,
983
Prof
it fo
r the
per
iod
- 99
,129
-
- -
- 99
,129
Ot
her c
ompr
ehen
sive
inco
me
- -
- 57
1 -
- 57
1 To
tal c
ompr
ehen
sive
inco
me
for t
he y
ear
- 99
,129
-
571
- -
99,7
00
Tran
sact
ions
with
ow
ners
in th
eir c
apac
ity a
s ow
ners
D
ivid
ends
pai
d -
(21,
859)
-
- -
- (2
1,85
9)
At 3
0 Ju
ne 2
018
568,
328
(1,0
53,9
08)
20,5
31
803
964,
262
(3,1
92)
496,
824
At 1
Jul
y 20
18
568,
328
(1,0
53,9
08)
20,5
31
803
964,
262
(3,1
92)
496,
824
Prof
it fo
r the
per
iod
- 13
3,36
9 -
- -
- 13
3,36
9 Ot
her c
ompr
ehen
sive
inco
me
- -
- 57
-
- 57
To
tal c
ompr
ehen
sive
inco
me
for t
he y
ear
- 13
3,36
9 -
57
- -
133,
426
Tran
sact
ions
with
ow
ners
in th
eir c
apac
ity a
s ow
ners
D
ivid
ends
pai
d -
(32,
987)
-
- -
- (3
2,98
7)
Afte
r tax
divi
dend
s ne
tted
off a
gain
st lo
an-fu
nded
sha
res
- 17
6 -
- -
- 17
6 S
hare
s iss
ued
unde
r DRP
14
,464
-
- -
- -
14,4
64
Exe
rcise
of s
hare
s ve
sted
und
er L
SP
603
- -
- -
- 60
3 Sh
are-
base
d pa
ymen
ts
- -
306
- -
- 30
6 At
30
June
201
9 58
3,39
5 (9
53,3
50)
20,8
37
860
964,
262
(3,1
92)
612,
812
32 MOUNT GIBSON IRON LIMITED 2019 Annual Report

Notes to the Consolidated Financial Report For the year ended 30 June 2019
(a) Corporate information The consolidated financial statements of the Group, comprising the Company and the entities that it controlled during the year ended 30 June 2019, were authorised for issue in accordance with a resolution of the Directors on 20 August 2019. The Company is a company limited by shares incorporated in Australia whose shares are publicly traded on the Australian Securities Exchange. The nature of operations and principal activities of the Group are the mining and export of hematite iron ore from the Mid-West region of Western Australia and Koolan Island in the Kimberley region of Western Australia, treasury management and the pursuit of mineral resources acquisitions and investments. The address of the registered office is Level 1, 2 Kings Park Road, West Perth, Western Australia, 6005, Australia.
(b) Basis of preparation The financial report is a general-purpose financial report, which has been prepared in accordance with the requirements of the Corporations Act 2001, applicable Australian Accounting Standards and other authoritative pronouncements of the Australian Accounting Standards Board. The financial report has also been prepared on a historical cost basis, except for derivative financial instruments and certain financial assets that have been measured at fair value. The Group has adopted all Accounting Standards and Interpretations mandatory to annual periods beginning on or before 1 July 2018. Adoption of these standards and interpretations, including AASB 15 Revenue from Contracts with Customers (AASB 15) and AASB 9 Financial Instruments (AASB 9), did not have a material effect on the financial position or performance of the Group at the date of initial application (see note 37). The accounting policies adopted are consistent with those followed in the preparation of the Group’s annual consolidated financial statements for the year ended 30 June 2018, except for the adoption of new standards and interpretations as of 1 July 2018. The financial report is presented in Australian dollars and all values are rounded to the nearest thousand dollars ($’000) unless otherwise stated, under the option available to the Company under Australian Securities and Investment Commission (ASIC) (Rounding in Financial/Directors’ Report) Instrument 2016/191. The Company is an entity to which the instrument applies. For the purposes of preparing the consolidated financial statements, the Company is a for-profit entity.
(c) Basis of consolidation The consolidated financial statements comprise the financial statements of the Company and its controlled entities. The financial statements of controlled entities are prepared for the same reporting period as the Company, using consistent accounting policies. Adjustments are made to bring into line any dissimilar accounting policies that may exist. All intercompany balances and transactions, including unrealised profits arising from intra-group transactions, have been eliminated in full. Unrealised losses are eliminated unless costs cannot be recovered. Control is achieved when the Group is exposed, or has rights, to variable returns from its involvement with the investee and has the ability to affect those returns through its power over the investee. Controlled entities are consolidated from the date on which control is transferred to the Group and cease to be consolidated from the date on which control is transferred out of the Group. Where there is loss of control of a controlled entity, the consolidated financial statements include the results for the part of the reporting period during which the Company has control.
1. Introduction
MOUNT GIBSON IRON LIMITED 2019 Annual Report 33

Notes to the Consolidated Financial Report (continued)
(a) Foreign currency The functional currency of the Company and its controlled entities is Australian dollars (A$). Transactions in foreign currencies are initially recorded in the functional currency at the exchange rates ruling at the date of the transaction. Monetary assets and liabilities denominated in foreign currencies are retranslated at the rate of exchange ruling at the balance sheet date. All such exchange differences are taken to the income statement in the consolidated financial report.
(b) Other taxes Revenues, expenses and assets are recognised net of the amount of Goods and Services Tax (GST) except: where the GST incurred on a purchase of goods and services is not recoverable from the taxation authority, in which case the GST is recognised as part of the cost of acquisition of the asset or as part of the expense item as applicable; and receivables and payables are stated with the amount of GST included. The net amount of GST recoverable from, or payable to, the taxation authority is included as part of receivables or payables in the balance sheet. Cash flows are included in the Cash Flow Statement on a gross basis and the GST component of cash flows arising from investing and financing activities, which is recoverable from, or payable to, the taxation authority are classified as operating cash flows. Commitments and contingencies are disclosed net of the amount of GST recoverable from, or payable to, the taxation authority.
(c) Other accounting policies Other significant accounting policies that summarise the measurement basis used and are relevant to an understanding of the financial statements are provided throughout the notes to the financial statements.
(d) Key accounting judgements, estimates and assumptions In the process of applying the Group’s accounting policies, management has made a number of judgements and applied estimates of future events. Significant judgements and estimates which are material to the financial statements are provided throughout the notes to the financial statements. Other significant accounting judgements, estimates and assumptions not provided in the notes to the financial statements are as follows: Determination of mineral resources and ore reserves The Group estimates its mineral resources and ore reserves in accordance with the Australasian Code for Reporting of Exploration Results, Mineral Resources and Ore Reserves 2012 (the “JORC Code”). The information on mineral resources and ore reserves was prepared by or under the supervision of Competent Persons as defined in the JORC Code. The amounts presented are based on the mineral resources and ore reserves determined under the JORC Code. There are numerous uncertainties inherent in estimating mineral resources and ore reserves and assumptions that are valid at the time of estimation which (or and) may change significantly when new information becomes available. Changes in the forecast prices of commodities, exchange rates, production costs or recovery rates may change the economic status of reserves and may, ultimately, result in the ore reserves being restated. Such changes in the ore reserves could impact depreciation and amortisation rates, asset carrying values, deferred stripping costs and provisions for decommissioning and restoration.
2. Other Significant Accounting Policies
34 MOUNT GIBSON IRON LIMITED 2019 Annual Report

Notes to the Consolidated Financial Report (continued)
2019 2018 Notes $’000 $’000
[a] Revenue Revenue from contracts with customers – sale of iron ore 213,396 250,341 Revenue from contracts with customers – freight/shipping services 45,621 - 259,017 250,341 Other revenue:
Quotation period price adjustments 26,427 - Realised gain/(loss) on foreign exchange and commodity forward sales contracts (7,080) 3,788
278,364 254,129 [b] Interest revenue
Interest revenue – calculated using the effective interest method 6,541 12,140 Interest revenue - other 4,574 - 11,115 12,140
[c] Other income Net realised gain on foreign exchange transactions 1,286 1,172 Net unrealised foreign exchange gain on balances - 283 Net gain on disposal of property, plant and equipment 251 128 Net realised gain on financial assets held for trading 147 95 Unrealised marked-to-market gain on financial assets held for trading - 145 Insurance proceeds – Koolan Island seawall business interruption insurance claim - 64,287 Insurance proceeds – other 21 20 Rail credit income 2,458 - Other income 493 353 4,656 66,483
Recognition and measurement Revenue from contracts with customers (policy adopted from 1 July 2018) The Group adopted AASB 15 using the modified retrospective method of adoption with an initial application date of 1 July 2018 and has not restated comparative information. The revised accounting policy effective from 1 July 2018 is set out below. The Group generates a significant proportion of revenue from the sale of iron ore. In some instances, the Group provides freight/shipping services. Revenue from contracts with customers is recognised when control of the goods or services is transferred to the customer and at the amount that reflects the consideration which the Group expects to receive in exchange for those goods or services. The Group has generally concluded that it is the principal in its revenue contracts because it typically controls the goods or services before transferring them to the customer. Iron ore sales Each iron ore shipment is governed by a sales contract with the customer, including spot sales agreements and long-term offtake agreements. For the Group’s iron ore sales not sold under Cost and Freight (CFR) Incoterms, the performance obligation is the delivery of the iron ore. A proportion of the Group’s iron ore sales are sold under CFR Incoterms, whereby the Group is also responsible for providing freight/shipping services. In these situations, the freight/shipping service represents a separate performance obligation. Revenue from iron ore sales is recognised when control of the iron ore passes to the customer, which generally occurs at a point in time when the iron ore is physically transferred onto a vessel. This is the point where title passes to the customer together with significant risks and rewards of ownership. A proportion of the Group’s sales are provisionally priced, where the final price is referenced to a future market-based (Platts) index price. Adjustment to the sales price occurs based on movements in the index price up to the end of the quotational period (QP). These are referred to as provisional pricing arrangements and are such that the selling price for the iron ore is determined on a specified future date after shipment to the customer. Adjustments to the sales price therefore occur up until the end of the QP. The period between provisional pricing and the end of the QP is generally between two and three months. Revenue is measured at the amount to which the Group expects to be entitled at the end of QP, being the estimated forward price at the date the revenue is recognised. For those arrangements subject to CFR shipping terms, a portion of the transaction price is allocated to the separate freight/shipping services provided. For provisional pricing arrangements, any future changes that occur over the QP are embedded within trade receivables. Given the exposure to the commodity price, these provisionally priced trade receivables are measured at fair value through profit or loss (see note 9). Subsequent changes in the fair value of provisionally priced trade receivables are recognised in revenue but are presented separately from revenue from contracts with customers. Changes in fair value over the term of the provisionally priced trade receivable are estimated by reference to movements in the index price as well as taking into account relevant other fair value consideration including interest rate and credit risk adjustments.
3. Revenue and Other Income
MOUNT GIBSON IRON LIMITED 2019 Annual Report 35

Notes to the Consolidated Financial Report (continued)
Freight/shipping services For CFR arrangements, the Group is responsible for providing freight/shipping services (as principal) after the date that the Group transfers control of the iron ore to its customers. The Group, therefore, has a separate performance obligation for freight/shipping services which are provided solely to facilitate the sale of the commodities it produces. The transaction price (as determined above) is allocated to the iron ore and freight/shipping services using the relative stand-alone selling price method. Under these arrangements, revenue is recognised over time using an output basis to measure progress towards complete satisfaction of the service as this best represents the Group’s performance. This is on the basis that the customer simultaneously receives and consumes the benefits provided by the Group as the services are being provided. The costs associated with the freight/shipping services are also recognised over the same period of time as shipping occurs. Revenue from Sale of Goods (policy adopted up to 30 June 2018) Revenue from the sale of Iron Ore was recognised when the significant risks and rewards of ownership of the goods passed to the buyer. Revenue was measured at the fair value of consideration received or receivable to the extent that it was probable that the economic benefits would flow to the entity and the revenue could be reliably measured. Interest Revenue Revenue is recognised as interest accrues using the effective interest method. This is a method of calculating the amortised cost of a financial asset and allocating the interest income over the relevant period using the effective interest rate, which is the rate that exactly discounts estimated future cash receipts through the expected life of the financial asset to the net carrying amount of the financial asset. Key estimates and judgments For the Group’s CFR customers, the Group is responsible for providing freight/shipping services. While the Group does not actually provide nor operate the vessels, the Group has determined that it is principal in these arrangements because it has concluded it controls the specified services before they are provided to the customer. The terms of the Group’s contract with the service provider give the Group the ability to direct the service provider to provide the specified services on the Group’s behalf. The Group has also concluded that revenue for freight/shipping services is to be recognised over time because the customer simultaneously receives and consumes the benefits provided by the Group. The fact that another entity would not need to re-perform the freight/shipping services that the Group has provided to date demonstrates that the customer simultaneously receives and consumes the benefits of the Group’s performance as it performs. The Group determined that the output method is the best method for measuring progress of the freight/shipping services because there is a direct relationship between the Group’s effort and the transfer of service to the customer. The Group recognises revenue on the basis of the time elapsed relative to the total expected time to complete the service.
36 MOUNT GIBSON IRON LIMITED 2019 Annual Report

Notes to the Consolidated Financial Report (continued)
2019 2018 Notes $’000 $’000
[a] Cost of sales – continuing operations Mining and site administration costs 123,868 35,518 Depreciation – mining and site administration 2,973 761 Mining waste costs deferred (Koolan Island pre-production) 15 (65,615) - Amortisation of mining waste costs deferred 15 1,039 - Amortisation of mine properties 15 4,287 4,125 Pre-production expenditure capitalised (11,155) - Crushing costs 11,876 5,313 Depreciation – crushing 293 32 Transport costs 54,922 83,852 Depreciation – transport 767 612 Port costs 13,818 16,538 Depreciation – port 259 139 Royalties 18,764 14,485 Net ore inventory movement 4,330 944 Impairment (write-back)/loss on ore inventories 10[i] (140) (2,443) Rehabilitation revised estimate adjustments 20 (1,621) - Cost of sales – FOB 158,665 159,876 Shipping freight 45,621 57,666 Cost of sales – CFR 204,286 217,542
[b] Finance costs Finance charges on banking facilities 569 439 Non-cash interest accretion on rehabilitation provision 20 927 845 1,496 1,284
[c] Administration and other expenses include: Depreciation 178 276Share-based payments expense 25(a) 306 -Impairment of debtors - 50 Net unrealised loss on foreign exchange balances 244 -Koolan seawall insurance claim 477 448Insurance premiums (net of refunds) 1,364 1,002Business development expenses 26 467Impairment/(write-back) and obsolescence of consumables inventories (2,100) 61Impairment (write-back) of deferred acquisition, exploration and evaluation 14 3 (62)Exploration expenses 14 220 38Unrealised marked-to-market loss on foreign exchange and commodity forward derivatives 5,859 255 Unrealised marked-to-market loss on financial assets held for trading 21 -
[d] Cost of sales and Administration and other expenses above include: Salaries, wages expense and other employee benefits 46,543 25,789Operating lease rental – minimum lease payments 4,913 3,198
4. Expenses
MOUNT GIBSON IRON LIMITED 2019 Annual Report 37

Notes to the Consolidated Financial Report (continued)
Recognition and measurement Employee benefits expense Wages, salaries, sick leave and other employee benefits Liabilities for wages and salaries, including non-monetary benefits and other employee benefits expected to be settled within 12 months of the reporting date are recognised in other payables in respect of employees' services up to the reporting date. They are measured at the amounts expected to be paid when the liabilities are settled. Liabilities for sick leave are recognised when the leave is taken and are measured at the rates paid or payable. Redundancy Provision is made for redundancy payments where positions have been identified as excess to requirements, the Group has communicated a detailed and formal plan, and a reliable estimate of the amount payable can be determined. Refer to note 20 for further details on redundancy (restructure) provision. Annual leave and long service leave The Group expects its annual leave benefits to be settled wholly within 12 months of each reporting date. The obligation is measured at the amount expected to be paid when the liabilities are settled. The liability for long service leave is recognised in the provision for employee benefits and measured as the present value of future payments to be made in respect of services provided by employees up to the reporting date. Consideration is given to future wage and salary levels, experience of employee departures, and periods of service. Future payments are discounted using market yields at the reporting date on high quality corporate bonds with terms to maturity and currencies that match, as closely as possible, the estimated future cash outflows. Share-Based Payment Plans The policy relating to share-based payments is set out in note 25. Superannuation Contributions made by the Group to employee superannuation funds, which are defined contribution plans, are charged as an expense when incurred. Borrowing costs Borrowing costs are recognised as an expense when incurred except for borrowing costs that are directly attributable to the acquisition, construction or production of a qualifying asset which are capitalised as part of the cost of that asset. Operating Leases The minimum lease payments of operating leases, where the lessor effectively retains substantially all of the risks and benefits of ownership of the leased item, are recognised as an expense in the income statement on a straight-line basis over the lease term. Contingent rentals are recognised as an expense in the financial year in which they are incurred. Depreciation and amortisation Refer to notes 13 and 15 for details on depreciation and amortisation. Impairment Impairment expenses are recognised to the extent that the carrying amounts of assets exceed their recoverable amounts. Refer to note 16 for further details on impairment.
38 MOUNT GIBSON IRON LIMITED 2019 Annual Report

Notes to the Consolidated Financial Report (continued)
2019 2018 $’000 $’000
Major components of tax benefit for the years ended 30 June 2019 and 2018 are:
Income Statement Current tax Current income tax charge - - Refund in respect of previous return - - Deferred tax Relating to origination and reversal of temporary differences: Income tax benefit recognised from previously unrecognised tax losses and deductible temporary differences (84,407) -
Deferred tax relating to movement in temporary differences 21,447 - Tax benefit reported in Income Statement (62,960) - Tax benefit relating to continuing operations (63,013) - Tax expense relating to discontinued operations 53 - (62,960) - Statement of Changes in Equity Deferred income tax Remeasurement of foreign exchange contracts 53 - Deferred income tax (benefit)/liability reported in equity 53 - Reconciliation of tax benefit A reconciliation of tax benefit applicable to accounting profit before tax at the statutory income tax rate to tax expense at the Group’s effective tax rate for the years ended 30 June 2019 and 2018 is as follows:
Accounting profit before tax 70,462 99,129 At the statutory income tax rate of 30% (2018: 30%) 21,138 29,739 Expenditure not allowed for income tax purposes 308 46 Recognition of previously unrecognised deferred tax assets (84,407) (29,749) Adjustments in respect of current income tax of previous year - 17 Other 54 (53) Tax benefit reported in Income Statement (62,907) -
5. Taxation
MOUNT GIBSON IRON LIMITED 2019 Annual Report 39
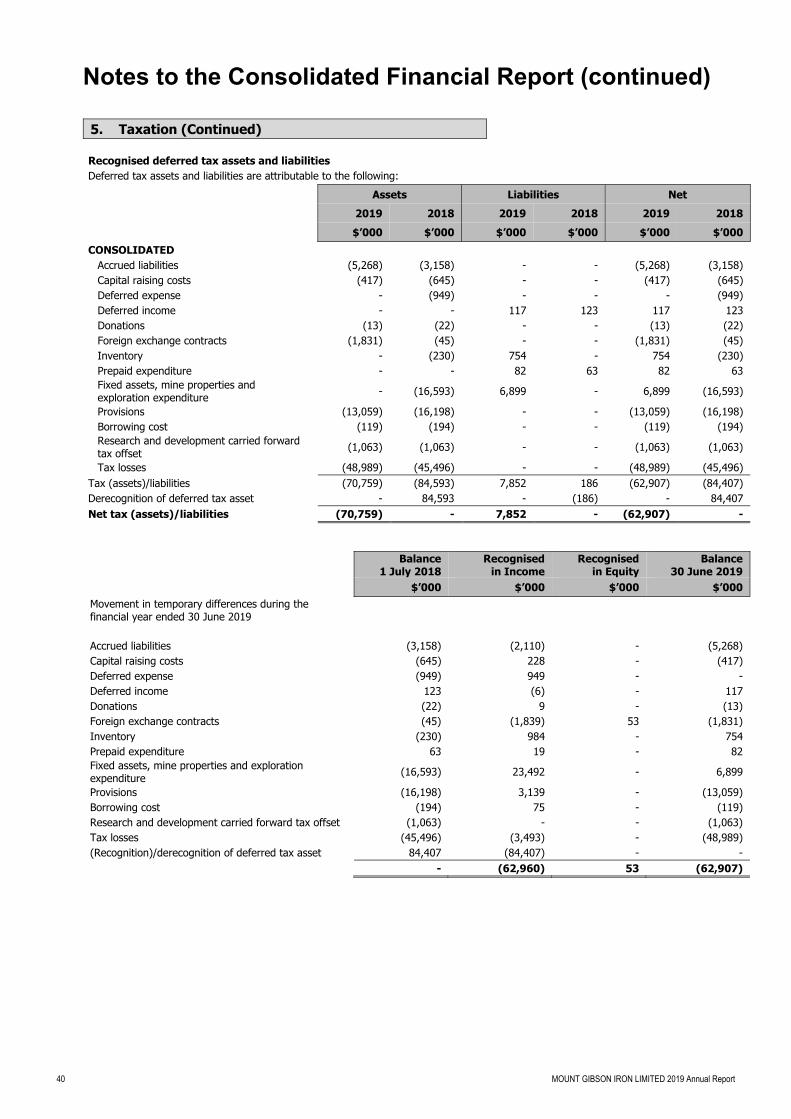
Notes to the Consolidated Financial Report (continued)
5. Taxation (Continued) Recognised deferred tax assets and liabilities Deferred tax assets and liabilities are attributable to the following: Assets Liabilities Net 2019 2018 2019 2018 2019 2018 $’000 $’000 $’000 $’000 $’000 $’000 CONSOLIDATED
Accrued liabilities (5,268) (3,158) - - (5,268) (3,158) Capital raising costs (417) (645) - - (417) (645) Deferred expense - (949) - - - (949) Deferred income - - 117 123 117 123 Donations (13) (22) - - (13) (22) Foreign exchange contracts (1,831) (45) - - (1,831) (45) Inventory - (230) 754 - 754 (230) Prepaid expenditure - - 82 63 82 63 Fixed assets, mine properties and exploration expenditure - (16,593) 6,899 - 6,899 (16,593)
Provisions (13,059) (16,198) - - (13,059) (16,198) Borrowing cost (119) (194) - - (119) (194) Research and development carried forward tax offset (1,063) (1,063) - - (1,063) (1,063)
Tax losses (48,989) (45,496) - - (48,989) (45,496) Tax (assets)/liabilities (70,759) (84,593) 7,852 186 (62,907) (84,407) Derecognition of deferred tax asset - 84,593 - (186) - 84,407 Net tax (assets)/liabilities (70,759) - 7,852 - (62,907) -
Balance1 July 2018
Recognisedin Income
Recognised in Equity
Balance30 June 2019
$’000 $’000 $’000 $’000 Movement in temporary differences during the financial year ended 30 June 2019
Accrued liabilities (3,158) (2,110) - (5,268) Capital raising costs (645) 228 - (417) Deferred expense (949) 949 - - Deferred income 123 (6) - 117 Donations (22) 9 - (13) Foreign exchange contracts (45) (1,839) 53 (1,831) Inventory (230) 984 - 754 Prepaid expenditure 63 19 - 82 Fixed assets, mine properties and exploration expenditure (16,593) 23,492 - 6,899
Provisions (16,198) 3,139 - (13,059) Borrowing cost (194) 75 - (119) Research and development carried forward tax offset (1,063) - - (1,063) Tax losses (45,496) (3,493) - (48,989) (Recognition)/derecognition of deferred tax asset 84,407 (84,407) - - - (62,960) 53 (62,907)
40 MOUNT GIBSON IRON LIMITED 2019 Annual Report

Notes to the Consolidated Financial Report (continued)
5. Taxation (Continued)
Balance1 July 2017
Recognisedin Income
Recognised in Equity
Balance30 June 2018
$’000 $’000 $’000 $’000 Movement in temporary differences during the financial year ended 30 June 2018
Accrued liabilities (1,743) (1,415) - (3,158) Capital raising costs (1,015) 370 - (645) Deferred expense - (949) - (949) Deferred income (1) 124 - 123 Donations (10) (12) - (22) Foreign exchange contracts (89) 97 (53) (45) Inventory (1,211) 981 - (230) Prepaid expenditure 53 10 - 63 Fixed assets, mine properties and exploration expenditure (23,545) 6,952 - (16,593)
Provisions (15,416) (782) - (16,198) Borrowing cost (298) 104 - (194) Research and development carried forward tax offset (1,063) - - (1,063) Tax losses (69,818) 24,322 - (45,496) Derecognition of deferred tax asset 114,156 (29,802) 53 84,407 - - - -
2019 2018 $’000 $’000 Unrecognised deferred tax assets (calculated at 30%) Deferred tax assets have not been recognised in respect of the following items:
Temporary differences - 38,911 Tax losses - 45,496
- 84,407
MOUNT GIBSON IRON LIMITED 2019 Annual Report 41

Notes to the Consolidated Financial Report (continued)
5. Taxation (Continued)
Recognition and measurement Income Tax Deferred income tax is provided for using the full liability balance sheet approach. Deferred income tax liabilities are recognised for all taxable differences: • except where the deferred income tax liability arises from the initial recognition of an asset or liability in a transaction that is not a business
combination and, at the time of the transaction, affects neither the accounting profit nor taxable profit or loss; and • in respect of taxable temporary differences associated with investments in subsidiaries, associates and interests in joint ventures, except
where the timing of the reversal of the temporary differences can be controlled and it is probable that the temporary differences will not reverse in the foreseeable future.
Deferred income tax assets are recognised for all deductible temporary differences, carry-forward of unused tax assets and unused tax losses, to the extent that it is probable that taxable profit will be available against which the deductible temporary differences, and the carry-forward of unused tax assets and unused tax losses can be utilised: • except where the deferred income tax asset relating to the deductible temporary difference arises from the initial recognition of an asset
or liability in a transaction that is not a business combination and, at the time of the transaction, affects neither the accounting profit nor taxable profit or loss; and
• in respect of deductible temporary differences associated with investments in controlled entities, associates and interests in joint ventures, deferred tax assets are only recognised to the extent that it is probable that the temporary differences will reverse in the foreseeable future and taxable profit will be available against which the temporary differences can be utilised.
The carrying amount of deferred income tax assets is reviewed at each balance sheet date and reduced to the extent that it is no longer probable that sufficient taxable profit will be available to allow all or part of the deferred income tax asset to be utilised. Deferred income tax assets and liabilities are measured at the tax rates that are expected to apply to the year when the asset is realised or the liability is settled, based on tax rates (and tax laws) that have been enacted or substantively enacted at the balance sheet date. Income taxes relating to items recognised directly in equity are recognised in equity and not in the income statement. Tax consolidation Mount Gibson and its wholly-owned Australian controlled entities have formed an income tax consolidated group under the Tax Consolidation Regime. Using the Group allocation approach, each entity in the group recognises its own current and deferred tax liabilities, except for any deferred tax liabilities resulting from unused tax losses and tax credits, which are immediately assumed by the parent entity in addition to its own current and deferred tax amounts. The current tax liability of each group entity is then subsequently assumed by the parent entity. Assets or liabilities arising under tax funding agreements with the tax consolidated entities are recognised as amounts receivable from or payable to other entities in the Group. Details of the tax funding agreement are disclosed below. Any difference between the amounts assumed and amounts receivable or payable under the tax funding agreement are recognised as a contribution to (or distribution from) wholly-owned tax consolidated entities. Members of the tax consolidated group have entered into a tax sharing agreement that provides for the allocation of income tax liabilities between the entities should the head entity default on its tax payment obligations. No amounts have been recognised in the financial statements in respect of this agreement on the basis that the possibility of default is remote. The head entity and the controlled entities in the tax consolidated group continue to account for their own current and deferred tax amounts. The Group has applied the group allocation approach in determining the appropriate amount of current taxes and deferred taxes to allocate to members of the tax consolidated group. The current and deferred tax amounts are measured in a systematic manner that is consistent with the broad principles in AASB 112 Income Taxes. The nature of the tax funding agreement is discussed further below. In addition to its own current and deferred tax amounts, the head entity also recognises current tax liabilities (or assets) and the deferred tax assets arising from unused tax losses and unused tax credits assumed from controlled entities in the tax consolidated group. Members of the tax consolidated group have entered into a tax funding agreement. Under the funding agreement, the funding of tax within the Group is based on accounting profit. The tax funding agreement requires payments to/from the head entity to be recognised via an inter-entity receivable (payable) which is at call. To the extent that there is a difference between the amount charged under the tax funding agreement and the allocation under the accounting policy, the head entity accounts for these as equity transactions with the subsidiaries. The amounts receivable or payable under the tax funding agreement are due upon receipt of the funding advice from the head entity, which is issued as soon as practicable after the end of each financial year. The head entity may also require payment of interim funding amounts to assist with its obligations to pay tax instalments. Key estimate: recoverability of potential deferred tax assets The Group recognises deferred tax assets in respect of tax losses to the extent that the future utilisation of these losses is considered probable. Assessing the future utilisation of these losses requires the Group to make significant estimates related to expectations of future taxable income. Estimates of future taxable income are based on forecast cash flows from operations and the application of existing tax laws. To the extent that future cash flows and taxable income differ significantly from estimates, this could result in significant changes to the deferred tax assets recognised, which would in turn impact future financial results. As at 30 June 2019 the Group considers it probable that sufficient taxable profits will be generated in the near term to enable the previously unrecognised deferred tax assets to be recognised at balance date.
42 MOUNT GIBSON IRON LIMITED 2019 Annual Report

Notes to the Consolidated Financial Report (continued)
2019 2018 $’000 $’000
[a] Reconciliation of cash For the purposes of the Cash Flow Statement, cash and cash equivalents comprise the following at 30 June: Cash at bank and on hand 48,850 46,547
48,850 46,547
Cash at bank earns interest at floating daily bank deposit rates. Short-term deposits are made for varying periods of between one day and three months depending on the immediate cash requirements of the Group, and earn interest at short-term deposit rates.
Recognition and measurement Cash and short-term deposits in the balance sheet comprise cash at bank and on hand and short-term deposits with an original maturity period of three months or less. For the purposes of the Cash Flow Statement, cash and cash equivalents consist of cash and cash equivalents as defined above, net of outstanding bank overdrafts, if any.
[b] Reconciliation of the net profit after tax to the net cash flows from operations Net profit after tax 133,369 99,129 Adjustments to reconcile profit after tax to net cash flows:
Depreciation of non-current assets 4,480 1,842 Amortisation of mining waste costs deferred 1,039 - Amortisation of other mine properties 4,287 4,125 Net (gain) on disposal of property, plant and equipment (251) (128) Interest revenue (11,115) (12,140) Exploration expenses written off 220 38 Share based payments 306 - Borrowing costs 144 131 Interest accretion on rehabilitation provision 927 845 Net ore inventory movement 4,330 944 Impairment of debtors - 154 Impairment/(write-back) and obsolescence of consumables inventories (2,100) 61 Impairment/(write-back) of ore inventories (140) (2,443) Impairment/(write-back) of deferred acquisition, exploration and evaluation 3 (62) Unrealised (gain)/loss on foreign exchange balances 244 (283) Unrealised marked-to-market loss on foreign exchange and commodity forward derivatives 5,859 255 Unrealised marked-to-market (gain)/loss on financial assets held for trading 21 (145) Realised (gain) on sale of financial assets held for trading (147) (95)
Changes in assets and liabilities: (Increase)/decrease in trade and other receivables (27,310) 1,461 (Increase) in inventory (3,058) (1,144) (Increase) in prepayments and deposits (4,455) (281) (Increase) in deferred tax assets (62,907) - Increase in trade and other payables 21,979 3,551 Increase/(decrease) in employee benefits (47) 524 Increase/(decrease) in provision for restructure (3,033) 3,559 (Decrease) in other provisions (3,261) (671)
Net Cash Flow from Operating Activities 59,384 99,227
[c] Non-cash financing activities There were no non-cash financing activities during the year ended 30 June 2019 (2018: nil).
6. Cash and Cash Equivalents
MOUNT GIBSON IRON LIMITED 2019 Annual Report 43

Notes to the Consolidated Financial Report (continued)
Notes 2019 2018 $’000 $’000
Current Term deposits – loans and receivables [i] - 279,000 Term deposits – financial assets at amortised cost [i] 208,600 - Subordinated notes – available for sale investment [ii] - 98,030 Subordinated notes – financial assets at fair value through other comprehensive income (OCI) [ii] 88,882 -
297,482 377,030
[i] Term deposits are made for varying periods of between three and twelve months depending on the cash requirements of the Group, and earn interest at market term deposit rates. Term deposits are held with various financial institutions with short term credit ratings of A-2 or better (S&P). As these instruments have maturity dates of less than twelve months, the Group has assessed the credit risk on these financial assets using life time expected credit losses. In this regard, the Group has concluded that the probability of default on the term deposits is relatively low. Accordingly, no impairment allowance has been recognised for expected credit losses on the term deposits.
[ii] Subordinated notes comprise tradeable floating interest rate instruments with maturities of up to ten years. These instruments are held in order to supplement the Group’s treasury returns, and the Group intends and is able to realise these instruments as and when the Group’s cash needs require. Subordinated notes are held with various financial institutions with short-term and long-term credit ratings of A or better (S&P). The Group has assessed the credit risk on these financial assets and determined that the credit risk exposure has not increased significantly since initial recognition. In determining the expected credit loss for the next twelve months, the Group considers the probability of default to be relatively low. Accordingly, no impairment allowance has been recognised for expected credit losses on these notes.
Recognition and measurement Policy applied from 1 July 2018 See note 35 for the accounting policy for financial assets classified as financial assets at amortised cost and financial assets at fair value through OCI.
Policy applied to 30 June 2018 Term deposits were classified as receivables and recorded at amortised costs using the effective interest rate method less impairment. Subordinated notes were classified as available for sale investments and carried at fair value through other comprehensive income.
2019 2018 $’000 $’000
Current Tradeable corporate bonds at fair value through profit or loss 33,055 32,420 Quoted share investments at fair value through profit or loss 5,144 1,537 38,199 33,957
Financial assets held for trading comprise corporate bonds and equity securities which are traded in active markets. These financial assets are acquired principally for the purpose of selling or repurchasing in the short term. The portfolio of tradeable corporate bonds is managed by a professional funds management entity, and Mount Gibson is able to vary or terminate the portfolio management mandate at any time, with applicable notice periods.
Recognition and measurement Policy applied from 1 July 2018 See note 35 for the accounting policy for financial assets classified as financial assets at fair value through profit and loss.
Policy applied to 30 June 2018 Financial assets held for trading were measured at fair value through the income statement. Gains or losses from the sale of the financial assets were recognised in the income statement. Interest earned at market bond rates was recognised in the income statement on an effective yield basis.
7. Term Deposits and Subordinated Notes
8. Financial Assets Held for Trading
44 MOUNT GIBSON IRON LIMITED 2019 Annual Report

Notes to the Consolidated Financial Report (continued)
2019 2018 Notes $’000 $’000
Current Trade debtors – at amortised cost [a][i] 155 6,087 Allowance for impairment [b] (70) (3,374) 85 2,713 Trade debtors – at fair value through profit or loss [a][i] 26,983 - Sundry debtors [a][ii] 5,387 2,763 Other receivables 2,185 2,367 34,640 7,843
[a] Terms and conditions Terms and conditions relating to the above financial instruments: [i] Generally, on presentation of ship loading documents and the provisional invoice, the customer settles 95% of the provisional sales
invoice value within 10 days and the remaining 5% is settled within 30 days of presentation of the final invoice. The vast majority of sales is invoiced and received in US dollars (US$). The balance of other trade debtors are invoiced and received in Australian dollars (A$).
[ii] Sundry debtors are non-interest bearing and have repayment terms between 30 and 90 days. There is an insignificant probability of default as sundry debtors are short term, have no history of default and customers have passed the Group’s internal credit assessment.
[b] Impaired trade receivables
The table below reconciles the allowance for impairment loss for the years ended 30 June 2019 and 2018.
2019 2018 $’000 $’000
Allowance for impairment – trade debtors Balance at the beginning of the year 3,374 5,384 Charge for the year - 154 Utilised (3,304) (2,164) Balance at the end of the year 70 3,374
At 30 June 2019, trade debtors of $35,000 (2018: $131,000) in the Group were past due but not impaired. These related to a number of customers for whom there is no recent history of default. At 20 August 2019, $18,000 of this amount remains outstanding.
The ageing of trade debtors is as follows:
Current 50 2,582 Less than 30 days overdue - - Between 30 and 60 days overdue - - Between 60 and 90 days overdue 30 124 Greater than 90 days overdue 5 7
85 2,713 Impaired receivables 70 3,374 155 6,087
Recognition and measurement Policy applied from 1 July 2018 See note 35 for the accounting policy for financial assets.
Policy applied to 30 June 2018 Trade receivables Trade receivables were recognised and carried at amortised cost less any allowance for impairment. The exposure of provisionally priced sales to commodity price movements over the quotational period, previously led to an embedded derivative (QP derivative) being separated from the host trade receivable and accounted for separately. Collectability of trade receivables was reviewed on an ongoing basis at an operating unit level. Individual debts that were known to be uncollectible were written off when identified. An allowance for impairment of trade receivables was made when there is objective evidence that the Group would not be able to collect the debts. Indicators of impairment would include financial difficulties of the debtor, likelihood of the debtor’s insolvency and default in payment. Any impairment was recognised in the income statement. Other receivables Other receivables were recorded at amortised cost, using the effective interest rate method, less any impairment.
9. Trade and Other Receivables
MOUNT GIBSON IRON LIMITED 2019 Annual Report 45

Notes to the Consolidated Financial Report (continued)
2019 2018 Notes $’000 $’000
Consumables – at cost 16,891 13,833 Allowance for impairment of consumables inventories (5,439) (7,539) 11,452 6,294 Ore – at cost 13,407 17,737 Allowance for impairment of ore inventories [i] (570) (710) At net realisable value 12,837 17,027 Total inventories 24,289 23,321
[i] At 30 June 2019, the Group assessed the carrying values of ore inventories stockpiled at the Extension Hill and Koolan Island mine sites. Assumptions used in the assessment include prevailing and anticipated iron ore prices and exchange rates, ore specifications, estimated costs to make the ore inventories available for sale, and associated sales and shipping freight costs.
Impairment write-backs were recorded for ore inventories that were impaired and sold during the period.
Based on these assumptions, the following impairment write-backs on ore inventories were recorded during the financial period:
2019 2018 $’000 $’000 Extension Hill 140 2,443 Koolan Island - - Total write-backs on impairment 140 2,443
Recognition and measurement Inventories are carried at the lower of cost and net realisable value. For iron ore, cost comprises direct material, labour and expenditure in getting such inventories to their existing location and condition, based on weighted average costs incurred during the period in which such inventories were produced. Net realisable value is the estimated selling price in the ordinary course of business, less estimated costs of completion and the estimated costs necessary to make the sale. Consumable material relating to plant and equipment is recognised as inventory. Consumable stocks are carried at cost less accumulated impairment. Key estimate Consumables are impaired if considered damaged or, have become wholly or partially obsolete. A new assessment is made of impairment in each subsequent period.
2019 2018 Notes $’000 $’000
Current Foreign currency option contracts 35[b][i] 36 - 36 -
Refer note 35 for details on derivative financial instruments.
10. Inventories
11. Derivative Financial Assets
46 MOUNT GIBSON IRON LIMITED 2019 Annual Report

Notes to the Consolidated Financial Report (continued)
Name Country of Incorporation
Percentage of Equity Interest Held by the Group
2019 2018 % %
Mount Gibson Mining Limited Australia 100 100 Geraldton Bulk Handling Pty Ltd Australia 100 100 Gibson Minerals Ltd Australia 100 100 Aztec Resources Limited Australia 100 100 Koolan Shipping Pty Ltd Australia 100 100 Brockman Minerals Pty Ltd Australia 100 100 Koolan Iron Ore Pty Ltd Australia 100 100
KIO SPV Pty Ltd Australia 100 100
Entities subject to Class Order relief
Pursuant to ASIC Instrument 2016/785, relief has been granted to Mount Gibson Mining Limited, Aztec Resources Limited and Koolan Iron Ore Pty Ltd from the Corporations Act 2001 requirements for the preparation, audit and lodgement of financial reports. As a condition of the Class Order, Mount Gibson Iron Limited, Mount Gibson Mining Limited, Aztec Resources Limited and Koolan Iron Ore Pty Ltd (Closed Group) entered into a Deed of Cross Guarantee on 1 May 2008. The effect of this deed is that Mount Gibson Iron Limited has guaranteed to pay any deficiency in the event of winding up of these controlled entities or if they do not meet their obligations under the terms of overdrafts, loans, leases or other liabilities subject to the guarantee. The controlled entities have also given a similar guarantee in the event that Mount Gibson Iron Limited is wound up or if it does not meet its obligations under the terms of overdrafts, loans, leases or other liabilities subject to the guarantee.
The Consolidated Income Statement and Balance Sheet of the Closed Group are set out below:
Consolidated Income Statement of the Closed Group 2019 2018 $’000 $’000
CONTINUING OPERATIONS Revenue 278,364 254,129 Interest revenue 11,115 12,140 TOTAL REVENUE 289,479 266,269 Cost of sales (192,978) (202,446) GROSS PROFIT 96,501 63,823 Other income 4,654 66,480 Impairment of non-current other receivables (364) (14,864) Administration and other expenses (17,532) (15,052) PROFIT FROM CONTINUING OPERATIONS BEFORE TAX AND FINANCE COSTS 83,259 100,387 Finance costs (1,496) (1,284) PROFIT FROM CONTINUING OPERATIONS BEFORE TAX 81,763 99,103 Tax benefit 51,482 - PROFIT AFTER TAX FROM CONTINUING OPERATIONS 133,245 99,103 DISCONTINUED OPERATIONS Profit after tax for the year from discontinued operations 124 26 PROFIT AFTER TAX ATTRIBUTABLE TO MEMBERS OF THE COMPANY 133,369 99,129
12. Interests in Subsidiaries
MOUNT GIBSON IRON LIMITED 2019 Annual Report 47

Notes to the Consolidated Financial Report (continued)
Consolidated Balance Sheet of the Closed Group
2019 2018 Notes $’000 $’000
ASSETS CURRENT ASSETS Cash and cash equivalents 48,654 46,430 Term deposits and subordinated notes 297,482 377,030 Financial assets held for trading 33,055 32,420 Trade and other receivables 34,568 7,674 Inventories 24,016 23,116 Prepayments 4,048 3,224 Derivative financial assets 36 - TOTAL CURRENT ASSETS 441,859 489,894 NON-CURRENT ASSETS Other receivables 9,813 - Property, plant and equipment 21,717 7,483 Mine properties 194,994 87,781 Prepayments 1,929 2,370 Deferred tax assets 57,420 - TOTAL NON-CURRENT ASSETS 285,873 97,634 TOTAL ASSETS 727,732 587,528
LIABILITIES CURRENT LIABILITIES Trade and other payables 54,030 39,847 Employee benefits 3,347 3,083 Interest-bearing loans and borrowings 1,753 - Derivative financial liabilities 6,042 325 Provisions 6,487 6,144 TOTAL CURRENT LIABILITIES 71,659 49,399 NON-CURRENT LIABILITIES Other payables - 461 Employee benefits 258 478 Provisions 43,003 40,366 TOTAL NON-CURRENT LIABILITIES 43,261 41,305 TOTAL LIABILITIES 114,920 90,704 NET ASSETS 612,812 496,824
EQUITY Issued capital 583,395 568,328 Accumulated losses [i] (953,350) (1,053,908) Reserves 982,767 982,404 TOTAL EQUITY 612,812 496,824
[i] Accumulated losses Balance at the beginning of the year (1,053,908) (1,131,178) Net profit attributable to members of the closed group 133,369 99,129 Dividends paid (32,811) (21,859) Balance at the end of the year (953,350) (1,053,908)
48 MOUNT GIBSON IRON LIMITED 2019 Annual Report

No
tes
to t
he
Co
nso
lidat
ed F
inan
cial
Rep
ort
(co
nti
nu
ed)
Land
Pl
ant a
nd e
quip
men
t Pl
ant a
nd e
quip
men
t un
der l
ease
Bu
ildin
gs
Capi
tal w
orks
in
prog
ress
To
tal
2019
20
18
2019
20
18
2019
20
18
2019
20
18
2019
20
18
2019
20
18
$’00
0 $’
000
$’00
0 $’
000
$’00
0 $’
000
$’00
0 $’
000
$’00
0 $’
000
$’00
0 $’
000
Gros
s ca
rryin
g am
ount
at c
ost
649
649
293,
637
279,
895
16,5
90
22,0
74
141,
468
140,
048
2,20
6 77
6 45
4,55
0 44
3,44
2 Ac
cum
ulat
ed d
epre
ciatio
n an
d im
pairm
ent
(549
) (5
49)
(275
,748
) (2
73,5
86)
(16,
590)
(2
2,07
4)
(139
,946
) (1
39,4
99)
- -
(432
,833
) (4
35,7
08)
Net
car
ryin
g am
ount
10
0 10
0 17
,889
6,
309
- -
1,52
2 54
9 2,
206
776
21,7
17
7,73
4
Reco
ncili
atio
n Ca
rryin
g am
ount
at t
he b
egin
ning
of t
he y
ear
100
100
6,30
9 4,
793
- 8
549
899
776
119
7,73
4 5,
919
Addi
tions
-
- 15
,184
5,
184
- -
1,15
4 38
2,
202
776
18,5
40
5,99
8 Tr
ansf
ers
- -
332
37
- -
440
82
(772
) (1
19)
- -
Disp
osal
s-
- (7
7)-
--
--
--
(77)
-De
prec
iatio
n ex
pens
e –
cont
inui
ng o
pera
tions
-
- (3
,849
) (1
,370
) -
- (6
21)
(450
) -
- (4
,470
) (1
,820
) De
prec
iatio
n ex
pens
e –
disc
ontin
ued
oper
atio
ns
- -
(10)
(2
2)
- -
- -
- -
(10)
(2
2)
Depr
ecia
tion
capi
talis
ed
- -
- (2
,313
) -
(8)
- (2
0)
- -
- (2
,341
) Ca
rryi
ng a
mou
nt a
t the
end
of t
he y
ear
100
100
17,8
89
6,30
9 -
- 1,
522
549
2,20
6 77
6 21
,717
7,
734
Asse
ts p
ledg
ed a
s se
curit
y 10
0 10
0 17
,889
6,
309
- -
1,52
2 54
9 2,
206
776
21,7
17
7,73
4
Refe
r not
e 18
for d
etai
ls of
sec
urity
arra
ngem
ents
.
13.
Prop
erty
, Pla
nt a
nd E
quip
men
t
MOUNT GIBSON IRON LIMITED 2019 Annual Report 49

Notes to the Consolidated Financial Report (continued)
13. Property, Plant and Equipment (Continued)
Recognition and measurement Plant and equipment is stated at cost less accumulated depreciation and any impairment in value. Depreciation and amortisation The cost of owned property, plant and equipment directly engaged in mining operations is depreciated over its expected economic life on a units-of-production method, with due regard given to the life of the related area of interest. Plant and equipment under hire purchase or finance lease directly engaged in mining operations is written down to its residual value over the lesser of the hire purchase or finance lease term and its useful life. Other assets which are depreciated or amortised on a basis other than the units-of-production method typically are depreciated on a straight-line basis over the estimated useful life of the asset as follows: Buildings 5 - 20 years Motor vehicles 4 - 5 years Office equipment 3 - 5 years Leasehold improvements Shorter of lease term and useful life of 5 – 10 years Impairment The carrying values of plant and equipment are reviewed for impairment when events or changes in circumstances indicate the carrying value may not be recoverable. For an asset that does not generate largely independent cash inflows, the recoverable amount is determined for the cash-generating unit to which the asset belongs. Individual assets in the cash-generating units are not written down below their recoverable amount. Refer note 16 for further details on impairment. Derecognition An item of property, plant and equipment is derecognised upon disposal or when no future economic benefits are expected to arise from the continued use of the asset. Any gain or loss arising on derecognition of the asset (calculated as the difference between the net disposal proceeds and the carrying amount of the item) is included in the income statement in the period the item is derecognised. Key judgement, estimates and assumptions Units of production method of depreciation and amortisation The Group applies the units of production method of depreciation and amortisation of its mine assets based on ore tonnes mined. These calculations require the use of estimates and assumptions. Significant judgement is required in assessing the available ore reserves, mineral resources and the production capacity of the operations to be depreciated under this method. Factors that are considered in determining ore reserves, mineral resources and production capacity include the Group’s history of converting mineral resources to ore reserves and the relevant timeframes, the complexity of metallurgy, markets and future developments. The Group uses economically recoverable mineral resources (comprising proven and probable ore reserves) to depreciate assets on a units of production basis. However, where a mineral property has been acquired and an amount has been attributed to the fair value of mineral resources not yet designated as ore reserves, the additional mineral resources may be taken into account. When these factors change or become known in the future, such differences will impact pre-tax profit and carrying values of assets. Impairment of property, plant and equipment The carrying value of property, plant and equipment is reviewed for impairment if there is any indication that the carrying amount may not be recoverable. Where a review for impairment is conducted, the recoverable amount is assessed by reference to either the ‘value-in-use’ (being the net present value of expected future cash flows of the relevant cash generating unit) or ‘fair value less cost of disposal’. In determining value-in-use, future cash flow forecasts for each cash generating unit (i.e. each mine) are prepared utilising management’s latest estimates of mine life, mineral resource and ore reserve recovery, operating and development costs, royalties and taxation, and other relevant cash inflows and outflows. Cash flow scenarios for a range of commodity prices and foreign exchange rates are assessed using internal and external market forecasts, and the present value of the forecast cash flows is determined utilising a discount rate based on industry weighted average cost of capital. The Group’s cash flows are most sensitive to movements in iron ore prices, the discount rate and key operating costs. Variations to the expected future cash flows, and the timing thereof, could result in significant changes to any impairment assessment or losses recognised, if any, which could in turn impact future financial results. Refer note 16 for further details on impairment.
50 MOUNT GIBSON IRON LIMITED 2019 Annual Report

Notes to the Consolidated Financial Report (continued)
2019 2018 Notes $’000 $’000
Deferred acquisition, exploration and evaluation – at cost 18,103 18,100 Allowance for impairment (18,103) (18,100) - - Reconciliation Carrying amount at beginning of the year - - Additions 223 46 Net impairment reversal/(expense) (3) 62 Write-back of accruals - (70) Exploration expenditure written off (220) (38) Carrying amount at the end of the year - -
Recognition and measurement Acquisition costs Exploration and evaluation costs arising from acquisitions are carried forward where exploration and evaluation activities have not, at balance date, reached a stage to allow a reasonable assessment regarding the existence of economically recoverable reserves. Exploration and evaluation costs Costs arising from exploration and evaluation activities are capitalised if activities in the area of interest have not yet reached a stage which permits a reasonable assessment of the existence or otherwise of economically recoverable reserves. To the extent that it is determined in the future that this capitalised expenditure should be written off, this will reduce profits and net assets in the period in which this determination is made. A regular review is undertaken of each area of interest to determine the appropriateness of continuing to carry forward costs in relation to that area of interest. Where uncertainty exists as to the future viability of certain areas, the value of the area of interest is written off to the income statement or provided against.
Key estimates and assumptions: impairment of capitalised exploration and evaluation expenditure The future recoverability of capitalised exploration and evaluation expenditure is dependent on a number of factors, including whether the Group decides to exploit the related lease itself or, if not, whether it successfully recovers the related exploration and evaluation asset through sale. Factors which could impact the future recoverability include the level of mineral resources and ore reserves, future technological changes which could impact the cost of mining, future legal changes (including changes to environmental restoration obligations) and changes to commodity prices. To the extent that capitalised exploration and evaluation expenditure is determined not to be recoverable in the future, this will reduce profits and net assets in the period in which this determination is made.
14. Deferred Acquisition, Exploration and Evaluation Costs
MOUNT GIBSON IRON LIMITED 2019 Annual Report 51

Notes to the Consolidated Financial Report (continued)
2019 2018 $’000 $’000
Mine properties - at cost 1,361,526 1,629,644 Accumulated amortisation and impairment (1,166,532) (1,541,863) 194,994 87,781
Koolan Island Extension Hill Total
2019 2018 2019 2018 2019 2018
Reconciliation $’000 $’000 $’000 $’000 $’000 $’000
Deferred Waste
Carrying amount at the beginning of the period - - - - - -
Deferred waste capitalised 65,615 - - - 65,615 -
Amortisation expensed (1,039) - - - (1,039) -
Carrying amount at the end of the period 64,576 - - - 64,576 -
Other mine properties
Carrying amount at the beginning of the period 85,529 4,988 2,252 5,903 87,781 10,891
Additions 38,799 79,963 - 267 38,799 80,230
Mine rehabilitation – revised estimate adjustment 8,125 578 - 207 8,125 785
Amortisation expensed (2,035) - (2,252) (4,125) (4,287) (4,125)
Carrying amount at the end of the period 130,418 85,529 - 2,252 130,418 87,781
Total mine properties 194,994 85,529 - 2,252 194,994 87,781
The security pledged for financing facilities includes mining mortgages over the mining tenements and contractual rights to mine hematite deposits owned by the Group (refer note 18).
Recognition and measurement Deferred stripping As part of its mining operations, the Group incurs mining stripping (waste removal) costs both during the development and production phase of its operations. When stripping costs are incurred in the development phase of a mine before the production phase commences (development stripping), such expenditure is capitalised as part of the cost of constructing the mine and subsequently amortised over its useful life using a units of production method, in accordance with the policy applicable to mine properties. The capitalisation of development stripping costs ceases when the mine or relevant component thereof is commissioned and ready for use as intended by management. Waste development costs incurred in the production phase creates two benefits, being either the production of inventory or improved access to the ore to be mined in the future. Where the benefits are realised in the form of inventory produced in the period, the production stripping costs are accounted for as part of the cost of producing those inventories. Where production stripping costs are incurred and the benefit is improved access to ore to be mined in the future, the costs are recognised as a stripping activity asset within mine properties. If the costs of the inventory produced and the stripping asset are not separately identifiable, the allocation is undertaken based on the waste-to-ore stripping ratio for the particular ore component concerned. If mining of waste in a period occurs in excess of the expected life-of-component waste-to-ore strip ratio, the excess is recognised as part of the stripping asset. Where mining occurs at or below the expected life-of-component stripping ratio in a period, the entire production stripping cost is allocated to the cost of the ore inventory produced. Amortisation is provided on the units-of-production method over the life of the identified orebody component. The units-of-production method results in an amortisation charge proportional to the depletion of the economically recoverable mineral resources (comprising proven and probable reserves).
15. Mine Properties
52 MOUNT GIBSON IRON LIMITED 2019 Annual Report

Notes to the Consolidated Financial Report (continued)
15. Mine Properties (Continued)
Other mine properties Other mine properties represent the accumulation of all acquisition, exploration, evaluation and development expenditure incurred by or on behalf of the Group in relation to areas of interest in which the mining of mineral resources has commenced. When further development expenditure is incurred in respect of a mine property after the commencement of production, such expenditure is carried forward as part of the cost of that mine property only when substantial future economic benefits are established, otherwise such expenditure is classified as part of the cost of production. Amortisation is provided on the units-of-production method over the life of the mine, with separate calculations being made for each mineral resource. The units-of-production method results in an amortisation charge proportional to the depletion of the economically recoverable mineral resources (comprising proven and probable reserves). A regular review is undertaken of each area of interest to determine the appropriateness of continuing to carry forward costs in relation to that area of interest. Impairment expenses are recognised to the extent that the carrying amount of the mine properties asset exceeds its estimated recoverable amount. Refer to note 16 for further details on impairment. Key judgement and estimate Determining the beginning of production Judgement is required to determine when capitalisation of development costs ceases and amortisation of mine assets commences upon the start of commercial production. This is based on the specific circumstances of the project, and considers when the specific asset is substantially complete and becomes ‘available for use’ as intended by management which includes consideration of the following factors: completion of reasonable testing of the mine plant and equipment; mineral recoveries, availability and throughput levels at or near expected levels; the ability to produce iron ore in saleable form (where more than an insignificant amount is produced); and the achievement of continuous production. With respect to Koolan Island, mining access was gained to the first benches of high-grade ore in March 2019. The first shipment of high-grade ore, averaging 65% Fe, was completed in late April 2019. Mining and ore production were progressively ramped up and the project moved into the production phase at the end of May 2019. Stripping activity assets Judgment is required to identify a suitable production measure to be used to allocate production stripping costs between inventory and any stripping activity asset(s) for each orebody component. The Group considers that the ratios of the expected volume of waste to be stripped for an expected volume of ore to be mined for a specific component of orebody, to be the most suitable production measure. In identifying and defining the orebody components, judgment is required to determine the expected volumes of waste to be stripped and ore to be mined in each of these components. These assessments are based on the information available in the mine plan which will vary between mines for various reasons, including, the geological characteristics of the orebody, the geographical location and/or financial considerations. Stripping ratio Significant judgment is required in determining the waste capitalisation ratio for each component of the mine. Factors that are considered include: any proposed changes in the design of the mine; estimates of the quantities of ore reserves and mineral resources for which there is a high degree of confidence of economic extraction; identifiable components of orebody; future production levels; impacts of regulatory obligations and taxation legislation; and future cash cost of production Impairment of capitalised mine development expenditure The future recoverability of capitalised mine development expenditure is dependent on a number of factors, including the level of mineral resources and ore reserves, future technological changes which could impact the cost of mining, future legal changes (including changes to environmental restoration obligations) and changes to commodity prices and exchange rates. The Group regularly reviews the carrying values of its mine development assets in the context of internal and external consensus forecasts for commodity prices and foreign exchange rates, with the application of appropriate discount rates for the assets concerned. To the extent that capitalised mine development expenditure is determined not to be recoverable in the future, this will reduce profits and net assets in the period in which this determination is made. Capitalised mine development expenditure is assessed for recoverability along with property, plant and equipment as described below. Refer note 16 for further details on impairment.
MOUNT GIBSON IRON LIMITED 2019 Annual Report 53

Notes to the Consolidated Financial Report (continued)
The Group reviews the carrying value of the assets of each Cash Generating Unit (CGU) at each balance date for indicators of potential impairment or reversal thereof. Where such indicators exist, the Company utilises the approaches under applicable accounting pronouncements for assessment of any impairment expenses or reversals.
No impairment indicators were identified for any of the Group’s CGUs at 30 June 2019.
The Group performed an impairment reversal trigger assessment of the Koolan Island CGU at 30 June 2019 as this CGU had previously been impaired in prior periods. Impairment reversal triggers were identified for the Koolan Island CGU at 30 June 2019.
Accordingly, the Group assessed the recoverable amount of the Koolan Island CGU as at 30 June 2019 using the Fair Value Less Costs of Disposal (FVLCD) approach. The FVLCD is assessed as the present value of the future cash flows expected to be derived from the operation less disposal costs (level 3 in the fair value hierarchy), utilising the following key assumptions for the CGU:
Cashflow forecasts were made based on recent actual performance, budgets and anticipated revenues and estimated operating and capital costs over the remaining life of the mine;
Discount rate of 10.0% (nominal, after tax); Iron ore price forecasts for the 62% Fe benchmark fines CFR prices (northern China), expressed in real 2019 terms, of US$73/dmt in
2019/20 (falling over the following five years to US$55/dmt), at an exchange rate of A$1.00/US$0.705 in 2019/20 (rising to US$0.735 for three years and US$0.740 thereafter) with sensitivities undertaken for a broad range of these inputs;
Forecast realised sales prices reflect a reasonable high grade premium for 65% Fe iron ore; and Revenue and cost inflation estimates of 2.0% per year.
The Group’s assessment of the Koolan Island CGU has concluded that no impairment reversal is required as at 30 June 2019.
The cashflow estimates for the Koolan Island CGU are most sensitive to changes in iron ore prices and the A$/US$ exchange rate. It is estimated that changes in these key assumptions would impact the recoverable amount of the CGU as at 30 June 2019 as follows:
An increase in the benchmark 62% Fe CFR fines iron ore price by 10% would increase the CGU’s recoverable amount by approximately $97 million; and
A reduction in the A$/US$ exchange rate by 10% would increase the CGU’s recoverable amount by approximately $82 million.
Recognition and measurement Recoverable amount of assets At each reporting date, the Group assesses whether there is any indication that an asset may be impaired. Where an indicator of impairment exists, the Group makes a formal estimate of recoverable amount. Where the carrying amount of an asset exceeds its recoverable amount, the asset is considered impaired and is written down to its recoverable amount. Recoverable amount is the greater of fair value less costs to sell and value-in-use. Recoverable amount is determined for an individual asset, unless the asset’s value-in-use cannot be estimated to be close to its fair value less cost to sell and it does not generate cash inflows that are largely independent of those from other assets or groups of assets, in which case the recoverable amount is determined for the cash-generating unit to which the asset belongs. In assessing value-in-use, the estimated future cash flows are discounted to their present value using a pre-tax discount rate that reflects current market assessments of the time value of money and the risks specific to the asset. In allocating an impairment loss, the carrying amount of an individual asset is not taken below its individual recoverable amount. An assessment is also made at each reporting date as to whether there is any indication that a previously recognised impairment loss may no longer exist or may have decreased. If such indication exists, the recoverable amount is estimated. A previously recognised impairment loss is reversed only where there has been a change in the estimates used to determine the asset’s recoverable amount since the last impairment loss was recognised. If that is the case the carrying amount of the asset is increased to its recoverable amount. That increased amount cannot exceed the carrying amount that would have been determined, net of depreciation and amortisation, had no impairment loss been recognised for the asset in prior years. Such reversal is recognised in profit or loss unless the asset is carried at revalued amount, in which case the reversal is treated as a revaluation increase. After such a reversal, the depreciation or amortisation charges are adjusted in future periods to allocate the asset’s revised carrying amount, less any residual value, on a systematic basis over its remaining useful life.
16. Impairment of Non-Current Assets
54 MOUNT GIBSON IRON LIMITED 2019 Annual Report

Notes to the Consolidated Financial Report (continued)
2019 2018 Notes $’000 $’000
Current Trade creditors [i] 20,463 15,289 Accruals and other payables [i] 34,731 26,789 55,194 42,078
[i] Current trade creditors and other payables are non-interest bearing and are normally settled on 30 day terms.
Recognition and measurement Trade payables, accruals and other payables are carried at amortised costs and represent liabilities for goods and services provided to the Group prior to the end of the financial year that are unpaid and arise when the Group becomes obliged to make future payments in respect of the purchase of these goods and services.
2019 2018 Notes $’000 $’000
Current Insurance premium funding facility [a] 1,753 - 1,753 -
The following off-balance sheet financing facility had been negotiated and was available at the reporting date:
Performance bonding facility [b] Used at reporting date 7,087 9,444 Unused at reporting date 12,913 10,556 20,000 20,000 Terms and conditions relating to the above financing facilities: [a] Insurance premium funding facility
Insurance premium arrangements have been entered into by the Group to fund its annual insurance premiums. Interest is charged at 3.74% pa. The loan is repayable monthly with the final instalment due in September 2019.
[b] Performance bonding facility In May 2011, the Company entered into a Facility Agreement comprising a Corporate Loan facility and a Performance Bonding facility. The undrawn Corporate Loan facility was cancelled in April 2013. The Performance Bonding facility was reduced in size from $55,000,000 to $20,000,000 in June 2017 and extended to 30 June 2021. As at balance date, bonds and guarantees totalling $7,087,000 were drawn under the Performance Bonding Facility. The security pledge for the Performance Bonding Facility is a fixed and floating charge over all the assets and undertakings of Mount Gibson Iron Limited, Mount Gibson Mining Limited, Geraldton Bulk Handling Pty Ltd, Koolan Iron Ore Pty Ltd and Aztec Resources Limited, together with mining mortgages over the mining tenements owned by Mount Gibson Mining Limited and Koolan Iron Ore Pty Ltd and the contractual rights of Mount Gibson Mining Limited to mine hematite iron ore at Extension Hill.
Recognition and measurement All loans and borrowings are initially recognised at the fair value of the consideration received less directly attributable transaction costs. After initial recognition, interest-bearing loans and borrowings are subsequently measured at amortised cost using the effective interest rate method. Fees paid on the establishment of loan facilities are included as part of the carrying amount of the loans and borrowings. Gains and losses are recognised in the profit or loss when the liabilities are derecognised.
2019 2018 Notes $’000 $’000 19. Derivative Financial Liabilities
Current Foreign currency option contracts 35[b][i] 3 325 Iron ore swap contracts 35[e] 6,039 - 6,042 325
17. Trade and Other Payables
18. Interest-Bearing Loans and Borrowings
MOUNT GIBSON IRON LIMITED 2019 Annual Report 55

No
tes
to t
he
Co
nso
lidat
ed F
inan
cial
Rep
ort
(co
nti
nu
ed)
Road
Res
ealin
g Re
stru
ctur
e D
ecom
mis
sion
ing
Reha
bilit
atio
n To
tal
2019
20
18
2019
20
18
2019
20
18
2019
20
18
$’00
0 $’
000
$’00
0 $’
000
$’00
0 $’
000
$’00
0 $’
000
Curre
nt
1,20
0 2,
000
526
3,55
9 4,
933
980
6,65
9 6,
539
Non-
Curre
nt
- -
- -
43,0
03
40,3
66
43,0
03
40,3
66
1,20
0 2,
000
526
3,55
9 47
,936
41
,346
49
,662
46
,905
Reco
ncili
atio
n
Carry
ing
amou
nt a
t the
beg
inni
ng o
f the
yea
r 2,
000
2,53
6 3,
559
- 41
,346
39
,851
46
,905
42
,387
Prov
ision
for p
erio
d -
256
- 3,
559
- -
- 3,
815
Amou
nts
utilis
ed d
urin
g th
e pe
riod
(422
) (1
79)
(3,0
33)
- (7
30)
(135
) (4
,185
) (3
14)
Inte
rest
acc
retio
n on
reha
bilit
atio
n pr
ovisi
on -
expe
nsed
-
- -
- 92
7 84
5 92
7 84
5
Revi
sed
estim
ate
adju
stm
ent –
con
tinui
ng o
pera
tions
-
- -
- (1
,621
) -
(1,6
21)
-
Revi
sed
estim
ate
adju
stm
ent –
disc
ontin
ued
oper
atio
ns
(378
) (6
13)
- -
(111
) -
(489
) (6
13)
Revi
sed
estim
ate
adju
stm
ent –
min
e pr
oper
ties
asse
t -
- -
- 8,
125
785
8,12
5 78
5
Carr
ying
am
ount
at t
he e
nd o
f the
yea
r 1,
200
2,00
0 52
6 3,
559
47,9
36
41,3
46
49,6
62
46,9
05
Road
rese
alin
g Th
is pr
ovisi
on re
late
s to
the
fore
cast
cos
t of r
oadw
orks
ass
ocia
ted
with
the
Talle
ring
Peak
and
Ext
ensio
n Hi
ll m
ine
sites
.
Rest
ruct
ure
This
prov
ision
rela
tes
to th
e fo
reca
st c
osts
ass
ocia
ted
with
rele
ase
of p
erso
nnel
on
the
win
d do
wn
and/
or c
losu
re o
f the
Ext
ensio
n Hi
ll m
ine
site
whe
re a
det
aile
d fo
rmal
pla
n ha
s be
en a
ppro
ved
and
com
mun
icate
d to
the
rele
vant
min
e sit
e w
orkf
orce
.
Dec
omm
issi
onin
g re
habi
litat
ion
This
prov
ision
rep
rese
nts
the
pres
ent v
alue
of d
ecom
miss
ioni
ng a
nd r
ehab
ilitat
ion
cost
s fo
r th
e Ta
llerin
g Pe
ak, K
oola
n Is
land
and
Ext
ensio
n Hi
ll sit
es.
The
cost
est
imat
es fo
rmin
g th
e ba
sis o
f the
pr
ovisi
ons
wer
e pr
epar
ed a
s at
the
end
of th
e fin
ancia
l yea
r by
inde
pend
ent c
onsu
ltant
s sp
ecia
lisin
g in
min
e clo
sure
pla
nnin
g an
d m
ine
reha
bilit
atio
n co
st e
stim
ates
. Th
e tim
ing
of d
ecom
miss
ioni
ng
and
reha
bilit
atio
n ex
pend
iture
is d
epen
dent
on
the
life
of t
he m
ines
and
on
the
timin
g of
the
reh
abilit
atio
n re
quire
men
ts, w
hich
may
var
y in
the
fut
ure.
Ba
sed
on c
urre
nt e
stim
ates
, the
bul
k of
ex
pend
iture
on
deco
mm
issio
ning
reha
bilit
atio
n is
expe
cted
to o
ccur
at T
alle
ring
Peak
and
Ext
ensio
n Hi
ll w
ithin
the
next
1-3
yea
rs, a
nd a
t Koo
lan
Isla
nd b
etw
een
4-6
year
s fro
m b
alan
ce d
ate.
20.
Prov
isio
ns
56 MOUNT GIBSON IRON LIMITED 2019 Annual Report

Notes to the Consolidated Financial Report (continued)
2019 2018 $’000 $’000 20. Provisions (Continued)
The following table summarises the decommissioning rehabilitation provision by mine site:
Tallering Peak 730 980 Koolan Island 37,353 28,542 Extension Hill 9,853 11,824
47,936 41,346
Recognition and measurement Rehabilitation costs Long-term environmental obligations are based on the Group’s environmental management plans, in compliance with current environmental and regulatory requirements. Full provision is made based on the present value of the estimated cost of restoring the environmental disturbance that has occurred up to the balance sheet date. Increases due to additional environmental disturbances, relating to the development of an asset, are capitalised and amortised over the remaining lives of the area of interest. Annual increases in the provision relating to the change in the present value of the provision are accounted for in the income statement as borrowing costs. The estimated costs of rehabilitation are reviewed annually and adjusted as appropriate for changes in legislation, technology or other circumstances. Cost estimates are not reduced by potential proceeds from the sale of assets. Restructuring provision Restructuring provisions are recognised by the Group only when a detailed formal plan identifies the business or part of the business concerned, the location and number of employees affected, a detailed estimate of the associated costs, and an appropriate timeline, and the employees affected have been notified of the plan’s main features. Other Provisions Provisions are recognised when the Group has a present obligation (legal or constructive) as a result of a past event, it is probable that an outflow of resources embodying economic benefits will be required to settle the obligation and a reliable estimate can be made of the amount of the obligation. If the effect of the time value of money is material, provisions are determined by discounting the expected future cash flows at a pre-tax rate that reflects the current market assessments of the time value of money and, where appropriate, the risks specific to the liability. Where discounting is used, the increase in the provision due to the passage of time is recognised as a finance cost. A provision for dividends is not recognised as a liability unless the dividends have been declared, determined or publicly recommended on or before the balance date. Key estimate: mine rehabilitation provision The Group assesses its mine rehabilitation provision annually in accordance with the accounting policy stated above. Significant judgement is required in determining the provision for mine rehabilitation as there are many factors that will affect the ultimate liability payable to rehabilitate the mine site. These include future development, changes in anticipated rehabilitation activities and costs, changes in technology, commodity price changes and changes in interest rates. When these factors change or become known in the future, such differences will impact the mine rehabilitation provision in the period in which they change or become known.
MOUNT GIBSON IRON LIMITED 2019 Annual Report 57

Notes to the Consolidated Financial Report (continued)
2019 2018 $’000 $’000
[a] Ordinary shares
Issued and fully paid 583,395 568,328
2019 2018
Notes Number of Shares $’000 Number of
Shares $’000
[b] Movement in ordinary shares on issue
Balance at the beginning of the financial year 1,091,813,060 568,328 1,091,813,060 568,328 Shares issued under Dividend Reinvestment Plan 29,883,486 14,464 - - Shares fully paid under LSP [f] 2,168,889 603 - -
1,123,865,435 583,395 1,091,813,060 568,328 Restricted shares – reserved for Loan Share Plan:
Balance at the beginning of the financial year 4,749,456 - 4,749,456 - Shares issued under LSP 2,998,351 - - - Shares forfeited under LSP [f] (1,074,623) - - - Conversion of fully paid shares under LSP [f] (2,168,889) - - -
4,504,295 - 4,749,456 - Balance at the end of the financial year 1,128,369,730 583,395 1,096,562,516 568,328
[c] Terms and conditions of contributed equity Ordinary shares have the right to receive dividends as declared, and in the event of winding up the Company, to participate in the proceeds from the sale of all surplus assets in proportion to the number of and amounts paid up on shares held. Ordinary shares entitle their holder to one vote, either in person or by proxy, at a meeting of the Company. Effective from 1 July 1998, the Corporations legislation abolished the concept of authorised capital and par values. Accordingly, the Company does not have authorised capital nor a par value in respect of its issued shares.
[d] Share options As at 30 June 2019, there were no options on issue (2018: nil). Share options carry no right to dividends and no voting rights.
[e] Performance rights During the year ended 30 June 2019, no Performance Rights were issued. No Performance Rights vested during the year (2018: nil). As at 30 June 2019, there were no Performance Rights on issue (2018: nil) – see note 25(c).
[f] Loan Share Plan (in-substance options) During the year ended 30 June 2019, 2,998,351 shares under the LSP were issued. No shares under the LSP vested during the year (2018: 4,749,456). A total of 1,074,623 shares under the LSP were forfeited upon the resignation of Mr Jim Beyer on 30 September 2018. These shares were subsequently reissued under the Company’s Dividend Reinvestment Plan (see note 27). During the year ended 30 June 2019, Mr Jim Beyer repaid the loan for the shares that were issued on 24 August 2016 under the LSP which vested in July 2017. Accordingly, 2,168,889 shares that were previously reported as restricted shares are now reported as unrestricted shares.
[g] Capital management The primary objectives of the Group’s capital management program are to safeguard the Group’s ability to continue as a going concern, so that it can provide returns for shareholders and benefits for other stakeholders, and to maintain an optimal capital structure to reduce the cost of capital. The Group manages its capital structure and makes adjustments to it in light of changes in economic conditions. To maintain or adjust the capital structure, the Group may adjust the dividend payment to shareholders, return capital to shareholders, buy back shares or issue new shares or other securities. No changes were made in the objectives, policy or processes for managing capital during the year ended 30 June 2019.
21. Issued Capital
58 MOUNT GIBSON IRON LIMITED 2019 Annual Report

Notes to the Consolidated Financial Report (continued)
2019 2018 Notes $’000 $’000
Share based payments reserve [a] 20,837 20,531 Net unrealised gains reserve [b] 860 803 Dividend distribution reserve [c] 964,262 964,262 Equity reserves [d] (3,192) (3,192) 982,767 982,404
[a] Share based payments reserve
This reserve is used to record the value of equity benefits provided to employees and directors as part of their remuneration. Balance at the beginning of the year 20,531 20,531 Share based payments 306 - Balance at the end of the year 20,837 20,531
[b] Net unrealised gains reserve
This reserve records movement for financial assets classified as fair value through other comprehensive income (2018: available for sale financial assets) and gains and losses on hedging instruments classified as effective cash flow hedges. Balance at the beginning of the year 803 232 Net gain/(loss) on cash flow hedges 179 (411) Change in fair value of available for sale financial assets (122) 982 Deferred income tax on cash flow hedges - - Balance at the end of the year 860 803
[c] Dividend distribution reserve
This reserve is used to record profits from prior income years for the purpose of future dividend distribution by the Company. Balance at the beginning of the year 964,262 964,262 Movement during the period - - Balance at the end of the year 964,262 964,262
[d] Equity reserves
This reserve is used to record the gain or loss arising from the sale or acquisition of non-controlling interests to or from third party investors. Balance at the beginning of the year (3,192) (3,192) Movement during the period - - Balance at the end of the year (3,192) (3,192)
22. Reserves
MOUNT GIBSON IRON LIMITED 2019 Annual Report 59

Notes to the Consolidated Financial Report (continued)
2019 2018 Notes $’000 $’000
23. Accumulated Losses Balance at the beginning of the year (1,053,908) (1,131,178) Dividends paid during the period (32,811) (21,859) Net profit attributable to members of the Company 133,369 99,129 Balance at the end of the year (953,350) (1,053,908)
[a] Exploration Expenditure Commitments [i]
Minimum obligations not provided for in the financial report and are payable: Not later than one year 470 470 Later than one year but not later than five years 1,292 1,401 Later than five years 1,721 2,088
3,483 3,959
[b] Operating Lease Commitments [ii]
Minimum lease payments Not later than one year 9,245 1,496 Later than one year but not later than five years 14,820 3,119 Later than five years 29 -
24,094 4,615
[c] Property, plant and equipment commitments [iii]
Commitments contracted for at balance date but not recognised as liabilities Not later than one year 2,857 5,246 Later than one year but not later than five years - -
2,857 5,246
[d] Contractual commitments [iv]
Commitments for the payment of other mining and transport contracts: Not later than one year 13,274 9,485 Later than one year but not later than five years 3,750 -
17,024 9,485
[i] In order to maintain current rights to explore and mine the tenements at its various mines and projects, the Group is required to perform minimum exploration work to meet the expenditure requirements specified by the Department of Mines, Industry Regulation and Safety.
[ii] Operating leases relate to leases for office space and land with an initial term of 5 years, and leases for equipment which have an average term of 2.4 years.
[iii] The Group has contractual commitments to purchase property, plant and equipment at Koolan Island and Extension Hill. [iv] Amounts disclosed as contractual commitments relate primarily to supplier arrangements at the Group’s Extension Hill and Koolan
Island sites where financial obligations, including minimum notice periods, apply in the case of termination.
24. Expenditure Commitments
60 MOUNT GIBSON IRON LIMITED 2019 Annual Report

Notes to the Consolidated Financial Report (continued)
2019 2018 Notes $’000 $’000
(a) Recognised share-based payment expense
Expense arising from equity-settled share-based payment transactions 4[c] 306 -
The share-based payment plans are described below. There have been no cancellations of any of the plans during 2019 or 2018.
(b) Employee Option Scheme
An Employee Option Scheme has been established where the Company may, at the discretion of the Board, grant options over the ordinary shares of the Company. The options, issued for nil consideration, are granted in accordance with performance guidelines established by the Directors of the Company. All Directors, officers and employees are eligible for this scheme. No options were issued during the year ended 30 June 2018. As at balance date, no options over unissued shares were on issue.
(c) Performance Rights Plan
The Company has established a Performance Rights Plan. Rights are granted at no cost to recipients and convert (vest) into ordinary shares on completion by the recipient of minimum periods of continuous service and the satisfaction of specified performance hurdles, including those related to the Company's Total Shareholder Return measured against a comparator group of companies over specified periods. There were no Performance Rights issued during the year and there were no Performance Rights on issue as at 30 June 2019.
(d) Loan Share Plan
The Company previously established a Loan Share Plan (LSP) under which ordinary shares in the Company may be issued to eligible participants, with vesting of the shares being subject to the satisfaction of stipulated market conditions. The shares are issued at their market value with the recipient required to pay this market value in order to take up the share offer. The Company or any of its subsidiaries will provide a loan to fund the acquisition price. The loan is interest-free and is secured against the shares in the form of a holding lock preventing all dealing in the shares. The loan is limited recourse such that if the shares do not ultimately vest and are therefore forfeited, this is treated as full repayment of the loan balance. While the loan balance remains outstanding, any dividends paid on the shares, net of the tax on the dividends, will be automatically applied towards repayment of the loan. In making the loan in respect of the newly issued shares, there is no cash cost to the Company as the shares are newly issued. On 2 July 2018, the Company issued 2,998,351 shares under the LSP. In accordance with the terms of the LSP, the shares were issued with an index share price of $0.443 per share and pursuant to the vesting conditions, these shares do not vest unless a share price target of a 10% premium to the index price is met between 1 July 2019 and 1 July 2023 and the participants remain continuously employed by the Group. The award was accounted for as an in-substance option award and the fair value at grant date assessed at $0.159 per LSP share. In calculating this fair value, a Monte Carlo simulation model was utilised over several thousand simulations to predict the share price at each vesting test date and whether the 10% hurdle would be satisfied, with the resultant values discounted back to the grant date. The underlying share price and the exercise price was $0.45 per share, the period to exercise was assumed as three years (being half way between the first possible vesting date and the expiry of the LSP shares), the risk free rate was 2.11% based on Australian Government bond yields with three year lives, the estimated volatility was 50% based on historical share price analysis, and the dividend yield was assumed as nil. A total of 1,074,623 previously issued shares under the LSP were forfeited upon the resignation of Mr Jim Beyer on 30 September 2018. These shares were subsequently reissued under the Company’s Dividend Reinvestment Plan (refer note 27). The following table shows the number and weighted average exercise prices (WAEP) of, and movements in, LSP shares during the year:
2019 2018
Number of LSP Shares WAEP1
Number of LSP Shares WAEP1
Balance at beginning of the year 4,749,456 $0.28 4,749,456 $0.30 - granted during the year 2,998,351 $0.44 - - - exercised during the year (2,168,889) 2 $0.28 - - - forfeited during the year (1,074,623) $0.44 - - Balance at end of the year 4,504,295 $0.34 4,749,456 $0.30
1 Weighted average exercise price at balance date after dividend adjustments. 2 The weighted average share price at the date of exercise of these LSP shares was $1.19.
25. Share-Based Payment Plans
MOUNT GIBSON IRON LIMITED 2019 Annual Report 61

Notes to the Consolidated Financial Report (continued)
25. Share-Based Payment Plans (Continued)
Recognition and measurement Share-based payment transactions The Group provides benefits to employees (including directors) of the Group in the form of share-based payment transactions, whereby employees render services in exchange for shares or rights over shares (equity-settled transactions). Options There is currently a Directors, Officers, Employees and Other Permitted Persons option plan. The cost of any options issued under this plan is measured by reference to their fair value at the date at which they are granted. The fair value is typically determined by using a binomial model. No account is taken of any performance conditions, other than conditions linked to the price of the shares of the Company. Performance rights There is a Mount Gibson Iron Limited Performance Rights Plan (PRP). The PRP enables the Company to provide its executives with long term incentives which create a link between the delivery of value to shareholders, financial performance and rewarding and retaining the executives. The cost of Performance Rights issued under the PRP is measured by reference to their fair value at the date at which they are granted. The fair value is determined using either a Black-Scholes or Monte Carlo option valuation model. Loan share plan There is a Mount Gibson Iron Limited Loan Share Plan (LSP). The LSP enables the Company to provide its executives with long term incentives which create a link between the delivery of value to shareholders, financial performance and rewarding and retaining the executives. This plan is accounted for as an in-substance option award. The cost of these share rights is measured by reference to the fair value at the date at which they are granted. The fair value is measured by reference to the quoted market price on the Australian Stock Exchange and using a Monte Carlo simulation model. Equity-Settled Transactions Generally The cost of equity-settled transactions is recognised, together with a corresponding increase in equity, over the period in which the performance conditions are fulfilled, ending on the date on which the relevant employees become fully entitled to the award (vesting date). The cumulative expense recognised for equity-settled transactions at each reporting date until vesting date reflects (i) the extent to which the vesting period has expired and (ii) the number of awards that, in the opinion of the Directors of the Group, will ultimately vest. This opinion is formed based on the best available information at balance date. No adjustment is made for the likelihood of market performance conditions being met as the effect of these conditions is included in the determination of fair value at grant date. No expense is recognised for awards that do not ultimately vest, except for awards where vesting is conditional upon a market condition. Where the terms of an equity-settled award are modified, as a minimum an expense is recognised as if the terms had not been modified. In addition, an expense is recognised for any increase in the value of the transaction as a result of the modification, as measured at the date of modification. Where an equity-settled award is cancelled, it is treated as if it had vested on the date of cancellation, and any expense not yet recognised for the award is recognised immediately. However, if a new award is substituted for the cancelled award, and designated as a replacement award on the date that it is granted, both the cancelled and new award are treated as if they were a modification of the original award, as described in the previous paragraph. The dilutive effect, if any, of outstanding options, Performance Rights and LSP shares is reflected as additional share dilution in the computation of earnings per share.
62 MOUNT GIBSON IRON LIMITED 2019 Annual Report

Notes to the Consolidated Financial Report (continued)
Basic earnings per share is calculated by dividing net profit for the year attributable to ordinary equity holders of the Company by the weighted average number of ordinary shares outstanding during the year.
Diluted earnings per share amounts is calculated by dividing the net profit attributable to ordinary equity holders of the Company by the weighted average number of ordinary shares outstanding during the year plus the weighted average number of ordinary shares that would be issued on the conversion of all the dilutive potential ordinary shares into ordinary shares.
The following reflects the income and share data used in the calculations of basic and diluted earnings per share:
2019 2018 $’000 $’000 Profit used in calculating basic and diluted earnings per share:
Continuing operations 133,245 99,103 Discontinued operations 124 26
Profit attributable to ordinary equity holders of the Company 133,369 99,129
Number of Shares
Number of Shares
Weighted average number of ordinary shares used in calculating basic earnings per share 1,113,380,526 1,091,813,060 Effect of dilution - Restricted shares (in-substance options) 2,319,616 4,749,456 Weighted average number of ordinary shares used in calculating diluted earnings per share 1,115,700,142 1,096,562,516 Earnings per Share (cents per share): Basic earnings per share 11.98 9.08 Diluted earnings per share 11.95 9.04
Conversions, calls, subscriptions or issues after 30 June 2019
Immediately after year end, on 3 July 2019, an issue of 1,705,800 restricted shares was made under the LSP. In accordance with the terms of the LSP, the shares were issued at an index share price of $1.03 per share. In order for the shares to vest, the participants must remain continuously employed with the Group to at least 1 July 2020 and the Company’s share price, as measured by a rolling five day volume weighted average price of the Company’s shares traded on the ASX, must on 1 July 2020 or at any time in the following four year period be above a 10% premium to the index price of the shares. A total of 1,923,728 shares vested after balance date in July 2019. Other than as described above, there have been no issues of shares or exercises, conversions or realisations of options, performance rights or restricted LSP shares under any of the Company’s share-based payment plans since 30 June 2019. Recognition and measurement Basic earnings per share is calculated as net profit attributable to members of the parent, adjusted to exclude any costs of servicing equity (other than dividends) and preference share dividends, divided by the weighted average number of ordinary shares, adjusted for any bonus element. Diluted earnings per share is calculated as net profit attributable to members of the company, adjusted for: i) costs of servicing equity (other than dividends) and preference share dividends; ii) the after tax effect of dividends and interest associated with dilutive potential ordinary shares that have been recognised as expenses;
and iii) other non-discretionary changes in revenues or expenses during the period that would result from the dilution of potential ordinary
shares;
divided by the weighted average number of ordinary shares and dilutive potential ordinary shares, adjusted for any bonus element.
26. Earnings Per Share
MOUNT GIBSON IRON LIMITED 2019 Annual Report 63

Notes to the Consolidated Financial Report (continued)
[b] Dividends not recognised at the end of the reporting period:
On 20 August 2019, the Company declared a final dividend on ordinary shares in respect of the 2018/19 financial year of $0.04 per share fully franked, payable either in cash or in shares to eligible shareholders as part of the Company’s Dividend Reinvestment Plan. The total amount of the dividend is $45,203,000. The dividend has not been provided for in the 30 June 2019 financial statements.
[c] Franked dividends: The amount of franking credits available for the subsequent financial year are: Franking account balance as at the end of the financial year at 30% 35,706 49,843 Franking credits that will arise from the payment of income tax payable as at the end of the financial year - -
35,706 49,843 The amount of franking credits available for future reporting periods: Impact on the franking account of dividends proposed or declared before the financial report was authorised for issue but not recognised as a distribution to equity holders during the period
(19,373) (14,137)
16,333 35,706
Tax rates
The tax rate at which paid dividends have been franked is 30%.
1. The Group has a Performance Bonding facility drawn to a total of $7,087,000 as at balance date (2018: $9,444,000). The performance bonds secure the Group’s obligations relating primarily to environmental matters and infrastructure assets.
2. Certain claims arising with customers, employees, consultants, and contractors have been made by or against certain controlled entities in the ordinary course of business, some of which involve litigation or arbitration. The Directors do not consider the outcome of any of these claims will have a material adverse impact on the financial position of the consolidated entity.
2019 2018 $’000 $’000
27. Dividends Paid and Proposed Declared and paid during the year:
[a] Dividends on ordinary shares:
During the year ended 30 June 2019, a final dividend of $0.03 per share fully franked ($32,987,000) in respect of the 2017/18 financial year was distributed by way of $18,347,000 in cash and the issue of 29,883,486 new shares under the Company’s Dividend Reinvestment Plan.
28. Contingent Liabilities
64 MOUNT GIBSON IRON LIMITED 2019 Annual Report

Notes to the Consolidated Financial Report (continued)
[a] Compensation of Key Management Personnel
2019 2018 $ $ Short-term 3,682,201 2,922,817 Post employment 200,323 189,888 Long-term 108,880 75,767 Share-based payment 305,873 - 4,297,277 3,188,472
[b] Other Transactions and Balances with Key Management Personnel
There were no other transactions and balances with key management personnel during the year.
Ultimate parent
Mount Gibson Iron Limited is the ultimate Australian parent company.
Director-related entity transactions
Sales
During all or part of the year Mr Li was a director of Shougang Concord International Trading Pty Ltd (SCIT), and Mr Lee and Mr Ferguson were directors of APAC Resources Limited (APAC).
The following sale agreements were in place with director-related entities during the period:
The sale to SCIT of 80% of iron ore from Koolan Island’s available mined production over the life of mine.
The sale to a subsidiary of APAC of 20% of iron ore from Koolan Island’s available mined production of the life of mine.
The sale to SCIT of approximately 75% of the iron ore produced from the Iron Hill deposit at the Extension Hill mine site.
No ad hoc spot sales of iron ore to SCIT from Extension Hill.
Two ad hoc spot sales of iron ore to APAC from Extension Hill.
Pursuant to these sales agreements, during the financial year, the Group:
Sold 2,073,265 wet metric tonnes (WMT) (2018: 1,678,072 WMT) of iron ore to SCIT; and
Sold 264,712 WMT (2018: 366,940 WMT) of iron ore to APAC.
29. Key Management Personnel
30. Related Party Transactions
MOUNT GIBSON IRON LIMITED 2019 Annual Report 65

Notes to the Consolidated Financial Report (continued)
Amounts recognised at the reporting date in relation to director-related entity transactions:
2019 2018 $’000 $’000
Assets and Liabilities
Current Assets Receivables – APAC 11,877 (53) Receivables – SCIT 6,997 1,961 Total trade receivables 18,874 1,908 Total Assets 18,874 1,908 Current Liabilities Payables – APAC - - Payables – SCIT - - Total trade payables - - Total Liabilities - - Sales Revenue Sales revenue – APAC 43,066 18,893 Sales revenue – SCIT 176,344 130,278 Total Sales Revenue (before shipping freight) 219,410 149,171
Apart from the above, there are no director-related entity transactions other than those specified in note 29.
2019 2018 $ $
Amounts received or due and receivable by EY for: An audit or review of the financial report of the entity and any other entity in the
consolidated entity 200,054 192,095
Other services in relation to the entity and any other entity in the consolidated entity - - 200,054 192,095
31. Auditor’s Remuneration
66 MOUNT GIBSON IRON LIMITED 2019 Annual Report

Notes to the Consolidated Financial Report (continued)
2019 2018 $’000 $’000
The Tallering Peak operation was first reported as a discontinued operation in the financial report for the year ended 30 June 2015. Mining was completed in June 2014 and the final shipment of remnant low grade ore occurred in March 2017. Ongoing costs relate to rehabilitation and minor holding activities.
[a] Profit from discontinued operations The financial results of Tallering Peak operation for the year are presented below:
Impairment of debtors - (104) Revised estimate adjustment – road resealing and rehabilitation provisions 489 613 Other expenses (312) (483)
Profit before tax and finance costs from discontinued operations 177 26 Finance costs - -
Profit before tax from discontinued operations 177 26 Tax expense (53) -
Net profit after tax from discontinued operations 124 26
Earnings per share (cents per share): basic earnings per share 0.01 0.00 diluted earnings per share 0.01 0.00
[b] Cash flow from discontinued operations The net cash flows incurred by Tallering Peak operation are as follows: Operating (2,514) (653) Investing - - Financing - -
Net cash outflow from discontinued operations (2,514) (653)
32. Discontinued Operations
MOUNT GIBSON IRON LIMITED 2019 Annual Report 67

Notes to the Consolidated Financial Report (continued)
The Group has identified its operating segments based on the internal reports that are reviewed and used by the Chief Executive Officer and the executive management team in assessing performance and in determining the allocation of resources.
For management purposes, the Group has organised its operating segments into two reportable segments as follows:
Extension Hill segment – this segment includes the mining, crushing, transportation and sale of iron ore from the Extension Hill and Iron Hill iron ore deposits.
Koolan Island segment – this segment includes the reconstruction of the main pit seawall and mining, crushing and sale of iron ore from the Koolan Island iron operation.
Operating results for each reportable segment are reviewed separately by management for the purpose of making decisions about resource allocation and performance assessment. Segment performance is evaluated based on operating profit or loss and is measured consistently with operating profit or loss in the consolidated financial statements.
Except as noted below, the accounting policies applied for internal reporting purposes are consistent with those applied in the preparation of the financial statements.
For the purposes of segment reporting, revenue is disclosed net of shipping freight costs, on a Free on Board (FOB) basis and includes quotation period price adjustments and realised gains and losses on foreign exchange and commodity forward sale contracts.
There have been no inter-segment revenues.
Items that are managed on a Group basis and are not allocated to segments as they are not considered part of core operations of any segment are as follows:
Finance costs and revenue on investments Interest revenue Foreign exchange gains/(losses) Unrealised gains/(losses) on derivatives Corporate costs
Operating results for discontinued operations (Tallering Peak) have been excluded from the segment results below, and are set out in note 32.
During the year ended 30 June 2019, revenue received from the sale of iron ore comprised purchases by the following (unnamed) buyers who each on a proportionate basis equated to greater than 10% of total sales for the period:
2019 Customer $’000 # 1 191,620 # 2 50,855 # 3 28,840 Other 7,049 278,364
During the year ended 30 June 2018, revenue received from the sale of iron ore comprised purchases by the following buyers who each on a proportionate basis equated to greater than 10% of total sales for the period:
2018 Customer $’000 # 1 132,102 # 2 35,924 # 3 25,677 Other 60,426 254,129
Revenue from external customers by geographical location is based on the port of delivery. All iron ore has been shipped to China during the year ended 30 June 2019.
All segment assets are located within Australia.
33. Segment Information
68 MOUNT GIBSON IRON LIMITED 2019 Annual Report

No
tes
to t
he
Co
nso
lidat
ed F
inan
cial
Rep
ort
(co
nti
nu
ed)
33.
Segm
ent I
nfor
mat
ion
(Con
tinue
d)Ex
tens
ion
Hill
Ko
olan
Isl
and
Unal
loca
ted*
Co
nsol
idat
ed
2019
20
18
2019
20
18
2019
20
18
2019
20
18
$’00
0 $’
000
$’00
0 $’
000
$’00
0 $’
000
$’00
0 $’
000
Segm
ent r
even
ue
Reve
nue
from
sal
e of
iron
ore
, net
of s
hipp
ing
freig
ht a
nd re
alise
d ga
ins/
(loss
es) o
n de
rivat
ives
17
9,77
9 19
6,46
3 52
,964
-
- -
232,
743
196,
463
Inte
rest
reve
nue
- -
- -
11,1
15
12,1
40
11,1
15
12,1
40
Segm
ent r
even
ue, n
et o
f shi
ppin
g fr
eigh
t 17
9,77
9 19
6,46
3 52
,964
-
11,1
15
12,1
40
243,
858 *
* 20
8,60
3
Segm
ent r
esul
t Ea
rnin
gs/(
loss
) bef
ore
impa
irmen
t, in
tere
st, t
ax, d
epre
ciatio
n an
d am
ortis
atio
n 64
,221
^
39,8
14
22,3
50
- (7
,231
) 64
,074
79
,340
10
3,88
8 Im
pairm
ent (
loss
)/re
vers
al
927
2,38
2 1,
313
- (3
) 62
2,
237
2,44
4 Ea
rnin
gs/(
loss
) bef
ore
inte
rest
, tax
, dep
recia
tion
and
amor
tisat
ion
65,1
48
42,1
96
23,6
63
- (7
,234
) 64
,136
81
,577
10
6,33
2 De
prec
iatio
n an
d am
ortis
atio
n (4
,347
) (5
,669
) (5
,271
) -
(178
) (2
76)
(9,7
96)
(5,9
45)
Segm
ent r
esul
t 60
,801
36
,527
18
,392
-
(7,4
12)
63,8
60
71,7
81
100,
387
Fina
nce
cost
s (1
,496
) (1
,284
) Pr
ofit
befo
re ta
x an
d di
scon
tinue
d op
erat
ions
70,2
85
99,1
03
Item
s in
clude
d in
seg
men
t res
ult:
Impa
irmen
t los
s/(w
rite-
back
s) o
f con
sum
able
s in
vent
orie
s (7
87)
61
(1,3
13)
- -
- (2
,100
) 61
Im
pairm
ent (
writ
e-ba
cks)
on
ore
inve
ntor
ies
(140
) (2
,443
) -
- -
- (1
40)
(2,4
43)
Impa
irmen
t los
s/(w
rite-
back
s) o
f exp
lora
tion
and
eval
uatio
n ex
pend
iture
--
--
3 (6
2)3
(62)
(927
) (2
,382
) (1
,313
) -
3 (6
2)
(2,2
37)
(2,4
44)
^
Inclu
des
redu
ctio
n in
pro
visio
n fo
r reh
abilit
atio
n of
$1,
621,
000
due
to re
vise
d co
st e
stim
ates
. *
‘Una
lloca
ted’
inclu
des
inte
rest
reve
nue
of $
11,1
15,0
00, u
nrea
lised
mar
ked-
to-m
arke
t los
s on
fore
ign
exch
ange
and
com
mod
ity s
wap
s of
$5,
859,
000
and
corp
orat
e ex
pens
es s
uch
as h
ead
offic
e sa
larie
s an
d w
ages
.**
To
reco
ncile
seg
men
t rev
enue
to s
tatu
tory
reve
nue,
shi
ppin
g fre
ight
of $
45,6
21,0
00 (2
018:
$57
,666
,000
) is
adde
d.
MOUNT GIBSON IRON LIMITED 2019 Annual Report 69

No
tes
to t
he
Co
nso
lidat
ed F
inan
cial
Rep
ort
(co
nti
nu
ed)
33.
Segm
ent I
nfor
mat
ion
(Con
tinue
d)Ex
tens
ion
Hill
Ko
olan
Isl
and
Unal
loca
ted*
Co
nsol
idat
ed
2019
20
18
2019
20
18
2019
20
18
2019
20
18
$’00
0 $’
000
$’00
0 $’
000
$’00
0 $’
000
$’00
0 $’
000
Segm
ent a
sset
s Cu
rrent
fina
ncia
l ass
ets
18,8
96
13,4
78
35,7
24
1,47
3 36
4,58
7 45
0,42
6 41
9,20
7 46
5,37
7 Ot
her c
urre
nt a
sset
s 4,
045
18,9
17
23,1
61
6,63
4 1,
281
1,14
4 28
,487
26
,695
Pr
oper
ty, p
lant
and
equ
ipm
ent
977
3,24
1 20
,436
4,
172
304
321
21,7
17
7,73
4 M
ine
prop
ertie
s -
2,25
2 19
4,99
4 85
,529
-
- 19
4,99
4 87
,781
Ot
her n
on-c
urre
nt a
sset
s -
- 1,
929
2,37
0 -
- 1,
929
2,37
0 De
ferre
d ta
x as
sets
-
- -
- 62
,907
-
62,9
07
- To
tal a
sset
s 23
,918
37
,888
27
6,24
4 10
0,17
8 42
9,07
9 45
1,89
1 72
9,24
1 58
9,95
7
Segm
ent l
iabi
litie
s Fi
nanc
ial l
iabi
litie
s 16
,170
27
,078
32
,633
11
,790
14
,186
3,
535
62,9
89
42,4
03
Othe
r lia
bilit
ies
11,9
35
18,4
71
39,7
18
29,3
31
1,78
7 2,
928
53,4
40
50,7
30
Tota
l lia
bilit
ies
28,1
05
45,5
49
72,3
51
41,1
21
15,9
73
6,46
3 11
6,42
9 93
,133
N
et a
sset
s/(l
iabi
litie
s)
(4,1
87)
(7,6
61)
203,
893
59,0
57
413,
106
445,
428
612,
812
496,
824
*‘U
nallo
cate
d’ c
urre
nt f
inan
cial
asse
ts i
nclu
des
term
dep
osits
of
$208
,600
,000
(20
18:
$279
,000
,000
), su
bord
inat
ed n
otes
of
$88,
882,
000
(201
8: $
98,0
30,0
00)
and
finan
cial
asse
ts h
eld
for
tradi
ng o
f $3
8,19
9,00
0(2
018:
$33
,957
,000
).
70 MOUNT GIBSON IRON LIMITED 2019 Annual Report
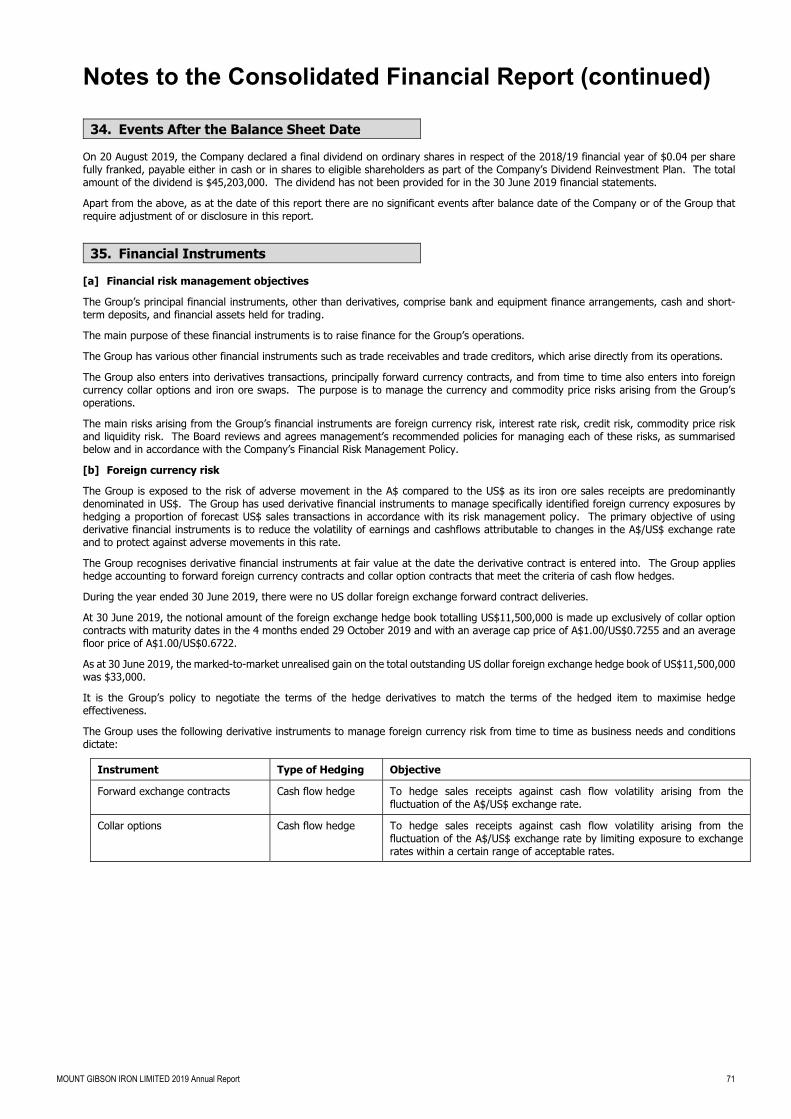
Notes to the Consolidated Financial Report (continued)
On 20 August 2019, the Company declared a final dividend on ordinary shares in respect of the 2018/19 financial year of $0.04 per share fully franked, payable either in cash or in shares to eligible shareholders as part of the Company’s Dividend Reinvestment Plan. The total amount of the dividend is $45,203,000. The dividend has not been provided for in the 30 June 2019 financial statements.
Apart from the above, as at the date of this report there are no significant events after balance date of the Company or of the Group that require adjustment of or disclosure in this report.
[a] Financial risk management objectives
The Group’s principal financial instruments, other than derivatives, comprise bank and equipment finance arrangements, cash and short-term deposits, and financial assets held for trading.
The main purpose of these financial instruments is to raise finance for the Group’s operations.
The Group has various other financial instruments such as trade receivables and trade creditors, which arise directly from its operations.
The Group also enters into derivatives transactions, principally forward currency contracts, and from time to time also enters into foreign currency collar options and iron ore swaps. The purpose is to manage the currency and commodity price risks arising from the Group’s operations.
The main risks arising from the Group’s financial instruments are foreign currency risk, interest rate risk, credit risk, commodity price risk and liquidity risk. The Board reviews and agrees management’s recommended policies for managing each of these risks, as summarised below and in accordance with the Company’s Financial Risk Management Policy.
[b] Foreign currency risk
The Group is exposed to the risk of adverse movement in the A$ compared to the US$ as its iron ore sales receipts are predominantly denominated in US$. The Group has used derivative financial instruments to manage specifically identified foreign currency exposures by hedging a proportion of forecast US$ sales transactions in accordance with its risk management policy. The primary objective of using derivative financial instruments is to reduce the volatility of earnings and cashflows attributable to changes in the A$/US$ exchange rate and to protect against adverse movements in this rate.
The Group recognises derivative financial instruments at fair value at the date the derivative contract is entered into. The Group applies hedge accounting to forward foreign currency contracts and collar option contracts that meet the criteria of cash flow hedges.
During the year ended 30 June 2019, there were no US dollar foreign exchange forward contract deliveries.
At 30 June 2019, the notional amount of the foreign exchange hedge book totalling US$11,500,000 is made up exclusively of collar option contracts with maturity dates in the 4 months ended 29 October 2019 and with an average cap price of A$1.00/US$0.7255 and an average floor price of A$1.00/US$0.6722.
As at 30 June 2019, the marked-to-market unrealised gain on the total outstanding US dollar foreign exchange hedge book of US$11,500,000 was $33,000.
It is the Group’s policy to negotiate the terms of the hedge derivatives to match the terms of the hedged item to maximise hedge effectiveness.
The Group uses the following derivative instruments to manage foreign currency risk from time to time as business needs and conditions dictate:
Instrument Type of Hedging Objective
Forward exchange contracts Cash flow hedge To hedge sales receipts against cash flow volatility arising from the fluctuation of the A$/US$ exchange rate.
Collar options Cash flow hedge To hedge sales receipts against cash flow volatility arising from the fluctuation of the A$/US$ exchange rate by limiting exposure to exchange rates within a certain range of acceptable rates.
34. Events After the Balance Sheet Date
35. Financial Instruments
MOUNT GIBSON IRON LIMITED 2019 Annual Report 71

Notes to the Consolidated Financial Report (continued)
35. Financial Instruments (Continued) [i] Foreign exchange contracts – cash flow hedges
At balance date, the following foreign exchange contracts designed as a hedge of anticipated future receipts that will be denominated in US$ were outstanding:
2019 2018 Average
Contract Rate
Contract Amount
US$
Contract Amount
A$
Fair Value
A$
Average Contract
Rate
Contract Amount
US$
Contract Amount
A$
Fair Value
A$ A$/US$ $’000 $’000 $’000 A$/US$ $’000 $’000 $’000
Collar Option Contracts Within one year: 3,000 3,822 (143) - call strike price 0.7850 - put strike price 0.7667 Within one year: 9,000 11,538 (182) - call strike price 0.7800 - put strike price 0.7410 Within one year: 2,500 3,338 (3) - call strike price 0.7490 - put strike price 0.6800 Within one year: 9,000 12,517 36 - call strike price 0.7190 - put strike price 0.6700 Total 11,500 15,855 33 12,000 15,360 (325)
As balance date, the following foreign exchange contracts were recognised on the balance sheet and income statement: 2019 2018 Notes $’000 $’000 Current assets 11 36 - Current liabilities 19 (3) (325)
Total collar option contracts 33 (325)
[ii] Foreign currency sensitivity
The following table details the effect on profit and other comprehensive income after tax of a 10% change in the A$ against the US$ from the spot rates at 30 June 2019 and 30 June 2018.
Sensitivity to a 10% change in A$ against US$ at balance date
Net Profit Other Comprehensive Income 2019 2018 2019 2018 $’000 $’000 $’000 $’000
10% appreciation in the A$ spot rate with all other variables held constant (2,886) (770) 690 468 10% depreciation in the A$ spot rate with all other variables held constant 3,528 942 (762) (1,362)
The sensitivity analysis of the Group’s exposure to the foreign currency risk at balance date has been determined based on the change in value due to foreign exchange movement based on exposures at balance sheet date. A positive number indicates an increase in profit and other comprehensive income.
72 MOUNT GIBSON IRON LIMITED 2019 Annual Report

Notes to the Consolidated Financial Report (continued)
35. Financial Instruments (Continued)At balance date, the Group’s exposure to foreign currency risks on financial assets and financial liabilities, excluding derivatives, are as follows:
2019 2018 $’000 $’000
Financial Assets Cash (included within note 6) 21,095 10,204 Trade and other receivables (included within note 9) 26,983 2,621 Financial Liabilities Trade and other payables (included within note 17) (2,719) (716)
Net exposure 45,359 12,109
[c] Interest rate risk
The Group’s exposure to market interest rates relates primarily to the Group’s cash and cash equivalents, term deposits and subordinated notes, trade debtors, financial assets at fair value through profit or loss and financial assets held for trading (tradeable corporate bonds).
The Group’s policy is to manage its interest costs using a mix of fixed and variable rate debt (as appropriate).
The Group regularly analyses its interest income rate exposure. Within this analysis, consideration is given to potential renewals of existing positions and alternative financing arrangements.
At balance date, the Group’s exposure to interest rate risks on financial assets and financial liabilities was as follows:
MOUNT GIBSON IRON LIMITED 2019 Annual Report 73

No
tes
to t
he
Co
nso
lidat
ed F
inan
cial
Rep
ort
(co
nti
nu
ed)
35.
Fina
ncia
l Ins
trum
ents
(Co
ntin
ued)
Fixe
d in
tere
st ra
te m
atur
ing
in:
Tota
l car
ryin
g am
ount
pe
r bal
ance
she
et
Wei
ghte
d Av
erag
e In
tere
st
Floa
ting
inte
rest
rate
1
year
or l
ess
Ove
r 1 to
5 y
ears
N
on-in
tere
st b
earin
g 20
19
2018
20
19
2018
20
19
2018
20
19
2018
20
19
2018
20
19
2018
CO
NSO
LID
ATED
$’
000
$’00
0 $’
000
$’00
0 $’
000
$’00
0 $’
000
$’00
0 $’
000
$’00
0 %
%
i) Fi
nanc
ial a
sset
s Ca
sh
48,8
49
46,5
46
- -
- -
1 1
48,8
50
46,5
47
0.42
0.
69
Term
dep
osits
-
- 20
8,60
0 27
9,00
0 -
- -
- 20
8,60
0 27
9,00
0 2.
48
2.62
Su
bord
inat
ed n
otes
88
,882
98
,030
-
- -
- -
- 88
,882
98
,030
3.
34
3.29
Fi
nanc
ial a
sset
s he
ld fo
r tra
ding
-
- 33
,055
32
,420
-
- 5,
144
1,53
7 38
,199
33
,957
3.
80
3.86
Tr
ade
and
othe
r rec
eiva
bles
-
- -
- -
- 34
,640
* 7,
843
34,6
40
7,84
3 -
- De
rivat
ive
finan
cial a
sset
s-
--
--
- 36
*-
36
- -
- To
tal f
inan
cial
ass
ets
137,
731
144,
576
241,
655
311,
420
- -
39,8
21
9,38
1 41
9,20
7 46
5,37
7
ii) F
inan
cial
liab
ilitie
s Tr
ade
and
othe
r pay
able
s -
- -
- -
- 55
,194
42
,078
55
,194
42
,078
-
- In
tere
st-b
earin
g lo
ans
and
borro
win
gs
- -
1,75
3 -
- -
- -
1,75
3 -
3.74
-
Deriv
ativ
e fin
ancia
l lia
bilit
ies
- -
- -
- -
6,04
2 32
5 6,
042
325
- -
Tota
l fin
anci
al li
abili
ties
- -
1,75
3 -
- -
61,2
36
42,4
03
62,9
89
42,4
03
*Th
ese
finan
cial a
sset
s ex
pose
the
Grou
p to
inte
rest
rate
risk
as
they
are
car
ried
at fa
ir va
lue.
74 MOUNT GIBSON IRON LIMITED 2019 Annual Report
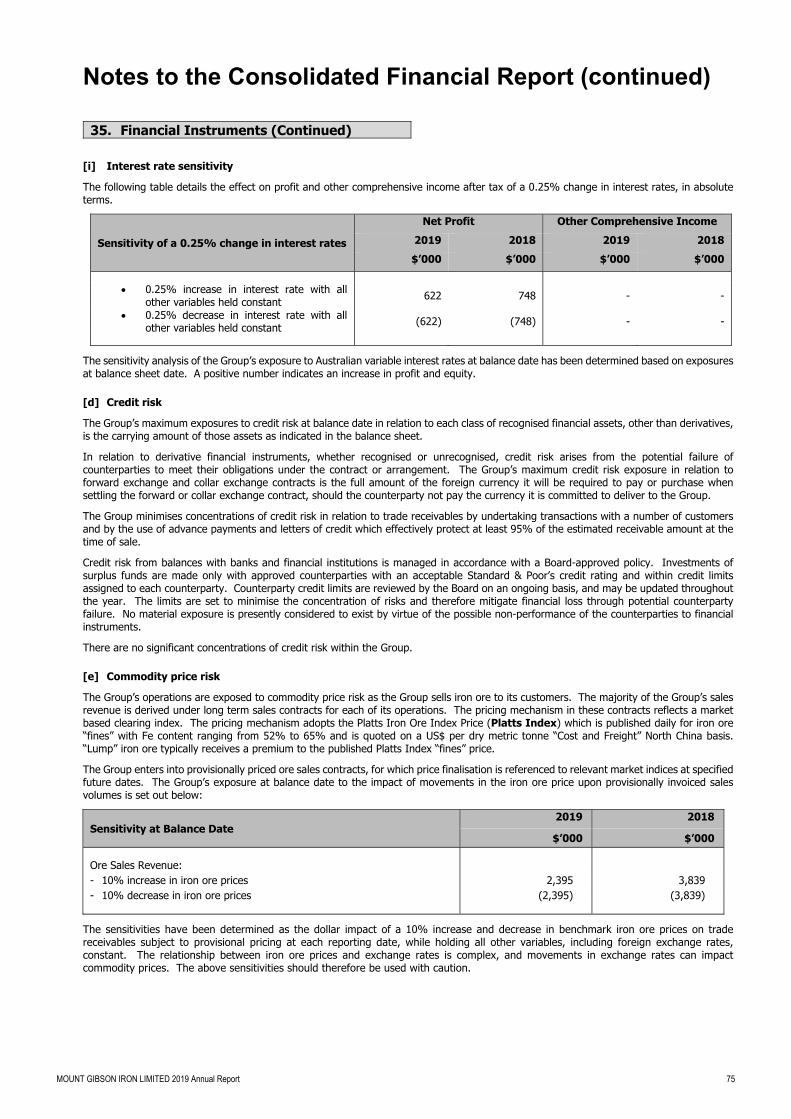
Notes to the Consolidated Financial Report (continued)
35. Financial Instruments (Continued)
[i] Interest rate sensitivity
The following table details the effect on profit and other comprehensive income after tax of a 0.25% change in interest rates, in absolute terms.
Sensitivity of a 0.25% change in interest rates
Net Profit Other Comprehensive Income 2019 2018 2019 2018 $’000 $’000 $’000 $’000
0.25% increase in interest rate with allother variables held constant 622 748 - -
0.25% decrease in interest rate with allother variables held constant (622) (748) - -
The sensitivity analysis of the Group’s exposure to Australian variable interest rates at balance date has been determined based on exposures at balance sheet date. A positive number indicates an increase in profit and equity.
[d] Credit risk
The Group’s maximum exposures to credit risk at balance date in relation to each class of recognised financial assets, other than derivatives, is the carrying amount of those assets as indicated in the balance sheet.
In relation to derivative financial instruments, whether recognised or unrecognised, credit risk arises from the potential failure of counterparties to meet their obligations under the contract or arrangement. The Group’s maximum credit risk exposure in relation to forward exchange and collar exchange contracts is the full amount of the foreign currency it will be required to pay or purchase when settling the forward or collar exchange contract, should the counterparty not pay the currency it is committed to deliver to the Group.
The Group minimises concentrations of credit risk in relation to trade receivables by undertaking transactions with a number of customers and by the use of advance payments and letters of credit which effectively protect at least 95% of the estimated receivable amount at the time of sale.
Credit risk from balances with banks and financial institutions is managed in accordance with a Board-approved policy. Investments of surplus funds are made only with approved counterparties with an acceptable Standard & Poor’s credit rating and within credit limits assigned to each counterparty. Counterparty credit limits are reviewed by the Board on an ongoing basis, and may be updated throughout the year. The limits are set to minimise the concentration of risks and therefore mitigate financial loss through potential counterparty failure. No material exposure is presently considered to exist by virtue of the possible non-performance of the counterparties to financial instruments.
There are no significant concentrations of credit risk within the Group.
[e] Commodity price risk
The Group’s operations are exposed to commodity price risk as the Group sells iron ore to its customers. The majority of the Group’s sales revenue is derived under long term sales contracts for each of its operations. The pricing mechanism in these contracts reflects a market based clearing index. The pricing mechanism adopts the Platts Iron Ore Index Price (Platts Index) which is published daily for iron ore “fines” with Fe content ranging from 52% to 65% and is quoted on a US$ per dry metric tonne “Cost and Freight” North China basis. “Lump” iron ore typically receives a premium to the published Platts Index “fines” price.
The Group enters into provisionally priced ore sales contracts, for which price finalisation is referenced to relevant market indices at specified future dates. The Group’s exposure at balance date to the impact of movements in the iron ore price upon provisionally invoiced sales volumes is set out below:
Sensitivity at Balance Date 2019 2018
$’000 $’000
Ore Sales Revenue: - 10% increase in iron ore prices 2,395 3,839 - 10% decrease in iron ore prices (2,395) (3,839)
The sensitivities have been determined as the dollar impact of a 10% increase and decrease in benchmark iron ore prices on trade receivables subject to provisional pricing at each reporting date, while holding all other variables, including foreign exchange rates, constant. The relationship between iron ore prices and exchange rates is complex, and movements in exchange rates can impact commodity prices. The above sensitivities should therefore be used with caution.
MOUNT GIBSON IRON LIMITED 2019 Annual Report 75

Notes to the Consolidated Financial Report (continued)
35. Financial Instruments (Continued)
During the period, the Group entered into forward sales agreements covering six shipments totalling 420,000 tonnes of iron ore, with maturity dates spread over the period April 2019 to September 2019. The contracts were stated in US$ per dry metric tonne (DMT) and were cash settled against the average daily CFR benchmark price for 62% Fe fines ores for delivery to northern China. The average price of the forward contracts at each maturity date was between US$78 and US$90 per DMT. Movements in the market value of the forward sale contracts are taken to the income statement.
At balance date, the following iron ore forward sales contracts that have not been designated as hedges were outstanding:
2019 2018
Tonnes
Average Price per
Tonne
Fair Value
US$
Fair Value
A$ Tonnes
Average Price per
Tonne
Fair Value
US$
Fair Value
A$ US$ $’000 $’000 US$ $’000 $’000
Maturing within: - 1 to 3 months 210,000 88 (4,239) (6,039) - - - - Total 210,000 88 (4,239) (6,039) - - - -
The fair value of the forward sales contracts of $6,039,000 (2018: $nil) has been recognised in the statement of financial position as derivative financial liabilities (note 19).
[f] Liquidity risk
The Group’s objective is to maintain a balance between continuity of funding and flexibility through the use of its cash reserves. The Group manages liquidity risk by continuously monitoring forecast and actual cash flows and matching maturity profiles of financial assets and liabilities.
The Group’s capital risk management objectives are to safeguard the business as a going concern, to provide appropriate returns for shareholders and benefits for other stakeholders and to maintain an optimal capital structure in order to reduce the cost of capital (being equity and debt).
Mount Gibson does not have a target debt/equity ratio but has a policy of maintaining a flexible financing structure so as to be able to take advantage of new investment opportunities that may arise.
At 30 June 2019, the Group had unutilised performance bonding facilities totalling $12,913,000 (2018: $10,556,000). Refer note 18.
Tabulated below is an analysis of the Group’s financial liabilities according to relevant maturity groupings based on the remaining period from the balance sheet date to the contractual maturity date. As the amounts disclosed in the table are the contractual undiscounted cash flows, these balances will not necessarily agree with the amounts disclosed in the balance sheet.
30 June 2019 30 June 2018
Less than 6
months 6 to 12 months
1 to 5 years
Over 5 years Total
Less than 6
months 6 to 12 months
1 to 5 years
Over 5 years Total
$’000 $’000 $’000 $’000 $’000 $’000 $’000 $’000 $’000 $’000
Financial Liabilities Trade and other payables 55,194 - - - 55,194 42,078 - - - 42,078 Interest-bearing loans and borrowings 1,764 - - - 1,764 - - - - -
Derivatives 6,042 - - - 6,042 325 - - - 325 63,000 - - - 63,000 42,403 - - - 42,403
76 MOUNT GIBSON IRON LIMITED 2019 Annual Report

Notes to the Consolidated Financial Report (continued)
35. Financial Instruments (Continued)
[g] Fair value of financial assets and financial liabilities
All financial instruments for which fair value is recognised or disclosed are categorised within the fair value hierarchy, described as follows, based on the lowest level input that is significant to the fair value measurement as a whole: Level 1 – quoted market prices in an active market (that are unadjusted) for identical assets or liabilities Level 2 – valuation techniques (for which the lowest level of input that is significant to the fair value measurement is directly or indirectly observable) Level 3 – valuation techniques (for which the lowest level of input that is significant to the fair value measurement is unobservable)
The fair values of derivative financial instruments are sourced from an independent valuation by the Group’s treasury advisors using the valuation techniques with prevailing short and long term observable market inputs sourced from Reuters/Bloomberg to determine an appropriate mid-price valuation (level 2).
The fair values of quoted notes and bonds (classified as either financial assets held for trading or at fair value through other comprehensive income) are determined based on market price quotations at the reporting date (level 1).
The fair values of trade receivables classified as financial assets at fair value through profit and loss are determined using a discounted cash flow model incorporating market observable inputs sourced from Platts index pricing (level 2). This model also incorporates interest rate and credit risk adjustments. The fair values of cash, short-term deposits, other receivables, trade and other payables and other interest-bearing borrowings approximate their carrying values, as a result of their short maturity or because they carry floating rates of interest.
The carrying amounts and fair values of the financial assets and financial liabilities for the Group as at 30 June 2019 and 30 June 2018 are shown below.
2019 2018
Notes Carrying Amount Fair Value Carrying
Amount Fair Value
$’000 $’000 $’000 $’000
Financial assets – current Cash 6 48,850 48,850 46,547 46,547 Term deposits 7 208,600 208,600 279,000 279,000 Subordinated notes 7 88,882 88,882 98,030 98,030 Financial assets held for trading 8 38,199 38,199 33,957 33,957 Trade debtors and other receivables 9 34,640 34,640 7,843 7,843 Derivatives 11 36 36 - -
419,207 419,207 465,377 465,377 Financial liabilities – current Trade and other payables 17 55,194 55,194 42,078 42,078 Interest-bearing loans and borrowings 18 1,753 1,753 - - Derivatives 19 6,042 6,042 325 325
62,989 62,989 42,403 42,403 Net financial assets 356,218 356,218 422,974 422,974
Recognition and measurement
Accounting policy for financial assets applied from 1 July 2018
Initial recognition and measurement Financial assets are classified, at initial recognition, and subsequently measured at amortised cost, fair value through other comprehensive income (OCI), or fair value through profit or loss. The classification of financial assets at initial recognition that are debt instruments depends on the financial asset’s contractual cash flow characteristics and the Group’s business model for managing them. With the exception of trade receivables that do not contain a significant financing component or for which the Group has applied the practical expedient, the Group initially measures a financial asset at its fair value plus, in the case of a financial asset not at fair value through profit or loss, transaction costs. Trade receivables that do not contain a significant financing component or for which the Group has applied the practical expedient for contracts that have a maturity of one year or less, are measured at the transaction price determined under the revenue accounting policy (see note 3). In order for a financial asset to be classified and measured at amortised cost or fair value through OCI, it needs to give rise to cash flows that are ‘solely payments of principal and interest’ (SPPI) on the principal amount outstanding. This assessment is referred to as the SPPI test and is performed at an instrument level. The Group’s business model for managing financial assets refers to how it manages its financial assets in order to generate cash flows. The business model determines whether cash flows will result from collecting contractual cash flows, selling the financial assets, or both. Purchases or sales of financial assets that require delivery of assets within a time frame established by regulation or convention in the market place (regular way trades) are recognised on the trade date, i.e., the date that the Group commits to purchase or sell the asset.
MOUNT GIBSON IRON LIMITED 2019 Annual Report 77

Notes to the Consolidated Financial Report (continued)
Subsequent measurement For purposes of subsequent measurement, financial assets are classified in four categories: Financial assets at amortised cost (debt instruments) Financial assets at fair value through OCI with recycling of cumulative gains and losses (debt instruments) Financial assets designated at fair value through OCI with no recycling of cumulative gains and losses upon derecognition (equity instruments) Financial assets at fair value through profit or loss
Financial assets at amortised cost (debt instruments) The Group measures financial assets at amortised cost if both of the following conditions are met: The financial asset is held within a business model with the objective to hold financial assets in order to collect contractual cash flows; and The contractual terms of the financial asset give rise on specified dates to cash flows that are solely payments of principal and interest on the
principal amount outstandingFinancial assets at amortised cost are subsequently measured using the effective interest rate (EIR) method and are subject to impairment. Interest received is recognised as part of finance income in the statement of profit or loss and other comprehensive income. Gains and losses are recognised in profit or loss when the asset is derecognised, modified or impaired. The Group’s financial assets at amortised cost include trade receivables (not subject to provisional pricing), other receivables and term deposits (see notes 7 and 9).
Financial assets at fair value through profit or loss Financial assets at fair value through profit or loss include financial assets held for trading (see note 8), financial assets designated upon initial recognition at fair value through profit or loss or financial assets mandatorily required to be measured at fair value, i.e., where they fail the SPPI test. Financial assets are classified as held for trading if they are acquired for the purpose of selling or repurchasing in the near term. Derivatives, including separated embedded derivatives, are also classified as held for trading unless they are designated as effective hedging instruments. Financial assets with cash flows that do not pass the SPPI test are required to be classified and measured at fair value through profit or loss, irrespective of the business model. Financial assets at fair value through profit or loss are carried in the statement of financial position at fair value with net changes in fair value recognised in profit or loss. As the Group applies the SPPI test to determine the classification of financial assets, the requirements relating to the separation of embedded derivatives is no longer needed for financial assets. An embedded derivative will often make a financial asset fail the SPPI test thereby requiring the instrument to be measured at fair value through profit or loss in its entirety. This is applicable to the Group’s trade receivables subject to provisional pricing (see note 9). These receivables relate to sales contracts where the selling price is determined after delivery to the customer, based on an index price at the end of the relevant quotational period stipulated in the contract. This exposure to the market-based index price causes such trade receivables to fail the SPPI test. As a result, these receivables are measured at fair value through profit or loss from the date of recognition of the corresponding sale, with subsequent movements being recognised in other revenue (see note 3)
Financial assets at fair value through OCI The Group measures debt instruments at fair value though OCI if both of the following conditions are met: - The financial asset is held with a business model with both the objective of both holding to collect contractual cash flows and selling; and The contractual terms meet the SPPI test.For debt instruments at fair value through OCI, interest income and impairment losses are recognised in profit and loss and computed in the same manner as for financial assets carried at amortised cost. The remaining fair value changes are recognised in OCI. Upon derecognition, the cumulative fair value change recognised in OCI is recycled to profit and loss. The Group’s debt instruments at fair value through OCI includes the subordinated notes (see note 7)
Impairment of financial assets The Group recognises an allowance for expected credit losses (ECLs) for all debt instruments not held at fair value through profit or loss. ECLs are based on the difference between the contractual cash flows due in accordance with the contract and all the cash flows that the Group expects to receive, discounted at an approximation of the original EIR. ECLs are recognised in two stages. For credit exposures for which there has not been a significant increase in credit risk since initial recognition, ECLs are provided for credit losses that result from default events that are possible within the next 12-months (12-month ECL). For those credit exposures for which there has been a significant increase in credit risk since initial recognition, a loss allowance is required for credit losses expected over the remaining life of the exposure, irrespective of the timing of the default (lifetime ECL). For trade receivables (not subject to provisional pricing) and other receivables due in less than 12 months, the Group applies the simplified approach in calculating ECLs. Therefore, the Group does not track changes in credit risk, but instead, recognises a loss allowance based on the financial asset’s lifetime ECL at each reporting date. The Group has established a provision matrix for trade receivables that is based on its historical credit loss experience, adjusted for forward-looking factors specific to the debtors and the economic environment. For any other financial assets carried at amortised cost (which are due in more than 12 months), the ECL is based on the 12-month ECL when there has not been a significant increase in credit risk since origination. The 12-month ECL is the proportion of lifetime ECLs that results from default events on a financial instrument that are possible within 12 months after the reporting date. When there has been a significant increase in credit risk since origination, the allowance will be based on the lifetime ECL. When determining whether the credit risk of a financial asset has increased significantly since initial recognition and when estimating ECLs, the Group considers reasonable and supportable information that is relevant and available without undue cost or effort. This includes both quantitative and qualitative information and analysis, based on the Group’s historical experience and informed credit assessment including forward-looking information. The Group considers a financial asset in default when contractual payments are 90 days past due. However, in certain cases, the Group may also consider a financial asset to be in default when internal or external information indicates that the Group is unlikely to receive the outstanding contractual amounts in full before taking into account any credit enhancements held by the Group. A financial asset is written off when there is no reasonable expectation of recovering the contractual cash flows and usually occurs when past due for more than one year and not subject to enforcement activity.
78 MOUNT GIBSON IRON LIMITED 2019 Annual Report

Notes to the Consolidated Financial Report (continued)
Derivative financial instruments and hedging Derivative financial instruments are initially recognised at fair value on the date the derivative contract is entered into and are subsequently remeasured to fair value. Any gains and losses arising from changes in the fair value of derivatives, except those that qualify as cash flow hedges, are taken directly to net profit or loss for the year. For the purpose of hedge accounting, hedges are classified as either fair value hedges when they hedge the exposure to changes in the fair value of a recognised asset or liability, or cash flow hedges where they hedge exposure to variability in cash flows that is either attributable to a particular risk associated with a recognised asset or liability or a forecasted transaction. All hedges are currently classified as cash flow hedges. In relation to cash flow hedges to hedge firm commitments which meet the conditions for hedge accounting, the portion of the gain or loss on the hedging instrument that is determined to be an effective hedge is recognised directly in equity and the ineffective portion is recognised in the income statement. When the hedged firm commitment results in the recognition of an asset or a liability, then, at the time the asset or liability is recognised, the associated gains or losses that had previously been recognised in equity are included in the initial measurement of the acquisition cost or other carrying amount of the asset or liability. For all other cash flow hedges, the gains or losses that are recognised in equity are transferred to the income statement in the same year in which the hedged firm commitment affects the net profit and loss, for example when the future sale actually occurs.
Effectiveness is tested at inception of each hedge and monthly thereafter until the hedge expires. The cumulative dollar offset method is applied in the measurement of effectiveness. The cumulative approach involves comparing the cumulative change (to date from inception of the hedge) in the hedging instrument’s fair values to the cumulative change in the hedged item’s (or USD cash flow) attributable to the risk being hedged.
Effectiveness of the forward exchange contracts is monitored by comparing the forward net present value of the underlying cash flows to the forward net present value of the fair value associated with the hedging instrument. Prospective and retrospective testing is undertaken by the Group’s treasury advisors. At each balance date, the Group measures ineffectiveness using the ratio offset method. For foreign currency cash flow hedges if the risk is over hedged, the ineffective portion is taken immediately to other income or expense in the income statement. Hedge accounting is discontinued when the hedging instrument expires or is sold, terminated or exercised, or no longer qualifies for hedge accounting. At that point in time, any cumulative gain or loss on the hedging instrument recognised in equity is kept in equity until the forecasted transaction occurs. If a hedged transaction is no longer expected to occur, the net cumulative gain or loss recognised in equity is transferred to the income statement.
2019 2018 $’000 $’000
[a] Information relating to Mount Gibson Iron Limited:
Current assets 11,013 11,055 Total assets 1,077,940 902,753 Current liabilities 270 218 Total liabilities 465,128 405,929
Issued capital 583,395 568,328 Issued capital – restricted shares under Loan Share Plan 1,750 1,501 Accumulated losses (387,476) (487,842) Dividend distribution reserve 394,306 394,306 Share based payments reserve 20,837 20,531
Total Shareholder’s Equity 612,812 496,824
Net profit after tax of the parent entity 133,177 99,700
Total comprehensive profit of the parent entity 133,177 99,700
36. Parent Entity Information
MOUNT GIBSON IRON LIMITED 2019 Annual Report 79

Notes to the Consolidated Financial Report (continued)
[b] Details of any guarantees entered into by the parent entity
There are cross guarantees given by Mount Gibson Iron Limited in relation to the debts of its subsidiaries as described in note 12 and note 18.
The parent entity has further provided bank guarantees in respect of obligations to various authorities. Refer to note 18.
[c] Details of any contingent liabilities of the parent entity
The parent entity had contingent liabilities as at reporting date as set out in note 28. For information about guarantees given by the parent entity, refer [b] above.
Mount Gibson Iron Limited guarantees the performance of Mount Gibson Mining Limited’s obligations to Aurizon entities under the rail Transport Agreement made on 26 June 2008 as amended and restated. In accordance with this agreement, Mount Gibson Mining Limited agrees to reimburse Aurizon for track access charges properly due and payable to Brookfield, the rail infrastructure owner.
[d] Details of any contractual commitments by the parent entity for the acquisition of property, plant and equipment
There are no contractual commitments by the parent entity for the acquisition of property, plant and equipment as at reporting date.
[e] Tax Consolidation
The Company and its 100%-owned entities have formed a tax consolidated group. Members of the Group entered into a tax sharing arrangement in order to allocate income tax expense to the wholly-owned controlled entities. The agreement provides for the allocation of income tax liabilities between the entities should the head entity default on its tax payment obligations. At balance date, the possibility of default is remote. The head entity of the tax consolidated group is Mount Gibson Iron Limited.
80 MOUNT GIBSON IRON LIMITED 2019 Annual Report

Notes to the Consolidated Financial Report (continued)
A. New and amended Accounting Standards and Interpretations adopted from 1 July 2018
Since 1 July 2018, the Group has adopted all Accounting Standards and Interpretations mandatory to annual periods beginning on or before 1 July 2018. Adoption of these standards and interpretations did not have a material effect on the financial position or performance of the Group.
The Group applies, for the first time, AASB 15 and AASB 9.
AASB 15
AASB 15 and its related amendments superseded AASB 118 Revenue (AASB 118) and related Interpretations and applies to all revenue arising from contracts with customers. AASB 15 requires revenue to be recognised when control of a good or service transfers to a customer at an amount that reflects the consideration to which the Group expects to be entitled in exchange for transferring goods or services to a customer. The Group adopted AASB 15 using the modified retrospective method of adoption with an initial application date of 1 July 2018 and has not restated comparative information. The Group has applied AASB 15 to contracts that were not completed contracts at the date of initial application.
The effects of adopting AASB 15 are as follows:-
Iron ore sales
The Group derives revenue from the sale of iron ore. There were no changes identified with respect to the timing of revenue recognition in relation to iron ore sales as control transfers to customers at the date of loading/shipment which is consistent with the point in time when risks and rewards passed under AASB 118. Adjustments are made for variations in assay and weight between the time of dispatch of the ore and time of final settlement. The Group estimates the amount of consideration receivable using the expected value approach based on internal assays. Management considers that it is highly probable that a significant reversal in the amount of cumulative revenue recognised will not occur due to a variation in assay and weight.
There has been a change in the amount of revenue recognised for iron ore sold under Cost and Freight (CFR) Incoterms where the Group provides shipping services. This is because these services are now considered to represent a separate performance obligation which is satisfied at a different point in time from the iron ore. Therefore some of the transaction price that was previously allocated to the iron ore under AAB 118 is now allocated to this new performance obligation under AASB 15. This shipping revenue has been disclosed separately in the disaggregated revenue disclosures – see note 3.
Provisionally priced sales
Certain of the Group’s sales are provisionally priced, where the final price depends on prices in a specified future period (index prices). Adjustments to the sales price occur based on movements in the index price up to the end of the quotational period (QP). Under previous accounting, provisionally priced sales were considered to contain an embedded derivative (ED) which was separated from the host contract from the date of shipment. Revenue was initially recognised for these arrangements at the date of shipment based on the estimated forward price that the entity expected to receive at the end of the QP determined at the date of shipment. Subsequent changes in the fair value of the ED were recognised in the Statement of Profit and Loss each period until the end of the QP, and were presented as part of revenue. The adoption of AASB 9 led to a change in the Group’s accounting (refer below) as the related receivable will now be measured at fair value through profit and loss. Under AASB 15 the accounting for revenue will remain unchanged except that the fair value adjustments on receivables subject to QP are recognised in other revenue and not included in revenue from contracts with customers.
Shipping services
As noted above, a portion of the Group’s iron ore sales are sold on CFR Incoterms, whereby the Group is responsible for providing freight and shipping services after the date that it transfers control of the iron ore to the customer. Under AASB 118, freight and shipping services were not accounted for as separate services. Instead all of the revenue relating to the sale was recognised at the date of loading and presented as revenue from sale of iron ore. Under AASB 15, it has been concluded that freight and shipping represents a separate performance obligation and that the Group acts as principal. As a result, a portion of the transaction price is now required to be allocated to this performance obligation and will be recognised over time on a gross basis as the services are provided. Given the nature of the Group’s shipping profile, most of these services are completed in the same reporting period that control of the iron ore passes to the customer. The Group considered the deferral of revenue apportioned to the remaining sea voyages of vessels “in transit” to their destination ports as at the date of initial application of the standard and at balance date. At 30 June 2017 the Group had only two vessels in transit. As the corresponding shipping freight cost would also be deferred, the impact at the date of initial application of the Standard was not material.
Impact on the financial statements
The Group assessed all enforceable offtake agreements and as discussed above, it was determined that the adoption of AASB 15 did not have a significant impact on the Group at the date of initial application of the Standard. The impact of adopting AASB 15 on the financial statements at 30 June 2019 is as follows:
Revenue from contracts with customers is now split between sale of iron ore ($213,396,000) and freight/shipping services($45,621,000) as they each represent separate performance obligations.
Revenue from quotation period price adjustments ($26,427,000) is now presented separately from revenue from contracts withcustomers as the provisionally priced trade debtors are measured at fair value through profit or loss given the exposure tocommodity price variations. The trade debtors at 30 June 2019 which are subject to QP price adjustments are disclosed as tradedebtors at fair value through profit or loss ($26,983,000).
37. New and Amended Accounting Standardsand Interpretations
MOUNT GIBSON IRON LIMITED 2019 Annual Report 81

Notes to the Consolidated Financial Report (continued)
AASB 9
AASB 9 replaces parts of AASB 139 Financial Instruments: Recognition and Measurement (AASB 139) and brings together all three aspects of the accounting for financial instruments: classification and measurement, impairment and hedge accounting. The Group has applied AASB 9 retrospectively with the initial application date being 1 July 2018. In accordance with the transitional provisions in AASB 9, comparative information has not been restated.
The effects of adopting AASB 9 are as follows:
Classification and measurement
Under AASB 9, there has been a change in the classification and measurement requirements relating to financial assets. Previously, there were four categories of financial asset: loans and receivables, fair value through profit and loss, held to maturity and available for sale. Under AASB 9, financial assets are either classified as amortised cost, fair value through profit and loss (FVTPL) or fair value through other comprehensive income (FVTOCI). For debt instruments, the classification is based on two criteria: the Group’s business model for managing the assets; and whether the instruments’ contractual cash flows represent ‘solely payments of principal and interest’ and the principal amount outstanding (the ‘SPPI criterion’).
At the date of initial application, existing financial assets and liabilities of the Group were assessed in terms of the requirements of AASB 9. The Group has determined the adoption of AASB 9 has impacted the classification of financial instruments at 1 July 2018 as follows:
Financial instruments Classification under AASB 132 Classification under AASB 9 Cash and cash equivalents Loans and receivables Financial assets at amortised cost Term deposits Loans and receivables Financial assets at amortised cost Subordinated notes Available for sale financial asset Financial assets at FVTOCI Trade receivables (subject to a QP adjustment)
Host - Loans and receivables ED – at fair value through profit and loss
Financial asset at FVTPL ^
Other receivables Loans and receivables Financial assets at amortised cost Tradeable corporate bonds FVTPL financial assets Financial assets at FVTPL Investment in listed equity shares FVTPL financial assets Equity financial assets at FVTPL Derivative liabilities Financial liabilities at fair value Financial liabilities at fair value Trade and other payables Financial liabilities at amortised cost Financial liabilities at amortised cost
^ Prior to the adoption of AASB 9, the exposure of provisionally priced sales to price movements over the QP, previously led to an embedded derivative (QP derivative) being separated from the host trade receivable and accounted for separately. The QP derivative was not material at 1 July 2018. Under AASB 9, embedded derivatives are no longer separated from financial assets. Instead, the exposure of the trade receivable to future commodity price movements will cause the trade receivable to fail the SPPI test. Therefore, the entire receivable is now required to be measured at fair value through profit or loss, with subsequent changes in fair value recognised in the statement of profit or loss and other comprehensive income each period until final settlement.
The change in classification of financial instruments has not resulted in any re-measurement adjustments at 1 July 2018.
Impairment
The adoption of AASB 9 has changed the Group’s accounting for impairment losses for financial assets by replacing AASB 139’s incurred loss approach with a forward-looking expected credit loss (ECL) approach. AASB 9 requires the Group to recognise an allowance for ECLs for all debt instruments not held at fair value through profit or loss. As at 1 July 2018, the Group reviewed and assessed the existing financial assets for impairment. With respect to the Group’s term deposits and subordinated notes at 30 June 2018, no material adjustments were required on adoption of the ECL approach. These balances were assessed as having low probability of default as they are held with reputable financial institutions with high credit ratings. Other receivables which the Group measures at amortised cost (i.e. receivables not subject to QP adjustment) are short term and the change to a forward-looking ECL approach did not have a material impact on the amounts recognised in the financial statements under AASB 139.
Hedging
The Group elected to continue to apply the hedge accounting requirements of AASB 139. The adoption of AASB 9 has therefore had no impact on the Group’s hedge accounting.
82 MOUNT GIBSON IRON LIMITED 2019 Annual Report

Notes to the Consolidated Financial Report (continued)
B. New and amended Accounting Standards and Interpretations issued but not yet effective Other Australian Accounting Standards and Interpretations relevant to the Group that have recently been issued or amended but are not yet effective, have not been adopted by the Group for the period ended 30 June 2019 are outlined in the table below:
Reference Title Summary Application date of
standard
Application date for Group
AASB 16 Leases AASB 16 provides a new lessee accounting model which requires a lessee to recognise assets and liabilities for all leases with a term of more than 12 months unless the underlying asset is of low value. A lessee is required to recognise a right-of-use asset representing its right to use the underlying leased asset and a lease liability representing its obligations to make lease payments. The depreciation of the right-of-use asset and interest on the lease liability will be recognised in the consolidated income statement. Transition to AASB 16 The Group plans to adopt the modified retrospective approach on transition with the initial date of application being 1 July 2019. The lease liability will be measured at the present value of future lease payments, discounted using the incremental borrowing rate for the Group at the date of transition. Using this approach, the right-of-use asset will be set to equal the lease liability. Prior period comparative financial statements are not required to be restated under this transition method. The Group has reviewed and implemented changes to its contracting process and system to ensure ongoing compliance with AASB 16. The Group has progressed with its impact assessment of AASB 16 and estimates an impact of at least $19,000,000, being an increase to both non-current assets (right-of-use assets) and liabilities (lease liabilities) on its consolidated statement of financial position on the initial date of application. The Group continues to assess the impact of a few other contracts on transition. The leases recognised by the Group under AASB 16 predominantly relate to mining equipment, contractor-provided equipment and office premises. Adoption of AASB 16 is expected to result in lower operating costs and higher finance and depreciation costs as the accounting profile of the lease payments changes under the new model.
1 January 2019
1 July 2019
AASB 2017-6 Amendments to Australian Accounting Standards- Prepayment Features with Negative Compensation
This Standard amends AASB 9 Financial Instruments to permit entities to measure at amortised cost or fair value through other comprehensive income particular financial assets that would otherwise have contractual cash flows that are solely payments of principle and interest but do not meet that condition only as a result of a prepayment feature. This is subject to meeting other conditions, such as the nature of the business model relevant to the financial asset. Otherwise, the financial assets would be measured at fair value through profit or loss. The Standard also clarifies in the Basis for Conclusion that, under AASB 9, gains and losses arising on modifications of financial liabilities that do not result in derecognition should be recognised in profit or loss.
1 January 2019
1 July 2019
AASB 2018-1 Annual Improvements to IFRS Standards 2015-2017 Cycle
The amendments clarify certain requirements in:► AASB 3 Business Combinations and AASB 11 Joint
Arrangements – previously held interest in a joint operation ► AASB 112 Income Taxes – income tax consequences of
payments on in financial instruments classified as equity ► AASB 123 Borrowing Cost – borrowing costs eligible for
capitalisation.
1 January 2019
1 July 2019
MOUNT GIBSON IRON LIMITED 2019 Annual Report 83

Notes to the Consolidated Financial Report (continued)
Reference Title Summary Application date of
standard
Application date for Group
AASB Int 23, and relevant amending standards
Uncertainty over Income Tax Treatments
The Interpretation clarifies the application of the recognitions and measurement criteria in AASB 112 Income Taxes when there is uncertainty over income tax treatments. The Interpretation specifically addresses the following: ► Whether an entity considers uncertain tax treatments
separately► The assumptions an entity makes about the examination of tax
treatments by taxation authorities► How an entity determines taxable profit (tax loss), tax bases,
unused tax losses, unused tax credits and tax rates► How an entity considers changes in facts and circumstances.
1 January 2019
1 July 2019
Conceptual Framework AASB 2019-1
Conceptual Framework for Financial Reporting Amendments to Australian Accounting Standards – Reference to the Conceptual Framework
The revised Conceptual Framework includes some new concepts, provides updated definitions and recognition criteria for assets and liabilities and clarifies some important concepts. It is arranged in eight chapters, as follows: ► Chapter 1 – The objective of financial reporting► Chapter 2 – Qualitative characteristics of useful financialinformation ► Chapter 3 – Financial statements and the reporting entity► Chapter 4 – The elements of financial statements► Chapter 5 – Recognition and derecognition► Chapter 6 – Measurement► Chapter 7 – Presentation and disclosure► Chapter 8 – Concepts of capital and capital maintenanceAASB 2019-1 has also been issued, which sets out the amendments to Australian Accounting Standards, Interpretations and other pronouncements in order to update references to the revised Conceptual Framework. The changes to the Conceptual Framework may affect the application of accounting standards in situations where no standard applies to a particular transaction or event. In addition, relief has been provided in applying AASB 3 and developing accounting policies for regulatory account balances using AASB 108, such that entities must continue to apply the definitions of an asset and a liability (and supporting concepts) in the Framework for the Preparation and Presentation of Financial Statements (July 2004), and not the definitions in the revised Conceptual Framework.
1 January 2020
1 July 2020
AASB 2018-6 Amendments to Australian Accounting Standards – Definition of a Business
The Standard amends the definition of a business in AASB 3 Business Combinations. The amendments clarify the minimum requirements for a business, remove the assessment of whether market participants are capable of replacing missing elements, add guidance to help entities assess whether an acquired process is substantive, narrow the definitions of a business and of outputs, and introduce an optional fair value concentration test.
1 January 2020
1 July 2020
AASB 2018-7 Amendments to Australian Accounting Standards – Definition of Material
This Standard amends AASB 101 Presentation of Financial Statements and AAS 108 Accounting Policies, Changes in Accounting Estimates and Errors to align the definition of ‘material’ across the standards and to clarify certain aspects of the definition. The amendments clarify that materiality will depend on the nature or magnitude of information. An entity will need to assess whether the information, either individually or in combination with other information, is material in the context of the financial statements. A misstatement of information is material if it could reasonably be expected to influence decisions made by the primary users.
1 January 2020
1 July 2020
The Group has elected not to early adopt any of these new standards or amendments in these financial statements. The Group intends to adopt these standards when they become effective. An impact assessment of the standards issued but not yet effective has not been performed, except for AASB 16.
84 MOUNT GIBSON IRON LIMITED 2019 Annual Report

Directors’ Declaration
In accordance with a resolution of the directors of Mount Gibson Iron Limited, I state that:
1. In the opinion of the Directors:
a. the financial statements, notes and the additional disclosures included in the Directors Report designated as audited ofthe Group are in accordance with the Corporations Act 2001, including:
i) giving a true and fair view of the financial position of the Group as at 30 June 2019 and of its performance forthe year ended on that date; and
ii) complying with Accounting Standards and the Corporations Regulations 2001; and
b. the financial statements and notes also comply with International Reporting Standards as disclosed in note 1; and
c. there are reasonable grounds to believe that the Group will be able to pay its debts as and when they become due andpayable.
2. This declaration has been made after receiving the declarations required to be made to the Directors in accordance with section295A of the Corporations Act 2001 for the financial year ended 30 June 2019.
Signed in accordance with a resolution of the directors.
LEE SENG HUI Chairman
Sydney, 20 August 2019
MOUNT GIBSON IRON LIMITED 2019 Annual Report 85
A member firm of Ernst & Young Global Limited
GB:JG:MGI:259 Liability limited by a scheme approved under Professional Standards Legislation
Ernst & Young 11 Mounts Bay Road Perth WA 6000 Australia GPO Box M939 Perth WA 6843
Tel: +61 8 9429 2222 Fax: +61 8 9429 2436 ey.com/au
Independent auditor's report to the Members of Mount Gibson Iron Limited
Report on the audit of the financial report
Opinion
We have audited the financial report of Mount Gibson Iron Limited (the Company) and its subsidiaries (collectively the Group), which comprises the consolidated balance sheet as at 30 June 2019, the consolidated income statement, the consolidated statement of comprehensive income, consolidated statement of changes in equity and consolidated cash flow statement for the year then ended, notes to the financial statements, including a summary of significant accounting policies, and the Directors' declaration.
In our opinion, the accompanying financial report of the Group is in accordance with the Corporations Act 2001, including:
a) giving a true and fair view of the consolidated financial position of the Group as at 30 June 2019and of its consolidated financial performance for the year ended on that date; and
b) complying with Australian Accounting Standards and the Corporations Regulations 2001.
Basis for opinion
We conducted our audit in accordance with Australian Auditing Standards. Our responsibilities under those standards are further described in the Auditor’s Responsibilities for the Audit of the Financial Report section of our report. We are independent of the Group in accordance with the auditor independence requirements of the Corporations Act 2001 and the ethical requirements of the Accounting Professional and Ethical Standards Board’s APES 110 Code of Ethics for Professional Accountants (the Code) that are relevant to our audit of the financial report in Australia. We have also fulfilled our other ethical responsibilities in accordance with the Code.
We believe that the audit evidence we have obtained is sufficient and appropriate to provide a basis for our opinion.
Key audit matters
Key audit matters are those matters that, in our professional judgment, were of most significance in our audit of the financial report of the current year. These matters were addressed in the context of our audit of the financial report as a whole, and in forming our opinion thereon, but we do not provide a separate opinion on these matters. For each matter below, our description of how our audit addressed the matter is provided in that context.
We have fulfilled the responsibilities described in the Auditor’s Responsibilities for the Audit of the Financial Report section of our report, including in relation to these matters. Accordingly, our audit included the performance of procedures designed to respond to our assessment of the risks of material misstatement of the financial report. The results of our audit procedures, including the procedures performed to address the matters below, provide the basis for our audit opinion on the accompanying financial report.
86 MOUNT GIBSON IRON LIMITED 2019 Annual Report

A m
embe
r fir
m o
f Ern
st &
You
ng G
loba
l Lim
ited
Liab
ility
lim
ited
by a
sch
eme
appr
oved
und
er P
rofe
ssio
nal S
tand
ards
Leg
isla
tion
1.P
rovi
sion
for
reha
bilit
atio
n
Why
sig
nific
ant
How
our
aud
it a
ddre
ssed
the
key
aud
it m
atte
r
As
a co
nseq
uenc
e of
its
oper
atio
ns th
e G
roup
incu
rs o
blig
atio
ns to
reh
abili
tate
and
res
tore
its
min
e si
tes.
Reh
abili
tatio
n ac
tiviti
es a
re g
over
ned
by lo
cal l
egis
lativ
e re
quir
emen
ts. A
s at
30
Jun
e 20
19 th
e G
roup
’s c
onso
lidat
ed b
alan
ce s
heet
incl
udes
pro
visi
ons
of $
49.1
mill
ion
(incl
udin
g th
e ro
ad r
esea
ling
prov
isio
n) in
res
pect
of t
hese
obl
igat
ions
(ref
er to
Not
e 20
).
We
cons
ider
ed th
is to
be
a ke
y au
dit m
atte
r be
caus
e es
timat
ing
the
cost
s as
soci
ated
with
th
ese
futu
re a
ctiv
ities
req
uire
s ju
dgm
ent a
nd e
stim
atio
n of
fact
ors
such
as
timin
g of
whe
n re
habi
litat
ion
will
take
pla
ce, t
he e
xten
t of t
he r
ehab
ilita
tion
and
rest
orat
ion
activ
ities
and
ec
onom
ic a
ssum
ptio
ns s
uch
as in
flatio
n ra
tes
and
disc
ount
rat
es w
hich
are
use
d to
de
term
ine
the
prov
isio
n am
ount
.
We
eval
uate
d th
e as
sum
ptio
ns a
nd m
etho
dolo
gies
use
d by
the
Gro
up in
arr
ivin
g at
thei
r re
habi
litat
ion
cost
est
imat
es. O
ur a
udit
proc
edur
es in
clud
ed th
e fo
llow
ing:
►W
e in
volv
ed o
ur r
ehab
ilita
tion
spec
ialis
ts to
ass
ess
the
obje
ctiv
ity, q
ualif
icat
ions
and
com
pete
nce
of th
e G
roup
’s e
xter
nal e
xper
ts w
hose
wor
k fo
rmed
the
basi
s of
the
Gro
up’s
cos
t est
imat
e.
►A
sses
sed
the
reas
onab
lene
ss o
f the
tim
ing
of th
e re
habi
litat
ion
cash
flow
s an
d th
ere
sulta
nt in
flatio
n an
d di
scou
nt r
ate
assu
mpt
ions
use
d in
the
Gro
up’s
cos
t est
imat
es,
havi
ng r
egar
d to
ava
ilabl
e ec
onom
ic d
ata
on fu
ture
infla
tion
and
disc
ount
rat
es
►Ev
alua
ted
the
adeq
uacy
of t
he G
roup
’s d
iscl
osur
es r
elat
ing
to r
ehab
ilita
tion
oblig
atio
ns a
nd c
onsi
dere
d th
e tr
eatm
ent a
pplie
d to
cha
nges
in th
e re
habi
litat
ion
and
rest
orat
ion
prov
isio
n.
MOUNT GIBSON IRON LIMITED 2019 Annual Report 87

A m
embe
r fir
m o
f Ern
st &
You
ng G
loba
l Lim
ited
Liab
ility
lim
ited
by a
sch
eme
appr
oved
und
er P
rofe
ssio
nal S
tand
ards
Leg
isla
tion
2.Im
pair
men
t as
sess
men
t fo
r th
e K
oola
n Is
land
Cas
h G
ener
atin
g U
nit
Why
sig
nific
ant
How
our
aud
it a
ddre
ssed
the
key
aud
it m
atte
r
The
valu
e of
the
Gro
up’s
pro
pert
y, p
lant
and
equ
ipm
ent a
nd m
ine
prop
erty
ass
ets
at 3
0 Ju
ne 2
019
was
$21
6.7
mill
ion.
Of t
his
tota
l am
ount
$21
5.5
mill
ion
rela
ted
to th
e Ko
olan
Is
land
Cas
h G
ener
atin
g U
nit (
“CGU
”).
The
Gro
up a
sses
sed
whe
ther
any
indi
cato
rs o
f im
pair
men
t wer
e pr
esen
t at
30
June
201
9 an
d co
nclu
ded
that
an
impa
irm
ent r
ever
sal i
ndic
ator
was
pre
sent
in r
espe
ct o
f the
Koo
lan
Isla
nd C
GU. A
ccor
ding
ly, t
he G
roup
per
form
ed a
n im
pair
men
t rev
ersa
l ass
essm
ent f
or th
e Ko
olan
Isla
nd C
GU
at 3
0 Ju
ne 2
019
and
base
d on
this
ass
essm
ent c
oncl
uded
that
an
impa
irm
ent r
ever
sal w
as n
ot r
equi
red
(ref
er to
Not
e 16
).
We
cons
ider
ed th
is to
be
a ke
y au
dit m
atte
r be
caus
e of
the:
►Si
gnifi
cant
judg
men
t inv
olve
d in
det
erm
inin
g if
ther
e w
as a
n in
dica
tor
that
an
impa
irm
ent l
oss
reco
gnis
ed in
pri
or p
erio
ds m
ay e
ither
nee
d to
be
reve
rsed
in fu
ll or
inpa
rt o
r w
heth
er fu
rthe
r im
pairm
ent w
as r
equi
red.
►Si
gnifi
cant
judg
men
t and
est
imat
es in
volv
ed in
the
dete
rmin
atio
n of
the
reco
vera
ble
amou
nt o
f the
Koo
lan
Isla
nd C
GU
incl
udin
g as
sum
ptio
ns r
elat
ing
to fu
ture
iron
ore
pric
es, e
xcha
nge
rate
s, o
pera
ting
and
capi
tal c
osts
and
an
appr
opri
ate
disc
ount
rat
e to
refle
ct th
e ris
k as
soci
ated
with
the
fore
cast
cas
h flo
ws
havi
ng r
egar
d to
the
curr
ent
stat
us o
f the
pro
ject
.
We
asse
ssed
the
reas
onab
lene
ss o
f the
Gro
up’s
impa
irm
ent a
sses
smen
t pro
cess
and
the
resu
ltant
reco
vera
ble
valu
e de
term
inat
ion
for
the
Kool
an Is
land
CGU
. Our
aud
it pr
oced
ures
in
clud
ed th
e fo
llow
ing:
►
Eval
uate
d th
e as
sum
ptio
ns a
nd m
etho
dolo
gies
use
d by
the
Gro
up, i
n pa
rtic
ular
, tho
sere
latin
g to
fore
cast
cas
h flo
ws
and
inpu
ts u
sed
to fo
rmul
ate
them
. Thi
s in
clud
edas
sess
ing,
with
invo
lvem
ent f
rom
our
val
uatio
n sp
ecia
lists
, whe
re a
ppro
pria
te, t
hefo
reig
n ex
chan
ge r
ates
and
iron
ore
pri
ces
with
ref
eren
ce to
mar
ket p
rice
s (w
here
avai
labl
e), m
arke
t res
earc
h, m
arke
t pra
ctic
e, m
arke
t ind
ices
, bro
ker
cons
ensu
s,hi
stor
ical
per
form
ance
and
the
disc
ount
rat
e.
►Te
sted
the
mat
hem
atic
al a
ccur
acy
of th
e G
roup
’s d
isco
unte
d ca
sh fl
ow im
pair
men
tm
odel
and
agr
eed
rele
vant
dat
a, in
clud
ing
assu
mpt
ions
on
timin
g an
d fu
ture
cap
ital
and
oper
atin
g ex
pend
iture
, to
the
Gro
up’s
feas
ibili
ty a
naly
sis
of th
e pr
ojec
t and
the
late
st B
oard
app
rove
d lif
e of
min
e pl
an.
►A
sses
sed
the
wor
k of
the
Gro
up’s
inte
rnal
and
ext
erna
l exp
erts
with
res
pect
to th
eca
pita
l and
ope
ratin
g as
sum
ptio
ns u
sed
in th
e ca
sh fl
ow fo
reca
sts.
Thi
s in
clud
edun
ders
tand
ing
the
unde
rlyin
g co
st e
stim
atio
n pr
oces
s, in
form
atio
n in
Boa
rd r
epor
tsan
d re
leas
es to
the
mar
ket.
We
also
exa
min
ed th
e co
mpe
tenc
e, q
ualif
icat
ions
and
obje
ctiv
ity o
f the
exp
erts
and
ass
esse
d w
heth
er k
ey c
apita
l and
ope
ratin
g ex
pend
iture
assu
mpt
ions
wer
e co
nsis
tent
with
info
rmat
ion
in B
oard
rep
orts
and
rel
ease
s to
the
mar
ket.
►A
sses
sed
the
wor
k of
the
Gro
up’s
exp
erts
with
res
pect
to th
e re
serv
e as
sum
ptio
nsus
ed in
the
cash
flow
fore
cast
s. T
his
incl
uded
und
erst
andi
ng th
e re
serv
e es
timat
ion
proc
ess.
We
also
exa
min
ed th
e co
mpe
tenc
e, q
ualif
icat
ions
and
obj
ectiv
ity o
f the
Gro
up’s
exp
erts
, and
ass
esse
d w
heth
er k
ey r
eser
ve e
cono
mic
ass
umpt
ions
wer
eco
nsis
tent
with
thos
e us
ed e
lsew
here
in th
e fin
anci
al r
epor
t.
►A
sses
sed
the
impa
ct o
f a r
ange
of s
ensi
tiviti
es to
the
econ
omic
ass
umpt
ions
unde
rpin
ning
the
Gro
up’s
impa
irm
ent a
sses
smen
t
►Ev
alua
ted
the
adeq
uacy
of t
he G
roup
’s d
iscl
osur
es w
ith r
espe
ct to
thei
r im
pair
men
tre
vers
al a
sses
smen
t for
the
Kool
an Is
land
CG
U.
88 MOUNT GIBSON IRON LIMITED 2019 Annual Report

A m
embe
r fir
m o
f Ern
st &
You
ng G
loba
l Lim
ited
Liab
ility
lim
ited
by a
sch
eme
appr
oved
und
er P
rofe
ssio
nal S
tand
ards
Leg
isla
tion
3.A
ccou
ntin
g fo
r pr
evio
usly
unr
ecog
nise
d de
ferr
ed t
ax a
sset
s
Why
sig
nific
ant
How
our
aud
it a
ddre
ssed
the
key
aud
it m
atte
r
As
set o
ut in
Not
e 5
of th
e fin
anci
al r
epor
t, th
e G
roup
has
def
erre
d ta
x as
sets
of
$62
.9 m
illio
n as
at 3
0 Ju
ne 2
019
on th
e ba
sis
they
con
side
r it
prob
able
the
Gro
up w
ill d
eriv
e su
ffic
ient
taxa
ble
inco
me
in th
e fu
ture
to r
ecou
p th
e re
cogn
ised
tax
asse
ts.
We
cons
ider
ed th
is to
be
a ke
y au
dit m
atte
r be
caus
e th
e de
term
inat
ion
of th
e pr
obab
ility
of t
he G
roup
der
ivin
g ta
xabl
e in
com
e in
the
futu
re to
rec
oup
the
defe
rred
tax
asse
ts r
ecog
nise
d is
hig
hly
judg
men
tal.
This
is s
ubje
ct to
nu
mer
ous
assu
mpt
ions
aro
und
the
futu
re p
rofit
abili
ty o
f the
Gro
up’s
min
ing
asse
ts, w
hich
in tu
rn is
prim
arily
dep
ende
nt u
pon
assu
mpt
ions
incl
udin
g fu
ture
pr
oduc
tion
leve
ls, i
ron
ore
pric
es a
nd e
xcha
nge
rate
s, o
pera
ting
and
capi
tal
deve
lopm
ent c
osts
.
We
eval
uate
d th
e ap
prop
riat
enes
s of
the
Gro
up’s
ass
essm
ent o
f the
pro
babi
lity
of th
e G
roup
der
ivin
g as
sess
able
inco
me
in th
e fu
ture
to r
ecou
p th
e pr
evio
usly
unr
ecog
nise
d de
ferr
ed ta
x as
sets
, rec
ogni
sed
at 3
0 Ju
ne 2
019.
We
invo
lved
our
tax
spec
ialis
ts in
the
asse
ssm
ent o
f the
Gro
up’s
tax
posi
tions
, in
clud
ing
the
judg
men
ts m
ade
and
estim
ates
use
d. W
e co
nsid
ered
the
appr
opri
aten
ess
of th
e D
irec
tors
' ass
umpt
ions
, est
imat
es a
nd a
naly
sis
in r
elat
ion
to th
e G
roup
’s fu
ture
ta
x po
sitio
n ha
ving
reg
ard
to th
e st
atus
of t
he G
roup
’s o
pera
tions
at 3
0 Ju
ne 2
019,
th
e im
pair
men
t rev
ersa
l ass
essm
ent u
nder
take
n fo
r th
e Ko
olan
Isla
nd C
GU
and
the
rece
nt fi
nanc
ial p
erfo
rman
ce o
f the
Gro
up.
We
eval
uate
d th
e ad
equa
cy o
f the
Gro
up’s
dis
clos
ures
rel
atin
g to
def
erre
d ta
x as
sets
in
the
30 J
une
2019
fina
ncia
l rep
ort.
MOUNT GIBSON IRON LIMITED 2019 Annual Report 89

A member firm of Ernst & Young Global Limited Liability limited by a scheme approved under Professional Standards Legislation
Information other than the financial report and auditor’s report thereon
The Directors are responsible for the other information. The other information comprises the information included in the Company’s 2019 Annual Report other than the financial report and our auditor’s report thereon. We obtained the Directors’ Report that is to be included in the Annual Report, prior to the date of this auditor’s report, and we expect to obtain the remaining sections of the Annual Report after the date of this auditor’s report.
Our opinion on the financial report does not cover the other information and we do not and will not express any form of assurance conclusion thereon with the exception of the Remuneration Report and our related assurance opinion.
In connection with our audit of the financial report, our responsibility is to read the other information and, in doing so, consider whether the other information is materially inconsistent with the financial report or our knowledge obtained in the audit or otherwise appears to be materially misstated.
If, based on the work we have performed on the other information obtained prior to the date of this auditor’s report, we conclude that there is a material misstatement of this other information, we are required to report that fact. We have nothing to report in this regard.
Responsibilities of the Directors for the financial report
The Directors of the Company are responsible for the preparation of the financial report that gives a true and fair view in accordance with Australian Accounting Standards and the Corporations Act 2001 and for such internal control as the Directors determine is necessary to enable the preparation of the financial report that gives a true and fair view and is free from material misstatement, whether due to fraud or error.
In preparing the financial report, the Directors are responsible for assessing the Group’s ability to continue as a going concern, disclosing, as applicable, matters relating to going concern and using the going concern basis of accounting unless the Directors either intend to liquidate the Group or to cease operations, or have no realistic alternative but to do so.
Auditor's responsibilities for the audit of the financial report
Our objectives are to obtain reasonable assurance about whether the financial report as a whole is free from material misstatement, whether due to fraud or error, and to issue an auditor’s report that includes our opinion. Reasonable assurance is a high level of assurance, but is not a guarantee that an audit conducted in accordance with the Australian Auditing Standards will always detect a material misstatement when it exists. Misstatements can arise from fraud or error and are considered material if, individually or in the aggregate, they could reasonably be expected to influence the economic decisions of users taken on the basis of this financial report.
As part of an audit in accordance with the Australian Auditing Standards, we exercise professional judgment and maintain professional scepticism throughout the audit. We also:
Identify and assess the risks of material misstatement of the financial report, whether due to fraud or error, design and perform audit procedures responsive to those risks, and obtain audit evidence that is sufficient and appropriate to provide a basis for our opinion. The risk of not detecting a material misstatement resulting from fraud is higher than for one resulting from error, as fraud may involve collusion, forgery, intentional omissions, misrepresentations, or the override of internal control.
90 MOUNT GIBSON IRON LIMITED 2019 Annual Report

A member firm of Ernst & Young Global Limited
Liability limited by a scheme approved under Professional Standards Legislation
Obtain an understanding of internal control relevant to the audit in order to design audit procedures that are appropriate in the circumstances, but not for the purpose of expressing an opinion on the effectiveness of the Group’s internal control.
Evaluate the appropriateness of accounting policies used and the reasonableness of accounting estimates and related disclosures made by the Directors.
Conclude on the appropriateness of the Directors’ use of the going concern basis of accounting and, based on the audit evidence obtained, whether a material uncertainty exists related to events or conditions that may cast significant doubt on the Group’s ability to continue as a going concern. If we conclude that a material uncertainty exists, we are required to draw attention in our auditor’s report to the related disclosures in the financial report or, if such disclosures are inadequate, to modify our opinion. Our conclusions are based on the audit evidence obtained up to the date of our auditor’s report. However, future events or conditions may cause the Group to cease to continue as a going concern.
Evaluate the overall presentation, structure and content of the financial report, including the disclosures, and whether the financial report represents the underlying transactions and events in a manner that achieves fair presentation.
Obtain sufficient appropriate audit evidence regarding the financial information of the entities or business activities within the Group to express an opinion on the financial report. We are responsible for the direction, supervision and performance of the Group audit. We remain solely responsible for our audit opinion.
We communicate with the Directors regarding, among other matters, the planned scope and timing of the audit and significant audit findings, including any significant deficiencies in internal control that we identify during our audit.
We also provide the Directors with a statement that we have complied with relevant ethical requirements regarding independence, and to communicate with them all relationships and other matters that may reasonably be thought to bear on our independence, and where applicable, related safeguards.
From the matters communicated to the Directors, we determine those matters that were of most significance in the audit of the financial report of the current year and are therefore the key audit matters. We describe these matters in our auditor’s report unless law or regulation precludes public disclosure about the matter or when, in extremely rare circumstances, we determine that a matter should not be communicated in our report because the adverse consequences of doing so would reasonably be expected to outweigh the public interest benefits of such communication.
Report on the audit of the Remuneration Report
Opinion on the Remuneration Report
We have audited the Remuneration Report included in the Directors' report for the year ended 30 June 2019.
In our opinion, the Remuneration Report of Mount Gibson Iron Limited for the year ended 30 June 2019, complies with section 300A of the Corporations Act 2001.
MOUNT GIBSON IRON LIMITED 2019 Annual Report 91

A member firm of Ernst & Young Global Limited Liability limited by a scheme approved under Professional Standards Legislation
Responsibilities
The Directors of the Company are responsible for the preparation and presentation of the Remuneration Report in accordance with section 300A of the Corporations Act 2001. Our responsibility is to express an opinion on the Remuneration Report, based on our audit conducted in accordance with Australian Auditing Standards.
Ernst & Young
Gavin BuckinghamPartnerPerth20 August 2019
92 MOUNT GIBSON IRON LIMITED 2019 Annual Report

Corporate Governance
The Company's Board is committed to protecting and enhancing shareholder value and conducting the Company's business ethically and in
accordance with high standards of corporate governance. In determining those standards the Company has had reference to the ASX
Corporate Governance Council's Corporate Governance Principles and Recommendations recently released 3rd Edition (“ASX
Recommendations”) during the reporting period. The Company believes that its practices are substantially consistent with the ASX
Recommendations and will continue to adapt its governance practices to be consistent with them and make changes as appropriate, having
regard to the nature and scale of the Company's business.
A description of the Company's main corporate governance practices is set out in its Corporate Governance Statement available online at
www.mtgibsoniron.com.au. The practices reflect the Company's existing corporate governance policies and is current as at 30 September
2019. The Corporate Governance Statement has been approved by the Board.
MOUNT GIBSON IRON LIMITED 2019 Annual Report 93

Additional ASX Information
(a) Distribution of equity securities
As at 31 August 2019 the number of Shareholders, by size of holding, in each class of share, are as follows:
(b) Equity security holders
As at 5 September 2019 the names of the twenty largest holders of quoted shares are:
Ordinary Shares
Number of holders % of Issued Capital
% of Shares HeldNumber of Shares
Number of Shares
1. SUN HUNG KAI INVESTMENT SERVICES LIMITED <CLIENT A/C>
2. APAC RESOURCES INVESTMENTS LIMITED
3. TRUE PLUS LIMITED
4. HSBC CUSTODY NOMINEES (AUSTRALIA) LIMITED
5. J P MORGAN NOMINEES AUSTRALIA PTY LIMITED
6. CITICORP NOMINEES PTY LIMITED
7. DEBORTOLI WINES PTY LIMITED
8. NATIONAL NOMINEES LIMITED
9. HSBC CUSTODY NOMINEES (AUSTRALIA) LIMITED <NT-COMNWLTH SUPER CORP A/C>
10. ECAPITAL NOMINEES PTY LIMITED <ACCUMULATION A/C>
11. MERRILL LYNCH (AUSTRALIA) NOMINEES PTY LIMITED
12. BNP PARIBAS NOMS PTY LTD <DRP>
13. ZERO NOMINEES PTY LTD
14. DE BORTOLI WINES (SUPERANNUATION) PTY LIMITED <DE BORTOLI WINES PL S/F A/C>
15. HSBC CUSTODY NOMINEES (AUSTRALIA) LIMITED-GSCO ECA
16. HSBC CUSTODY NOMINEES (AUSTRALIA) LIMITED - A/C 2
17. J P MORGAN NOMINEES AUSTRALIA PTY LIMITED
18. BNP PARIBAS NOMINEES PTY LTD <AGENCY LENDING DRP A/C>
19. CS THIRD NOMINEES PTY LIMITED <HSBC CUST NOM AU LTD 13 A/C>
20. MR PETER KERR
Top 20 Holders
Total Remaining Holders Balance
Total Issued Ordinary Shares
191,991,689
182,934,392
163,866,874
128,931,870
97,080,495
48,782,589
34,246,165
17,048,128
13,960,923
13,123,919
7,766,882
7,181,271
5,160,000
4,850,000
4,348,037
3,673,450
3,578,514
3,214,957
3,196,941
3,038,343
937,975,439
192,100,091
1,130,075,530
16.99
16.19
14.50
11.41
8.59
4.32
3.03
1.51
1.24
1.16
0.69
0.64
0.46
0.43
0.38
0.33
0.32
0.28
0.28
0.27
83.02
16.98
100.00
1747 883,042 0.08
3,360 9,583,481 0.85
1,676 13,278,224 1.17
2,557 76,776,438 6.79
296 1,029,554,345 91.10
9,636 1,130,075,530 100.00
1 - 1,000
1,001 - 5,000
5,001 - 10,000
10,001 - 100,000
100,001 - 999,999,999
TOTAL
Unmarketable parcels
The minimum parcel size at $0.7150 per share is 700 shares. 1112 shareholders hold unmarketable parcels.
94 MOUNT GIBSON IRON LIMITED 2019 Annual Report

Additional ASX Information Continued
1. APAC Resources Limited and its subsidiaries 374,926,081 33.18%
2. Allied Properties Investments (1) Company Limited and its related corporate entities
Note: Substantial shareholdings 1 and 2 are not cumulative and arise through common shareholdings. 374,926,081 33.18%
3. Shougang Corporation and Shougang Concord International Enterprises Company Limited and each of their controlled entities 154,166,874 13.64%
4. Shougang Fushan Resources Group Limited, True Plus Limited and its subsidiaries 154,166,874 13.64%
Note: Substantial shareholdings 3 and 4 are not cumulative and arise through common shareholdings.
5. Paradice Investment Management Pty Ltd 57,854,005 5.12%
Extension Hill L70/133 Live 100%
Extension Hill G70/232 Live 100%
Extension Hill G70/238 Live 100%
Koolan Island M04/416-I Live 100%
Koolan Island M04/417-I Live 100%
Koolan Island E04/1266-I Live 100%
Koolan Island L04/29 Live 100%
Koolan Island L04/68 Live 100%
Koolan Island L04/101 Live 100%
Tallering Peak M70/1062-I Live 100%
Tallering Peak M70/896-I Live 100%
Tallering Peak E70/3732-I Live 100%
Tallering Peak L70/60 Live 100%
Tallering Peak L70/69 Live 100%
Tallering Peak L70/73 Live 100%
Tallering Peak L70/74 Live 100%
Tallering Peak G70/192 Live 100%
Tallering Peak G70/201 Live 100%
Tallering Peak G70/202 Live 100%
Tallering Peak G70/203 Live 100%
Tallering Peak G70/204 Live 100%
Tallering Peak G70/205 Live 100%
(c) Substantial Shareholders
(d) Voting rights
% of CurrentIssued Shares
Number of Shares
(e) Schedule of interests in mining tenements
Tenement Status Percentage HeldLocation
Tenements Held by MGX
The names of Substantial Shareholders who have notified the Company in accordance with section 671B of the Corporations Act 2001 are:
All ordinary Shares carry one vote per Share without restriction.
No voting rights attach to options.
MOUNT GIBSON IRON LIMITED 2019 Annual Report 95

Tenement Status Percentage HeldLocation
MGX Has Interests In
(e) Schedule of interests in mining tenements (continued)
Tenements are held by another party. MGX has rights to Hematite, Goethite and Limonite. 1
Tenements are held by another party. MGX has rights to Iron on a portion of these tenements. 2
Extension Hill M59/339-I Live1
Extension Hill M59/338-I Live1
Extension Hill M59/454-I Live1
Extension Hill M59/455-I Live1
Extension Hill M59/550-I Live1
Extension Hill M59/526-I Live1
Extension Hill M59/609-I Live1
Extension Hill L59/63 Live1
Extension Hill G59/30 Live1
Extension Hill G59/31 Live1
Extension Hill G59/45 Live1
Extension Hill G59/33 Live1
Extension Hill G59/34 Live1
Extension Hill G59/35 Live1
Extension Hill G59/36 Live1
Extension Hill G59/41 Live1
Fields Find E59/1984 Live1
Fields Find E59/1268-I Live1
Fields Find M59/63-I Live 1
Fields Find E59/1996 Live1
Fields Find E59/1997 Live1
Fields Find E59/2064 Live1
Fields Find E59/2065 Live1
Fields Find E59/2066 Live1
Fields Find E59/2067 Live1
Shine M59/406-I Live2
Shine M59/421-I Live2
Shine M59/731-I Live2
96 MOUNT GIBSON IRON LIMITED 2019 Annual Report

Notes
MOUNT GIBSON IRON LIMITED 2019 Annual Report 97

Notes
98 MOUNT GIBSON IRON LIMITED 2019 Annual Report

2 99MOUNT GIBSON IRON LIMITED 2019 Annual Report MOUNT GIBSON IRON LIMITED 2019 Annual Report
COURAGE INTEGRITY SAFETY AGILITY RESPECT
Taking and giving feedback Do what you say you will doGenuine care for self
and othersMake timely decisions
Be approachable and opento other points of view
Treat others as you wouldexpect to be treated
Encourage and develop people
Be dynamic andembrace change
Grab the opportunity
Constant concern(hazard identification)
Actively interveneto improve
Do the right thing, even when no one is looking
“walk the talk”
Be prepared to admitbeing wrong
Challenge the normconstructively
Make the hard calls
MGX Values
Mount Gibson Iron Limited is an established Australian producer and exporter of iron ore.
The Company was incorporated in 1996 and was listed on the Australian Securities
Exchange in 2002. The Company was admitted to the Standard & Poor's ASX-300 Index
in March 2019.
Mount Gibson seeks to provide sustainable, long-term returns to shareholders by
optimising its existing operations and growing long-term profitability through the
discovery, development and acquisition of mineral resources.
Headquartered in Perth, Mount Gibson owns the Extension Hill/Iron Hill operations in the
Mount Gibson Range south-east of Geraldton, and the high grade Koolan Island mine off
the Kimberley coast in the remote north-west of the State.
High grade ore sales resumed from Koolan Island in April 2019, making Mount Gibson the
highest grade producer of direct-shipping (DSO) hematite in Australia.
Our MGX Values provide us with a behavioural guide on how to sustainably deliver
shareholder value. We always put the health and safety of our people first, work together
with the communities in which we operate, and undertake our activities in an
environmentally responsible and sustainable manner.
Auditors
Ernst & Young
Ernst & Young Building
11 Mounts Bay Road
Perth 6000, Western Australia
Bankers
HSBC Bank Australia Ltd
188-190 St George’s Terrace
Perth 6000, Western Australia
Stock Exchange ListingThe company’s shares are listed on the Australian Securities Exchange.
ASX Code: MGX
Share Registry
Computershare Investor Services Pty Ltd
Level 11, 172 St George’s Terrace
Perth 6000, Western Australia
Telephone: 1300 787 272
Facsimile: +61 8 9323 2033
Annual General Meeting of Shareholders
Scheduled to be held at 12.00 Midday on 13 November 2019
at the Parmelia Hilton Hotel, 14 Mill St, Perth WA.
Easy Access to Information
See our website at www.mtgibsoniron.com.au for regular quarterly
reports and financial results. Additionally, shareholders or interested
parties can register to receive emailed updates shortly after the
company makes any regular or major announcement.
Board of Directors
Lee Seng Hui
Chairman, Non-Executive Director
Alan Jones
Non-Executive Director
Li Shaofeng
Non-Executive Director
Russell Barwick
Non-Executive Director
Paul Dougas
Non-Executive Director
Simon Bird
Non-Executive Director
Company SecretaryDavid Stokes
Registered Office
Level 1, 2 Kings Park Road
West Perth 6005, Western Australia
Telephone: +61 8 9426 7500
Facsimile: +61 8 9485 2305
Email: [email protected]
Website: www.mtgibsoniron.com.au
Solicitors
Herbert Smith Freehills
Level 36, QV1 Building
250 St George’s Terrace
Perth 6000, Western Australia
Corporate Directory
All information correct as at 30 June 2019

MO
UN
T G
IBSO
N IR
ON
LIMIT
ED
2019 A
NN
UAL R
EPO
RT
2019 Annual Reportwww.mtgibsoniron.com.au