Embed Size (px)
Citation preview
DHS WORKING PAPERSDHS WORKING PAPERS
2008 No. 55
Alfredo L. Fort
Monica T. Kothari
Noureddine Abderrahim
Association Between Maternal, Birth, and Newborn Characteristics and Neonatal Mortality
in Five Asian Countries
August 2008
This document was produced for review by the United States Agency for International Development.
DEMOGRAPHICAND
HEALTHRESEARCH
C
M
Y
CM
MY
CY
CMY
K
WP55 cover.ai 9/2/2008 1:38:00 PMWP55 cover.ai 9/2/2008 1:38:00 PM

The DHS Working Papers series is an unreviewed and unedited prepublication series of papers reporting
on research in progress based on Demographic and Health Surveys (DHS) data. This research was carried
out with support provided by the United States Agency for International Development (USAID) through
the MEASURE DHS project (#GPO-C-00-03-00002-00). The views expressed are those of the authors
and do not necessarily reflect the views of USAID or the United States Government.
MEASURE DHS assists countries worldwide in the collection and use of data to monitor and evaluate
population, health, and nutrition programs. Additional information about the MEASURE DHS project can
be obtained by contacting Macro International Inc., Demographic and Health Research Division, 11785
Beltsville Drive, Suite 300, Calverton, MD 20705 (telephone: 301-572-0200; fax: 301-572-0999; e-mail:
[email protected]; internet: www.measuredhs.com).
Association Between Maternal, Birth, and Newborn Characteristics
and Neonatal Mortality in Five Asian Countries
Alfredo L. Fort1
Monica T. Kothari1
Noureddine Abderrahim2
August 2008
Corresponding author: Alfredo L. Fort, PATH/DHS, Demographic and Health Research Division, Macro International Inc. 11785 Beltsville Drive, Calverton, MD 20705, USA; Phone: 301-572-0947; Fax: 301-572-0999; Email: [email protected] 1 PATH/DHS 2 Macro International/DHS


ABSTRACT
Neonatal mortality rates continue to be high in the developing world and are drawing more attention
worldwide as its fraction over infant and childhood mortality increases, due to the faster progress
achieved in the survival of infants older than one month. Therefore, there is renewed interest in
interventions believed to improve neonatal survival, such as providing thermal care to the newborn,
postnatal care to the mother and newborn, and counseling on infant and maternal health care to
mothers. Questions about these new interventions have recently been added to the Demographic and
Health Surveys (DHS) in five Asian countries, Bangladesh, India, Indonesia, Nepal and the
Philippines. The addition of these questions to the DHS surveys in these five countries provides an
opportunity to analyze their associations with neonatal mortality.
The survey results indicate that associations exist between mothers’ perceived size of their
babies, birth weight, receipt of postpartum care, and neonatal mortality. There are also some
associations between elements of newborn care—such as use of a sterilized delivery kit, wrapping of
the baby immediately after birth, and giving mothers maternal and infant care advice—and reduced
levels of neonatal mortality. These associations, tested in only a few countries, merit further
investigation for their potential to contribute to policy and program design in this crucial public
health area.

ACKNOWLEDGMENTS
The authors thank Vinod Mishra, Fred Arnold, Shea Rutstein, Shane Khan, and Shyam Thapa for
reviewing the study methodology, tables, and manuscript. Special thanks to Yuan Gu for formatting
the manuscript. Results from this study were presented at the Consultative Meeting on Survey-based
Indicators for Monitoring and Evaluation of Newborn Health Programs, sponsored by Save the
Children, on April 29-30, 2008, in Washington, DC, and at the U.S. Agency for International
Development in Washington, DC, on May 8, 2008. Suggestions received during those presentations
have contributed to the conclusions and policy implications presented at the end of this report.
1
INTRODUCTION
Neonatal mortality (NNM) accounts for one third of the nearly 11 million deaths of children under
age 5 annually (Lawn et al., 2005; Black et al., 2003). Of the four million neonatal deaths that occur
each year, India reports the highest number, at nearly 1.1 million neonatal deaths. Two other Asian
countries, Pakistan and Bangladesh, also have high numbers of neonatal deaths, at 298,000 and
153,000, respectively. Within the first 28 days of life, three out of four deaths occur in the first week
of life. The risk of a newborn dying is 24 per 1,000 live births in the first week of life, 3 per 1,000 per
week during the rest of the first month, and 0.12 per 1,000 per week after the first year of life. As
with maternal mortality, 99 percent of neonatal deaths occur in the lower to middle income countries,
where the average NNM rate (NMR) is 33 per 1,000 live births (Lawn et al., 2006; Save the
Children, 2006).
The Millennium Development Goal of reducing mortality in children under age 5 by two
thirds between 1990 and 2015 (MDG 4) has been the center of attention in international forums in
recent years. At the current rate of decline in under-5 mortality of less than 4 percent per annum, it is
unlikely that this goal will be achieved (Hill and Choi, 2006). However, childhood mortality and
postneonatal mortality have declined at a faster pace than NNM. Data from the UNICEF 2008
Countdown to 2015 report on maternal, newborn, and child health indicators suggest that reducing
perinatal mortality and NNM is of paramount importance for making additional gains in child
survival (Bryce and Requejo, 2008).
Causes of neonatal deaths vary by early and late neonatal periods. In addition to neonatal
deaths due to prematurity, asphyxia, and congenital defects in the first week of life, infections, such
as pneumonia, diarrhea, and tetanus, are a major cause of death in the next three weeks (Ngoc et al.,
2006; Moss et al., 2002). Infections, which account for 36 percent of neonatal deaths, can be
prevented easily even in developing health systems by following essential newborn care practices

2
such as cleaning, drying, and warming the infant; providing early and exclusive breastfeeding; and
caring properly for the cord (Knippenberg et al., 2005). Low birth weight (LBW) is also the
underlying cause of 40-80 percent of neonatal deaths (Tinker et al., 2006). A special issue of The
Lancet series on maternal and child undernutrition underscores the risk of childhood mortality due to
LBW (Black et al., 2008).
Perinatal mortality and NNM are known to be affected by contextual factors that influence
maternal health, such as socioeconomic status, deprivation, gender inequity, illiteracy, and high
fertility rates (Bale et al., 2003; Donnay, 2000). Studies have reported that higher maternal education
levels are associated with improved perinatal and neonatal survival (Bhutta et al., 2005). Different
variables linked with maternal education, such as appropriate birth spacing and health-seeking
behavior, particularly for prenatal care, have also been shown to reduce maternal mortality and NNM
rates (Harris et al., 1999).
Further analysis of Tanzania Demographic and Health Surveys (DHS) data also suggests that
child survival gains can be achieved by low-income countries that invest in strengthening their health
care systems, in spite of the increased burden of neonatal deaths due to HIV (Masanja, 2008).
However, not all interventions seem to achieve the same degree of success. Nutritional and health
interventions, such as breastfeeding promotion, micronutrient supplementation, and malaria
treatment, have shown mixed results in reducing NNM, based on randomized trials and other studies
(Bhutta et al., 2008). Exclusive breastfeeding immediately after birth along with other recommended
newborn care practices, such as appropriate cord care and thermal control, have been shown to
reduce NMR by 28 percent (Leon-Cava et al., 2002; Lawn et al., 2001). NNM was reduced by 65
percent in a Chinese population with severe iodine deficiency, after being supplemented with iodine
(Delong et al., 1997). However, daily treatment with vitamin A supplementation during the third
trimester of pregnancy and at delivery did not reduce rates of NNM, fetal loss, or preterm births in

3
intervention groups compared to control groups (Katz et al., 2000). Malaria treatment of women
between 16 and 30 weeks of gestation did decrease NMR rates by up to 38 percent, depending on the
stage of pregnancy (Shulman et al., 1999).
Community-level interventions for newborn care have shown success in the reduction of
NMR in several developing countries in Asia. In India, training of village health workers to provide a
package of maternal and newborn care services, including health education, clean delivery, neonatal
resuscitation, and breastfeeding promotion, led to a decrease in the NMR from 62 per 1,000 at
baseline to 26 per 1,000 from the first to the third year of the intervention. A drop in the rate of
stillbirths and the perinatal mortality rate was also found (Bang et al., 1999). In rural Nepal, female
facilitators working with women’s groups to increase health-seeking behaviors and practices, expand
the use of clean delivery kits, and strengthen the health care system led to a 30 percent reduction in
the NMR (primarily in the late NMR, 7-28 days after birth) (Manandhar et al., 2004). In rural China,
the introduction of modern resuscitation skills among grassroots maternal and child health care
personnel led to an 86 percent reduction in the asphyxia-specific NMR rate by strictly applying the
ABCDE (airway, breathing, circulation, drug, and evaluation) protocol (Bhutta et al., 2005).
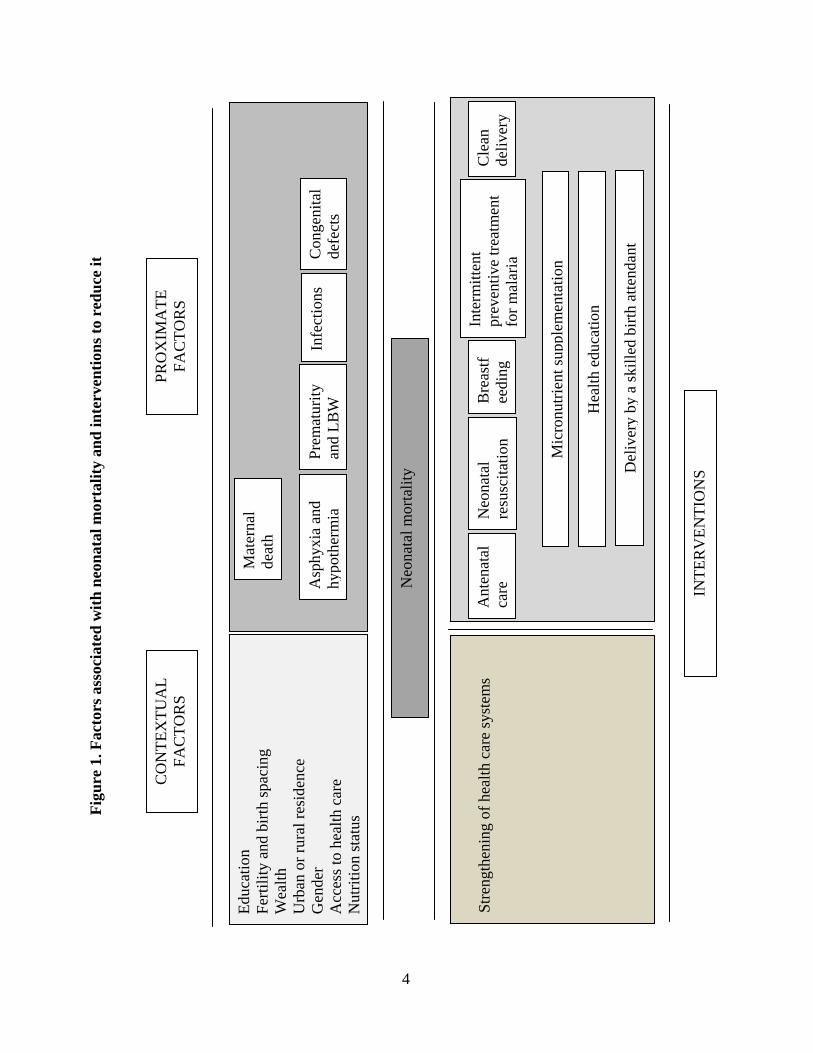
A framework summarizing the factors that are probably associated with NNM and
interventions to reduce it is presented in Figure 1.
Fig
ure
1. F
acto
rs a
ssoc
iate
d w
ith n
eona
tal m
orta
lity
and
inte
rven
tions
to r
educ
e it
Neo
nata
l mor
talit
y
Asp
hyxi
a an
d hy
poth
erm
iaPr
emat
urity
an
d LB
WC
onge
nita
l de
fect
sIn
fect
ions
Bre
astf
eedi
ng
Inte
rmitt
ent
prev
entiv
e tre
atm
ent
for m
alar
ia
Ant
enat
al
care
Mic
ronu
trien
t sup
plem
enta
tion
Cle
an
deliv
ery
Hea
lth e
duca
tion
Neo
nata
l re
susc
itatio
n
Stre
ngth
enin
g of
hea
lth c
are
syst
ems
Del
iver
y by
a sk
illed
birt
h at
tend
ant
Educ
atio
n Fe
rtilit
y an
d bi
rth sp
acin
g W
ealth
U
rban
or r
ural
resi
denc
e G
ende
r A
cces
s to
heal
th c
are
Nut
ritio
n st
atus
PRO
XIM
ATE
FA
CTO
RS
CO
NTE
XTU
AL
FAC
TOR
S
INTE
RV
ENTI
ON
S
Mat
erna
l de
ath
4

5
The conduct of population-based surveys in which women of fertile age recall the
circumstances around the birth of their last-born child presents a unique opportunity to explore
further some of the factors associated with NNM. Such surveys can also be used to study the
potential influence of maternal-neonatal health interventions (e.g., the use of a sterile blade and kit
for cord cutting) on the status of newborns. Recently, some DHS surveys in Asian countries have
included new variables related to the circumstances around birth, such as whether a disposable
delivery kit was used; whether there were any complications that occurred during delivery; whether
the child was dried or wrapped at birth; whether the child was bathed during a specified period after
birth; and whether the woman received advice on family planning, breastfeeding, or baby care after
birth.
In this report, associations are explored between NNM and a number of background and
birth-related characteristics, including the new NNM-related variables measured in DHS surveys, in
five Asian countries—Bangladesh, India, Indonesia, Nepal and the Philippines.
6
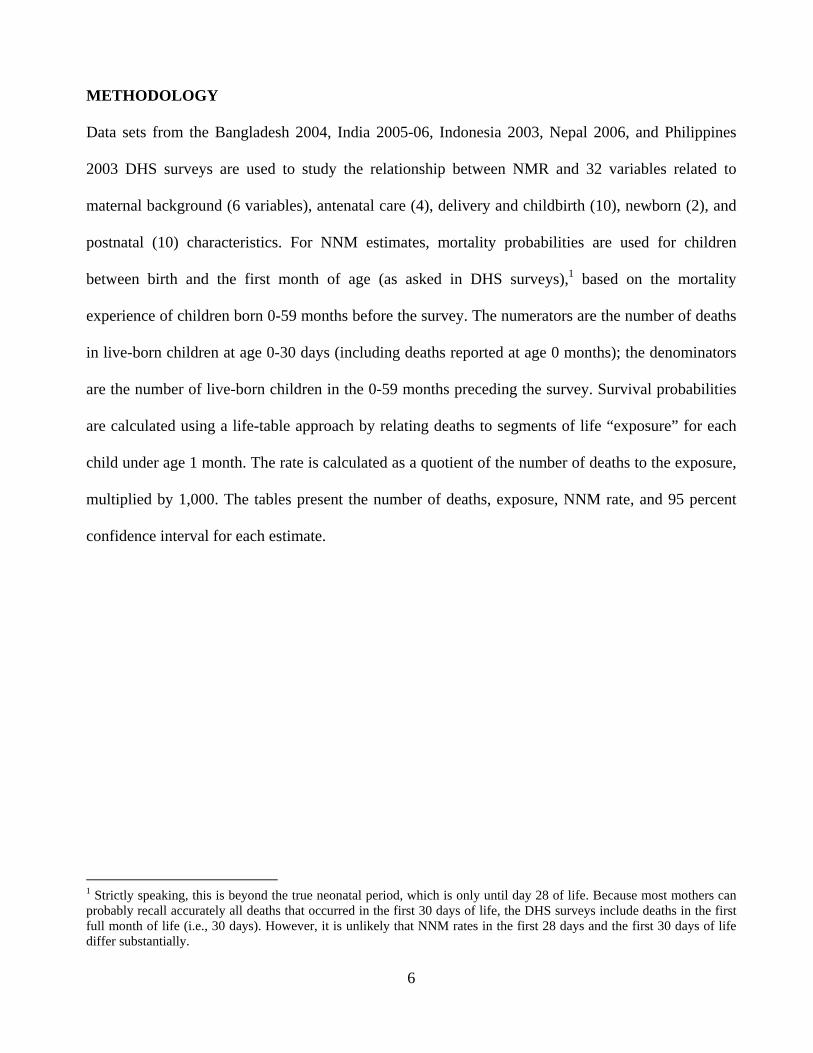
METHODOLOGY
Data sets from the Bangladesh 2004, India 2005-06, Indonesia 2003, Nepal 2006, and Philippines
2003 DHS surveys are used to study the relationship between NMR and 32 variables related to
maternal background (6 variables), antenatal care (4), delivery and childbirth (10), newborn (2), and
postnatal (10) characteristics. For NNM estimates, mortality probabilities are used for children
between birth and the first month of age (as asked in DHS surveys),1 based on the mortality
experience of children born 0-59 months before the survey. The numerators are the number of deaths
in live-born children at age 0-30 days (including deaths reported at age 0 months); the denominators
are the number of live-born children in the 0-59 months preceding the survey. Survival probabilities
are calculated using a life-table approach by relating deaths to segments of life “exposure” for each
child under age 1 month. The rate is calculated as a quotient of the number of deaths to the exposure,
multiplied by 1,000. The tables present the number of deaths, exposure, NNM rate, and 95 percent
confidence interval for each estimate.
1 Strictly speaking, this is beyond the true neonatal period, which is only until day 28 of life. Because most mothers can probably recall accurately all deaths that occurred in the first 30 days of life, the DHS surveys include deaths in the first full month of life (i.e., 30 days). However, it is unlikely that NNM rates in the first 28 days and the first 30 days of life differ substantially.

7
RESULTS
Results for each country are presented in Appendices I to V. Table 1 presents a summary of
associations between NNM and the 32 variables in the five Asian countries. In this section, findings
are grouped into five categories, as described in Table 1: maternal background characteristics,
antenatal care, delivery and childbirth, newborn characteristics, and postnatal care.
Maternal Background Characteristics
1. Place of Residence
In four of the five countries studied, there is no association between rural residence and increased risk
of NNM. Only in India (possibly due to the large sample size) is there an association between rural
area residence and higher NNM rates.
2. Education
In two of the five countries (Nepal and India), education is negatively associated with NNM. In the
Philippines, women with no education have an NNM rate that is 2.6 times higher than women with
secondary education. However, the very few cases of illiteracy produced large confidence intervals
that overlap with the lower estimates.
3. Wealth Index
In four of the five countries, there is no association between the wealth index and NNM rates. Only
in India (helped by a large sample size) is there an association between poorer households and higher
NNM rates.

8
Table 1. Summary of associations between maternal, childbirth, and newborn characteristics and neonatal mortality rates, DHS Bangladesh, India, Indonesia, Nepal, and the Philippines, 2003-06
CHARACTERISTICS Bangladesh 2004
India 2005-06
Indonesia 2003
Nepal 2006
Philippines 2003
MATERNAL BACKGROUND
1. Place of residence (urban / rural) +
2. Education (secondary or higher / no education) + + 1
3. Wealth index (richest / poorest ) +2 4. Sex of the child (male / female)
5. Birth order (second or third order / first order) + +3 +
6. Previous birth interval (2-3 years / less than 2
years) + 1
ANTENATAL CARE
7. Mother received antenatal care (yes / no) 1 1
8. Mother informed about complications (yes / no) 9. Mother given iron supplements (yes / no)
10. Mother given tetanus injection (yes / no) 1
DELIVERY AND CHILDBIRTH
11. Skilled attendant at delivery (professionals /
other) 12. Place of delivery (institutional / noninstitutional) 4
13. Use of disposable delivery kit (yes / no) +
14. Instrument to cut umbilical cord (new, clean, and
boiled / other) 1 1
15. Anything placed on stump (yes / no) 1
16. Caesarean section (yes / no) 1 1 17. Long labor (yes / no) 18. Excessive bleeding (yes / no) 19. Baby’s hands and feet came first (yes / no) 20. High fever or convulsions (yes / no)
NEWBORN CHARACTERISTICS
21. Perceived birth size by mother (average or
larger / small or very small) + + + +
22. Birth weight (2.5+ kg / <2.5 kg) + + 1 1
POSTNATAL CARE
23. Mother received postpartum care (yes / no) + + +
24. Mother initiated breastfeeding early (yes / no) +
25. Child was dried prior to placenta delivery (yes /
no)
1
1
26. Child was wrapped immediately after birth /
prior to placenta delivery (yes / no) +
27. Timing of bathing (within 1 hour of birth / more
than 24 hours later) 1
28. Mother received an abdominal, breast, or internal
examination (yes / no) (Cont’d)

9
Table 1 – cont’d
CHARACTERISTICS Bangladesh 2004
India 2005-06
Indonesia 2003
Nepal 2006
Philippines 2003
POSTNATAL CARE
29. Mother received family planning advice (yes /
no) 1
30. Mother received breastfeeding advice (yes /
no) 1 +
31. Mother received baby care advice (yes / no) +
32. Newborn received a checkup (yes / no) 4 + 1 +
Note: Characteristics with statistically significant associations are in boldface text; blank cells indicate no association. + Positive association 1 Although rates differ (in a positive direction) by at least 50 percent, the difference is not statistically significant due to the small number of cases. 2 Includes two highest quintiles. 3 Significant (positive) differences are also found between birth intervals of two to three years versus four or more years. 4 Although rates differ (in a negative direction) by at least 50 percent, the differences are not statistically significant due to the small number of cases.
4. Sex of the Child
No associations are found between sex of the child and NNM rates.
5. Birth Order
First births are associated with higher NNM rates than second and third order births in Bangladesh,
India and Nepal. There is no association between birth order and NNM in Indonesia and the
Philippines.
6. Previous Birth Interval
In four of the five countries, NNM rates are not associated with a birth interval of less than two years.
In Nepal, the NNM rate in women whose previous birth occurred less than two years earlier is 73
percent higher than in women whose previous birth occurred at least four years earlier (i.e., 23
Data not available

10
months earlier compared to 48 months or more earlier) but the confidence intervals overlap. In India,
a birth interval of less than two years is associated with a higher NNM rate.
Antenatal Care
7. Receipt of Antenatal Care
No associations between antenatal care and NNM rates are found in any of the five countries. In
India, the NNM rate is 39 percent higher for women who did not receive antenatal care than in
women who received antenatal care, but the confidence intervals overlap. In the Philippines, women
who did not receive antenatal care report a rate of NNM that is three times as high as that of women
who received antenatal care, but the number of cases is small.
8. Whether Woman Informed of Complications
No associations are found in any of the five countries between whether the mother was informed of
pregnancy complications and NNM rates.
9. Maternal Iron Supplementation
No associations are found in any of the five countries between maternal iron supplementation and
NNM rates.
10. Maternal Tetanus Injection
No associations are found in any of the five countries between maternal tetanus injections and NNM
rates. In India, the NNM rate in mothers who have not been given a tetanus injection is 54 percent
higher than in those who have had an injection, but the confidence intervals overlap.

11
Delivery and Childbirth
11. Skilled Attendant at Delivery
No associations are found in any of the five countries between NNM rates and the mother’s receipt of
care from a professional or “other” personnel during her last delivery.
12. Place of Delivery
In the five countries, there are no associations between place of delivery and NNM rates. In
Bangladesh, the NNM rate for delivery in an institution is higher than that taking place in a
noninstitutional setting (64 per 1,000 versus 39 per 1,000, respectively) — an association in the
opposite direction from that in other countries2 — but the confidence intervals overlap.
13. Use of a Disposable Delivery Kit
The DHS surveys only ask about use of disposable delivery kits in Nepal and India. In Nepal,
deliveries without the use of a disposable delivery kit are associated with higher NNM rates. In India,
there is no association.
14. Use of a Clean Blade to Cut the Umbilical Cord
Only the India and Nepal DHS surveys ask about use of a clean blade to cut the umbilical cord. The
NNM rates are 72 percent higher in Indian women and 53 percent higher in Nepalese women,
respectively, for whom a clean blade was not used to cut the cord, than in women for whom a clean
blade was used, but in both cases the confidence intervals overlap.
2 The direction of this association is also plausible. In a country with few institutional births, such as Bangladesh, women who deliver in a health care facility might do so precisely because of the complications of labor and delivery; these complications can ultimately lead to newborn deaths.

12
15. Anything Placed on the Umbilical Cord Stump
Only the Nepal DHS survey asks about the placement of anything on the umbilical cord stump
immediately following delivery. The NNM rate is nearly twice as high when nothing was placed on
the stump (which is contrary to expectations) as when anything was placed on the stump. However,
the difference is not significant.
16. Caesarean Section
No associations are found between having a Caesarean section and NNM rates in any of the five
countries. In Nepal, women who did not have a Caesarean section have an NNM rate that is 94
percent higher than women who had a Caesarean section, but very few women surveyed had a
Caesarean section. In India, not having a Caesarean section is associated with a 48 percent increase in
NNM rates but the confidence intervals overlap.
17. Long Labor
Only the Indonesia and Bangladesh DHS surveys ask women about labor duration. No associations
are found between duration of labor and NNM rates.
18. Excessive Bleeding
Women are asked about excessive bleeding during labor and delivery only in Indonesia and
Bangladesh. No associations are found between excessive bleeding during labor and delivery and
NNM rates.

13
19. Whether the Baby’s Hands and Feet Came Out First
A question concerning whether the baby’s head or feet were delivered first is asked only in
Bangladesh. No association is found between this variable and the NNM rate.
20. High Fever or Convulsions
Only the Indonesia and Bangladesh DHS surveys ask about mothers’ experiences of high fever or
convulsions during labor and delivery. No associations are found between this variable and NNM
rates.
Newborn Characteristics
21. Perceived Birth Size
Mothers’ perceptions that their babies were small or very small at birth are associated with higher
NNM rates than mothers’ perceptions that their babies are of average or larger size at birth in the four
countries with data on perceived infant size (these data are not available for Bangladesh).
22. Birth Weight
Birth weight under 2.5 kg is associated with higher NNM rates than birth weight higher than 2.5 kg
in India and Indonesia. In Nepal and the Philippines, the rates are also substantially higher in LBW
babies, 2.3 and 3.2 times higher, respectively. However, the confidence intervals overlap, possibly
due to the small number of cases and of deaths in babies born weighing less than 2.5 kg. Data on
birth weight are unavailable for Bangladesh.

14
Postnatal Care
23. Postpartum Care of Mothers
Not having received postpartum care (for mothers) is associated with higher NNM rates compared
with having received such care in India, Indonesia, and the Philippines. No association is found in
Nepal and Bangladesh.
24. Early initiation of Breastfeeding
In four of the five countries studied, there is no association between lack of early initiation of
breastfeeding (i.e., breastfeeding within one hour of birth) and increased NNM rates. In Indonesia, an
association is found between lack of early breastfeeding initiation and higher NNM.
25. Drying the Newborn Prior to Placenta Delivery
Only the Nepal DHS survey asks mothers whether their newborns had been dried before the placenta
was delivered. The NNM rate is more than twice as high in infants who were not dried than in those
who were dried. However, the confidence intervals overlap.
26. Wrapping the Newborn
Only the Nepal DHS survey asks whether newborns were wrapped (in a blanket) immediately after
delivery. In Nepal, not wrapping newborns is associated with higher NNM rates.
In India, the DHS survey asks a combined question about whether the child was dried prior to
placenta delivery and then wrapped. Not drying or wrapping babies is associated with an NMR rate
that is 30 percent higher, but the confidence intervals overlap.

15
27. Timing of First Bath
Only the Nepal DHS survey asks about the timing of bathing for newborns. Bathing the newborn 24
hours or more after birth is associated with a rate of NNM that is 50% lower than the rate associated
with bathing the infant less than an hour after birth. However, very few respondents report that their
newborns were bathed more than 24 hours after birth and the difference is not significant.
28. Abdominal, Breast, or Internal Postpartum Examinations
Only the Nepal and Philippines DHS surveys ask about postpartum abdominal, breast, or internal
examinations. No associations are found between these examinations and NNM rates.
29. Family Planning Advice
Only the India and Philippines DHS surveys ask whether new mothers had received family planning
advice.3 In India, not receiving family planning advice is associated with an NNM rate that is 63
percent higher than receiving such advice, but the confidence intervals overlap. In the Philippines,
there is no association between receipt of family planning advice and NNM rates.
30. Breastfeeding Advice
Only the India and Philippines DHS surveys ask whether mothers received breastfeeding advice after
giving birth. In India, not receiving advice about breastfeeding is associated with an NNM rate that is
53 percent higher than receiving this advice, but the confidence intervals overlap. In the Philippines,
not receiving the advice is associated with a higher NNM rate.
3 In India, this question referred to advice received in the last trimester of pregnancy, while in Philippines it referred to advice received after delivery.

16
31. Baby Care Advice
Only the India and Philippines DHS surveys ask whether new mothers have received baby care
advice. In India, there is no association between receiving this advice and the NNM rate. In the
Philippines, not receiving the advice is associated with a higher NNM rate.
32. Newborn Checkup
In India and the Philippines, not receiving a checkup is associated with a higher NNM rate. In
Indonesia, not receiving a checkup is associated with an NNM rate that is twice as high as that
associated with receiving a checkup, but the confidence intervals overlap (by two points). In
Bangladesh, the NNM rate is 60 percent higher in infants who received a checkup than in those who
did not (representing a reverse association), but the confidence intervals overlap (by 4 points).

17
CONCLUSIONS
This study of five Asian countries with DHS data found associations between several maternal,
newborn, and childbirth characteristics and NNM.
The clearest association is between mothers’ perceptions of the size of their newborn and the
NNM rate. Mothers who say that their babies were “smaller than average” or “very small” at birth
consistently report a significantly higher NNM rate than those responding that their babies were of
average or larger size in all the countries with data. Interpretation of this finding is difficult because it
is unclear whether the mothers perceived their babies as small as a rationalization after the newborns
failed to thrive and died. A similar variable, actual birth weight reported by mothers, yields
associations between babies weighing less than 2.5 Kg and higher NNM rates in two of the four
countries with data; differences in the other two countries fail to reach significance due to the small
number of cases and deaths.
Another characteristic associated with NNM is birth order. In three of the five countries, first
births are associated with increased mortality rates compared with second and third births. In India,
fourth order births are also associated with increased NNM rates compared with second and third
order births.
The third characteristic associated with increased NNM rates is non-receipt of postpartum
care at a health care institution or at home. In three of the five countries studied, NNM rates among
mothers who did not receive postpartum care are higher than among those who did receive such care.
Given that in these countries, the vast majority of births occur outside a health care institution, this
finding is of particular importance.
Because of the low rates of NNM and the statistical methods used, several associations do not
reach statistical significance. However, analyses for India, with a sample size 3 to 10 times higher
than that of other countries, yield significant associations with such variables as place of residence,
18
education, wealth and previous birth interval.
In addition, variables that have only recently been added to some DHS surveys (such as use of
a delivery kit during labor and delivery; drying the newborn prior to placenta delivery; wrapping the
newborn prior to placenta delivery; timing of the newborn’s first bath; and mother’s receipt of advice
on family planning, breastfeeding, and baby care) yield some associations with NNM rates in the few
countries whose DHS surveys include these variables.

19
IMPLICATIONS FOR POLICY, RESEARCH, AND FUTURE SURVEYS
This study yielded a few associations with policy implications. A first and previously known
association is that between NNM rates and birth order. The association between higher NMR rates
and first order birth demonstrates the need for countries to ensure that first-born neonates receive
extra care and attention, especially during the postnatal period.
The association between NMR rates and mothers’ perceptions that their newborns were small
could be used for early interventions. For example, through health education, mothers who perceive
their newborn babies as too small or whose babies weigh less than 2.5 kg. could be encouraged to
take their baby promptly to a health care facility for further examination. Also, babies born in
noninstitutional settings should receive at least one early postpartum or postnatal care visit,
preferably at a health care institution or, if at home, by a health care professional.
Observed associations between NMR rates and responses to several questions pertaining to
specific interventions, such as the use of a disposable delivery kit, newborn thermal care, and advice
on maternal and newborn care, merit further investigation. The reliability of questions on such topics
as skin-to-skin care, the components of postnatal care for mothers and babies, and mothers’
recognition of danger signs in their newborns, also needs to be investigated. Additional studies
exploring the background characteristics of mothers who receive the recommended care during and
after birth and follow the recommended practices of newborn care would be useful in identifying
target populations for various program interventions in this arena.
These positive initial findings have important potential for immediate policy applications and
are thus worth studying further. In particular, quantitative and qualitative studies could be designed to
explore mothers’ knowledge and understanding of these interventions, as well as to validate their
recall of selected interventions through observational studies. Multivariate analysis, in particular,
could shed light on the most critical factors affecting NNM when all of these factors are considered

20
simultaneously. The ultimate objectives of these studies would be to determine which questions are
worth including in future surveys and to better formulate such questions. An ultimate goal is to
develop a neonatal health module using questions proven to be reliable that could be used and
adapted as necessary in countries with particular interventions designed to lower their NNM rates.

21
LIMITATIONS
A study of this nature has inherent limitations. One of the most important limitations is that produced
by small sample sizes or small numbers of responses regarding specific characteristics. For example,
because most mothers in the five countries studied do not know the birth weight of their newborns,
comparisons of low and normal birth weights can only be made for a small number of cases.
As with any study based on cross-sectional surveys, this study is limited by its dependence on
the recall of mothers. Mothers may underreport deaths in their newborns, especially those that
occurred a few days after birth; in addition, mothers may also underreport deaths for births that
occurred several years before the survey.
Several associations explored here may be obscuring the presence of a confounding variable.
Multivariate analysis would help identify the most critical factors that independently and strongly
affect the differing levels of mortality found.
Given that the confidence interval rates are derived from the same sample and not from
independent samples, a more appropriate statistical test would include the covariate term in the
equation. Including the covariate could yield significant associations in a few of the borderline
analyses in which no associations are found. With that in mind, the significant associations found
using these data should be interpreted as the “minimum set” of associations.
In addition, associations cannot determine directions of causality. In particular, several
variables might suffer from “reverse causality,” or mothers’ rationalizations or adjustments. Such
rationalizations might have occurred in mothers who perceive their baby’s birth weight as low;
mothers whose neonate died might be more likely to revise their perception and answer that their
newborn was “small” or “very small” than mothers of healthy newborns. Similar phenomena may
have occurred in mothers who report receiving postpartum care, and this may be the case with other
variables investigated.

22
REFERENCES
Bale, J., B. Stoll, A. Lucas. 2003, and Committee on Improving Birth Outcomes. Improving birth
outcomes: Meeting the challenge in the developing world. Washington, DC: The National
Academy Press.
Bang, A., R. Bang, S. Baitule, M. Reddy, and M. Deshmukh. 1999. Effect of home-based neonatal
care and management of sepsis on neonatal mortality: Field trial in rural India. Lancet 354:
1955–1961.
Bhutta, Z. A., T. Ahmed, R.E. Black, S. Cousen, K. Dewey, E. Giugliani, B.A. Haider, B. Kirkwood,
S.S. Morris, H.P. Sachdev, M. Shekar, and Maternal and Child Undernutrition Study Group.
2008. What works? Interventions for maternal and child undernutrition and survival. Lancet
371: 41-64.
Bhutta, Z. A., G.L. Darmstadt, B.S. Hasan, and R.A. Haws. 2005. Community-based interventions
for improving perinatal and neonatal health outcomes in developing countries: A review of
the evidence. Pediatrics 115: 519-617.
Black, R. E., L.H. Allen, Z.A. Bhutta, L.E. Caulfield, M. de Onis, M. Ezzati, C. Mathers, J. Rivera,
and Maternal and Child Undernutrition Study Group. 2008. Maternal and child
undernutrition: Global and regional exposure and health consequences. Lancet 371: 5-22.
Black, R. E., S.S. Morris, and J. Bryce. 2003. Where and why are 10 million children dying every
year? Lancet 361: 2226-2234.
Bryce, J., and J.H. Requejo. 2008. Countdown to 2015. Tracking progress in maternal newborn &
child survival. The 2008 report. New York, New York: UNICEF. Available at
http://www.who.int/entity/pmnch/Countdownto2015FINALREPORT-apr7.pdf

23
Delong, G., P. Leslie, S.H. Wang, X.M. Jiang, M.L. Zhang, M. Rakeman, J.Y. Jiang, T. Ma, and
X.Y. Cao. 1997. Effect on infant mortality of iodination of irrigation water in the severely
iodine deficient areas of China. Lancet 350: 771–773.
Donnay, F. 2000. Maternal survival in developing countries: What has been done, what can be
achieved in the next decade. International Journal of Gynaecology and Obstetrics 70: 89-97.
Harris, K., C. Wilson, N. Sheppard Brown, L. Keys, C. Wenz, and V. Mendler. 1999. A perinatal
education consortium: Improved resource utilization. Journal of Obstetric, Gynecologic, and
Neonatal Nursing 28: 486-492.
Hill, K., and Y. Choi. 2006. Neonatal mortality in the developing world. Demographic research 14:
429-452.
Katz, J., K.J. West, S. Khatry S, E.K. Pradhan, S.C. LeClerq, P. Christian, L.S. Wu, R.K. Adhikari,
S.R. Shrestha, and A. Sommer. 2000. Maternal low-dose vitamin A or beta-carotene
supplementation has no effect on fetal loss and early infant mortality: A randomized cluster
trial in Nepal. American Journal of Clinical Nutrition 71: 1570 –1576.
Knippenberg, R., L.E. Lawn, G.L. Darmstadt, G. Bekyorian, H. Fogstasdt, N. Waleign, V. Paul, and
Lancet Neonatal Survival Steering Team. 2005. Systematic scaling up newborn care in
countries. Lancet 365: 1087-98.
Lawn, J.E., S. Cousens, and J. Zupan. 2005. 4 million neonatal deaths: When? Where? Why? Lancet
365: 891-899.
Lawn, J.E., B. McCarthy, and S.R. Ross. 2001. The healthy newborn: A reference guide for program
managers. Atlanta, Georgia: Centers for Disease Control and Prevention and Care. Available
at: http://www.cdc.gov/reproductive-health/health_newborn.htm.
Lawn, J.E., J. Zupan, G. Begkoyian, and R. Knippenberg. 2006. Newborn survival. In D.T. Jamison,
J.G. Breman, A.R. Measham, G. Alleyne, M. Claeson, D.B. Evans, P. Jha, A. Mills, and P.

24
Musgrove (eds.), Disease control priorities in developing countries. 2nd edition. New York:
Oxford University Press, pp. 531-549. Available at http://files.dcp2.org/pdf/DCP/DCP27.pdf
Leon-Cava, N., C. Lutter, J. Ross, and L. Martin L. 2002. Quantifying the benefits of breastfeeding:
A summary of the evidence. Washington, DC: Pan American Health Organization and
LINKAGES. Available at: http://www.linkagesproject.org/media/publications/Technical
%20Reports/BOB.pdf
Manandhar, D.S., D. Osrin, B.P. Shrestha, N. Mesko, J. Mossision, K.M. Tumbahangphe, S.
Tamang, S. Thapa, D. Shrestha, B. Thapa, J.R. Shrestha, A. Wade, J. Borghi, H. Standing, M.
Manandhar, A.M. Costello, and members of the MIRA Makwanpur trial team. 2004. Effect of
a participatory intervention with women’s groups on birth outcomes in Nepal: Cluster-
randomised controlled trial. Lancet 364: 970-79.
Masanja, H., D. de Savigny, P. Smithson, J. Schellenberg, T. John, C. Mbuya, G. Upunda, T.
Boerma, C. Victora, T. Smith, and H. Mshinda. 2008. Child survival gains in Tanzania:
Analysis of data from Demographic and Health Surveys. Lancet 371: 1276-1283.
Moss, W., G.L. Darmstadt, D.R. Marsh, R.E. Black, and M. Santosham. 2002. State of the art:
Research priorities for the reduction of perinatal and neonatal morbidity and mortality in
developing country communities. Journal of Perinatology 22: 484-495.
Ngoc, N.T.N., M. Merialdi, H. Abdel-Aleem, G. Carroli, M. Purwar, N. Zavaleta, L. Campódonico,
M.M. Ali, G.J. Hofmeyr, M. Mathai, O. Lincetto, and J. Villlar. 2006. Causes of stillbirths
and early neonatal deaths: Data from 7993 pregnancies in six developing countries. Bulletin
of the World Health Organization 84: 699-705.
Save the Children. 2006. State of the world’s mothers 2006: Saving the lives of mothers and
newborns. Westport, Connecticut: Save the Children. Available at
http://www.savethechildren.org/publications/mothers/2006/SOWM_2006_final.pdf

25
Shulman, C., E. Dorman, F. Cutts, K. Kawuondo, J.N. Bulmer, N. Peshu, and K. Marsh. 1999.
Intermittent sulphadoxine-pyrimethimine to prevent severe anaemia secondary to malaria in
pregnancy: A randomized, placebo-controlled trial. Lancet 353: 632-636.
Tinker, A.G., V.K. Paul, and J.D. Ruben. 2006. Maternal and newborn care: The right to a healthy
newborn. International Journal of Gynecology and Obstetrics 94: 269-276.

26
APPENDIX I. Neonatal Mortality in Bangladesh Number of neonatal deaths and exposures, neonatal mortality rates, and confidence intervals for the five years preceding the survey by background, prenatal, childbirth, and newborn characteristics, Bangladesh, 2004
Neonatal deaths (N)
Exposure (N)
Neonatal mortality rate per 1,000 live births
Confidence interval
BACKGROUND CHARACTERISTICS
Type of place of residence Urban 55 1,407 39 29-49 Rural 237 5,658 42 35-49 Region Barisal 11 415 28 15-40 Chittagong 55 1,549 35 24-46 Dhaka 98 2,200 44 33-56 Khulna 26 735 36 22-50 Rajshahi 67 1,563 43 29-57 Sylhet 35 602 58 42-74 Education No education 129 2,738 47 37-57 Primary 87 2,178 40 30-49 Secondary 76 2,149 36 26-45 Wealth index Poorest 86 1,814 48 34-62 Poorer 47 1,459 32 21-43 Middle 71 1,383 51 37-65 Richer 43 1,246 35 23-47 Richest 44 1,162 38 26-50 Sex of the child Male 153 3,593 43 34-51 Female 140 3,472 40 32-48 Birth order 1 121 2,067 58 47-70 2-3 96 3,043 32 24-39 4+ 76 1,955 39 29-49 Previous birth interval <2 years 39 759 51 24-78 2-3 years 72 2,343 31 23-39 4+ years 55 1,886 29 20-38
(Cont’d)

27
APPENDIX I – cont’d
Neonatal deaths (N)
Exposure (N)
Neonatal mortality rate per 1,000 live births
Confidence interval
BEFORE CHILDBIRTH Antenatal care Yes 69 2,959 23 17-30 No 57 2,335 24 17-31 Told about complications Yes 39 1,614 24 16-33 No 87 3,680 24 18-29
Mother took supplemental iron
Yes 64 2,642 24 18-31 No 62 2,650 23 17-30
Mother had a tetanus injection
Yes 29 1,095 26 15-37 No 22 791 27 15-40 DK/Missing 76 3,410 22 17-28 CHILDBIRTH Skilled attendant at delivery Doctor, nurse, or midwife 55 2,169 25 19-32 Other 14 790 18 7-30 Place of delivery Institutional 43 679 64 43-84 Noninstitutional 239 6,199 39 33-44 Caesarean section Yes 8 237 35 13-57 No 273 6,634 41 35-47 Long labor Yes 61 1,483 41 29-53 No 231 5,582 41 35-48
Mother had excessive bleeding
Yes 63 1,534 41 28-54 No 230 5,531 42 35-48 Mother had convulsions Yes 72 1,998 36 27-45 No 220 5,066 43 36-50 (Cont’d)

28
APPENDIX I – cont’d
Neonatal deaths (N)
Exposure (N)
Neonatal mortality rate per 1,000 live births
Confidence interval
Baby's hands and feet came out first
Yes 118 2,465 48 38-58 No 174 4,599 38 31-45 Other complications Yes 10 293 33 12-55 No 282 6,771 42 36-48 AFTER CHILDBIRTH
Mother received postpartum care
Yes 30 743 41 26-56 No 209 5,456 38 32-45
Early initiation of breastfeeding
Yes 158 6,257 25 21-30 No 9 488 19 5-34 Infant received a checkup Yes 48 1,481 32 22-43 No 78 3,815 20 15-26 Total 292 7,065 41 36-47

APP
EN
DIX
FIG
UR
E I.
Neo
nata
l Mor
talit
y R
ates
by
Bac
kgro
und
Cha
ract
eris
tics –
Ban
glad
esh
2004
29

30
APPENDIX II. Neonatal Mortality in India Number of neonatal deaths and exposures, neonatal mortality rates, and confidence intervals for the five years preceding the survey by background, prenatal, childbirth, and newborn characteristics, India, 2005-06
Neonatal deaths (N)
Exposure (N)
Neonatal mortality rates per 1,000 live births
Confidence intervals
BACKGROUND CHARACTERISTICS Type of place of residence Urban 413 14,476 29 22-35 Rural 1,805 42,416 43 37-48
Region North
Delhi 16 532 29 24-35 Haryana 24 1,036 24 -40-87 Himachal Pradesh 7 252 27 -38-93 Jammu and Kashmir 14 474 30 * Punjab 31 1,123 28 2-54 Rajasthan 155 3,541 44 * Uttaranchal 12 417 28 15-70
Central
Chhatisgarh 62 1,215 51 2-100 Madhya Pradesh 174 3,868 45 -17-107 Uttar Pradesh 563 11,819 48 3-93
East Bihar 249 6,264 40 2-78
Jharkhand 92 1,897 49 -25-123 Orissa 90 1,973 45 -22-113 West Bengal 157 4,183 38 -9-84
Northeast
Arunachal Pradesh 2 66 34 * Assam 66 1,446 45 * Manipur 2 119 19 * Meghalaya 4 182 24 7-40 Mizoram 1 51 16 7-26 Nagaland 2 96 20 * Sikkim 0.4 26 19 * Tripura 5 162 33 -34-100 West Goa 0.5 56 9 * Gujarat 88 2,626 33 24-43 Maharashtra 142 4,448 32 -2-65
(Cont’d)

31
APPENDIX II – cont’d
Neonatal deaths (N)
Exposure (N)
Neonatal mortality rates per 1,000 live births
Confidence intervals
South
Andhra Pradesh 128 3,165 40 -20-100 Karnataka 79 2,721 29 17-41 Kerala 12 1,041 12 * Tamil Nadu 40 2,092 19 -4-42 Education
No education 1,303 28,492 46 41-51 Primary 358 7,982 45 37-53 Secondary + 557 20,417 27 23-32 Wealth index Poorest 701 14,494 48 40-56 Poorer 568 12,747 45 40-49 Middle 441 11,241 39 31-48 Richer 327 10,245 32 27-37 Richest 180 8,165 22 17-27 Sex of the child Male 1,214 29,638 41 36-46 Female 1,004 27,254 37 31-43 Birth order 1 826 17,290 48 39-57 2-3 746 24,593 30 27-34 4+ 646 15,009 43 36-50 Previous birth interval <2 years 582 10,402 56 47-65 2-3 years 554 20,794 27 23-31 4+ years 241 8,289 29 24-35 BEFORE CHILDBIRTH Antenatal care Yes 674 29,948 23 19-27 No 282 8,830 32 24-40 Told about complications Yes 149 7,376 20 15-25 No 525 22,566 23 19-28
Mother took supplemental iron
Yes 551 25,271 22 18-26 No 401 13,352 30 24-36
(Cont’d)

32
APPENDIX II – cont’d
Neonatal deaths (N)
Exposure (N)
Neonatal mortality rates per 1,000 live births
Confidence intervals
Mother had a tetanus injection Yes 68 2,560 26 18-35 No 251 6,255 40 31-49 Don’t know or missing 1,842 46,741 39 34-45 CHILDBIRTH Skilled attendant at delivery Doctor, nurse, or midwife 643 28,414 23 19-27 Other 31 1,535 20 12-29 Place of delivery Institutional 764 21,483 36 27-44 Noninstitutional 1,358 34,006 40 36-44 Caesarean section Yes 129 4,711 27 19-36 No 2,029 50,821 40 35-45 Disposable delivery kit used Yes 98 4,693 21 15-27 No 458 16,087 28 24-33 Don’t know or missing 47 1,903 24 17-32 Clean blade used to cut the umbilical cord Yes 528 20,861 25 21-30 No 46 1,090 43 24-62 Don’t know or missing 28 733 38 15-61 NEWBORN CHARACTERISTICS Birth size Small or very small 651 11,548 56 46-67 Average or larger 1,398 43,213 32 27-38 Don’t know or missing 112 794 141 95-188 Birth weight < 2.5 kg 176 4,086 43 33-53 2.5+ kg 206 14,887 14 10-17 Don’t know or missing 1,779 36,583 49 45-52 AFTER CHILDBIRTH
Mother received postpartum care
Yes 18 1,096 17 5-28 No 1,340 32,909 41 37-44
(Cont’d)

33
APPENDIX II – cont’d
Neonatal deaths (N)
Exposure (N)
Neonatal mortality rates per 1,000 live births
Confidence intervals
Early initiation of breastfeeding
Yes 298 28,805 10 8-13 No 86 8,933 10 7-12
Child dried and then wrapped before delivery of placenta
Yes 236 10,284 23 19-27 No 344 11,640 30 25-34 Don’t know or missing 23 759 30 11-48
Mother given family planning advice
Yes 80 5,122 16 9-22 No 202 7,831 26 18-33
Mother given breastfeeding advice
Yes 106 6,155 17 12-23 No 176 6,799 26 18-34
Mother given baby care advice
Yes 95 4,979 19 13-26 No 186 7,975 23 16-31 Need for cleanliness advice Yes 113 6,150 18 13-24 No 168 6,804 25 16-33
Infant received a checkup
Yes 19 1588 12 4-20 No 539 17,940 30 27-33
Total 2,218 56,892 39 34-44 * Not calculated because of insufficient numbers. Note: The month of the interview is excluded from analysis.

APP
EN
DIX
FIG
UR
E II
. Neo
nata
l Mor
talit
y R
ates
by
Bac
kgro
und
Cha
ract
eris
tics –
Indi
a 20
06
34

35
APPENDIX III. Neonatal Mortality in Indonesia Number of neonatal deaths and exposures, neonatal mortality rates, and confidence intervals for the five years preceding the survey by background, prenatal, childbirth, and newborn characteristics, Indonesia, 2003
Neonatal deaths (N)
Exposure (N)
Neonatal mortality rate per 1,000 live births
Confidence interval
BACKGROUND CHARACTERISTICS Type of place of residence Urban 132 7,027 19 13-24 Rural 165 8,119 20 15-25
Region Sumatera
North Sumatra 25 1,380 18 4-31 West Sumatra 9 463 20 6-34 Riau 9 428 21 11-31 Jambi 2 200 11 3-20 South Sumatra 10 382 25 7-43 Bengkulu 2 91 21 7-35 Lampung 12 523 23 8-38 Bangka Belitung 2 71 33 13-54 Java DKI Jakarta 9 508 18 4-33 West Java 66 3,084 21 10-33 Central Java 25 1,795 14 5-23 DI Yogyakarta 1 145 9 0-17 East Java 55 2,138 26 11-40 Banten 13 743 17 7-28 Baliand Nusa Tenggara Bali 1 198 7 0-14 West Nusa Tenggara 5 329 15 5-25 East Nusa Tenggara 7 377 20 8-32 Kalimantan West Kalimantan 5 299 16 4-28 Central Kalimantan 5 177 26 13-40 South Kalimantan 5 253 20 7-33 East Kalimantan 6 261 21 5-38 Sulawest North Sulawesi 3 155 21 8-33 Cenrtal Sulawesi 4 214 17 4-31 South Sulawesi 7 659 10 1-19 Southeast Sulawesi 6 179 34 13-56 Gorontalo 2 92 25 7-42
(Cont’d)

36
APPENDIX III – cont’d
Neonatal deaths (N)
Exposure (N)
Neonatal mortality rate per 1,000 live births
Confidence interval
Education No education 13 732 18 5-30 Primary 138 7,316 19 13-24 Secondary 146 7,098 21 15-26 Wealth index Poorest 67 3,584 19 14-24 Poorer 75 2,960 25 15-36 Middle 53 2,982 18 10-25 Richer 58 2,868 20 10-31 Richest 44 2,752 16 8-24 Sex of the child Male 167 7,833 21 16-26 Female 130 7,312 18 13-23 Birth order 1 113 5,265 22 16-28 2-3 115 6,757 17 12-22 4+ 69 3,124 22 14-30 Previous birth interval <2 years 34 1,211 28 12-44 2-3 years 50 3,003 17 9-25 4+ years 94 5,625 17 11-22 BEFORE CHILDBIRTH Antenatal care Yes 139 11,893 12 8-15 No 13 548 23 -4-51 Told about complications Yes 32 3,422 9 4-14 No 103 8,366 12 8-16 Don’t know or missing 19 137 140 55-225
Mother took supplemental iron
Yes 108 9,774 11 8-15 No 41 2,511 16 7-26 Don’t know or missing 18 187 94 38-149 Mother had a tetanus injection Yes 46 2,688 17 8-26 No 40 3,253 12 6-19 Don’t know or missing 80 6,530 12 8-17
(Cont’d)

37
APPENDIX III – cont’d
Neonatal deaths (N)
Exposure (N)
Neonatal mortality rate per 1,000 live births
Confidence interval
CHILDBIRTH Skilled attendant at delivery Doctor, nurse, or midwife 70 6,623 11 7-14 Other 69 5,269 13 7-19 Place of delivery Institutional 96 5,933 16 10-22 Noninstitutional 135 8,742 15 11-20 Don’t know or missing 60 120 498 346-650 Caesarean section Yes 10 599 16 -8-41 No 282 14,107 20 16-24 Long labor Yes 17 1,063 16 8-24 No 94 5,096 18 12-24 Don’t know or missing 0 5 0 Excessive bleeding in mother Yes 48 2,761 18 11-24 No 248 12,374 20 18-24 High fever in mother Yes 7 560 13 2-24 No 289 14,575 20 16-24 Convulsions in mother Yes 4 240 18 -6-42 No 292 14,895 20 16-23 Other complications in mother Yes 19 866 22 8-35 No 278 14,269 19 16-23 NEWBORN CHARACTERISTICS Birth size Small or very small 79 2,021 39 25-54 Average or larger 140 12,110 12 8-15 Don’t know or missing 71 665 108 69-146 Birth weight < 2.5 kg 60 825 72 39-106 2.5+ kg 85 10,647 8 5-11 Don’t know or missing 146 3,324 44 33-55
(Cont’d)
38
APPENDIX III – cont’d
Neonatal deaths (N)
Exposure (N)
Neonatal mortality rate per 1,000 live births
Confidence interval
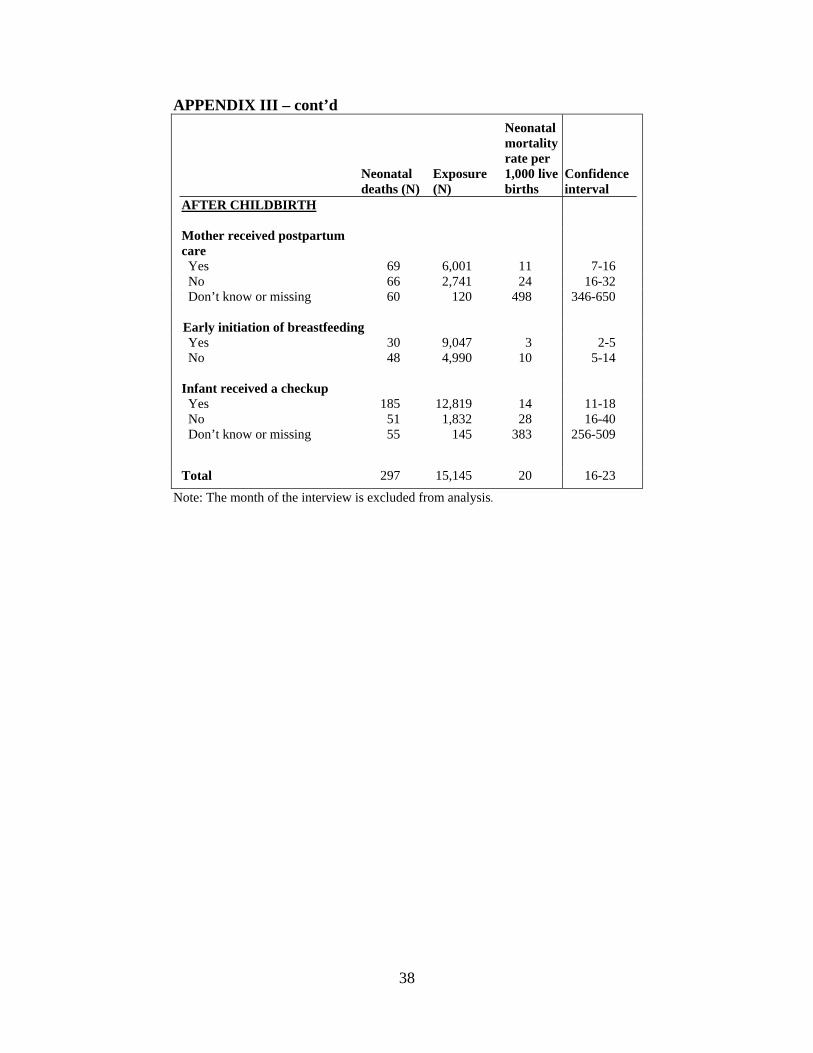
AFTER CHILDBIRTH
Mother received postpartum care
Yes 69 6,001 11 7-16 No 66 2,741 24 16-32 Don’t know or missing 60 120 498 346-650 Early initiation of breastfeeding Yes 30 9,047 3 2-5 No 48 4,990 10 5-14 Infant received a checkup Yes 185 12,819 14 11-18 No 51 1,832 28 16-40 Don’t know or missing 55 145 383 256-509 Total 297 15,145 20 16-23
Note: The month of the interview is excluded from analysis.

A
PPE
ND
IX F
IGU
RE
III.
Neo
nata
l Mor
talit
y R
ates
by
Bac
kgro
und
Cha
ract
eris
tics –
Indo
nesi
a 20
03
37 39

40
APPENDIX IV. Neonatal mortality in Nepal Number of neonatal deaths and exposures, neonatal mortality rates, and confidence intervals for the five years preceding the survey by background, prenatal, childbirth, and newborn characteristics, Nepal, 2006
Neonatal deaths (N) Exposure (N)
Neonatal mortality rate per 1,000 live births
Confidence interval
BACKGROUND CHARACTERISTICS Type of place of residence Urban 18 687 26 16-36 Rural 165 4,913 34 26-41 Region Eastern 40 1,197 33 21-45 Central 52 1,835 28 16-41 Western 35 1,034 33 18-49 Midwestern 34 716 48 28-67 Far-western 23 818 28 11-45 Education No education 133 3,392 39 30-48 Primary 31 1,009 31 18-44 Secondary 19 1,199 16 8-24 Wealth index Poorest 46 1,430 32 23-42 Poorer 41 1,194 34 20-48 Middle 53 1,139 46 29-64 Richer 25 990 25 14-37 Richest 18 847 22 11-33 Sex of the child Male 89 2,839 31 23-40 Female 94 2,762 34 25-43 Birth order 1 75 1,693 44 32-57 2-3 49 2,364 21 14-28 4+ 58 1,543 38 25-51 Previous birth interval <2 years 32 837 38 23-53 2-3 years 53 2,116 25 16-33 4+ years 21 946 22 10-33 BEFORE CHILDBIRTH Antenatal care Yes 47 2,930 16 10-22 No 25 1,048 24 14-34 (Cont’d)

41
APPENDIX IV – cont’d
Neonatal deaths (N) Exposure (N)
Neonatal mortality rate per 1,000 live births
Confidence interval
Mother told about pregnancy complications Yes 27 1,685 16 9-24 No 19 1,243 15 7-24 Don’t know or missing 0 2 0 Mother took supplemental iron Yes 33 2,350 14 8-20 No 38 1,627 23 16-31 Mother had a tetanus injection Yes 10 403 24 4-45 No 34 1,054 32 20-45 Don’t know or missing 28 2,521 11 6-16 CHILDBIRTH Skilled attendant at delivery Doctor, nurse, or midwife 29 1,738 16 9-24 Other 18 1,192 15 7-24 Place of delivery Institutional 28 966 29 15-43 Noninstitutional 150 4,490 33 26-40 Caesarean section Yes 3 146 17 -15-49 No 176 5,310 33 26-40 Disposable delivery kit used Yes 4 562 6 -1-14 No 55 2,635 21 14-27 Instrument used to cut the umbilical cord New or boiled blade 33 1,944 17 10-24 Other 18 679 26 14-39 Anything placed on the umbilical cord stump Yes 8 814 10 3-18 No 45 2,357 19 12-26 Child cried at birth Yes 3 3 1,000 * No 5 34 137 7-267 NEWBORN CHARACTERISTICS Birth size Small or very small 59 1,043 56 39-73 Average or larger 118 4,408 27 20-33
(Cont’d)

42
APPENDIX IV – cont’d
Neonatal deaths (N) Exposure (N)
Neonatal mortality rate per 1,000 live births
Confidence interval
Birth weight < 2.5 kg 5 135 35 -2-71 2.5+ kg 12 810 15 3-27 Don’t know or missing 161 4,512 36 28-43 AFTER CHILDBIRTH
Mother received postpartum care
Yes 8 275 30 5-55 No 142 4,215 34 26-41 Early initiation of breastfeeding Yes 32 2,885 11 6-16 No 7 1,052 7 1-13
Child dried before delivery of placenta
Yes 15 1,365 11 5-17 No 43 1,817 24 15-33
Child wrapped before delivery of placenta
Yes 14 1,423 10 5-16 No 44 1,762 25 16-34 Timing of infant’s first bath <1 hour after birth 26 1,667 16 9-23 1-23 hours after birth 10 998 10 2-19 24+hours after birth 4 515 8 0-15
Mother examined for pelvic discharge
Yes 8 596 14 2-26 No 1 71 16 -17-49 Infant received a checkup Yes 8 358 23 4-42 No 50 2840 18 11-24 Total 183 5,600 33 26-39 Note: The month of the interview is excluded from analysis.

APP
EN
DIX
FIG
UR
E IV
. Neo
nata
l Mor
talit
y R
ates
by
Bac
kgro
und
Cha
ract
eris
tics –
Nep
al 2
006
41 43

44
APPENDIX V. Neonatal Mortality in the Philippines Number of neonatal deaths and exposures, neonatal mortality rates, and confidence intervals for the five years preceding the survey by background, prenatal, childbirth, and newborn characteristics, Philippines, 2003
Neonatal deaths (N) Exposure (N)
Neonatal mortality rate per 1,000 live births
Confidence Interval
BACKGROUND CHARACTERISTICS Type of place of residence Urban 55 3,500 16 11-20 Rural 65 3,525 18 14-23 Region National capital region 19 1,058 18 8-28
Cordillera administrative region 1 116 12 -1-25
I - Ilocos 8 311 26 6-47 II - Cagayan Valley 2 227 7 -7-21 III - Central Luzon 12 690 18 6-30 IVA - CALABARZON 9 835 11 2-20 IVB - MIMAROPA 5 243 20 3-38 V - Bicol 7 445 15 4-26 VI - Western Visayas 11 478 24 4-43 VII - Central Visayas 7 537 12 1-24 VIII - Eastern Visayas 9 362 24 9-38 IX - Zamboanga Peninsula 3 275 13 1-24 X - Northern Mindanao 7 302 24 6-43 XI - Davao 5 303 15 3-28 XII - SOCCSKSARGEN 5 323 15 4-27 XIII - Caraga 4 203 18 5-32 ARMM 6 316 20 4-37 Education No education 5 134 39 4-74 Primary 43 2,060 21 14-27 Secondary 72 4,831 15 11-19 Wealth index Poorest 37 1,867 20 13-27 Poorer 28 1,606 17 11-24 Middle 21 1,367 15 8-23 Richer 24 1,176 21 10-31 Richest 10 1,010 10 3-16 Sex of the child Male 71 3,582 20 15-25 Female 49 3,443 14 10-19
(Cont’d)

45
APPENDIX V – cont’d
Neonatal deaths (N) Exposure (N)
Neonatal mortality rate per 1,000 live births
Confidence Interval
Birth order 1 40 1,956 20 13-28 2-3 34 2,697 13 8-17 4+ 46 2,372 19 13-26 Previous birth interval <2 years 29 1,559 19 12-26 2-3 years 23 2,103 11 6-16 4+ years 28 1,394 20 12-28 BEFORE CHILDBIRTH Antenatal care Yes 50 4,420 11 8-15 No 9 260 33 10-56 Told about complications Yes 22 2,166 10 6-15 No 28 2,244 12 8-17 Mother took supplemental iron Yes 43 3,608 12 8-15 No 15 1,068 14 6-22 Given tetanus injection Yes 18 1,565 12 6-17 No 22 1,304 17 9-24 Don’t know or missing 24 1,825 13 7-19 CHILDBIRTH Skilled attendant at delivery Doctor, nurse, or midwife 46 4,115 11 8-15 Other 4 305 12 0-23 Place of delivery Institutional 43 2,589 17 11-23 Noninstitutional 60 4,220 14 10-18 Caesarean section Yes 8 495 16 4-27 No 112 6,336 18 14-21 NEWBORN CHARACTERISTICS Birth size Small or very small 38 1,295 29 19-40 Average or larger 62 5,479 11 8-14
(Cont’d)

46
APPENDIX V – cont’d
Neonatal deaths (N) Exposure (N)
Neonatal mortality rate per 1,000 live births
Confidence Interval
Birth weight < 2.5 kg 17 893 19 8-29 2.5+ kg 22 3,756 6 3-9 Don’t know or missing 81 2,196 37 28-46 AFTER CHILDBIRTH Mother received postpartum care Yes 14 1,807 8 3-12 No 46 2,412 19 13-25 Early initiation of breastfeeding Yes 14 2,785 5 3-8 No 20 3,087 6 3-9 Abdominal examination conducted Yes 19 2,473 8 4-11 No 12 891 13 5-22 Breast examination conducted Yes 13 1,575 8 4-13 No 18 1,790 10 5-15 Internal examination conducted Yes 16 1,214 13 7-20 No 15 2,146 7 3-11 Mother given family planning advice Yes 14 1,645 9 4-14 No 16 1,718 10 5-15 Mother given breastfeeding advice Yes 13 2,514 5 2-8 No 18 849 21 10-32 Mother given baby care advice Yes 15 2,601 6 3-9 No 16 763 21 10-32 Infant received a checkup Yes 17 2,874 6 3-9 No 14 494 28 13-43 Total 120 7,025 17 14-20 The month of the interview is excluded from analysis.

APP
EN
DIX
FIG
UR
E V
. Neo
nata
l Mor
talit
y R
ates
by
Bac
kgro
und
Cha
ract
eris
tics –
Phi
lippi
nes 2
003
47