Embed Size (px)
Citation preview
COVER 1 2 3 4 5 6 7 8 9 10 11 12 13 14 15 16 17 18 19 20 21 22 23 24 25 26 27 28 29 30 31 32 33 Glossary/Acronyms References & Endnotes Acknowledgements Back Cover
COVER 1 2 3 4 5 6 7 8 9 10 11 12 13 14 15 16 17 18 19 20 21 22 23 24 25 26 27 28 29 30 31 32 33 Glossary/Acronyms References & Endnotes Acknowledgements Back Cover
WWF LIVING FORESTS REPORT: CHAPTER 4
FORESTS AND WOOD PRODUCTS
2012
REPORTINT
1 | Living Forest Report: Chapter 3
COVER 1 2 3 4 5 6 7 8 9 10 11 12 13 14 15 16 17 18 19 20 21 22 23 24 25 26 27 28 29 30 31 32 33 Glossary/Acronyms References & Endnotes Acknowledgements Back Cover
COVER 1 2 3 4 5 6 7 8 9 10 11 12 13 14 15 16 17 18 19 20 21 22 23 24 25 26 27 28 29 30 31 32 33 Glossary/Acronyms References & Endnotes Acknowledgements Back Cover
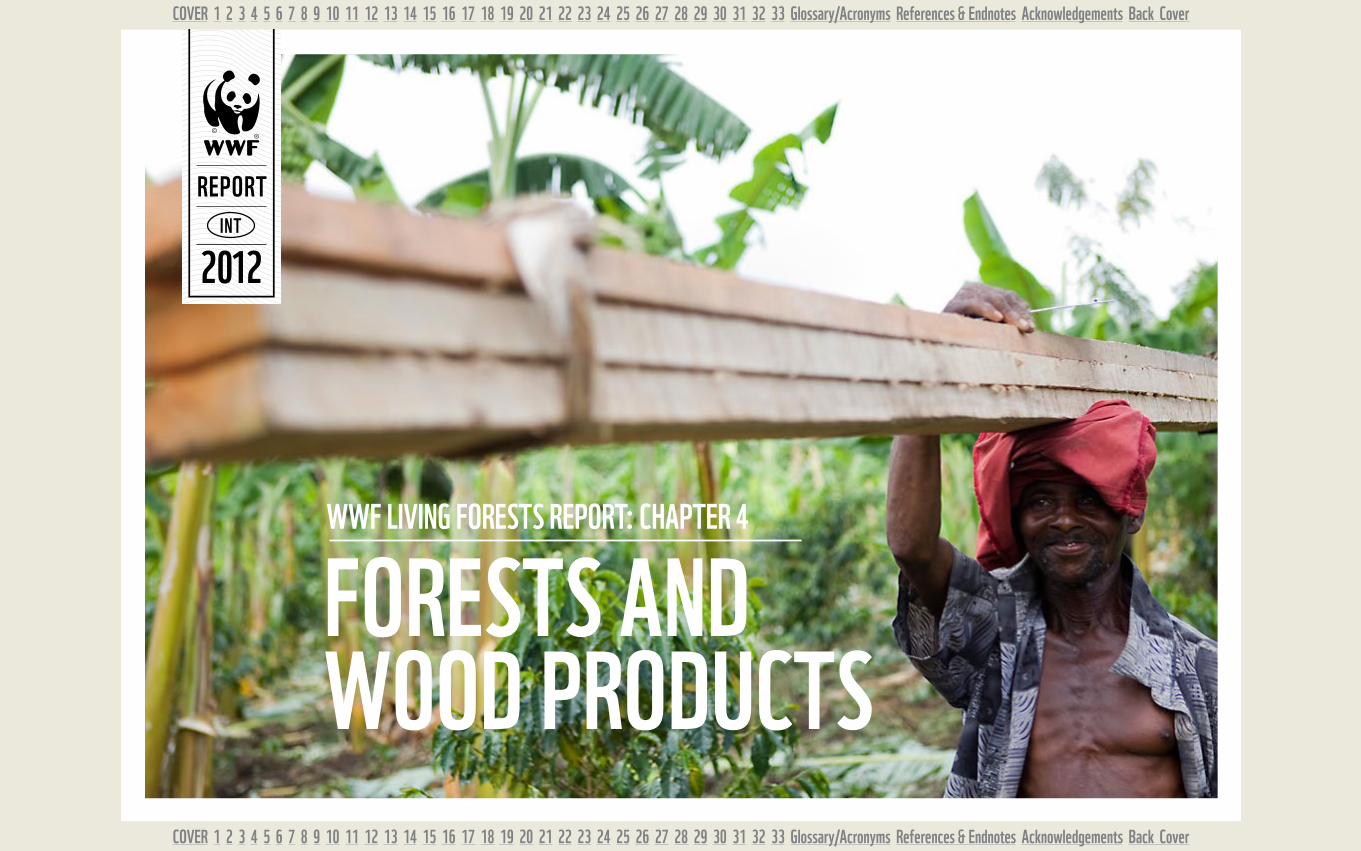
The Living Forests Report aims to catalyse debate on the future role and value of forests in a world where humanity is living within the Earth’s ecological limits and sharing its resources equitably. The report presents Zero Net Deforestation and Degradation (ZNDD) by 2020 as a target that reflects the scale and urgency with which threats to the world’s forest biodiversity and climate need to be tackled. We use the Living Forests Model1, developed by WWF in collaboration with the International Institute for Applied Systems Analysis (IIASA) , to look at the land-use implications of ZNDD under a range of scenarios that consider different conservation, dietary and energy-use options.
The first three chapters of the report were published in 2011:Chapter 1 – Forests for a Living Planet examines the drivers of
deforestation and the need to shift to a new model of sustainable forestry, farming and consumption with ZNDD.
Chapter 2 – Forests and Energy examines the safeguards needed to ensure expanding use of bioenergy helps to provide energy security, rural development and greenhouse gas (GHG) reductions without destroying valuable ecosystems or undermining food and water security.
Chapter 3 – Forests and Climate – REDD+ at a Crossroads highlights REDD+ as a unique opportunity to cut GHG emissions from forests in time to prevent runaway climate change, but only if investments are made now.
This 4th chapter examines current and future demand for wood products and how this can best be met. We explore the many values and uses of wood and its footprint relative to alternative materials (pages 2-7); the current and future demand for wood products (pages 8-17); the relationship between wood production and the conservation of other forest values (pages 19-21) and various options for producing wood (pages 22-31). The chapter concludes with broad solutions that will enable humanity to optimize the use and benefits of wood without diminishing the natural capital in the world’s forests.
While this chapter focuses on wood as the major commodity extracted from forests, it is important to note that forests also produce non-timber forest products (NTFPs). The global value NTFPs is hard to assess but was estimated at US$18.5 billion in 20052. The economic, cultural and ecological value of NTFPs makes them an important component of sustainable forest management and the conservation of biological and cultural diversity.
This chapter of the Living Forests Report explores how we can meet future demand for wood products within the finite resources of one planet.
“WE ARE LIVING AS IF WE HAVE AN ExTRA PLANET AT OUR DISPOSAL. WE ARE USING 50 PER CENT mORE
RESOURCES THAN THE EARTH CAN PROVIDE, AND UNLESS WE CHANGE COURSE THAT NUmbER WILL GROW VERy FAST – by 2030, EVEN TWO PLANETS
WILL NOT bE ENOUGH3”
COVER 1 2 3 4 5 6 7 8 9 10 11 12 13 14 15 16 17 18 19 20 21 22 23 24 25 26 27 28 29 Glossary & Acronyms References & Endnotes Acknowledgements Back Cover
COVER 1 2 3 4 5 6 7 8 9 10 11 12 13 14 15 16 17 18 19 20 21 22 23 24 25 26 27 28 29 Glossary & Acronyms References & Endnotes Acknowledgements Back Cover
2011
REPORTINT
WWF LIVING FORESTS REPORT: CHAPTER 1
FORESTS FOR A LIVING PLANET
COVER 1 2 3 4 5 6 7 8 9 10 11 12 13 14 15 16 17 18 19 20 21 22 23 24 Glossary & Acronyms Appendix References & Endnotes Acknowledgements Back Cover
COVER 1 2 3 4 5 6 7 8 9 10 11 12 13 14 15 16 17 18 19 20 21 22 23 24 Glossary & Acronyms Appendix References & Endnotes Acknowledgements Back Cover
2011
REPORTINT
WWF LIVING FORESTS REPORT: CHAPTER 2
FORESTS AND ENERGY
COVER 1 2 3 4 5 6 7 8 9 10 11 12 13 14 15 16 17 18 19 20 21 22 23 24 25 26 Call for Action Glossary & Acronyms References & Endnotes Acknowledgements Back Cover
COVER 1 2 3 4 5 6 7 8 9 10 11 12 13 14 15 16 17 18 19 20 21 22 23 24 25 26 Call for Action Glossary & Acronyms References & Endnotes Acknowledgements Back Cover
2011
REPORTINT
WWF LIVING FORESTS REPORT: CHAPTER 3
FORESTS ANd CLImATE: REdd+ AT A CROSSROAdS
Jim Leape, Director-General, WWF International
FORESTS AND WOOD PRODUCTS
2 | Living Forest Report: Chapter 3
COVER 1 2 3 4 5 6 7 8 9 10 11 12 13 14 15 16 17 18 19 20 21 22 23 24 25 26 27 28 29 30 31 32 33 Glossary/Acronyms References & Endnotes Acknowledgements Back Cover
COVER 1 2 3 4 5 6 7 8 9 10 11 12 13 14 15 16 17 18 19 20 21 22 23 24 25 26 27 28 29 30 31 32 33 Glossary/Acronyms References & Endnotes Acknowledgements Back Cover
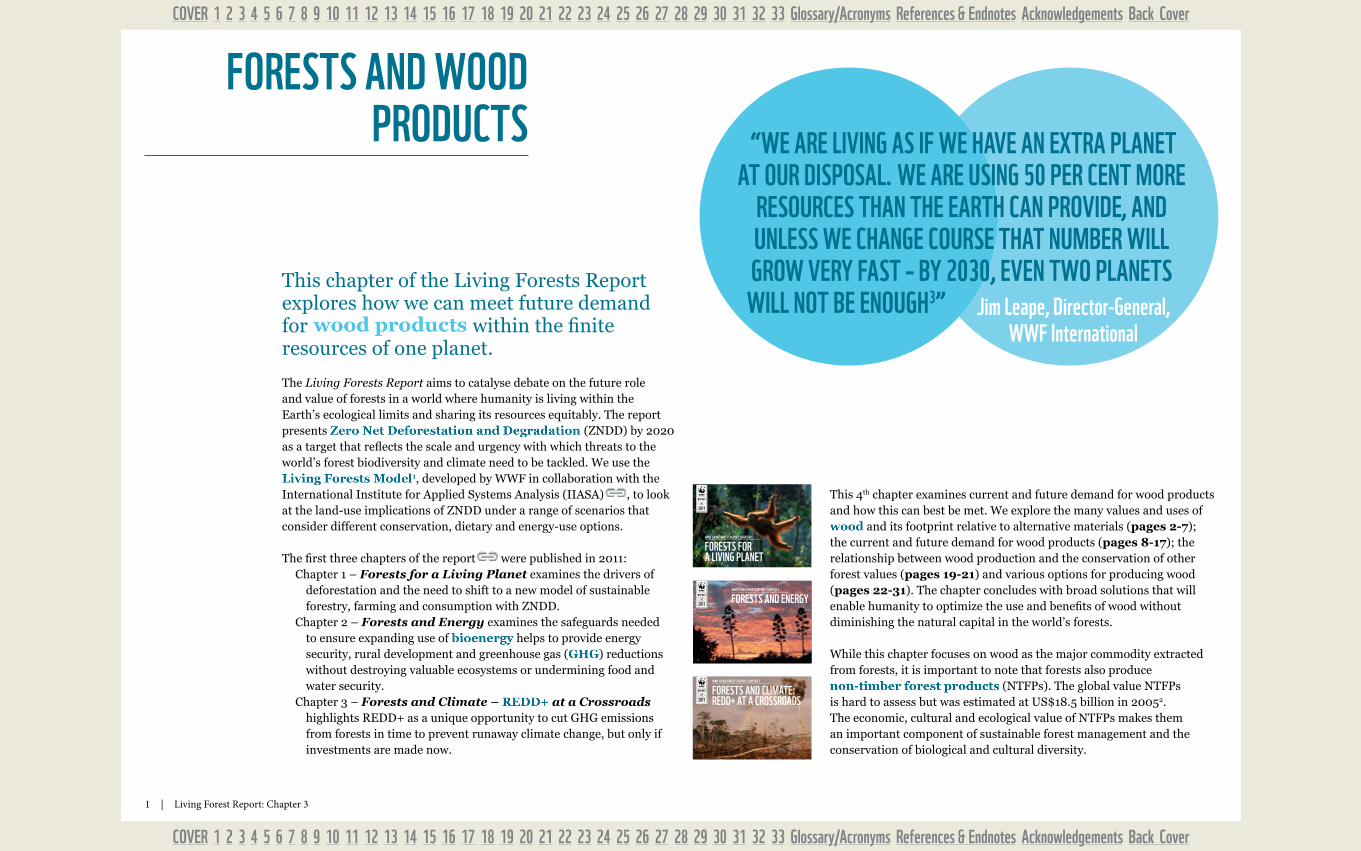
Humanity will likely use more wood in more ways as the future unfolds. If production forests are managed sustainably and wood products are used efficiently or replace
others with a heavier footprint, this should be good for the planet.
WWF advocates reducing wasteful consumption of wood and paper. But even with more frugal use and greater efficiencies, net demand is likely to grow with rising population and incomes in developing countries. So how can we produce more wood without destroying or degrading forests, in a world where competition for land and water is increasing? This challenge spans the whole supply chain, from where and how wood is grown and harvested to how wisely and efficiently it is processed, used and reused. It also involves changes to consumption patterns – such as eliminating excessive and wasteful use of paper in rich societies, while improving access for the poor to paper products that can improve education, hygiene and food safety.
Advancing technology is enabling new uses of wood and its core chemical components in composites, films and chemically processed speciality cellulose. In the future such uses could add significantly to the volume of wood that needs to be extracted from forests or grown in plantations.
WOOD PRODUCTS: TODAy AND
TOmORROW
EVEN WITH mORE FRUGAL USE AND GREATER EFFICIENCIES, NET DEmAND IS LIkELy TO GROW
3 | Living Forest Report: Chapter 3
COVER 1 2 3 4 5 6 7 8 9 10 11 12 13 14 15 16 17 18 19 20 21 22 23 24 25 26 27 28 29 30 31 32 33 Glossary/Acronyms References & Endnotes Acknowledgements Back Cover
COVER 1 2 3 4 5 6 7 8 9 10 11 12 13 14 15 16 17 18 19 20 21 22 23 24 25 26 27 28 29 30 31 32 33 Glossary/Acronyms References & Endnotes Acknowledgements Back Cover
RECOVERED PAPER / WOOD
PRIMARY PROCESSING
SECONDARY PROCESSING& MANUFACTURING
FOREST MANAGEMENT & WOOD HARVESTING
INDUSTRIAL ROUNDWOOD
Pulp BiomassSawn wood Panels
Pulpwood
FUELWOOD
Saw logs and veneer logs
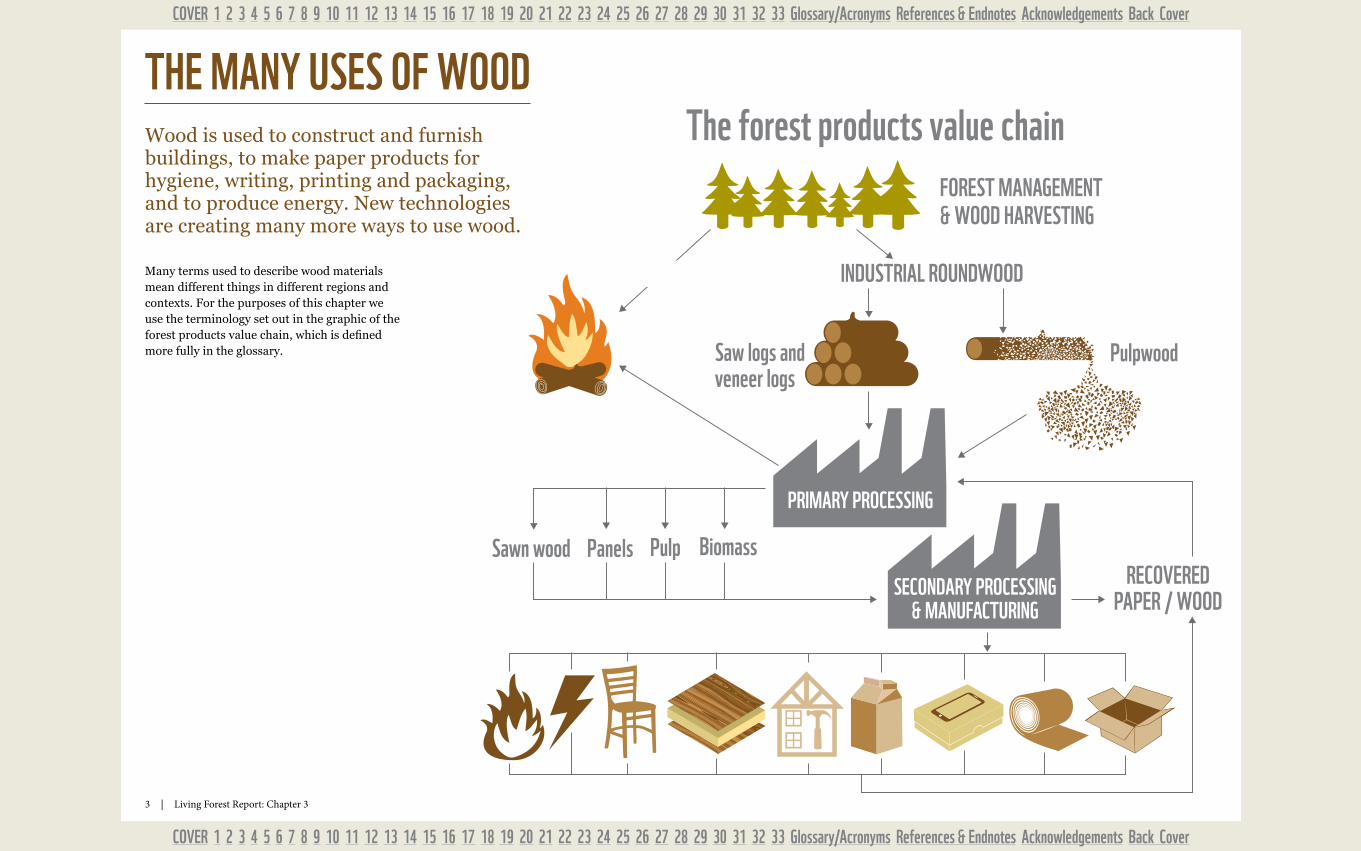
The forest products value chainTHE mANy USES OF WOODWood is used to construct and furnish buildings, to make paper products for hygiene, writing, printing and packaging, and to produce energy. New technologies are creating many more ways to use wood.
Many terms used to describe wood materials mean different things in different regions and contexts. For the purposes of this chapter we use the terminology set out in the graphic of the forest products value chain, which is defined more fully in the glossary.
4 | Living Forest Report: Chapter 3
COVER 1 2 3 4 5 6 7 8 9 10 11 12 13 14 15 16 17 18 19 20 21 22 23 24 25 26 27 28 29 30 31 32 33 Glossary/Acronyms References & Endnotes Acknowledgements Back Cover
COVER 1 2 3 4 5 6 7 8 9 10 11 12 13 14 15 16 17 18 19 20 21 22 23 24 25 26 27 28 29 30 31 32 33 Glossary/Acronyms References & Endnotes Acknowledgements Back Cover
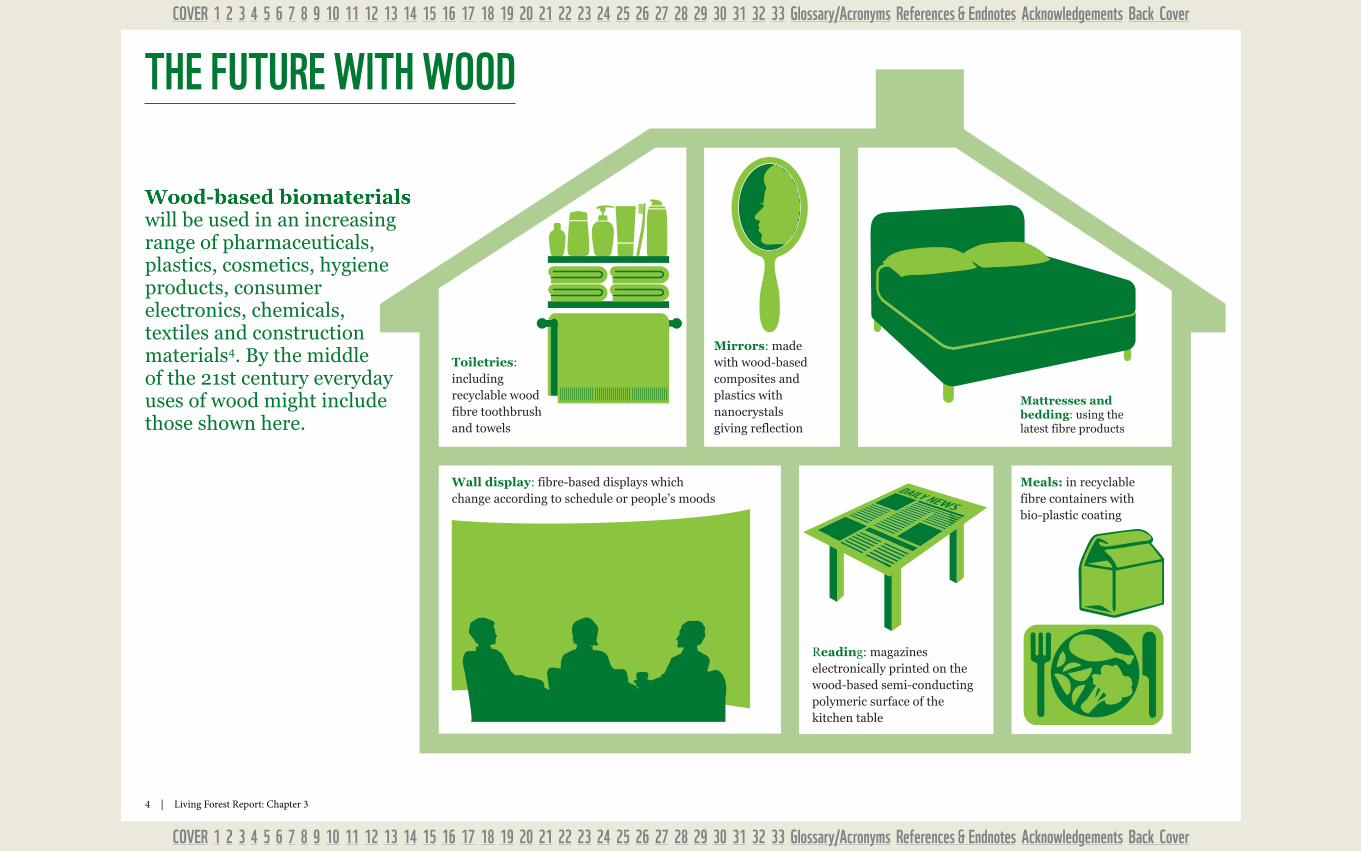
Toiletries: including recyclable wood fibre toothbrush and towels
Mattresses and bedding: using the latest fibre products
Mirrors: made with wood-based composites and plastics with nanocrystals giving reflection
Meals: in recyclable fibre containers with bio-plastic coating
Reading: magazines electronically printed on the wood-based semi-conducting polymeric surface of the kitchen table
Wall display: fibre-based displays which change according to schedule or people’s moods
Wood-based biomaterials will be used in an increasing range of pharmaceuticals, plastics, cosmetics, hygiene products, consumer electronics, chemicals, textiles and construction materials4. By the middle of the 21st century everyday uses of wood might include those shown here.
THE FUTURE WITH WOOD
5 | Living Forest Report: Chapter 3
COVER 1 2 3 4 5 6 7 8 9 10 11 12 13 14 15 16 17 18 19 20 21 22 23 24 25 26 27 28 29 30 31 32 33 Glossary/Acronyms References & Endnotes Acknowledgements Back Cover
COVER 1 2 3 4 5 6 7 8 9 10 11 12 13 14 15 16 17 18 19 20 21 22 23 24 25 26 27 28 29 30 31 32 33 Glossary/Acronyms References & Endnotes Acknowledgements Back Cover
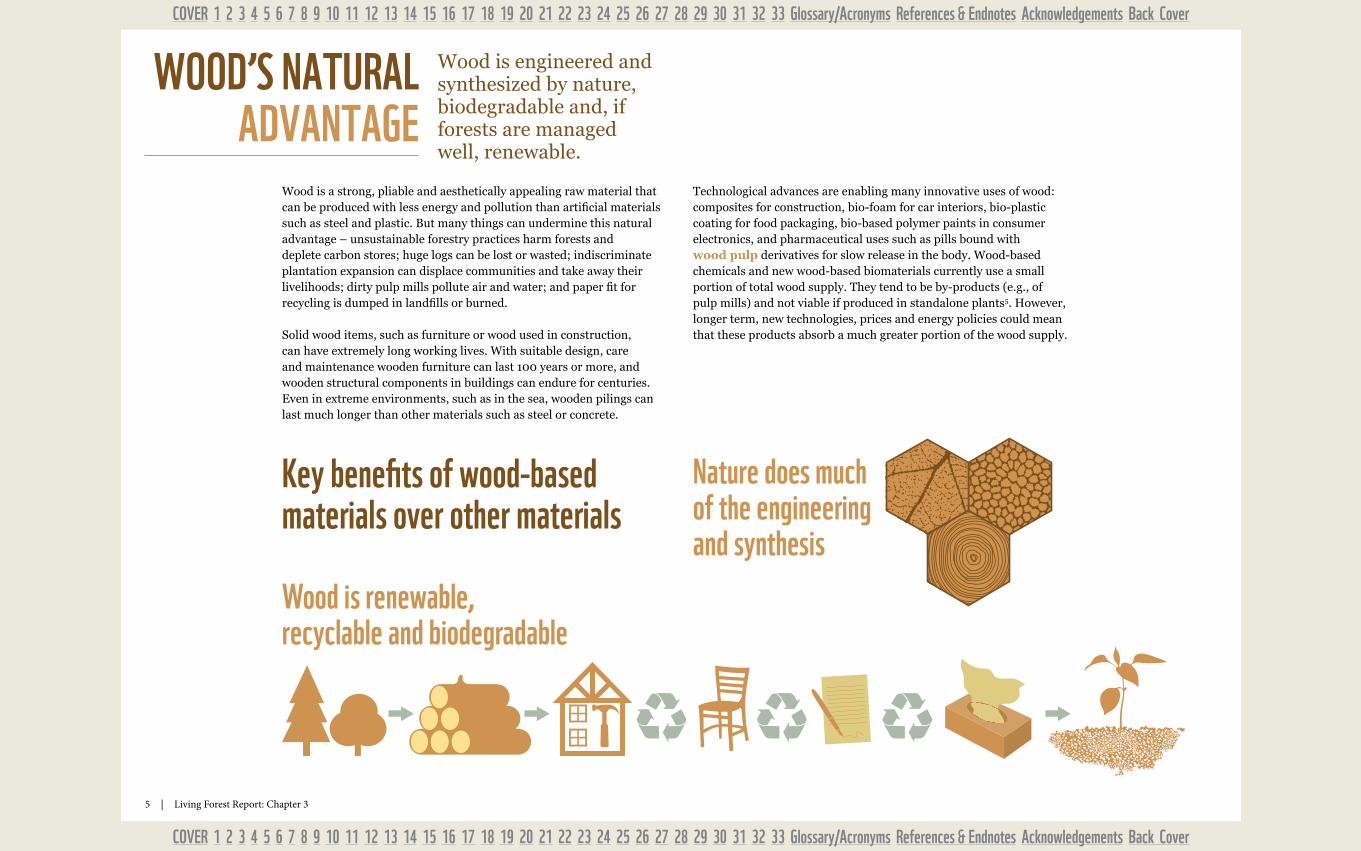
Wood is engineered and synthesized by nature, biodegradable and, if forests are managed well, renewable.
WOOD’S NATURAL ADVANTAGE
key benefits of wood-based materials over other materials
Nature does much of the engineering and synthesis
Wood is renewable, recyclable and biodegradable
Technological advances are enabling many innovative uses of wood: composites for construction, bio-foam for car interiors, bio-plastic coating for food packaging, bio-based polymer paints in consumer electronics, and pharmaceutical uses such as pills bound with wood pulp derivatives for slow release in the body. Wood-based chemicals and new wood-based biomaterials currently use a small portion of total wood supply. They tend to be by-products (e.g., of pulp mills) and not viable if produced in standalone plants5. However, longer term, new technologies, prices and energy policies could mean that these products absorb a much greater portion of the wood supply.
Wood is a strong, pliable and aesthetically appealing raw material that can be produced with less energy and pollution than artificial materials such as steel and plastic. But many things can undermine this natural advantage – unsustainable forestry practices harm forests and deplete carbon stores; huge logs can be lost or wasted; indiscriminate plantation expansion can displace communities and take away their livelihoods; dirty pulp mills pollute air and water; and paper fit for recycling is dumped in landfills or burned.
Solid wood items, such as furniture or wood used in construction, can have extremely long working lives. With suitable design, care and maintenance wooden furniture can last 100 years or more, and wooden structural components in buildings can endure for centuries. Even in extreme environments, such as in the sea, wooden pilings can last much longer than other materials such as steel or concrete.
6 | Living Forest Report: Chapter 3
COVER 1 2 3 4 5 6 7 8 9 10 11 12 13 14 15 16 17 18 19 20 21 22 23 24 25 26 27 28 29 30 31 32 33 Glossary/Acronyms References & Endnotes Acknowledgements Back Cover
COVER 1 2 3 4 5 6 7 8 9 10 11 12 13 14 15 16 17 18 19 20 21 22 23 24 25 26 27 28 29 30 31 32 33 Glossary/Acronyms References & Endnotes Acknowledgements Back Cover
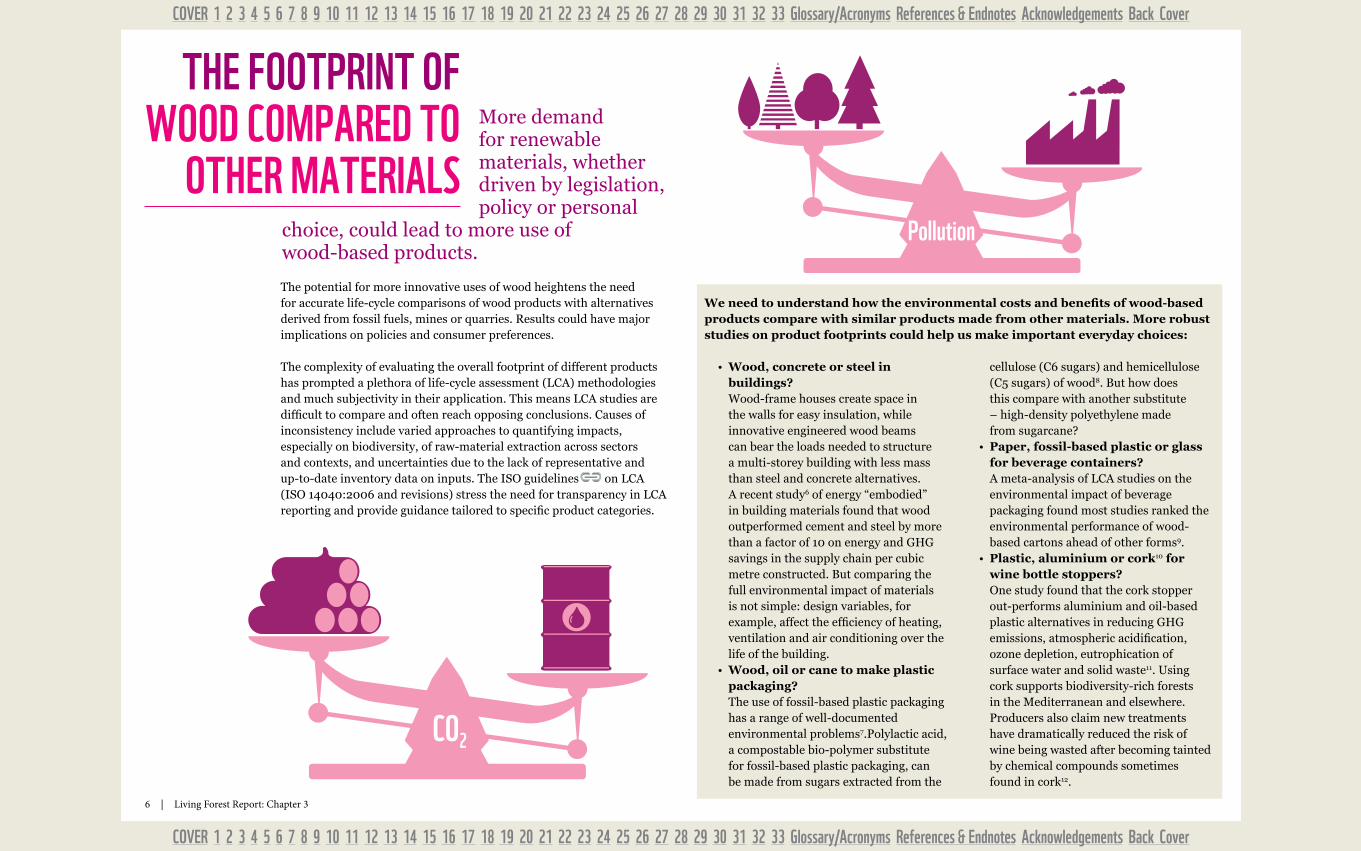
The potential for more innovative uses of wood heightens the need for accurate life-cycle comparisons of wood products with alternatives derived from fossil fuels, mines or quarries. Results could have major implications on policies and consumer preferences.
The complexity of evaluating the overall footprint of different products has prompted a plethora of life-cycle assessment (LCA) methodologies and much subjectivity in their application. This means LCA studies are difficult to compare and often reach opposing conclusions. Causes of inconsistency include varied approaches to quantifying impacts, especially on biodiversity, of raw-material extraction across sectors and contexts, and uncertainties due to the lack of representative and up-to-date inventory data on inputs. The ISO guidelines on LCA (ISO 14040:2006 and revisions) stress the need for transparency in LCA reporting and provide guidance tailored to specific product categories.
We need to understand how the environmental costs and benefits of wood-based products compare with similar products made from other materials. More robust studies on product footprints could help us make important everyday choices:
• Wood, concrete or steel in buildings? Wood-frame houses create space in the walls for easy insulation, while innovative engineered wood beams can bear the loads needed to structure a multi-storey building with less mass than steel and concrete alternatives. A recent study6 of energy “embodied” in building materials found that wood outperformed cement and steel by more than a factor of 10 on energy and GHG savings in the supply chain per cubic metre constructed. But comparing the full environmental impact of materials is not simple: design variables, for example, affect the efficiency of heating, ventilation and air conditioning over the life of the building.
• Wood, oil or cane to make plastic packaging? The use of fossil-based plastic packaging has a range of well-documented environmental problems7.Polylactic acid, a compostable bio-polymer substitute for fossil-based plastic packaging, can be made from sugars extracted from the
cellulose (C6 sugars) and hemicellulose (C5 sugars) of wood8. But how does this compare with another substitute – high-density polyethylene made from sugarcane?
• Paper, fossil-based plastic or glass for beverage containers? A meta-analysis of LCA studies on the environmental impact of beverage packaging found most studies ranked the environmental performance of wood-based cartons ahead of other forms9.
• Plastic, aluminium or cork10 for wine bottle stoppers? One study found that the cork stopper out-performs aluminium and oil-based plastic alternatives in reducing GHG emissions, atmospheric acidification, ozone depletion, eutrophication of surface water and solid waste11. Using cork supports biodiversity-rich forests in the Mediterranean and elsewhere. Producers also claim new treatments have dramatically reduced the risk of wine being wasted after becoming tainted by chemical compounds sometimes found in cork12.
CO2
Pollution
CO2
Pollution
THE FOOTPRINT OF WOOD COmPARED TO
OTHER mATERIALSMore demand for renewable materials, whether driven by legislation, policy or personal
choice, could lead to more use of wood-based products.
7 | Living Forest Report: Chapter 3
COVER 1 2 3 4 5 6 7 8 9 10 11 12 13 14 15 16 17 18 19 20 21 22 23 24 25 26 27 28 29 30 31 32 33 Glossary/Acronyms References & Endnotes Acknowledgements Back Cover
COVER 1 2 3 4 5 6 7 8 9 10 11 12 13 14 15 16 17 18 19 20 21 22 23 24 25 26 27 28 29 30 31 32 33 Glossary/Acronyms References & Endnotes Acknowledgements Back Cover
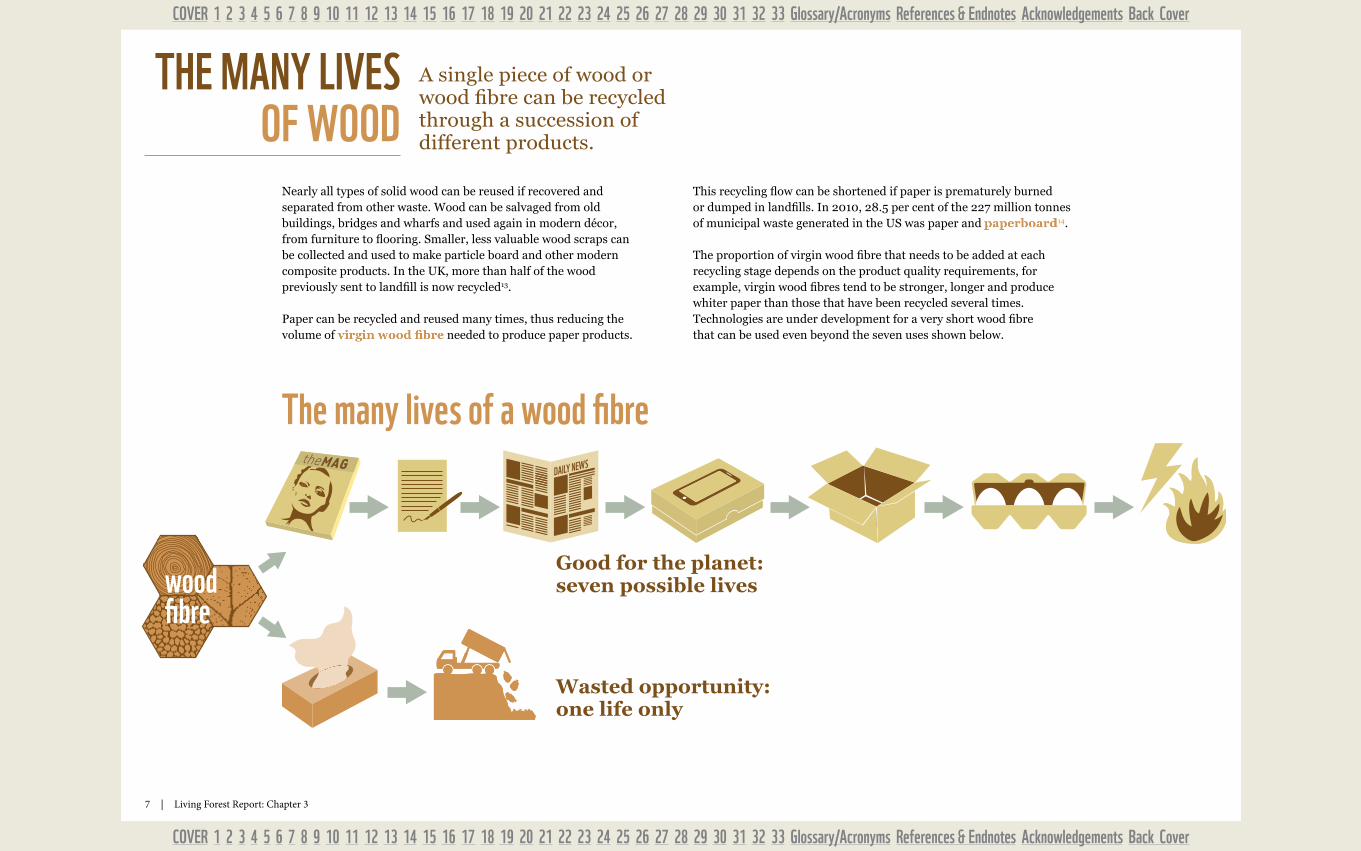
A single piece of wood or wood fibre can be recycled through a succession of different products.
THE mANy LIVES OF WOOD
Nearly all types of solid wood can be reused if recovered and separated from other waste. Wood can be salvaged from old buildings, bridges and wharfs and used again in modern décor, from furniture to flooring. Smaller, less valuable wood scraps can be collected and used to make particle board and other modern composite products. In the UK, more than half of the wood previously sent to landfill is now recycled13.
Paper can be recycled and reused many times, thus reducing the volume of virgin wood fibre needed to produce paper products.
This recycling flow can be shortened if paper is prematurely burned or dumped in landfills. In 2010, 28.5 per cent of the 227 million tonnes of municipal waste generated in the US was paper and paperboard14.
The proportion of virgin wood fibre that needs to be added at each recycling stage depends on the product quality requirements, for example, virgin wood fibres tend to be stronger, longer and produce whiter paper than those that have been recycled several times. Technologies are under development for a very short wood fibre that can be used even beyond the seven uses shown below.
DAILY NEWS
Good for the planet: seven possible lives
Wasted opportunity: one life only
The many lives of a wood fibre
wood fibre
8 | Living Forest Report: Chapter 3
COVER 1 2 3 4 5 6 7 8 9 10 11 12 13 14 15 16 17 18 19 20 21 22 23 24 25 26 27 28 29 30 31 32 33 Glossary/Acronyms References & Endnotes Acknowledgements Back Cover
COVER 1 2 3 4 5 6 7 8 9 10 11 12 13 14 15 16 17 18 19 20 21 22 23 24 25 26 27 28 29 30 31 32 33 Glossary/Acronyms References & Endnotes Acknowledgements Back Cover
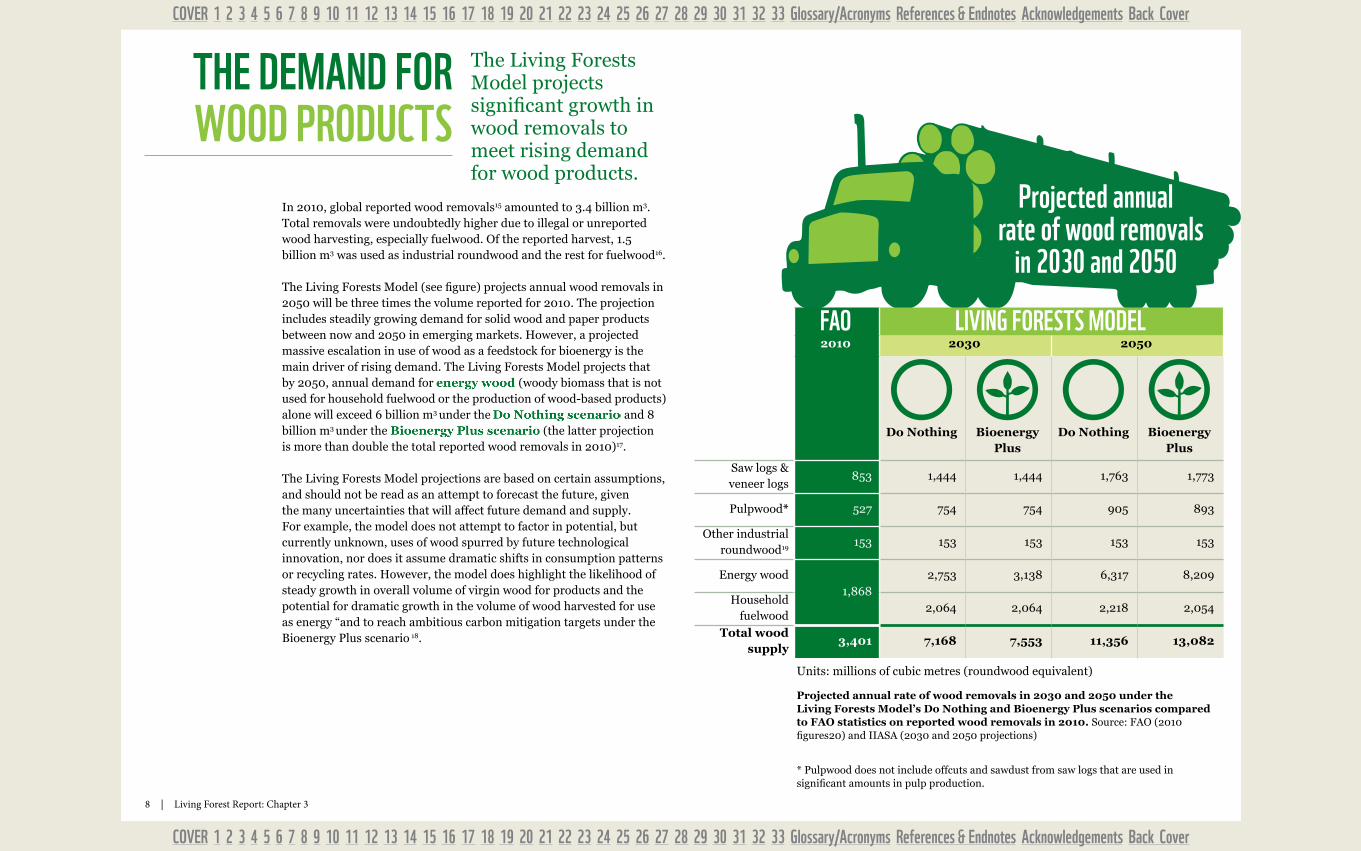
The Living Forests Model projects significant growth in wood removals to meet rising demand for wood products.
In 2010, global reported wood removals15 amounted to 3.4 billion m3. Total removals were undoubtedly higher due to illegal or unreported wood harvesting, especially fuelwood. Of the reported harvest, 1.5 billion m3 was used as industrial roundwood and the rest for fuelwood16.
The Living Forests Model (see figure) projects annual wood removals in 2050 will be three times the volume reported for 2010. The projection includes steadily growing demand for solid wood and paper products between now and 2050 in emerging markets. However, a projected massive escalation in use of wood as a feedstock for bioenergy is the main driver of rising demand. The Living Forests Model projects that by 2050, annual demand for energy wood (woody biomass that is not used for household fuelwood or the production of wood-based products) alone will exceed 6 billion m3 under the Do Nothing scenario and 8 billion m3 under the Bioenergy Plus scenario (the latter projection is more than double the total reported wood removals in 2010)17.
The Living Forests Model projections are based on certain assumptions, and should not be read as an attempt to forecast the future, given the many uncertainties that will affect future demand and supply. For example, the model does not attempt to factor in potential, but currently unknown, uses of wood spurred by future technological innovation, nor does it assume dramatic shifts in consumption patterns or recycling rates. However, the model does highlight the likelihood of steady growth in overall volume of virgin wood for products and the potential for dramatic growth in the volume of wood harvested for use as energy “and to reach ambitious carbon mitigation targets under the Bioenergy Plus scenario 18.
FAO LIVING FORESTS mODEL2010 2030 2050
Do Nothing Bioenergy Plus
Do Nothing Bioenergy Plus
Saw logs & veneer logs
853 1,444 1,444 1,763 1,773
Pulpwood* 527 754 754 905 893
Other industrial roundwood19
153 153 153 153 153
Energy wood1,868
2,753 3,138 6,317 8,209
Household fuelwood
2,064 2,064 2,218 2,054
Total wood supply
3,401 7,168 7,553 11,356 13,082
Units: millions of cubic metres (roundwood equivalent)
Projected annual rate of wood removals in 2030 and 2050 under the Living Forests Model’s Do Nothing and Bioenergy Plus scenarios compared to FAO statistics on reported wood removals in 2010. Source: FAO (2010 figures20) and IIASA (2030 and 2050 projections)
* Pulpwood does not include offcuts and sawdust from saw logs that are used in significant amounts in pulp production.
THE DEmAND FOR WOOD PRODUCTS
Projected annual rate of wood removals
in 2030 and 2050
9 | Living Forest Report: Chapter 3
COVER 1 2 3 4 5 6 7 8 9 10 11 12 13 14 15 16 17 18 19 20 21 22 23 24 25 26 27 28 29 30 31 32 33 Glossary/Acronyms References & Endnotes Acknowledgements Back Cover
COVER 1 2 3 4 5 6 7 8 9 10 11 12 13 14 15 16 17 18 19 20 21 22 23 24 25 26 27 28 29 30 31 32 33 Glossary/Acronyms References & Endnotes Acknowledgements Back Cover
De�nition of regions for Appendix 1 (softwood sawn wood trade)
Western Europe: Finland, Norway, Sweden, Austria, Belgium, Denmark, France, Germany, Greece, Ireland, Italy, Netherlands, Portugal, Spain, Switzer-land, UK
Eastern Europe: Russia, Ukraine, Belarus, Moldova, Azerbaijan, Kazakhstan, Uzbekistan, Other CIS, Baltic countries, Bulgaria, Czech Republic, Slovakia, Hungary, Poland, Romania, Slovenia, Rest of East-ern Europe
Oceania: Australia, New Zealand, Rest of Oceania
Rest of Asia: China, India, Indonesia, Rep. of Korea, Malaysia, Pakistan, Philippines, Singapore, Taiwan, Thailand, Vietnam, Rest of AsiaAsia: Japan + Rest of Asia (see above)
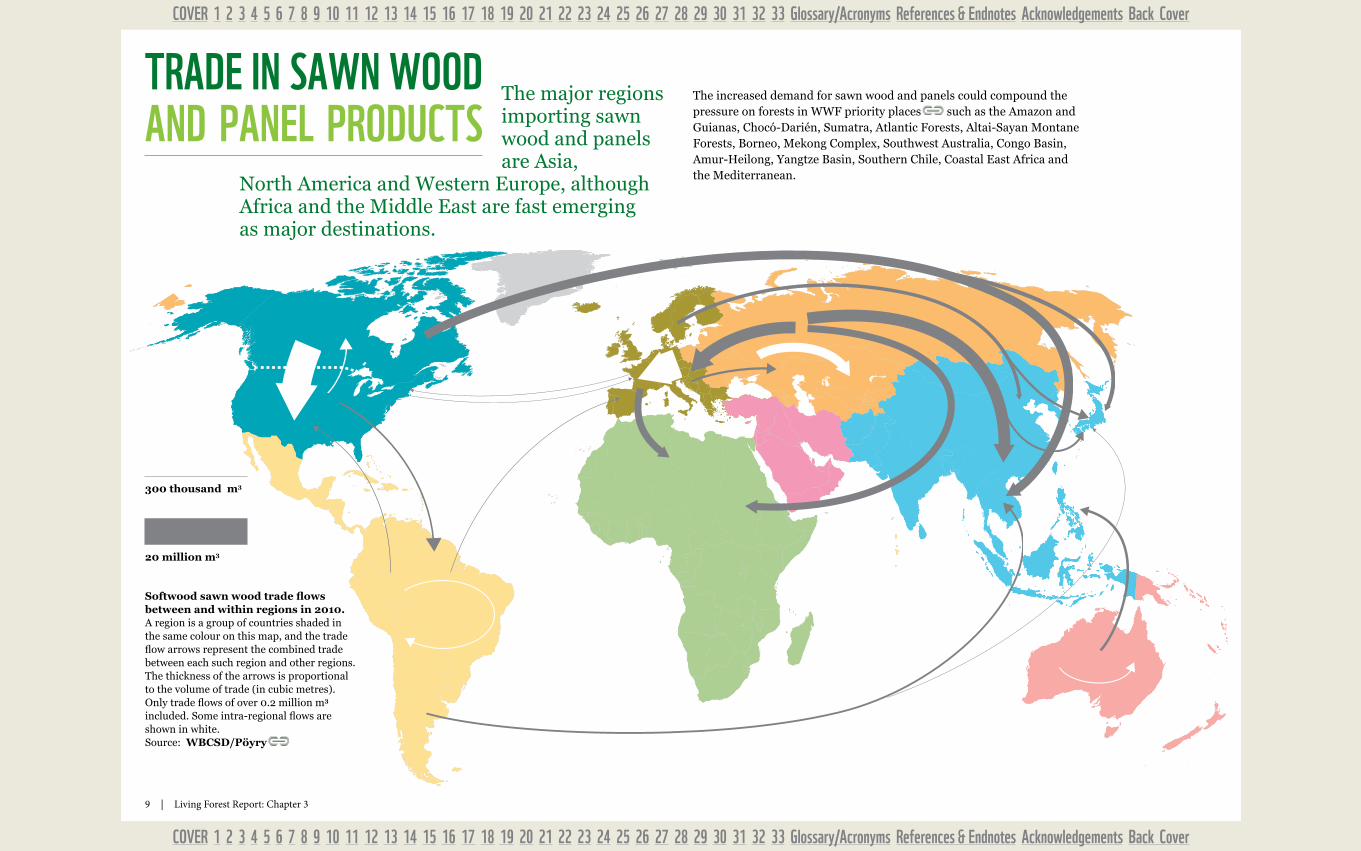
The increased demand for sawn wood and panels could compound the pressure on forests in WWF priority places such as the Amazon and Guianas, Chocó-Darién, Sumatra, Atlantic Forests, Altai-Sayan Montane Forests, Borneo, Mekong Complex, Southwest Australia, Congo Basin, Amur-Heilong, Yangtze Basin, Southern Chile, Coastal East Africa and the Mediterranean.
TRADE IN SAWN WOOD AND PANEL PRODUCTS
Softwood sawn wood trade flows between and within regions in 2010.A region is a group of countries shaded in the same colour on this map, and the trade flow arrows represent the combined trade between each such region and other regions. The thickness of the arrows is proportional to the volume of trade (in cubic metres). Only trade flows of over 0.2 million m3 included. Some intra-regional flows are shown in white.Source: WBCSD/Pöyry
The major regions importing sawn wood and panels are Asia,
North America and Western Europe, although Africa and the Middle East are fast emerging as major destinations.
20 million m3
300 thousand m3
10 | Living Forest Report: Chapter 3
COVER 1 2 3 4 5 6 7 8 9 10 11 12 13 14 15 16 17 18 19 20 21 22 23 24 25 26 27 28 29 30 31 32 33 Glossary/Acronyms References & Endnotes Acknowledgements Back Cover
COVER 1 2 3 4 5 6 7 8 9 10 11 12 13 14 15 16 17 18 19 20 21 22 23 24 25 26 27 28 29 30 31 32 33 Glossary/Acronyms References & Endnotes Acknowledgements Back Cover
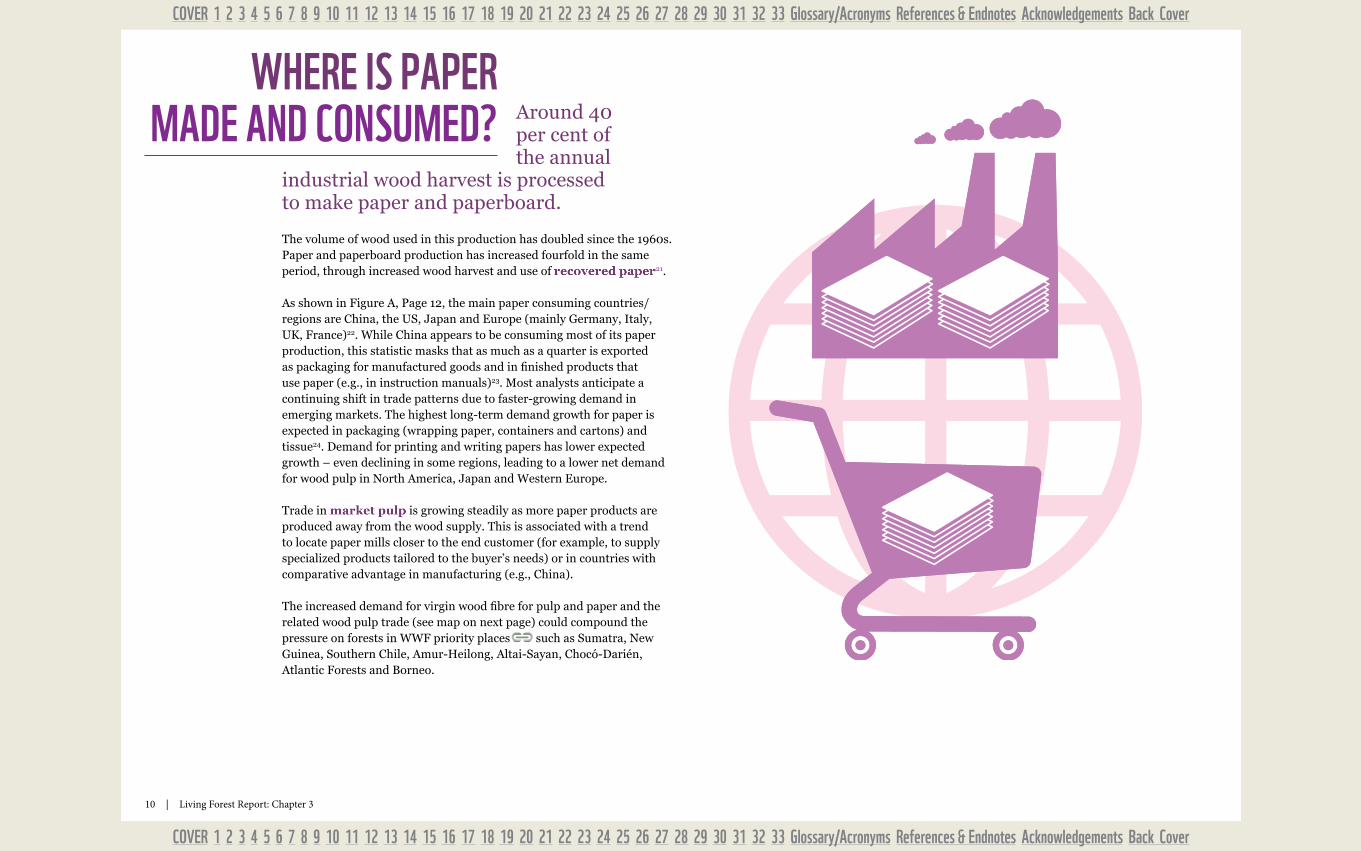
The volume of wood used in this production has doubled since the 1960s. Paper and paperboard production has increased fourfold in the same period, through increased wood harvest and use of recovered paper21.
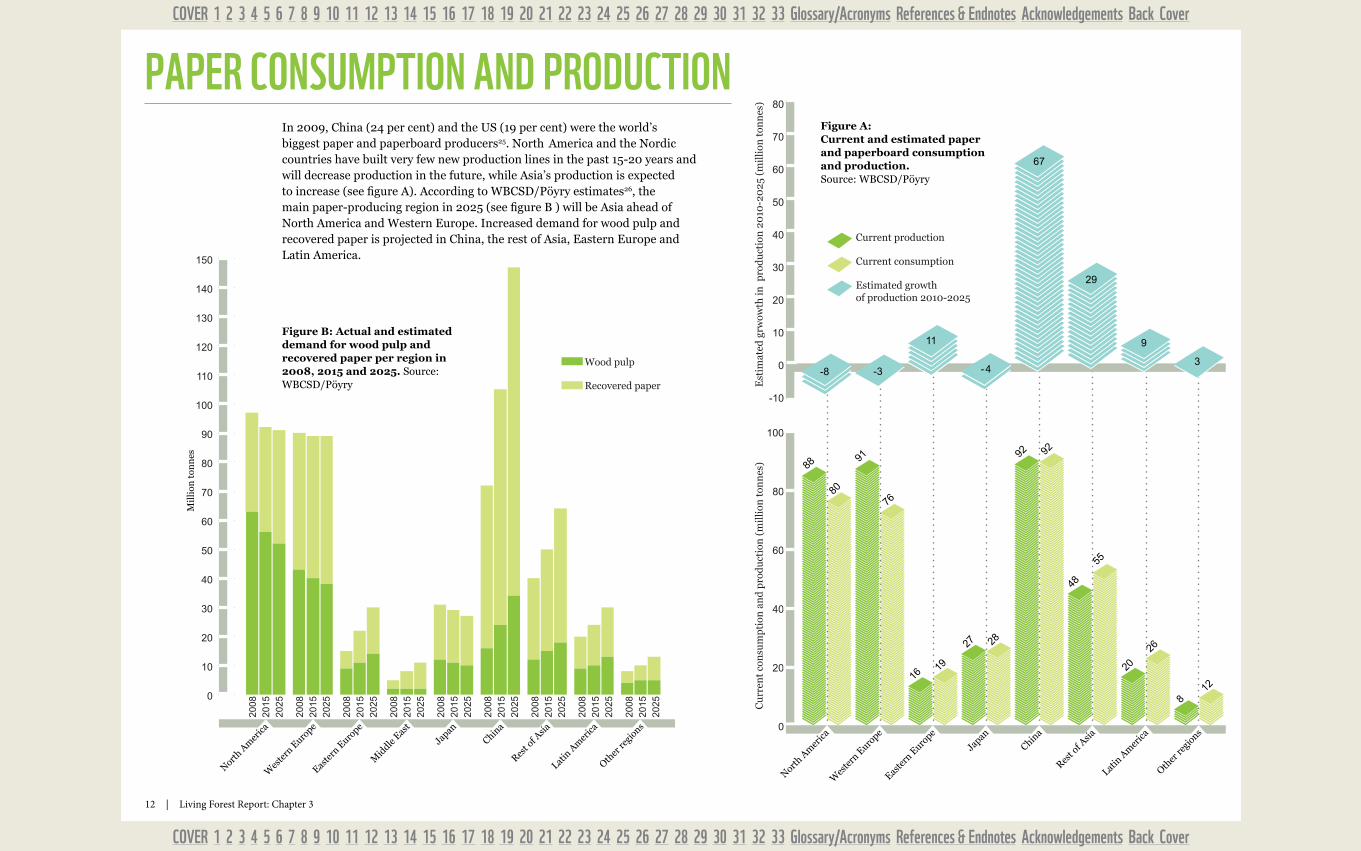
As shown in Figure A, Page 12, the main paper consuming countries/regions are China, the US, Japan and Europe (mainly Germany, Italy, UK, France)22. While China appears to be consuming most of its paper production, this statistic masks that as much as a quarter is exported as packaging for manufactured goods and in finished products that use paper (e.g., in instruction manuals)23. Most analysts anticipate a continuing shift in trade patterns due to faster-growing demand in emerging markets. The highest long-term demand growth for paper is expected in packaging (wrapping paper, containers and cartons) and tissue24. Demand for printing and writing papers has lower expected growth – even declining in some regions, leading to a lower net demand for wood pulp in North America, Japan and Western Europe.
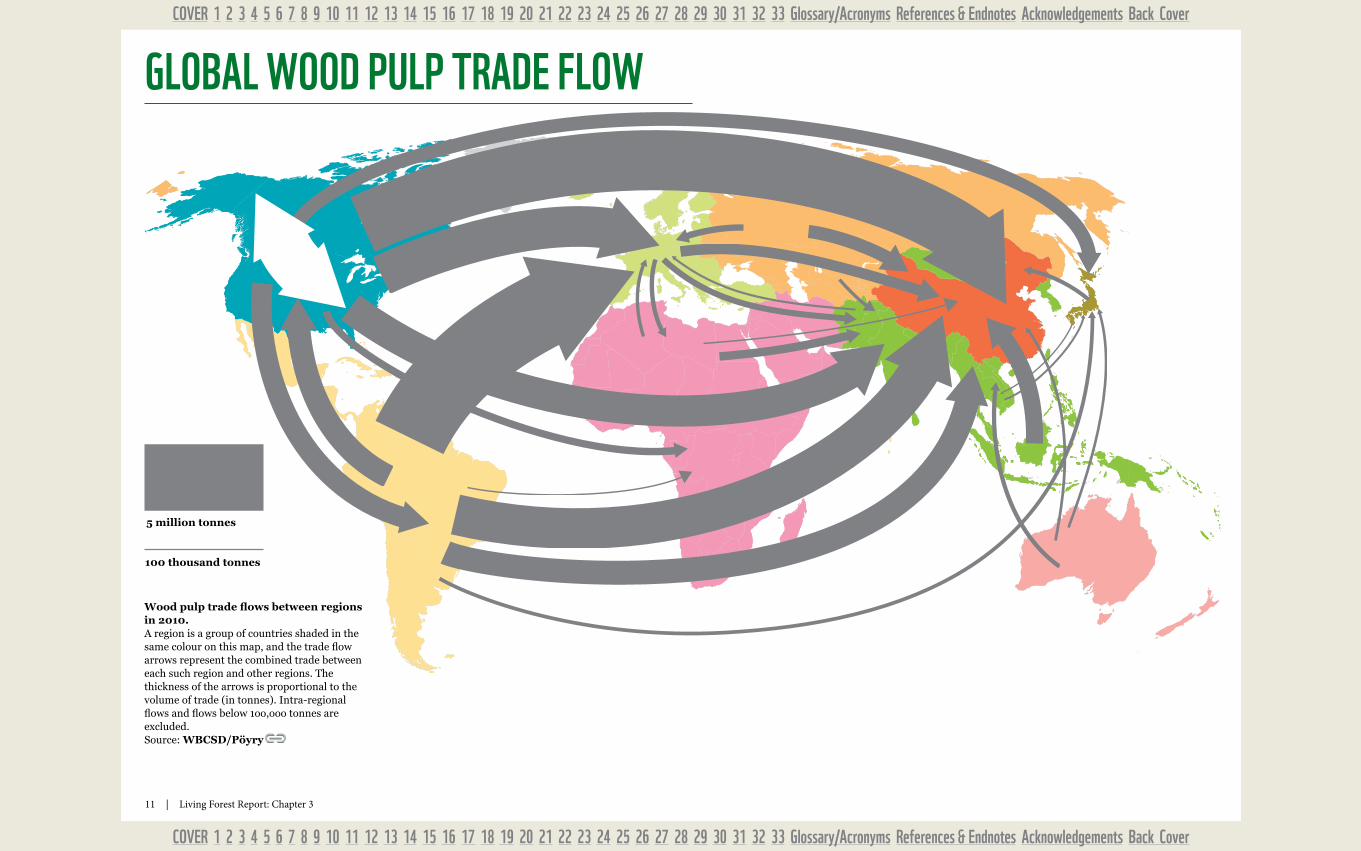
Trade in market pulp is growing steadily as more paper products are produced away from the wood supply. This is associated with a trend to locate paper mills closer to the end customer (for example, to supply specialized products tailored to the buyer’s needs) or in countries with comparative advantage in manufacturing (e.g., China).
The increased demand for virgin wood fibre for pulp and paper and the related wood pulp trade (see map on next page) could compound the pressure on forests in WWF priority places such as Sumatra, New Guinea, Southern Chile, Amur-Heilong, Altai-Sayan, Chocó-Darién, Atlantic Forests and Borneo.
WHERE IS PAPER mADE AND CONSUmED? Around 40
per cent of the annual
industrial wood harvest is processed to make paper and paperboard.
11 | Living Forest Report: Chapter 3
COVER 1 2 3 4 5 6 7 8 9 10 11 12 13 14 15 16 17 18 19 20 21 22 23 24 25 26 27 28 29 30 31 32 33 Glossary/Acronyms References & Endnotes Acknowledgements Back Cover
COVER 1 2 3 4 5 6 7 8 9 10 11 12 13 14 15 16 17 18 19 20 21 22 23 24 25 26 27 28 29 30 31 32 33 Glossary/Acronyms References & Endnotes Acknowledgements Back Cover
Wood pulp trade flows between regions in 2010.A region is a group of countries shaded in the same colour on this map, and the trade flow arrows represent the combined trade between each such region and other regions. The thickness of the arrows is proportional to the volume of trade (in tonnes). Intra-regional flows and flows below 1oo,ooo tonnes are excluded. Source: WBCSD/Pöyry
GLObAL WOOD PULP TRADE FLOW
5 million tonnes
100 thousand tonnes
12 | Living Forest Report: Chapter 3
COVER 1 2 3 4 5 6 7 8 9 10 11 12 13 14 15 16 17 18 19 20 21 22 23 24 25 26 27 28 29 30 31 32 33 Glossary/Acronyms References & Endnotes Acknowledgements Back Cover
COVER 1 2 3 4 5 6 7 8 9 10 11 12 13 14 15 16 17 18 19 20 21 22 23 24 25 26 27 28 29 30 31 32 33 Glossary/Acronyms References & Endnotes Acknowledgements Back Cover
In 2009, China (24 per cent) and the US (19 per cent) were the world’s biggest paper and paperboard producers25. North America and the Nordic countries have built very few new production lines in the past 15-20 years and will decrease production in the future, while Asia’s production is expected to increase (see figure A). According to WBCSD/Pöyry estimates26, the main paper-producing region in 2025 (see figure B ) will be Asia ahead of North America and Western Europe. Increased demand for wood pulp and recovered paper is projected in China, the rest of Asia, Eastern Europe and Latin America.
Other
regi
ons
Latin
Am
erica
Rest o
f Asia
China
Japan
Easte
rn E
urope
Mid
dle Eas
t
Wes
tern
Euro
pe
North A
mer
ica
0
10
20
30
40
50
60
70
80
90
100
110
120
130
140
15020
0820
1520
25
2008
2015
2025
2008
2015
2025
2008
2015
2025
2008
2015
2025
2008
2015
2025
2008
2015
2025
2008
2015
2025
2008
2015
2025
Wood pulp
Recovered paper
Mil
lion
ton
nes
Figure B: Actual and estimated demand for wood pulp and recovered paper per region in 2008, 2015 and 2025. Source: WBCSD/Pöyry
PAPER CONSUmPTION AND PRODUCTION
-10
0
10
20
30
40
50
60
70
80
Cu
rren
t co
nsu
mp
tion
an
d p
rod
uct
ion
(m
illi
on t
onn
es)
Est
imat
ed g
rwow
th in
pro
du
ctio
n 2
010
-20
25 (
mil
lion
ton
nes
)Oth
er re
gions
Latin
Am
erica
Rest o
f Asia
China
Japan
Easte
rn E
urope
Wes
tern
Euro
pe
North A
mer
ica0
20
40
60
80
100
-8 -3
11
-4
67
29
9
3
88
80
91
76
1619
27 28
92 92
48
55
20
26
812
Current production
Current consumption
Estimated growth of production 2010-2025
Figure A: Current and estimated paper and paperboard consumption and production. Source: WBCSD/Pöyry
13 | Living Forest Report: Chapter 3
COVER 1 2 3 4 5 6 7 8 9 10 11 12 13 14 15 16 17 18 19 20 21 22 23 24 25 26 27 28 29 30 31 32 33 Glossary/Acronyms References & Endnotes Acknowledgements Back Cover
COVER 1 2 3 4 5 6 7 8 9 10 11 12 13 14 15 16 17 18 19 20 21 22 23 24 25 26 27 28 29 30 31 32 33 Glossary/Acronyms References & Endnotes Acknowledgements Back Cover
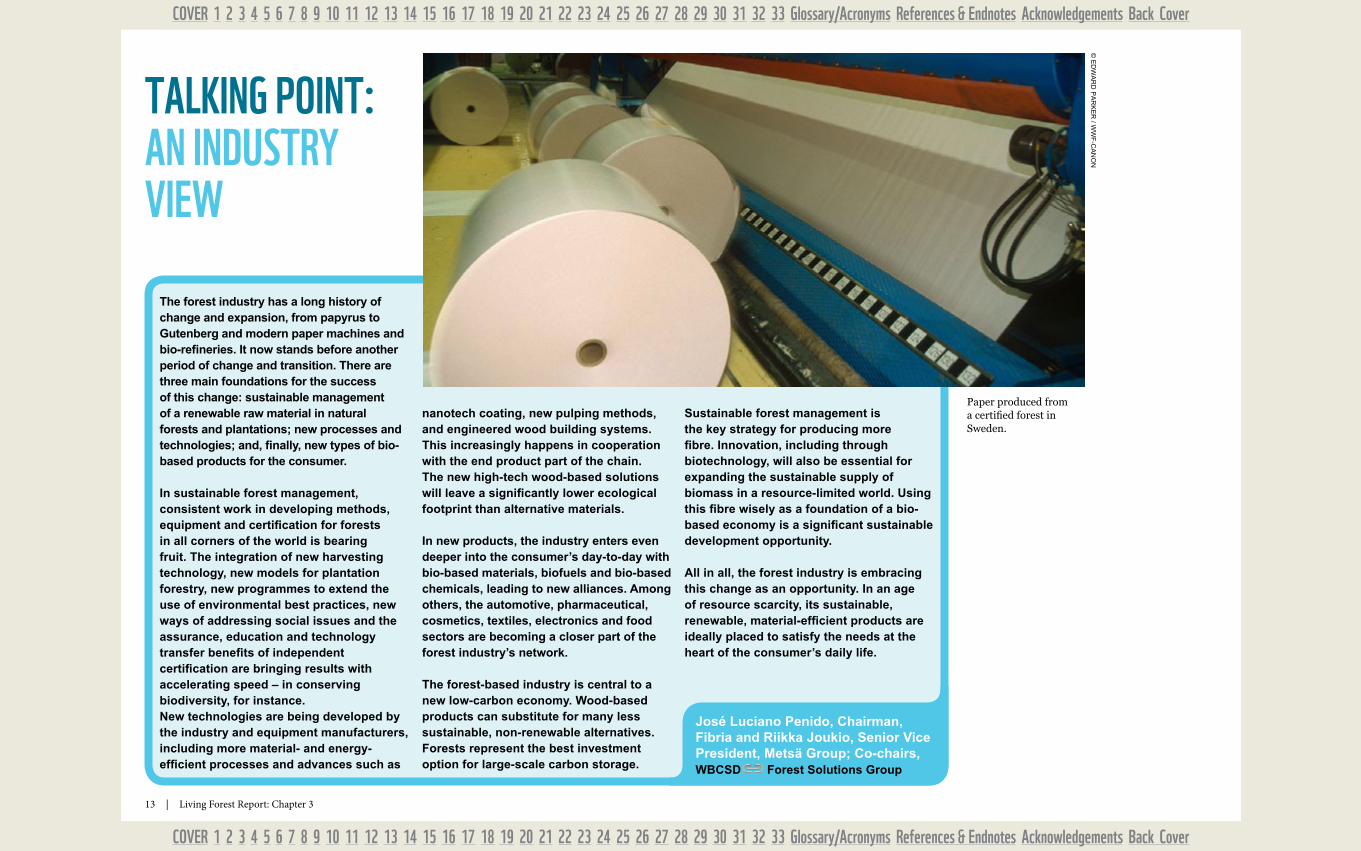
The forest industry has a long history of change and expansion, from papyrus to Gutenberg and modern paper machines and bio-refineries. It now stands before another period of change and transition. There are three main foundations for the success of this change: sustainable management of a renewable raw material in natural forests and plantations; new processes and technologies; and, finally, new types of bio-based products for the consumer.
In sustainable forest management, consistent work in developing methods, equipment and certification for forests in all corners of the world is bearing fruit. The integration of new harvesting technology, new models for plantation forestry, new programmes to extend the use of environmental best practices, new ways of addressing social issues and the assurance, education and technology transfer benefits of independent certification are bringing results with accelerating speed – in conserving biodiversity, for instance.New technologies are being developed by the industry and equipment manufacturers, including more material- and energy-efficient processes and advances such as
nanotech coating, new pulping methods, and engineered wood building systems. This increasingly happens in cooperation with the end product part of the chain. The new high-tech wood-based solutions will leave a significantly lower ecological footprint than alternative materials.
In new products, the industry enters even deeper into the consumer’s day-to-day with bio-based materials, biofuels and bio-based chemicals, leading to new alliances. Among others, the automotive, pharmaceutical, cosmetics, textiles, electronics and food sectors are becoming a closer part of the forest industry’s network.
The forest-based industry is central to a new low-carbon economy. Wood-based products can substitute for many less sustainable, non-renewable alternatives. Forests represent the best investment option for large-scale carbon storage.
Sustainable forest management is the key strategy for producing more fibre. Innovation, including through biotechnology, will also be essential for expanding the sustainable supply of biomass in a resource-limited world. Using this fibre wisely as a foundation of a bio-based economy is a significant sustainable development opportunity.
All in all, the forest industry is embracing this change as an opportunity. In an age of resource scarcity, its sustainable, renewable, material-efficient products are ideally placed to satisfy the needs at the heart of the consumer’s daily life.
José Luciano Penido, Chairman, Fibria and Riikka Joukio, Senior Vice President, Metsä Group; Co-chairs, WBCSD Forest Solutions Group
TALkING POINT: AN INDUSTRy VIEW
Paper produced from a certified forest in Sweden.
© E
dw
ar
d P
ar
kE
r / w
wF
-Ca
no
n
14 | Living Forest Report: Chapter 3
COVER 1 2 3 4 5 6 7 8 9 10 11 12 13 14 15 16 17 18 19 20 21 22 23 24 25 26 27 28 29 30 31 32 33 Glossary/Acronyms References & Endnotes Acknowledgements Back Cover
COVER 1 2 3 4 5 6 7 8 9 10 11 12 13 14 15 16 17 18 19 20 21 22 23 24 25 26 27 28 29 30 31 32 33 Glossary/Acronyms References & Endnotes Acknowledgements Back Cover
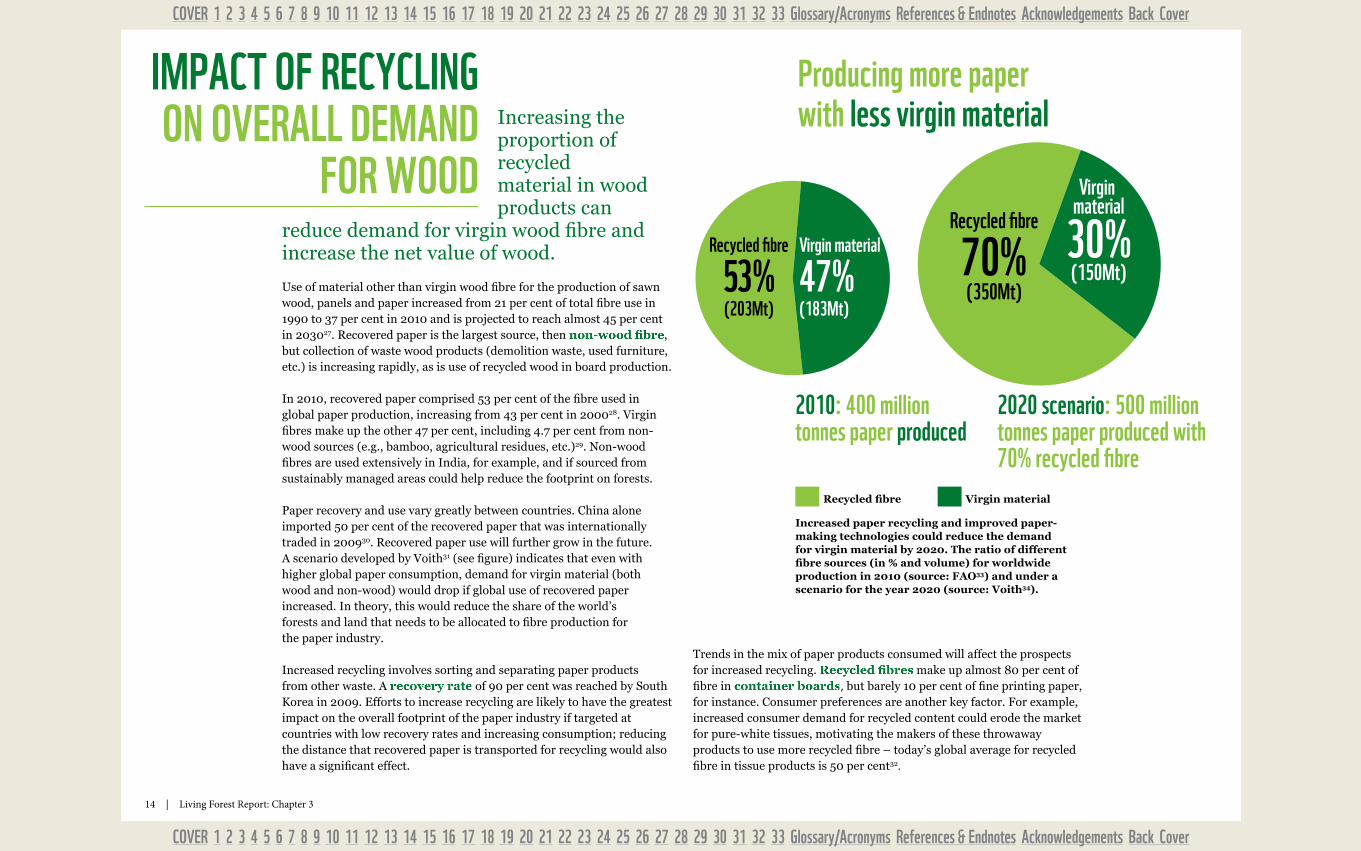
2020 scenario: 500 million tonnes paper produced with 70% recycled fibre
Increasing the proportion of recycled material in wood products can
reduce demand for virgin wood fibre and increase the net value of wood.
Trends in the mix of paper products consumed will affect the prospects for increased recycling. Recycled fibres make up almost 80 per cent of fibre in container boards, but barely 10 per cent of fine printing paper, for instance. Consumer preferences are another key factor. For example, increased consumer demand for recycled content could erode the market for pure-white tissues, motivating the makers of these throwaway products to use more recycled fibre – today’s global average for recycled fibre in tissue products is 50 per cent32.
Increased paper recycling and improved paper-making technologies could reduce the demand for virgin material by 2020. The ratio of different fibre sources (in % and volume) for worldwide production in 2010 (source: FAO33) and under a scenario for the year 2020 (source: Voith34).
ImPACT OF RECyCLING ON OVERALL DEmAND
FOR WOOD
Use of material other than virgin wood fibre for the production of sawn wood, panels and paper increased from 21 per cent of total fibre use in 1990 to 37 per cent in 2010 and is projected to reach almost 45 per cent in 203027. Recovered paper is the largest source, then non-wood fibre, but collection of waste wood products (demolition waste, used furniture, etc.) is increasing rapidly, as is use of recycled wood in board production.
In 2010, recovered paper comprised 53 per cent of the fibre used in global paper production, increasing from 43 per cent in 200028. Virgin fibres make up the other 47 per cent, including 4.7 per cent from non-wood sources (e.g., bamboo, agricultural residues, etc.)29. Non-wood fibres are used extensively in India, for example, and if sourced from sustainably managed areas could help reduce the footprint on forests.
Paper recovery and use vary greatly between countries. China alone imported 50 per cent of the recovered paper that was internationally traded in 200930. Recovered paper use will further grow in the future. A scenario developed by Voith31 (see figure) indicates that even with higher global paper consumption, demand for virgin material (both wood and non-wood) would drop if global use of recovered paper increased. In theory, this would reduce the share of the world’s forests and land that needs to be allocated to fibre production for the paper industry.
Increased recycling involves sorting and separating paper products from other waste. A recovery rate of 90 per cent was reached by South Korea in 2009. Efforts to increase recycling are likely to have the greatest impact on the overall footprint of the paper industry if targeted at countries with low recovery rates and increasing consumption; reducing the distance that recovered paper is transported for recycling would also have a significant effect.
Virgin material
47%(183Mt)
Recycled fibre
53%(203Mt)
Virgin material
30%(150Mt)
Recycled fibre
70%(350Mt)
Virgin material
47%(183Mt)
Recycled fibre
53%(203Mt)
Virgin material
30%(150Mt)
Recycled fibre
70%(350Mt)
2010: 400 million tonnes paper produced
Producing more paper with less virgin material
Recycled fibre Virgin material
15 | Living Forest Report: Chapter 3
COVER 1 2 3 4 5 6 7 8 9 10 11 12 13 14 15 16 17 18 19 20 21 22 23 24 25 26 27 28 29 30 31 32 33 Glossary/Acronyms References & Endnotes Acknowledgements Back Cover
COVER 1 2 3 4 5 6 7 8 9 10 11 12 13 14 15 16 17 18 19 20 21 22 23 24 25 26 27 28 29 30 31 32 33 Glossary/Acronyms References & Endnotes Acknowledgements Back Cover
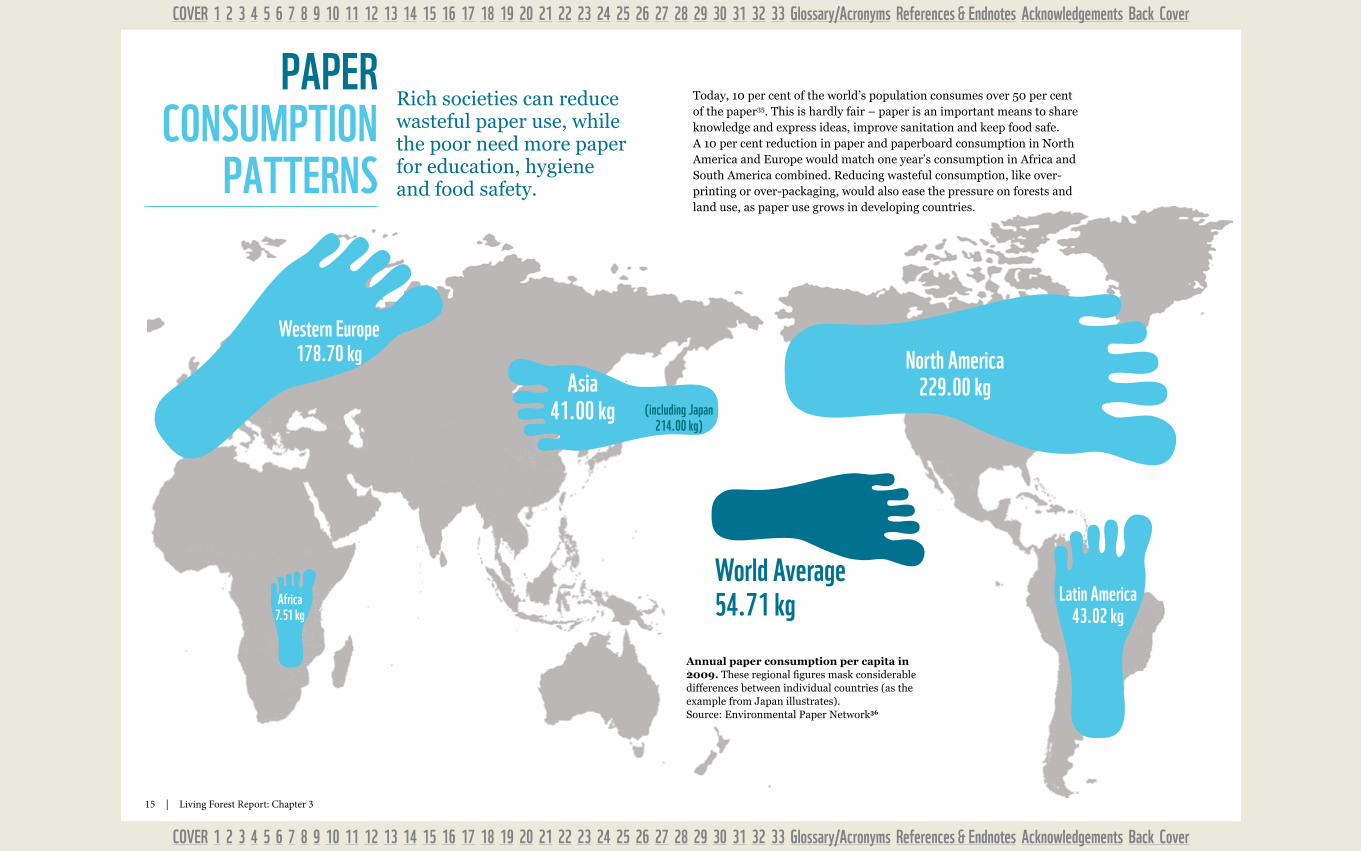
North America229.00 kg
World Average54.71 kg Latin America
43.02 kg
Asia41.00 kg (including Japan
214.00 kg)
Africa7.51 kg
Rich societies can reduce wasteful paper use, while the poor need more paper for education, hygiene and food safety.
Annual paper consumption per capita in 2009. These regional figures mask considerable differences between individual countries (as the example from Japan illustrates). Source: Environmental Paper Network36
PAPER CONSUmPTION
PATTERNS
Today, 10 per cent of the world’s population consumes over 50 per cent of the paper35. This is hardly fair – paper is an important means to share knowledge and express ideas, improve sanitation and keep food safe. A 10 per cent reduction in paper and paperboard consumption in North America and Europe would match one year’s consumption in Africa and South America combined. Reducing wasteful consumption, like over-printing or over-packaging, would also ease the pressure on forests and land use, as paper use grows in developing countries.
Western Europe178.70 kg
16 | Living Forest Report: Chapter 3
COVER 1 2 3 4 5 6 7 8 9 10 11 12 13 14 15 16 17 18 19 20 21 22 23 24 25 26 27 28 29 30 31 32 33 Glossary/Acronyms References & Endnotes Acknowledgements Back Cover
COVER 1 2 3 4 5 6 7 8 9 10 11 12 13 14 15 16 17 18 19 20 21 22 23 24 25 26 27 28 29 30 31 32 33 Glossary/Acronyms References & Endnotes Acknowledgements Back Cover
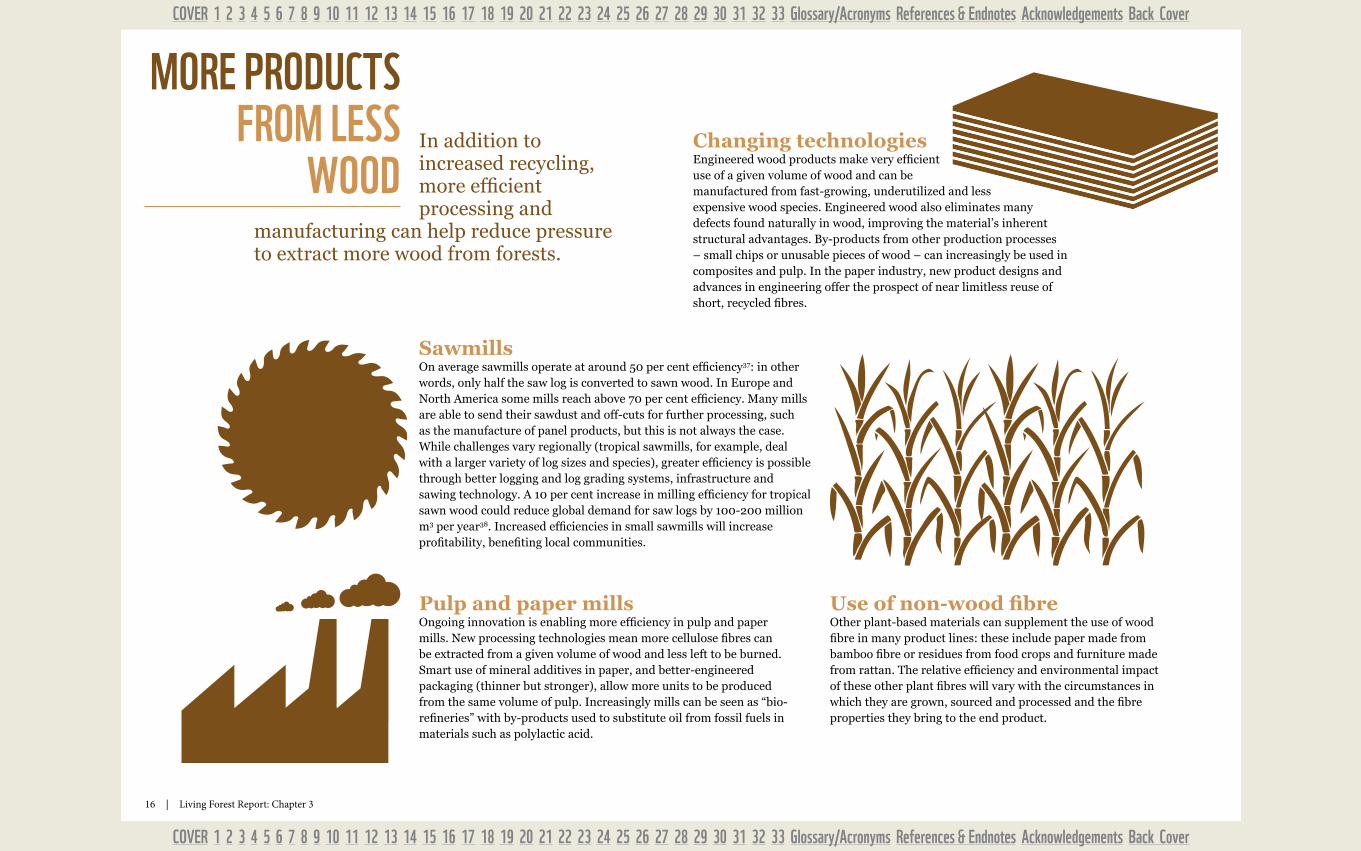
Sawmills On average sawmills operate at around 50 per cent efficiency37: in other words, only half the saw log is converted to sawn wood. In Europe and North America some mills reach above 70 per cent efficiency. Many mills are able to send their sawdust and off-cuts for further processing, such as the manufacture of panel products, but this is not always the case. While challenges vary regionally (tropical sawmills, for example, deal with a larger variety of log sizes and species), greater efficiency is possible through better logging and log grading systems, infrastructure and sawing technology. A 10 per cent increase in milling efficiency for tropical sawn wood could reduce global demand for saw logs by 100-200 million m3 per year38. Increased efficiencies in small sawmills will increase profitability, benefiting local communities.
Pulp and paper mills Ongoing innovation is enabling more efficiency in pulp and paper mills. New processing technologies mean more cellulose fibres can be extracted from a given volume of wood and less left to be burned. Smart use of mineral additives in paper, and better-engineered packaging (thinner but stronger), allow more units to be produced from the same volume of pulp. Increasingly mills can be seen as “bio-refineries” with by-products used to substitute oil from fossil fuels in materials such as polylactic acid.
Changing technologies Engineered wood products make very efficient use of a given volume of wood and can be manufactured from fast-growing, underutilized and less expensive wood species. Engineered wood also eliminates many defects found naturally in wood, improving the material’s inherent structural advantages. By-products from other production processes – small chips or unusable pieces of wood – can increasingly be used in composites and pulp. In the paper industry, new product designs and advances in engineering offer the prospect of near limitless reuse of short, recycled fibres.
mORE PRODUCTS FROm LESS
WOODIn addition to increased recycling, more efficient processing and
manufacturing can help reduce pressure to extract more wood from forests.
Use of non-wood fibre Other plant-based materials can supplement the use of wood fibre in many product lines: these include paper made from bamboo fibre or residues from food crops and furniture made from rattan. The relative efficiency and environmental impact of these other plant fibres will vary with the circumstances in which they are grown, sourced and processed and the fibre properties they bring to the end product.
17 | Living Forest Report: Chapter 3
COVER 1 2 3 4 5 6 7 8 9 10 11 12 13 14 15 16 17 18 19 20 21 22 23 24 25 26 27 28 29 30 31 32 33 Glossary/Acronyms References & Endnotes Acknowledgements Back Cover
COVER 1 2 3 4 5 6 7 8 9 10 11 12 13 14 15 16 17 18 19 20 21 22 23 24 25 26 27 28 29 30 31 32 33 Glossary/Acronyms References & Endnotes Acknowledgements Back Cover
The Living Forests Model projects a significant increase in wood demand (including as a feedstock for bioenergy) over the coming decades, even with increased recycling, reuse and efficiency. According to the model, this demand can be met by a combination of enlarging the portion of the world’s natural forests that is managed for production, and establishing new tree plantations.
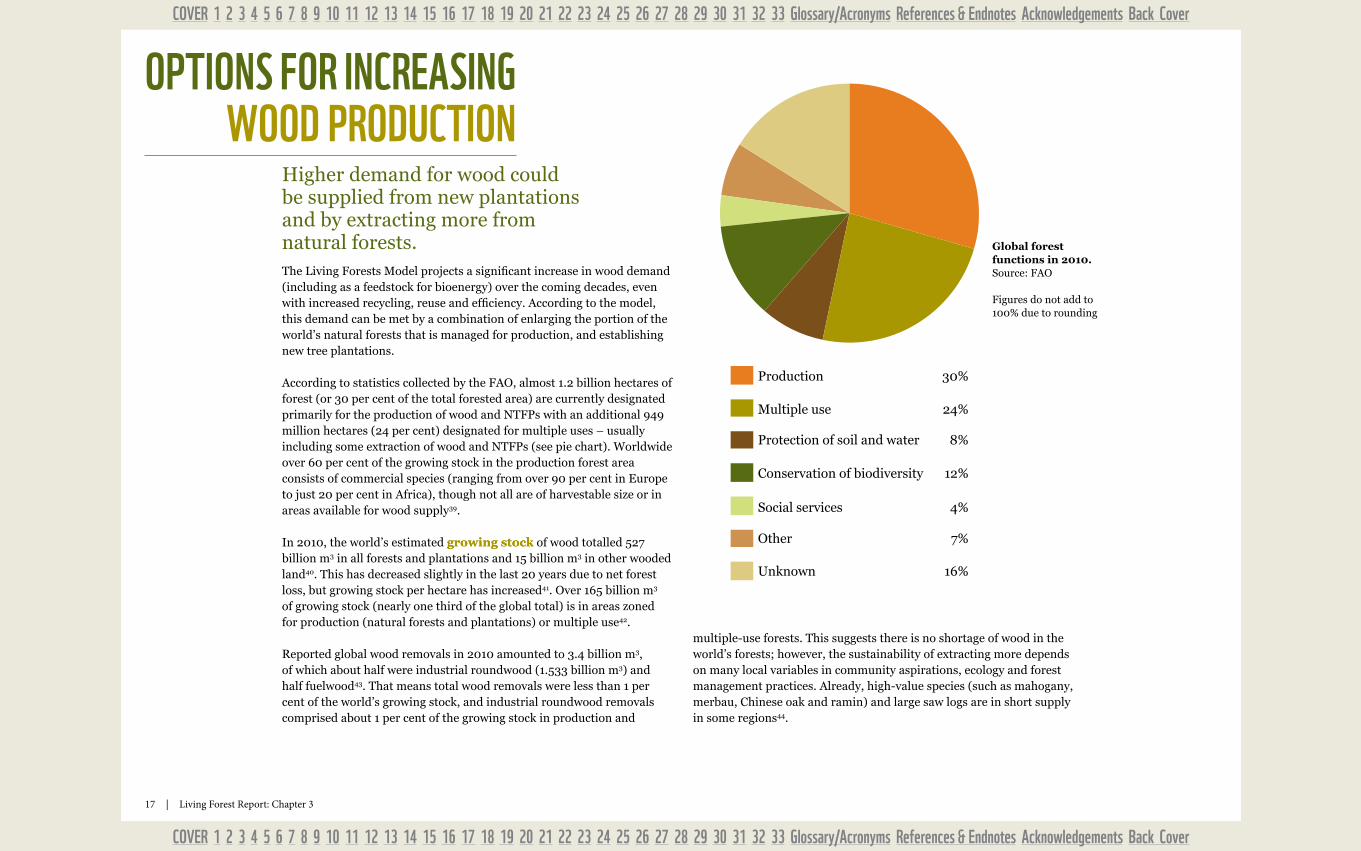
According to statistics collected by the FAO, almost 1.2 billion hectares of forest (or 30 per cent of the total forested area) are currently designated primarily for the production of wood and NTFPs with an additional 949 million hectares (24 per cent) designated for multiple uses – usually including some extraction of wood and NTFPs (see pie chart). Worldwide over 60 per cent of the growing stock in the production forest area consists of commercial species (ranging from over 90 per cent in Europe to just 20 per cent in Africa), though not all are of harvestable size or in areas available for wood supply39.
In 2010, the world’s estimated growing stock of wood totalled 527 billion m3 in all forests and plantations and 15 billion m3 in other wooded land40. This has decreased slightly in the last 20 years due to net forest loss, but growing stock per hectare has increased41. Over 165 billion m3 of growing stock (nearly one third of the global total) is in areas zoned for production (natural forests and plantations) or multiple use42.
Reported global wood removals in 2010 amounted to 3.4 billion m3, of which about half were industrial roundwood (1.533 billion m3) and half fuelwood43. That means total wood removals were less than 1 per cent of the world’s growing stock, and industrial roundwood removals comprised about 1 per cent of the growing stock in production and
Global forest functions in 2010. Source: FAO
Figures do not add to 100% due to rounding
multiple-use forests. This suggests there is no shortage of wood in the world’s forests; however, the sustainability of extracting more depends on many local variables in community aspirations, ecology and forest management practices. Already, high-value species (such as mahogany, merbau, Chinese oak and ramin) and large saw logs are in short supply in some regions44.
OPTIONS FOR INCREASING WOOD PRODUCTION
Unknown 16%
Other 7%
Multiple use 24%
Social services 4%
Conservation of biodiversity 12%
Protection of soil and water 8%
Production 30%
Unknown 16%
Other 7%
Multiple use 24%
Social services 4%
Conservation of biodiversity 12%
Protection of soil and water 8%
Production 30%
Higher demand for wood could be supplied from new plantations and by extracting more from natural forests.
18 | Living Forest Report: Chapter 3
COVER 1 2 3 4 5 6 7 8 9 10 11 12 13 14 15 16 17 18 19 20 21 22 23 24 25 26 27 28 29 30 31 32 33 Glossary/Acronyms References & Endnotes Acknowledgements Back Cover
COVER 1 2 3 4 5 6 7 8 9 10 11 12 13 14 15 16 17 18 19 20 21 22 23 24 25 26 27 28 29 30 31 32 33 Glossary/Acronyms References & Endnotes Acknowledgements Back Cover
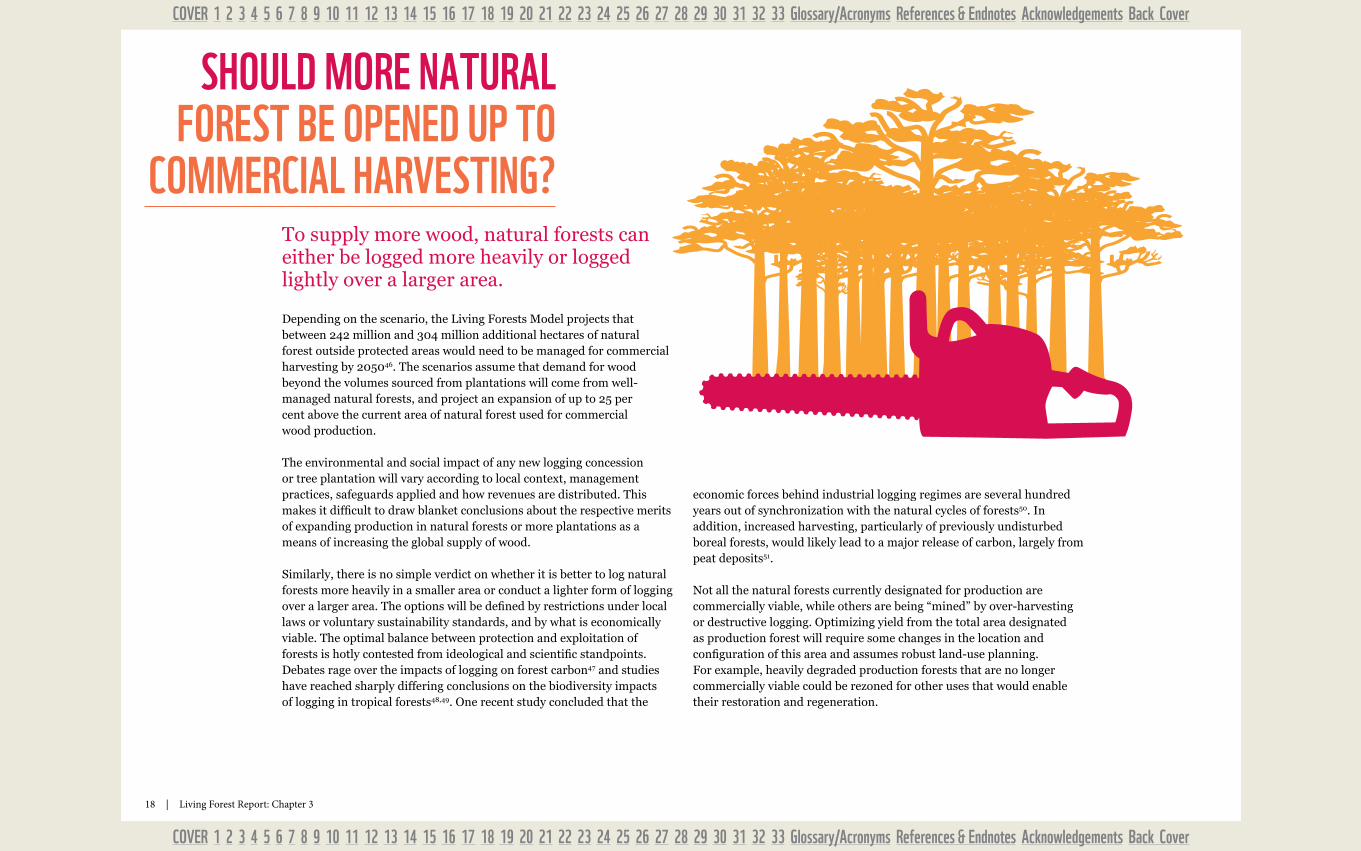
To supply more wood, natural forests can either be logged more heavily or logged lightly over a larger area.
Depending on the scenario, the Living Forests Model projects that between 242 million and 304 million additional hectares of natural forest outside protected areas would need to be managed for commercial harvesting by 205046. The scenarios assume that demand for wood beyond the volumes sourced from plantations will come from well-managed natural forests, and project an expansion of up to 25 per cent above the current area of natural forest used for commercial wood production.
The environmental and social impact of any new logging concession or tree plantation will vary according to local context, management practices, safeguards applied and how revenues are distributed. This makes it difficult to draw blanket conclusions about the respective merits of expanding production in natural forests or more plantations as a means of increasing the global supply of wood.
Similarly, there is no simple verdict on whether it is better to log natural forests more heavily in a smaller area or conduct a lighter form of logging over a larger area. The options will be defined by restrictions under local laws or voluntary sustainability standards, and by what is economically viable. The optimal balance between protection and exploitation of forests is hotly contested from ideological and scientific standpoints. Debates rage over the impacts of logging on forest carbon47 and studies have reached sharply differing conclusions on the biodiversity impacts of logging in tropical forests48,49. One recent study concluded that the
economic forces behind industrial logging regimes are several hundred years out of synchronization with the natural cycles of forests50. In addition, increased harvesting, particularly of previously undisturbed boreal forests, would likely lead to a major release of carbon, largely from peat deposits51.
Not all the natural forests currently designated for production are commercially viable, while others are being “mined” by over-harvesting or destructive logging. Optimizing yield from the total area designated as production forest will require some changes in the location and configuration of this area and assumes robust land-use planning. For example, heavily degraded production forests that are no longer commercially viable could be rezoned for other uses that would enable their restoration and regeneration.
SHOULD mORE NATURAL FOREST bE OPENED UP TO
COmmERCIAL HARVESTING?
19 | Living Forest Report: Chapter 3
COVER 1 2 3 4 5 6 7 8 9 10 11 12 13 14 15 16 17 18 19 20 21 22 23 24 25 26 27 28 29 30 31 32 33 Glossary/Acronyms References & Endnotes Acknowledgements Back Cover
COVER 1 2 3 4 5 6 7 8 9 10 11 12 13 14 15 16 17 18 19 20 21 22 23 24 25 26 27 28 29 30 31 32 33 Glossary/Acronyms References & Endnotes Acknowledgements Back Cover
SUSTAINAbLE WOOD ExTRACTION
AS A FOREST CONSERVATION
STRATEGy
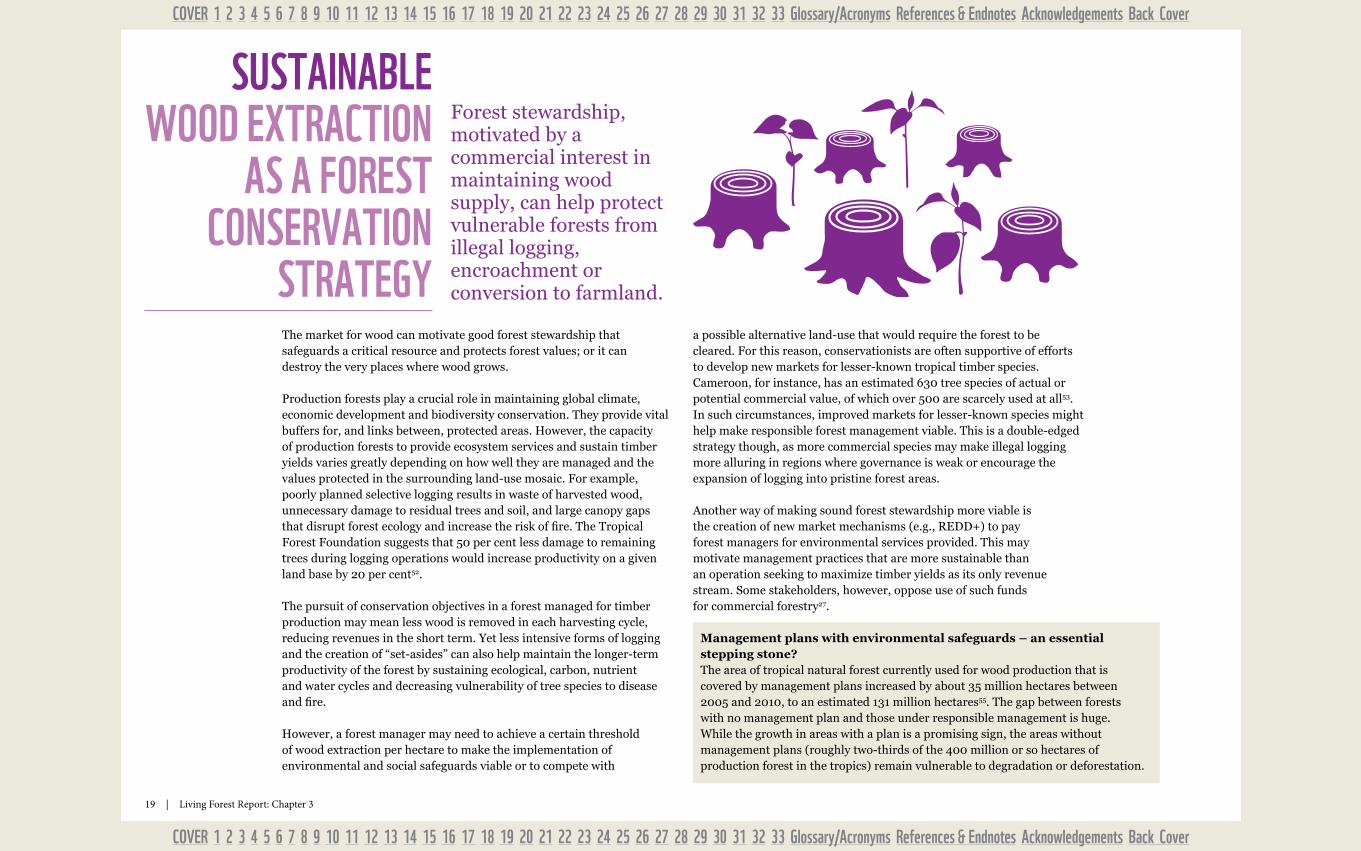
Forest stewardship, motivated by a commercial interest in maintaining wood supply, can help protect vulnerable forests from illegal logging, encroachment or conversion to farmland.
Management plans with environmental safeguards – an essential stepping stone?The area of tropical natural forest currently used for wood production that is covered by management plans increased by about 35 million hectares between 2005 and 2010, to an estimated 131 million hectares55. The gap between forests with no management plan and those under responsible management is huge. While the growth in areas with a plan is a promising sign, the areas without management plans (roughly two-thirds of the 400 million or so hectares of production forest in the tropics) remain vulnerable to degradation or deforestation.
The market for wood can motivate good forest stewardship that safeguards a critical resource and protects forest values; or it can destroy the very places where wood grows.
Production forests play a crucial role in maintaining global climate, economic development and biodiversity conservation. They provide vital buffers for, and links between, protected areas. However, the capacity of production forests to provide ecosystem services and sustain timber yields varies greatly depending on how well they are managed and the values protected in the surrounding land-use mosaic. For example, poorly planned selective logging results in waste of harvested wood, unnecessary damage to residual trees and soil, and large canopy gaps that disrupt forest ecology and increase the risk of fire. The Tropical Forest Foundation suggests that 50 per cent less damage to remaining trees during logging operations would increase productivity on a given land base by 20 per cent52.
The pursuit of conservation objectives in a forest managed for timber production may mean less wood is removed in each harvesting cycle, reducing revenues in the short term. Yet less intensive forms of logging and the creation of “set-asides” can also help maintain the longer-term productivity of the forest by sustaining ecological, carbon, nutrient and water cycles and decreasing vulnerability of tree species to disease and fire.
However, a forest manager may need to achieve a certain threshold of wood extraction per hectare to make the implementation of environmental and social safeguards viable or to compete with
a possible alternative land-use that would require the forest to be cleared. For this reason, conservationists are often supportive of efforts to develop new markets for lesser-known tropical timber species. Cameroon, for instance, has an estimated 630 tree species of actual or potential commercial value, of which over 500 are scarcely used at all53. In such circumstances, improved markets for lesser-known species might help make responsible forest management viable. This is a double-edged strategy though, as more commercial species may make illegal logging more alluring in regions where governance is weak or encourage the expansion of logging into pristine forest areas.
Another way of making sound forest stewardship more viable is the creation of new market mechanisms (e.g., REDD+) to pay forest managers for environmental services provided. This may motivate management practices that are more sustainable than an operation seeking to maximize timber yields as its only revenue stream. Some stakeholders, however, oppose use of such funds for commercial forestry27.
20 | Living Forest Report: Chapter 3
COVER 1 2 3 4 5 6 7 8 9 10 11 12 13 14 15 16 17 18 19 20 21 22 23 24 25 26 27 28 29 30 31 32 33 Glossary/Acronyms References & Endnotes Acknowledgements Back Cover
COVER 1 2 3 4 5 6 7 8 9 10 11 12 13 14 15 16 17 18 19 20 21 22 23 24 25 26 27 28 29 30 31 32 33 Glossary/Acronyms References & Endnotes Acknowledgements Back Cover
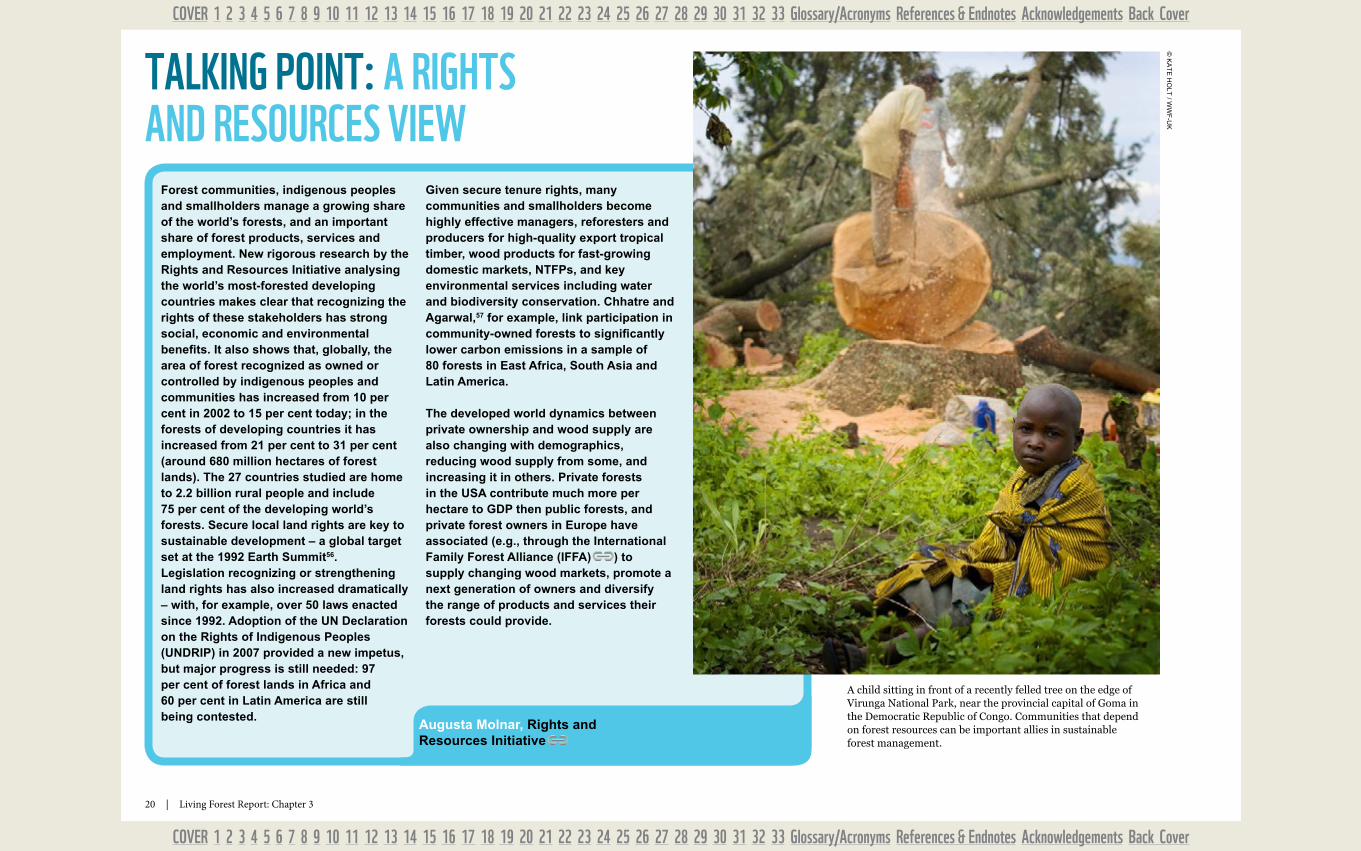
TALkING POINT: A RIGHTS AND RESOURCES VIEW
Augusta Molnar, Rights and Resources Initiative
A child sitting in front of a recently felled tree on the edge of Virunga National Park, near the provincial capital of Goma in the Democratic Republic of Congo. Communities that depend on forest resources can be important allies in sustainable forest management.
© k
at
E H
olt
/ ww
F-U
kForest communities, indigenous peoples and smallholders manage a growing share of the world’s forests, and an important share of forest products, services and employment. New rigorous research by the Rights and Resources Initiative analysing the world’s most-forested developing countries makes clear that recognizing the rights of these stakeholders has strong social, economic and environmental benefits. It also shows that, globally, the area of forest recognized as owned or controlled by indigenous peoples and communities has increased from 10 per cent in 2002 to 15 per cent today; in the forests of developing countries it has increased from 21 per cent to 31 per cent (around 680 million hectares of forest lands). The 27 countries studied are home to 2.2 billion rural people and include 75 per cent of the developing world’s forests. Secure local land rights are key to sustainable development – a global target set at the 1992 Earth Summit56. Legislation recognizing or strengthening land rights has also increased dramatically – with, for example, over 50 laws enacted since 1992. Adoption of the UN Declaration on the Rights of Indigenous Peoples (UNDRIP) in 2007 provided a new impetus, but major progress is still needed: 97 per cent of forest lands in Africa and 60 per cent in Latin America are still being contested.
Given secure tenure rights, many communities and smallholders become highly effective managers, reforesters and producers for high-quality export tropical timber, wood products for fast-growing domestic markets, NTFPs, and key environmental services including water and biodiversity conservation. Chhatre and Agarwal,57 for example, link participation in community-owned forests to significantly lower carbon emissions in a sample of 80 forests in East Africa, South Asia and Latin America.
The developed world dynamics between private ownership and wood supply are also changing with demographics, reducing wood supply from some, and increasing it in others. Private forests in the USA contribute much more per hectare to GDP then public forests, and private forest owners in Europe have associated (e.g., through the International Family Forest Alliance (IFFA) ) to supply changing wood markets, promote a next generation of owners and diversify the range of products and services their forests could provide.
21 | Living Forest Report: Chapter 3
COVER 1 2 3 4 5 6 7 8 9 10 11 12 13 14 15 16 17 18 19 20 21 22 23 24 25 26 27 28 29 30 31 32 33 Glossary/Acronyms References & Endnotes Acknowledgements Back Cover
COVER 1 2 3 4 5 6 7 8 9 10 11 12 13 14 15 16 17 18 19 20 21 22 23 24 25 26 27 28 29 30 31 32 33 Glossary/Acronyms References & Endnotes Acknowledgements Back Cover
Former Soviet UnionEurope (EU27
+ rest of Europe)
66.5
35.3
35.4
Rest of Asia-Pacific
32.3Africa and the
Middle East
26.6Latin America and
the Caribbean
44.8North America
(US and Canada)
China
11
251.8WORLD TOTAL
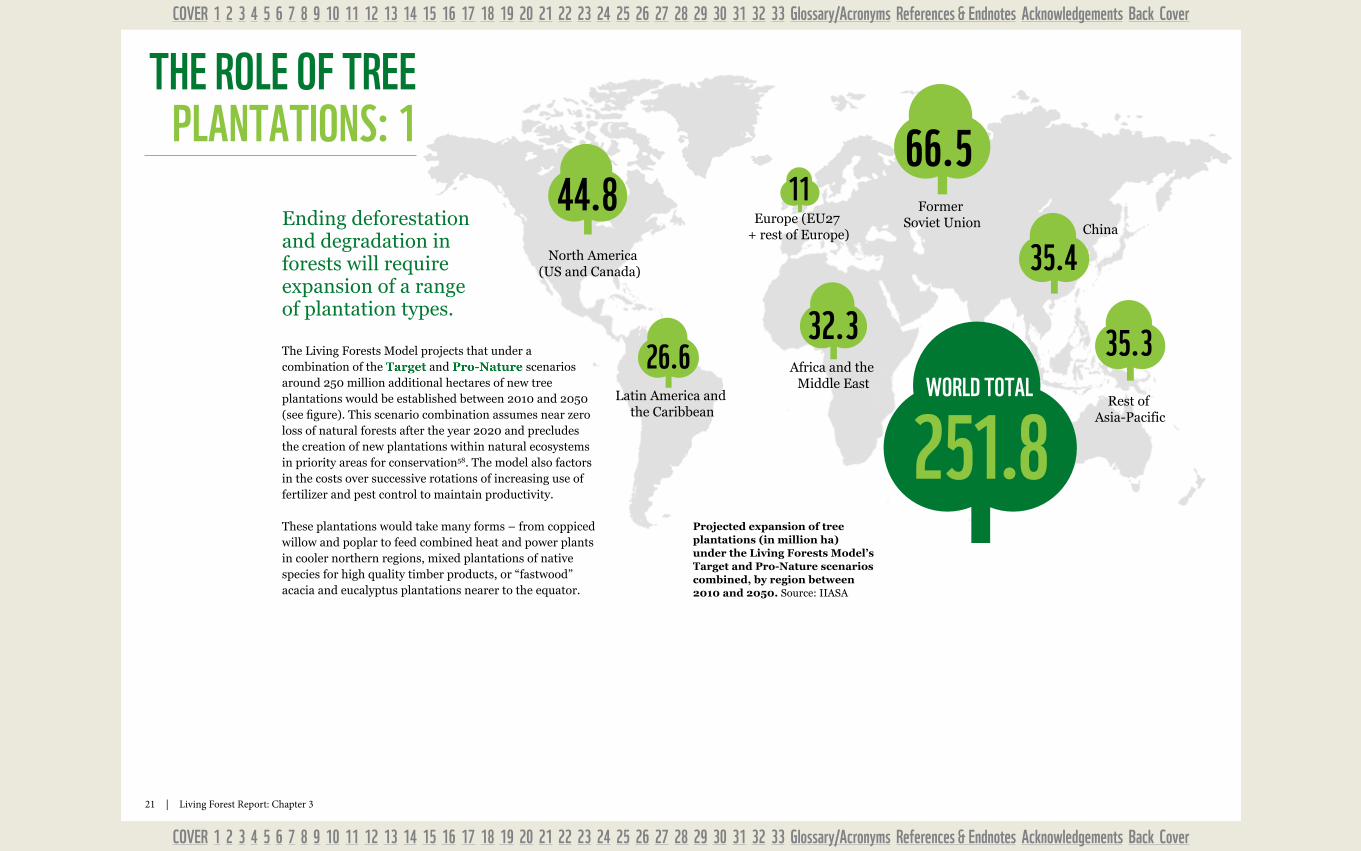
The Living Forests Model projects that under a combination of the Target and Pro-Nature scenarios around 250 million additional hectares of new tree plantations would be established between 2010 and 2050 (see figure). This scenario combination assumes near zero loss of natural forests after the year 2020 and precludes the creation of new plantations within natural ecosystems in priority areas for conservation58. The model also factors in the costs over successive rotations of increasing use of fertilizer and pest control to maintain productivity.
These plantations would take many forms – from coppiced willow and poplar to feed combined heat and power plants in cooler northern regions, mixed plantations of native species for high quality timber products, or “fastwood” acacia and eucalyptus plantations nearer to the equator.
Projected expansion of tree plantations (in million ha) under the Living Forests Model’s Target and Pro-Nature scenarios combined, by region between 2010 and 2050. Source: IIASA
THE ROLE OF TREE PLANTATIONS: 1
Ending deforestation and degradation in forests will require expansion of a range of plantation types.
22 | Living Forest Report: Chapter 3
COVER 1 2 3 4 5 6 7 8 9 10 11 12 13 14 15 16 17 18 19 20 21 22 23 24 25 26 27 28 29 30 31 32 33 Glossary/Acronyms References & Endnotes Acknowledgements Back Cover
COVER 1 2 3 4 5 6 7 8 9 10 11 12 13 14 15 16 17 18 19 20 21 22 23 24 25 26 27 28 29 30 31 32 33 Glossary/Acronyms References & Endnotes Acknowledgements Back Cover
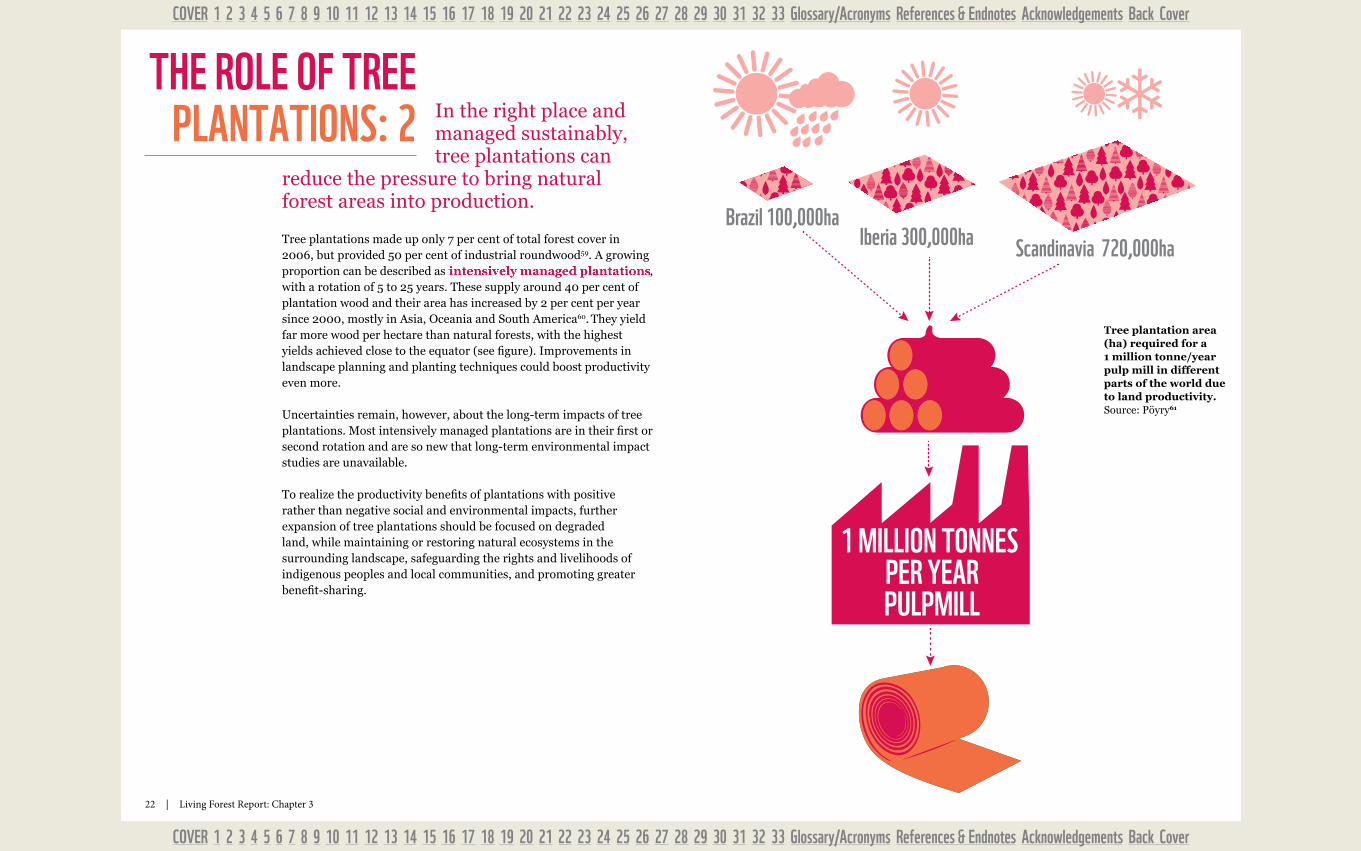
Brazil 100,000haIberia 300,000ha Scandinavia 720,000ha
1 MILLION TONNES PER YEARPULPMILL
Tree plantations made up only 7 per cent of total forest cover in 2006, but provided 50 per cent of industrial roundwood59. A growing proportion can be described as intensively managed plantations, with a rotation of 5 to 25 years. These supply around 40 per cent of plantation wood and their area has increased by 2 per cent per year since 2000, mostly in Asia, Oceania and South America60. They yield far more wood per hectare than natural forests, with the highest yields achieved close to the equator (see figure). Improvements in landscape planning and planting techniques could boost productivity even more.
Uncertainties remain, however, about the long-term impacts of tree plantations. Most intensively managed plantations are in their first or second rotation and are so new that long-term environmental impact studies are unavailable.
To realize the productivity benefits of plantations with positive rather than negative social and environmental impacts, further expansion of tree plantations should be focused on degraded land, while maintaining or restoring natural ecosystems in the surrounding landscape, safeguarding the rights and livelihoods of indigenous peoples and local communities, and promoting greater benefit-sharing.
Tree plantation area (ha) required for a 1 million tonne/year pulp mill in different parts of the world due to land productivity. Source: Pöyry61
THE ROLE OF TREE PLANTATIONS: 2 In the right place and
managed sustainably, tree plantations can
reduce the pressure to bring natural forest areas into production.
23 | Living Forest Report: Chapter 3
COVER 1 2 3 4 5 6 7 8 9 10 11 12 13 14 15 16 17 18 19 20 21 22 23 24 25 26 27 28 29 30 31 32 33 Glossary/Acronyms References & Endnotes Acknowledgements Back Cover
COVER 1 2 3 4 5 6 7 8 9 10 11 12 13 14 15 16 17 18 19 20 21 22 23 24 25 26 27 28 29 30 31 32 33 Glossary/Acronyms References & Endnotes Acknowledgements Back Cover
Along with improved practices, advances in biotechnology could further boost plantation
yields. But the precautionary principle62 must be applied in deciding if and how they are deployed and such advances must first gain social acceptance.
The Living Forests Model assumes that future tree plantation yields will match the best yields achieved today for a given combination of climate variables and soil type63. However, in theory biotechnology, whether through conventional plant breeding or genetic modification, could improve plantation yields and reduce globally the portion of land that needs to be dedicated to wood production.
So far there has been very limited commercial deployment of genetically modified (GM) trees and no international consensus exists on the potential risks, benefits and ethics of GM technology (see box). Wherever GM organisms are proposed to be released into the environment, WWF advocates a strong precautionary approach with respect to environmental and social impacts and transparent monitoring for such impacts. National regulatory frameworks for environmental use and release of GM organisms (including field trials and commercialization) should support and implement the Cartagena Protocol on Biosafety .
GM trees An extract from The Forests Dialogue Scoping Paper on GM Trees67
Gamborg and Sandøe64 note “that if modern biotechnology is to stand a chance, three main conditions for public acceptance must be met: utility, low risk, and an assurance that the biotechnology is used in a decent way”. But they also note that surveys suggest these are necessary but not sufficient conditions, and that “moral acceptability is a better predictor … than risk or usefulness”. Thus, a fundamental challenge for proponents of GM trees is to build public trust65, in part by finding ways of demonstrating to members of civil society that GM trees satisfy these conditions and tests. Societies will continue to rely on technological advances, such as those offered by genetic modification66; conversely, as aspects of the agbiotech debate (amongst many others) illustrate, scientific advances do not necessarily or inherently confer legitimacy or gain social acceptance. More profound social processes are necessary to engender legitimacy and acceptance of scientific innovation for which the balance of potential benefits and risks is uncertain, and this applies to GM trees as to other such technologies.
THE ROLE OF TREE PLANTATIONS: 3
24 | Living Forest Report: Chapter 3
COVER 1 2 3 4 5 6 7 8 9 10 11 12 13 14 15 16 17 18 19 20 21 22 23 24 25 26 27 28 29 30 31 32 33 Glossary/Acronyms References & Endnotes Acknowledgements Back Cover
COVER 1 2 3 4 5 6 7 8 9 10 11 12 13 14 15 16 17 18 19 20 21 22 23 24 25 26 27 28 29 30 31 32 33 Glossary/Acronyms References & Endnotes Acknowledgements Back Cover
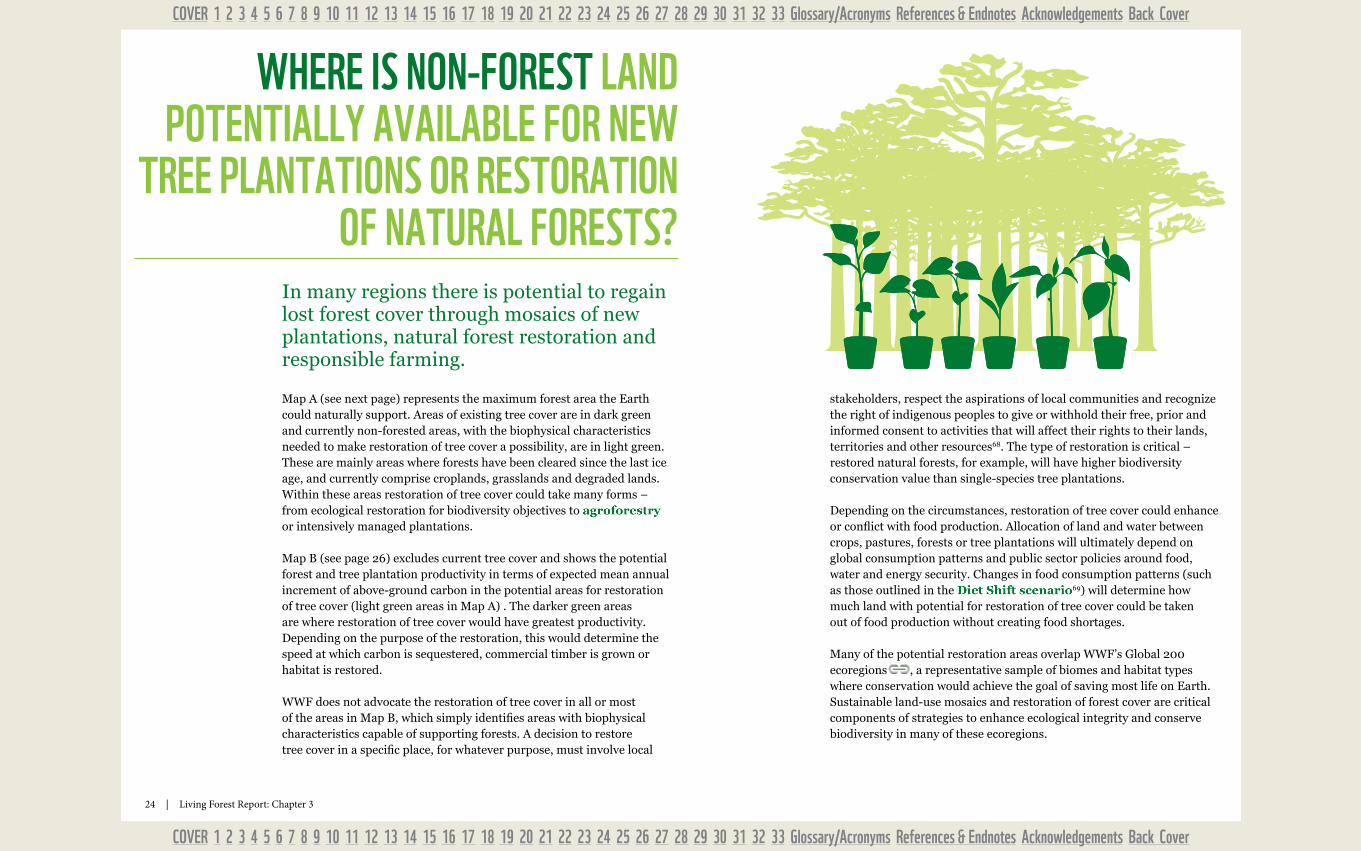
In many regions there is potential to regain lost forest cover through mosaics of new plantations, natural forest restoration and responsible farming.
Map A (see next page) represents the maximum forest area the Earth could naturally support. Areas of existing tree cover are in dark green and currently non-forested areas, with the biophysical characteristics needed to make restoration of tree cover a possibility, are in light green. These are mainly areas where forests have been cleared since the last ice age, and currently comprise croplands, grasslands and degraded lands. Within these areas restoration of tree cover could take many forms – from ecological restoration for biodiversity objectives to agroforestry or intensively managed plantations. Map B (see page 26) excludes current tree cover and shows the potential forest and tree plantation productivity in terms of expected mean annual increment of above-ground carbon in the potential areas for restoration of tree cover (light green areas in Map A) . The darker green areas are where restoration of tree cover would have greatest productivity. Depending on the purpose of the restoration, this would determine the speed at which carbon is sequestered, commercial timber is grown or habitat is restored.
WWF does not advocate the restoration of tree cover in all or most of the areas in Map B, which simply identifies areas with biophysical characteristics capable of supporting forests. A decision to restore tree cover in a specific place, for whatever purpose, must involve local
WHERE IS NON-FOREST LAND POTENTIALLy AVAILAbLE FOR NEW
TREE PLANTATIONS OR RESTORATION OF NATURAL FORESTS?
stakeholders, respect the aspirations of local communities and recognize the right of indigenous peoples to give or withhold their free, prior and informed consent to activities that will affect their rights to their lands, territories and other resources68. The type of restoration is critical – restored natural forests, for example, will have higher biodiversity conservation value than single-species tree plantations.
Depending on the circumstances, restoration of tree cover could enhance or conflict with food production. Allocation of land and water between crops, pastures, forests or tree plantations will ultimately depend on global consumption patterns and public sector policies around food, water and energy security. Changes in food consumption patterns (such as those outlined in the Diet Shift scenario69) will determine how much land with potential for restoration of tree cover could be taken out of food production without creating food shortages.
Many of the potential restoration areas overlap WWF’s Global 200 ecoregions , a representative sample of biomes and habitat types where conservation would achieve the goal of saving most life on Earth. Sustainable land-use mosaics and restoration of forest cover are critical components of strategies to enhance ecological integrity and conserve biodiversity in many of these ecoregions.
25 | Living Forest Report: Chapter 3
COVER 1 2 3 4 5 6 7 8 9 10 11 12 13 14 15 16 17 18 19 20 21 22 23 24 25 26 27 28 29 30 31 32 33 Glossary/Acronyms References & Endnotes Acknowledgements Back Cover
COVER 1 2 3 4 5 6 7 8 9 10 11 12 13 14 15 16 17 18 19 20 21 22 23 24 25 26 27 28 29 30 31 32 33 Glossary/Acronyms References & Endnotes Acknowledgements Back Cover
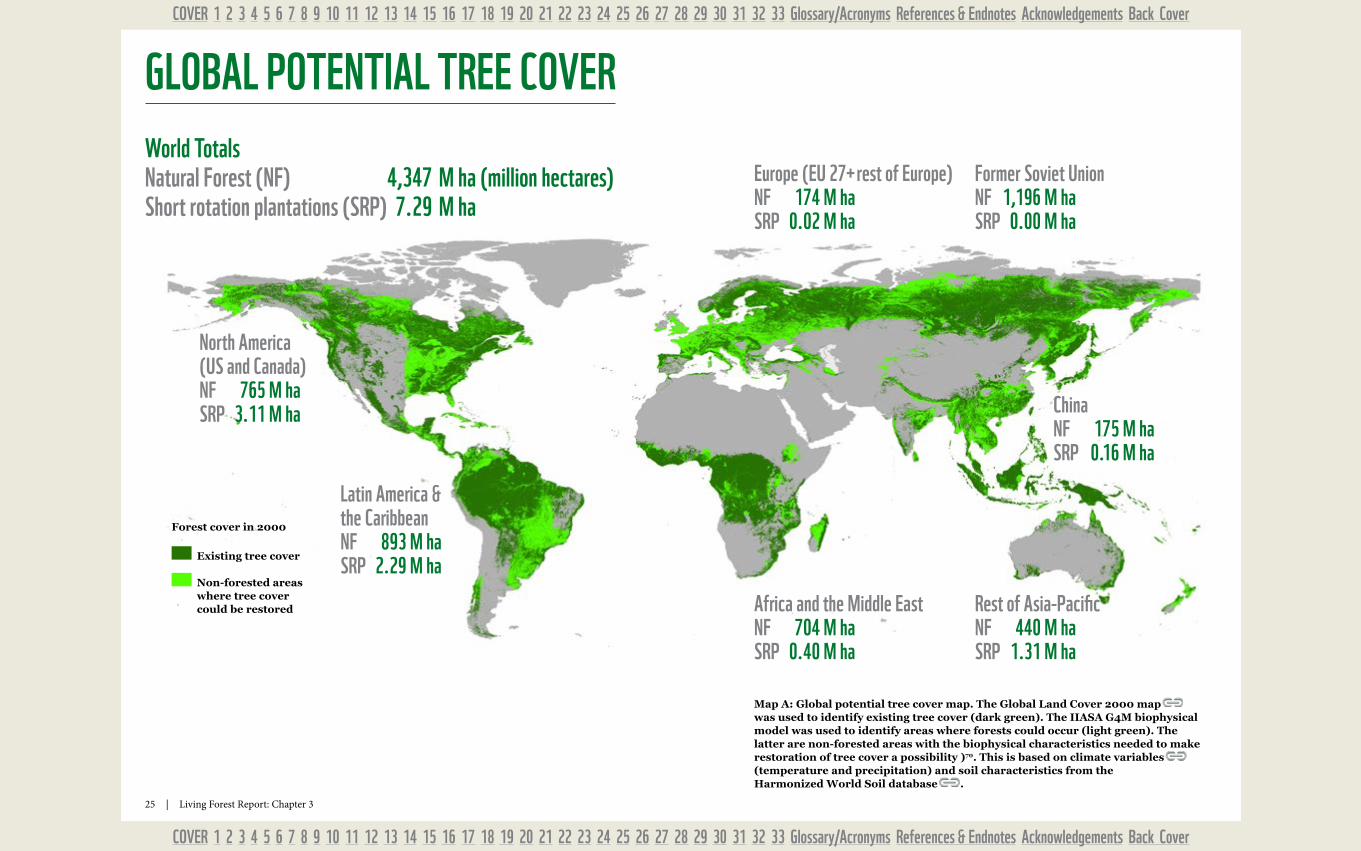
Map A: Global potential tree cover map. The Global Land Cover 2000 map was used to identify existing tree cover (dark green). The IIASA G4M biophysical model was used to identify areas where forests could occur (light green). The latter are non-forested areas with the biophysical characteristics needed to make restoration of tree cover a possibility )70. This is based on climate variables (temperature and precipitation) and soil characteristics from the Harmonized World Soil database .
North America (US and Canada) NF 765 m haSRP 3.11 m ha
Existing tree cover
Non-forested areas where tree cover could be restored
Forest cover in 2000
Latin America & the CaribbeanNF 893 m haSRP 2.29 m ha
Africa and the middle EastNF 704 m haSRP 0.40 m ha
ChinaNF 175 m haSRP 0.16 m ha
Rest of Asia-PacificNF 440 m haSRP 1.31 m ha
Former Soviet UnionNF 1,196 m haSRP 0.00 m ha
Europe (EU 27+ rest of Europe) NF 174 m haSRP 0.02 m ha
World TotalsNatural Forest (NF) 4,347 m ha (million hectares)Short rotation plantations (SRP) 7.29 m ha
GLObAL POTENTIAL TREE COVER
26 | Living Forest Report: Chapter 3
COVER 1 2 3 4 5 6 7 8 9 10 11 12 13 14 15 16 17 18 19 20 21 22 23 24 25 26 27 28 29 30 31 32 33 Glossary/Acronyms References & Endnotes Acknowledgements Back Cover
COVER 1 2 3 4 5 6 7 8 9 10 11 12 13 14 15 16 17 18 19 20 21 22 23 24 25 26 27 28 29 30 31 32 33 Glossary/Acronyms References & Endnotes Acknowledgements Back Cover
POTENTIAL AREAS FOR RESTORATION OF TREE COVER
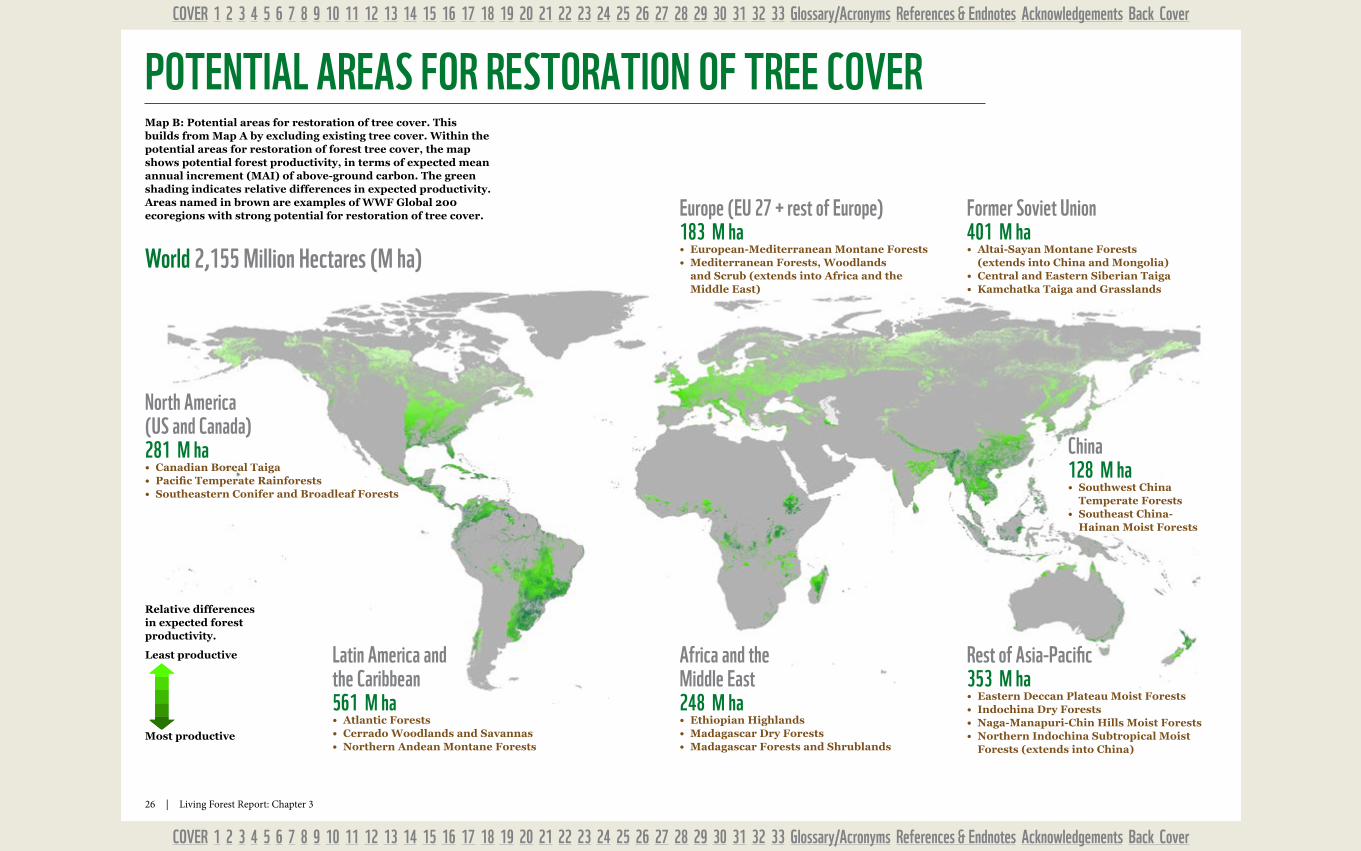
Latin America and the Caribbean561 m ha• Atlantic Forests• Cerrado Woodlands and Savannas• Northern Andean Montane Forests
Africa and the middle East248 m ha• Ethiopian Highlands• Madagascar Dry Forests• Madagascar Forests and Shrublands
China128 m ha• Southwest China
Temperate Forests• Southeast China-
Hainan Moist Forests
Rest of Asia-Pacific353 m ha• Eastern Deccan Plateau Moist Forests• Indochina Dry Forests• Naga-Manapuri-Chin Hills Moist Forests• Northern Indochina Subtropical Moist
Forests (extends into China)
Former Soviet Union401 m ha• Altai-Sayan Montane Forests
(extends into China and Mongolia)• Central and Eastern Siberian Taiga• Kamchatka Taiga and Grasslands
Europe (EU 27 + rest of Europe) 183 m ha• European-Mediterranean Montane Forests• Mediterranean Forests, Woodlands
and Scrub (extends into Africa and the Middle East)
World 2,155 million Hectares (m ha)
North America (US and Canada) 281 m ha• Canadian Boreal Taiga• Pacific Temperate Rainforests• Southeastern Conifer and Broadleaf Forests
Map B: Potential areas for restoration of tree cover. This builds from Map A by excluding existing tree cover. Within the potential areas for restoration of forest tree cover, the map shows potential forest productivity, in terms of expected mean annual increment (MAI) of above-ground carbon. The green shading indicates relative differences in expected productivity. Areas named in brown are examples of WWF Global 200 ecoregions with strong potential for restoration of tree cover.
Relative differences in expected forest productivity.
Least productive
Most productive
27 | Living Forest Report: Chapter 3
COVER 1 2 3 4 5 6 7 8 9 10 11 12 13 14 15 16 17 18 19 20 21 22 23 24 25 26 27 28 29 30 31 32 33 Glossary/Acronyms References & Endnotes Acknowledgements Back Cover
COVER 1 2 3 4 5 6 7 8 9 10 11 12 13 14 15 16 17 18 19 20 21 22 23 24 25 26 27 28 29 30 31 32 33 Glossary/Acronyms References & Endnotes Acknowledgements Back Cover
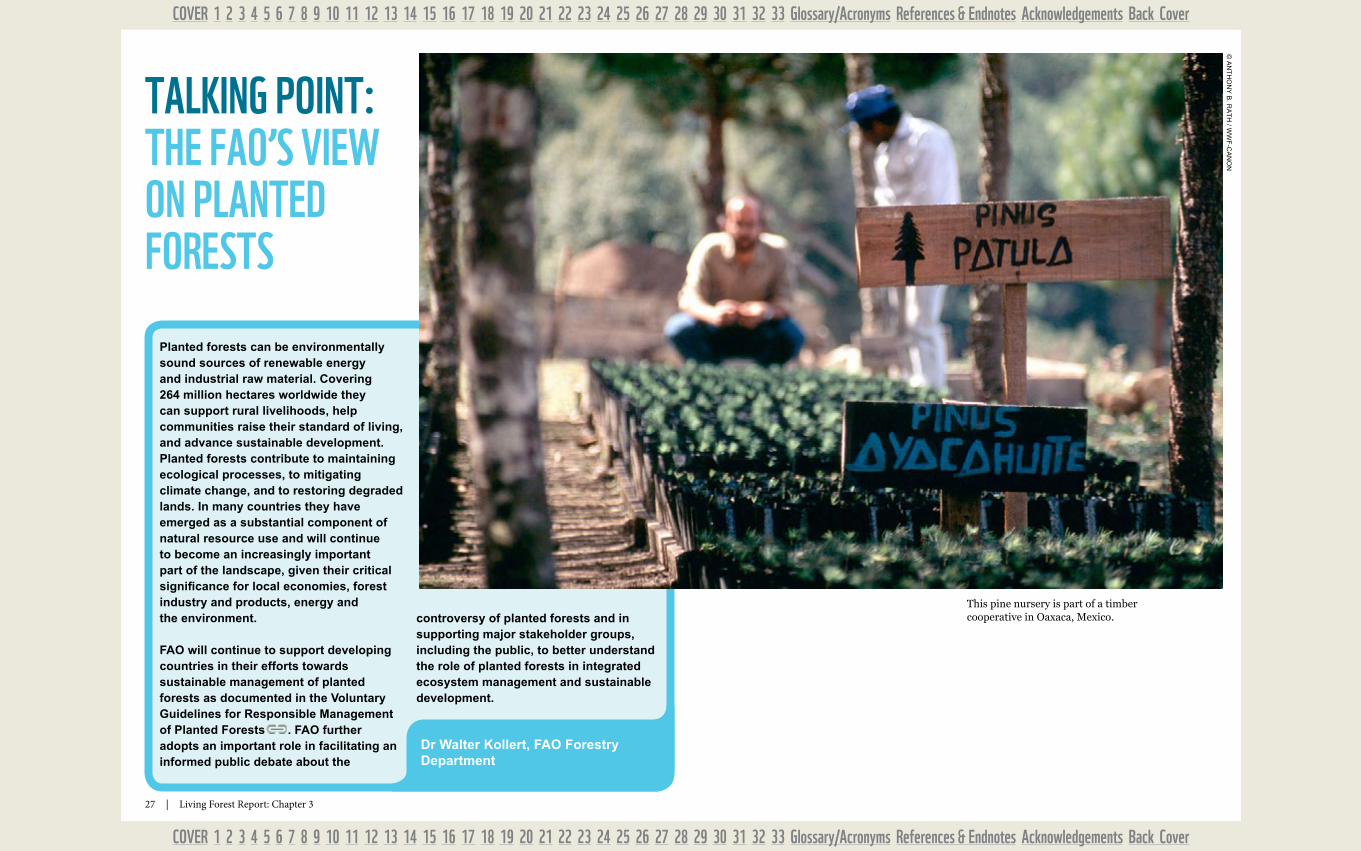
Planted forests can be environmentally sound sources of renewable energy and industrial raw material. Covering 264 million hectares worldwide they can support rural livelihoods, help communities raise their standard of living, and advance sustainable development. Planted forests contribute to maintaining ecological processes, to mitigating climate change, and to restoring degraded lands. In many countries they have emerged as a substantial component of natural resource use and will continue to become an increasingly important part of the landscape, given their critical significance for local economies, forest industry and products, energy and the environment.
FAO will continue to support developing countries in their efforts towards sustainable management of planted forests as documented in the Voluntary Guidelines for Responsible Management of Planted Forests . FAO further adopts an important role in facilitating an informed public debate about the
controversy of planted forests and in supporting major stakeholder groups, including the public, to better understand the role of planted forests in integrated ecosystem management and sustainable development.
Dr Walter Kollert, FAO Forestry Department
TALkING POINT: THE FAO’S VIEW ON PLANTED FORESTS
This pine nursery is part of a timber cooperative in Oaxaca, Mexico.
© a
nt
Ho
ny
B. r
at
H / w
wF
-Ca
no
n
28 | Living Forest Report: Chapter 3
COVER 1 2 3 4 5 6 7 8 9 10 11 12 13 14 15 16 17 18 19 20 21 22 23 24 25 26 27 28 29 30 31 32 33 Glossary/Acronyms References & Endnotes Acknowledgements Back Cover
COVER 1 2 3 4 5 6 7 8 9 10 11 12 13 14 15 16 17 18 19 20 21 22 23 24 25 26 27 28 29 30 31 32 33 Glossary/Acronyms References & Endnotes Acknowledgements Back Cover
Although the illegal trade remains on a massive scale, solutions to this problem are emerging.
Improved enforcement of forest laws and increasing regulation of trade in wood products is helping reduce illegal logging. Research carried out by Chatham House estimates that illegal logging has fallen 50 per cent in Cameroon, 50-75 per cent in the Brazilian Amazon and 75 per cent in Indonesia since 200071.
New trade regulations targeting illegal logging Governments in consumer countries are introducing prohibitions on trade in products containing illegally sourced wood and other policy measures linked to the Forest Law Enforcement, Governance and Trade (FLEGT) initiatives72. The 2008 amendment of the US Lacey Act makes it an offence to import, handle or sell illegally sourced wood products73. The EU Timber Regulation74 will enter into force in 2013, requiring those placing wood products on the EU market to exercise due diligence to ensure the wood was legally sourced. The Australian government is also developing an Illegal Logging Prohibition Bill, which, if passed, will regulate due diligence requirements for importers and processors. However, other growing markets for wood products have yet to take firm action. China, for example, has commissioned a study into the country’s role as an importer of illegally sourced wood, but has no official plans to develop legislation to tackle the issue75.
TraceabilityOne critical step in reducing illegal logging and associated trade is accurate tracing of wood along the supply chain. Without traceability a business cannot be sure that the wood or fibre in products it sells, uses or manufactures originates from a legal source. Technology is making full traceability more feasible. Better labelling devices (such as bar-coded tags or radio-frequency identification chips that can be scanned electronically) on logs or processed material enable efficient and accurate data capture at critical points along the supply chain. Internet-related data management systems are harder to forge or falsify than paper-
based manual-entry systems. DNA and isotopic76 testing as well as fibre analysis can be used to check suspicious claims about the source or species of wood in a product. However, in regions where the trade in logs or processed wood is fragmented (involving numerous intermediaries) and opaque (e.g., characterized by cash transactions and poor official record keeping), full traceability may only be feasible if governance and government-led tracking is strengthened and if buyers simplify their supply chains and use the emerging tracking and tracing systems.
However, legality is only a step towards sustainability. Elements of sustainability, such as good governance, inclusiveness and maintaining forest ecosystems, usually require actions that go beyond mere legal compliance.
HALTING ILLEGAL LOGGING
29 | Living Forest Report: Chapter 3
COVER 1 2 3 4 5 6 7 8 9 10 11 12 13 14 15 16 17 18 19 20 21 22 23 24 25 26 27 28 29 30 31 32 33 Glossary/Acronyms References & Endnotes Acknowledgements Back Cover
COVER 1 2 3 4 5 6 7 8 9 10 11 12 13 14 15 16 17 18 19 20 21 22 23 24 25 26 27 28 29 30 31 32 33 Glossary/Acronyms References & Endnotes Acknowledgements Back Cover
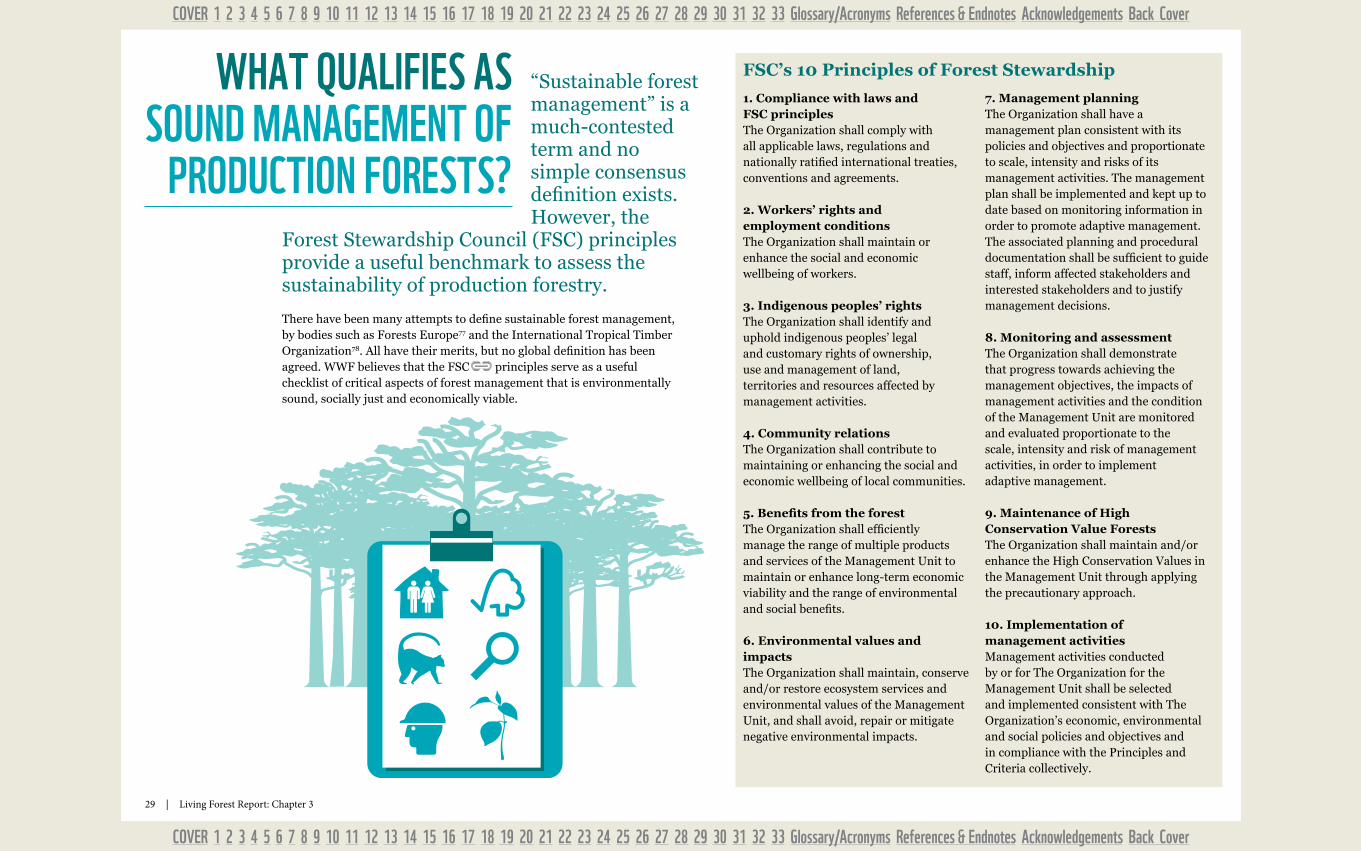
“Sustainable forest management” is a much-contested term and no simple consensus definition exists. However, the
Forest Stewardship Council (FSC) principles provide a useful benchmark to assess the sustainability of production forestry.
There have been many attempts to define sustainable forest management, by bodies such as Forests Europe77 and the International Tropical Timber Organization78. All have their merits, but no global definition has been agreed. WWF believes that the FSC principles serve as a useful checklist of critical aspects of forest management that is environmentally sound, socially just and economically viable.
FSC’s 10 Principles of Forest Stewardship
1. Compliance with laws and FSC principlesThe Organization shall comply with all applicable laws, regulations and nationally ratified international treaties, conventions and agreements.
2. Workers’ rights and employment conditionsThe Organization shall maintain or enhance the social and economic wellbeing of workers.
3. Indigenous peoples’ rightsThe Organization shall identify and uphold indigenous peoples’ legal and customary rights of ownership, use and management of land, territories and resources affected by management activities.
4. Community relations The Organization shall contribute to maintaining or enhancing the social and economic wellbeing of local communities.
5. Benefits from the forestThe Organization shall efficiently manage the range of multiple products and services of the Management Unit to maintain or enhance long-term economic viability and the range of environmental and social benefits.
6. Environmental values and impactsThe Organization shall maintain, conserve and/or restore ecosystem services and environmental values of the Management Unit, and shall avoid, repair or mitigate negative environmental impacts.
7. Management planningThe Organization shall have a management plan consistent with its policies and objectives and proportionate to scale, intensity and risks of its management activities. The management plan shall be implemented and kept up to date based on monitoring information in order to promote adaptive management. The associated planning and procedural documentation shall be sufficient to guide staff, inform affected stakeholders and interested stakeholders and to justify management decisions.
8. Monitoring and assessmentThe Organization shall demonstrate that progress towards achieving the management objectives, the impacts of management activities and the condition of the Management Unit are monitored and evaluated proportionate to the scale, intensity and risk of management activities, in order to implement adaptive management.
9. Maintenance of High Conservation Value ForestsThe Organization shall maintain and/or enhance the High Conservation Values in the Management Unit through applying the precautionary approach.
10. Implementation of management activitiesManagement activities conducted by or for The Organization for the Management Unit shall be selected and implemented consistent with The Organization’s economic, environmental and social policies and objectives and in compliance with the Principles and Criteria collectively.
WHAT qUALIFIES AS SOUND mANAGEmENT OF
PRODUCTION FORESTS?
30 | Living Forest Report: Chapter 3
COVER 1 2 3 4 5 6 7 8 9 10 11 12 13 14 15 16 17 18 19 20 21 22 23 24 25 26 27 28 29 30 31 32 33 Glossary/Acronyms References & Endnotes Acknowledgements Back Cover
COVER 1 2 3 4 5 6 7 8 9 10 11 12 13 14 15 16 17 18 19 20 21 22 23 24 25 26 27 28 29 30 31 32 33 Glossary/Acronyms References & Endnotes Acknowledgements Back Cover
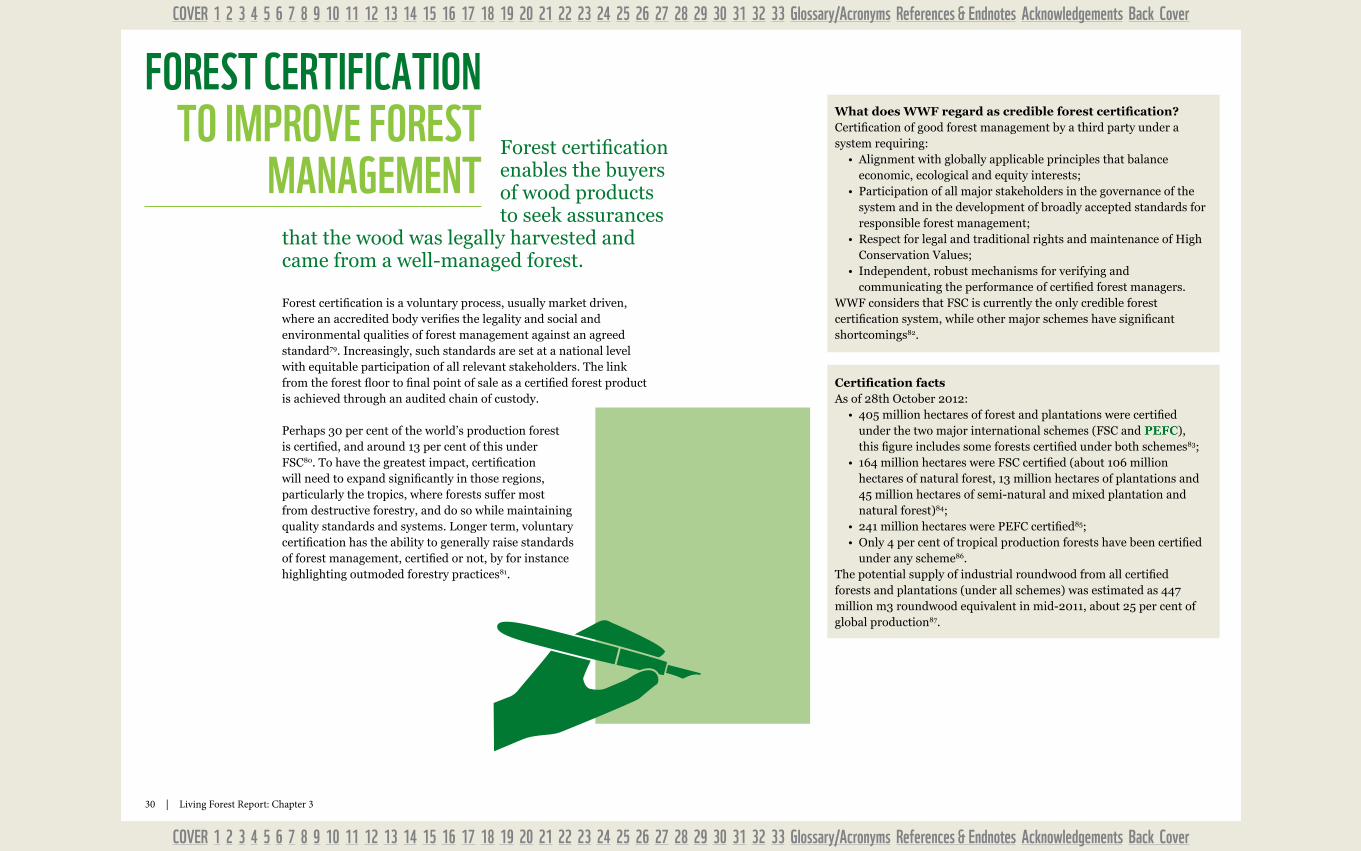
Forest certification enables the buyers of wood products to seek assurances
that the wood was legally harvested and came from a well-managed forest.
Forest certification is a voluntary process, usually market driven, where an accredited body verifies the legality and social and environmental qualities of forest management against an agreed standard79. Increasingly, such standards are set at a national level with equitable participation of all relevant stakeholders. The link from the forest floor to final point of sale as a certified forest product is achieved through an audited chain of custody.
Perhaps 30 per cent of the world’s production forest is certified, and around 13 per cent of this under FSC80. To have the greatest impact, certification will need to expand significantly in those regions, particularly the tropics, where forests suffer most from destructive forestry, and do so while maintaining quality standards and systems. Longer term, voluntary certification has the ability to generally raise standards of forest management, certified or not, by for instance highlighting outmoded forestry practices81.
What does WWF regard as credible forest certification?Certification of good forest management by a third party under a system requiring:
• Alignment with globally applicable principles that balance economic, ecological and equity interests;
• Participation of all major stakeholders in the governance of the system and in the development of broadly accepted standards for responsible forest management;
• Respect for legal and traditional rights and maintenance of High Conservation Values;
• Independent, robust mechanisms for verifying and communicating the performance of certified forest managers.
WWF considers that FSC is currently the only credible forest certification system, while other major schemes have significant shortcomings82.
FOREST CERTIFICATION TO ImPROVE FOREST
mANAGEmENT
Certified
Certification factsAs of 28th October 2012:
• 405 million hectares of forest and plantations were certified under the two major international schemes (FSC and PEFC), this figure includes some forests certified under both schemes83;
• 164 million hectares were FSC certified (about 106 million hectares of natural forest, 13 million hectares of plantations and 45 million hectares of semi-natural and mixed plantation and natural forest)84;
• 241 million hectares were PEFC certified85;• Only 4 per cent of tropical production forests have been certified
under any scheme86. The potential supply of industrial roundwood from all certified forests and plantations (under all schemes) was estimated as 447 million m3 roundwood equivalent in mid-2011, about 25 per cent of global production87.
31 | Living Forest Report: Chapter 3
COVER 1 2 3 4 5 6 7 8 9 10 11 12 13 14 15 16 17 18 19 20 21 22 23 24 25 26 27 28 29 30 31 32 33 Glossary/Acronyms References & Endnotes Acknowledgements Back Cover
COVER 1 2 3 4 5 6 7 8 9 10 11 12 13 14 15 16 17 18 19 20 21 22 23 24 25 26 27 28 29 30 31 32 33 Glossary/Acronyms References & Endnotes Acknowledgements Back Cover
DOES FOREST CERTIFICATION mAkE
A DIFFERENCE?Studies indicate that FSC certification has a positive impact on economic, ecological and social aspects of
forest management, but more research is needed.
While many studies describe benefits of forest certification (see box for some examples), measuring the impacts of forest certification presents many challenges. The majority of the studies are based on indirect approaches – not field-based assessments – and the few with primary data have faced challenges in attributing observed impacts to the certification intervention88. More well-structured studies are needed to fully evaluate the impact of FSC and other forest certification schemes.
Tropical forests in general An extensive study of Corrective Action Requests (CARs)89 looking at FSC-certified operations in natural tropical forests concludes that FSC certification has a positive impact particularly in the fields of: health and safety of employees and their families; management plans; monitoring; use of reduced-impact logging; and protection of rare, threatened species. The study found that the number of CARs given in certification assessments was decreasing over time, suggesting that companies have incorporated management activities that are in line with FSC requirements as standard best practice.
Borneo The Deramakot Forest Reserve (DFR) in Sabah, Borneo covers 55,000 hectares and was originally licensed for logging in 1956. In 1989, it was designated as a model site to develop sustainable forest management and all logging activities were suspended. A new management system with reduced-impact logging was implemented in 1995 and DFR was FSC certified in 1997. Studies comparing DFR with similar conventionally logged forests have shown DFR to be more effective in sustaining biodiversity90; it is one of the few areas in Sabah containing all five Bornean wild cat species, including the bay cat (Pardofelis badia) – one of the world’s rarest wild cats91. DFR is also estimated to have 54 tonnes more carbon per hectare stocked in the above-ground vegetation than the Tangkulap Forest Reserve (a conventional logging site)92.
Gabon A study from Gabon93 looking at the quality of wildlife management of forest concessionaires concluded that FSC-certified operations comply significantly better with national legislation and IUCN recommended best practices compared to non-certified companies.
BrazilIn plantation forestry in Brazil, FSC-certified operations performed substantially better on social and environmental aspects than non-certified companies94.
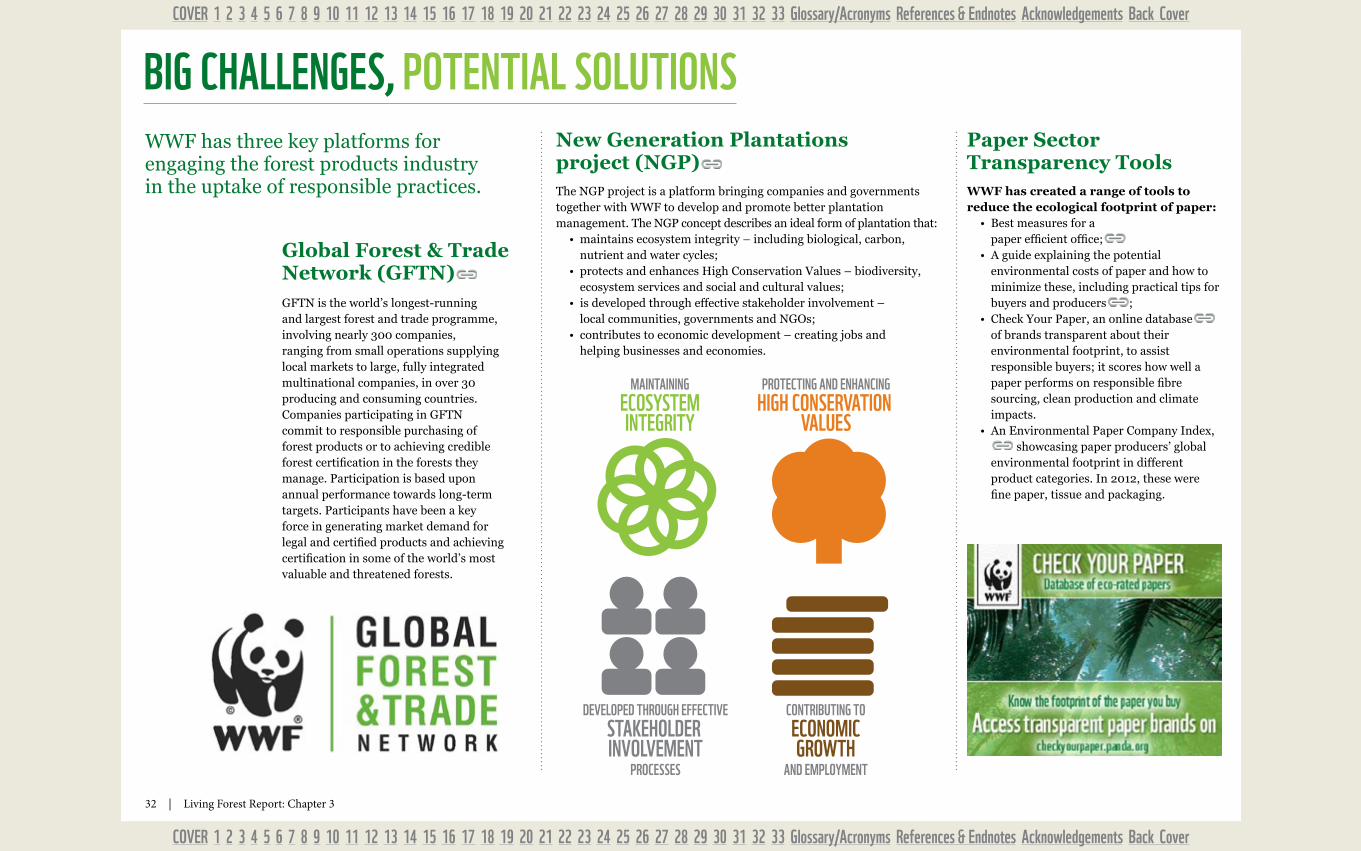
32 | Living Forest Report: Chapter 3
COVER 1 2 3 4 5 6 7 8 9 10 11 12 13 14 15 16 17 18 19 20 21 22 23 24 25 26 27 28 29 30 31 32 33 Glossary/Acronyms References & Endnotes Acknowledgements Back Cover
COVER 1 2 3 4 5 6 7 8 9 10 11 12 13 14 15 16 17 18 19 20 21 22 23 24 25 26 27 28 29 30 31 32 33 Glossary/Acronyms References & Endnotes Acknowledgements Back Cover
32 | Living Forest Report: Chapter 3
Global Forest & Trade Network (GFTN) GFTN is the world’s longest-running and largest forest and trade programme, involving nearly 300 companies, ranging from small operations supplying local markets to large, fully integrated multinational companies, in over 30 producing and consuming countries. Companies participating in GFTN commit to responsible purchasing of forest products or to achieving credible forest certification in the forests they manage. Participation is based upon annual performance towards long-term targets. Participants have been a key force in generating market demand for legal and certified products and achieving certification in some of the world’s most valuable and threatened forests.
WWF has created a range of tools to reduce the ecological footprint of paper:
• Best measures for a paper efficient office;
• A guide explaining the potential environmental costs of paper and how to minimize these, including practical tips for buyers and producers ;
• Check Your Paper, an online database of brands transparent about their environmental footprint, to assist responsible buyers; it scores how well a paper performs on responsible fibre sourcing, clean production and climate impacts.
• An Environmental Paper Company Index, showcasing paper producers’ global
environmental footprint in different product categories. In 2012, these were fine paper, tissue and packaging.
bIG CHALLENGES, POTENTIAL SOLUTIONS
MAINTAININGECOSYSTEMINTEGRITY
PROTECTING AND ENHANCINGHIGH CONSERVATION
VALUES
DEVELOPED THROUGH EFFECTIVESTAKEHOLDER INVOLVEMENT
PROCESSES
CONTRIBUTING TOECONOMICGROWTH
AND EMPLOYMENT
WWF has three key platforms for engaging the forest products industry in the uptake of responsible practices. The NGP project is a platform bringing companies and governments
together with WWF to develop and promote better plantation management. The NGP concept describes an ideal form of plantation that:
• maintains ecosystem integrity – including biological, carbon, nutrient and water cycles;
• protects and enhances High Conservation Values – biodiversity, ecosystem services and social and cultural values;
• is developed through effective stakeholder involvement – local communities, governments and NGOs;
• contributes to economic development – creating jobs and helping businesses and economies.
New Generation Plantations project (NGP)
Paper Sector Transparency Tools
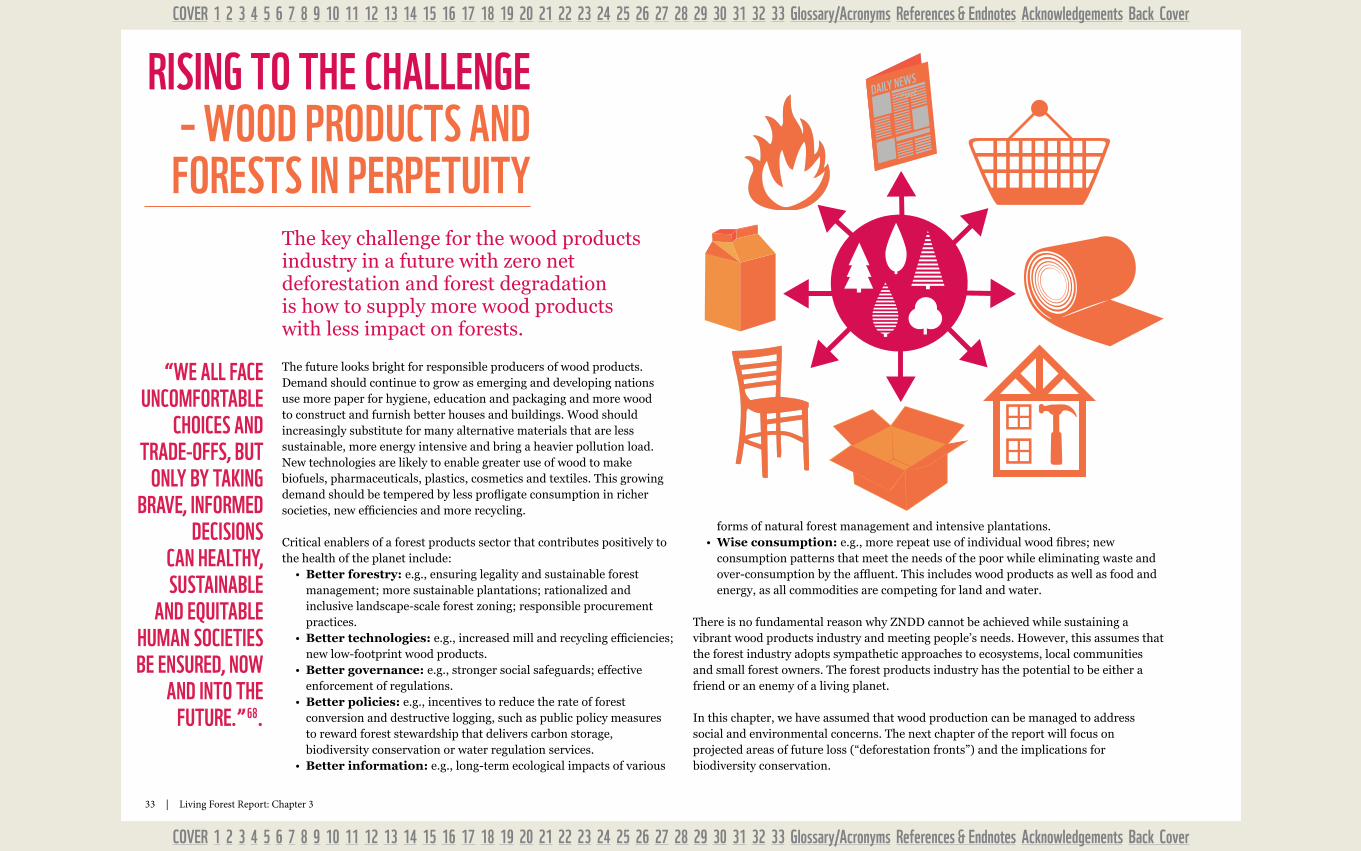
33 | Living Forest Report: Chapter 3
COVER 1 2 3 4 5 6 7 8 9 10 11 12 13 14 15 16 17 18 19 20 21 22 23 24 25 26 27 28 29 30 31 32 33 Glossary/Acronyms References & Endnotes Acknowledgements Back Cover
COVER 1 2 3 4 5 6 7 8 9 10 11 12 13 14 15 16 17 18 19 20 21 22 23 24 25 26 27 28 29 30 31 32 33 Glossary/Acronyms References & Endnotes Acknowledgements Back Cover
The key challenge for the wood products industry in a future with zero net deforestation and forest degradation is how to supply more wood products with less impact on forests.
The future looks bright for responsible producers of wood products. Demand should continue to grow as emerging and developing nations use more paper for hygiene, education and packaging and more wood to construct and furnish better houses and buildings. Wood should increasingly substitute for many alternative materials that are less sustainable, more energy intensive and bring a heavier pollution load. New technologies are likely to enable greater use of wood to make biofuels, pharmaceuticals, plastics, cosmetics and textiles. This growing demand should be tempered by less profligate consumption in richer societies, new efficiencies and more recycling.
Critical enablers of a forest products sector that contributes positively to the health of the planet include:
• Better forestry: e.g., ensuring legality and sustainable forest management; more sustainable plantations; rationalized and inclusive landscape-scale forest zoning; responsible procurement practices.
• Better technologies: e.g., increased mill and recycling efficiencies; new low-footprint wood products.
• Better governance: e.g., stronger social safeguards; effective enforcement of regulations.
• Better policies: e.g., incentives to reduce the rate of forest conversion and destructive logging, such as public policy measures to reward forest stewardship that delivers carbon storage, biodiversity conservation or water regulation services.
• Better information: e.g., long-term ecological impacts of various
forms of natural forest management and intensive plantations.• Wise consumption: e.g., more repeat use of individual wood fibres; new
consumption patterns that meet the needs of the poor while eliminating waste and over-consumption by the affluent. This includes wood products as well as food and energy, as all commodities are competing for land and water.
There is no fundamental reason why ZNDD cannot be achieved while sustaining a vibrant wood products industry and meeting people’s needs. However, this assumes that the forest industry adopts sympathetic approaches to ecosystems, local communities and small forest owners. The forest products industry has the potential to be either a friend or an enemy of a living planet.
In this chapter, we have assumed that wood production can be managed to address social and environmental concerns. The next chapter of the report will focus on projected areas of future loss (“deforestation fronts”) and the implications for biodiversity conservation.
“WE ALL FACE UNCOmFORTAbLE
CHOICES AND TRADE-OFFS, bUT
ONLy by TAkING bRAVE, INFORmED
DECISIONS CAN HEALTHy, SUSTAINAbLE
AND EqUITAbLE HUmAN SOCIETIES bE ENSURED, NOW
AND INTO THE FUTURE.” 68.
RISING TO THE CHALLENGE – WOOD PRODUCTS AND
FORESTS IN PERPETUITy
DAILY NEWS
DAILY NEWS
34 | Living Forest Report: Chapter 3
COVER 1 2 3 4 5 6 7 8 9 10 11 12 13 14 15 16 17 18 19 20 21 22 23 24 25 26 27 28 29 30 31 32 33 Glossary/Acronyms References & Endnotes Acknowledgements Back Cover
COVER 1 2 3 4 5 6 7 8 9 10 11 12 13 14 15 16 17 18 19 20 21 22 23 24 25 26 27 28 29 30 31 32 33 Glossary/Acronyms References & Endnotes Acknowledgements Back Cover
Agroforestry: ecologically-based natural resources management system that, through the integration of trees on farms and in the agricultural landscape, diversifies and sustains production for increased social, economic and environmental benefits for land users at all levels .
Bioenergy: energy derived from biomass, which can be used to generate electricity, supply heat and as a liquid biofuel.
Bioenergy Plus scenario: a scenario of the Living Forests Model where bioenergy feedstock demand is based on the “global 2ºC scenario” derived from the POLES (Prospective Outlook for the Long-term Energy System) model .
Biomass: biological material derived from living or recently living organisms, such as wood and other crops. Biomass may also include biodegradable wastes that can be burnt as fuel. It excludes fossilized organic material which has been transformed by geological processes into substances such as coal or petroleum.
Cellulose: the basic structural component of plant cell walls, cellulose comprises about 33 per cent of all vegetable matter and is the most abundant of all naturally occurring organic compounds. Not digestible by humans, cellulose is a food for herbivorous animals (e.g., cows, horses), is processed to produce papers and fibres, and is chemically modified to yield substances used in the manufacture of such items as plastics, photographic films, etc.
Container board: container board is a type of light-weight paperboard specially manufactured for the production of corrugated board (formed by gluing one or more fluted sheets of paperboard to one or more flat sheet). It is typically used in the packaging of large materials.
Diet Shift scenario: a scenario of the Living Forests Model where the total global consumption of animal calories is maintained at the 2010 global average with convergence in per capita consumption across regions (i.e., those now below the global average consume more in the future, while those now above the global average consume less).
Do Nothing Scenario: A Living Forests Model projection of what the world could look like if our behaviour continues in line with historical trends. The Do Nothing Scenario anticipates land-use change due to: (a) demands for land to supply a growing global human population with food, fibre and fuel; and (b) continuation of historical patterns of poorly planned and governed exploitation of forest resources. Key assumptions in this scenario are:
• By 2050, world population reaches 9.1 billion and per-capita GDP almost triples.
• Demand for commodities is driven by changes in affluence (measured by GDP) and human population growth.
• Aggregate historical trends in agricultural productivity gains continue.• The average human diet in a country changes according to historically
observed relationships with per-capita GDP.• Forestry and agricultural production does not expand into protected
areas, but unprotected natural habitats can be managed for production of timber or converted to timber plantations, cropland and pasture.
• Total primary energy use from land-based biomass feedstocks doubles between 2010 and 2050 due to projected energy demand and the competitiveness of bioenergy technologies and supply chains.
Energy wood: woody biomass that is not used for household fuelwood or the production of wood-based products.
FAO: Food and Agriculture Organization of the United Nations
Fibre: cellulose-filled cells that are extracted from biological material (e.g., wood, bamboo, agricultural residues) and used to manufacture a variety of products, including paper.
Fuelwood: roundwood that will be used as fuel for purposes such as cooking, heating or power production. It includes wood harvested for fuel from main stems, branches and other parts of trees and wood that will be used for charcoal production (e.g., in pit kilns and portable ovens). It also includes wood chips to be used for fuel that are made directly (i.e. in the forest) from roundwood.
GHG: greenhouse gas
Growing stock: volume of wood in all living trees in a given area that have more than a specified diameter at breast height (or above buttress if these are higher). Includes the stem from ground level or stump height up to a specified top diameter, and may also include branches above a specified minimum diameter .
High Conservation Value (HCV): an exceptional or critical ecological attribute, ecosystem service or social function of forests and other biomes, defined by the FSC as follows: HCV1 – Species diversity: Concentrations of biological diversity including endemic species, and rare, threatened or endangered species, that are significant at global, regional or national levels.
GLOSSARy, NOTES AND ACRONymS
35 | Living Forest Report: Chapter 3
COVER 1 2 3 4 5 6 7 8 9 10 11 12 13 14 15 16 17 18 19 20 21 22 23 24 25 26 27 28 29 30 31 32 33 Glossary/Acronyms References & Endnotes Acknowledgements Back Cover
COVER 1 2 3 4 5 6 7 8 9 10 11 12 13 14 15 16 17 18 19 20 21 22 23 24 25 26 27 28 29 30 31 32 33 Glossary/Acronyms References & Endnotes Acknowledgements Back Cover
HCV 2 – Landscape-level ecosystems and mosaics: Large landscape-level ecosystems and ecosystem mosaics that are significant at global, regional or national levels, and that contain viable populations of the great majority of the naturally occurring species in natural patterns of distribution and abundance. HCV 3 – Ecosystems and habitats: Rare, threatened or endangered ecosystems, habitats or refugia. HCV 4 – Critical ecosystem services: Basic ecosystem services in critical situations, including protection of water catchments and control of erosion of vulnerable soils and slopes. HCV 5 – Community needs: Sites and resources fundamental for satisfying the basic necessities of local communities or indigenous peoples (for example for livelihoods, health, nutrition, water), identified through engagement with these communities or indigenous peoples. HCV 6 - Cultural values: Sites, resources, habitats and landscapes of global or national cultural, archaeological or historical significance, and/or of critical cultural, ecological, economic or religious/sacred importance for the traditional cultures of local communities or indigenous peoples, identified through engagement with these local communities or indigenous peoples .
Industrial roundwood: all harvested wood (saw logs, veneer logs and pulpwood) suitable for processing into wood products, and excluding wood used directly as fuelwood.
Intensively managed plantations: plantations of introduced and/or native tree species established through planting or seeding for rapid production of biomass (5 to 25 years).
Living Forests Model: developed for WWF by the International Institute for Applied Systems Analysis (IIASA ) the model draws on G4M and GLOBIOM models to show geographically explicit land-use change under different scenarios. The G4M model projects future deforestation and land-use change by extrapolating from historical trends and taking into account future projections for population, GDP and infrastructure. GLOBIOM is an economic model that allocates land and resources optimally based on projected commodity and ecosystem service demands under future GDP, population and policy scenarios.
Market pulp: pulp that is produced in one location, from virgin or recycled fibre, dried and shipped to another location for further processing to make paper and paperboard.
Non-timber forest product (NTFP): a product of biological origin other than wood derived from forests, other wooded land and trees outside forests . NTFP refers to all the resources/products (other than industrial roundwood and derived sawn timber, wood chips, wood-based panels and pulp) that may be extracted from forest ecosystems and are used within the household or are marketed or have social, cultural or religious significance. These include plants and plant materials used for food, fuel, storage and fodder, medicine, wrapping materials and bio-chemicals, as well as animals .
Non-wood fibre: cellulose-filled cells that are extracted from biological material other than wood (e.g., bamboo, agricultural residues) and used to manufacture a variety of products including paper.
Panels and panel product: a range of materials (e.g., plywood, particleboard or fibreboard) typically formed into sheets from particles, fibres or veneers, made from industrial roundwood or recovered fibre/wood.
Paper: material mainly used for writing or printing upon or for packaging, as well as for tissue products, that is produced by pressing together moist fibres, typically derived from pulpwood, fibre crops or recovered paper, and drying them into flexible sheets.
Paperboard: a relatively stiff, heavy material, thicker than paper, that is produced by pressing together moist fibres, typically derived from pulpwood, fibre crops or recovered paper, and drying them into thick sheets.
PEFC: Programme for the Endorsement of Forest Certification, a major certification organization.
Production forest: forest area designated primarily for production of wood, fibre, bioenergy and/or non-timber forest products .
Pro-Nature scenarios: scenarios (Pro-Nature and Pro-Nature Plus) of the Living Forests Model which project that the remaining natural ecosystems are conserved (i.e., no further conversion of these ecosystems to cropland, grazing land, plantations or urban settlement) in areas identified as important for biodiversity by three separate conservation mapping processes using a UNEP World Conservation Monitoring Centre (UNEP-WCMC) dataset. These scenarios assume that current land uses (e.g., cropland or forestry) in these areas remain constant and continue to produce food or wood .
GLOSSARy, NOTES AND ACRONymS
36 | Living Forest Report: Chapter 3
COVER 1 2 3 4 5 6 7 8 9 10 11 12 13 14 15 16 17 18 19 20 21 22 23 24 25 26 27 28 29 30 31 32 33 Glossary/Acronyms References & Endnotes Acknowledgements Back Cover
COVER 1 2 3 4 5 6 7 8 9 10 11 12 13 14 15 16 17 18 19 20 21 22 23 24 25 26 27 28 29 30 31 32 33 Glossary/Acronyms References & Endnotes Acknowledgements Back Cover
Protected area: a clearly defined geographical space that is recognized, dedicated and managed through legal or other effective means in order to achieve the long-term conservation of nature with associated ecosystem services and cultural values .
Pulp: a material prepared by chemically or mechanically extracting cellulose fibres from pulpwood, fibre crops or recovered paper.
Pulpwood: industrial roundwood that will be used for the production of pulp, particleboard or fibreboard. It includes roundwood (with or without bark) that will be used for these purposes in its round form or as split wood or wood chips made directly (i.e. in the forest) from roundwood. It does not include by-products from the sawmill.
Recovered paper/wood: fibre, paper and wood from unused material, collected waste and manufacturing waste. It can be divided into pre-consumer and post-consumer recovered paper/wood.
Recovery rate: percentage of usable recycled materials that have been removed from waste generated in a specific area or by a specific industry.
Recycled fibre: fibre made from processing recovered paper or wood.
REDD+: A package of actions aimed at (1) reducing emissions from deforestation and forest degradation (REDD) in developing countries; (2) conservation and sustainable management of forests; and (3) enhancement of forest carbon stocks.
Roundwood: All wood felled or otherwise harvested and removed.
Saw logs: Roundwood that will be sawn (or chipped) lengthways for the manufacture of sawn wood.
Sawn wood: planks or boards mechanically sawn from saw logs.
Target scenario: a scenario of the Living Forests Model where ZNDD (with near zero gross rate of loss of natural and semi-natural forest) is achieved by 2020 and maintained at that level indefinitely .
Veneer logs: roundwood that will be used for the production of veneer (a thin facing layer of wood) mainly by peeling or slicing.
Virgin wood fibres: wood fibre used for the first time in the manufacture of paper or other products.
WBCSD: the World Business Council for Sustainable Development .
Well-managed natural forests: natural and semi-natural forests managed in an economically viable, socially equitable and environmentally sustainable way that maintains biodiversity and ecosystem services. The FSC elaborates this further with 10 principles .
Wood: the hard fibrous material that forms the main substance of the trunk or branches of a tree or shrub.
Wood-based biomaterials: materials synthesized from wood fibre.
Wood fibre: cellulose-filled cells that are extracted from wood and used to manufacture a variety of products including paper. It covers both virgin wood fibre and fibre from recovered paper or wood.
Wood pulp: pulp made from virgin wood fibres.
Wood products: the wide range of products that are manufactured from industrial roundwood.
Zero Net Deforestation and Forest Degradation (ZNDD): WWF defines ZNDD as no net forest loss through deforestation and no net decline in forest quality through degradation. ZNDD provides some flexibility: it is not quite the same as no forest clearing anywhere, under any circumstances. For instance, it recognizes people’s right to clear some forests for agriculture, or the value in occasionally “trading off” degraded forests to free up other land to restore important biological corridors, provided that biodiversity values and net quantity and quality of forests are maintained. In advocating ZNDD by 2020, WWF stresses that: (a) most natural forest should be retained — the annual rate of loss of natural or semi-natural forests should be reduced to near zero; and (b) any gross loss or degradation of pristine natural forests would need to be offset by an equivalent area of socially and environmentally sound forest restoration. In this accounting, plantations are not equated with natural forests as many values are diminished when a plantation replaces a natural forest.
GLOSSARy, NOTES AND ACRONymS
37 | Living Forest Report: Chapter 3
COVER 1 2 3 4 5 6 7 8 9 10 11 12 13 14 15 16 17 18 19 20 21 22 23 24 25 26 27 28 29 30 31 32 33 Glossary/Acronyms References & Endnotes Acknowledgements Back Cover
COVER 1 2 3 4 5 6 7 8 9 10 11 12 13 14 15 16 17 18 19 20 21 22 23 24 25 26 27 28 29 30 31 32 33 Glossary/Acronyms References & Endnotes Acknowledgements Back Cover
1 For details of the living Forests Model, see taylor, r. (ed). 2011a. Chapter 1: Forests for a living Planet in Living Forests Report. wwF, Gland, Switzerland. wwf.panda.org/livingforests
2 Fao. 2010. Global Forest Resources Assessment 2010: Main Report, Fao Forestry Paper 163, Fao, rome
3 wwF. 2012. Living Planet Report 2012: Biodiversity, biocapacity and better choices. wwF, Gland, Switzerland
4 Poyry. 2012. Future from Fibre, From Forest to Finished Product. technical report for wBCSd/wwF, Gland, Switzerland
5 Ibid.
6 Bribián, I.Z., Capilla, a.V. and a.a. Usón. 2011. life cycle assessment of building materials: Comparative analysis of energy and environmental impacts and evaluation of the eco-efficiency improvement potential. Building and Environment, 46(5):1133-1140
7 thompson, r.C., Moore, C.J., vom Saal, F.S. and S.H. Swan. 2009. Plastics, the environment and human health: current consensus and future trends. Phil. Trans. R. Soc. B, 364(1526):2153-2166
8 Poyry, op. cit.
9 Von Falkenstein, E., wellenreuther, F. and a. detzel. 2010. lCa studies comparing beverage cartons and alternative packaging: can overall conclusions be drawn? International Journal of Life Cycle Assessment, doI 10.1007/s11367-010-0218-x
10 Quercus suber L
11 PricewaterhouseCoopers/ECoBIlan 2008. Evaluation of the environmental impacts of Cork Stoppers versus Aluminium and Plastic Closures. www.corkfacts.com/pdffiles/Amorim_LCA_Presentation.pdf
12 Pereira, C. and Gil, l. 2006. the Problem of Cork taint in Cork Stoppers and the Process for their Elimination/reduction. Silva Lus. [online] 14(1):101-111. ISSn 0870-6352.
13 www.woodrecyclers.org/recycleintro.php
14 www.epa.gov/osw/nonhaz/municipal/index.htm
15 See: faostat.fao.org/site/626/desktopdefault.aspx?PageId=626#ancor
16 Fao. 2011. State of the World’s Forests 2011.
17 taylor, r. (ed). 2011b. Chapter 2: Forests & Energy in Living Forests Report. wwF, Gland, Switzerland. wwf.panda.org/livingforests
18 obersteiner, M. et al. 2001. Managing climate risk [3]. Science 294:786–787
19 the living Forest Model does not attempt to project volumes of “other industrial roundwood”. this table uses reported volumes of “other industrial roundwood” for 2010 (source: Fao 2011. State of the World’s Forests 2011. Fao, rome) as a constant for 2030 and 2050 projections.
20 See: faostat.fao.org/site/626/default.aspx#ancor
21 Along with pulpwood, the 40 per cent figure includes offcuts and sawdust from saw logs used in pulp production. Fao. 2011. State of the World’s Forests 2011 (Chapter 2); and statistic of Fao 2010, faostat.fao.org
22 Fao. 2011. State of the World’s Forests 2011.
23 Zhao, H. 2012. Outlook for Global Recovered Paper – March 2012. rISI
24 Poyry, op. cit.
25 Fao. 2011. Highlights on paper and paperboard: 1999-2009. Fao, rome
26 Poyry, op. cit.
27 Fao. 2011. State of the World’s Forests 2011 (Chapter 2)
28 Fao statistics: faostat.fao.org/site/626/default.aspx#ancor
29 Fao. 2010. Forest statistic: faostat.fao.org/site/626/default.aspx#ancor
30 Fao. 2011. Highlights on wood pulp and other fibre furnish: 1999-2009. Fao, rome
31 dr Hans-Peter Sollinger, Voith Paper, personal communication, 17 February 2010
32 tissueworldmagazine.com/11_octnov/market_issues.php
33 See: faostat.fao.org/site/626/default.aspx#ancor
34 dr Hans-Peter Sollinger, Voith Paper, personal communication, 17 February 2010
35 Fao. 2011. State of the World’s Forests 2011 (table 1 and table 5)
36 Environmental Paper network. 2011. The State of the Paper Industry 2011: Steps Toward an Environmental Vision. asheville, USa. www.environmentalpaper.org/state-of-the-paper-industry-2011.php
37 Enters, t. 2001. Trash or treasure? Logging and mill residues in Asia and the Pacific. FAO Regional Office for Asia and the Pacific, Bangkok. www.fao.org/doCrEP/003/X6966E/X6966E02.htm
38 Ibid.
39 Fao. 2010. Global Forest Resources Assessment, p.37.
40 Ibid., pp 11 and 35
41 Ibid., p.35
42 data calculated from: Fao. 2011. State of the World’s Forests and Fao. 2009. State of the World’s Forests 2009, Fao, rome; see table 3 at: ftp://ftp.fao.org/docrep/fao/011/i0350e/i0350e04c.pdf Calculation based upon total growing stock per country which is reported as “commercial”. note that not all countries reported data, hence 165 billion is a minimum figure.
43 Fao. 2011. State of the World’s Forests, table 5.10., p.101
44 Fao. 2003. World Agriculture: Towards 2015/2030. An FAO perspective. Fao, rome
45 www.fao.org/forestry/fra/62219/en
46 taylor, r. (ed) 2011a. op. cit., p.23.
47 Fao. 2010. Managing forests for climate change, pp 10-11. Fao, rome, www.fao.org/docrep/013/i1960e/i1960e00.pdf
48 Putz, F.E., Zuidema, P.a., Synnott, t., Peña-Claros, M., Pinard, M.a., Sheil, d., Vanclay, J.k., Sist, P., Gourlet-Fleury, S., Griscom, B., Palmer, J. and r. Zagt. 2012. Sustaining conservation values in selectively logged tropical forests: the attained and the attainable. Conservation Letters. doI: 10.1111/j.1755-263X.2012.00242.x
49 Zimmerman, B.l. and kormos, C.F. 2012. Prospects for sustainable logging in tropical forests. Bioscience 62(5):479-487
50 Ibid.
REFERENCES AND ENDNOTES
38 | Living Forest Report: Chapter 3
COVER 1 2 3 4 5 6 7 8 9 10 11 12 13 14 15 16 17 18 19 20 21 22 23 24 25 26 27 28 29 30 31 32 33 Glossary/Acronyms References & Endnotes Acknowledgements Back Cover
COVER 1 2 3 4 5 6 7 8 9 10 11 12 13 14 15 16 17 18 19 20 21 22 23 24 25 26 27 28 29 30 31 32 33 Glossary/Acronyms References & Endnotes Acknowledgements Back Cover
51 olsson, r. 2011. To Manage or Protect? air Pollution and Climate Series number 26. air Pollution and Climate Secretariat, Göteborg, Sweden
52 Sampson, n. 2003. timber, Fuel, and Fiber (Chapter 9), in Bystriakova, n., Brown, S., Gonzalez, P., Irland, l.C., kauppi, P., Sedjo, r. and I.d. thompson. Ecosystems and human well-being: Current states and trends. www.maweb.org/documents/document.278.aspx.pdf
53 www.unep.org/bpsp/Forestry/Forestry%20Case%20Studies/Cameroon.pdf
54 See for example: www.globalwitness.org/campaigns/environment/forests/forests-and-climate-change/reducing-emissions-deforestation-and-forest-degradation-redd
55 Blaser, J., Sarre, a., Poore, d. and S. Johnson. 2011. Status of tropical forest management 2011. Itto technical Series no 38, the International tropical Timber Organization. www.itto.int/direct/topics/topics_pdf_download/topics_id=2660&no=0&disp=inline
56 rrI. 2012. What Rights? A Comparative Analysis of Developing Countries’ National Legislation on Community and Indigenous Peoples’ Forest Tenure Rights. rights and resources Initiative, washington dC. www.rightsandresources.org/publication_details.php?publicationID=4924; and rrI. 2012. Respecting Rights, Delivering Development: Forest Tenure Reform since Rio 1992. rights and resources Initiative, washington dC. www.rightsandresources.org/publication_details.php?publicationID=4935
57 Chhatre, a. and agarwal, a. 2009. trade-offs and synergies between carbon storage and livelihood benefits from forest commons. PNAS 106(42):17667-17670. www.pnas.org/cgi/doi/10.1073/pnas.0905308106
58 taylor, r. (ed) 2011a. op. cit., p.23
59 Jagels, r. 2006. Management of wood properties in planted forests: a paradigm for global forest production. Fao working paper. ftp://ftp.fao.org/docrep/fao/009/j8289e/j8289e.pdf
60 kanowski, P. and Murray, H. 2008. Intensively Managed Planted Forests. Toward best practice. tFd review, the Forests dialogue, new Haven, USa
61 Bracelpa. 2011. Brazilian Pulp And Paper Industry. Brazilian Pulp and Paper association (Bracelpa). www.bracelpa.org.br/eng/estatisticas/pdf/booklet/booklet.pdf
62 Principle 15 of the rio declaration on Environment and development, www.unep.org/documents.Multilingual/default.asp?documentid=78&articleid=1163
63 due to uncertainty over potential gains from new technology, the model assumes zero growth in input-neutral productivity. In other words, it assumes current best technologies and practices (e.g. better use of fertilizer, irrigation, pest control, quality seed etc.) will become more widely practised but does not try to predict new technology (e.g. genetic modification or other future technologies deployed to boost yields).
64 Gamborg, C. and Sandøe, P. 2010. Ethical considerations regarding genetically modified trees. In: El-Kassaby, Y. (ed) Forests and genetically modified trees, pp 163–176. IUFro and Fao. www.fao.org/docrep/013/i1699e/i1699e00.htm
65 doering, d.S. 2004. will the marketplace see the see the sustainable forest for the transgenic trees?. In: Strauss, S.H. and Bradshaw, H.d. (eds) The bioengineered forest, pp 112–140. resources for the Future, washington dC
66 Boyd, E. 2010. Societal Choice for Climate Change Futures: trees, Biotechnology, and Clean development. BioScience 60:742–750
67 kanowski, P. 2011. Genetically-Modified Trees: Opportunities For Dialogue. the Forests dialogue, p. 7. environment.yale.edu/tfd/uploads/tFd%20ScopingPaper%20GMtrees(1).pdf
68 See the United nations declaration on the rights of Indigenous People (www.un.org/esa/socdev/unpfii/documents/DRIPS_en.pdf) and also The Forests dialogue (undated) Initiative on Free, Prior and Informed Consent. environment.yale.edu/tfd/uploads/TFD_FPIC_Concept_note.pdf
69 taylor, r. (ed) 2011a. op. cit., p.22.
70 the global land Cover 2000 map (bioval.jrc.ec.europa.eu/products/glc2000/glc2000.php) was used to identify existing forests. the IIaSa G4M biophysical model was used to identify areas where forests could occur. this was based on climate variables (temperature and precipitation) from www.worldclim.org and soil characteristics from the Harmonised world Soil database (www.iiasa.ac.at/research/lUC/External-world-soil-database/HtMl/index.html). this data was used to estimate the potential above-ground net primary production (nPP) of a given area, i.e. the net accumulation of carbon in above-ground biomass per hectare per year. the range of potential forms of vegetation (from desert through grassland, shrubland, to forest) that a given area could potentially support was based on conservative estimates of nPP thresholds for each vegetation type.
71 lawson, S. and MacFaul, l. 2010. Illegal Logging and Related Trade Indicators of the Global Response. Chatham House, london
72 UnECE/Fao. 2011. Forest Products Annual Market Review, 2010-2011, Geneva timber and Forest Study Paper 27, ECE/tIM/SP/27. www.unece.org/fileadmin/DAM/publications/timber/FPAMR_2010-2011_HQ.pdf
73 lawson, S and MacFaul, l. op. cit.; and white, G. 2010. Exporting in a Shifting Legal Landscape. Global Forest & trade network, wwF, Gland, Switzerland
74 ec.europa.eu/environment/forests/timber_regulation.htm
75 lawson, S. and MacFaul, l. op. cit.
76 Itto. 2012. Draft Report – Timber Tracking Technologies – Review of Electronic and Semi-Electronic Timber Tracking Technologies and Case Studies. www.itto.int/files/user/pdf/Meeting%20related%20documents/timber%20tracking%20review.pdf
77 Ministerial Conference for the Protection of Forests in Europe. 2002. Improved Pan-European Indicators for Sustainable Forest Management as adopted by the MCPFE Expert Level Meeting, 7-8 October 2002. MCPFE liaison Unit, Vienna
78 www.itto.int/sustainable_forest_management
79 Purbawiyatna, A. and Simula, A. 2008. Developing Forest Certification; Towards increasing the comparability and acceptance of forest certification systems worldwide. ITTO Technical Series No 29, ITTO. www.itto.int/direct/topics/topics_pdf_download/topics_id=40920000&no=1&disp=inline
80. UnECE/Fao. op. cit., p.99
81 Cashore, B., Egan, E., auld, G. and d. newsom. 2007. revising theories of non-State Market-driven (nSMd) Governance: lessons from the Finnish Forest Certification Experience. Global Environmental Politics 7(1)
REFERENCES AND ENDNOTES
39 | Living Forest Report: Chapter 3
COVER 1 2 3 4 5 6 7 8 9 10 11 12 13 14 15 16 17 18 19 20 21 22 23 24 25 26 27 28 29 30 31 32 33 Glossary/Acronyms References & Endnotes Acknowledgements Back Cover
COVER 1 2 3 4 5 6 7 8 9 10 11 12 13 14 15 16 17 18 19 20 21 22 23 24 25 26 27 28 29 30 31 32 33 Glossary/Acronyms References & Endnotes Acknowledgements Back Cover
82 wwF. 2011. wwF statement on the PEFC international standards launched in November 2010.awsassets.panda.org/downloads/wwf_statement_on_pefc_standards_march_2011.pdf and WWF. 2010. Forest certification. awsassets.panda.org/downloads/wwf_forest_certification_pp_oct07.pdf; and Ford, J. and Jenkins, a. 2011. on the Ground – the controversies of PEFC and SFI. Climate for Ideas, Forests of the world, dogwood alliance, Hnutí dUHa (Friends of the Earth Czech republic), les amis de la terre (Friends of the Earth France), Greenpeace, Sierra Club of British Columbia, Suomen luonnonsuojeluliitto, netherlands Centre for Indigenous Peoples. www.greenpeace.org/international/Global/international/publications/forests/on%20The%20Ground%2017_10_11.pdf
83 FSC figures from www.fsc.org/facts-figures.19.htm accessed, October 2012, and PEFC figures from www.pefc.org/about-pefc/who-we-are/facts-a-figures, accessed October 2012. Note the PEFC figures include areas certified under the Sustainable Forestry Initiative (SFI) and Canadian Standards association (CSa).
84 ibid.
85 ibid.
86 UnECE/Fao 2011. op. cit., p.101.
87 ibid.
88 romero, C. (in review). taking Stock of the Impacts of Forest Management Certification. PROFOR-World Bank
89 Peña-Claros, M. et al. 2009. Assessing the progress made: An evaluation of forest management certification in the tropics. wageningen Ur, netherlands. www.illegal-logging.info/uploads/March10assessingtheprogressforestmgtintropics.pdf
90 Imai, N., Samejima, H., Langner, A., Ong, R.C., Kita, S. et al. 2009. Co-Benefits of Sustainable Forest Management in Biodiversity Conservation and Carbon Sequestration. PLoS ONE 4(12): 8267. doi:10.1371/journal.pone.0008267
91 Azlan, M. et al. 2009. Records of five Bornean cat species from Deramakot Forest reserve in Sabah, Malaysia. CATnews 51. www.cloudedleopard.org/Documents/Mohamed_et_al_Cat_News_51.pdf
92 Seino, t., takyu, M., aiba, S.-I., kitayama, k. and r.C. ong. 2006. landscape-level evaluation of carbon and biodiversity in the tropical rain forests of deramakot Forest reserve, Sabah, Malaysia. Second Workshop on Synergy between carbon management and biodiversity conservation in tropical rain forests, 5:1. www.mendeley.com/research/landscapelevel-evaluation-carbon-biodiversity-tropical-rain-forests-deramakot-forest-reserve-sabah-malaysia
93 rayden, r. at al. 2010. Evaluation of the management of wildlife in the forestry concessions around the national parks of Lopé, Waka and Ivindo, Gabon. wCS. wcs-gabon.org/index.php?option=com_remository&Itemid=27&func=startdown&id=26&lang=fr
94 noveas keppe, a.l. et al. 2008. Impact assessment of FSC certification on forest companies in southern Brazil. Imaflora. ww2.imaflora.org/arquivos/Impact%20assessment%20of%20FSC%20certification%20on%20forest%20enterprises%20in%20southern%20Br1.pdf
95 wwF. 2012. Living Planet Report 2012: Biodiversity, biocapacity and better choices.
96 www.fao.org/forestry/tof/50667/en
97 For more information on the living Forests Model scenarios see wwf.panda.org/livingforests and in particular Chapter 2 on Forests & Energy. the PolES model is a global sectoral simulation model for the development of energy scenarios until 2050. See EC. 2011. a roadmap for moving to a competitive low carbon economy in 2050. Staff working document SEC 288. European Commission, Brussels. (http://eur-lex.europa.eu/lexUriServ/ lexUriServ.do?uri=CElEX:52011dC0112:En:not)
98 www.britannica.com/EBchecked/topic/101633/cellulose
99 Eurostat/Fao/Itto/UnECE. 2011. Joint Forest Sector Questionnaire definitions 2011. www.fao.org/forestry/7800-0db7b13ec95581687e7852a1d85e5b8b6.pdf
100 Adapted from FAO definition. See FAO. 2010. Forest Resource Assessment, annex 2. Fao, rome. www.fao.org/docrep/013/i1757e/i1757e13.pdf
101 FSC. 2011. Principles and Criteria for Forest Stewardship. vote.fsc.org/md.static/FSC-STD-01-001_V5-0_D5-0_EN_Explanatory_Notes+Rationales.pdf
102 www.iiasa.ac.at/research/For/globiom/forestry.html
103 kindermann, G.E., obersteiner, M., rametsteiner, E. and I. McCallum. 2006. Predicting the deforestation-trend under different carbon-prices. Carbon Balance and Management 1(1). www.scopus.com; and kindermann, G., M. obersteiner, Sohngen, B. et al. 2008. Global cost estimates of reducing carbon emissions through avoided deforestation. Proceedings of the National Academy of Sciences of the United States of America 105(30):10302-10307 and Havlík, P., Uwe, a., Schneider, E.S. et al. 2010. Global land-use implications of first and second generation biofuel targets. Energy Policy 4
104 www.fao.org/forestry/site/6388/en
105 wickens, G.E. 1992. Management issues for development of non-timber forest products. Unasylva, 42:165
106 Fao. 2010. Global Forest Resources Assessment, annex 2. www.fao.org/docrep/013/i1757e/i1757e13.pdf
107 taylor, r. (ed). 2011a. op. cit., pp. 10-11.
108 dudley, n. (ed). 2008. Guidelines for Applying Protected Area Management Categories. IUCn, Gland, Switzerland
109 Eurostat/Fao/Itto/UnECE. op. cit.
110 taylor, r. (ed.) 2011a. op. cit., p.7
111 www.wbcsd.org
112 See www.fsc.org/principles-and-criteria.34.htm for details
REFERENCES AND ENDNOTES
40 | Living Forest Report: Chapter 3
COVER 1 2 3 4 5 6 7 8 9 10 11 12 13 14 15 16 17 18 19 20 21 22 23 24 25 26 27 28 29 30 31 32 33 Glossary/Acronyms References & Endnotes Acknowledgements Back Cover
COVER 1 2 3 4 5 6 7 8 9 10 11 12 13 14 15 16 17 18 19 20 21 22 23 24 25 26 27 28 29 30 31 32 33 Glossary/Acronyms References & Endnotes Acknowledgements Back Cover
WWFWWF is one of the world’s largest and most experienced independent conservation organizations, with more than 5 million supporters and a global network active in over 100 countries. WWF’s mission is to stop the degradation of the planet’s natural environment and to build a future in which humans live in harmony with nature, by conserving the world’s biological diversity, ensuring that the use of renewable natural resources is sustainable, and promoting the reduction of pollution and wasteful consumption.
This report was produced in collaboration with:IIASAFounded in 1972, the International Institute for Applied Systems Analysis (IIASA) is an international research organization that conducts policy-oriented research into problems that are too large or too complex to be solved by a single country or academic discipline. IIASA is sponsored by its National Member Organizations in Africa, Asia, Europe and the Americas. It is independent and completely unconstrained by political or national self-interest. www.iiasa.ac.at
ContributorsEditor in Chief: Rod TaylorTechnical Editors: Nigel Dudley, Emmanuelle Neyroumande, Michael Obersteiner, Sue Stolton and George White
Thanks to colleagues at WWF including: Helma Brandlmaier, Rodrigo Catalan, Kerry Cesareo, Tim Cronin, Chiaki Furosawa, Keila Hand, Mutai Hashimoto, Nina Haase, Stefan Henningson, Per Larsson, László Máthé, Margareta Renstrom, Anke Schulmeister, Mustapha Seidu, Aurélie Shapiro, Luis Silva, Simone Stammbach, Gerald Steindlegger, Martha Stevenson, Julia Young.
Editorial Team: Gretchen Lyons, Barney Jeffries
With special thanks for review and contributions from: Mario Abreu (Tetra Pak); James Griffiths (WBCSD); Anders Hildeman (IKEA); Riikka Joukio (Metsä Group); Walter Kollert (FAO); Augusta Molnar (Rights and Resources Initiative); José Luciano Penido (Fibria); Jukka Tissari (FAO); Petri Vasara and Hannele Lehtinen (Pöyry Management Consulting).
IIASA’s modelling team: Michael Obersteiner, team leader; with Petr Havlik and Kentaro Aoki, Juraj Balkovic, Hannes Boettcher, Stefan Frank, Steffen Fritz, Sabine Fuss, Mykola Gusti, Mario Herrero, Nikolay Khabarov, Georg Kindermann, Florian Kraxner, Sylvain Leduc, Ian McCallum, Aline Mosnier, Erwin Schmid, Uwe Schneider, Rastislav Skalsky, Linda See and Hugo Valin.
This report makes use of the work of the International Institute for Applied Systems Analysis (IIASA) and has not undergone a full academic peer review. Views or opinions expressed in this report do not necessarily represent those of the Institute, its National Member Organizations or other organizations sponsoring the work. IIASA and its contributing authors will not be liable for damages of any kind arising from the use of this report.
Designed by Miller Design
WWF InternationalAvenue du Mont Blanc1196 Gland, Switzerlandwww.panda.org
ISBN 978-2-940443-32-1
Publication detailsPublished in December 2012 by WWF – World Wide Fund for Nature (Formerly World Wildlife Fund), Gland, Switzerland.
Any reproductions in full or in part of this publication must mention the title and credit the above-mentioned publisher as the copyright owner.
© Text and graphics: 2012 WWFAll rights reserved
The material and geographical designations in this report do not imply the expression of any opinion whatsoever on the part of WWF concerning the legal status of any country.
ACkNOWLEDGEmENTS
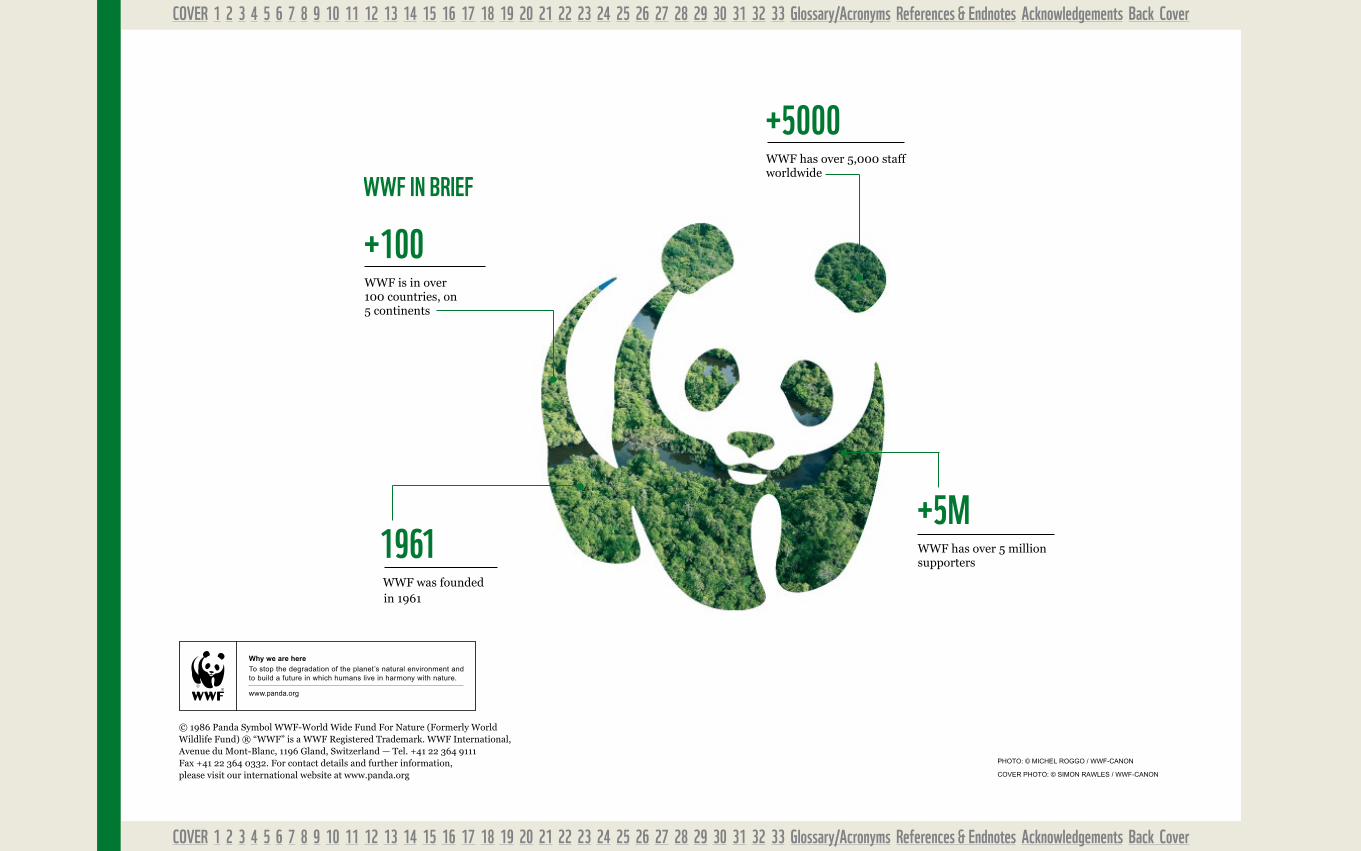
COVER 1 2 3 4 5 6 7 8 9 10 11 12 13 14 15 16 17 18 19 20 21 22 23 24 25 26 27 28 29 30 31 32 33 Glossary/Acronyms References & Endnotes Acknowledgements Back Cover
COVER 1 2 3 4 5 6 7 8 9 10 11 12 13 14 15 16 17 18 19 20 21 22 23 24 25 26 27 28 29 30 31 32 33 Glossary/Acronyms References & Endnotes Acknowledgements Back Cover
© 1986 Panda Symbol WWF-World Wide Fund For Nature (Formerly World Wildlife Fund) ® “WWF” is a WWF Registered Trademark. WWF International, Avenue du Mont-Blanc, 1196 Gland, Switzerland — Tel. +41 22 364 9111 Fax +41 22 364 0332. For contact details and further information, please visit our international website at www.panda.org
PHoto: © MICHEl roGGo / wwF-Canon
CoVEr PHoto: © SIMon rawlES / wwF-Canon
WWF IN bRIEF
+100WWF is in over 100 countries, on 5 continents
1961WWF was founded in 1961
+5000WWF has over 5,000 staff worldwide
+5mWWF has over 5 million supportersIf there is no URL
With URL - Regular
OR
Why we are here
To stop the degradation of the planet’s natural environment andto build a future in which humans live in harmony and nature.
Why we are here
www.panda.org
To stop the degradation of the planet’s natural environment andto build a future in which humans live in harmony with nature.