Embed Size (px)
Citation preview

Geochemistry of Construction Dewatering Discharge
Impacted by Freshly Poured Concrete
NAHYAN MUHAMMAD RANA
3A Earth and Environmental Sciences – Geosciences Specialization
University of Waterloo

UNIVERSITY OF WATERLOO
Faculty of Science
ENVIRONMENTAL FATE OF CONSTRUCTION DEWATERING DISCHARGE
IMPACTED BY CONCRETE
MMM Group Limited
Kitchener, Ontario
Nahyan Muhammad Rana
3A Environmental Science (Geosciences Specialization)
ID 20486918
August 28, 2015

130 Lincoln Road Waterloo, Ontario N2J 4N3 June 10, 2015 Mr. William Taylor, Department Chair, Department of Earth and Environmental Sciences, University of Waterloo N2J 3G1 Dear Mr. Taylor: This report, entitled “Environmental Fate of Construction Dewatering Discharge Impacted by Concrete” was prepared as my 3A work report for MMM Group Limited. This is my second work term report. The purpose of this report is to introduce and analyse the environmental problem and fate of construction dewatering discharge water that has been in contact with recently poured concrete. MMM Group Limited is a multidisciplinary consulting firm that provides a wide range of civil engineering and environmental engineering services which include, but are not limited to, hydrogeology, transport management, GIS services, environmental planning, water resource management, community design and infrastructure development. The Environmental Management Division, in which I was employed as a Hydrogeological Assistant, is managed by Peter Hayes. Our work consisted of working with clients to perform groundwater studies (surface water and groundwater monitoring), private water well surveys (water quality assessments), erosion and sediment control inspections, and apply for regulatory permits, including Ontario Ministry of the Environment and Climate Change Permit-To-Take-Water (MOECC PTTW) applications, amongst other activities. This report was written entirely by me and has not received any previous academic credit at this or any other institution. I would like to thank Mr. Peter van Driel (supervisor) for his support and guidance and for proof-reading my report. I received no other assistance. Sincerely,
Nahyan Rana 20486918

TABLE OF CONTENTS
1.0 Introduction .......................................................................................................................................... 1
2.0 Construction Dewatering .................................................................................................................... 2
3.0 Regulations ............................................................................................................................................ 4
4.0 Production of Cement and Concrete ................................................................................................ 5
5.0 Cement and carbonate Geochemistry ............................................................................................... 7
5.1 Geochemical Properties of Cement ..................................................................................... 7
5.2 carbonate-carbon dioxide-H2O System .............................................................................. 9
6.0 Natural Methods of Attenuation of High-pH Impacted Water .................................................. 11
6.1 Release to Surface Waters .................................................................................................... 11
6.2 Access to Free Atmospheric carbon dioxide .................................................................... 12
6.2 Re-infiltration to Ground/Groundwater .......................................................................... 14
7.0 Management Strategies/Technologies ............................................................................................ 17
8.0 Case Study: High-pH Discharge out of Sanitary Sewer Manholes in Road and Infrastructure
Construction Project ....................................................................................................................................... 19
9.0 Conclusion ........................................................................................................................................... 20
10.0 Recommendations .............................................................................................................................. 21
11.0 References ........................................................................................................................................... 22
12.0 Appendices .......................................................................................................................................... 23

LIST OF TABLES AND FIGURES
Table 1: Major compounds in Portland cement ............................................................................................ 8
Figure 1: Illustration of Construction Dewatering ........................................................................................ 3
Figure 2: Rotary Kiln ......................................................................................................................................... 6
Figure 3: Freshly Poured Concrete .................................................................................................................. 6
Figure 4: Summary of Concrete Production Process ................................................................................... 7
Figure 5: Stages of Hydration in Curing Process of Concrete .................................................................... 9
Figure 6: Carbonate Ionic Species vs. pH .................................................................................................... 11
Figure 7: Bicarbonate/Carbonate vs. pH ..................................................................................................... 12
Figure 8: Alkaline water treatment with CO2 .............................................................................................. 14
Figure 9: CO2 Concentrations in Soil Air vs. Atmospheric Air ............................................................... 15
Figure 10: CO2 Concentrations in Soil Gases with Respect to Seasonal Variations ............................. 16
Figure 11: Comparison of CO2 vs. H2SO4 in Neutralization of Alkaline Water .................................. 17
APPENDICES
Appendix A: Case Study: Initial + Final Conditions
Appendix B: Site Photographs (June 1 – June 14, 2015)
Appendix C: Table 2: Water Quality Results from Manhole 1

SUMMARY
The purpose of this report is to introduce the environmental problem of dewatering discharge water
coming into contact with high-pH concrete dust at construction sites, before releasing the alkaline
mixture into storm sewer inlets or surface water bodies without proper management or treatment.
First, the concept of dewatering discharge is introduced, followed by a summary of regulation by-
laws in Southern Ontario that serve to ensure a reasonable and adequate standard of water quality
and quantity at construction sites. Next, the chemistry of cement and concrete is analyzed in order
to determine and analyze the compounds responsible for the naturally-high pH of concrete dust.
Furthermore, the fundamentals of carbonate geochemistry will be used to prove that carbon dioxide
can be used to remediate the pH of alkaline waters, a concept which can be (and has been) applied
in the real world as well. Lowering the pH of alkaline waters can be done through either allowing
exposure of the water to free carbon dioxide from the atmosphere or allowing the water to re-
infiltrate into the ground, where higher carbon dioxide concentrations are present (compared to
atmospheric carbon dioxide concentrations). Releasing alkaline waters to surface waters is also an
option, but should be considered as a ‘last resort’ option, as visible calcium carbonate precipitate
plumes can provide an unaesthetic appearance (whitish plumes) to the receiving body of water. This
will be further discussed in the Case Study, which involves a similar environmental problem that was
encountered at a construction site during the spring of 2015. Management and treatment strategies
will also be discussed and recommended, such as using properly managed dewatering discharge
containers and applying concrete dust further away from water bodies.

Page | 1
1.0 INTRODUCTION
Construction dewatering is a technique widely utilized to remove groundwater or surface water from
trenches and/or excavations in order to provide safer (and drier) working environments for the on-
site workers. Under most circumstances, using a pump or a gravity flume pipe, the water is
transferred from the working area to a dewatering discharge water containment tank, before
discharging the water into a storm sewer inlet or a surface water body, assuming that the water is
free of sediment (low in turbidity and total suspended solids) and/or contamination. Otherwise, the
water would need to be treated accordingly.
On-site cement and concrete works, including pouring concrete dust in preparation for building
infrastructure (i.e. roads, bridge abutments, etc.), are also extensive in almost every infrastructure
construction project. The chemistry of cement is predominantly calcium silicate compounds. During
the process of curing cement into concrete, the cement is hardened by adding water, which
promotes the production of lime [Ca(OH)2], an extremely alkaline (high pH) compound, from the
hydration of the calcium silicate compounds. The result of this process is the production of concrete
dust, which remains alkaline with a pH of above 12.
Therefore, it must be ensured that the poured concrete does not come into contact with surface
water and/or groundwater originating from the Site, including dewatering discharge water, as per
regulation by-laws in Southern Ontario. However, environmental problems have been caused at
several sites due to dewatering discharge water coming into contact with recently poured concrete
dust during surface runoff following heavy rain events, thus elevating its pH to over 12. This report
presents detailed geochemical analysis of concrete and alkaline water, especially limewater (discharge
water mixed with concrete dust), with the support of a project case study (with a similar
environmental problem) based on a construction site in Southern Ontario.

Page | 2
2.0 CONSTRUCTION DEWATERING
Our understanding of environmental impacts of construction projects, including construction
dewatering, has significantly improved over the past few decades. This is primarily due to the swift
rise in urbanization in North America, as urban centers have increased in size and related
infrastructure (roads, railroads, pipelines, utilities) needed to support the urban centers which have
been built. The natural landscape of Northern and Central portions of North America has been
geologically shaped by prolonged periods of glaciation (glacial cycles). The last glacial period ended
about 15,000 years ago, during the Pleistocene Epoch. These ‘ice ages’ produced mass sheets of ice
that covered the better part of the entire continent, before subsequent warmer periods
(interglaciation periods) caused large-scale melting. Some of the resulting meltwater formed many of
the natural watercourses (lakes, rivers, etc.) that we see in North America today, including the Great
Lakes. Most of this resulting meltwater, however, infiltrated into the porous soils to settle
underground as an aquifer, a groundwater system (Severinghaus, 1999).
To support the rapid rise in urbanization in North America, including Southern Ontario, countless
civil construction projects have been undertaken, involving working below the groundwater level.
Engineers, builders and scientists have encounter groundwater management challenges in order to
complete construction projects. The presence of groundwater at a construction site can affect the
design of the infrastructure, the construction procedures and timelines, and the resulting overall
project costs (Powers, 1992). In order to counter these obstacles, there is a need to gather further
knowledge regarding geology and groundwater conditions (i.e. hydrogeology) and the process of
pumping out groundwater and/or surface water out of excavations (dewatering), either through
pumping or via passive drainage methods (i.e. gravity flume pipe)’ (Powers, 1992). In construction
projects, dewatering has proved to be a useful tool especially in extracting and transferring water
from trenches or excavations (below-ground working areas), which are deeper than the groundwater

Page | 3
table, or become flooded by surface water drainage. In this case, the purpose of dewatering is to
pump the water out at a sufficient rate that keeps excavations and below-ground working areas dry
(Figure 1), thus providing a safer workplace for the workers, and enabling the construction work to
proceed. In some cases, dewatering is permanently required to maintain dry conditions in a low area,
such as a basement, subway, underpass, tunnel, or underground parking garage.
Figure 1: Simple illustration of construction dewatering activities requiring a local ‘drawdown’ of the water table.
Source: http://middourconsulting.com/
Surface water taking (or dewatering) includes pumping out rainwater or floodwater from excavations
following heavy rain events, as well as diverting the flow of water in rivers, creeks, streams or lakes,
around work areas or out of cofferdams, in order to keep the working area sufficiently dry and safe.
An example of when surface water dewatering would be necessary is a bridge construction project
spanning a river, with in-water piers or abutments.
The accumulated water in excavations or cofferdams (in-water work areas) is generally removed
through the use of water pumps, and the pumped water is then released (discharged) to an
appropriate location, which is normally a nearby lake, river, wetland, a vegetated field (where re-
infiltration occurs) or directly into storm sewer inlets (Powers, 1992).
Open Excavation
Dewatering Wells Dewatering water
discharged to a
nearby watercourse
or storm sewer, or
to a vegetated field
where it will re-
infiltrate back down
to the water table.

Page | 4
3.0 REGULATIONS
Groundwater or surface water dewatering is generally required in the construction industry when
excavations are required below the water table, and/or to remove accumulated surface water. For
projects in Ontario, under the Ontario Water Resources Act (OWRA) (Section 34) and the Water
Taking Regulation (Ontario Regulations 387/04), approval from the Ministry of the Environment
and Climate Change (MOECC) is required when the groundwater or surface water dewatering rates
exceed 50,000 L/day (MOECC, 2005), in which case, the applicant must apply for a Permit-to-Take-
Water (PTTW).
According to the MOECC, groundwater and surface water quality must also be monitored and
managed at construction sites involving dewatering, especially those when a PTTW has been
obtained. With respect to surface water quality, the objective is to ensure that the water quality is
satisfactory for aquatic life and recreational purposes, and not compromised by construction
activities. The Provincial Water Quality Objectives are numerical and narrative criteria which serve
as chemical and physical indicators defining acceptable water quality conditions for surface waters of
the Province (MOE PWQO Guidelines and Policies, 1994). In the same way, Ontario Regulations
(O. Reg.) 153/04, Record of Site Condition (amended in April 2011), provides guidelines for
groundwater quality of the Province of Ontario.
When construction dewatering discharge water is being released into storm sewers or sanitary
sewers, the local Municipal or Regional Storm Sewer Use By-Laws must be consulted, and it must be
ensured that the water quality and quantity entering the storm or sanitary sewer does not exceed the
levels indicated in the storm or sanitary sewer use regulations. For example, if dewatering discharge
water were to be released into a storm sewer in the Regional Municipality of York (York Region),
the York Region Sewer Use By-Law would be in effect, whereby the discharge entering the storm
sewer must not, in minimum, have a pH less than 6 or greater than 10.5, a temperature greater than

Page | 5
60 degrees Celsius, and a Total Suspended Solids (TSS) level of 15 mg/L (the water must not appear
to be cloudy or murky).
As shown in Figure 1 earlier, when dewatering operations are taking place, the groundwater table is
locally lowered and, on a wider scale, this forms a ‘drawdown cone’ (a zone of influence due to
dewatering). During construction dewatering works, if a residential property that uses well water
(groundwater) as their primary water supply is estimated to fall within the zone of influence, then
their water quality and quantity is monitored on a regular basis, to ensure that the dewatering works
are not negatively impacting their water supply or quality. In such cases, when groundwater is being
utilized for consumptive (drinking) purposes, the Ontario Drinking Water Quality Standard (O. Reg.
169/03 – ODWQS) is used to indicate acceptable vs. unacceptable water quality for potable use.
The ODWQS ensures that existing water supplies (i.e. private water wells) are not compromised in
water quantity or quality by construction projects occurring at a later time.
4.0 PRODUCTION OF CEMENT AND CONCRETE
Civil construction projects often involve use of large quantities of Cement/Concrete. Cement is the
main ingredient of concrete. Although there are other kinds of cement for various purposes, this
section will solely focus on Portland cement (will be simply referred to as cement from here on), the
most common type of cement. Four essential elements are required to make cement: calcium,
Silicon, aluminum and Iron. The dominant component, calcium, is usually extracted from crushed
limestone, which itself is quarried and blasted for this purpose, while Silicon is obtained from sand
and/or clay minerals, and sometimes Shale. Aluminum and iron are extracted from bauxite and iron
ores, respectively, and are also found in clay minerals. This group is then mixed (ground) together to
form a homogeneous powder, before being heated to high temperatures (800 to 1,500 degrees
Celsius) in a rotary kiln, which is a long, inclined, rotating steel cylinder primarily used for ‘cement-
cooking’, as shown in Figure 2 below (University of Illinois).

Page | 6
As this powdered mixture moves down the rotary kiln, and is exposed to higher temperatures, there
are four (4) primary stages of transformation that take place (University of Illinois):
1) Evaporation of free water in the powder;
2) Calcination: decomposition of limestone and clay;
3) Clinkering: initial formation of calcium silicate compounds; and
4) The final product, clinker, is cooled and ground/mixed with minor amounts (around 5%) of
gypsum (CaSO4 2H2O – used to regulate setting) to form the finished cement powder.
Figure 2: A Schematic Diagram of Rotary Kiln Source: http://matse1.matse.illinois.edu/concrete/prin.html
Figure 3: Freshly poured concrete.. Source: https://stevehyde.wordpress.com/2011/07/08/how-to-build-a-road/

Page | 7
A summary diagram of the entire process is provided as Figure 4 below.
To produce concrete, the cement powder needs to be hardened through curing, a chemical reaction
which results in maximum strength and durability by increasing its structural integrity and reducing
porosity and permeability. Cement hardens (is cured) as a result of hydration. The strength of the
concrete is related to the water-to-cement mass ratio and the curing conditions (i.e. temperature).
The ‘right’ volume of water is critical to the resulting strength of the concrete, as a high water-to-
cement mass ratio yields a low strength concrete with higher porosity. The majority of concrete is
made with a water-to-cement ratio ranging from 0.35 to 0.6 and at temperatures ranging from 10 to
25 degrees Celsius, according to most concrete manufacturing companies (University of Illinois).
5.0 CEMENT AND CARBONATE GEOCHEMISTRY
5.1 Geochemical Properties of Cement
Cement is predominantly composed of calcium silicate compounds (>70% for Portland cement).
The remaining minor compounds are calcium aluminate and calcium aluminoferrite compounds,
Figure 4: Summary of Concrete Production Process Source: http://matse1.matse.illinois.edu/concrete/prin.html

Page | 8
with minor amounts of gypsum. In summary, according to a study by the University of Illinois,
Portland cement consists of the following five (5) major compounds:
Cement Compound Weight
Percentage Chemical Formula
tricalcium silicate 50% Ca3SiO5 or 3CaO.SiO2
dicalcium silicate 25% Ca2SiO4 or 2CaO.SiO2
tricalcium aluminate 10% Ca3Al2O6 or 3CaO .Al2O3
Tetracalcium
aluminoferrite 10% Ca4Al2Fe2O10 or 4CaO.Al2O3.Fe2O3
Gypsum 5% CaSO4.2H2O
During the process of curing cement, upon the addition of water, tricalcium silicate is the first
compound to be hydrated and therefore greatly contributes to the final strength of the concrete. Its
equation is given by the following:
tricalcium silicate + water � calcium silicate hydrate + calcium hydroxide + heat
2 Ca3SiO5 + 7 H2O � 3 CaO.2SiO2.4H2O + 3 Ca(OH)2 + 173.6 kJ
As shown in Equation 1, the exothermic reaction releases calcium ions and hydroxide ions (OH-),
which contributes to the abrupt rise in pH of water in contact with the cement from near-neutral (7
to 8) to over 12. This reaction continues until the system is saturated in calcium and hydroxide ions,
which is when the calcium hydroxide (Lime) begins to crystallize, along with calcium silicate Hydrate
crystals, which act as ‘seeds’ upon which more calcium silicate Hydrate can form. The crystals grow
thicker at a steady rate, simultaneously, until the water molecules are unable to diffuse through the
thick coating around the calcium silicate Hydrate crystals.
Table 1: The five (5) major compounds in Portland cement
Source: http://matse1.matse.illinois.edu/concrete/prin.html
Equation 1

Page | 9
As illustrated in Figure 4 above, the pore space, which is initially filled with water (blue color), is
decreasing as the calcium silicate Hydrate crystals (yellow) are thickening (pink) with water and
calcium hydroxide. Diagram D shows nearly-hardened cement paste, where the remaining pore
space is primarily calcium hydroxide solution that has still not crystallized. This hydration reaction
continues until all the water has been used up and all compounds have been hydrated. The same
reaction occurs in the case of dicalcium silicate, although at a much slower rate, as dicalcium silicate
is less reactive than tricalcium silicate (University of Illinois).
5.2 carbonate-carbon dioxide-H2O System
As discussed earlier, the release of hydroxide ions during the process of curing cement causes
elevated levels of pH in the cement-water mixture (freshly poured concrete). In construction sites, if
dewatering discharge water were to be in contact with freshly poured concrete (for example, by
surface runoff caused by heavy rain events), its pH would rise as well. This high-pH surface water
would then be discharged (through pipes or as runoff) into a creek or storm sewer without proper
management or attenuation, which is legally unacceptable as per regional by-laws in Ontario.
Therefore, it is essential to understand the geochemistry of carbonate systems, in order to restore
the water quality of high pH water before discharging into creeks or storm sewers.
Figure 5: Schematic illustration of the pores in calcium silicate through the different stages of hydration Source: http://matse1.matse.illinois.edu/concrete/prin.html

Page | 10
Garrels and Christ (1967) discuss carbonate equilibria in detail using several systems including
carbon dioxide, solution and solid phase carbonates (UC Davis).
Case 1: Neutral pH Waters
In open systems, where water with neutral pH (6 - 8) is in contact with free carbon dioxide from the
atmosphere, carbon dioxide dissolves into the water (becomes aqueous) and reacts with water to
form carbonic acid via the following reaction:
CO2 + H2O � H2CO3
The carbonic acid then dissociates into bicarbonate and hydrogen ions via the following reaction,
whereby the release of hydrogen ions acidifies the water (pH goes down):
H2CO3 � HCO3- + H+
In other words, carbon dioxide is effective in reducing pH of water. In fact, this is also why rain
water has a slightly acidic pH (5.6), as it comes into contact with higher concentrations of carbon
dioxide in the atmosphere, thus as the rain water falls down, it progressively becomes more acidic.
Case 2: Alkaline Waters
In the case of alkaline waters (pH > 10) in contact with free carbon dioxide from the atmosphere,
carbon dioxide reacts directly and rapidly with the excess hydroxide ions to produce bicarbonate via
Equation 4 given below. Since the concentration of hydroxide ions is reduced, the pH is also
lowered. CO2 + OH- � HCO3-
Equation 2
Equation 3
Equation 4
Page | 11
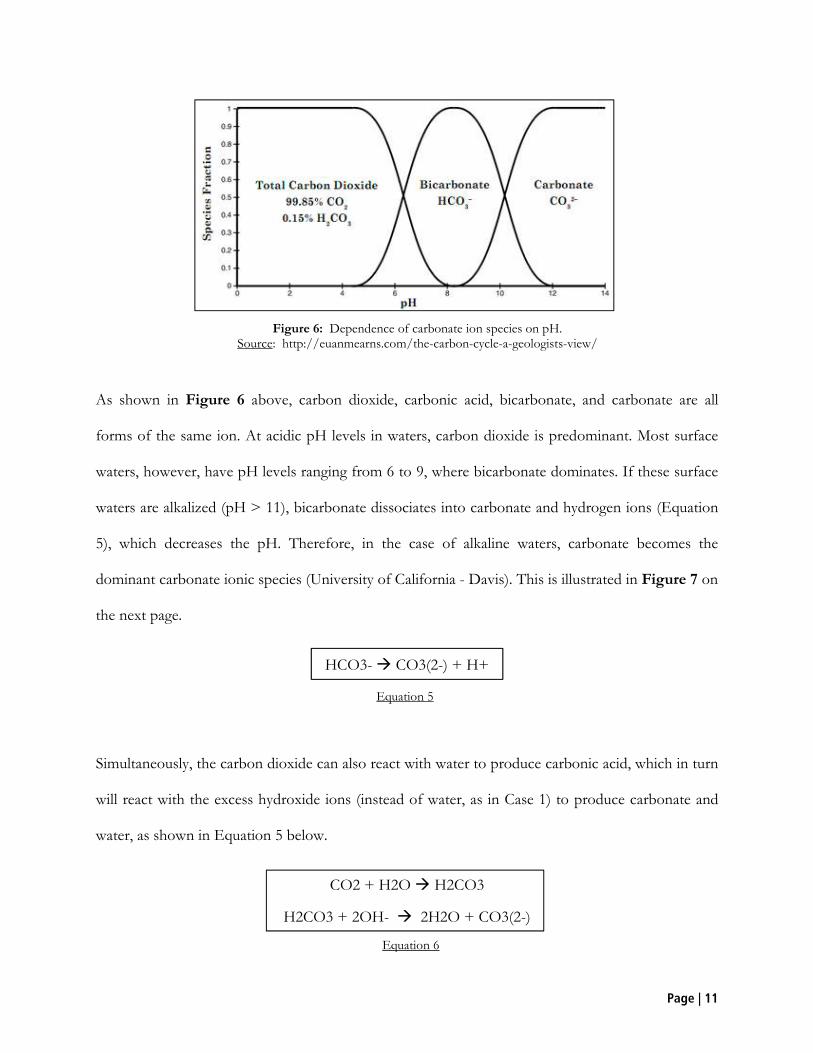
As shown in Figure 6 above, carbon dioxide, carbonic acid, bicarbonate, and carbonate are all
forms of the same ion. At acidic pH levels in waters, carbon dioxide is predominant. Most surface
waters, however, have pH levels ranging from 6 to 9, where bicarbonate dominates. If these surface
waters are alkalized (pH > 11), bicarbonate dissociates into carbonate and hydrogen ions (Equation
5), which decreases the pH. Therefore, in the case of alkaline waters, carbonate becomes the
dominant carbonate ionic species (University of California - Davis). This is illustrated in Figure 7 on
the next page.
HCO3- � CO3(2-) + H+
Simultaneously, the carbon dioxide can also react with water to produce carbonic acid, which in turn
will react with the excess hydroxide ions (instead of water, as in Case 1) to produce carbonate and
water, as shown in Equation 5 below.
CO2 + H2O � H2CO3
H2CO3 + 2OH- � 2H2O + CO3(2-)
Figure 6: Dependence of carbonate ion species on pH. Source: http://euanmearns.com/the-carbon-cycle-a-geologists-view/
Equation 6
Equation 5

Page | 12
When pH of the water is too high, the concentration of carbonate is high. If the calcium
concentration is high as well, then it is possible for precipitation of calcium carbonate to occur. In
other words, the solubility and precipitation of calcium carbonate depends on pH, and therefore the
carbonate concentration. Lower pH values lead to higher solubility (and lower precipitation) of
calcium carbonate (and vice versa), since carbon dioxide or bicarbonate is dominant at lower pH
values (Reefkeeping).
This is why driving the pH very high with freshly poured concrete (or limewater) can rapidly
precipitate calcium carbonate, due to the over-saturation of carbonate ions (from the high pH
water), and also likely due to the added calcium concentration (from the concrete – tricalcium
silicate) and alkalinity.
6.0 NATURAL METHODS OF ATTENUATION OF HIGH-PH WATER
In construction sites, there have been numerous cases of dewatering discharge water coming into
contact with freshly poured concrete or concrete dust. This typically occurs if there are no
containment tanks present (to contain the water) and the water is simply allowed to drain/run along
the ground surface. If concrete is being poured near the dewatering discharge location, then it would
be reasonable to assume that a heavy rain event could cause the concrete and discharge water to
Figure 7: Pictorial representation of the relative number of bicarbonate (green) and carbonate (red) ions in solution as a function of pH.
Source: http://reefkeeping.com/issues/2006-06/rhf/#10

Page | 13
assimilate and mix together to produce high-pH water. Based on observations at numerous sites, the
initial appearance of high-pH water is clear, as the calcium carbonate precipitation has not begun yet.
However, if the alkaline water is allowed to ‘sit’ and settle for a week (like a pond), enough carbon
dioxide will have dissolved into the water and reacted with lime [calcium hydroxide - Ca(OH)2],
which itself is sourced from the concrete (see Equation 1 in page 8), to precipitate calcium carbonate
out of solution.
Ca(OH)2(aq) + CO2(g) � CaCO3 (s) + H2O (l)
The three (3) following sub-sections explore three (3) natural methods that can be used to attenuate
(restore the pH) impacted waters.
6.1 Release to Surface Waters
If high-pH impacted discharge water is directed to a creek or a river by surface runoff, it is assumed
that, due to the increased rate of reaction with dissolved carbon dioxide in the surface water, calcium
carbonate will precipitate out of solution and settle on the bottom of the surface water, like sediment
or silt. This assumption was confirmed when, during this Spring season at a construction site,
impacted discharge water (initially clear) was released into a river and a calcium carbonate precipitate
plume was observed in the river, while the precipitates were settling on the river bed. This will be
further discussed as a case study in Section 8.1.
Equation 7
Page | 14
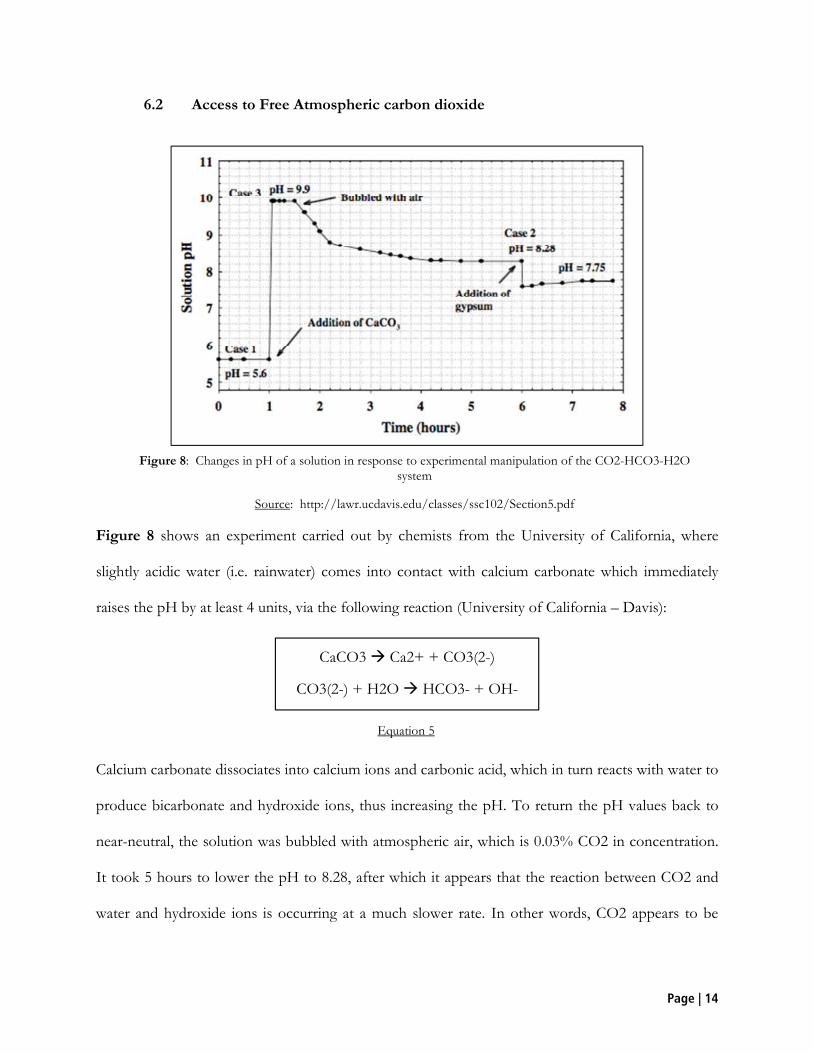
6.2 Access to Free Atmospheric carbon dioxide
Figure 8 shows an experiment carried out by chemists from the University of California, where
slightly acidic water (i.e. rainwater) comes into contact with calcium carbonate which immediately
raises the pH by at least 4 units, via the following reaction (University of California – Davis):
CaCO3 � Ca2+ + CO3(2-)
CO3(2-) + H2O � HCO3- + OH-
Calcium carbonate dissociates into calcium ions and carbonic acid, which in turn reacts with water to
produce bicarbonate and hydroxide ions, thus increasing the pH. To return the pH values back to
near-neutral, the solution was bubbled with atmospheric air, which is 0.03% CO2 in concentration.
It took 5 hours to lower the pH to 8.28, after which it appears that the reaction between CO2 and
water and hydroxide ions is occurring at a much slower rate. In other words, CO2 appears to be
Figure 8: Changes in pH of a solution in response to experimental manipulation of the CO2-HCO3-H2O system
Source: http://lawr.ucdavis.edu/classes/ssc102/Section5.pdf
Equation 5

Page | 15
more effective in reducing high pH levels in very alkaline waters (with pH > 9.5), where the
reactions occur at a greater rate, to a slightly alkaline pH (around 8.5 to 9). In order to further
reduce pH, gypsum (CaSO4 2H2O – Hydrated calcium sulphate) was added to increase alkalinity
and hardness by increasing the concentration of calcium ions, which promotes precipitation of
calcium carbonate, while also increasing the sulphate ionic concentration within the solution, causing
an increase in H2SO4 concentration (an acid), thereby lowering the pH to below 8.
The results of this experiment suggest that this method can also be applied in the field. If impacted
dewatering discharge water is found, this water could be transferred to a containment tank where
prolonged exposure (i.e. over a week) to air, which includes carbon dioxide, will lower the pH to
acceptable levels by precipitating calcium carbonate out of solution. The water may also be aerated
to accelerate this process. Gypsum can be used to further lower the pH; otherwise, if concentrations
of all dissolved metals and compounds (such as Volatile Organic Compounds) meet the regulatory
criteria, the water can then discharged into a storm sewer or a creek with no further treatment.
6.3 Re-infiltration to Ground/Groundwater
Carbon dioxide is much more abundant in soils than in the atmosphere. This is because plant roots
respire and produce CO2, along with additional CO2 produced by oxidative decay of organic matter.
As a result, CO2 concentrations in soils are much greater (approx. 10 times) than the atmospheric
concentrations, as shown in Figure 9 below (Ohio State University).
Figure 9: Composition of CO2 concentrations in soil air vs. atmospheric air Source: http://www.oardc.ohio-state.edu/ss540/lectures/SS540Aeration.pdf

Page | 16
Concentrations of CO2 in soil gases are also affected by seasonal variations, as shown in Figure 10
below, where the lack of vegetation in colder regions, such as Northern Canada, produces less CO2
compared to the warm wet regions (i.e. Brazil). Temperate regions, such as Southern Ontario, fall in
between that range. CO2 concentrations also vary with depth, with highest CO2 concentrations
generally found approximately 1 meter below ground surface.
Therefore, it is assumed that if impacted discharge water were to be allowed to re-infiltrate into the
ground, the rate of precipitation of calcium carbonate would be much greater than the rate of
precipitation of calcium carbonate if the impacted discharge water were to be exposed to air, given
that CO2 concentrations in soil gases are, on average, 10 times greater than that in the atmosphere.
Figure 10: CO2 concentrations in soil air, with respect to seasonal variations.
Source: http://www.gly.uga.edu/railsback/Fundamentals/1121WeatheringCO207.pdf

Page | 17
7.0 MANAGEMENT STRATEGIES/TECHNOLOGIES
The Environmental Protection Agency (EPA) of the United States recommends installing properly
managed concrete washout areas or facilities to safely contain the freshly poured concrete in
prefabricated washout containers that are protected from spills and leaks. This is necessary in
construction sites because, if dewatering activities are occurring nearby concrete washout areas, and
no washout containers are present, then the discharge water will likely come into contact with the
freshly poured concrete as surface runoff following rain events.
To remediate high-pH water, companies recommend use of carbon dioxide or Sulfuric acid
(H2SO4). One company, Advanced Sensor Technologies Inc. (ASTI), suggests using CO2 instead
of H2SO4 for pH control. This is because H2SO4 is deemed to be highly corrosive; therefore it is
potentially dangerous for workers to store and handle. Specialized equipment, pipes and materials
must be present to safely handle the use of H2SO4. Constant maintenance is also required. As a
result, ASTI strongly recommends the use of CO2 as a viable method for pH reduction of alkaline
waters, as it is safer, efficient, easy to use, and environmentally safe (ASTI Sensor).
Figure 11: Graph showing comparison of CO2 vs. Sulfuric acid in neutralization of alkaline water. Source: http://www.astisensor.com/carbon_dioxide_Versus_Mineral_acids.pdf
Comparative Neutralization Curves of High pH Water

Page | 18
ASTI has developed a pH control system, currently in use in the United States. A CO2 diffuser is
installed by means of a pressurized pipe, through which tiny CO2 bubbles are systematically released
into the alkaline water in the containment/storage tank. As discussed earlier, CO2 reacts with H2O
to produce carbonic acid (H2CO3, a weak acid), which dissociates into highly-reactive ions,
hydrogen Ion (H+) and bicarbonate (HCO3-), both of which react with ions responsible for
alkalinity of water, such as Sodium carbonate (Na2CO3), Sodium hydroxide (NaOH, also called
Caustic Soda), and dissolved lime [Ca(OH)2]. A pH probe is also installed downstream of the
injection point, thus measuring pH in the water following the chemical reactions discussed earlier.
As shown in Figure 11 on the previous page, an experiment conducted by ASTI involved 700 mL
of both carbon dioxide and Sulfuric acid being added to water with a pH of 11. Carbon dioxide
reacted with lime to produce precipitated calcium carbonate and the calcium ions reacted with the
sulfate ions to produce Gypsum, which is represented by the steep drop in pH in the graph. This
steep drop and the gradual decline of pH caused by Gypsum and carbon dioxide, respectively, is also
discussed in Figure 8 on page 14.
High-pH impacted water is recommended to be collected and transferred to a containment tank,
where it can be sampled and analyzed for general chemistry, nutrients, Volatile Organic Compounds
(VOC’s), and Petroleum Hydrocarbons (PHC’s), in order to avoid surface runoff of possibly-
contaminated water into surface waters or storm sewers. Following the treatment of pH of the
impacted water, the turbidity and TSS levels must also be monitored to ensure that the precipitate
and sediment settles on the bottom of the container (the water should not appear ‘murky’). If all
criteria meet regulatory standards, then the water can be discharged to a storm sewer or a creek.

Page | 19
8.0 CASE STUDY: HIGH-PH DISCHARGE OUT OF SANITARY SEWER MANHOLES IN ROAD
AND INFRASTRUCTURE CONSTRUCTION PROJECT
During the spring of 2015, MMM Group Limited had been actively involved in weekly erosion and
sediment control inspections and dewatering assessments at various construction sites in Southern
Ontario. One such location has been selected as a project case study in order to introduce and
analyse a real-world environmental problem involving construction dewatering discharge impacted
by recently poured concrete dust, thus creating a high-pH mixture which flowed as surface runoff
into the river to create a visible calcium carbonate precipitate plume. A location schematic diagram
has been created to assist the reader in understanding the Site in more detail, and is provided in
Appendix A. Photographs of this location are provided in Appendix B. The calcium carbonate
precipitate plume was observed in the river on June 1, 2015, after which an investigation was
conducted to determine the source of the calcium carbonate.
Initial conditions (May to June, 2015):
As illustrated in the Location Schematic Diagram, the sanitary sewer wastewater was flowing north
(from Manhole 1 and 2 to Manhole 4), and then west into the Pumping Station area (Manhole 4 to
Manhole 5). South of the railroad tracks, Manhole 2 was situated in a low spot, causing ponded
water to overtop Manhole 2 following heavy rain events. The water in Manhole 1 flows into
Manhole 2 through the sanitary sewer pipe. The accumulated water (mix of groundwater and surface
water) in the general area in or around Manholes 1 and 2 were dewatered (pumped) and discharged
into the woods to the west (Discharge 1), in order to provide safer working areas for the on-site
workers. This dewatering discharge water was allowed to pond and settle in a depression in the
woods, just south of the railroad tracks, in order to let it re-infiltrate into the ground. The pH of this

Page | 20
water was measured to be 12.5 on June 1, 2015, which reduced to 8.8 by June 8, 2015. The electrical
conductivity and turbidity values were also very high (over 4 mS/cm and 1,000 NTU, respectively).
To the north of the railroad tracks, sanitary sewer wastewater was being pumped into Manhole 5,
which was also situated in a low spot. Concrete dust was being poured in the general vicinity, as
shown in the Schematic Location Diagram. Following several heavy rain events during the month of
May to June, concrete dust was washed down (as surface runoff) into Manhole 5, thus mixing into
the existing groundwater and surface water (rain water). This water was being pumped out and into
the Pumping Station ditch (PS ditch), where it was expected to flow through the existing rock check
dams, through the culvert pipe that led to the woods (river bank), where the water was expected to
attenuate by re-infiltrating into the ground/groundwater and seep into the river as subsurface flow.
However, the vegetation in the discharge area was not dense enough to reduce the flow of water
significantly. Therefore, attenuation (re-infiltration) of the water was minimal and the pH remained
high. The water appeared cloudy and calcium carbonate precipitate was observed on the river banks
and on the river, where a whitish plume was observed. The pH of the cloudy water in the woods
was measured to be 11.5 during the first week of June.
The pH of the river upstream of the discharge location was measured to be 8.1, while the pH of the
river downstream was measured to be 8.4, which falls near the upper limit of the PWQO
requirements for surface water quality (i.e. pH of surface waters should fall between 6.5 and 8.5).
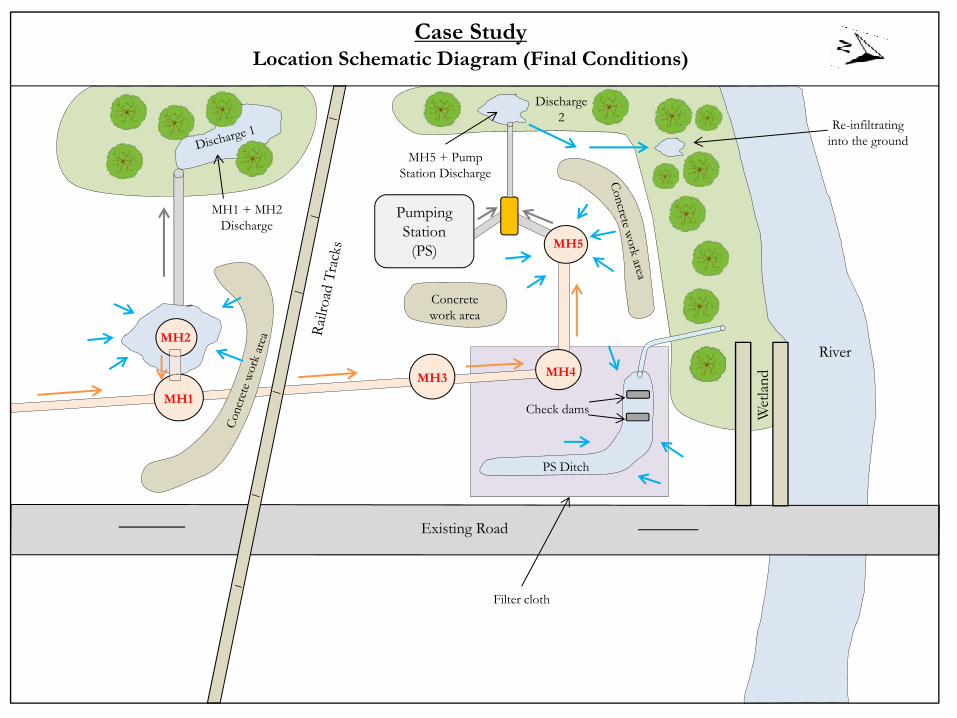
Final Conditions (June to July, 2015):
Following the investigation, the high-pH water from Manhole 5 and Pumping Station was no longer
dewatered into the PS ditch. The pumps were now directed towards the woods on the west end of
the Site. This area (Discharge 2) was relatively flat and elevated compared to the rest of the Pumping
Station area, therefore the water was naturally allowed to pond and re-infiltrate into the ground.

Page | 21
Excess water was flowing down a gully and into the adjacent woods to the north, where even
though steeper slopes were present, the thickness and density of the existing vegetation reduced the
flow of water enough to allow it to re-infiltrate into the ground. The precipitate plume was no longer
observed in the river following the implementation of these changes.
The pH of the water in Discharge 2 was measured to be 12.1. The pH of the water in the woods
could not be measured due to dense vegetation. The pH of the existing water in the PS ditch, where
there was no longer any input from the sanitary sewer dewatering, had reduced to 8.3. The check
dams in the ditch were re-enforced and a filter cloth was placed in this general area to filter
sediments out of surface water before entering the ditch and the culvert.
The environmental and working conditions south of the railroad tracks around Manholes 1 and 2
remained similar to the initial conditions. The water in and around Manhole 1 was sampled on four
(4) occasions during this month in order to analyze for general chemistry, total and dissolved metals
and VOC’s. A table of water quality results (Table 2) has been attached to this report as Appendix
C, to analyze the changes in the following chemical parameters during this month:
• pH (Field + Lab)
• Turbidity (Field + Lab)
• Electrical Conductivity (Field + Lab)
• Total Hardness (as CaCO3)
• Total Dissolved Solids
• Total Suspended Solids
• Alkalinity
• Bicarbonate
• Carbonate
• Hydroxide
• Iron
• Aluminum
• Calcium

Page | 22
As per Table 2, the pH of the water in Manhole 1 decreased from 12.51 to 9.1 (12.2 to 7.37 for lab
pH), which is expected as the water was always in contact with atmospheric carbon dioxide (i.e.
open system).
Electrical Conductivity is dependent on the concentration of ions in solution. In other words,
conductivity increases with ionic concentration. Therefore, since prolonged exposure to atmospheric
carbon dioxide had reduced the carbonate and hydroxide ionic concentration, conductivity also
decreased from >4,000 to 519 us/cm (similar to lab results).
Turbidity numerically describes the cloudiness/haziness of a fluid. The cloudiness is usually caused
by floating (unsettled) silt/sediment particles in the fluid (i.e. water). If a cloudy sample of water
were allowed to sit for a week, the turbidity would be expected to decrease as the silt particles would
settle to the bottom. It is suspected that, since the water in Manhole 1 was allowed to sit for weeks,
the calcium carbonate precipitates and silt particles settled down to the bottom of the shaft, thus
decreasing turbidity over time. The spike in turbidity on June 8 could have been caused by initial
formation of precipitate and increased sediment input from surface runoff following heavy rain
events (supported by Total Suspended Solids (TSS) value on the same day).
Hardness and Alkalinity decreased over time due to the increased rate of dissolved carbon dioxide,
which led to a reduction in concentration of carbonate compounds.
Bicarbonate was at its lowest at a pH of over 12 (June 1), as most of the bicarbonate had
dissociated into carbonate and hydrogen ions (as discussed in Section 5). This is confirmed by the
concentration of carbonate on the same day (68,400 ug/L). As pH decreased over time, carbonate
reacted with the excess hydrogen ions to create more bicarbonate. Carbonate (and also calcium)
also decreased due to the calcium carbonate being precipitated out of solution by the introduction of

Page | 23
carbon dioxide. Hydroxide had also significantly decreased due to carbon dioxide reacting with the
hydroxide ions to produce bicarbonate.
Iron and aluminum are both minor components of the chemical makeup of cement/concrete, thus
are included in Table 2. Iron and aluminum appear to be correlated to TSS, as evidenced by the
increase in iron and aluminum (14 June to 24 June) in response to the increase in TSS. Since iron
and aluminum form significant parts of the chemical makeup of sediments (i.e. clay minerals), higher
TSS would lead to higher iron and aluminum, and vice versa. Iron was found to be highly
concentrated when TSS was at its highest (June 8), although it is difficult to ascertain why aluminum
is relatively low on the same day. It is suspected that sediments composed of aluminum may have
been present at lower quantities on that day, as compared to the iron-rich sediments.
Finally, Total Dissolved Solids (TDS) also decreased as the calcium and carbonate precipitated out
of solution, therefore decreasing TDS and increasing TSS. It can be argued that, in this case, calcium
ionic concentrations in the water is related to the TDS values, as decrease in calcium concentrations
led to the decrease in TDS.

Page | 24
9.0 CONCLUSION
The water quality results from Manhole 1 confirm that, if given enough time, high-pH water
impacted by concrete can be treated through natural means by allowing atmospheric carbon dioxide
to dissolve into the solution and decrease the pH by reacting with the hydroxide ions to produce
bicarbonate, which in turn will dissociate into hydrogen ions, thus lowering the pH steadily.
Re-infiltrating alkaline water into the groundwater is also an effective natural treatment strategy, as
the soils will collect contaminants, sediments and ions as the water percolates through the soil,
where carbon dioxide concentrations are found to be, on average, ten (10) times greater than that of
the atmosphere.
Releasing high-pH water to surface water bodies can treat the water through rapid calcium carbonate
precipitation; however, the end product is an unaesthetic (cloudy) appearance of the receiving water
body.

Page | 25
10.0 RECOMMENDATIONS
Dewatering discharge water should be collected and contained in properly sealed containers.
Concrete works, such as pouring high-pH concrete dust, should be carried out at a location where
contact with groundwater, surface water (other than rain water), and dewatering discharge water is
unlikely. Signs should be put in place where concrete works are underway, to ensure better
communication amongst on-site workers.
Treatment strategies should be further investigated in case of similar environmental problems. Cost-
effect studies should be especially considered by those interested.
Finally, dewatering discharge water quality and flow rates should be periodically checked by
hydrogeologists or on-site workers (who have been trained by hydrogeologists to take field
chemistry measurements appropriately), prior to releasing the water into the fields.
Page | 26
11.0 REFERENCES
J. Severinghaus, E. Brook (1999). "Abrupt Climate Change at the End of the Last Glacial Period
Inferred from Trapped Air in Polar Ice". Science 286 (5441): 930–4.
Powers, J. Patrick (1992). Construction dewatering and groundwater control: new methods and
applications. New York City: John Wiley & Sons.
Rodriguez, J. (n.d.). Construction Dewatering - Definition and Description. Retrieved August 10,
2015, from http://construction.about.com/od/Contractors/a/What-Is-Dewatering.htm
(n.d.). Retrieved August 21, 2015, from http://lawr.ucdavis.edu/classes/ssc102/Section5.pdf
(n.d.). Retrieved August 21, 2015, from
http://www.astisensor.com/carbon_dioxide_Versus_Mineral_acids.pdf
A Simplified Guide to the Relationship Between calcium, Alkalinity, Magnesium and pH by Randy
Holmes-Farley - Reefkeeping.com. (n.d.). Retrieved August 27, 2015, from
http://reefkeeping.com/issues/2006-06/rhf/#10
About Middour Consulting. (n.d.). Retrieved August 10, 2015, from
http://middourconsulting.com/
Scientific Principles. (n.d.). Retrieved August 27, 2015, from
http://matse1.matse.illinois.edu/concrete/prin.html
What is cement and how is it made. (n.d.). Retrieved August 13, 2015, from
http://www.buildeazy.com/newplans/eazylist/cement.html
(n.d.). Retrieved August 27, 2015, from http://www.oardc.ohio-
state.edu/ss540/lectures/SS540Aeration.pdf
APPENDIX A
Case Study: Location Schematic Diagram

Existing Road
RIVER
MH1
Pumping
Station
(PS)
MH2
Case StudyLocation Schematic Diagram (Initial Conditions)
MH5
MH3 MH4
CaCO3
precipitate plume
PS Ditch
MH1 + MH2
Discharge
Old
Can
al L
ock
Str
uct
ure
Old
Can
al L
ock
Str
uct
ure
Wet
lan
d
Concrete work
areaculvert
Check
dams
Upstream
Downstream
Existing Road
River
MH1
Pumping
Station
(PS)
MH2
Case StudyLocation Schematic Diagram (Final Conditions)
MH5
MH3 MH4
MH5 + Pump
Station Discharge
PS Ditch
MH1 + MH2
Discharge
Discharge
2
Wet
lan
d
Check dams
Re-infiltrating
into the ground
Concrete
work area
Filter cloth

Sanitary Sewer Manhole
Sanitary Sewer Wastewater Flow Direction
Surface Water/Dewatering Discharge (being
pumped out) Flow Direction
Surface Water Runoff Flow Direction
Surface water flowing into low area
Woods (vegetated area)
Ponded water in woods due to overflow of
dewatering discharge water
Case StudyLegend
Dewatering Discharge Storage Container
Old Canal Lock Structure

APPENDIX B
Case Study: Location Photographs

JUNE 1, 2015
Photograph 1: Cloudy water inside Manhole 1
Photograph 2/3: Cloudy water in PS ditch, with the culvert seen at the far end of the ditch.

Photographs 3-5: Calcium carbonate precipitate plume observed on June 1, 2015 (See Schematic –
Initial Conditions)


JUNE 8, 2015
Photograph 6: Improved conditions at PS ditch, with no further input from the Pumping Station or
Manhole 5.
Photograph 7: Pumping Station (Manhole 5 is to the right, but not seen in the picture)

JUNE 14, 2015
Photograph 8: Manhole 1 and 2 following heavy rain events.
Photograph 9: Discharge 1 area (See Schematic Diagram).

Photographs 10-11: Pumping Station and Discharge 2 area. Water is being pumped from Manhole 5
(left) and Pumping Station (right) into the dewatering discharge storage container, before being
released into the woods.
Manhole 5
Dewatering discharge
being released into the
woods (Discharge 2 area)
Discharge 2

Photographs 12-13: Discharge 2 area, where water is flowing down this gully and into the woods
(bottom picture).

APPENDIX C
Table 2: Manhole 1 Water Quality Results (June 1 to June 24, 2015)

TABLE 1
Water Quality Results from 4 Sampling Events at Manhole 1
Spring 2015 Co-op Work Term Report
1-Jun-15 8-Jun-15 14-Jun-15 24-Jun-15
MH1 MH1 MH1 MH1
Field pH 6.5-8.5 12.51 8.78 9.1 9.1
Field Temperature (Celsius) - 13.1 13.5 16.3 20.5
Field Turbidity NTU 14 1,515 100 121
Field Electrical Conductivity µS/cm >3,999 1,242 1021 519
Electrical Conductivity µS/cm 2 - 4,120 1,630 891 500
Laboratory pH pH Units 6.5-8.5 12.2 8.19 7.67 7.37
Total Hardness (as CaCO3) µg/L 500 - 793,000 421000 102000 55000
Total Dissolved Solids mg/L 20 - 1,420 894 512 290
Alkalinity (as CaCO3) µg/L 5,000 - 612,000 235000 50000 55000
Bicarbonate (as CaCO3) µg/L 5,000 - <5000 235000 50000 55000
Carbonate (as CaCO3) µg/L 5,000 - 68,400 <5000 <5000 <5000
Hydroxide (as CaCO3) µg/L 5,000 - 543,000 <5000 <5000 <5000
Turbidity NTU 0.5 - 38.6 906 158.0 232
Calcium µg/L 100 - 317,000 143000 33400 19300
Aluminum µg/L 4.0 75 <4.0 4.2 64 123
Iron µg/L 10 300 109 2,110 470 750
Total Suspended Solids mg/L 10 - 58 866 91 101
NOTES:
PWQO
O. Reg. 153/04 as amended in 2013.
1100.0
R.D.L.
Water Management Policies, Guidelines, Provincial Water Quality Objectives of the Ontario Ministry of Environmment
and Energy, July 1994, Reprinted 1999.
Ontario Regulation 153/04 as amended by O. Reg. 366/05, O. Reg. 511/09, O. Reg. 179/11 and O. Reg. 333/13:
Records of Site Condition, Part XV.1 of the Act.
Parameter exceeds PWQO criteria
Reported Detection Limit.
Parameter Unit RDL PWQO
Date Sampled
Sample Location