Embed Size (px)
Citation preview
WTO Ag Trade Negotiationsand the 2007 Farm Bill
Robert L. ThompsonGardner Professor of Agricultural Policy
University of Illinois
August 10, 2005

Farm Bill & WTO Timetable• 2005:
– Extend Trade Promotion Authority (“fast track”) & decide to stay in the WTO [done]
– WTO negotiations to put meat on the skeleton of the 7/31/04 Framework Agreement (Hong Kong Ministerial to assess progress in Dec. 2005)
– Modest farm policy changes to accommodate WTO cotton decision and budget deficit reduction
• 2006:– Serious offers & requests in WTO negotiations
• 2007:– Congressional approval of new WTO Trade
Agreement and signing before TPA expires (6/07)– 2007 Farm Bill

Outline of Today’s Presentation• Why Trade?• Importance of Exports to U.S. Agriculture• The WTO – What It Is and Isn’t• Need to Level the Playing Field• Prospects for The Doha Round of Ag
Trade Negotiations• Prospects for the 2007 Farm Bill• Why the Priority on Developing Countries
in this “Doha Round”

World Trade Organization• An informal association of 148 countries which
meets periodically (“rounds of negotiations”) to review/revise the rules of international trade
• Its Secretariat, in Geneva, organizes these negotiations and a dispute settlement process to resolve differences among members over whether these rules are being broken
• Dispute settlement panels & an appellate body interpret agreements and build up a body of case law (necessary when wording is fuzzy)
• WTO cannot force any country to change its policies, but it can authorize the victims of violations to collect compensation via import duties on the violator’s exports
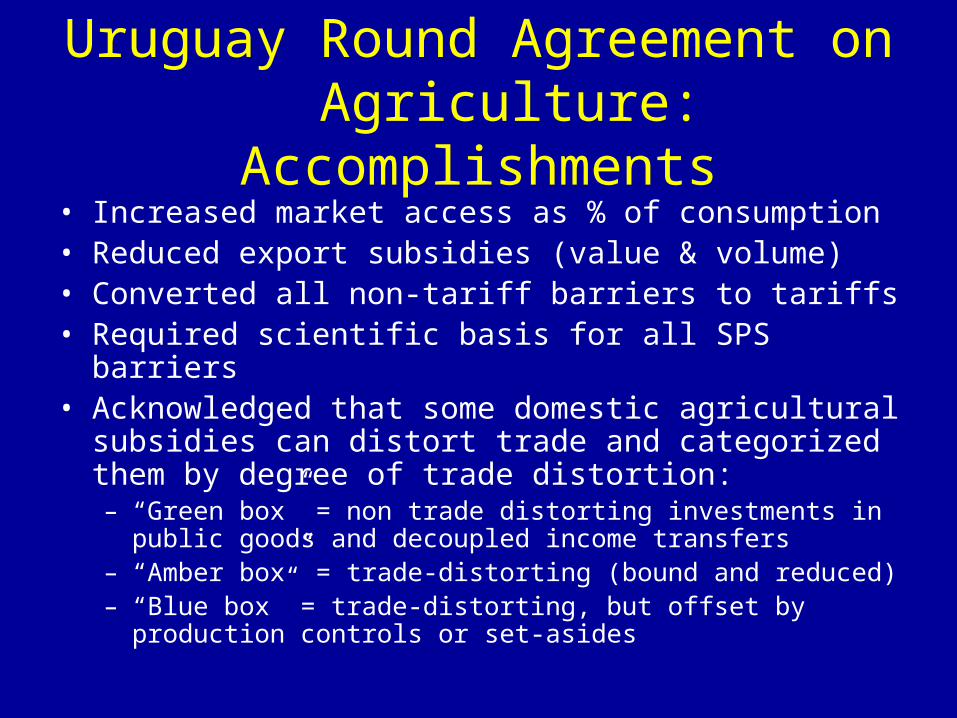
Uruguay Round Agreement on Agriculture: Accomplishments
• Increased market access as % of consumption• Reduced export subsidies (value & volume)• Converted all non-tariff barriers to tariffs• Required scientific basis for all SPS barriers• Acknowledged that some domestic agricultural subsidies
can distort trade and categorized them by degree of trade distortion:– “Green box” = non trade distorting investments in public goods
and decoupled income transfers– “Amber box” = trade-distorting (bound and reduced)– “Blue box” = trade-distorting, but offset by production controls or
set-asides

U.S. Was a Leader in Uruguay Round Ag Negotiations
• Got domestic agricultural policies on the negotiating table and got production- and trade- distorting subsidies capped
• Sold importance of decoupling payments from production of specific commodities
• Got export subsidies capped and reduced• Sold importance of converting all non-tariff
barriers to tariffs and to reduce them• Hung tough on requiring sound science basis for
sanitary & phytosanitary barriers

A Brief Review of the Commodity Programs in the 2002 Farm Bill
• Raised (lowered) loan rates on grains (soybeans)• Reestablished a target price system• Created new counter-cyclical payments (to
replace annual ad hoc emergency payments)• Watered down payment limitations• Authorized updating of program bases and yields• Institutionalized fixed payments (in place of
AMTA payments)• Significantly increased authorized spending
levels

2002 Farm Bill (cont’d.)• Added new commodities (small legumes)• Recreated wool, mohair, & honey programs• Added a new dairy program focused on small
herds• Created a new peanut program, while buying
out quotas• Sweetened the sugar program• Initiated country-of-origin labeling for meat,
fish and peanuts• Expanded export promotion programs• Banned Vietnam from calling its catfish
exports to the U.S. “catfish” (“basa”).

2002 Farm Bill Seen asAbdication of U.S. Leadership
• The U.S., which had led global effort to reduce ag subsidies appears two-faced: increasing its budget authority for agricultural subsidies while telling the rest of the world to cut theirs.
• Retreat on decoupling: By allowing bases to be updated, U.S. farmers know that “fixed payments” are not necessarily “fixed.”
• Counter-cyclical payments reduce U.S. farmers’ responsiveness to (downside) market signals.
• Marketing loans are effectively export subsidies, as are some forms of food aid and export credits.
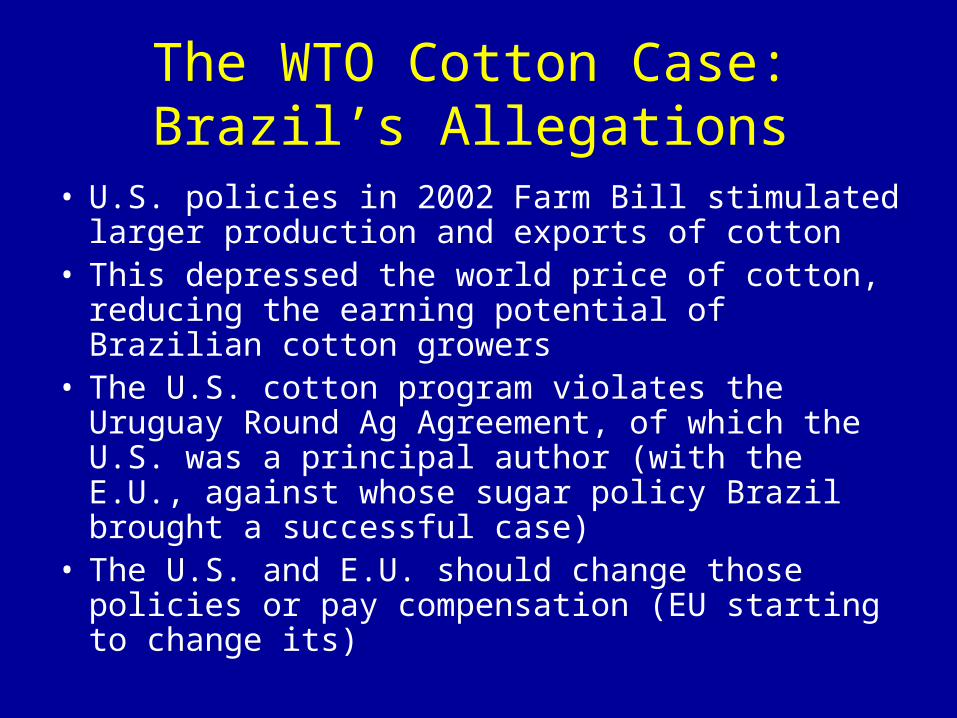
The WTO Cotton Case:Brazil’s Allegations
• U.S. policies in 2002 Farm Bill stimulated larger production and exports of cotton
• This depressed the world price of cotton, reducing the earning potential of Brazilian cotton growers
• The U.S. cotton program violates the Uruguay Round Ag Agreement, of which the U.S. was a principal author (with the E.U., against whose sugar policy Brazil brought a successful case)
• The U.S. and E.U. should change those policies or pay compensation (EU starting to change its)

The WTO Cotton Decision• Certain U.S. policies depressed the world market price by
enough to cause “serious prejudice” to interests of other exporters:– Marketing loan– Loan deficiency payments– Counter-cyclical payments– Market loss assistance payments – Step 2 cotton payments
• Other U.S. policies didn’t:– Direct payments– Crop insurance subsidies– Production flexibility contract payments

Cotton Decision (cont’d.)
• Certain payments, which the U.S. reported as decoupled (green box) payments should have been categorized as “amber box;” since they were not fully decoupled (fruit & veg exception). If they had been, the U.S. would have exceeded its allowed aggregate measure of support.
• Export credit guarantees are export subsidies and should be eliminated before July 1, 2005, as should Step 2 cotton payments, which are subsidies to both domestic consumption and exports of cotton.

Implications of Cotton Decisionfor 2007 Farm Bill
• Congress heeded the URAA AMS cap when it wrote the 2002 farm bill, but it ignored the fact that marketing loans work as export subsidies and can depress world market prices.
• Need to change marketing loan, LDP and CCP provisions for cotton and other program crops.
• The fruit and vegetable production exclusion in qualifying for direct payments needs to be changed. This will bring huge political opposition from fruit & vegetable growers, esp. Calif. & Fla.
• Note: The U.S. cannot claim any credit in the Doha Round agreement for changes it makes in policies found to be in violation of the URAA.

World Agriculture Still in Disarray*• Most high income countries subsidize their
agriculture, distorting relative returns to producing various outputs and inducing larger total investment in agriculture relative to other sectors.
• Many LDCs’ food policies turn the terms of trade against agriculture to keep urban food prices low, reducing the incentive to invest; agriculture underperforms relative to its potential.
• Protectionist import policies and export subsidies further distort what is produced where.
*to paraphrase D. Gale Johnson’s book World Agriculture in Disarray

OECD Producer Support Estimates, 2004, in Percent
Switzerland 68
Japan 56
European Union 33
Canada 21
United States 18
Mexico 17
Australia 4
New Zealand 3
30 Countries Overall 30
Source: OECD Agriculture Directorate

Average Producer Support in OECD Countries, 2004, in PercentRice 75
Sugar 58
Milk 36
Beef & Veal 34
Wheat 33
Corn 31
Oilseeds 27
Pork 21
Eggs 9
Overall 30

Effects of Producer Support
• Distort what gets produced where and, in turn, ag trade flows
• Depress world market prices below long-term trend
• Reduce price and/or income risk to one country’s farmers while increasing price volatility in world market
• Largest producers and farm land owners get most of the benefits

World Market Prices Depressed Below Long Term Trend
Rice 33 - 50 %
Sugar 20 – 40 %
Dairy Products 20 – 40 %
Cotton 10 – 20 %
Peanuts 10 – 20 %
Source: World Bank. Global Economic Prospects 2002, Chap. 2.

Doha Round Must Do Better• Uruguay Round established a useful
framework• But, it did little to open markets, and OECD
countries are still spending over $750 million per day subsidizing their farmers (30% of farmers’ incomes)
• Doha Round needs to be more ambitious than the Uruguay Round by closing loopholes and tightening disciplines to prevent circumvention of the intent of the agreement.

Doha Round Agricultural Agreement: What Is Possible?
• Eliminate all forms of ag export subsidies• Reduce trade-distorting domestic subsidies
(highest the most, but exceptions possible)• Reduce tariffs (highest the most, but exceptions
allowed if increase tariff-rate quota)• Tighten definition of what subsidies are “non-
trade distorting”• Allow developing countries smaller cuts over
longer period (definition? exempt LDCs completely? Special products?)

Domestic Support
• Present: Categorizes all support policies in one of three boxes, with only amber box total (“aggregate measure of support (AMS)”) capped.
• Proposed: – Impose product-specific caps– Cap sum of amber box + blue box + trade-distorting de minimus policies.
• This would significantly increase maximum allowed support in US and EU! Net effect depends on depth of cuts.)

Green Box
• Present: No cap.• Doha Round likely to encourage shifting as
much money as possible from amber to green box payments.
• Cotton case affirmed that direct payments are “green” only if there are no constraints whatsoever on what can be grown on land receiving payments.– U.S. must either delete fruit & vegetable exclusion or
include direct payments in amber box• Open issue: Tighten definition of “minimally
trade-distorting”

Amber Box
• “Substantial reduction in the overall level of its trade-distorting support from bound levels”
• Open issues:– Add product-specific caps?– Highest levels of support reduced the most?
• rice, cotton, sugar; dairy in the U.S.

Blue Box• Present: Trade-distorting policies that have
measures that offset their production-inducing effect, e.g. set-aside or quota on production or sales. No cap at present.
• Tentatively Agreed: – Broaden to include “direct payments that do not
require production,” e.g. counter-cyclical payments [no link to current production, but per unit payment is based on current market price; therefore, not green box].
– Cap at 5% of total value of all national ag production (including non-program crops).

Export Subsidies
• Present: Cap on volume and value of export subsidies on agricultural policies.
• Conditionally agreed: Eliminate all direct agricultural export subsidies by a (yet to be agreed) date certain
• WTO Cotton Case mandated that the U.S. must eliminate subsidy component in export credits and export credit guarantees
• Conditions yet to be agreed: – U.S. food aid should be on only a grant basis– Mode of operation of state-trading enterprises (STEs),
e.g. Canadian Wheat Board, must preclude possibility to subsidize exports.

Market Access
• The most difficult pillar on which the least has been agreed to date
• Framework Agreement says:– Substantial increase in market access though tariff
cuts or tariff rate quota (TRQ) expansion – Categorize all tariffs into “bands,” each with a different
reduction formula, with the highest tariffs to be reduced the most.
– Allow each country to designate an “appropriate number” of (politically) “sensitive products” on which smaller cuts can be made.
– Make cuts from bound rates.– Allow developing countries to use “special safeguard”

Market Access (cont’d.)
• Proposed:– Increase tariff-rate quotas (TRQs) on
“sensitive products” on which tariffs are cut less than formula would otherwise require.
• U.S. has TRQs on sugar, dairy, cotton, peanuts, and beef.
– Set a maximum allowable tariff rate.

Special & Differential Treatmentof Developing Countries
• Allow smaller cuts phased in over a longer period
• Allow each developing country to designate a (yet to be defined) number of “special products” that can be protected
• Exempt LDCs completely from adjustment• There remains politically divisive issue of
definition of “developing country” (as opposed to a least developed country (LDC)).

Why the Concern About Developing Countries in this WTO Round?
• Developing countries are the only potential growth markets of the future -- but only if they enjoy broad-based economic growth -- which will come only if they are allowed to export what they produce relatively most efficiently.
• Developing countries now make up the majority of WTO members. There will be no agreement in the current trade negotiations until they feel there is something of value in it for them (unlike past trade agreements).

Projected Population Growth (U.N. medium projections)
• Region 2004 2050• World 6,378 8,919• High Income 1,206 1,220• Low Income 5,172 7,699• Africa 869 1,803• Asia 3,871 5,222• Latin America 551 767

Dynamics of Food Demand
• 1.25 billion people live on less than $1 per day, of whom 840 million suffer under-nutrition or hunger
• 3 billion (almost half of the world’s population) live on less than $2 per day.
• By $2 per day, most hunger (calorie) problem is solved• Between $2 and $9 per day people eat more animal
protein, fruits, vegetables & edible oils, causing rapid growth in raw ag commodity demand
• After $10 per day, people buy more processing, services, packaging, variety, and luxury forms, but not more raw ag commodities
• How many presently low income consumers are lifted out of poverty will be the most important determinant of the future size of world food and ag product markets

Huge Market Growth Potential from Poverty Reduction
Country Pop’n (000) % < $1/day % < $2/day
China 1299 16.6
46.7
India 1065 34.7 79.9
Indonesia 239 7.5 52.4
Brazil 184 8.2 22.4
Pakistan 159 13.4 65.6
Russia 144 6.1 23.8
Bangladesh 141 36.0 82.8
Nigeria 126 70.2 90.8
Mexico 105 9.9 26.3Source: World Bank. World Development Indicators database

WTO Ag Negotiations Hung Up on Who Goes First
• U.S. has proposed reducing our ag subsidies substantially, but only if other countries provide much greater access to their markets.
• Developing countries won’t open their markets as long as world market prices are depressed by ag subsidies in OECD countries (and they have more than half of the votes)
• Despite encouraging words at July 2005 G-8 Summit, no more progress in WTO ag negotiations occurred this summer.
• After CAFTA-DR vote, other countries doubt U.S. ability to deliver on commitments.
• Unclear that U.S. negotiators have authority to strike deals

Ag Commodity PAC Contributions to Federal Candidates, 2004 Election Cycle
Commodity Contributions ($ 1,000)
Sugar 2,375
Dairy 1,757
Cotton 479
Rice 283
Peanuts 218
Citrus 167
Wheat 100
Potatoes 57
Corn 37
Soybeans 17
Source: Center for Responsive Politics (Federal Election Commission data)
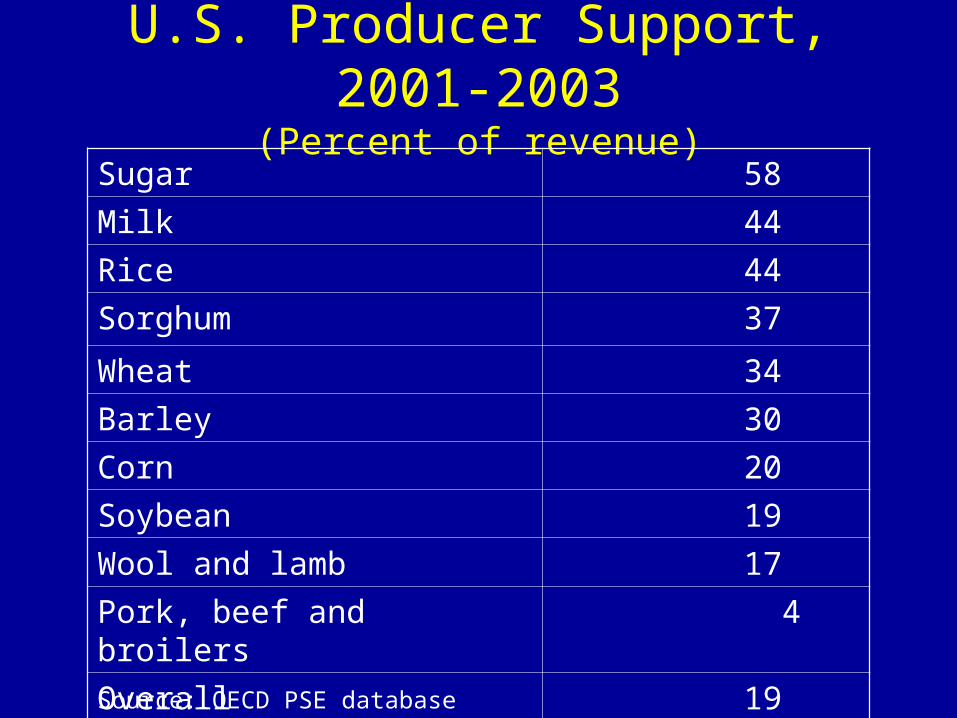
U.S. Producer Support, 2001-2003(Percent of revenue)
Sugar 58
Milk 44
Rice 44
Sorghum 37
Wheat 34
Barley 30
Corn 20
Soybean 19
Wool and lamb 17
Pork, beef and broilers 4
Overall 19Source: OECD PSE database

Source: ERS

Who Reelected President Bush?Rural America
Source: Univ. of Michigan

Recognition that Farm Programs Aren’t Achieving Stated Objectives
• Low farm family income– Most payments go to larger producers whose family incomes &
wealth are well above average– Low income farmers receive very little from programs
• Variability of farm income– Farmers have income averaging and cash accounting
• Increase competitiveness– Capitalization of payments into land values raises U.S. cost of
production and undercuts international competitiveness– Public investments in ag research declining
• Food security– Not a credible problem when U.S. ag grows 1/3 more than we
use domestically
• Rural development– Payments facilitate consolidation; don’t create more jobs

Other Issues Driving 2007 Farm Bill• Food safety and bioterrorism• Rural development: Acknowledgment that ag commodity
programs make weak rural development policy.• Science: Implications of shifting investments in ag
research from public to private sector are being recognized.
• Food aid: when is it an export subsidy?• Concerns re structure of agriculture.• Future role of ethanol and bio-diesel in U.S. energy
policy• Crop insurance: would Congress keep hands off to allow
an actuarially viable approach to function?• Gross revenue insurance to replace disaster payments,
crop insurance, marketing loans, LDPs, and CCPs?

Conclusion• Most likely outcome in 2007 Farm Bill is only
modest changes from 2002 Farm Bill• BUT, there are just enough forces for change
that you should be prepared that bigger change is possible– Federal budget deficit– WTO trade negotiations– Public perception that farm programs are not
achieving their objectives
• The most-discussed alternatives are– Some forms of subsidized gross income insurance– Payments for conservation or environmental services– Rural infrastructure investments

www.agritrade.org

Direct Government Payments USDA Forecasts for FY 2004 and 2005 ($ billions)
Total direct payments 14.5 24.1
Fixed direct payments 5.3 5.3
Counter-cyclical payments 2.0 6.0
Loan deficiency payments 3.2 4.8
Marketing loan gains 0.5 0.8
Milk income loss payments 0.2 0.5
Conservation payments 2.6 2.8
Ad hoc & emerg. payments 0.7 3.9
Source: USDA