Embed Size (px)
Citation preview
Azure InternationalTechnology & Development (Beijing) Limited
Sebastian Meyer Director, Research & Advisory
WTG Production and Installation volumes in China during 2008 -
2011
-
Chinese WTG industry to impact global market?
Presented at Global Wind Power 200830 October 2008
Sebastian Meyer Azure International Slide 2 of 26
Azure International -
About us
A specialized advisory and investment firm dedicated to the commercialization of clean, sustainable energy technologies that are commercially viable and have significant market potential in China
- “Tracker”
and advisory services covering market intelligence and commercial/financial due diligence in the China wind industry including project development and WTG and component manufacturing.
- Bespoke consulting services covering industry research, market intelligence, due diligence, industry monitoring.
Developer of sustainable energy projects in China, with focus on wind, biofuels, waste to energy and coal gasification
- Management capacity in engineering, energy development, project management, marketing & PR, strategic planning, knowledge transfer, domestic and international project and equity finance
- Broad experience within the energy industry, with a focus on new, cleaner energy technologies
- Hands-on knowledge and extensive professional experience in the Chinese, European and North American markets
Sebastian Meyer Azure International Slide 3 of 26
Presentation overview
Demand- Activity update- Economy / Power Sector & RPS- Operating track record - Supply
AnalysisConclusion
Will the domestic Chinese wind market to affect the global WTG market? –
Update Oct 2008
Sebastian Meyer Azure International Slide 4 of 26
Demand –
the domestic market -
Development activity update (1H 2008)
Source: Azure International
163
100MW
50 MW20 MW10 MW1 MW
Operating Wind Farm
Under Planning/Construction
Planned Capacity
163163
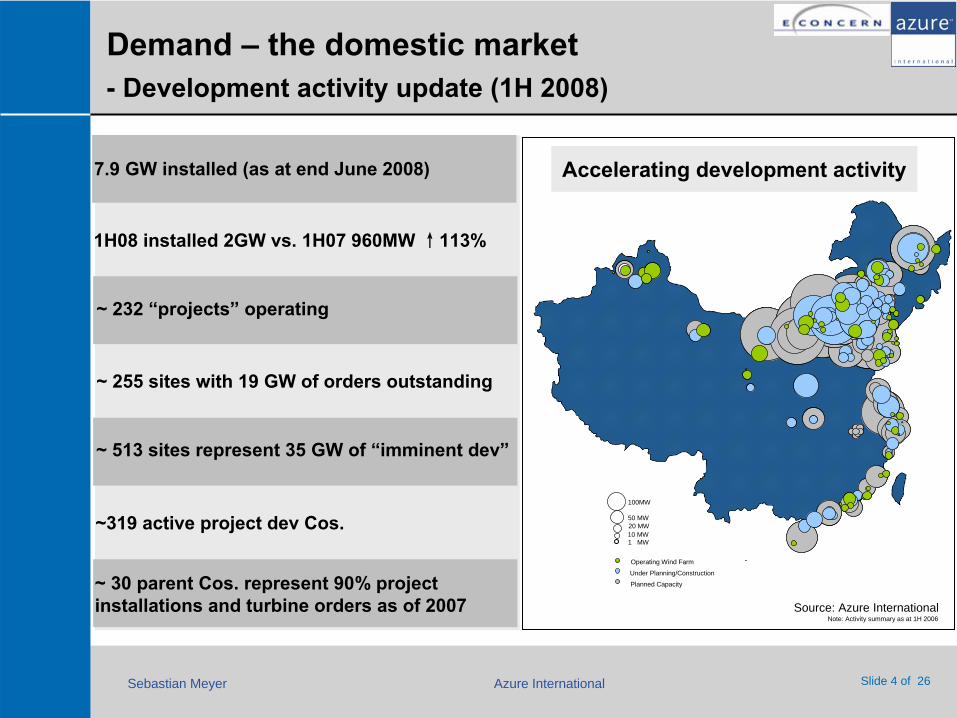
1H08 installed 2GW vs. 1H07 960MW ↑113%
~ 30 parent Cos. represent 90% project installations and turbine orders as of 2007
Accelerating development activity
~319 active project dev Cos.
Note: Activity summary as at 1H 2006
~ 232 “projects”
operating
~ 255 sites with 19 GW of orders outstanding
~ 513 sites represent 35 GW of “imminent dev”
7.9 GW installed (as at end June 2008)
Sebastian Meyer Azure International Slide 5 of 26
Demand –
Companies with pipeline -
Led by the SOE gencos
Source: Azure International
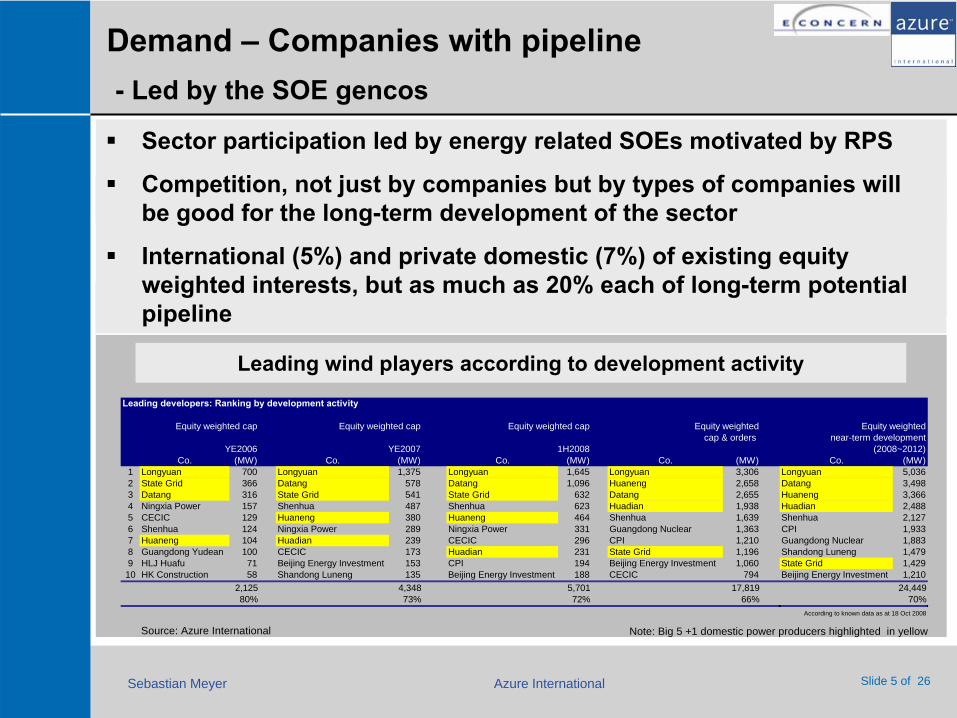
Leading wind players according to development activity
Sector participation led by energy related SOEs motivated by RPS
Competition, not just by companies but by types of companies will be good for the long-term development of the sector
International (5%) and private domestic (7%) of existing equity weighted interests, but as much as 20% each of long-term potential pipeline
Note: Big 5 +1 domestic power producers highlighted in yellow
Leading developers: Ranking by development activity
Equity weighted cap Equity weighted cap Equity weighted cap Equity weighted Equity weightedcap & orders near-term development
YE2006 YE2007 1H2008 (2008~2012)Co. (MW) Co. (MW) Co. (MW) Co. (MW) Co. (MW)
1 Longyuan 700 Longyuan 1,375 Longyuan 1,645 Longyuan 3,306 Longyuan 5,0362 State Grid 366 Datang 578 Datang 1,096 Huaneng 2,658 Datang 3,4983 Datang 316 State Grid 541 State Grid 632 Datang 2,655 Huaneng 3,3664 Ningxia Power 157 Shenhua 487 Shenhua 623 Huadian 1,938 Huadian 2,4885 CECIC 129 Huaneng 380 Huaneng 464 Shenhua 1,639 Shenhua 2,1276 Shenhua 124 Ningxia Power 289 Ningxia Power 331 Guangdong Nuclear 1,363 CPI 1,9337 Huaneng 104 Huadian 239 CECIC 296 CPI 1,210 Guangdong Nuclear 1,8838 Guangdong Yudean 100 CECIC 173 Huadian 231 State Grid 1,196 Shandong Luneng 1,4799 HLJ Huafu 71 Beijing Energy Investment 153 CPI 194 Beijing Energy Investment 1,060 State Grid 1,42910 HK Construction 58 Shandong Luneng 135 Beijing Energy Investment 188 CECIC 794 Beijing Energy Investment 1,210
2,125 4,348 5,701 17,819 24,44980% 73% 72% 66% 70%
According to known data as at 18 Oct 2008
Sebastian Meyer Azure International Slide 6 of 26
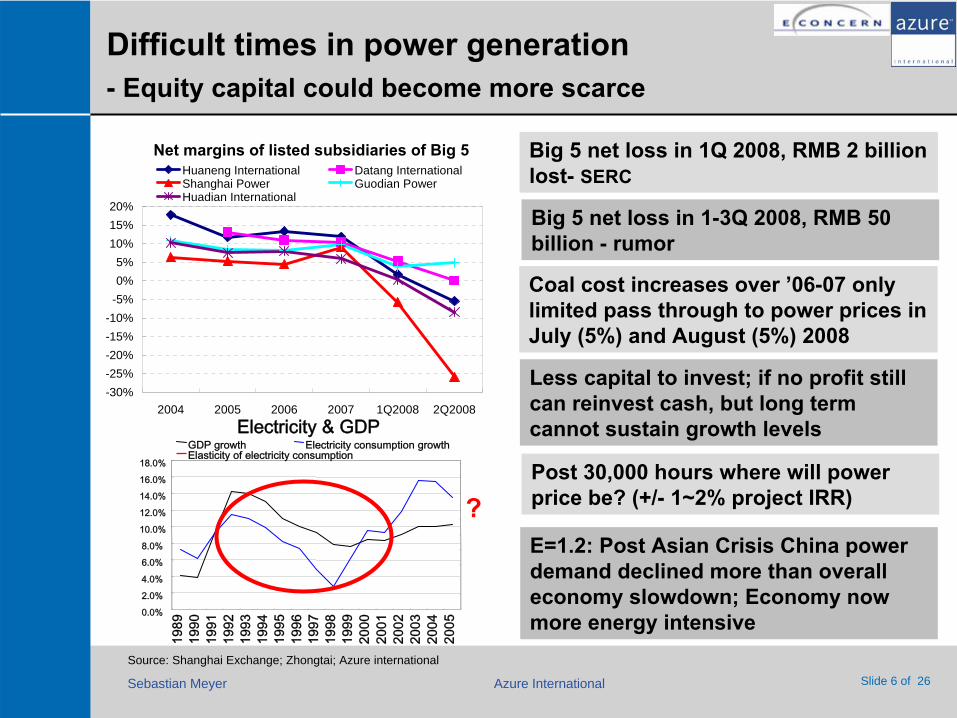
Difficult times in power generation -
Equity capital could become more scarce
Big 5 net loss in 1Q 2008, RMB 2 billion lost-
SERC
E=1.2:
Post Asian Crisis China power demand declined more than overall economy slowdown; Economy now more energy intensive
Coal cost increases over ’06-07 only limited pass through to power prices in July (5%) and August (5%) 2008
Less capital to invest; if no profit still can reinvest cash, but long term cannot sustain growth levels
Post 30,000 hours where will power price be? (+/-
1~2% project IRR)
Source: Shanghai Exchange; Zhongtai; Azure international
Electricity & GDP
0.0%
2.0%
4.0%
6.0%
8.0%
10.0%
12.0%
14.0%
16.0%
18.0%
1989
1990
1991
1992
1993
1994
1995
1996
1997
1998
1999
2000
2001
2002
2003
2004
2005
GDP growth Electricity consumption growthElasticity of electricity consumption
?
Net margins of listed subsidiaries of Big 5
-30%-25%-20%-15%-10%
-5%0%5%
10%15%20%
2004 2005 2006 2007 1Q2008 2Q2008
Huaneng International Datang InternationalShanghai Power Guodian PowerHuadian International
Big 5 net loss in 1-3Q 2008, RMB 50 billion -
rumor
Sebastian Meyer Azure International Slide 7 of 26
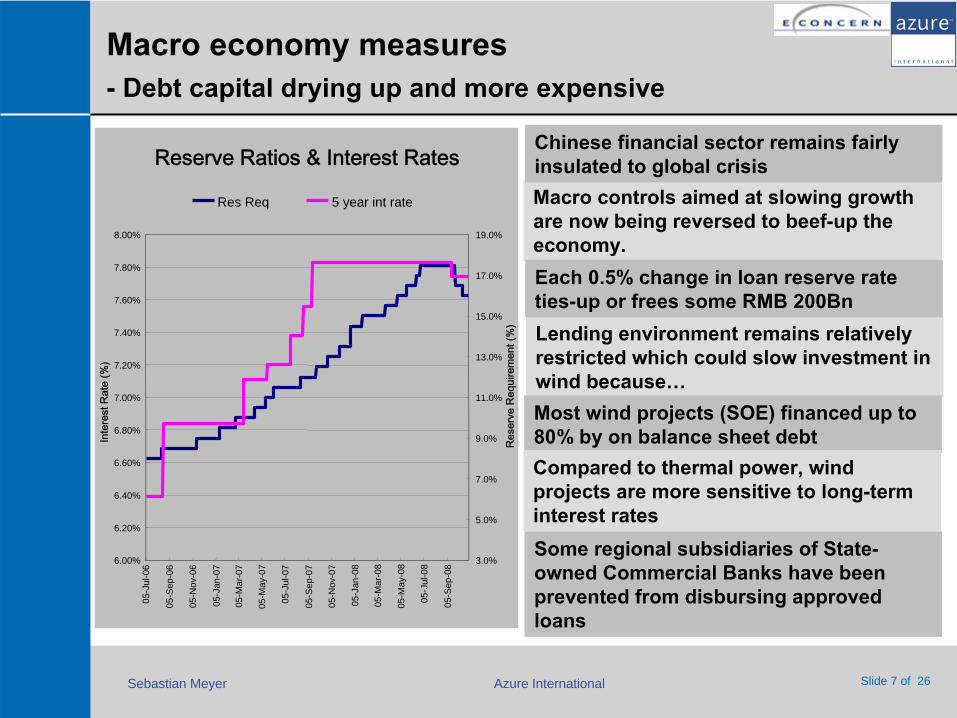
Macro economy measures -
Debt capital drying up and more expensive
Macro controls aimed at slowing growth are now being reversed to beef-up the economy.
Lending environment remains relatively restricted which could slow investment in wind because…Most wind projects (SOE) financed up to 80% by on balance sheet debt
Some regional subsidiaries of State-
owned Commercial Banks have been prevented from disbursing approved loans
Each 0.5% change in loan reserve rate ties-up or frees some RMB 200Bn
Compared to thermal power, wind projects are more sensitive to long-term interest rates
Reserve Ratios & Interest Rates
6.00%
6.20%
6.40%
6.60%
6.80%
7.00%
7.20%
7.40%
7.60%
7.80%
8.00%
05-J
ul-0
6
05-S
ep-0
6
05-N
ov-0
6
05-J
an-0
7
05-M
ar-0
7
05-M
ay-0
7
05-J
ul-0
7
05-S
ep-0
7
05-N
ov-0
7
05-J
an-0
8
05-M
ar-0
8
05-M
ay-0
8
05-J
ul-0
8
05-S
ep-0
8
Inte
rest
Rat
e (%
)
3.0%
5.0%
7.0%
9.0%
11.0%
13.0%
15.0%
17.0%
19.0%
Res
erve
Req
uire
men
t (%
)
Res Req 5 year int rate
Chinese financial sector remains fairly insulated to global crisis
Sebastian Meyer Azure International Slide 8 of 26
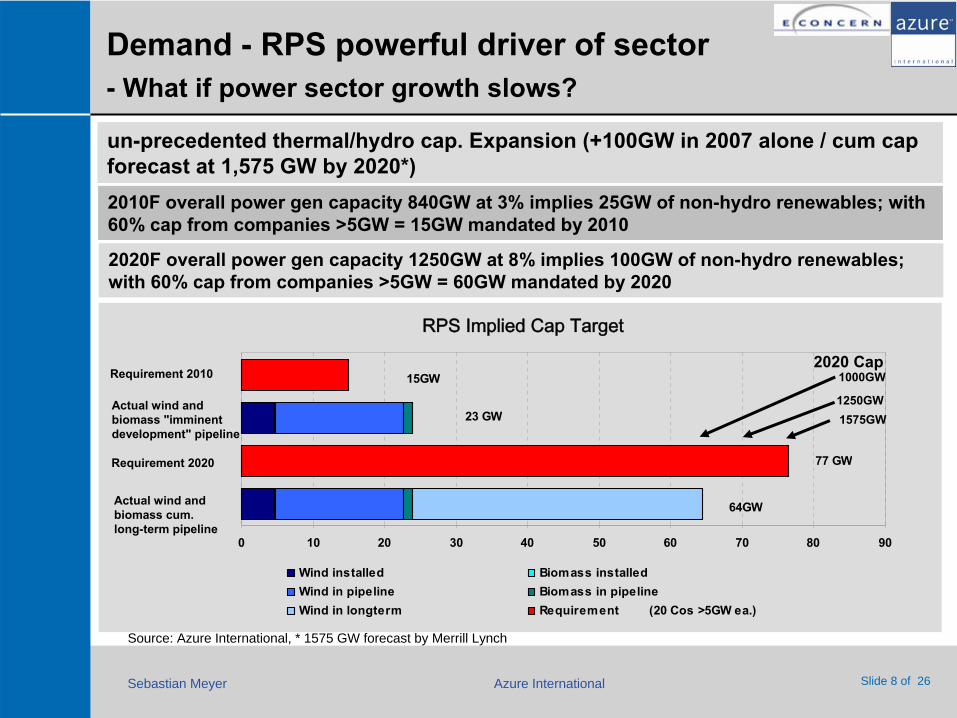
Demand -
RPS powerful driver of sector -
What if power sector growth slows?
2010F overall power gen capacity 840GW at 3% implies 25GW of non-hydro renewables; with 60% cap from companies >5GW = 15GW mandated by 2010
2020F overall power gen capacity
1250GW at 8% implies 100GW of non-hydro renewables;
with 60% cap from companies
>5GW = 60GW mandated by 2020
0 10 20 30 40 50 60 70 80 90
Wind installed Biomass installedWind in pipeline Biomass in pipelineWind in longterm Requirement (20 Cos >5GW ea.)
15GW
23 GW
77 GW
64GW
un-precedented
thermal/hydro cap. Expansion (+100GW in 2007 alone / cum cap forecast at 1,575 GW by 2020*)
RPS Implied Cap Target
Source: Azure International, * 1575 GW forecast by Merrill Lynch
2020 Cap
1575GW1250GW
1000GWRequirement 2010
Actual wind and biomass "imminent development" pipeline
Requirement 2020
Actual wind and biomass cum. long-term pipeline
Sebastian Meyer Azure International Slide 9 of 26
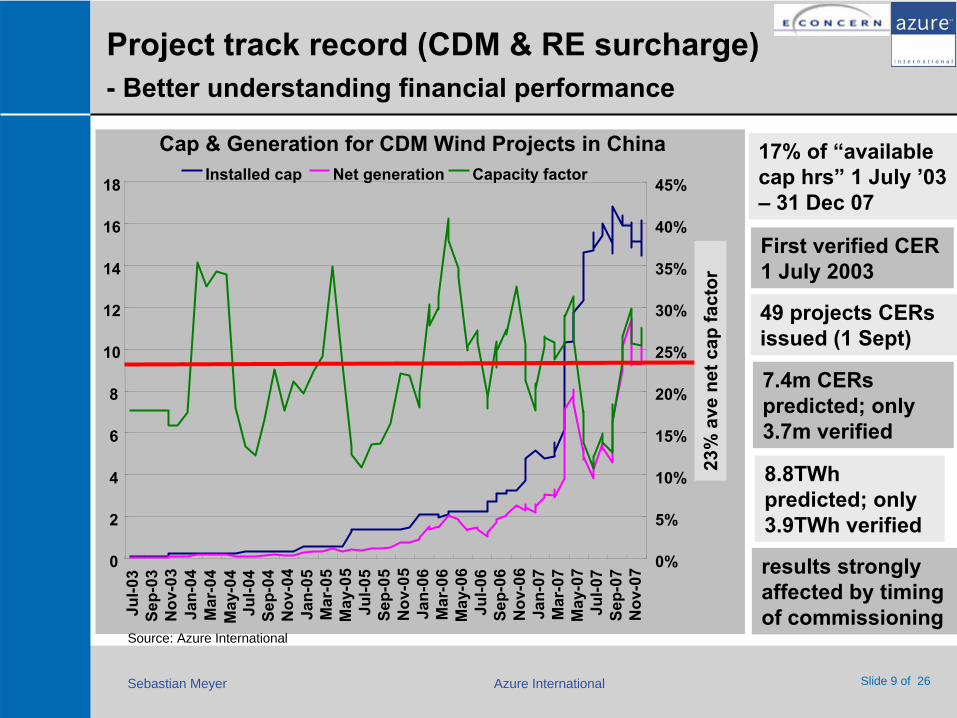
Project track record (CDM & RE surcharge) -
Better understanding financial performance
First verified CER 1 July 2003
7.4m CERs predicted; only
3.7m verified
49 projects CERs issued (1 Sept)
Source: Azure International
0
2
4
6
8
10
12
14
16
18
Jul-0
3Se
p-03
Nov
-03
Jan-
04M
ar-0
4M
ay-0
4Ju
l-04
Sep-
04N
ov-0
4Ja
n-05
Mar
-05
May
-05
Jul-0
5Se
p-05
Nov
-05
Jan-
06M
ar-0
6M
ay-0
6Ju
l-06
Sep-
06N
ov-0
6Ja
n-07
Mar
-07
May
-07
Jul-0
7Se
p-07
Nov
-07 0%
5%
10%
15%
20%
25%
30%
35%
40%
45%Installed cap Net generation Capacity factor
Cap & Generation for CDM Wind Projects in China
results strongly affected by timing of commissioning
8.8TWh predicted;
only 3.9TWh
verified
23%
ave
net c
ap fa
ctor
17% of “available cap hrs”
1 July ’03 –
31 Dec 07
Sebastian Meyer Azure International Slide 10 of 26
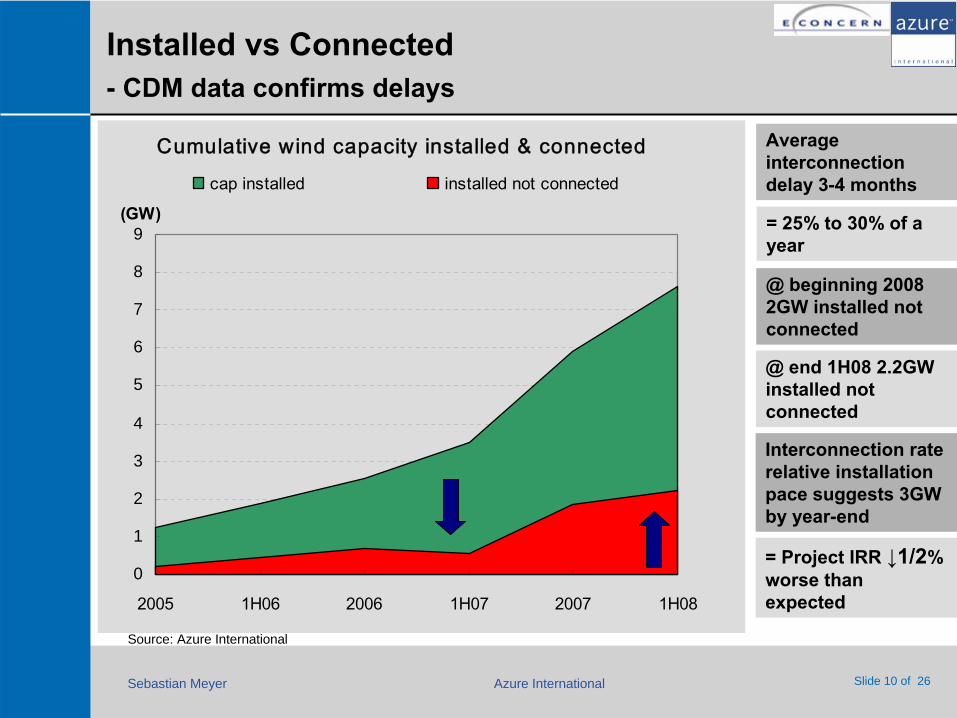
Installed vs Connected -
CDM data confirms delays
Average interconnection delay 3-4 months
= 25% to 30% of a year
@ beginning 2008 2GW installed not connected
@ end 1H08 2.2GW installed not connected
= Project IRR ↓1/2% worse than expected
Source: Azure International
Interconnection rate relative installation pace suggests 3GW by year-end
Cumulative wind capacity installed & connected
0
1
2
3
4
5
6
7
8
9
2005 1H06 2006 1H07 2007 1H08
(GW)
cap installed installed not connected
Sebastian Meyer Azure International Slide 11 of 26
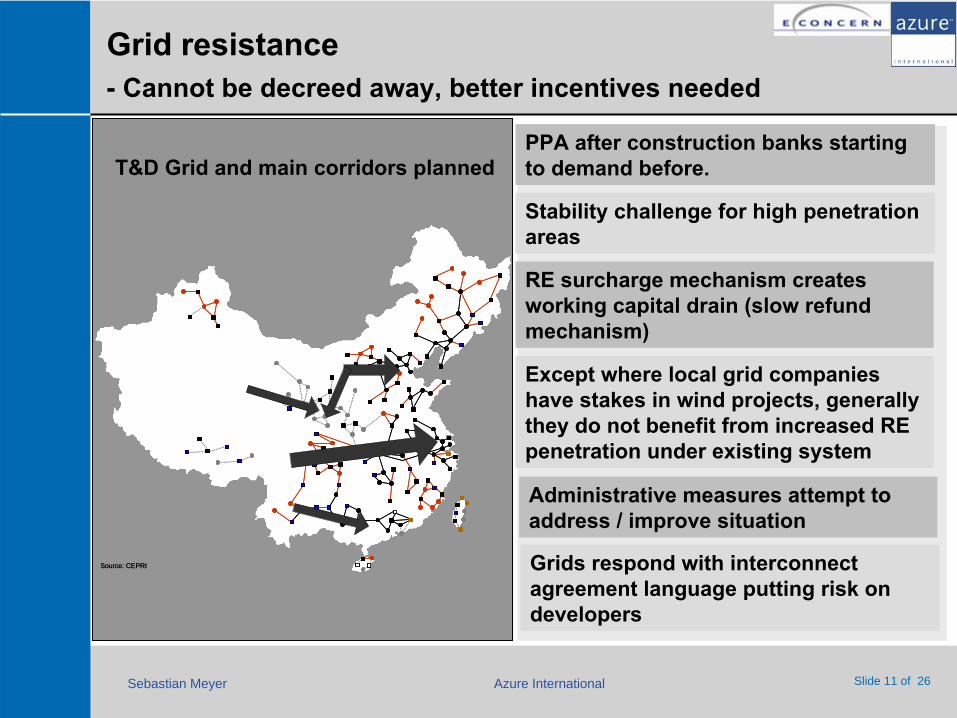
Grid resistance -
Cannot be decreed away, better incentives needed
PPA after construction banks starting to demand before.
RE surcharge mechanism creates working capital drain (slow refund mechanism)
Stability challenge for high penetration areas
Source: CEPRISource: CEPRI
T&D Grid and main corridors planned
Except where local grid companies have stakes in wind projects, generally they do not benefit from increased RE penetration under existing system
Administrative measures attempt to address / improve situation
Grids respond with interconnect agreement language putting risk on developers
Sebastian Meyer Azure International Slide 12 of 26
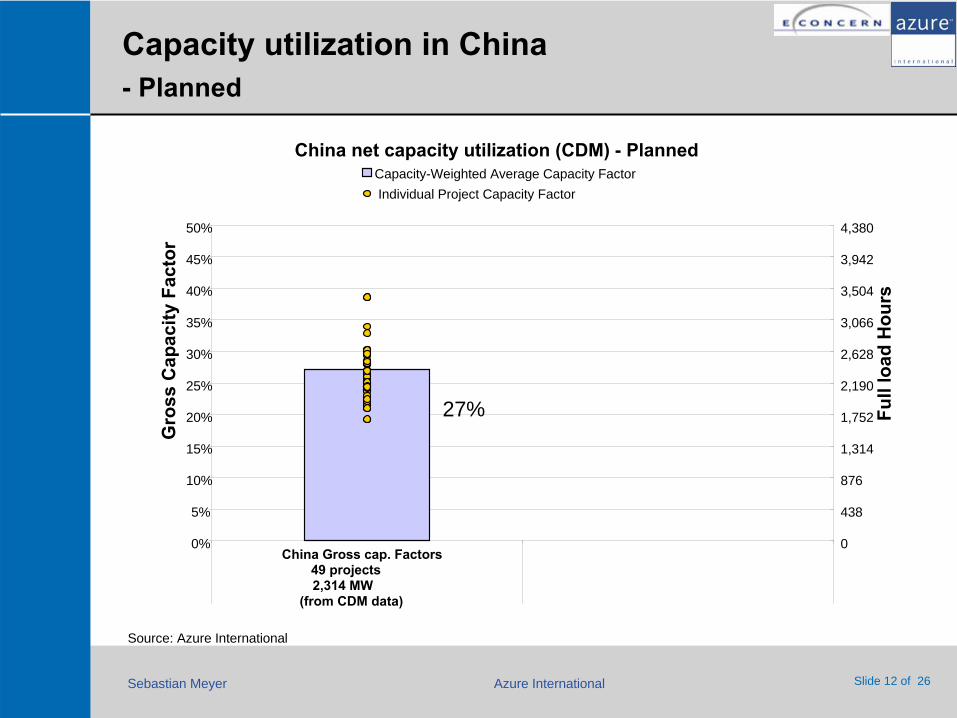
Capacity utilization in China - Planned
China net capacity utilization (CDM) -
Planned
0%
5%
10%
15%
20%
25%
30%
35%
40%
45%
50%
China Gross cap. Factors49 projects2,314 MW
(from CDM data)
Gro
ss C
apac
ity F
acto
r
0
438
876
1,314
1,752
2,190
2,628
3,066
3,504
3,942
4,380
Full
load
Hou
rs
Capacity-Weighted Average Capacity FactorIndividual Project Capacity Factor
27%
Source: Azure International
Sebastian Meyer Azure International Slide 13 of 26
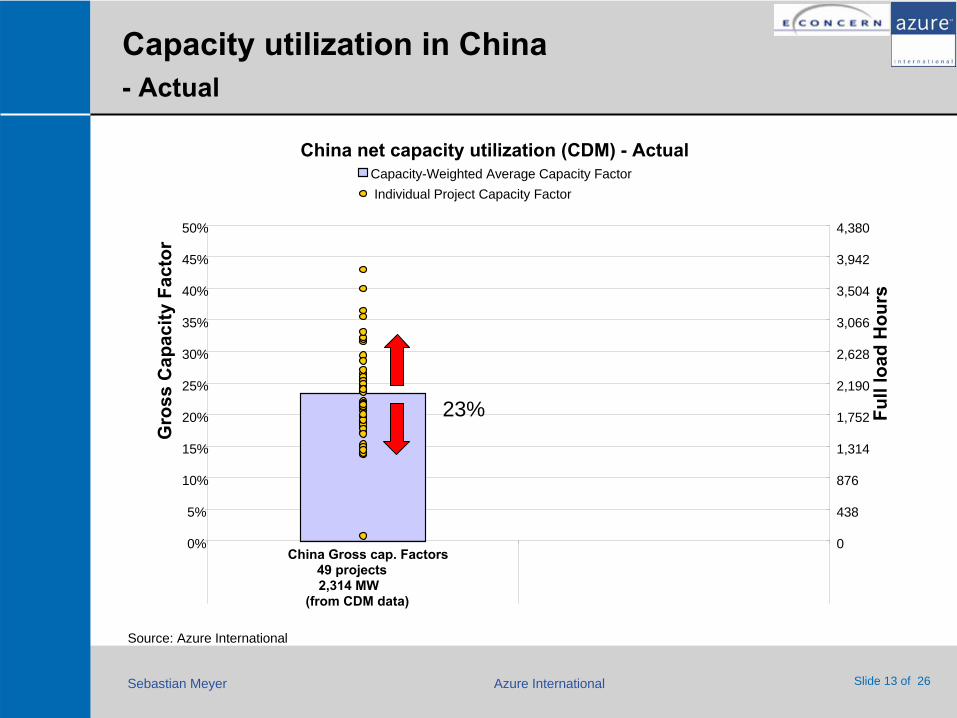
Capacity utilization in China - Actual
China net capacity utilization (CDM) -
Actual
0%
5%
10%
15%
20%
25%
30%
35%
40%
45%
50%
China Gross cap. Factors49 projects2,314 MW
(from CDM data)
Gro
ss C
apac
ity F
acto
r
0
438
876
1,314
1,752
2,190
2,628
3,066
3,504
3,942
4,380
Full
load
Hou
rs
Capacity-Weighted Average Capacity FactorIndividual Project Capacity Factor
23%
Source: Azure International
Sebastian Meyer Azure International Slide 14 of 26
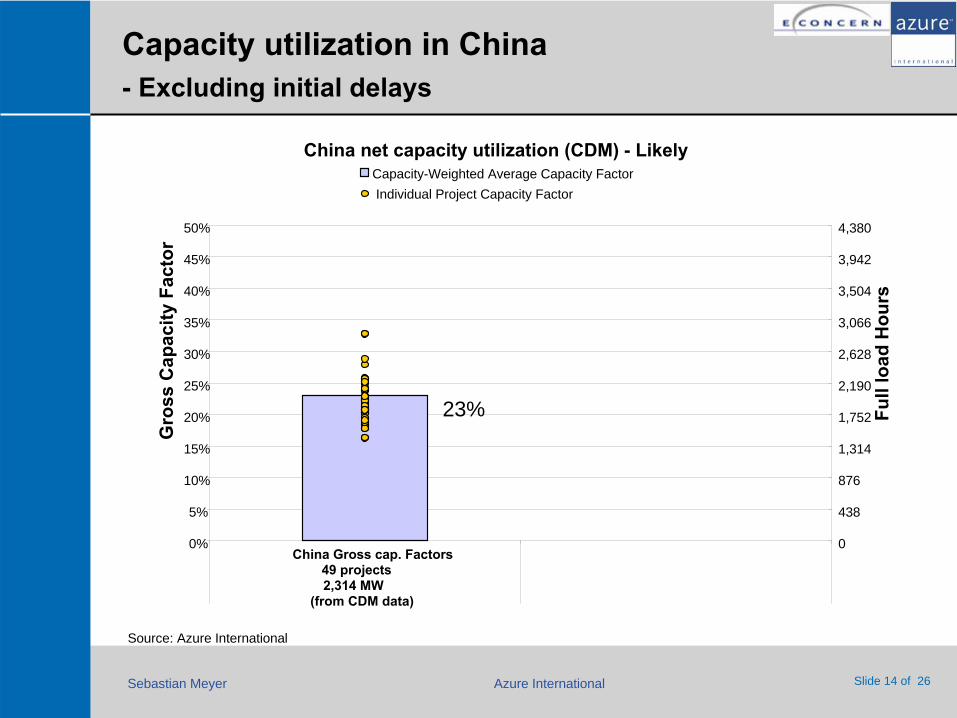
Capacity utilization in China -
Excluding initial delays
China net capacity utilization (CDM) -
Likely
0%
5%
10%
15%
20%
25%
30%
35%
40%
45%
50%
China Gross cap. Factors49 projects2,314 MW
(from CDM data)
Gro
ss C
apac
ity F
acto
r
0
438
876
1,314
1,752
2,190
2,628
3,066
3,504
3,942
4,380
Full
load
Hou
rs
Capacity-Weighted Average Capacity FactorIndividual Project Capacity Factor
23%
Source: Azure International
Sebastian Meyer Azure International Slide 15 of 26
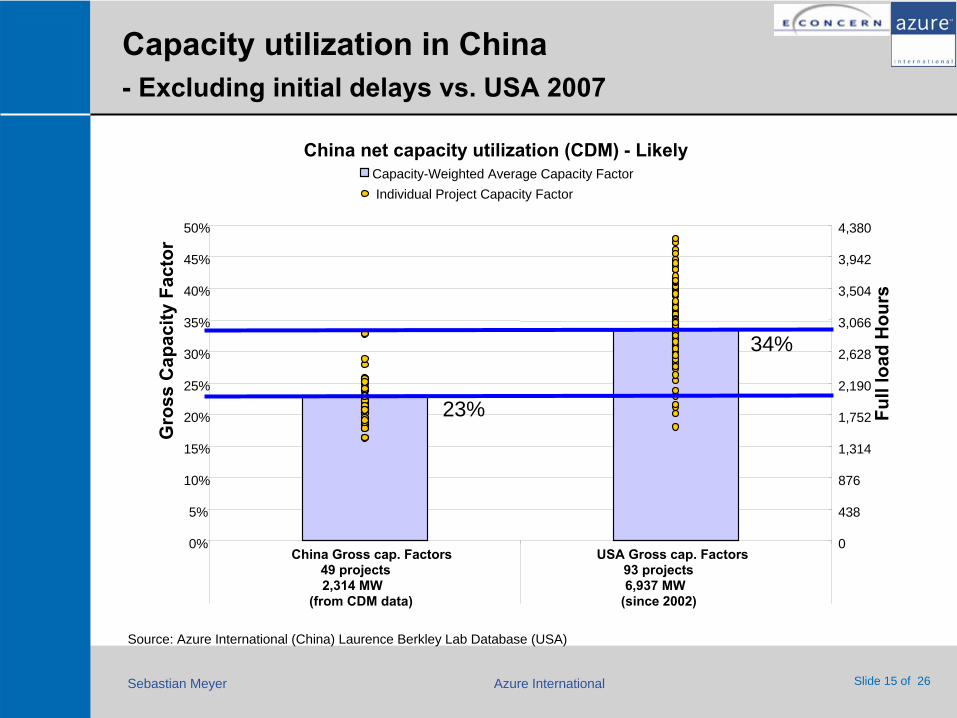
Capacity utilization in China -
Excluding initial delays vs. USA 2007
23%
34%
China net capacity utilization (CDM) -
Likely
0%
5%
10%
15%
20%
25%
30%
35%
40%
45%
50%
China Gross cap. Factors USA Gross cap. Factors49 projects 93 projects2,314 MW 6,937 MW
(from CDM data) (since 2002)
Gro
ss C
apac
ity F
acto
r
0
438
876
1,314
1,752
2,190
2,628
3,066
3,504
3,942
4,380
Full
load
Hou
rs
Capacity-Weighted Average Capacity FactorIndividual Project Capacity Factor
Source: Azure International (China) Laurence Berkley Lab Database (USA)
Sebastian Meyer Azure International Slide 16 of 26
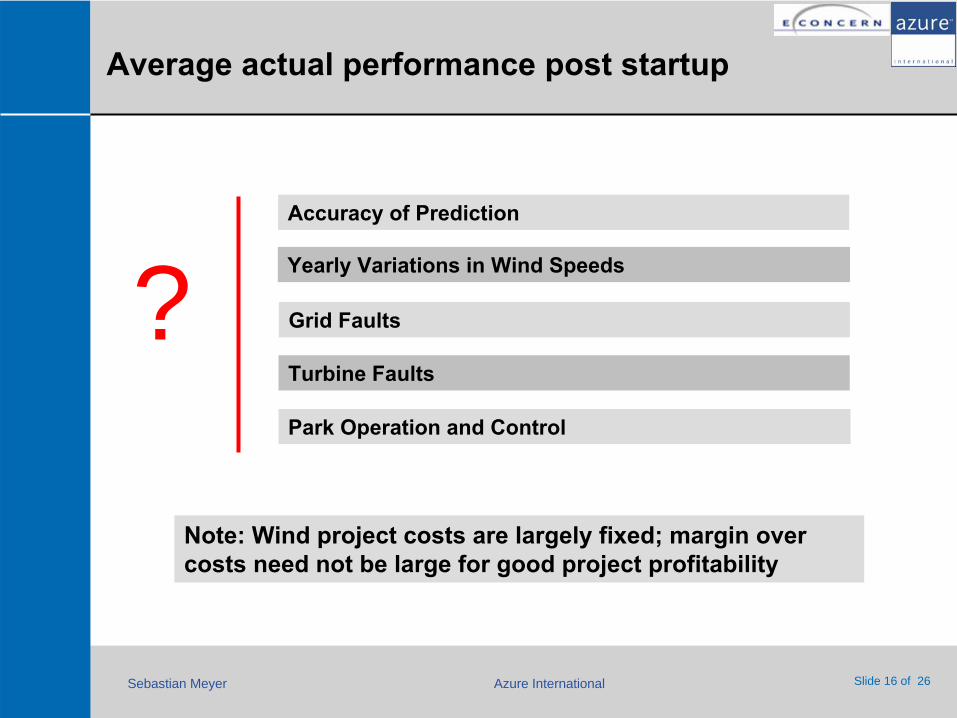
Average actual performance post startup
Accuracy of Prediction
Yearly Variations in Wind Speeds
Grid Faults
Turbine Faults
Park Operation and Control
?
Note: Wind project costs are largely fixed; margin over costs need not be large for good project profitability
Sebastian Meyer Azure International Slide 17 of 26
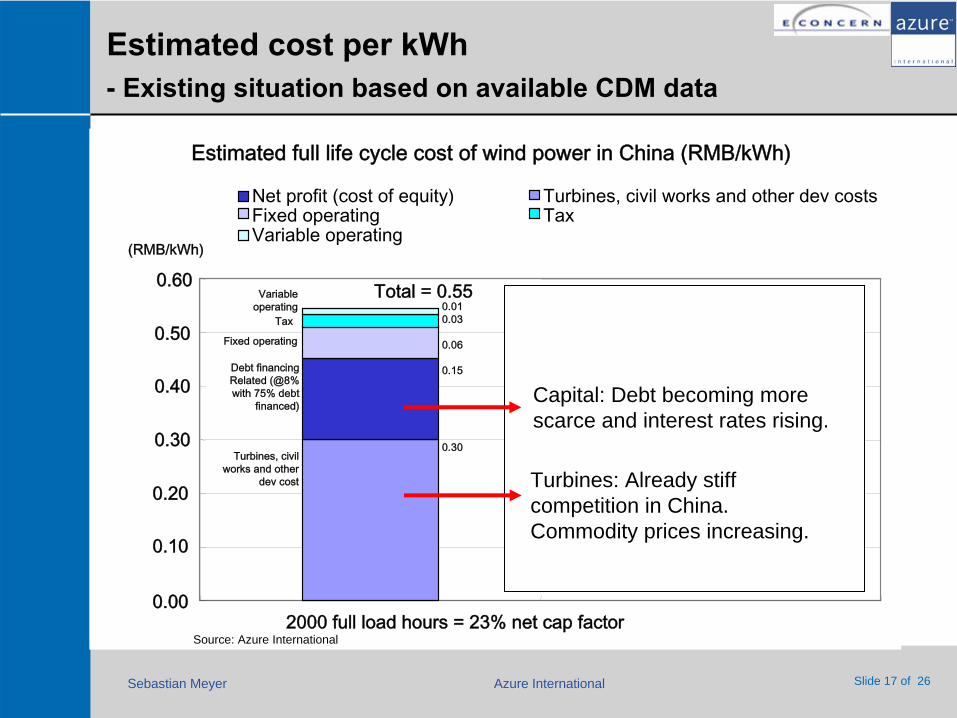
Estimated cost per kWh -
Existing situation based on available CDM data
Estimated full life cycle cost of wind power in China (RMB/kWh)
Turbines, civil works and other
dev cost
Variable operating
0.00
0.10
0.20
0.30
0.40
0.50
0.60
2000 full load hours = 23% net cap factor
(RMB/kWh)
Net profit (cost of equity) Turbines, civil works and other dev costsFixed operating TaxVariable operating
Tax
Fixed operating
Debt financing Related (@8% with 75% debt
financed)
Total = 0.550.010.03
0.06
0.15
0.30
Turbines: Already stiff competition in China. Commodity prices increasing.
Capital: Debt becoming more scarce and interest rates rising.
Source: Azure International
Sebastian Meyer Azure International Slide 18 of 26
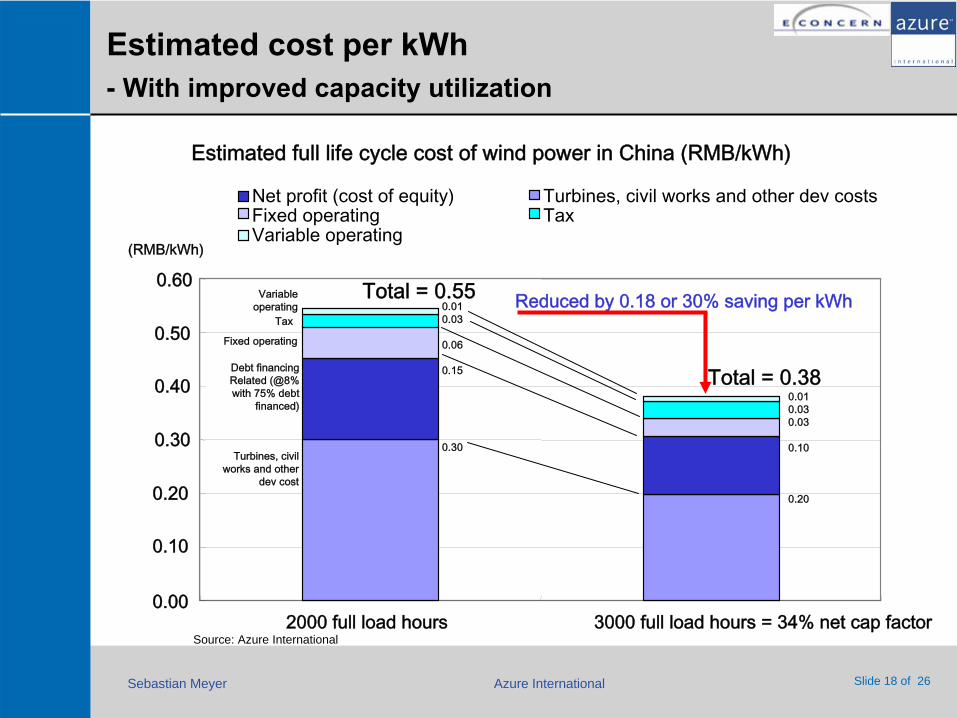
Estimated cost per kWh -
With improved capacity utilization
Estimated full life cycle cost of wind power in China (RMB/kWh)
Turbines, civil works and other
dev cost
Variable operating
0.00
0.10
0.20
0.30
0.40
0.50
0.60
2000 full load hours 3000 full load hours = 34% net cap factor
(RMB/kWh)
Net profit (cost of equity) Turbines, civil works and other dev costsFixed operating TaxVariable operating
Tax
Fixed operating
Debt financing Related (@8% with 75% debt
financed)
Total = 0.55
Total = 0.38
0.010.03
0.06
0.15
0.30
0.010.030.03
0.10
0.20
Reduced by 0.18 or 30% saving per kWh
Source: Azure International
Sebastian Meyer Azure International Slide 19 of 26
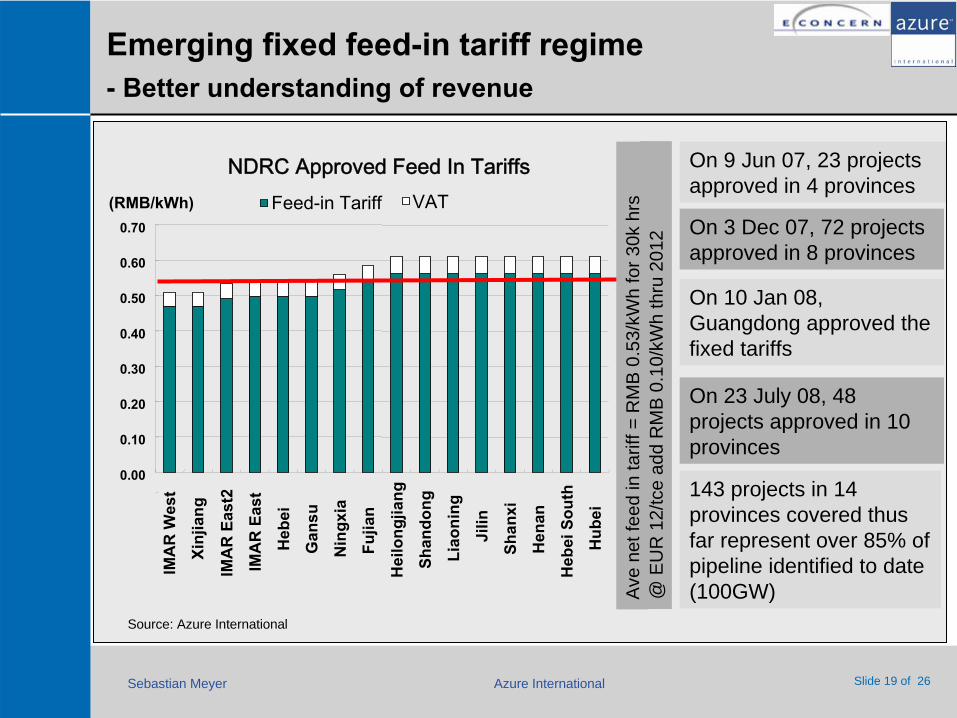
Emerging fixed feed-in tariff regime -
Better understanding of revenue
Source: Azure International
On 3 Dec 07, 72 projects approved in 8 provinces
On 9 Jun 07, 23 projects approved in 4 provinces
On 10 Jan 08, Guangdong approved the fixed tariffs
143 projects in 14 provinces covered thus far represent over 85% of pipeline identified to date (100GW)
On 23 July 08, 48 projects approved in 10 provinces
NDRC
Approved
Feed In Tariffs
0.00
0.10
0.20
0.30
0.40
0.50
0.60
0.70
IMA
R W
est
Xinj
iang
IMA
R E
ast2
IMA
R E
ast
Heb
ei
Gan
su
Nin
gxia
Fujia
n
Hei
long
jiang
Shan
dong
Liao
ning
Jilin
Shan
xi
Hen
an
Heb
ei S
outh
Hub
ei
(RMB/kWh) Feed-in Tariff VAT
Ave
net
feed
in ta
riff =
RM
B 0
.53/
kWh
for 3
0k h
rs@
EU
R 1
2/tc
e ad
d R
MB
0.1
0/kW
h th
ru 2
012
Sebastian Meyer Azure International Slide 20 of 26
`
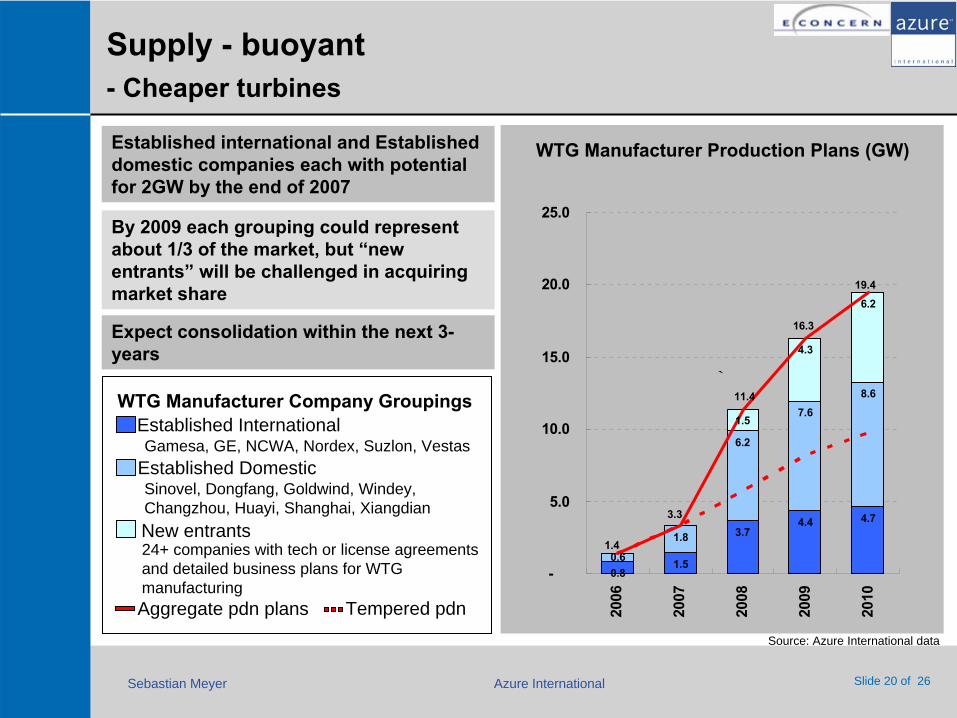
Supply -
buoyant -
Cheaper turbines
WTG Manufacturer Production Plans (GW)Established international and Established domestic companies each with potential for 2GW by the end of 2007
By 2009 each grouping could represent about 1/3 of the market, but “new entrants”
will be challenged in acquiring market share
Expect consolidation within the next 3-
years
24+ companies with tech or license agreements and detailed business plans for WTG manufacturing
Source: Azure International data
WTG Manufacturer Company Groupings
New entrants
Established Domestic
Established InternationalGamesa, GE, NCWA, Nordex, Suzlon, Vestas
Sinovel, Dongfang, Goldwind, Windey, Changzhou, Huayi, Shanghai, Xiangdian
Aggregate pdn plans Tempered pdn
0.81.5
3.74.4 4.7
1.8
6.2
7.68.6
1.5
4.3
6.2
0.6
19.4
16.3
11.4
3.3
1.4
-
5.0
10.0
15.0
20.0
25.0
2006
2007
2008
2009
2010
Sebastian Meyer Azure International Slide 21 of 26
`
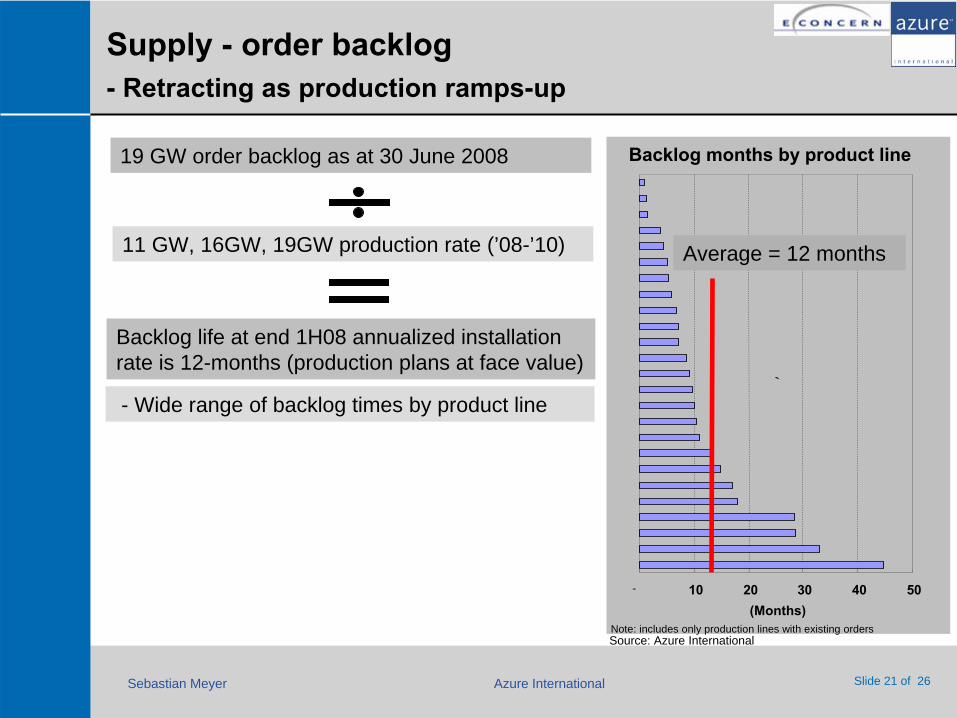
Supply -
order backlog -
Retracting as production ramps-up
19 GW order backlog as at 30 June 2008
11 GW, 16GW, 19GW production rate (’08-’10)
Backlog life at end 1H08 annualized installation rate is 12-months (production plans at face value)
- Wide range of backlog times by product line
Note: includes only production lines with existing ordersSource: Azure International
Backlog months by product line
- 10 20 30 40 50(Months)
Average = 12 months
Sebastian Meyer Azure International Slide 22 of 26
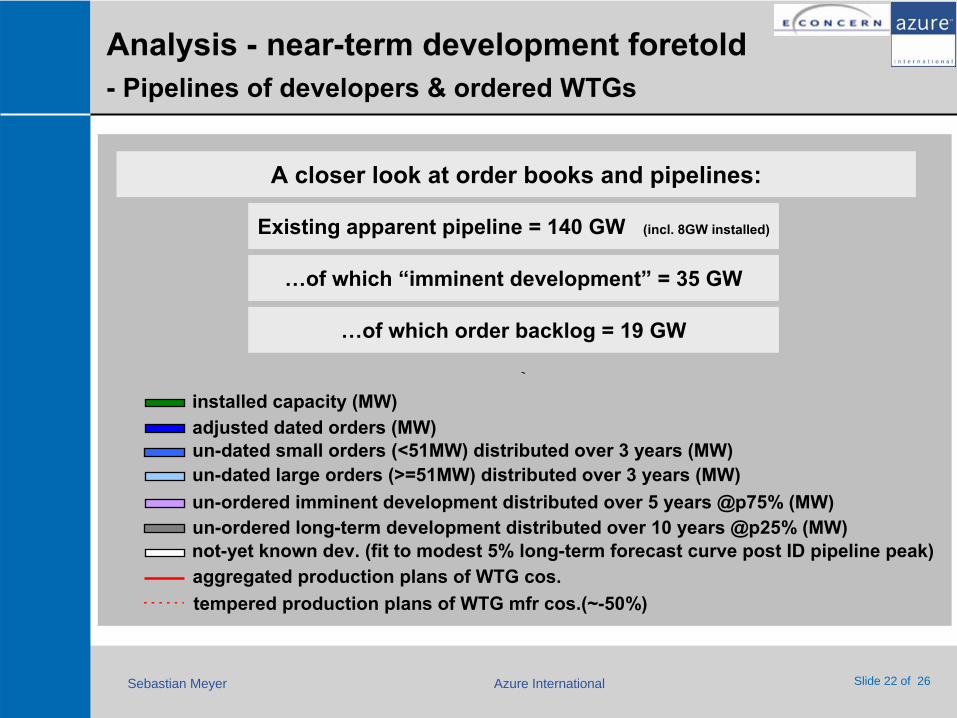
Analysis -
near-term development foretold -
Pipelines of developers & ordered WTGs
`
A closer look at order books and pipelines:
not-yet known dev. (fit to modest 5% long-term forecast curve post ID pipeline peak)
un-dated large orders (>=51MW) distributed over 3 years (MW)un-dated small orders (<51MW) distributed over 3 years (MW)
un-ordered imminent development distributed over 5 years @p75% (MW)un-ordered long-term development distributed over 10 years @p25% (MW)
adjusted dated orders (MW)installed capacity (MW)
aggregated production plans of WTG cos.tempered production plans of WTG mfr cos.(~-50%)
Existing apparent pipeline = 140 GW (incl. 8GW installed)
…of which order backlog = 19 GW
…of which “imminent development”
= 35 GW
Sebastian Meyer Azure International Slide 23 of 26
`
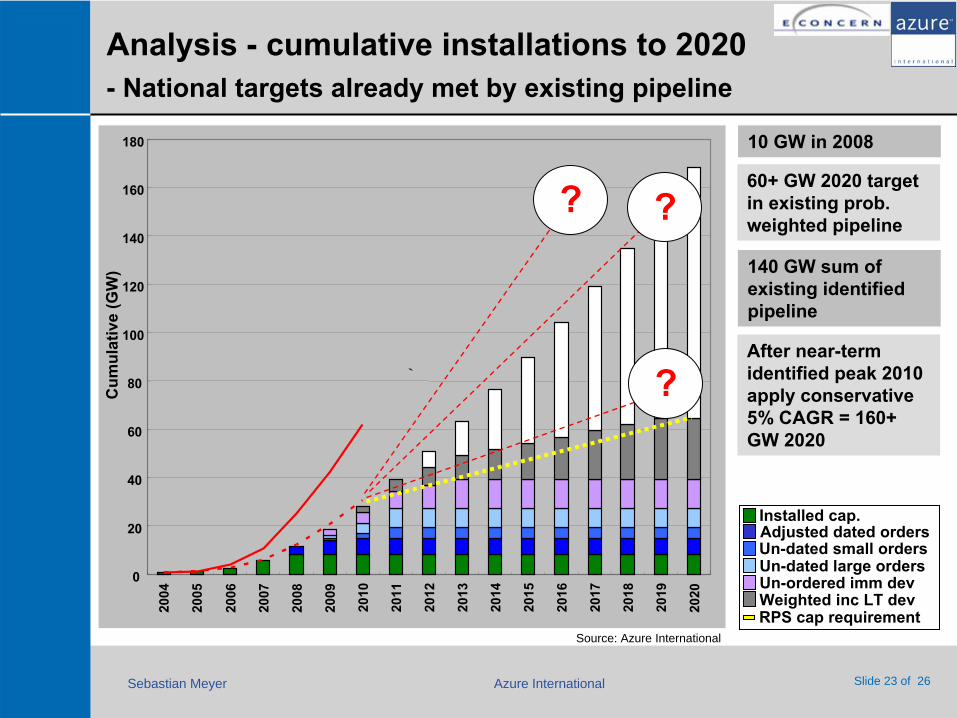
Analysis -
cumulative installations to 2020 -
National targets already met by existing pipeline
10 GW in 2008
60+
GW 2020 target in existing prob. weighted pipeline
140
GW sum of existing identified pipeline
Installed cap.Adjusted dated ordersUn-dated small ordersUn-dated large ordersUn-ordered imm devWeighted inc LT dev
Source: Azure International
After near-term identified peak 2010 apply conservative 5% CAGR = 160+ GW 2020
RPS cap requirement
0
20
40
60
80
100
120
140
160
18020
04
2005
2006
2007
2008
2009
2010
2011
2012
2013
2014
2015
2016
2017
2018
2019
2020
Cum
ulat
ive
(GW
)
? ?
?
Sebastian Meyer Azure International Slide 24 of 26
`
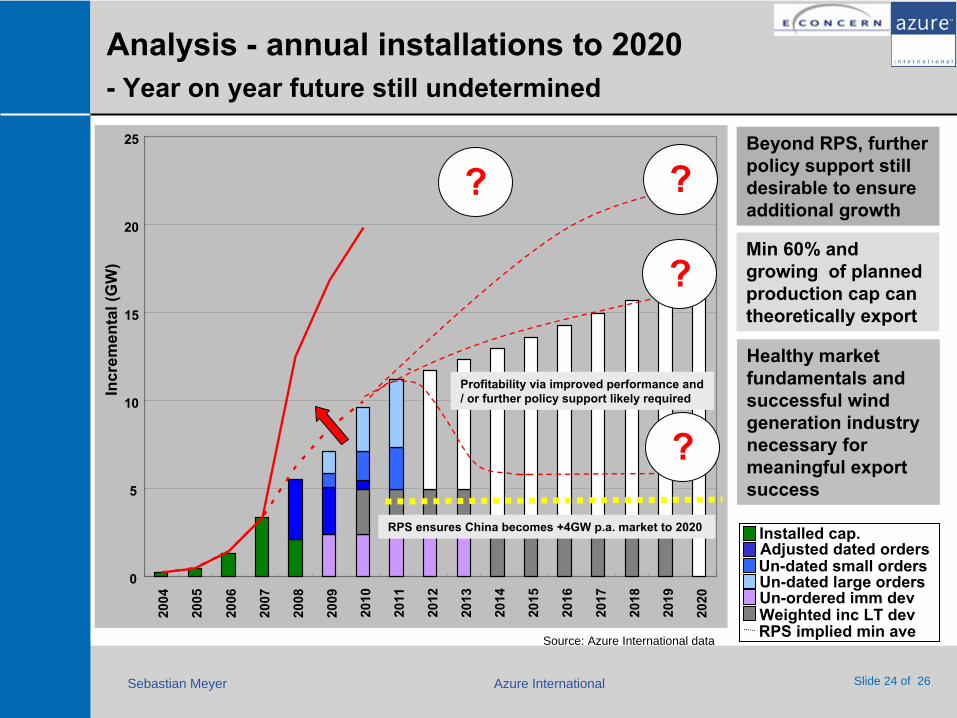
Analysis -
annual installations to 2020 -
Year on year future still undetermined
Beyond RPS, further policy support still desirable to ensure additional growth
Min 60% and growing of planned production cap can theoretically export
Installed cap.Adjusted dated ordersUn-dated small ordersUn-dated large ordersUn-ordered imm devWeighted inc LT dev
Source: Azure International dataRPS implied min ave
Healthy market fundamentals and successful wind generation industry necessary for meaningful export success
0
5
10
15
20
25
2004
2005
2006
2007
2008
2009
2010
2011
2012
2013
2014
2015
2016
2017
2018
2019
2020
Incr
emen
tal (
GW
)
?
?
?
?
RPS ensures China becomes +4GW p.a. market to 2020
Profitability via improved performance and / or further policy support likely required
Sebastian Meyer Azure International Slide 25 of 26
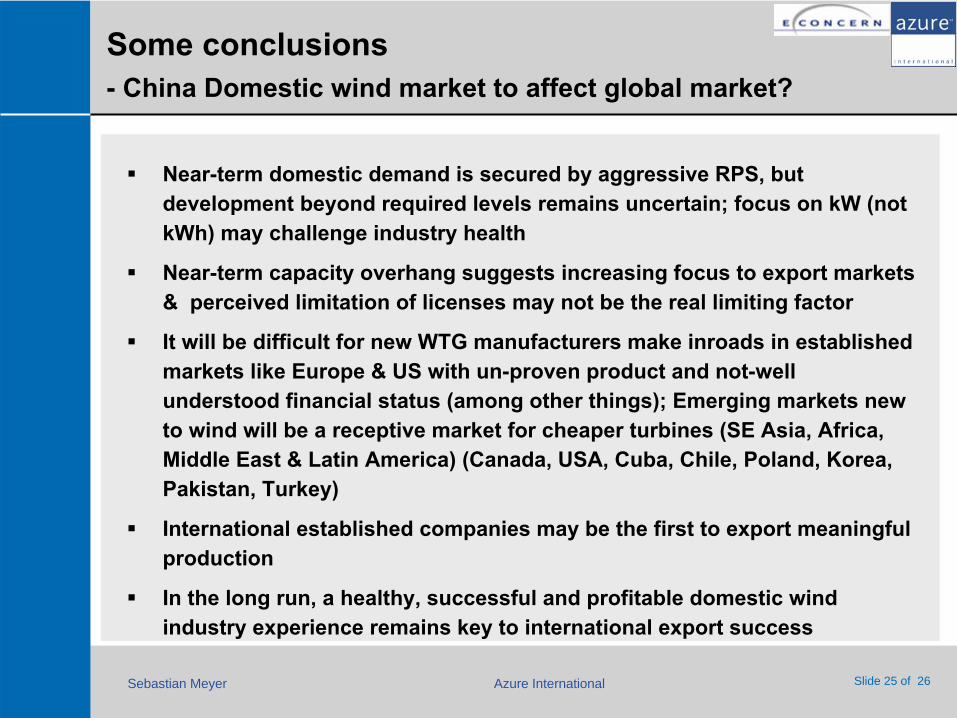
Some conclusions -
China Domestic wind market to affect global market?
Near-term domestic demand is secured by aggressive RPS, but development beyond required levels remains uncertain; focus on kW (not kWh) may challenge industry health
Near-term capacity overhang suggests increasing focus to export markets & perceived limitation of licenses may not be the real limiting factor
It will be difficult for new WTG manufacturers make inroads in established markets like Europe & US with un-proven product and not-well understood financial status (among other things); Emerging markets new to wind will be a receptive market for cheaper turbines (SE Asia, Africa, Middle East & Latin America) (Canada, USA, Cuba, Chile, Poland, Korea, Pakistan, Turkey)
International established companies may be the first to export meaningful production
In the long run, a healthy, successful and profitable domestic wind industry experience remains key to international export success
Sebastian Meyer Azure International Slide 26 of 26
Azure International -
Contact information
Sebastian MeyerDirector, Research & [email protected]: +86 10 8447 7053Fax: +86 10 8447 7058
Oriental KenzoSuite H, Office Tower, 6th Floor48, Dongzhimen Wai Street100027 Dong Cheng District, BeijingPR Chinawww.azure-international.com
Welcome to visit us at our office: