Embed Size (px)
Citation preview
Racial Disproportionality in Washington State36
Racial Disproportionality in Washington State 37
Across the country, children of color are present in the child welfare system at rates greater than their proportions in the population.1 This over-representation is referred to as “racial disproportionality.” In Washington State, a 2004 study of the child welfare system in King County found that American Indian (Indian) and Black children were overrepresented at all points in the system.2
The 2007 Legislature created the Racial Disproportionality Advisory Committee to study disproportion in Washington’s child welfare system.3 The Committee was directed to investigate whether racial disproportionality exists in Washington’s child welfare system and, if so, to identify those decision points in the system where disproportional-ity occurs. The legislation also directed the Washington State Institute for Public Policy (Institute) to provide technical assistance to the Committee. By June 2008, the Com-mittee must prepare a report for the Secretary of the Department of Social and Health Services (DSHS) on the prevalence of disproportionality. This report was prepared for the Advisory Committee to aid in writing its report.
After describing our data sources, definitions, and approach in Section I, we present descriptive statistics on racial disproportionality and factors related to child welfare outcomes (Section II). Last, we provide results of regression analyses that control for multiple factors simultaneously to see the combined effects on disproportionality (Sec-tion III).
Some tribes in Washington State operate their own juvenile courts and/or their own child welfare systems. Indian children may initially enter the state child welfare system and then transfer to tribal child welfare system. Further, a state court asserting jurisdic-tion over an Indian child may transfer jurisdiction to a tribal court and, in many cases, tribal courts have jurisdiction of the dependency action from the beginning. Information on children who are solely under tribal court jurisdiction and/or who are not served only by tribal child welfare agencies was not available for this analysis. Therefore, these find-ings are limited to Indian children who are served by the state child welfare system.
Section I: Approach to AnalysisThe overall approach to analysis was guided by the legislative direction (see sidebar, pg. 39).4
In studies of the child welfare system, two approaches are common. One is a “snap-shot” that looks at the population in the system at one point in time. The second involves following a cohort of children from entry into the child welfare system through subsequent events.
Both approaches have their strengths and weaknesses. The snapshot approach is valuable for program administration, because it reveals the population’s composition and informs resource allocations. For example, infants may require different services than adolescents. If one is interested in decision-making across a system, however, it is necessary to follow a cohort of individuals from entry. Such a cohort analysis reveals the dynamics of a population over time.
The Legislature directed that this study examine entries and exits at each stage of the child welfare system. Thus, a cohort approach was necessary to investigate the deci-sions and outcomes for children once they have contact with the child welfare system.
Cautions and Limitations. This analysis is descriptive, covering characteristics of the child welfare system’s population. The analysis does not attempt to explain or uncover the causes of disproportionality.
Study Population. For this analysis, we began with all referrals to Child Protective Services (CPS) that occurred in 2004. Resolution of child welfare cases can take con-
Marna Miller, Ph.D. Senior Researcher
WSIPP SUMMARYIn 2004, the focus year for the analysis, we identified 58,005 children referred to Child Protec-tive Services (CPS). These children were followed through November 2007. We examined the propor-tions of children from various racial groups at different points in the child welfare system to determine whether disproportionality exists in the system. Statewide findings indicate the following:
Referral to CPSPatterns of disproportionality are evident at the time of reports to CPS alleging child abuse or neglect. Compared with White children:
• AmericanIndianchildrenwerethree times as likely to be re-ferred to CPS.
• Blackchildrenwerenearlytwiceas likely to be referred to CPS.
• Hispanicchildrenwere1.3timesas likely to be referred to CPS.
• Asianchildrenwerelesslikelytobe referred to CPS.
Persons required by law to report suspected abuse and neglect (mandated reporters) accounted for about 60 percent of initial referrals to CPS for Indian, Black, Hispanic, and White children; 72 percent of referred Asian children were referred by mandated report-ers.
Decisions After ReferralAs we followed children after a CPS referral, we calculated the dis-proportionality that occurred within the child welfare system. We found that patterns of disproportional-ity varied by race. Compared with White children referred to CPS, after referral:
• Indianchildrenwere1.6timesaslikely to be removed from home and twice as likely to remain in foster care for over two years.
Racial Disproportionality in Washington State38
siderable time. We chose 2004 because it allows at least two years of follow-up for all children. We identified 58,005 individual children referred to CPS in that year.
We begin with a descriptive analysis, looking at racial disproportionality at each deci-sion point. Later, we take a more comprehensive approach to the analysis that controls for factors that prior research indicates may influence child welfare outcomes, such as prior contacts with the welfare system, nature of the alleged abuse, gender, and type of referrer.
This analysis is based on children, not on families. Because a child might be referred more than once in a year, we “unduplicated” the referral data so that each child was represented only once.
This unduplication allows us to examine the entire population of children involved at each decision point without confusing the issue of children with multiple referrals.5
Defining Race. Race is a complex concept that carries many cultural interpretations. Individuals may have more than one racial or ethnic heritage. In the 2000 Census, respondents could choose as many races/ethnicities as were necessary to describe themselves.6 While most Americans described themselves as one race only, 2.4 percent indicated more than one race and some indicated up to six racial categories, in addition to Hispanic origin.
The Children’s Administration database allows up to six races, as well as a code for Hispanic heritage.7 Of the children with a CPS referral in 2004, 8 percent had more than one race/ethnicity code. For this analysis, children were assigned to racial categories based on rules determined by the Advisory Committee’s Research Subcommittee. Each child was assigned only one race, so that percentages totaled to 100 percent.8 Although we lose some of the richness and complexity of the child population’s racial and ethnic composition, this classification scheme permits more clarity in describing results. The rules are as follows:
American Indian. If any of the six racial codes indicated American Indian background, the child was coded Indian in our analysis.
Black. If a child had no Indian heritage, but any of the codes indicated Black or African American, the child was coded as Black.
Asian/Pacific Islander. If a child was coded as Asian or one of the codes for Pacific Islander, with no Black or American Indian heritage, the child’s race was coded as Asian. We would have preferred to look at Pacific Islanders separately; however, this popula-tion is too small for a meaningful statewide analysis.9
Hispanic. Any child with Hispanic heritage, but not in the first three categories, was coded as Hispanic.
White. Any child with no indication of Indian, Black, Asian, or Hispanic race/ethnicity was coded as White.
In order to measure disproportionality, we must also know the number of children in each race statewide. To obtain these numbers, we used modified Census data for each county in Washington.10 For each age group, these data provide the number of persons in each of 124 possible combinations of ethnicity, gender, and multiple races. We calcu-lated the statewide and regional population of children by race using the same defini-tions applied to the child welfare population.
• Blackchildrenwere1.2timesmore likely to be removed from home and 1.5 times more likely to remain in care for over two years.
• Hispanicchildrenwerenomorelikely to be removed from home or to remain in care for over two years.
• Asianchildrenwerenomorelikely to be removed from home and less likely to remain in care for over two years.
Poverty and Family StructureChildren from poor families and those from single parent house-holds are overrepresented in the child welfare system.
When we statistically controlled for poverty, family structure, and case characteristics, the patterns of disproportionality did not change for Black, Hispanic, or Asian chil-dren. For Indian children, however, disproportionality after referral was reduced by about 45 percent.
Regional VariationDisproportionality varies among the DSHS administrative regions; the largest disproportionality after re-ferral was seen with Indian children in Region 4.
Racial Disproportionality in Washington State 39
Data Sources
Data for this report came from several sources. The Children’s Administration Manage-ment Information System (CAMIS) was the source for all referrals, accepted referrals, and placements (children removed from home). The legal events module in CAMIS provided information on court events when dependency cases were filed for children. Further legal information was obtained by matching children to superior court records on dependency cases and cases involving termination of parental rights. Washington’s Office of Financial Management provided county-level information on the number of persons by age in various combinations of racial and ethnic categories, based on the 2000 Census.
The legislation directs the Committee to study how poverty and family structure affect disproportionality. Since the earlier referenced data sources do not provide information on income or family structure for families referred to CPS, the Research Subcommittee agreed to use a family’s receipt of food stamps during 2004 as a measure of poverty. Food stamp records also provide some information on family structure.
CAMIS does not identify out-of-home placements resulting from CPS referrals. We therefore use the same procedure used by Children’s Administration in its federal reporting to the National Child Abuse and Neglect Data System (NCANDS). NCANDS defines an out-of-home placement occurring in the 90 days following a referral to be a CPS placement.11
Factors That May Affect Disproportionality
In addition to family structure and poverty, the legislation directs the Advisory Commit-tee to consider geography in its analysis. We have also included the category of person reporting the alleged abuse and neglect, and the age and gender of the children. We use DSHS administrative region to account for geography.
Family Structure. The Research Subcommittee recommended we use eight categories of family structure. These were children living with:
• Marriedcouple
• Singlemotheronly
• Singlemotherandpartner
• Singlemotherandothers
• Singlefatheronly
• Singlefatherandpartner
• Singlefatherandothers
• Relativeorguardian
CAMIS collects data on family structure only for children removed from home. CAMIS definitions of family structure allow us to identify only the following:
• Marriedcouple
• Singlefather
• Singlemother
• Unmarriedcouple
DSHS Division of Research and Data Analysis (RDA) matched children who were referred to CPS in 2004 against families receiving food stamps in 2004. Food stamp records provide information about household composition. We were able to evaluate the effect of family structure following a CPS referral for those families receiving food stamps. For these cases, definitions of family structure from the Research Subcommittee were used.
STUDY LANGUAGE FROM THE 2007 LEGISLATURE“The secretary of the department of social and health services shall convene an advisory committee to analyze and make recommenda-tions on the disproportionate rep-resentation of children of color in Washington’s child welfare system. The department shall collaborate with the Washington institute for public policy and private sector en-tities to develop a methodology for the advisory committee to follow in conducting a baseline analysis of data from the child welfare system to determine whether racial dis-proportionality and racial disparity exist in this system.”
“At a minimum, the advisory com-mittee shall examine and analyze: (a) The level of involvement of chil-dren of color at each stage in the state’s child welfare system, includ-ing the points of entry and exit, and each point at which a treatment decision is made; (b) the number of children of color in low-income or single-parent families involved in the state’s child welfare system; (c) the family structures of families involved in the state’s child welfare system; and (d) the outcomes for children in the existing child wel-fare system. This analysis shall be disaggregated by racial and ethnic group, and by geographic region.”
“If the results of the analysis indi-cate disproportionality or disparity exists for any racial or ethnic group in any region of the state, the com-mittee, in conjunction with the sec-retary of the department of social and health services, shall develop a plan for remedying the dispropor-tionality or disparity.”
SHB1472,Chapter465,Lawsof2007
Racial Disproportionality in Washington State40
Poverty. We define poverty as receipt of food stamps in the year of the study. As men-tioned above, RDA matched records of children with a CPS referral to those of families receiving food stamps in 2004.
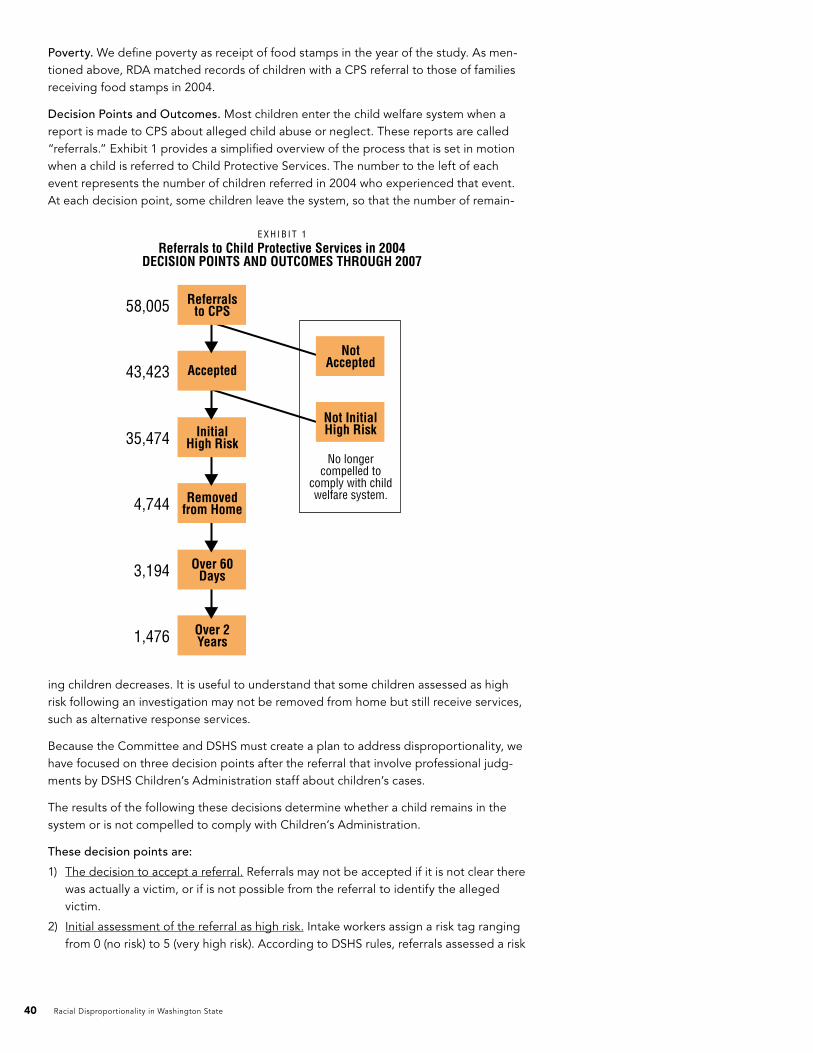
Decision Points and Outcomes. Most children enter the child welfare system when a report is made to CPS about alleged child abuse or neglect. These reports are called “referrals.” Exhibit 1 provides a simplified overview of the process that is set in motion when a child is referred to Child Protective Services. The number to the left of each event represents the number of children referred in 2004 who experienced that event. At each decision point, some children leave the system, so that the number of remain-
ing children decreases. It is useful to understand that some children assessed as high risk following an investigation may not be removed from home but still receive services, such as alternative response services.
Because the Committee and DSHS must create a plan to address disproportionality, we have focused on three decision points after the referral that involve professional judg-ments by DSHS Children’s Administration staff about children’s cases.
The results of the following these decisions determine whether a child remains in the system or is not compelled to comply with Children’s Administration.
These decision points are:
1) The decision to accept a referral. Referrals may not be accepted if it is not clear there was actually a victim, or if is not possible from the referral to identify the alleged victim.
2) Initial assessment of the referral as high risk. Intake workers assign a risk tag ranging from 0 (no risk) to 5 (very high risk). According to DSHS rules, referrals assessed a risk
Not InitialHigh Risk
No longercompelled to
comply with childwelfare system.
NotAccepted
1,476 Over 2Years
3,194 Over 60Days
4,744 Removedfrom Home
35,474 InitialHigh Risk
43,423 Accepted
58,005 Referralsto CPS
E X H I B I T 1
Referrals to Child Protective Services in 2004DECISION POINTS AND OUTCOMES THROUGH 2007
Racial Disproportionality in Washington State 41
of 3 (moderate risk) or greater require an investigation. Families with risk tags of 1 or 2 may be referred to an alternative response system.
3) Child removed from home. If a decision is made to remove the child, the child may be placed in a foster home or in the home of a relative. In this report we refer to this decision as “placement.”12
Analysis of each decision point was conducted separately. For each decision point, we identified all the children who had been moved to that point at least once during 2004.13 In our analysis, we identified 58,005 individual children with a referral to CPS. Of those children, 43,358 had an accepted referral; cases of 35,493 children were assessed high risk at intake; and, 4,744 were removed from home.
We do not analyze substantiation of the referral as a separate decision point. Substan-tiation is the determination that abuse or neglect occurred. This statistic is commonly used in the child welfare literature and is required for federal reporting. In Washington, however, substantiation (called “founded” in Washington) of a referral does not appear to be a predictor of further child outcomes. For example, of the 4,744 children removed from home after a CPS referral, 48 percent did not have a founded referral.14 Children’s Administration uses a combination of investigation findings and risk to determine removal of children. Unlike the decision points we include in our analysis, even if none of the allegations are substantiated (founded), the child may remain in the child welfare system. Thus, “founded” is not a clear decision point in Washington.
If children are removed from home, timelines for court involvement are defined by state and federal laws. The following sequence and timing of events is outlined in the federal Adoption and Safe Families Act of 1997 (ASFA):
1) If a child is removed from home and the removal is not voluntary, DSHS must file a dependency petition in the courts within 72 hours of removal.15
2) Within 75 days of filing, a fact-finding disposition hearing is held.16 Within 14 days of the fact-finding disposition, a hearing is held to determine if a dependency is established. A dependency generally means that the child is in the care and custody of the State.17
3) A permanency planning hearing must be held by 12 months following the court case filing. If the dependency remains open, a permanency planning hearing must be held every 12 months thereafter.
4) The state must move to terminate parental rights if a child has been in out-of-home placement for 15 of the previous 22 months.18,19
Outcomes that will be examined in this report for children removed from home include:
• Placementsforover60days
• Placementsforovertwoyears
• Placementwithrelatives
• Reunificationwithparents
• Guardianshipestablished.(Thislegalactionisconsideredapermanentoutcome.Although the case technically remains open in Children’s Administration, it requires a lower level of supervision. In our analysis, we consider the case closed.)20
• Filingofdependencycase
• Establishmentofdependency
• Terminationofparentalrights
• Adoption
• Anypermanentarrangement(reunification,guardianship,adoption)withintwoyearsof removal from home
Racial Disproportionality in Washington State42
Order of Findings: First Descriptive, Then Refined With Regression Analysis. Section II of this report presents descriptive statistics on disproportionality for key decision points and outcomes. However, factors such as poverty, family structure, prior history with the child welfare system, age of the child, type of reporter (mandated or relatives/neighbors), or the type of alleged maltreatment may influence decisions and outcomes. Observed racial disproportionality may be partially explained by variation in these fac-tors among racial or ethnic groups.
Section III of the report presents information from regression analyses that help isolate the effect of a child’s race from the many factors that can affect outcomes for children in the child welfare system.
Children may also enter the child welfare system when families are in crisis, either because of parental circumstances or because of child behavior. We provide a separate analysis of cases not linked to a CPS referral in Appendix A.6
Measuring Disproportionality
This analysis creates a Disproportionality Index (DI) for children in various racial groups compared with White children. The DI measures the chances of an event occurring for a child of color compared with the chances for a White child.
First we calculate rates for each racial group at each decision point. For example, 5,612 Indian children were referred to Child Protective Services (CPS) in 2004. According to the census, there were 55,872 children with any Indian heritage in Washington in 2000. We calculate the rate for Indian children by dividing the number of children referred by the number of children in the population and multiplying the result by 1,000 to get the rate per 1,000 children:
Rate of referral for Indian children: (5,612 55,872) 1,000 = 100
Thisrepresentsarateof100Indianchildrenreferredforevery1,000Indianchildreninthepopulation.
Disproportionality Index (DI). Because children of various races are not represented evenly in the population, we employ a metric commonly used to compare rates be-tween races: the Disproportionality Index. At each event, we calculate the DI for each racial group compared with White children by dividing the rate of referral of each racial group by the rate for White children. Using this same example, the comparable rate for White children was 34 per 1,000 children.
DI of referral for Indian children: 100 ÷ 34 = 2.92
ThismeansthatIndianchildrenarenearlythreetimesaslikelytobereferredtoCPSasWhitechildren.
The first measure of disproportionality is at the point of the referral to CPS. This calcula-tion reveals whether children of other races are referred at rates greater or less than those of White children.
Next, we calculate the disproportionality that may occur after children are referred to CPS. In calculating disproportionality after referral, we build on the approach outlined by Mark Courtney at the first meeting of the Advisory Committee. Courtney examined the outcomes for racial/ethnic groups as children are moved through the child welfare system.21 This approach allows us to understand the influence of race once children have been brought to the attention of the child welfare system.
Racial Disproportionality in Washington State 43
As a third step, we take advantage of a statistical technique called logistic regression to isolate the effects of race separate from other case characteristics. This technique is commonly used in medicine and other fields. For example, logistic regression can be used to calculate the effect of body mass index on the likelihood of a heart attack, con-trolling for smoking and cholesterol levels. Recently, logistic regression has been used to examine racial disproportionality in Minnesota’s child welfare system.22 As was done in the Minnesota analysis, we used logistic regression to measure the effect of race on outcomes while simultaneously controlling for factors known to affect outcomes in child welfare systems.
Section II: Descriptive Disproportionality Statistics and Factors Re-lated to Child Welfare OutcomesThe findings from this analysis focus on several questions:
• DoesracialdisproportionalityexistinWashington’schildwelfaresystem?Ifso,whichracial groups are over-represented compared with White children?
• Howdoesdisproportionalityaffectoutcomesforchildren?
• Howisdisproportionalityaffectedbyfamilystructure,poverty,geography,andother factors?
We begin with descriptive statistics showing the rates and disproportionality for chil-dren at different decision points and outcomes.
Does racial disproportionality exist in Washington’s child welfare system? If so, which racial groups are over-represented compared with White children?
When we look at the child welfare system overall, we see some significant differences between the rates of involvement of White children and children of other races. Indian, Black, and Hispanic children are over-represented in the child welfare system compared with White children. Asian children, on the other hand, are represented at rates lower than their proportions in the state population.
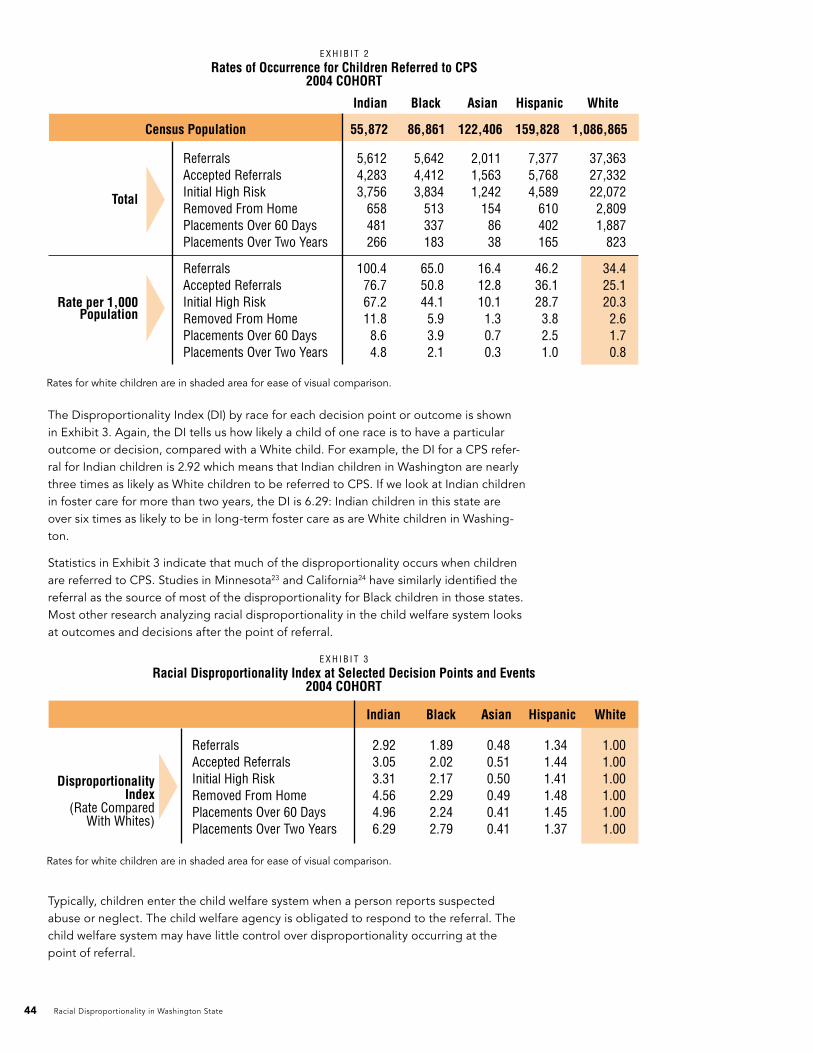
Exhibit 2 displays populations and rates for each of the races at selected decision points and child outcomes:
• Referrals
• Acceptedreferrals
• Initialhighrisk
• Removedfromthehome
• Placementsover60days
• Placementsovertwoyears
At the point of referral, we learn that Indian children had the highest rate of referral (100 children per 1,000 population) to the child welfare system, followed by Black children (65/1,000), Hispanic children (46/1,000), White children (34/1,000), and Asian children (16/1,000). If all races had the same rates, we would conclude there was no dispropor-tionality at the point of referral.
Racial Disproportionality in Washington State44
Census Population 55,872 122,406 159,828 1,086,865
37,36327,33222,0722,8091,887
823
34.425.120.32.61.70.8
7,3775,7684,589
610402165
46.236.128.73.82.51.0
2,0111,5631,242
1548638
16.412.810.11.30.70.3
86,861
5,6424,4123,834
513337183
65.050.844.15.93.92.1
E X H I B I T 2
Rates of Occurrence for Children Referred to CPS2004 COHORT
Total
Rate per 1,000Population
ReferralsAccepted ReferralsInitial High RiskRemoved From HomePlacements Over 60 DaysPlacements Over Two Years
ReferralsAccepted ReferralsInitial High RiskRemoved From HomePlacements Over 60 DaysPlacements Over Two Years
5,6124,2833,756
658481266
100.476.767.211.88.64.8
Indian Asian Hispanic WhiteBlack
The Disproportionality Index (DI) by race for each decision point or outcome is shown in Exhibit 3. Again, the DI tells us how likely a child of one race is to have a particular outcome or decision, compared with a White child. For example, the DI for a CPS refer-ral for Indian children is 2.92 which means that Indian children in Washington are nearly three times as likely as White children to be referred to CPS. If we look at Indian children in foster care for more than two years, the DI is 6.29: Indian children in this state are over six times as likely to be in long-term foster care as are White children in Washing-ton.
Statistics in Exhibit 3 indicate that much of the disproportionality occurs when children are referred to CPS. Studies in Minnesota23 and California24 have similarly identified the referral as the source of most of the disproportionality for Black children in those states. Most other research analyzing racial disproportionality in the child welfare system looks at outcomes and decisions after the point of referral.
Typically, children enter the child welfare system when a person reports suspected abuse or neglect. The child welfare agency is obligated to respond to the referral. The child welfare system may have little control over disproportionality occurring at the point of referral.
1.001.001.001.001.001.00
1.341.441.411.481.451.37
0.480.510.500.490.410.41
1.892.022.172.292.242.79
E X H I B I T 3
Racial Disproportionality Index at Selected Decision Points and Events2004 COHORT
DisproportionalityIndex
(Rate ComparedWith Whites)
ReferralsAccepted ReferralsInitial High RiskRemoved From HomePlacements Over 60 DaysPlacements Over Two Years
2.923.053.314.564.966.29
Indian Asian Hispanic WhiteBlack
Rates for white children are in shaded area for ease of visual comparison.
Rates for white children are in shaded area for ease of visual comparison.
Racial Disproportionality in Washington State 45
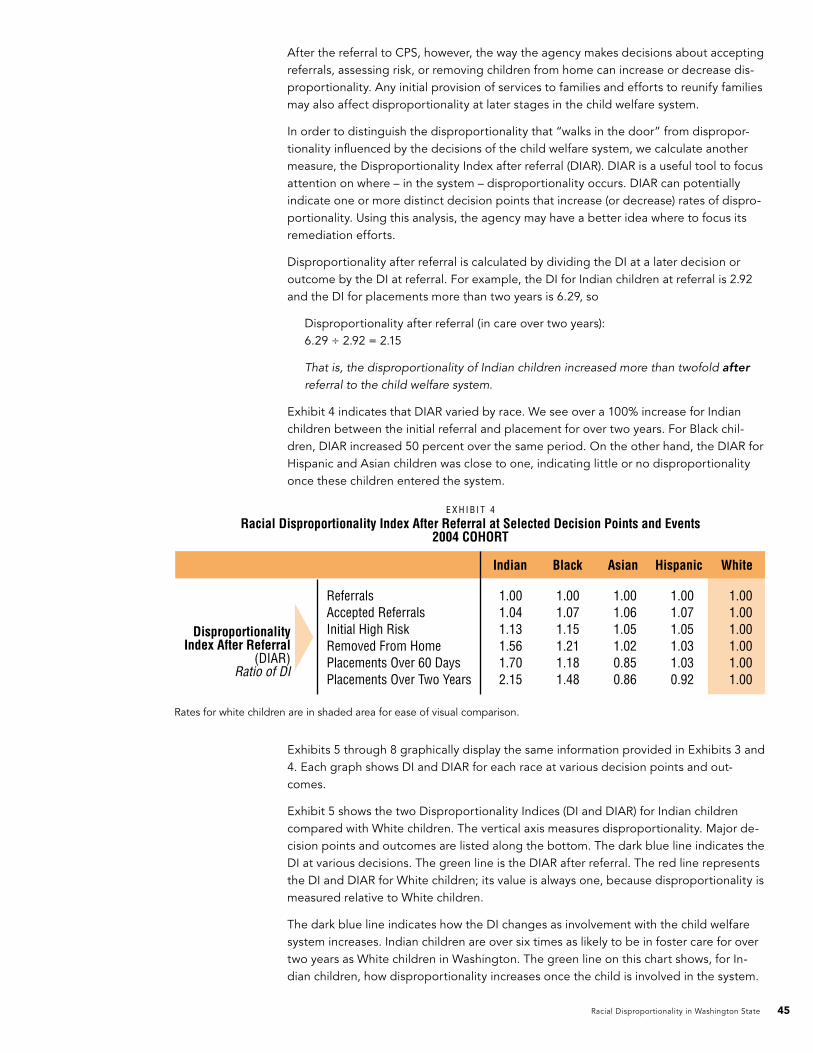
After the referral to CPS, however, the way the agency makes decisions about accepting referrals, assessing risk, or removing children from home can increase or decrease dis-proportionality. Any initial provision of services to families and efforts to reunify families may also affect disproportionality at later stages in the child welfare system.
In order to distinguish the disproportionality that “walks in the door” from dispropor-tionality influenced by the decisions of the child welfare system, we calculate another measure, the Disproportionality Index after referral (DIAR). DIAR is a useful tool to focus attention on where – in the system – disproportionality occurs. DIAR can potentially indicate one or more distinct decision points that increase (or decrease) rates of dispro-portionality. Using this analysis, the agency may have a better idea where to focus its remediation efforts.
Disproportionality after referral is calculated by dividing the DI at a later decision or outcome by the DI at referral. For example, the DI for Indian children at referral is 2.92 and the DI for placements more than two years is 6.29, so
Disproportionality after referral (in care over two years): 6.29 ÷ 2.92 = 2.15
Thatis,thedisproportionalityofIndianchildrenincreasedmorethantwofoldafter referraltothechildwelfaresystem.
Exhibit 4 indicates that DIAR varied by race. We see over a 100% increase for Indian children between the initial referral and placement for over two years. For Black chil-dren, DIAR increased 50 percent over the same period. On the other hand, the DIAR for Hispanic and Asian children was close to one, indicating little or no disproportionality once these children entered the system.
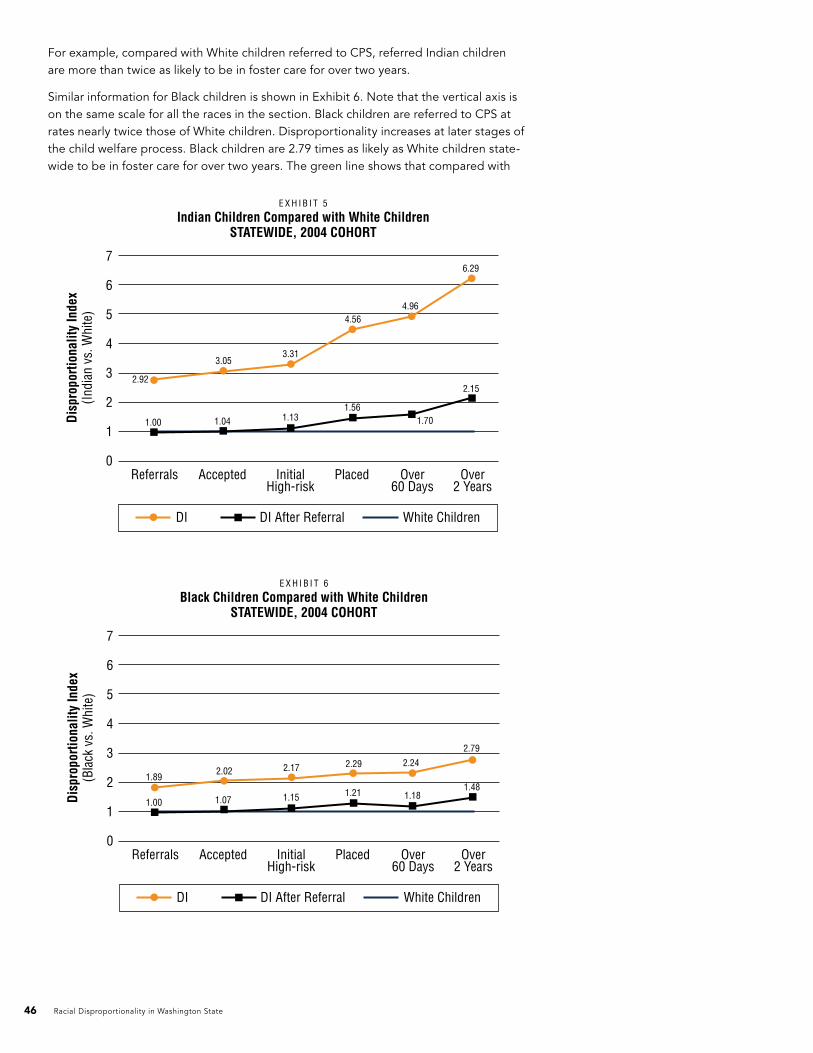
Exhibits 5 through 8 graphically display the same information provided in Exhibits 3 and 4. Each graph shows DI and DIAR for each race at various decision points and out-comes.
Exhibit 5 shows the two Disproportionality Indices (DI and DIAR) for Indian children compared with White children. The vertical axis measures disproportionality. Major de-cision points and outcomes are listed along the bottom. The dark blue line indicates the DI at various decisions. The green line is the DIAR after referral. The red line represents the DI and DIAR for White children; its value is always one, because disproportionality is measured relative to White children.
The dark blue line indicates how the DI changes as involvement with the child welfare system increases. Indian children are over six times as likely to be in foster care for over two years as White children in Washington. The green line on this chart shows, for In-dian children, how disproportionality increases once the child is involved in the system.
1.001.001.001.001.001.00
1.001.071.051.031.030.92
1.001.061.051.020.850.86
1.001.071.151.211.181.48
E X H I B I T 4
Racial Disproportionality Index After Referral at Selected Decision Points and Events2004 COHORT
DisproportionalityIndex After Referral
(DIAR)Ratio of DI
ReferralsAccepted ReferralsInitial High RiskRemoved From HomePlacements Over 60 DaysPlacements Over Two Years
1.001.041.131.561.702.15
Indian Asian Hispanic WhiteBlack
Rates for white children are in shaded area for ease of visual comparison.
Racial Disproportionality in Washington State46
For example, compared with White children referred to CPS, referred Indian children are more than twice as likely to be in foster care for over two years.
Similar information for Black children is shown in Exhibit 6. Note that the vertical axis is on the same scale for all the races in the section. Black children are referred to CPS at rates nearly twice those of White children. Disproportionality increases at later stages of the child welfare process. Black children are 2.79 times as likely as White children state-wide to be in foster care for over two years. The green line shows that compared with
7
6
5
4
3
2
1
0Referrals Accepted PlacedInitial
High-riskOver
60 DaysOver
2 Years
Dis
prop
ortio
nalit
y In
dex
(Ind
ian
vs. W
hite
)
DI DI After Referral White Children
2.92
3.053.31
4.564.96
6.29
1.131.56
1.70
2.15
1.041.00
E X H I B I T 5
Indian Children Compared with White ChildrenSTATEWIDE, 2004 COHORT
7
6
5
4
3
2
1
0Referrals Accepted PlacedInitial
High-riskOver
60 DaysOver
2 Years
Dis
prop
ortio
nalit
y In
dex
(Bla
ck v
s. W
hite
)
DI DI After Referral White Children
1.892.02 2.17 2.29 2.24
2.79
1.15 1.21 1.181.48
1.071.00
E X H I B I T 6
Black Children Compared with White ChildrenSTATEWIDE, 2004 COHORT
Racial Disproportionality in Washington State 47
7
6
5
4
3
2
1
0Referrals Accepted PlacedInitial
High-riskOver
60 DaysOver
2 YearsD
ispr
opor
tiona
lity
Inde
x(A
sian
vs.
Whi
te)
DI DI After Referral White Children
0.48 0.51 0.50 0.49 0.41 0.41
1.05 1.02 0.85 0.861.061.00
E X H I B I T 7
Asian Children Compared with White ChildrenSTATEWIDE, 2004 COHORT
White children with a CPS referral, after referral, Black children are 1.5 times as likely to be in foster care for over two years.
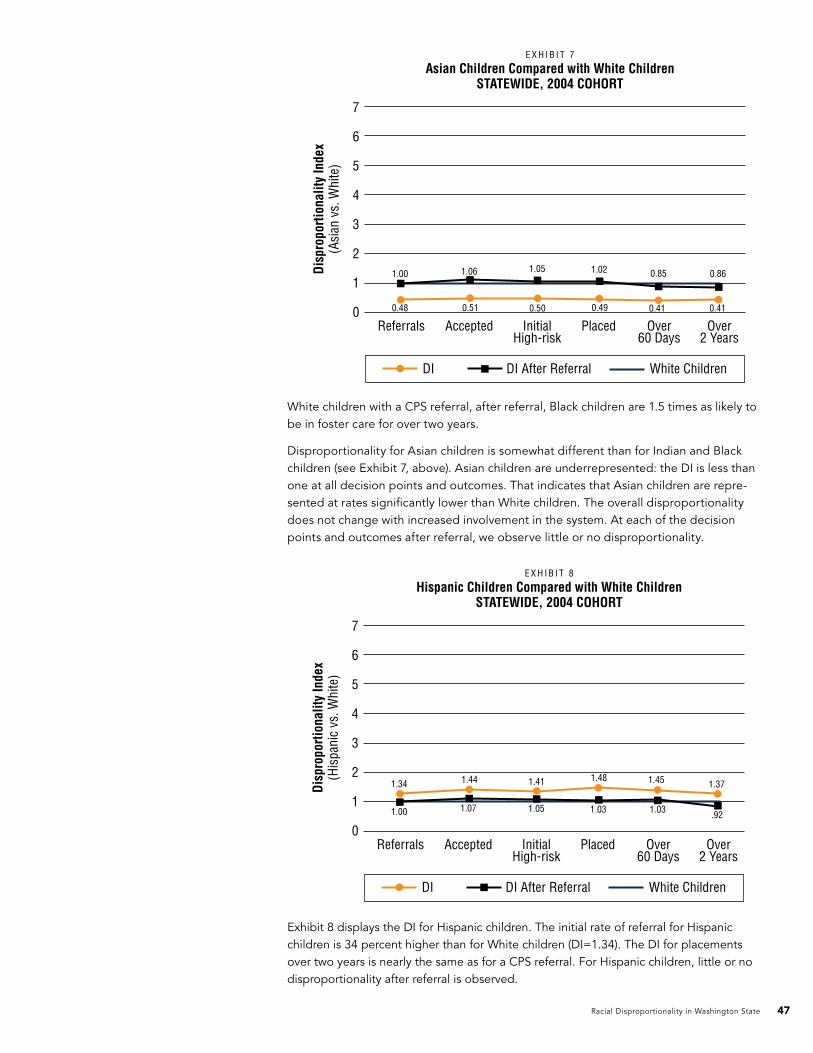
Disproportionality for Asian children is somewhat different than for Indian and Black children (see Exhibit 7, above). Asian children are underrepresented: the DI is less than one at all decision points and outcomes. That indicates that Asian children are repre-sented at rates significantly lower than White children. The overall disproportionality does not change with increased involvement in the system. At each of the decision points and outcomes after referral, we observe little or no disproportionality.
Exhibit 8 displays the DI for Hispanic children. The initial rate of referral for Hispanic children is 34 percent higher than for White children (DI=1.34). The DI for placements over two years is nearly the same as for a CPS referral. For Hispanic children, little or no disproportionality after referral is observed.
7
6
5
4
3
2
1
0Referrals Accepted PlacedInitial
High-riskOver
60 DaysOver
2 Years
Dis
prop
ortio
nalit
y In
dex
(His
pani
c vs
. Whi
te)
DI DI After Referral White Children
1.34 1.44 1.41 1.48 1.45 1.37
1.05 1.03 1.03 .921.071.00
E X H I B I T 8
Hispanic Children Compared with White ChildrenSTATEWIDE, 2004 COHORT
Racial Disproportionality in Washington State48
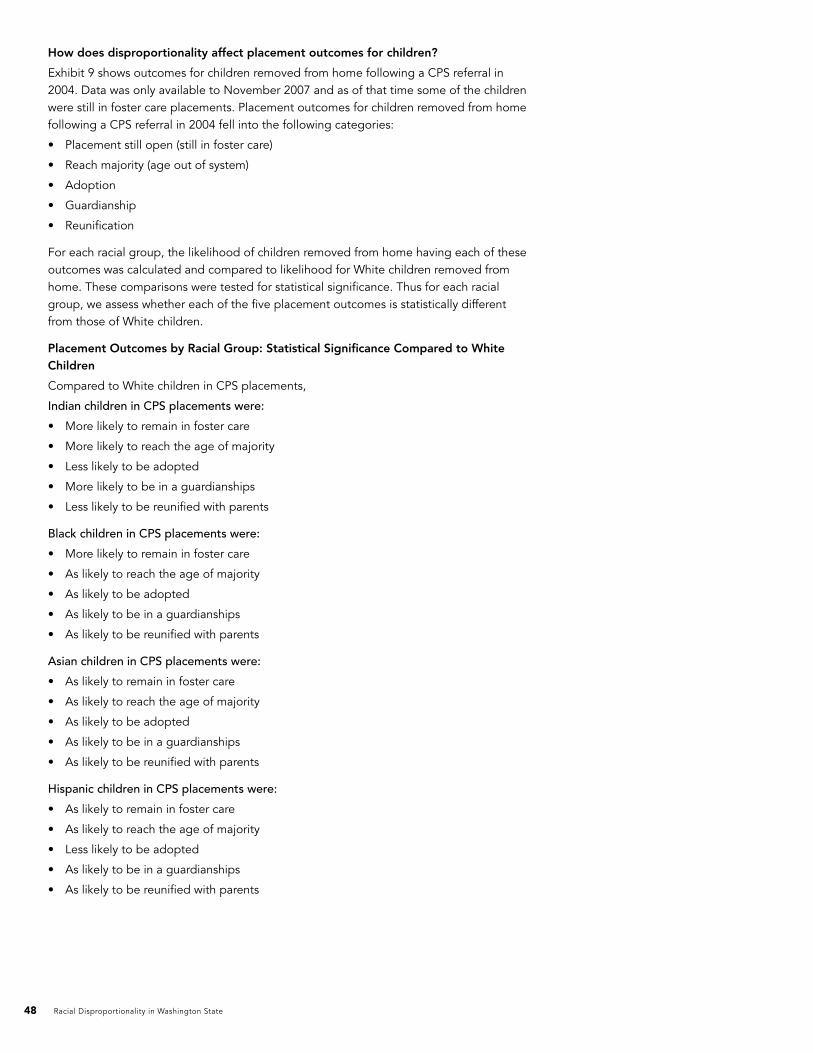
How does disproportionality affect placement outcomes for children?
Exhibit 9 shows outcomes for children removed from home following a CPS referral in 2004. Data was only available to November 2007 and as of that time some of the children were still in foster care placements. Placement outcomes for children removed from home following a CPS referral in 2004 fell into the following categories:
• Placementstillopen(stillinfostercare)
• Reachmajority(ageoutofsystem)
• Adoption
• Guardianship
• Reunification
For each racial group, the likelihood of children removed from home having each of these outcomes was calculated and compared to likelihood for White children removed from home. These comparisons were tested for statistical significance. Thus for each racial group, we assess whether each of the five placement outcomes is statistically different from those of White children.
Placement Outcomes by Racial Group: Statistical Significance Compared to White Children
Compared to White children in CPS placements,
Indian children in CPS placements were:
• Morelikelytoremaininfostercare
• Morelikelytoreachtheageofmajority
• Lesslikelytobeadopted
• Morelikelytobeinaguardianships
• Lesslikelytobereunifiedwithparents
Black children in CPS placements were:
• Morelikelytoremaininfostercare
• Aslikelytoreachtheageofmajority
• Aslikelytobeadopted
• Aslikelytobeinaguardianships
• Aslikelytobereunifiedwithparents
Asian children in CPS placements were:
• Aslikelytoremaininfostercare
• Aslikelytoreachtheageofmajority
• Aslikelytobeadopted
• Aslikelytobeinaguardianships
• Aslikelytobereunifiedwithparents
Hispanic children in CPS placements were:
• Aslikelytoremaininfostercare
• Aslikelytoreachtheageofmajority
• Lesslikelytobeadopted
• Aslikelytobeinaguardianships
• Aslikelytobereunifiedwithparents
Racial Disproportionality in Washington State 49
The reunification results differ from those of the King County report, which concluded that reunification for Black children was less likely than for White children.25 Some of the difference can be explained by the two different approaches used in the analysis. We followed a cohort of children and examined their outcomes. The King County report ex-amined all exits from foster care during a year. The key difference is that all the children in an exit sample have had a resolution of their cases, whereas the cohort analysis includes children whose cases have not yet been resolved.
We replicated the King County approach, using all King County children who exited foster care in 2002 (the year of the King County data) and in 2004. In 2002, rates of reunification for Black children exiting foster care were significantly lower than rates for White children. In 2004, however, rates of reunification for Indian and Black children were not significantly different than rates for White children. It appears that in King County, disproportionality with respect to reunification varies by year.
An earlier Institute report found that reunification rates varied over time as the caseload of children in foster care differed from year to year. Factors such as the percentage of chil-dren referred for neglect, placements with relatives (“relative placements”), and children placed as infants affect reunification rates.26
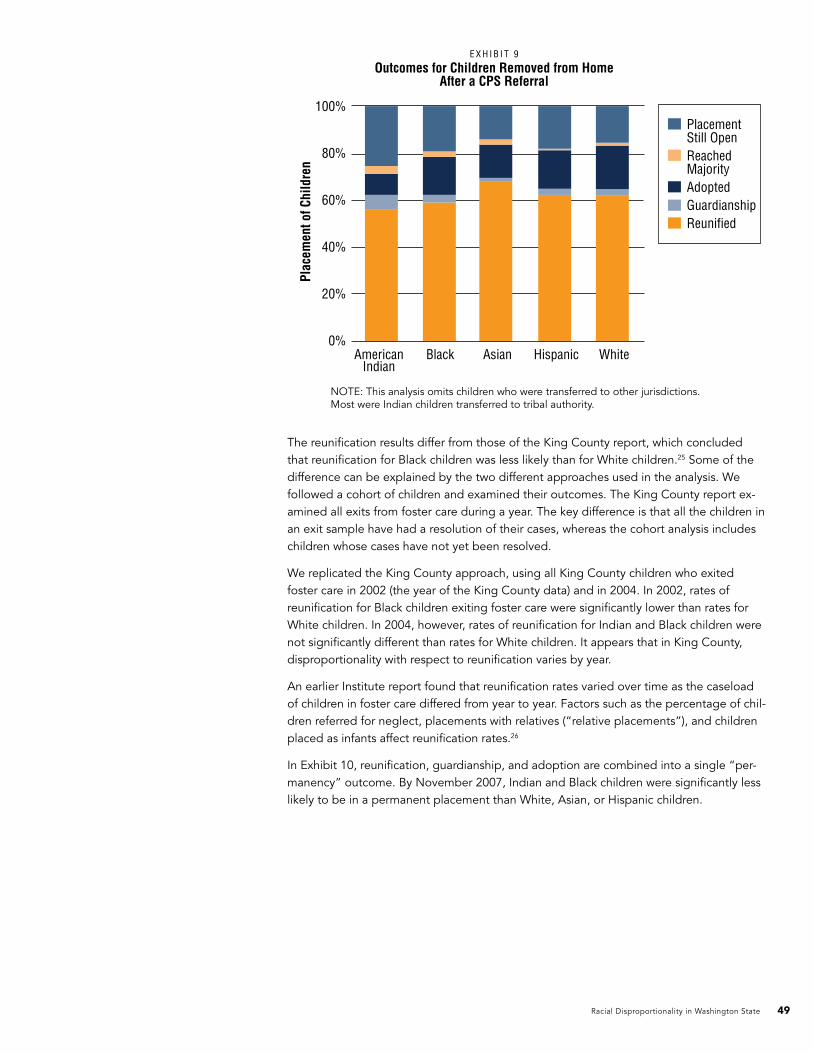
In Exhibit 10, reunification, guardianship, and adoption are combined into a single “per-manency” outcome. By November 2007, Indian and Black children were significantly less likely to be in a permanent placement than White, Asian, or Hispanic children.
100%
80%
60%
40%
20%
0%American
IndianBlack HispanicAsian White
Plac
emen
t of C
hild
ren
E X H I B I T 9
Outcomes for Children Removed from HomeAfter a CPS Referral
PlacementStill OpenReachedMajorityAdoptedGuardianshipReunified
NOTE: This analysis omits children who were transferred to other jurisdictions. Most were Indian children transferred to tribal authority.
Racial Disproportionality in Washington State50
100%
80%
60%
40%
20%
0%American
IndianBlack HispanicAsian White
Plac
emen
t of C
hild
ren
E X H I B I T 1 0
Outcomes for Children Removed from HomeAfter a CPS Referral
PlacementStill OpenReachedMajorityPermanancy
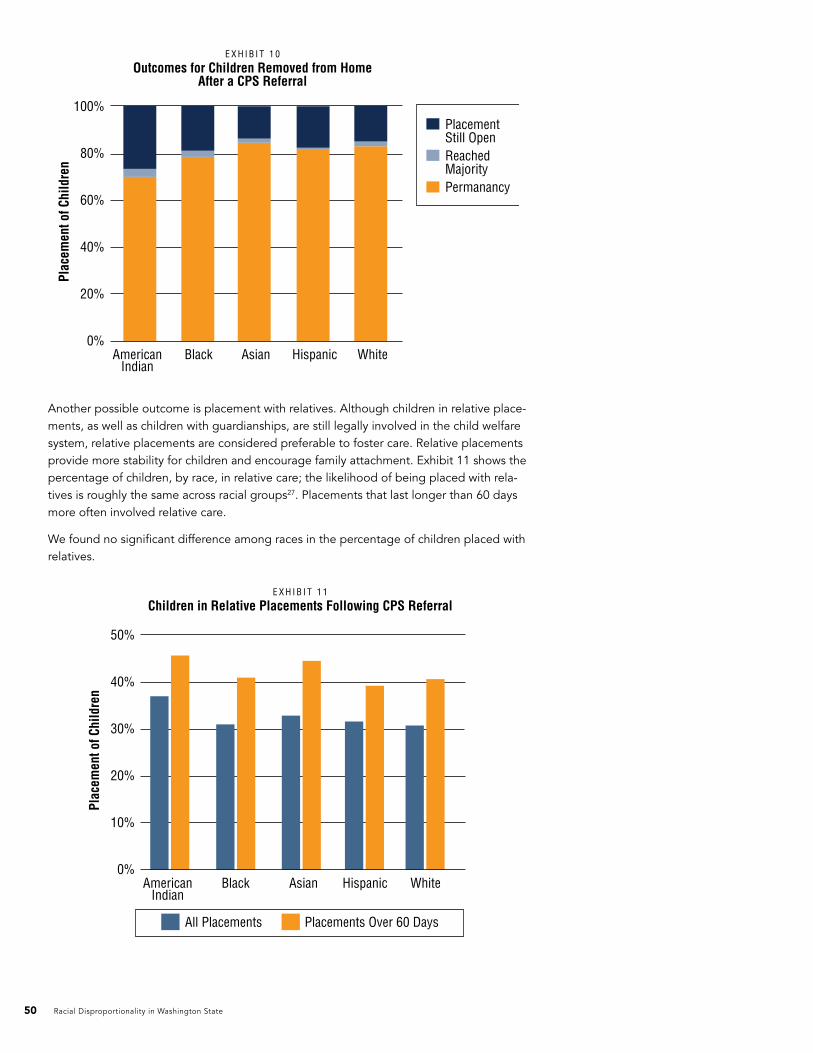
Another possible outcome is placement with relatives. Although children in relative place-ments, as well as children with guardianships, are still legally involved in the child welfare system, relative placements are considered preferable to foster care. Relative placements provide more stability for children and encourage family attachment. Exhibit 11 shows the percentage of children, by race, in relative care; the likelihood of being placed with rela-tives is roughly the same across racial groups27. Placements that last longer than 60 days more often involved relative care.
We found no significant difference among races in the percentage of children placed with relatives.
50%
40%
30%
20%
10%
0%American
IndianBlack HispanicAsian White
Plac
emen
t of C
hild
ren
E X H I B I T 1 1
Children in Relative Placements Following CPS Referral
All Placements Placements Over 60 Days
Racial Disproportionality in Washington State 51
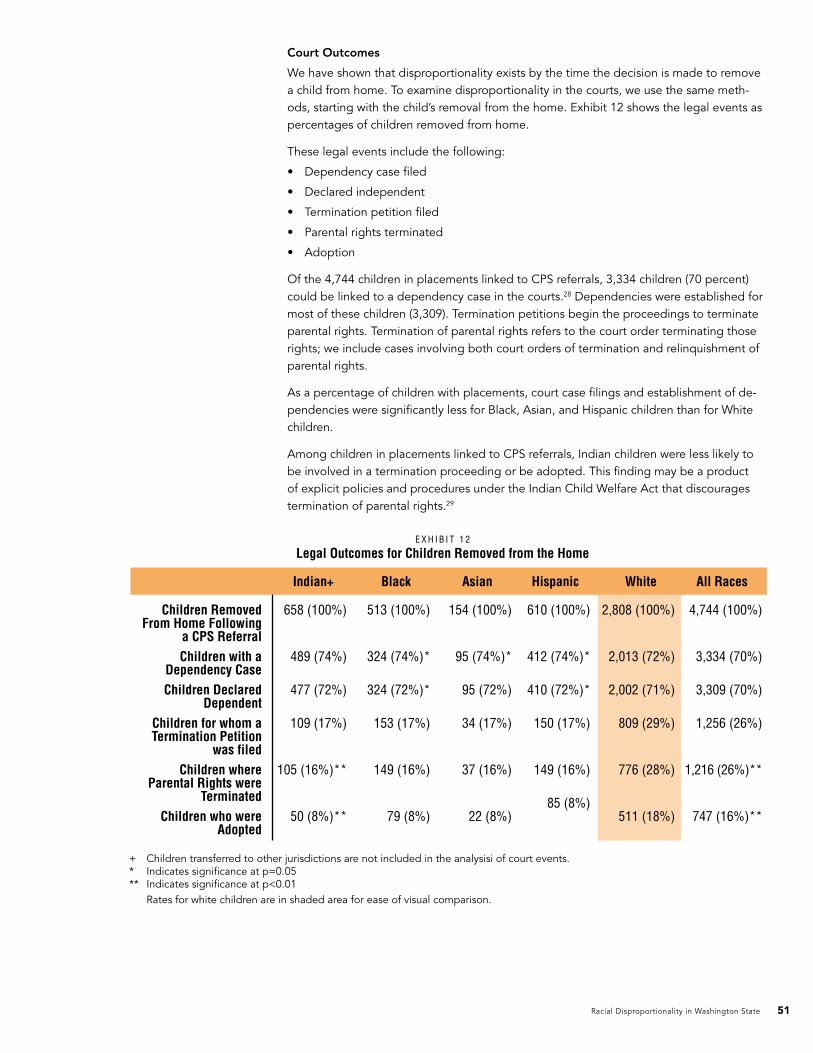
Court Outcomes
We have shown that disproportionality exists by the time the decision is made to remove a child from home. To examine disproportionality in the courts, we use the same meth-ods, starting with the child’s removal from the home. Exhibit 12 shows the legal events as percentages of children removed from home.
These legal events include the following:
• Dependencycasefiled
• Declaredindependent
• Terminationpetitionfiled
• Parentalrightsterminated
• Adoption
Of the 4,744 children in placements linked to CPS referrals, 3,334 children (70 percent) could be linked to a dependency case in the courts.28 Dependencies were established for most of these children (3,309). Termination petitions begin the proceedings to terminate parental rights. Termination of parental rights refers to the court order terminating those rights; we include cases involving both court orders of termination and relinquishment of parental rights.
As a percentage of children with placements, court case filings and establishment of de-pendencies were significantly less for Black, Asian, and Hispanic children than for White children.
Among children in placements linked to CPS referrals, Indian children were less likely to be involved in a termination proceeding or be adopted. This finding may be a product of explicit policies and procedures under the Indian Child Welfare Act that discourages termination of parental rights.29
E X H I B I T 1 2
Legal Outcomes for Children Removed from the Home
Children RemovedFrom Home Following
a CPS Referral
Children with aDependency Case
Children DeclaredDependent
Children for whom aTermination Petition
was filed
Children whereParental Rights were
Terminated
Children who wereAdopted
658 (100%)
489 (74%)
477 (72%)
109 (17%)
105 (16%)**
50 (8%)**
513 (100%)
324 (74%)*
324 (72%)*
153 (17%)
149 (16%)
79 (8%)
154 (100%)
95 (74%)*
95 (72%)
34 (17%)
37 (16%)
22 (8%)
610 (100%)
412 (74%)*
410 (72%)*
150 (17%)
149 (16%)
85 (8%)
2,808 (100%)
2,013 (72%)
2,002 (71%)
809 (29%)
776 (28%)
511 (18%)
4,744 (100%)
3,334 (70%)
3,309 (70%)
1,256 (26%)
1,216 (26%)**
747 (16%)**
Indian+ Asian Hispanic White All RacesBlack
+ Children transferred to other jurisdictions are not included in the analysisi of court events.* Indicates significance at p=0.05** Indicates significance at p<0.01 Rates for white children are in shaded area for ease of visual comparison.
Racial Disproportionality in Washington State52
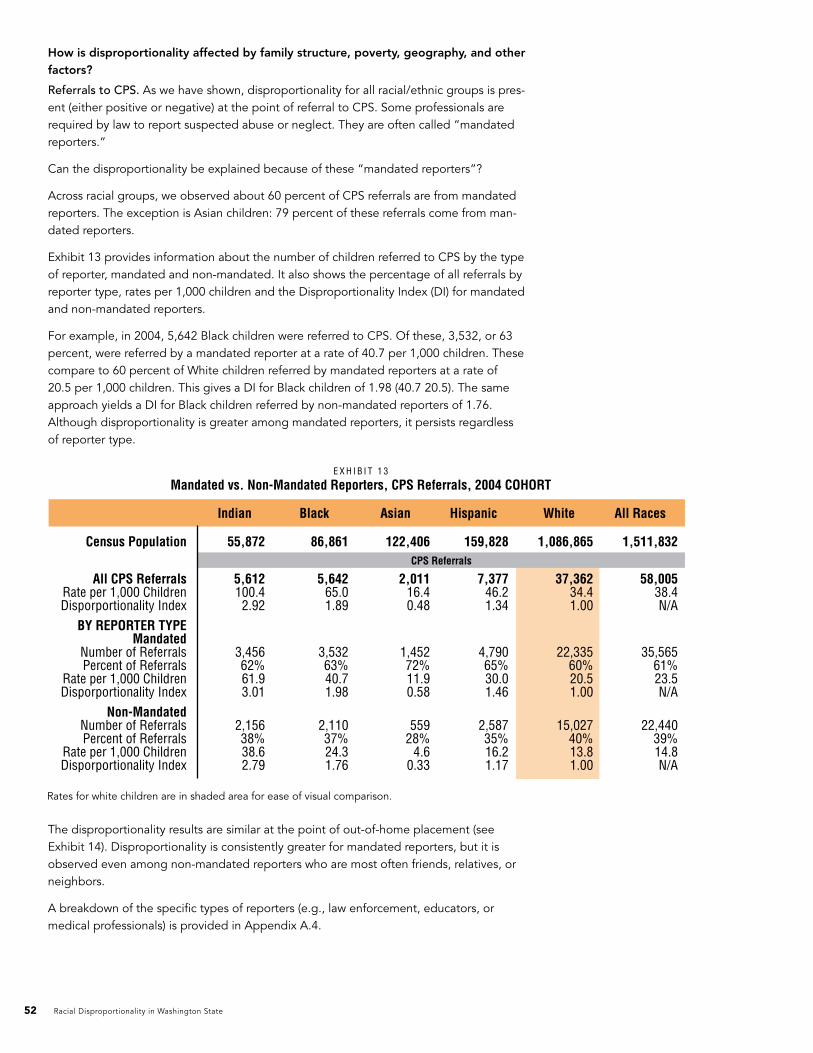
How is disproportionality affected by family structure, poverty, geography, and other factors?
Referrals to CPS. As we have shown, disproportionality for all racial/ethnic groups is pres-ent (either positive or negative) at the point of referral to CPS. Some professionals are required by law to report suspected abuse or neglect. They are often called “mandated reporters.”
Can the disproportionality be explained because of these “mandated reporters”?
Across racial groups, we observed about 60 percent of CPS referrals are from mandated reporters. The exception is Asian children: 79 percent of these referrals come from man-dated reporters.
Exhibit 13 provides information about the number of children referred to CPS by the type of reporter, mandated and non-mandated. It also shows the percentage of all referrals by reporter type, rates per 1,000 children and the Disproportionality Index (DI) for mandated and non-mandated reporters.
For example, in 2004, 5,642 Black children were referred to CPS. Of these, 3,532, or 63 percent, were referred by a mandated reporter at a rate of 40.7 per 1,000 children. These compare to 60 percent of White children referred by mandated reporters at a rate of 20.5 per 1,000 children. This gives a DI for Black children of 1.98 (40.7 20.5). The same approach yields a DI for Black children referred by non-mandated reporters of 1.76. Although disproportionality is greater among mandated reporters, it persists regardless of reporter type.
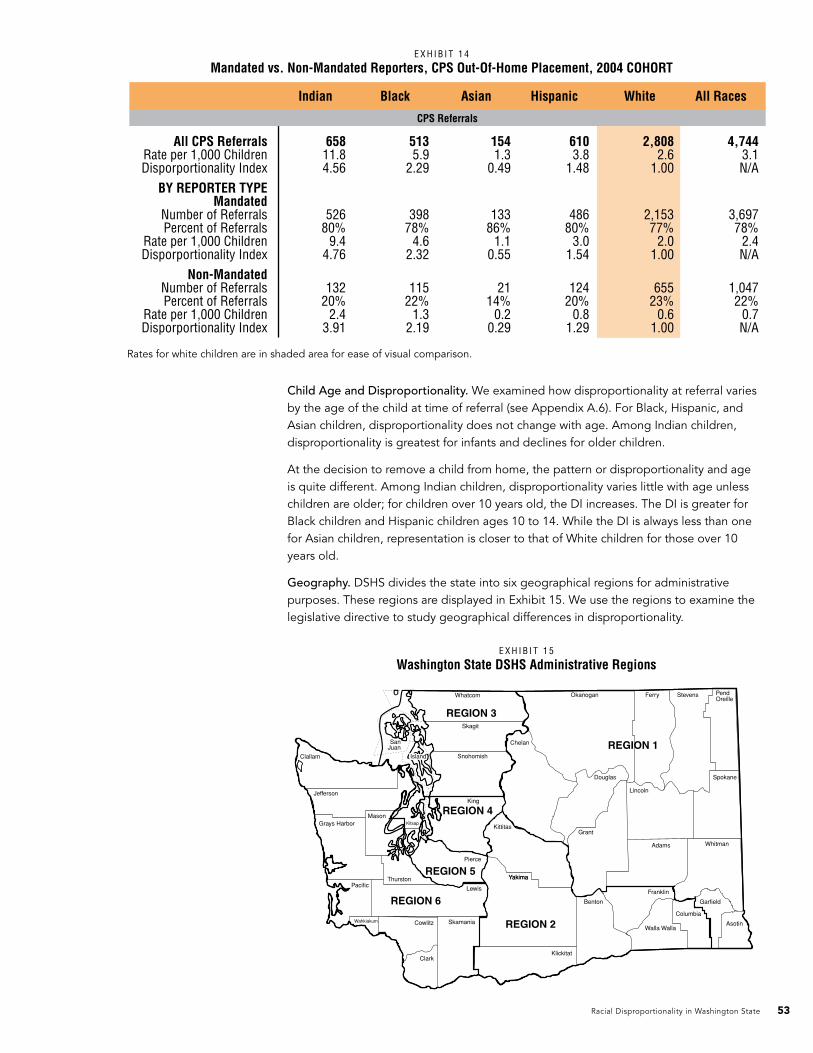
The disproportionality results are similar at the point of out-of-home placement (see Exhibit 14). Disproportionality is consistently greater for mandated reporters, but it is observed even among non-mandated reporters who are most often friends, relatives, or neighbors.
A breakdown of the specific types of reporters (e.g., law enforcement, educators, or medical professionals) is provided in Appendix A.4.
E X H I B I T 1 3
Mandated vs. Non-Mandated Reporters, CPS Referrals, 2004 COHORT
Census Population
All CPS Referrals Rate per 1,000 ChildrenDisporportionality Index
BY REPORTER TYPEMandated
Number of ReferralsPercent of Referrals
Rate per 1,000 ChildrenDisporportionality Index
Non-Mandated Number of ReferralsPercent of Referrals
Rate per 1,000 ChildrenDisporportionality Index
55,872
5,612100.42.92
3,45662%61.93.01
2,15638%38.62.79
86,861
5,64265.01.89
3,53263%40.71.98
2,11037%24.31.76
122,406
2,01116.40.48
1,45272%11.90.58
55928%
4.60.33
159,828
7,37746.21.34
4,79065%30.01.46
2,58735%16.21.17
1,086,865
37,36234.41.00
22,33560%20.51.00
15,02740%13.81.00
1,511,832
58,00538.4N/A
35,56561%23.5N/A
22,44039%14.8N/A
Indian Asian Hispanic White All RacesBlack
CPS Referrals
Rates for white children are in shaded area for ease of visual comparison.
Racial Disproportionality in Washington State 53
CPS Referrals
E X H I B I T 1 4
Mandated vs. Non-Mandated Reporters, CPS Out-Of-Home Placement, 2004 COHORT
All CPS Referrals Rate per 1,000 ChildrenDisporportionality Index
BY REPORTER TYPEMandated
Number of ReferralsPercent of Referrals
Rate per 1,000 ChildrenDisporportionality Index
Non-Mandated Number of ReferralsPercent of Referrals
Rate per 1,000 ChildrenDisporportionality Index
65811.84.56
52680%
9.44.76
13220%
2.43.91
5135.9
2.29
39878%
4.62.32
11522%
1.32.19
1541.3
0.49
13386%
1.10.55
2114%
0.20.29
6103.8
1.48
48680%
3.01.54
12420%
0.81.29
2,8082.6
1.00
2,15377%
2.01.00
65523%
0.61.00
4,7443.1N/A
3,69778%
2.4N/A
1,04722%
0.7N/A
Indian Asian Hispanic White All RacesBlack
Child Age and Disproportionality. We examined how disproportionality at referral varies by the age of the child at time of referral (see Appendix A.6). For Black, Hispanic, and Asian children, disproportionality does not change with age. Among Indian children, disproportionality is greatest for infants and declines for older children.
At the decision to remove a child from home, the pattern or disproportionality and age is quite different. Among Indian children, disproportionality varies little with age unless children are older; for children over 10 years old, the DI increases. The DI is greater for Black children and Hispanic children ages 10 to 14. While the DI is always less than one for Asian children, representation is closer to that of White children for those over 10 years old.
Geography. DSHS divides the state into six geographical regions for administrative purposes. These regions are displayed in Exhibit 15. We use the regions to examine the legislative directive to study geographical differences in disproportionality.
Rates for white children are in shaded area for ease of visual comparison.
E X H I B I T 1 5
Washington State DSHS Administrative Regions
SanJuan
PendOreille
StevensFerryOkanoganWhatcom
Skagit
Snohomish
King
Chelan
Douglas
Lincoln
Grant
Adams Whitman
Spokane
Garfield
Columbia
AsotinWalla Walla
Franklin
Benton
Klickitat
YakimaYakima
Kittitas
Pierce
Lewis
Skamania
Clark
CowlitzWahkiakum
Thurston
Mason
Pacific
Grays Harbor
Jefferson
Clallam
Kitsap
IslandIsland
REGION 1
REGION 3
REGION 2
REGION 4
REGION 5
REGION 6
Racial Disproportionality in Washington State54
4
3
2
1
0Referrals Accepted PlacedInitial
High-riskOver
60 DaysOver
2 Years
Dis
prop
ortio
nalit
y In
dex
Afte
r Ref
erra
l(I
ndia
n vs
. Whi
te)
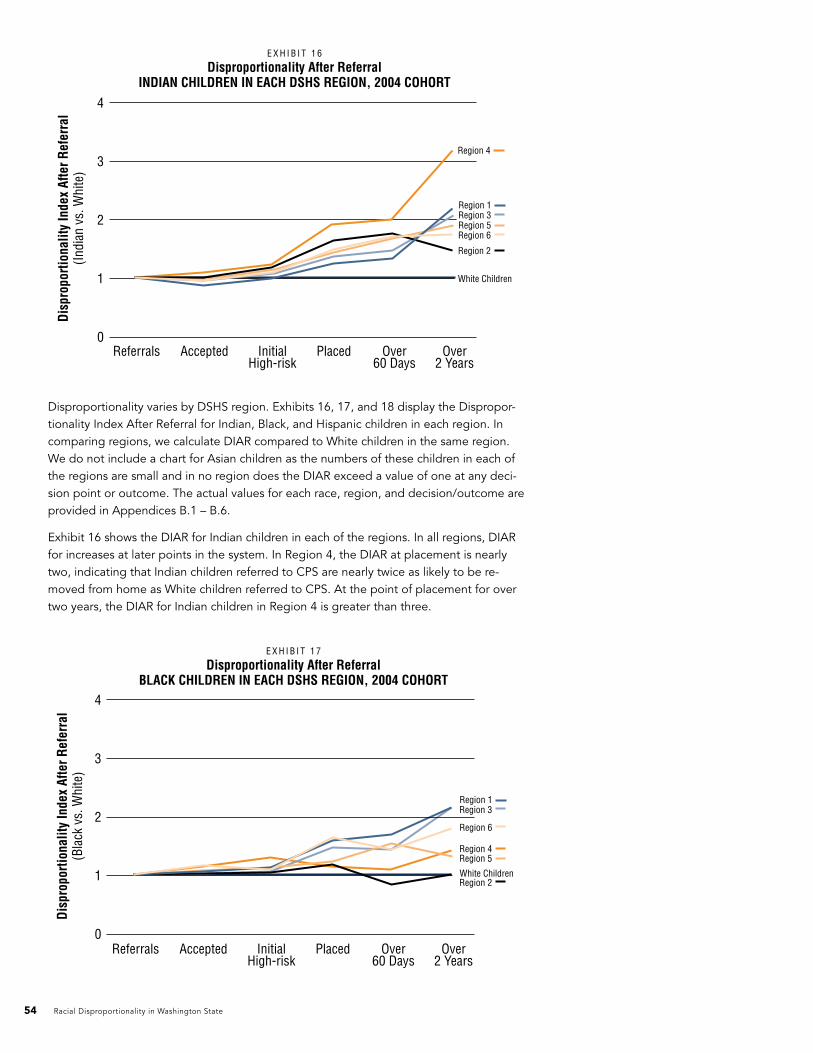
E X H I B I T 1 6
Disproportionality After ReferralINDIAN CHILDREN IN EACH DSHS REGION, 2004 COHORT
White Children
Region 4
Region 1Region 3Region 5Region 6
Region 2
Disproportionality varies by DSHS region. Exhibits 16, 17, and 18 display the Dispropor-tionality Index After Referral for Indian, Black, and Hispanic children in each region. In comparing regions, we calculate DIAR compared to White children in the same region. We do not include a chart for Asian children as the numbers of these children in each of the regions are small and in no region does the DIAR exceed a value of one at any deci-sion point or outcome. The actual values for each race, region, and decision/outcome are provided in Appendices B.1 – B.6.
Exhibit 16 shows the DIAR for Indian children in each of the regions. In all regions, DIAR for increases at later points in the system. In Region 4, the DIAR at placement is nearly two, indicating that Indian children referred to CPS are nearly twice as likely to be re-moved from home as White children referred to CPS. At the point of placement for over two years, the DIAR for Indian children in Region 4 is greater than three.
Referrals Accepted PlacedInitialHigh-risk
Over60 Days
Over2 Years
Dis
prop
ortio
nalit
y In
dex
Afte
r Ref
erra
l(B
lack
vs.
Whi
te)
E X H I B I T 1 7
Disproportionality After ReferralBLACK CHILDREN IN EACH DSHS REGION, 2004 COHORT
White Children
Region 4
Region 1Region 3
Region 5
Region 6
Region 2
4
3
2
1
0
Racial Disproportionality in Washington State 55
Referrals Accepted PlacedInitialHigh-risk
Over60 Days
Over2 Years
Dis
prop
ortio
nalit
y In
dex
Afte
r Ref
erra
l(H
ispa
nic
vs. W
hite
)
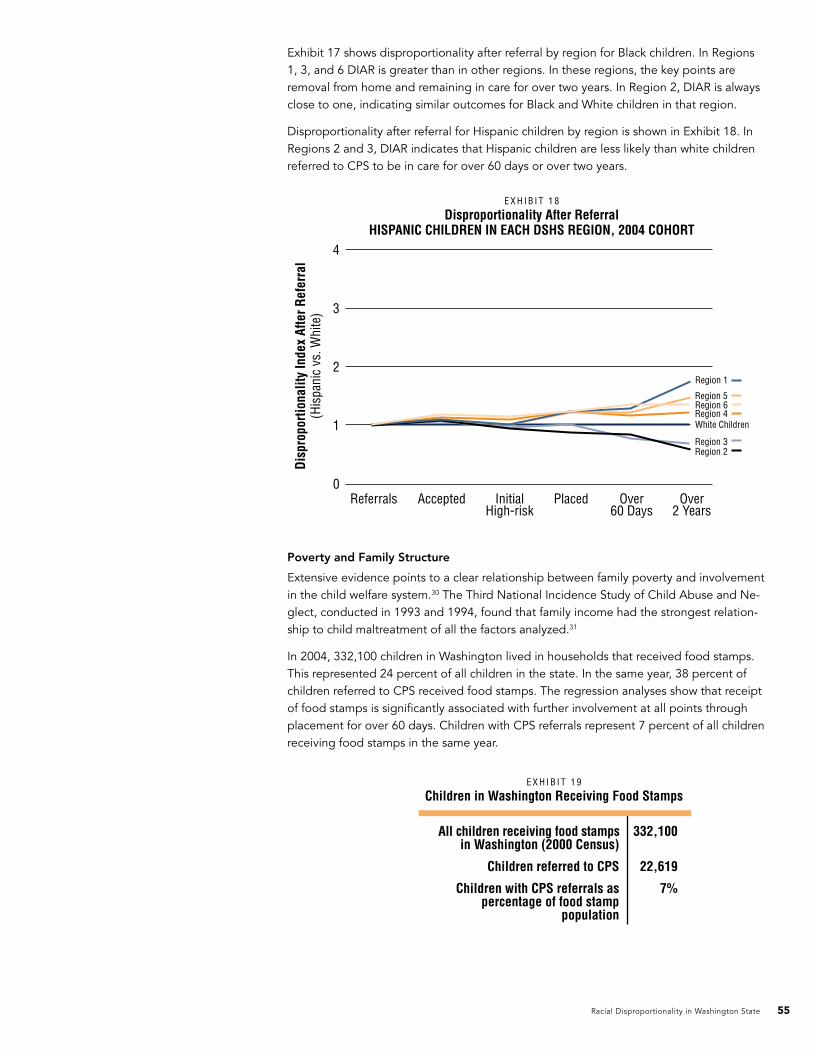
E X H I B I T 1 8
Disproportionality After ReferralHISPANIC CHILDREN IN EACH DSHS REGION, 2004 COHORT
White ChildrenRegion 4
Region 1
Region 3
Region 5Region 6
Region 2
4
3
2
1
0
Exhibit 17 shows disproportionality after referral by region for Black children. In Regions 1, 3, and 6 DIAR is greater than in other regions. In these regions, the key points are removal from home and remaining in care for over two years. In Region 2, DIAR is always close to one, indicating similar outcomes for Black and White children in that region.
Disproportionality after referral for Hispanic children by region is shown in Exhibit 18. In Regions 2 and 3, DIAR indicates that Hispanic children are less likely than white children referred to CPS to be in care for over 60 days or over two years.
Poverty and Family Structure
Extensive evidence points to a clear relationship between family poverty and involvement in the child welfare system.30 The Third National Incidence Study of Child Abuse and Ne-glect, conducted in 1993 and 1994, found that family income had the strongest relation-ship to child maltreatment of all the factors analyzed.31
In 2004, 332,100 children in Washington lived in households that received food stamps. This represented 24 percent of all children in the state. In the same year, 38 percent of children referred to CPS received food stamps. The regression analyses show that receipt of food stamps is significantly associated with further involvement at all points through placement for over 60 days. Children with CPS referrals represent 7 percent of all children receiving food stamps in the same year.
E X H I B I T 1 9
Children in Washington Receiving Food Stamps
All children receiving food stampsin Washington (2000 Census)
Children referred to CPS
Children with CPS referrals aspercentage of food stamp
population
332,100
22,619
7%
Racial Disproportionality in Washington State56
Turning to family structure, relevant data are more limited in CAMIS. CAMIS collects data on family structure only for children removed from home. CAMIS relies on the following definitions for family structure:
• Marriedcouple
• Singlefather
• Singlemother
• Unmarriedcouple
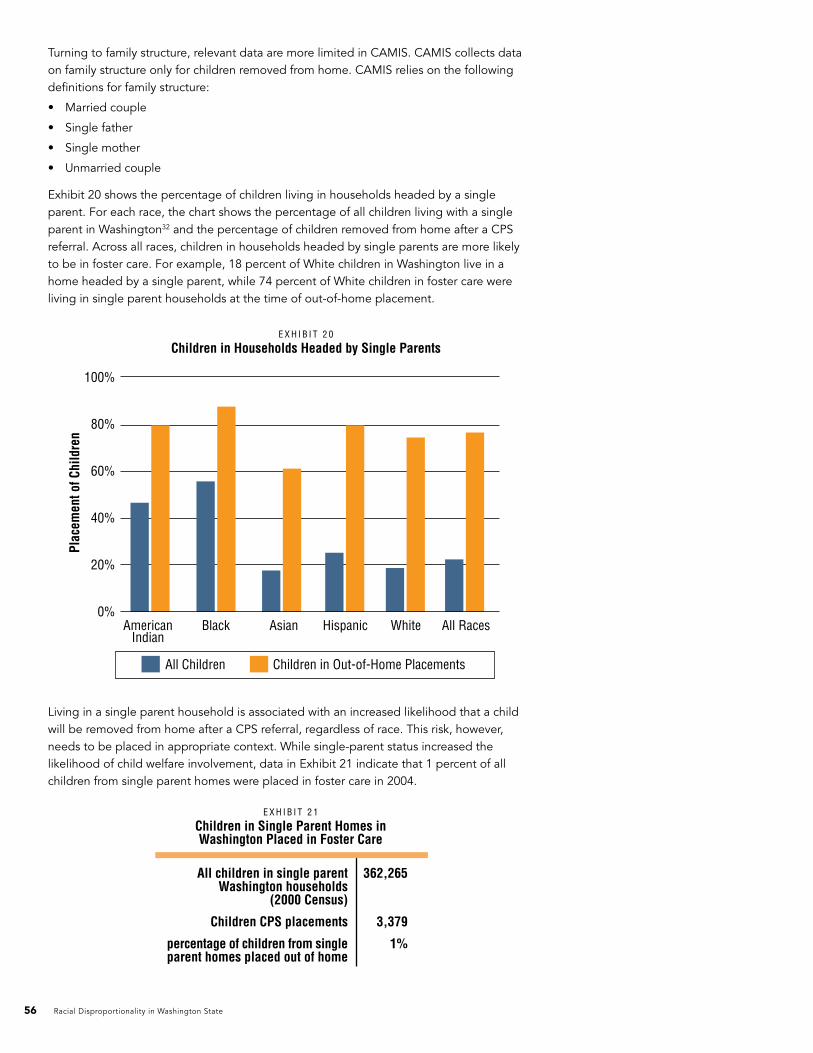
Exhibit 20 shows the percentage of children living in households headed by a single parent. For each race, the chart shows the percentage of all children living with a single parent in Washington32 and the percentage of children removed from home after a CPS referral. Across all races, children in households headed by single parents are more likely to be in foster care. For example, 18 percent of White children in Washington live in a home headed by a single parent, while 74 percent of White children in foster care were living in single parent households at the time of out-of-home placement.
100%
80%
60%
40%
20%
0%American
IndianBlack HispanicAsian White All Races
Plac
emen
t of C
hild
ren
E X H I B I T 2 0
Children in Households Headed by Single Parents
All Children Children in Out-of-Home Placements
E X H I B I T 2 1
Children in Single Parent Homes inWashington Placed in Foster Care
All children in single parentWashington households
(2000 Census)
Children CPS placements
percentage of children from singleparent homes placed out of home
362,265
3,379
1%
Living in a single parent household is associated with an increased likelihood that a child will be removed from home after a CPS referral, regardless of race. This risk, however, needs to be placed in appropriate context. While single-parent status increased the likelihood of child welfare involvement, data in Exhibit 21 indicate that 1 percent of all children from single parent homes were placed in foster care in 2004.
Racial Disproportionality in Washington State 57
To supplement this analysis, we used a subset of children referred to CPS in 2004 whose families also received food stamps in the same year. In Section III, we used regression analysis to examine the influence of family structure on decisions for children following a CPS referral, looking only at those families who received food stamps.
Section III: Regression Analysis ResultsUp to this point, we have sequentially reported on decisions and outcomes, as well as some factors related to outcomes. We expect that these factors work in combination to affect decisions and outcomes. Regression analysis isolates the effects of race from the other case characteristics available in the administrative data.33
Logistic regression allows us to assess, at each step in the process, the likelihood that In-dian, Black, Asian, and Hispanic children will be retained in the system as compared with White children. We use logistic regression to model the likelihood of a child remaining in the child welfare system at five key decision points or outcomes after referral:
• Acceptanceofreferral;
• Ofacceptedreferrals,childrenassessedtobeathigh-riskforabuseorneglect;
• Ofhigh-riskchildren,thoseplacedoutofhome;
• Ofchildrenplacedoutofhome,thosewhoremainoutofhomeforover60days;and
• Ofthoseincareforover60days,thosewhoremainforovertwoyears.
Logistic regression also allows us to control for factors other than race that may affect outcomes. Those factors include type of alleged abuse, child gender, type of referrer, child age at referral, DSHS region, and poverty (that is, the family received food stamps). Analyses of events early in the process also control for the intake worker who recorded the call and assigned the initial risk tag.34 The full results of these “multivariate” regres-sions are included in Appendix A.3.
The key findings summarized below discuss the results for each racial group in compari-son with White children, controlling for other case characteristics.
Key Findings by Racial Group
Compared with White children,
Indian children referred to CPS were:
• Lesslikelytohaveareferralaccepted.
• Morelikelytohaveahighrisktagatintake.
• Morelikelytoberemovedfromhomeiftheyhadahighriskatintake.
• Ifremovedfromhome,aslikelytoremainincareforover60days.
• Morelikelytoremainincaretwoyearslater.
Black children were:
• Morelikelytohaveareferralaccepted.
• Morelikelytobeassessedhighriskatintake.
• Aslikelytoberemovedfromhome.
• Aslikelytobeincareforover60days.
• Morelikelytobeincareforovertwoyears.
Racial Disproportionality in Washington State58
Asian children were:
• Morelikelytohaveareferralaccepted.
• Aslikelytobeassessedhighrisk.
• Aslikelytoberemovedfromhome.
• Aslikelytoremainincareforover60days.
• Aslikelytoremainincareforovertwoyears.
Hispanic children were:
• Morelikelytohaveareferralaccepted.
• Aslikelytobeassessedhighriskatintake.
• Morelikelytoberemovedfromhomeifhighrisk.
• Aslikelytoremainincareforover60days.
• Aslikelytoremainincareforovertwoyears.
Adjustments to DisproportionalityUsing the logistic regression results, we calculate what the Disproportionality Index would look like after controlling for case characteristics in the regression.
Exhibits 22 through 25 show the disproportionality and the adjusted disproportionality after controlling for known characteristics. In each exhibit, the first graph (A) shows overall disproportionality. The second graph (B) uses a different scale and shows only the dispro-portionality that occurred after children were referred to CPS. The chart also shows DIAR after adjusting for case characteristics.
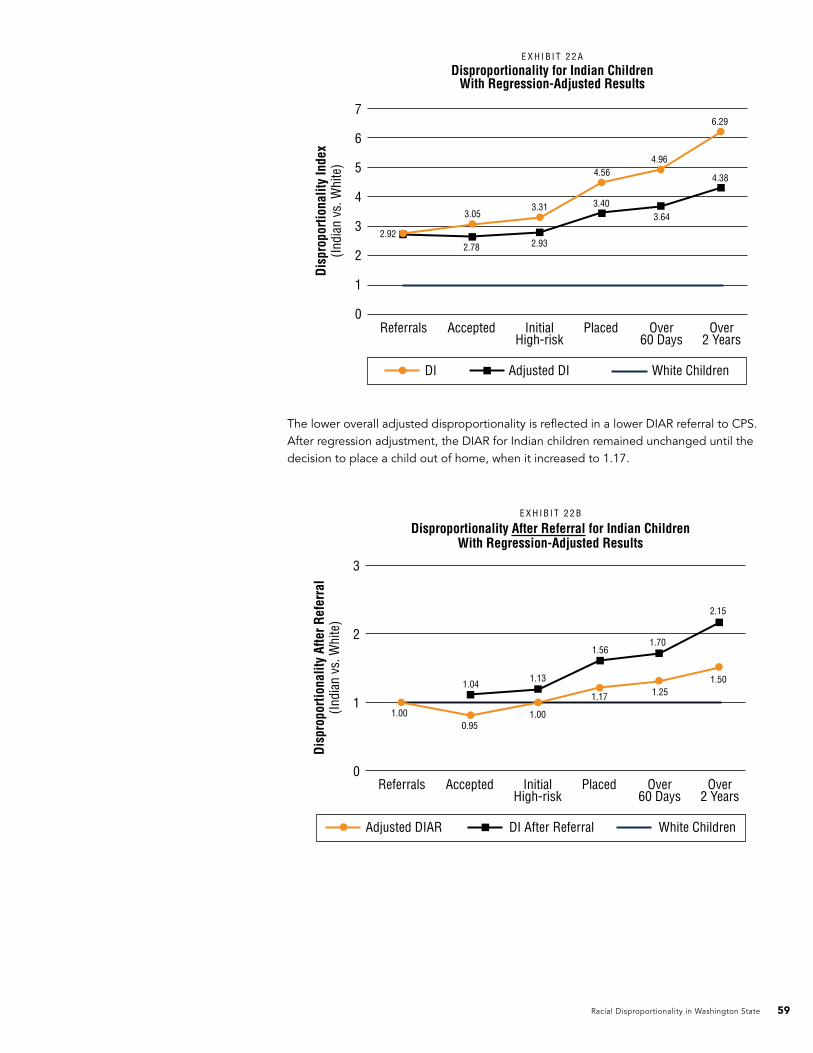
For example, information for Indian children is show in Exhibit 22.
• Exhibit22Ashowsoveralldisproportionality.
• Exhibit22BshowsDIAR.
After adjusting for case characteristics, the Disproportionality Index for Indian children was less than the raw value that did not take other factors into account. Among Indian children involved in the child welfare system, case characteristics – other than race – accounted for 25 percent of the overrepresentation of Indian children at the point of removal from home.
Racial Disproportionality in Washington State 59
7
6
5
4
3
2
1
0Referrals Accepted PlacedInitial
High-riskOver
60 DaysOver
2 YearsD
ispr
opor
tiona
lity
Inde
x(I
ndia
n vs
. Whi
te)
DI Adjusted DI White Children
2.92
3.053.31
4.564.96
6.29
2.93
3.403.64
4.38
2.78
E X H I B I T 2 2 A
Disproportionality for Indian ChildrenWith Regression-Adjusted Results
3
2
1
0Referrals Accepted PlacedInitial
High-riskOver
60 DaysOver
2 Years
Dis
prop
ortio
nalit
y Af
ter R
efer
ral
(Ind
ian
vs. W
hite
)
Adjusted DIAR DI After Referral White Children
1.00
1.041.13
1.561.70
2.15
1.00
1.17 1.251.50
0.95
E X H I B I T 2 2 B
Disproportionality After Referral for Indian ChildrenWith Regression-Adjusted Results
The lower overall adjusted disproportionality is reflected in a lower DIAR referral to CPS. After regression adjustment, the DIAR for Indian children remained unchanged until the decision to place a child out of home, when it increased to 1.17.
Racial Disproportionality in Washington State60
7
6
5
4
3
2
1
0Referrals Accepted PlacedInitial
High-riskOver
60 DaysOver
2 Years
Dis
prop
ortio
nalit
y In
dex
(Bla
ck v
s. W
hite
)
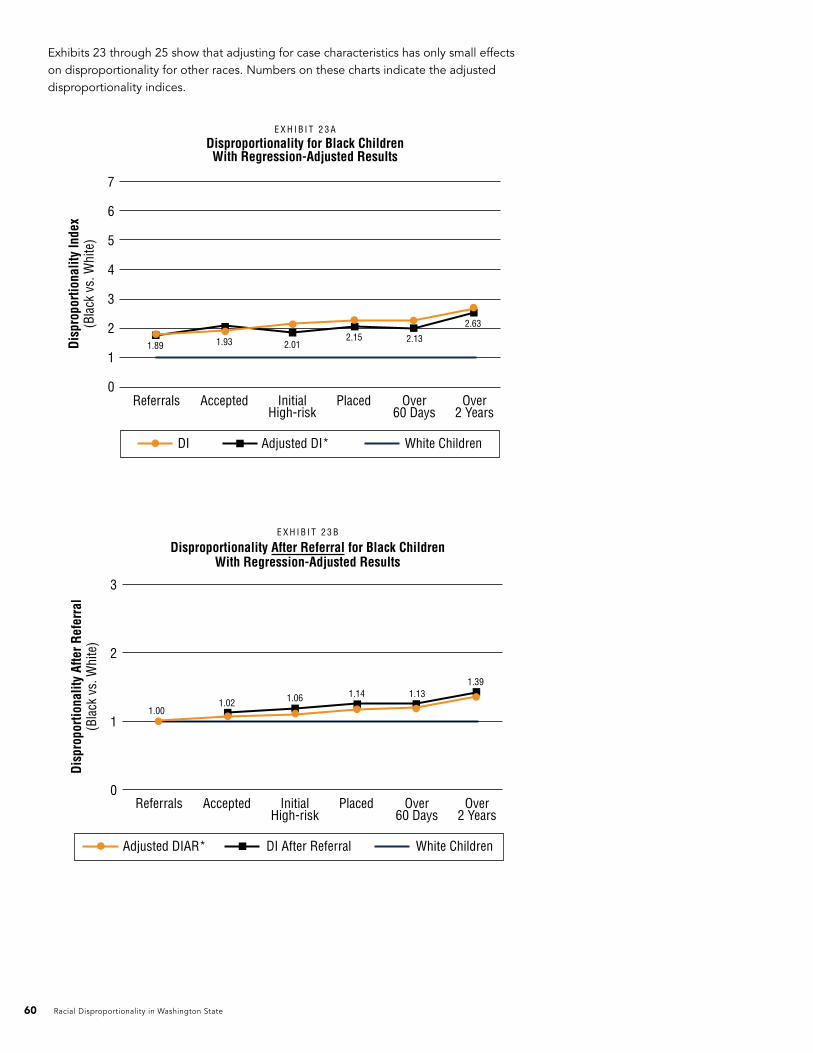
DI Adjusted DI* White Children
1.89 2.012.15 2.13
2.63
1.93
E X H I B I T 2 3 A
Disproportionality for Black ChildrenWith Regression-Adjusted Results
3
2
1
0Referrals Accepted PlacedInitial
High-riskOver
60 DaysOver
2 Years
Dis
prop
ortio
nalit
y Af
ter R
efer
ral
(Bla
ck v
s. W
hite
)
Adjusted DIAR* DI After Referral White Children
1.001.06 1.14 1.13
1.39
1.02
E X H I B I T 2 3 B
Disproportionality After Referral for Black ChildrenWith Regression-Adjusted Results
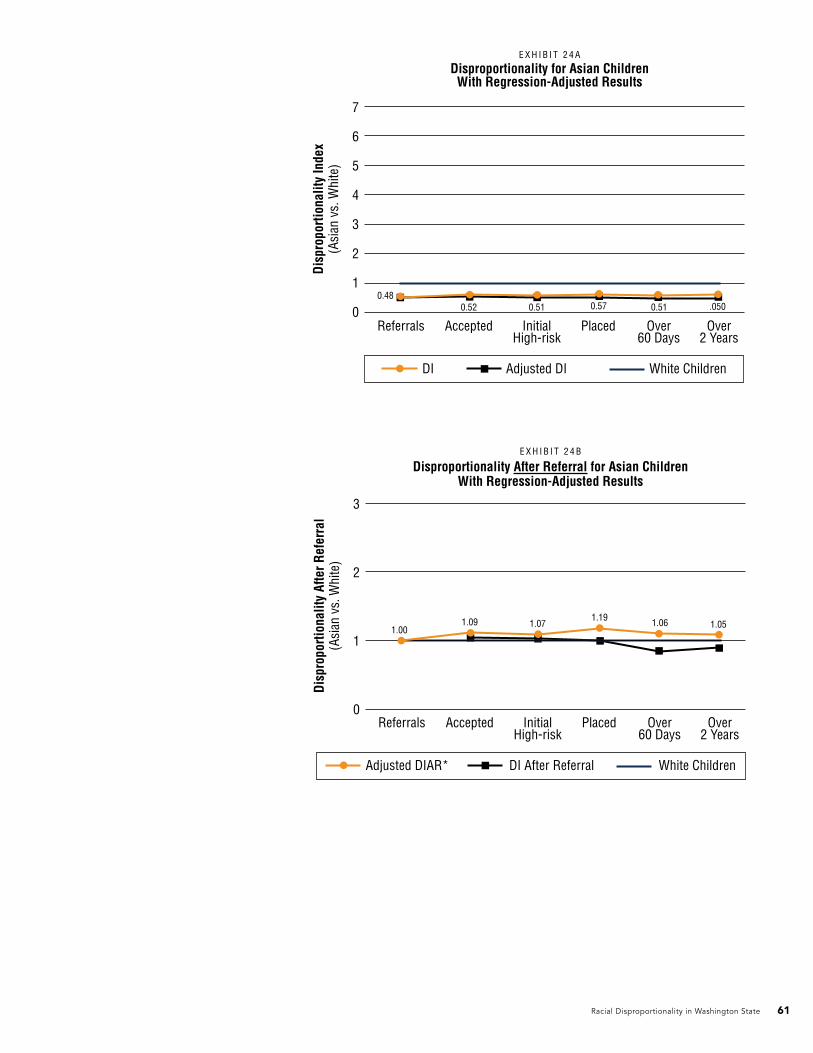
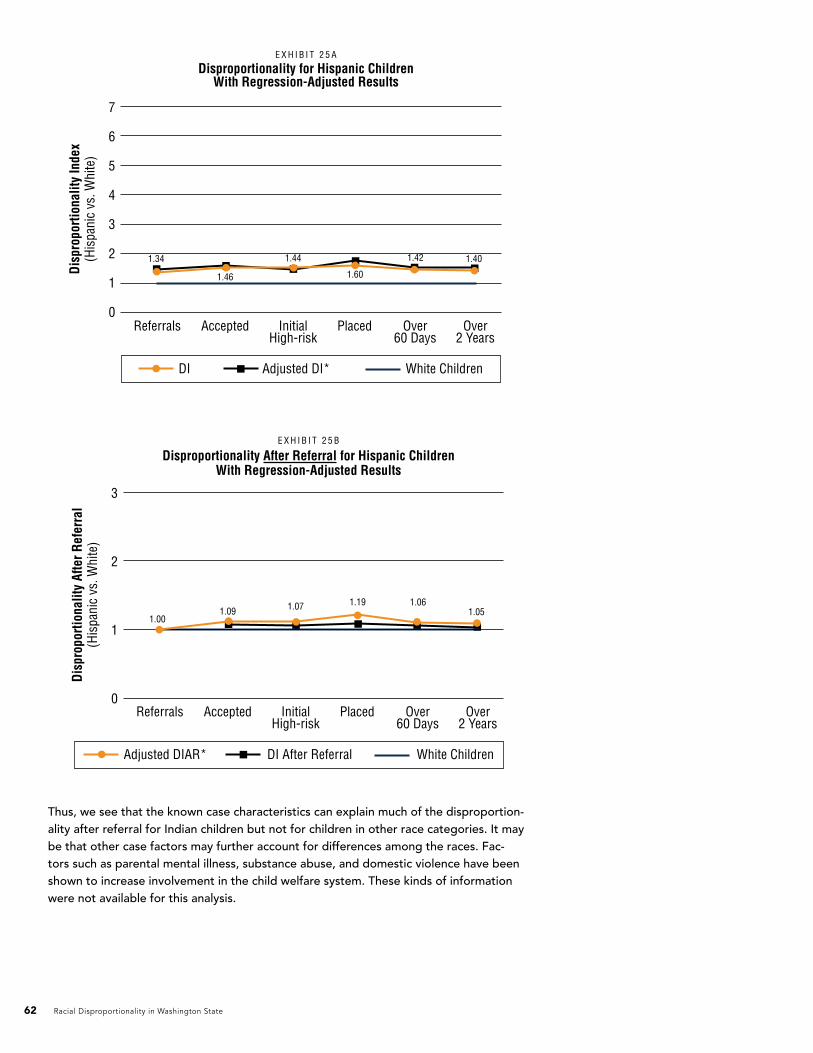
Exhibits 23 through 25 show that adjusting for case characteristics has only small effects on disproportionality for other races. Numbers on these charts indicate the adjusted disproportionality indices.
Racial Disproportionality in Washington State 61
7
6
5
4
3
2
1
0Referrals Accepted PlacedInitial
High-riskOver
60 DaysOver
2 YearsD
ispr
opor
tiona
lity
Inde
x(A
sian
vs.
Whi
te)
DI Adjusted DI White Children
0.480.51 0.57 0.51 .0500.52
E X H I B I T 2 4 A
Disproportionality for Asian ChildrenWith Regression-Adjusted Results
3
2
1
0Referrals Accepted PlacedInitial
High-riskOver
60 DaysOver
2 Years
Dis
prop
ortio
nalit
y Af
ter R
efer
ral
(Asi
an v
s. W
hite
)
Adjusted DIAR* DI After Referral White Children
1.001.07
1.19 1.06 1.051.09
E X H I B I T 2 4 B
Disproportionality After Referral for Asian ChildrenWith Regression-Adjusted Results
Racial Disproportionality in Washington State62
7
6
5
4
3
2
1
0Referrals Accepted PlacedInitial
High-riskOver
60 DaysOver
2 Years
Dis
prop
ortio
nalit
y In
dex
(His
pani
c vs
. Whi
te)
DI Adjusted DI* White Children
1.34 1.44
1.60
1.42 1.40
1.46
E X H I B I T 2 5 A
Disproportionality for Hispanic ChildrenWith Regression-Adjusted Results
3
2
1
0Referrals Accepted PlacedInitial
High-riskOver
60 DaysOver
2 Years
Dis
prop
ortio
nalit
y Af
ter R
efer
ral
(His
pani
c vs
. Whi
te)
Adjusted DIAR* DI After Referral White Children
1.001.07 1.19 1.06
1.051.09
E X H I B I T 2 5 B
Disproportionality After Referral for Hispanic ChildrenWith Regression-Adjusted Results
Thus, we see that the known case characteristics can explain much of the disproportion-ality after referral for Indian children but not for children in other race categories. It may be that other case factors may further account for differences among the races. Fac-tors such as parental mental illness, substance abuse, and domestic violence have been shown to increase involvement in the child welfare system. These kinds of information were not available for this analysis.
Racial Disproportionality in Washington State 63
Permanency. For each racial group, we analyzed the likelihood of reunification with par-ents and permanent placement within two years of out-of-home placement. The broader category of permanency includes reunification as well as guardianship and adoption. We found that, in comparison with White children:
• AsianandHispanicchildrenweremorelikelytobereunifiedwithintwoyears.
• IndianandBlackchildrenwerelesslikelytohavepermanentoutcomeswithintwoyears.
Black and Indian children entering care in 2004 were as likely as White children to reunify with their families within two years. Asian and Hispanic children were as likely as White children to have permanent outcomes.
Court outcomes. We also analyzed two court outcomes using regression analysis. The first is the establishment of a dependency,35 and the second examines termination of parental rights among dependent children. We found that, in comparison with White children:
• BlackandHispanicchildrenwerelesslikelytohaveadependencyestablished.
• Indianchildrenwerelesslikelytohaveparentalrightsterminated.
Indian and Asian children in placements linked to a CPS referral were as likely as White children to have a dependency established. Black, Asian, and Hispanic children were as likely to experience termination of parental rights as White children.
Family Structure. To understand whether family structure affects outcomes, similar analyses were conducted considering only children whose families received food stamps. (These are the only children for whom household composition information is available for the decision points examined.) Results for family structure compare various family struc-tures to families with single mothers. We found that, in comparison with children in single mother households:
• Childreninsinglefatherhouseholdswerelesslikelytohaveareferralacceptedandmore likely to have an out-of-home placement.
• Thoseintwo-parenthouseholdsweremorelikelytohavereferralacceptedandlesslikely to have an out-of-home placement.
• Childrenlivingwithmothersandothers(non-parents)weremorelikelytohaveaninitial risk tag of 3 or higher and less likely to have an out-of-home placement.
• Childreninrelativeorguardianhouseholdswerelesslikelytohaveanacceptedrefer-ral.
We also examined family structures for children who were removed from the home. Family structure is available for the entire population of children removed from the home (including those who do not receive food stamps). We found that, compared with children who had been living with single mothers:
• Childrenlivingwithsinglefatherswerelesslikelytobeinout-of-homecareforover60days.
• Childrenlivingwithanunmarriedcoupleweremorelikelytobeinout-of-homecarefor over 60 days.
• Childrenplacedoutofhomeforatleast60dayswhohadbeenlivingwithamarriedcouple were less likely to be in out-of-home care for over two years.
Racial Disproportionality in Washington State64
Summary of Main Findings
The first task of this legislatively directed analysis was to determine whether racial dispro-portionality exists in Washington’s child welfare system. The analysis identified children who were referred to CPS in 2004 and followed their involvement in the child welfare system until November 2007. Indian, Black, and Hispanic children were present in the system at rates greater than White children. Relative to White children, Indian children were nearly three times as likely to be referred to CPS and over six times as likely to be in foster care for over two years. Disproportionality also existed for Asian children, who were under-represented in Washington.
The second task was to examine disproportionality at all major decision points in the child welfare system. From the analysis, it is clear that most of the disproportionality occurred when someone makes a referral to CPS to report suspected abuse or neglect. The type of referrer – for example mandated reporters or informal reports by neighbors, relatives, and friends – appears not to account for the disproportionality found for Indian, Black, and (to a lesser extent) Hispanic children. Involvement at this stage reflects disproportionality at the societal, not institutional level. Outcomes after referral may be improved, but if entry rates stay imbalanced, disproportionality will still exist (unless White children, in large numbers, stay longer or exit later).
After controlling for other characteristics, factors that contributed to further dispropor-tionality appear to be:
• Thedecisiontoremoveachildfromhome.
• Longertimetopermanencyforchildreninfostercare,especiallyforIndianandBlackchildren.
A third task was to provide information on low-income and single-parent families involved in the child welfare system. Our analysis finds that in 2004, children from low-income families were over-represented in the child welfare system. This factor helps to explain some of the disproportionality observed. Single-parent status also was related to place-ment of children in foster care. According to the 2000 census, 25 percent of children in Washington lived in a household headed by a single parent. By contrast, 76 percent of children in foster care came from single-parent homes. Among children in foster care, the percentage of children from single-parent homes ranged by race from 62 percent for Asian children to 88 percent for Black children.
The fourth task was to determine whether outcomes for children in the child welfare sys-tem vary by race. Our analysis suggests that:
• Indianchildrenhadthegreatestdisproportionalityatreferral,weremorelikelytoberemoved from home, reunified less often with their families, and were more likely to remain in foster care.
• Blackchildrenweremorelikelytoberemovedfromhome,andremainincarelongerthan White children. They reunified about as often as White children. However, after two years they were more likely to remain in foster care and less likely to be in a per-manent placement than White children.
• HispanicchildrenwerereferredtoCPSathigherratesthanWhitechildren.Dispropor-tionality changed little for Hispanic children after referral to CPS.
• AsianchildrenwerereferredatratesofabouthalfofthoseforWhitechildren.Dispro-portionality did not change at any of the major decision points.
The results of regression analysis, which controlled for known case characteristics, includ-ing poverty, geography, type of neglect, age of the child, type of reporter and, where
Racial Disproportionality in Washington State 65
possible, family structure, still indicated disproportionality at many points in the child wel-fare system. After this adjustment, however, the degree of disproportionality was found to be lower for Indian children and slightly lower for Black children.
When we applied regression analysis to the two key outcomes in the legal system – es-tablishment of a dependency when children were removed from home and termination of parental rights among dependent children – we found little or no disproportionality in court outcomes.
The Legislature directed the committee to aggregate results by geographical region. Rather large differences in disproportionality, especially for Indian and Black children, existed across the six DSHS administrative regions. In general, disproportionality was greatest in Region 4 (King County).
Cautions and Limitations. It is important to repeat that this analysis addresses only the issue of disproportionate representation of children of color in the child welfare system. The causes of the disproportionality remain unclear. With the administrative databases available for analysis, we can say little about disparity of treatment.
Racial Disproportionality in Washington State66
Footnotes1 See, for example: Hill, R.B. (2006). Synthesis of research on disproportionality in child welfare:
An update. Casey Family Programs; General Accountability Office (2007). African American children in foster care: Additional HHS assistance needed to help state reduce the proportion in care. Washington, D.C.: United States Government Accountability Office, AGO-07-816.
2 King County Coalition on Racial Disproportionality (2004). Racial disproportionality in the child welfaresysteminKingCountyWashington.Report:Quantitativeandqualitativedataonracialdisproportionality.
3 SHB 1472, Chapter 465, Laws of 2007
4 Following the report on prevalence of disproportionality, the Advisory Committee in conjunc-tion with the Secretary of DSHS will develop a plan for remediation by December 1, 2008.
5 The issue of children with multiple events is handled in a separate analysis.
6 U.S. Census (2001). Census brief: Two or more races, population 2000. Washington D.C. Department of Commerce, U.S. Census Bureau. Accessed at http://www.census.gov/prod/2001pubs/c2kbr01-6.pdf.
7 A list of race ethnicity codes used in CAMIS is provided in Appendix A.1.
8 About 2 percent of children in placements had race coded as unknown or missing. We assigned these children to races in the same proportion as children in each child welfare population. For example, if 10 percent of the children in a region were Indian, we classified 10 percent of children with a missing race code as Indian. For regression analysis, we omitted children with a missing race code.
9 According to the 2000 Census, 1 percent of children in Washington State had any Pacific Islander heritage. We observed the same percentage in the child welfare database.
10 Census 2000 Modified Race Data MR31 (MR31-COTXT, Prepared by the U.S. Census Bureau, 2002).
11 Personal communication with Cindy Ellingson, Children’s Administration. May 30, 2008.
12 In 2007, HB 1377 broadened the options for placement to include persons with whom the child has a “pre-existing relationship,” such as family friends.
13 Children referred to CPS in late 2004 for whom decisions were made early in 2005 are included in this cohort of children referred to CPS in 2004.
14 Prior to 2007, results of investigated cases could be designated as founded, unfounded, or inconclusive. In 2007 RCW 26.44.030 was amended to permit only “founded” or “unfounded” findings of investigations. “Inconclusive” findings are no longer permitted.
15 WAC 388-15-041. There is an exception to the 3-day rule if parents agree to a voluntary place-ment. In these cases, DSHS may wait up to six months before filing if the parents are making progress addressing the deficits resulting in the removal. After 180 days, a shelter care hearing must be held, or “just cause” shown, in order to continue the voluntary placement. (Children’s Administration Operations Manual, 11211, Section C.)
16 RCW 13.34.060
17 RCW 13.34.130
18 Public Law 105-89, Adoption and Safe Families Act of 1997, as summarized in: Child Welfare Information Gateway (2008) Major Federal Legislation Concerned With Child Protection, Child Welfare, and Adoption. Washington D.C., Children’s Bureau/ACYF, U.S. Department of Health and Human Services. Accessed at: http://www.childwelfare.gov/pubs/otherpubs/majorfedlegis.pdf
19 Ibid. The state may not file a termination petition if it is not deemed in the best interest of the child, the child in the care of a relative, or the state has not provided the family of origin with services they require.
20 In placements where a guardianship fails and the child returns to foster care, we include the time spent in the guardianship in calculating the duration of the case.
21 Courtney, Mark (2007). Keynote Speaker, Washington State Racial Disproportionality Advisory Committee, Seattle, WA: Topic: “Racial Disproportionality in Child Welfare Services Provision.” November 2, 2007.
22 Johnson, E.P., Clark, S., Donald, M., Pedersen, R., Pichotta, C. (2007) Racial Disproportionality in Minnesota’s Child Protections System. Child Welfare 86(4):5-20.
23 Ibid.
24 Lemon, K., D’Andrade, A. Austin, J.M. 2005. Understanding and Addressing Disproportionality in the Front End of the Child Welfare System. Berkeley Ca: Bay area Social Services Consortium. http://cssr.berkeley.edu/bassc/public/EvidenceForPractice3_Disproportionality_FullReport.pdf
Racial Disproportionality in Washington State 67
Acknowledgements
I am grateful to the many people who contributed to this project.
The Racial Disproportionality Advisory Committee provided considerable guidance and insight throughout the report preparation.
Thanks to the efforts of Kathryn Beall at the DSHS Research and Data Analysis Division, we were able to include poverty in our analysis of disproportionality in the child welfare system.
Cindy Ellingson, Lee Doran, Matt Orme, Paul Smith, Tim Hunter, Nancy DuFraine, and Leah Stajduhar at Children’s Administration were extremely helpful in interpreting CAMIS data and clarifying DSHS rules and procedures.
Finally, Laura Schrager at the Institute was helpful in all phases of the project.
For further information, please contact Marna Miller at [email protected] or 360-586-2745.
25 Op cit. King County Coalition on Racial Disproportionality.
26 Miller, M. (2004). Decline in Washington’s family reunifications: What influenced this trend? Olympia: Washington State Institute for Public Policy.
27 For this analysis, relative placement is defined as any child with at least one placement with a relative.
28 To be considered a match, the court case could not start more than a week before the place-ment.
29 If a child is under joint jurisdiction of Children’s Administration and a tribe, tribal codes dictate how the case is handled. Many tribes do not recognize termination of parental rights and prefer permanent legal guardianships or family placements. (Personal communication, May 23, 2008: Nancy Dufraine, Indian Child Welfare Manager, Children’s Administration, Washington State Department of Social and Health Services.)
30 See, for example: Lee, B.J., Goerge, R.M. Poverty, early child-bearing and child maltreatment: A multinomial analysis. Children and Youth Services Review. 12(9/10): 755-780; Wu, S.S., Ma, C-X, Carter, R.L., Ariet, M., Feaver, E.A., Resnick, M.B., Roth, J. (2004). Risk factors for infant maltreat-ment: a population-base study. Child Abuse and Neglect 28(12): 1253-1264.
31 Sedlak, A.J., Broadhurst, D.D. (1996). The third national incidence study of child abuse and neglect. Washington D.C.: U.S. Department of Health and Human Services, Administration for Children and Families.
32 Poverty status in 1999 of related children under 18 years by family type, age, race, and His-panic/Latino. Universe: Related children under 18 years. Census 2000 Summary File, PCT52/PCT76 A−I. Downloaded from Washington’s Office of Financial Management http://www.ofm.wa.gov/census2000/dp58/st/53.pdf.
33 We used logistic regression using the Statistical Analysis System (SAS).
34 Analysis shows that individual intake workers vary significantly in the average risk they assign to cases. Significant variation also occurs among the regions. For the regression analyses, we calculated the average risk tag for each worker in 2004. These analyses omitted children whose intake workers did not handle at least three cases in 2004.
35 In our analysis of legal data, we found that of 3,334 children for whom a dependency case was
Suggested Citation: Marna Miller. (2008). Racial Disproportionality in Washington State’s Child Welfare System. Olympia: Washington State Institute for Public Policy, Document No. 08-06-3901