Embed Size (px)
Citation preview
WSEAS AIKED, Cambridge, 2010 1
Feature Importance in Bayesian Assessment of Newborn BrainMaturity from EEG
Livia Jakaite, Vitaly Schetinin and Carsten Maple
Department of Computer Science and Technology
University of Bedfordshire
WSEAS AIKED, Cambridge, 2010 2
Outline
EEG assessment of brain maturity
Why Bayesian Model Averaging (BMA) for the assessment?
Problems in using BMA for assessing brain maturity
Solution: using posterior information about features
Computational Experiments
Conclusions
WSEAS AIKED, Cambridge, 2010 3
EEG assessment of brain maturity
Newborn brain dismaturity alerts about neurophysiologic abnormality
Experts can assess newborn brain maturity by estimating a newborns age from an EEG recording
The accuracy of such estimate is usually two weeks
Brain maturity is assessed as normal if the newborn’s physical age is within the range of EEG-estimated ages; otherwise the maturity is assessed as abnormal
WSEAS AIKED, Cambridge, 2010 4
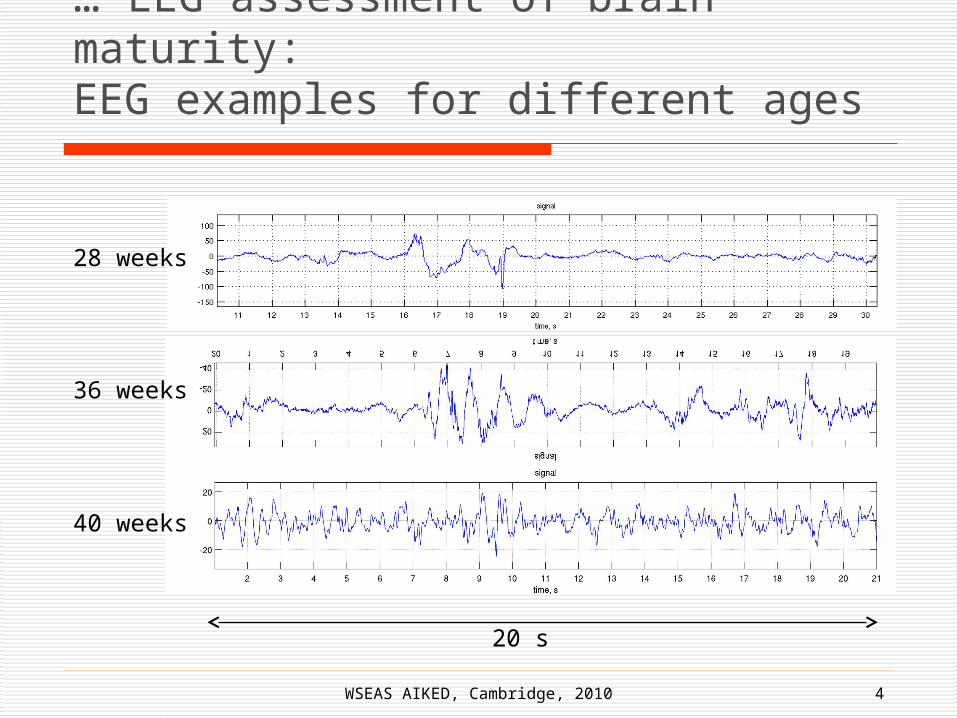
… EEG assessment of brain maturity:EEG examples for different ages
28 weeks
36 weeks
40 weeks
20 s

WSEAS AIKED, Cambridge, 2010 5
BMA for brain maturity assessment
Bayesian Model Averaging (BMA), in theory, provides the most accurate assessments and estimates of uncertainty
In practice, Markov Chain Monte Carlo (MCMC) is used to approximate the posterior distribution by taking random samples

WSEAS AIKED, Cambridge, 2010 6
…BMA for brain maturity assessment:exploring the posterior probability
An idea behind BMA is to average over multiple models diverse in their parameters
To ensure unbiased estimates, the portions of models sampled from the posterior distribution should be proportional to their likelihoods
The assessments will be most accurate, and the variation in models outcomes will be interpreted as the uncertainty in assessment
WSEAS AIKED, Cambridge, 2010 7
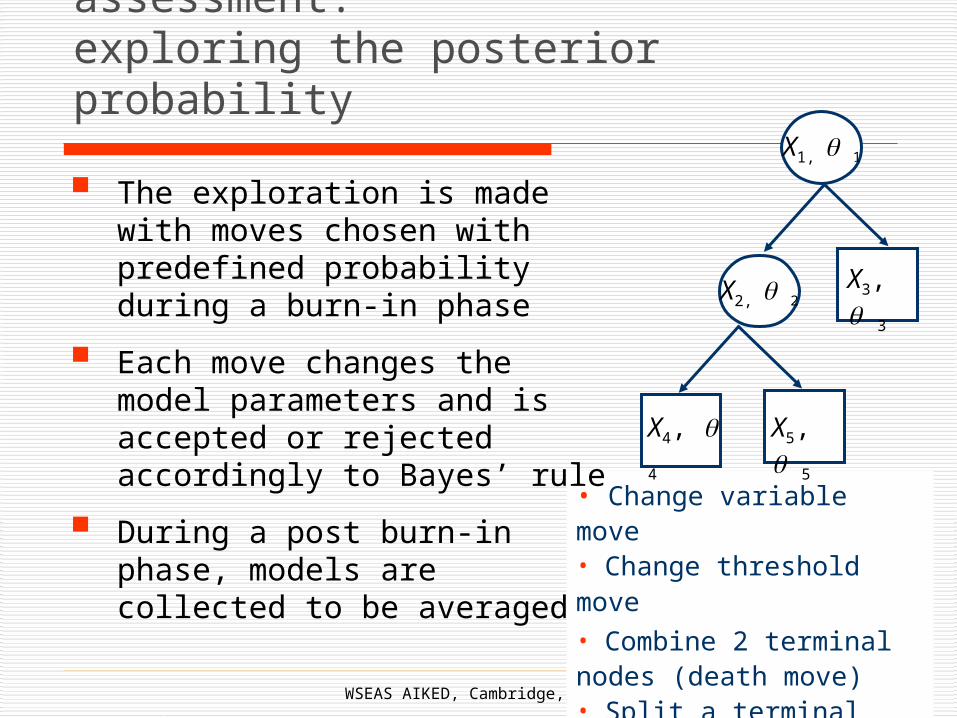
• Change variable move• Change threshold move
• Combine 2 terminal nodes (death move)• Split a terminal node (birth move)
…BMA for brain maturity assessment:exploring the posterior probability
The exploration is made with moves chosen with predefined probability during a burn-in phase
Each move changes the model parameters and is accepted or rejected accordingly to Bayes’ rule
During a post burn-in phase, models are collected to be averaged
X1, 1
X2, 2
X5, 5
X3, 3
X4, 4
WSEAS AIKED, Cambridge, 2010 8
…BMA for brain maturity assessment:lack of prior information causing biased sampling
To collect models proportionally, a model parameter space must be explored in detail
When the model parameter space is large, possible problem is:
Not all areas of PDF are explored, and then the models are disproportionally sampled
Prior information about feature importance helps to reduce a model parameter space
WSEAS AIKED, Cambridge, 2010 9
However, in our case, no prior information on feature importance is available
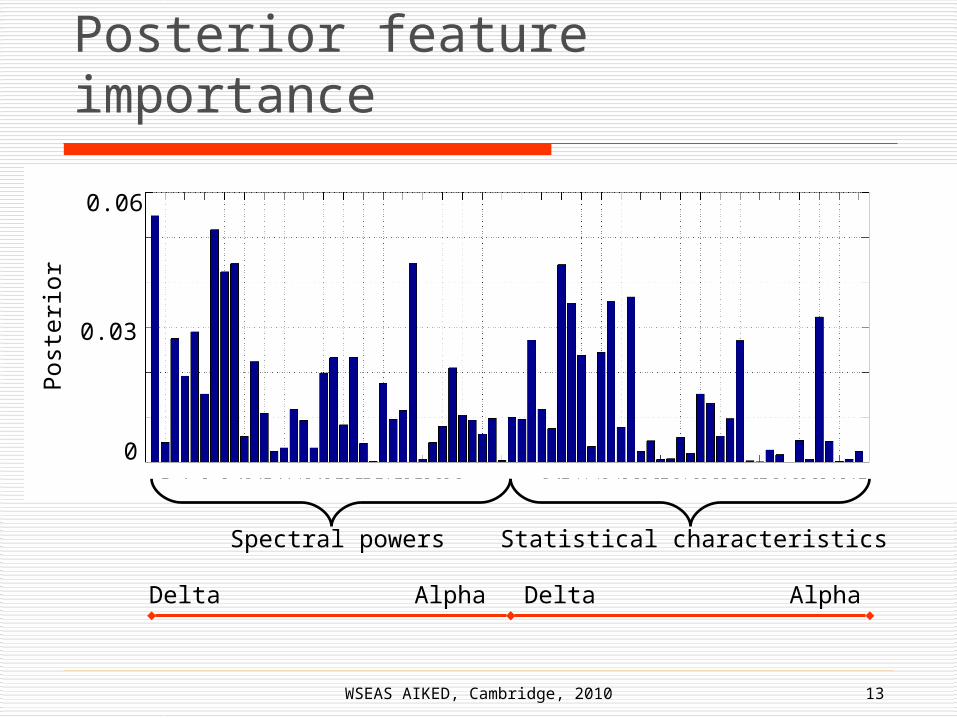
The EEG data is represented by spectral features and their statistical characteristics, in total by 72 attributes, some of them make weak contribution
To assess the feature importance, we can use Decision Trees (DTs) for BMA
…BMA for brain maturity assessment:lack of prior information causing biased sampling
WSEAS AIKED, Cambridge, 2010 10
If an attribute was rarely used in DTs included in the ensemble, we assume that this attribute makes a wear contribution
When the number of weak attributes is large, the disproportion in models becomes significant
Our hypothesis is that discarding the models using weak EEG attributes will reduce the negative effect of disproportional sampling
Solution: using posterior information about features
WSEAS AIKED, Cambridge, 2010 11
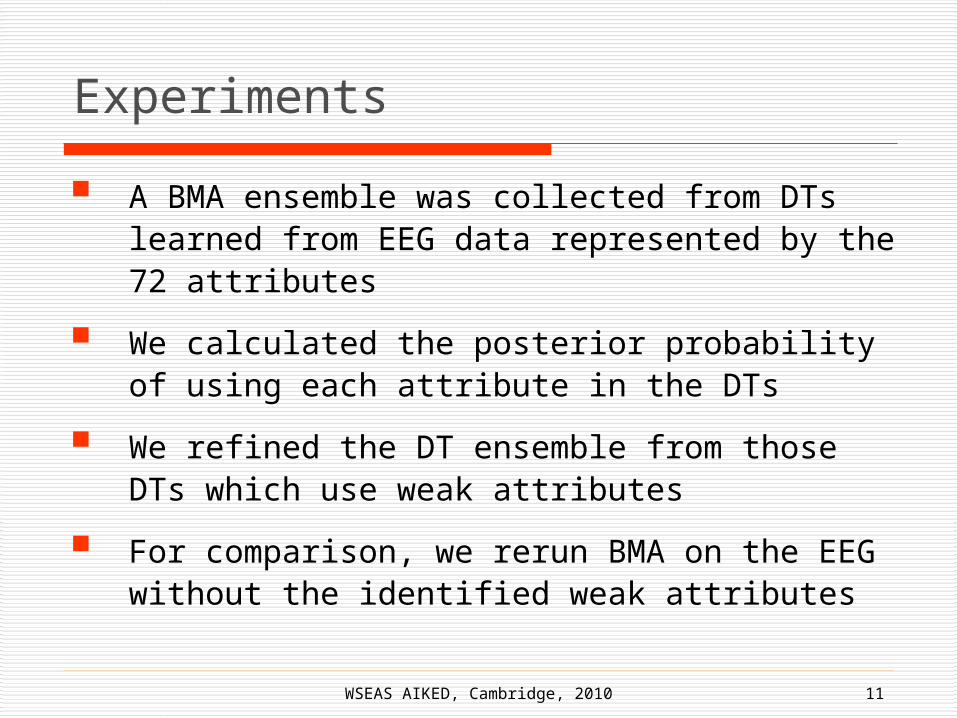
Experiments
A BMA ensemble was collected from DTs learned from EEG data represented by the 72 attributes
We calculated the posterior probability of using each attribute in the DTs
We refined the DT ensemble from those DTs which use weak attributes
For comparison, we rerun BMA on the EEG without the identified weak attributes
WSEAS AIKED, Cambridge, 2010 12
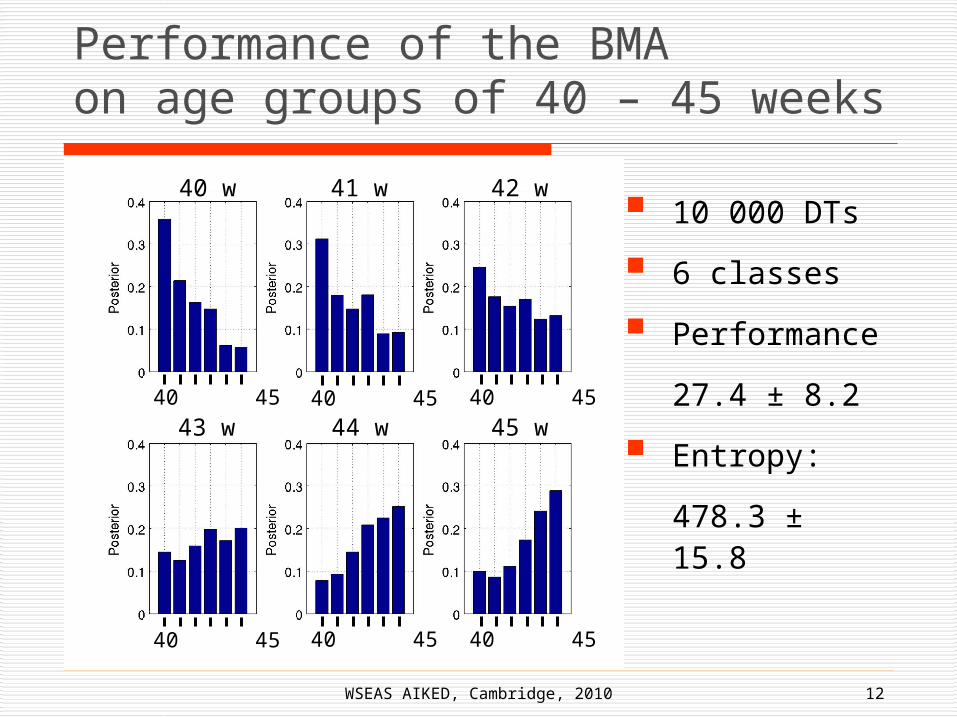
Performance of the BMA on age groups of 40 – 45 weeks
10 000 DTs
6 classes
Performance
27.4 ± 8.2
Entropy:
478.3 ± 15.8
40 45 40 45 40 45
40 45 40 45 40 45
43 w 44 w 45 w
40 w 41 w 42 w
WSEAS AIKED, Cambridge, 2010 13
Posterior feature importance
Spectral powers Statistical characteristics
Delta Alpha Delta Alpha
Post
eri
or
0.06
0
0.03
WSEAS AIKED, Cambridge, 2010 14
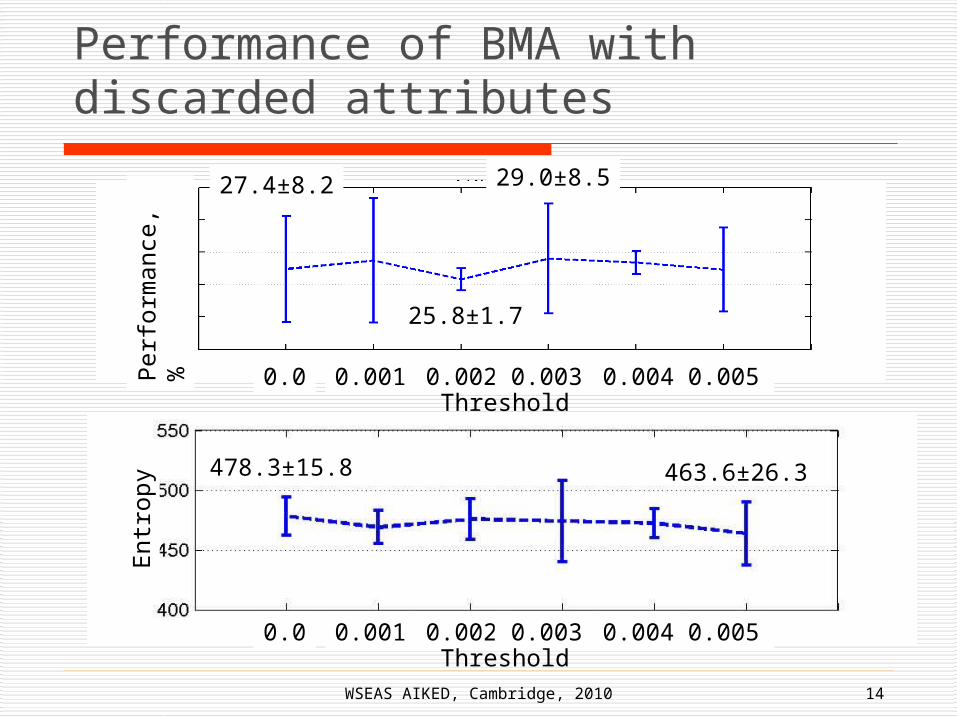
Performance of BMA with discarded attributes
Perf
orm
ance
, %29.0±8.527.4±8.2
Entr
opy 478.3±15.8 463.6±26.3
0.0 0.001 0.002 0.003 0.004 0.005Threshold
0.0 0.001 0.002 0.003 0.004 0.005Threshold
25.8±1.7
WSEAS AIKED, Cambridge, 2010 15
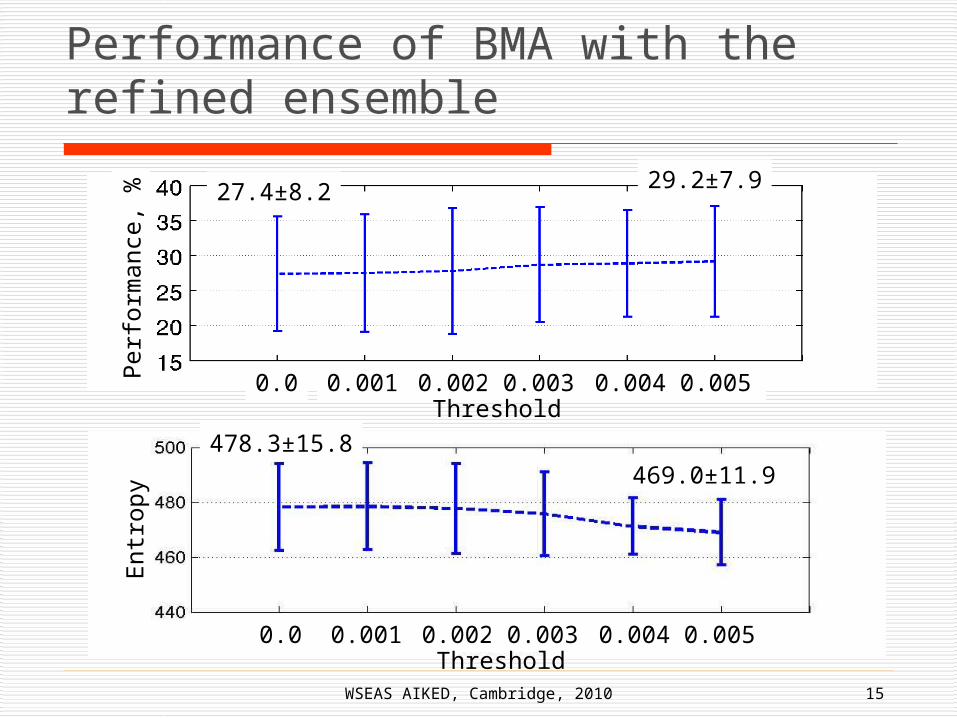
Performance of BMA with the refined ensemble
27.4±8.2 29.2±7.9
Perf
orm
ance
, %
Entr
opy
478.3±15.8469.0±11.9
0.0 0.001 0.002 0.003 0.004 0.005Threshold
0.0 0.001 0.002 0.003 0.004 0.005Threshold
WSEAS AIKED, Cambridge, 2010 16
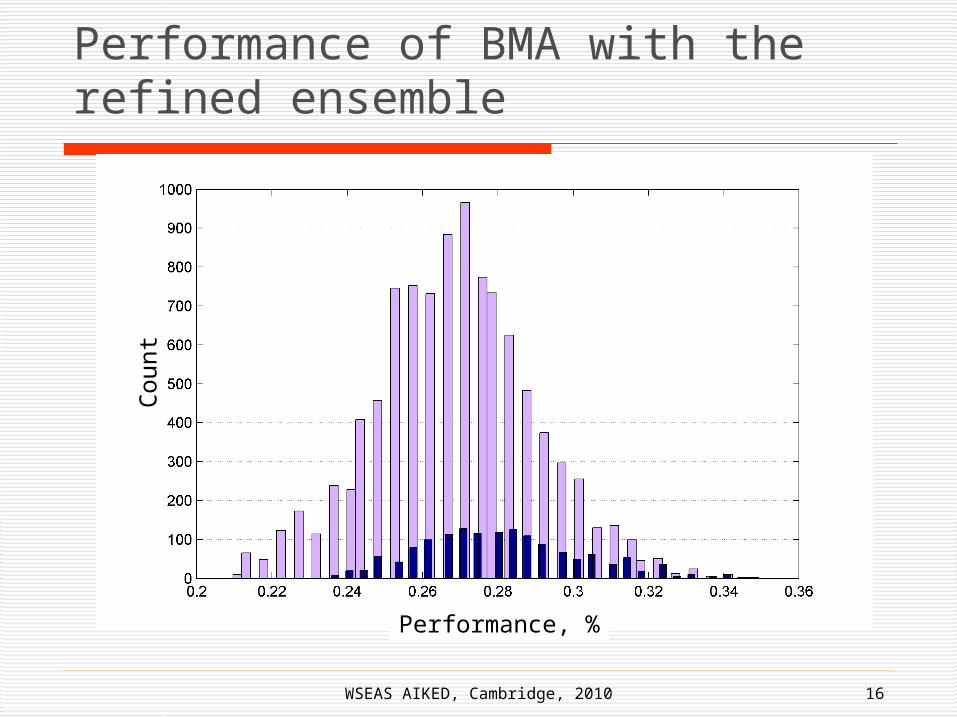
Performance of BMA with the refined ensemble
Performance, %
Count
WSEAS AIKED, Cambridge, 2010 17
Conclusions
The larger the number of weak attributes, the greater the negative impact on BMA performance
Reduction of the data dimensionality by discarding of weak attributes enabled improving BMA performance (1.6%) due to reducing a model parameter space
The proposed technique provides comparable improvement in performance (1.8%) without the need of rerunning the BMA

WSEAS AIKED, Cambridge, 2010 18
Acknowledgements
This research is funded by the Leverhulme Trust
www.leverhulme.ac.uk