Embed Size (px)
Citation preview
RPP-RPT-60396 Rev. 0
Atmospheric Modeling of the A Farm Retrieval Exhausters
AuthorBrian RumburgTanya Williams
TerraGraphics Environmental Engineering, Inc.
Date PublishedSeptember 2017
Prepared for the U.S. Department of EnergyAssistant Secretary for Environmental Management
Contractor for the U.S. Department of EnergyOffice of River Protection under Contract DE-AC27-08RV14800
P.O. Box 850Richland, Washington

RPP-RPT-60396 Rev. 0
EXECUTIVE SUMMARY
Washington River Protection Solutions, LLC is committed to the safe and efficient retrieval of radioactive and hazardous wastes from the Hanford Tank Farms. Hazardous waste is stored in large underground tanks at Hanford until it can be treated for final storage. A Farm, a single-shelled tank farm, is located just to the north of the 242-A Evaporator Building in the 200 East Area of Hanford. The waste in the single-shelled tanks in A Farm has previously been interim stabilized by having all the pumpable liquids removed. The remaining waste in the A Farm tanks is scheduled to be retrieved into double-shelled tanks in the near future.
Planning for waste retrieval requires an assessment of the potential increase in toxic emissions during retrieval and a prediction of the transport of these emissions through the atmosphere. The process of retrieving the waste from the single-shelled tanks includes waste disturbing activities necessary to liquify and pump the waste. This process increases emissions due to the increased volatilization of the compounds. Additionally, there is a possibility that the 60-feet tall 242-A Evaporator Building will impact the dispersion of the exhaust plume from the A Farm exhausters.
The project assessed the emissions from the new A Farm exhausters using AERMOD. AERMOD is a United States Environmental Protection Agency atmospheric dispersion model that can model the transport of air pollutants from multiple emission sources to multiple receptors and is primarily used in modeling regulated toxic and criteria air pollutants. AERMOD was designed to be conservative in estimating concentrations in order to protect human health. AERMOD has a building downwash option that models the pollutant airflow around buildings to determine the impact of those buildings on ground level dispersion.
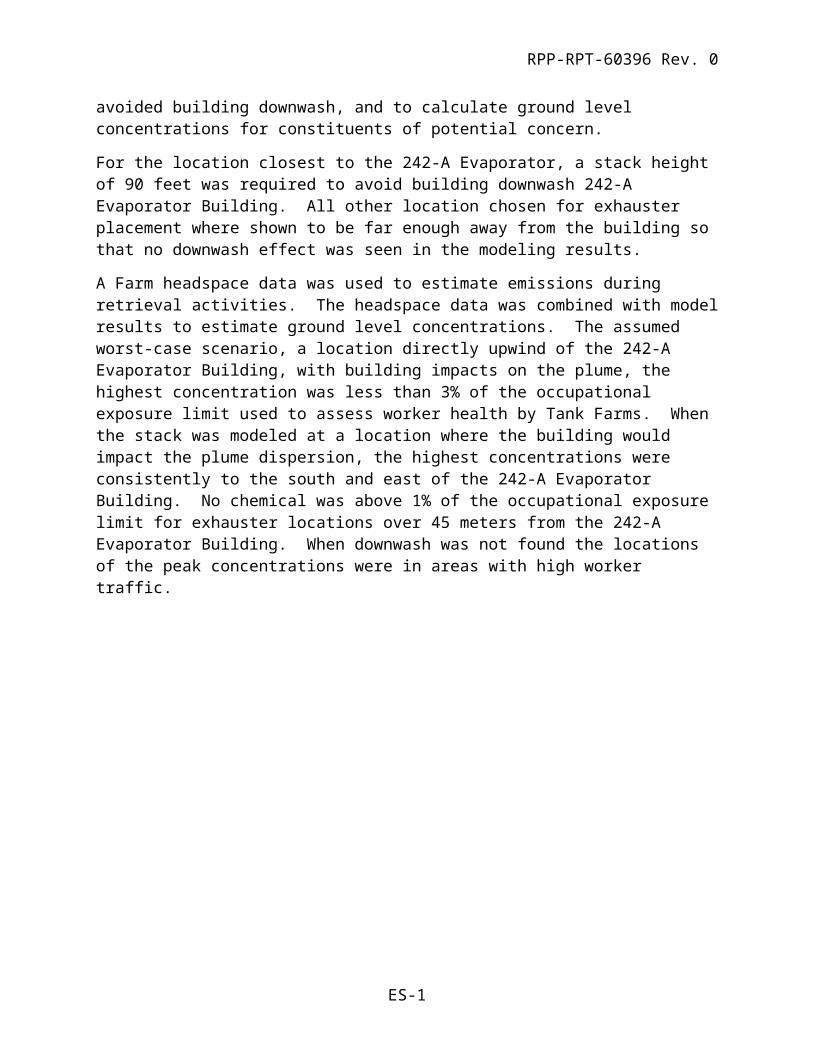
Atmospheric dispersion modeling was performed to determine locations within A Farm where the exhauster emissions would not be effected by building downwash, to determine stack heights that avoided building downwash, and to calculate ground level concentrations for constituents of potential concern.
For the location closest to the 242-A Evaporator, a stack height of 90 feet was required to avoid building downwash 242-A Evaporator Building. All other location chosen for exhauster placement where shown to be far enough away from the building so that no downwash effect was seen in the modeling results.
A Farm headspace data was used to estimate emissions during retrieval activities. The headspace data was combined with model results to estimate ground level concentrations. The assumed worst-case scenario, a location directly upwind of the 242-A Evaporator Building, with building impacts on the plume, the highest concentration was less than 3% of the occupational exposure limit used to assess worker health by Tank Farms. When the stack was modeled at a location where the building would impact the plume dispersion, the highest concentrations were consistently to the south and east of the 242-A Evaporator Building. No chemical was above 1% of the occupational exposure limit for exhauster locations over 45 meters from the 242-A Evaporator Building. When downwash was not found the locations of the peak concentrations were in areas with high worker traffic.
ES-1

RPP-RPT-60396 Rev. 0
ES-1
RPP-RPT-60396 Rev. 0
CONTENTS
1.0 INTRODUCTION...............................................................................................................1
2.0 BACKGROUND.................................................................................................................2
3.0 DISPERSION MODELING................................................................................................33.1 Plume Dispersion.....................................................................................................33.2 Air Dispersion Modeling Program (AERMOD).....................................................33.3 Input Data................................................................................................................33.4 Meteorological Data................................................................................................43.5 Assumptions............................................................................................................73.6 Limitations...............................................................................................................7
4.0 EXHAUSTER MODEL OPTIONS....................................................................................84.1 Option 1: South-Central Stack Location.................................................................84.2 Option 2: South-Central Stack Location, Multiple Stack Heights.........................84.3 Option 3: Modeling Multiple Sites.........................................................................94.4 Option 4: Actual Emissions and Modeled Concentrations.....................................9
5.0 RESULTS............................................................................................................................95.1 Option 1: South-Central Stack Location.................................................................95.2 Option 2: South-Central Location, Stack Heights................................................165.3 Option 3: Testing Various A Farm Locations for Downwash..............................225.4 Option 4: Site Specific Concentrations.................................................................22
6.0 CONCLUSIONS...............................................................................................................25
7.0 REFERENCES..................................................................................................................25
i
RPP-RPT-60396 Rev. 0
LIST OF FIGURES
Figure 1. Aerial picture of A Farm and the 242-A Evaporator Building with preferred location marked with an X..........................................................................................................2
Figure 2. Wind Rose for Calendar Year 2009 from the Hanford Meteorological Station..............5Figure 3. Wind Rose for Calendar Year 2010 from the Hanford Meteorological Station..............5Figure 4. Wind Rose for Calendar Year 2011 from the Hanford Meteorological Station..............6Figure 5. Wind Rose for Calendar Year 2012 from the Hanford Meteorological Station..............6Figure 6. Wind Rose for Calendar Year 2013 from the Hanford Meteorological Station..............7Figure 7. One A Farm exhauster, 1-hour averaging, 3,000 cfm, no downwash dilution ratios....11Figure 8. One A Farm exhauster, 1-hour averaging, 3,000 cfm, downwash dilution ratios.........12Figure 9. One A Farm exhauster, 1-hour averaging, 1,500 cfm, no downwash dilution ratios....13Figure 10. One A Farm exhauster, 1-hour averaging, 1,500 cfm, downwash dilution ratios.......14Figure 12. One A Farm exhauster, 80 foot stack, 1-hour averaging, 1,500 cfm, downwash
dilution ratios..............................................................................................................20Figure 13. One A Farm exhauster, 90 foot stack, 1-hour averaging, 1,500 cfm, downwash
dilution ratios..............................................................................................................21Figure 14. Locations of all exhausters modeled in A Farm with green markers signifying no
downwash observed and red markers signifying downwash observed......................22Figure 15. Peak 1-hour dilution ground level concentration for the A Farm exhauster located at
Site 57.........................................................................................................................24
LIST OF TABLES
Table 1. Dilution ratio, one A Farm exhauster south-central location, 1-hour averaging, with and without building downwash, flow rates of 1,500 and 3,000 cfm...............................10
Table 2. Dilution ratios, one A Farm Exhauster, 8-hour averaging, with and without building downwash. flow rates of 1,500 and 3,000 cfm...........................................................15
Table 3. Dilution ratios, one A Farm Exhauster, 24-hour averaging, with and without building downwash, flow rates of 1,500 and 3,000 cfm...........................................................15
Table 4. Dilution ratios, one A Farm Exhauster, annual averaging, with and without building downwash, flow rates of 1,500 and 3,000 cfm...........................................................16
Table 5. Dilution ratios, one A Farm exhauster, 1-Hour averaging, flow rate of 1,500 cfm........17Table 6. Dilution ratio, one A Farm exhauster, 8-Hour averaging, flow rate of 1,500 cfm.........17Table 7. Dilution ratio, one A Farm exhauster, 24-Hour averaging, flow rate of 1,500 cfm.......17Table 8. Dilution ratio, one A Farm exhauster, annual averaging, flow rate of 1,500 cfm..........18Table 9. Chemicals of potential concern found in A Farm tank headspace and modeled
concentrations with percentage of the Occupational Exposure Levels......................23
ii
RPP-RPT-60396 Rev. 0
LIST OF TERMS
Abbreviations and Acronyms
AERMAP terrain preprocessor for AERMODAERMET meteorological data preprocessor for AERMODAERMOD air dispersion modeling programBPIP building data preprocessor for AERMODDOE Department of EnergyDST Double-shelled tankEPA United States Environmental Protection AgencyHISI Hanford Information System InventoryHMS Hanford Meteorological StationOEL Occupational Exposure LevelSST Single-shelled tankSWIHD Site Wide Industrial Hygiene DatabaseTWINS Tank Waste Information Network System USGS United States Geological ServiceWRPS Washington River Protection Solutions, LLC
Unitsg gramg/s gram per secondm meterm/s meters per secondm3 cubic meterµg micrograms second
iii

RPP-RPT-60396 Rev. 0
1.0 INTRODUCTION
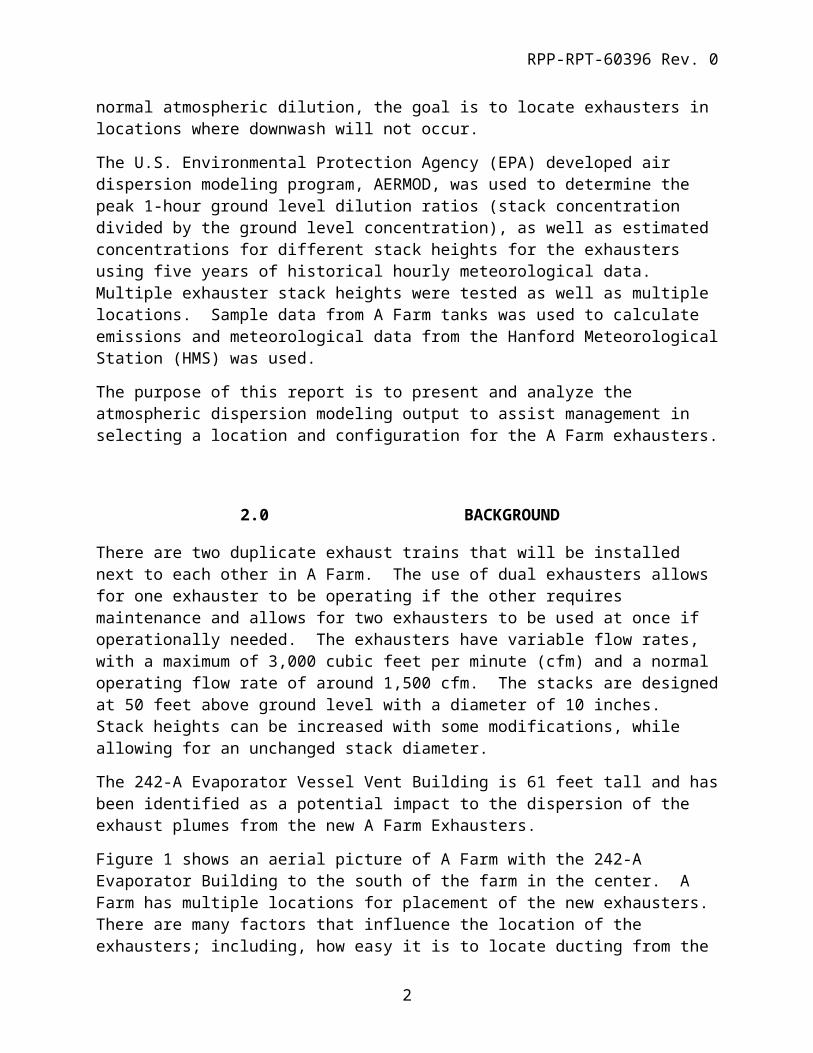
Washington River Protection Solutions (WRPS), LLC and the U.S. Department of Energy (DOE) is committed to the safe and efficient retrieval of radioactive and hazardous wastes from the DOE Hanford Tank Farms. Hazardous waste is stored in large underground tanks at Hanford until it can be treated for final storage. The waste in the single-shelled tanks (SST) in A Farm have previously been interim stabilized by having all the pumpable liquids removed. The waste in the A Farm tanks is scheduled to be retrieved into double-shelled tanks (DST). The process of retrieving the waste from the SSTs involves using multiple technologies to liquify the solid and semi-solid waste and then pump the waste to DSTs. Exhausters are used to ventilate the headspace of the SSTs to ensure any gaseous or particulate emissions are controlled. Exhausters also assist in maintaining visibility in the tank headspace so that operators can monitor the retrieval processes.
WRPS evaluates the location, stack heights, tank emission rates, and modeled potential ground level concentrations for the potential impact when evaluating where to place stacks. Atmospheric modeling is performed to give an estimate of the concentrations workers might be exposed to based upon potential stack locations, stack heights, flow rates, historical emission rates, and structural interferences or obstacles.
The A Farm is located just to the north of the 242-A Evaporator in the 200 East Area of the Hanford Site. The 242-A Evaporator Building is over 60 feet tall and there is the potential for the stack plume to be captured by the airflow around the building. Turbulent wake zones or eddies in the atmosphere occur when the wind flows over and around obstacles like buildings and hills. In these zones pollutant plumes from stacks can be forced to impact the ground instead of dispersing normally in the atmosphere and there is the potential for recirculation eddies to form where the pollutant accumulates in theses eddies. The recirculation areas are called building downwash areas. Since these building downwash areas have the potential to increase normal atmospheric dilution, the goal is to locate exhausters in locations where downwash will not occur.
The U.S. Environmental Protection Agency (EPA) developed air dispersion modeling program, AERMOD, was used to determine the peak 1-hour ground level dilution ratios (stack concentration divided by the ground level concentration), as well as estimated concentrations for different stack heights for the exhausters using five years of historical hourly meteorological data. Multiple exhauster stack heights were tested as well as multiple locations. Sample data from A Farm tanks was used to calculate emissions and meteorological data from the Hanford Meteorological Station (HMS) was used.
The purpose of this report is to present and analyze the atmospheric dispersion modeling output to assist management in selecting a location and configuration for the A Farm exhausters.
1

RPP-RPT-60396 Rev. 0
2.0 BACKGROUND
There are two duplicate exhaust trains that will be installed next to each other in A Farm. The use of dual exhausters allows for one exhauster to be operating if the other requires maintenance and allows for two exhausters to be used at once if operationally needed. The exhausters have variable flow rates, with a maximum of 3,000 cubic feet per minute (cfm) and a normal operating flow rate of around 1,500 cfm. The stacks are designed at 50 feet above ground level with a diameter of 10 inches. Stack heights can be increased with some modifications, while allowing for an unchanged stack diameter.
The 242-A Evaporator Vessel Vent Building is 61 feet tall and has been identified as a potential impact to the dispersion of the exhaust plumes from the new A Farm Exhausters.
Figure 1 shows an aerial picture of A Farm with the 242-A Evaporator Building to the south of the farm in the center. A Farm has multiple locations for placement of the new exhausters. There are many factors that influence the location of the exhausters; including, how easy it is to locate ducting from the tanks to the exhausters and the locations of other buildings or previous contamination that might influence the decision.
Figure 1. Aerial picture of A Farm and the 242-A Evaporator Building with preferred location marked with an X.
2
RPP-RPT-60396 Rev. 0
3.0 DISPERSION MODELING
3.1 PLUME DISPERSION
Atmospheric turbulence is the dominant mechanism for plume dispersion. Atmospheric turbulence mixes the atmosphere horizontally from the wind and vertically from thermal heating of the earth. For stack release, it is possible for the plume to reach ground level for short periods of time due to vertical mixing. Buildings and hills can also create wake areas and recirculation zones where plumes can become trapped. When winds are light and variable, plumes tend to have minimal mixing. Inversions can also limit plume mixing. The major factors determining the dilution that a plume experiences are the proximity to the source and the level of atmospheric turbulence. The farther the plume travels, and the greater the turbulence, and thus the greater the dilution.
3.2 AIR DISPERSION MODELING PROGRAM (AERMOD)
AERMOD is a plume dispersion model that is based upon models of the planetary boundary layer turbulence and includes treatment of both surface and elevated sources as well as simple and complex terrain. AERMOD was developed by the EPA for regulatory compliance and is designed to give a conservative estimate of air pollutant concentrations. AERMOD is used for many air regulatory processes; including, assessing the impact of emission sources on the public, both close to the source and far away. AERMOD has three input processors that preprocess data and format data for AERMOD to read. The first is AERMET which takes meteorological data near the surface, as well as upper level air data, and then characterizes the atmospheric turbulence so that it can be processed be AERMOD. AERMAP is the terrain processor for AERMOD and it calculates the heights of source, receptors, buildings, and the surrounding terrain. BPIP is a building pre-processor which calculates the area influenced by the buildings based upon their size and shape.
The verification process for AERMOD involves running EPA test cases in AERMOD and comparing the results to EPA results. Each new version of AERMOD is verified. AERMOD Version 16216r was used and was verified in report RPP-RPT-60051, “AERMOD Version 16216r Testing Validation.”
3.3 INPUT DATA
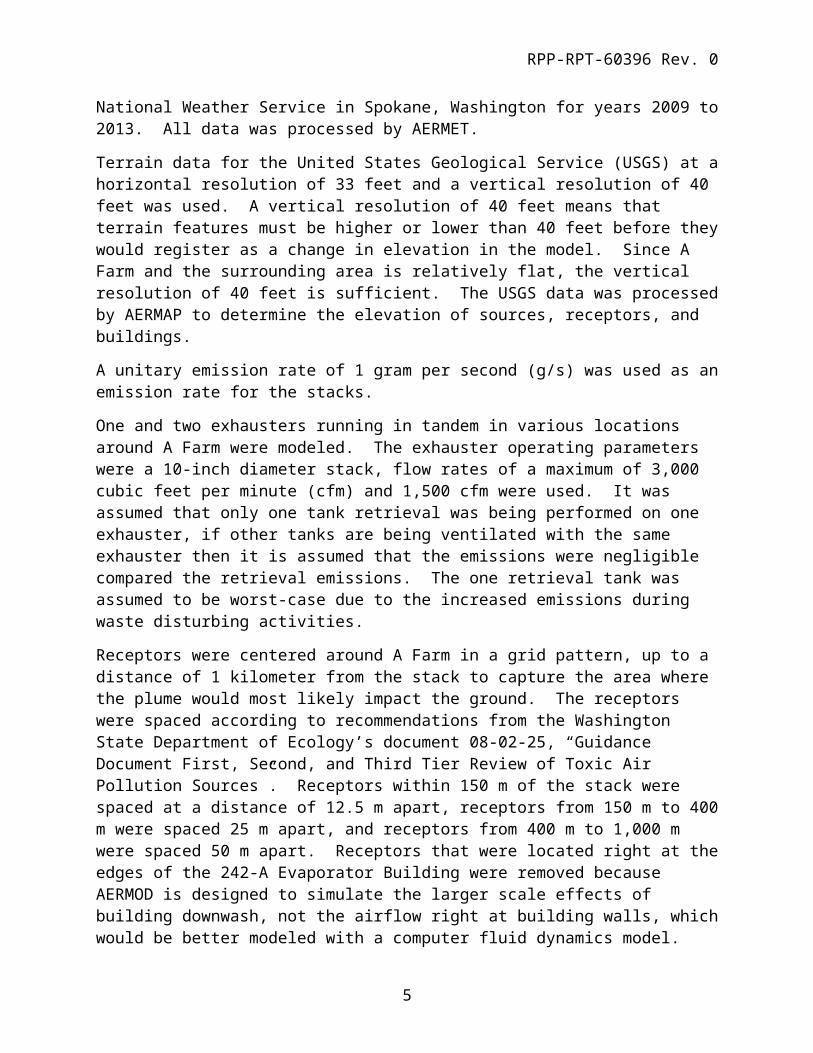
Hourly meteorological surface data for the years 2009 to 2013 was used from the HMS. The data is verified by Pacific Northwest National Laboratory in RPP-RPT-60051, “AERMET Software Quality Assurance Plan for Analysis.” Five years of continuous meteorological data is typically assumed to incorporate the most conservative conditions. Upper air data was collected by the National Weather Service in Spokane, Washington for years 2009 to 2013. All data was processed by AERMET.
Terrain data for the United States Geological Service (USGS) at a horizontal resolution of 33 feet and a vertical resolution of 40 feet was used. A vertical resolution of 40 feet means that terrain features must be higher or lower than 40 feet before they would register as a change in elevation in the model. Since A Farm and the surrounding area is relatively flat, the vertical
3
RPP-RPT-60396 Rev. 0
resolution of 40 feet is sufficient. The USGS data was processed by AERMAP to determine the elevation of sources, receptors, and buildings.
A unitary emission rate of 1 gram per second (g/s) was used as an emission rate for the stacks.
One and two exhausters running in tandem in various locations around A Farm were modeled. The exhauster operating parameters were a 10-inch diameter stack, flow rates of a maximum of 3,000 cubic feet per minute (cfm) and 1,500 cfm were used. It was assumed that only one tank retrieval was being performed on one exhauster, if other tanks are being ventilated with the same exhauster then it is assumed that the emissions were negligible compared the retrieval emissions. The one retrieval tank was assumed to be worst-case due to the increased emissions during waste disturbing activities.
Receptors were centered around A Farm in a grid pattern, up to a distance of 1 kilometer from the stack to capture the area where the plume would most likely impact the ground. The receptors were spaced according to recommendations from the Washington State Department of Ecology’s document 08-02-25, “Guidance Document First, Second, and Third Tier Review of Toxic Air Pollution Sources”. Receptors within 150 m of the stack were spaced at a distance of 12.5 m apart, receptors from 150 m to 400 m were spaced 25 m apart, and receptors from 400 m to 1,000 m were spaced 50 m apart. Receptors that were located right at the edges of the 242-A Evaporator Building were removed because AERMOD is designed to simulate the larger scale effects of building downwash, not the airflow right at building walls, which would be better modeled with a computer fluid dynamics model.
AERMOD models the output concentrations at receptors in micrograms per cubic meter (µg/m3). The stack emission rate was converted to a stack concentration based upon the flow rate. The concentrations were converted to a dilution ratio to facilitate converting stack concentrations to ground level concentrations in the future. The dilution ratio was calculated by dividing the stack concentration by the modeled receptor concentration. Since the stack concentration is a constant, a lower dilution ratio means a higher receptor concentration.
3.4 METEOROLOGICAL DATA
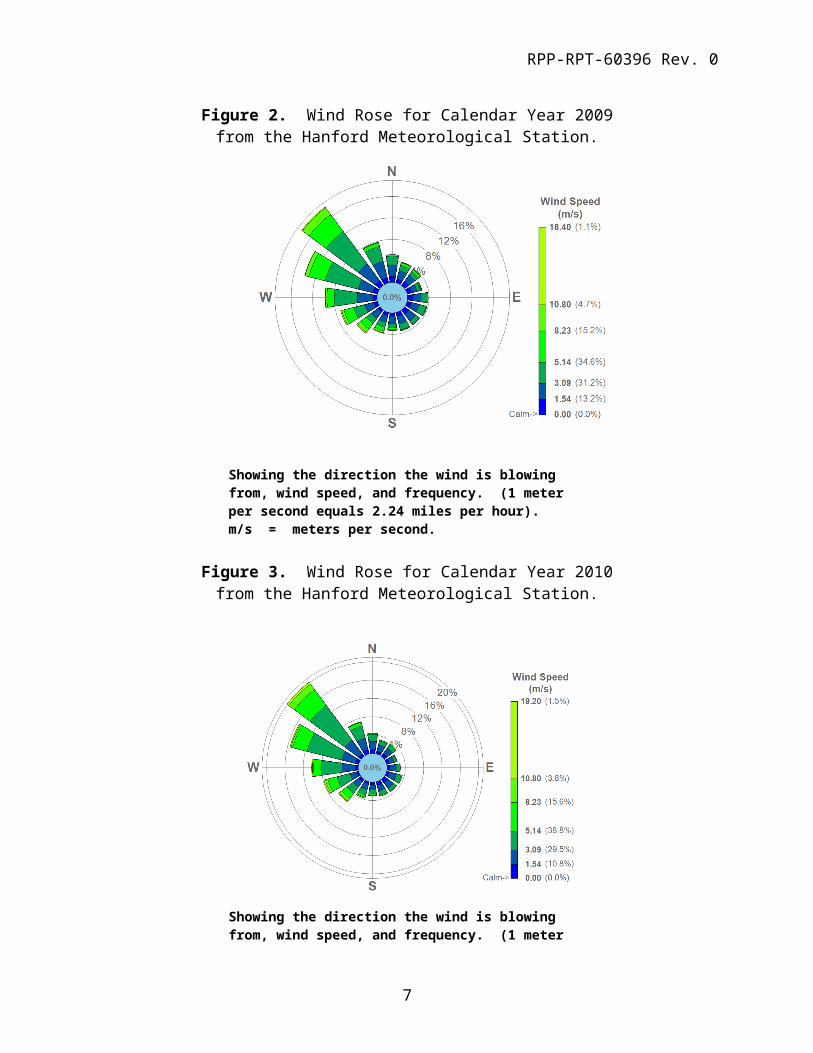
Annual wind roses are shown below for the years 2009 to 2013. Generally, for all years, the dominant wind direction was from the west and northwest with the strongest winds also coming from that direction. The winds tend to be light and variable a significant amount of the time. Light and variable winds with inversions tend to keep the plume near the ground and produce the highest ground level concentrations.
4

RPP-RPT-60396 Rev. 0
Figure 2. Wind Rose for Calendar Year 2009from the Hanford Meteorological Station.
Showing the direction the wind is blowing from, wind speed, and frequency. (1 meter per second equals 2.24 miles per hour).m/s = meters per second.
Figure 3. Wind Rose for Calendar Year 2010from the Hanford Meteorological Station.
Showing the direction the wind is blowing from, wind speed, and frequency. (1 meter per second equals 2.24 miles per hour).m/s = meters per second.
5

RPP-RPT-60396 Rev. 0
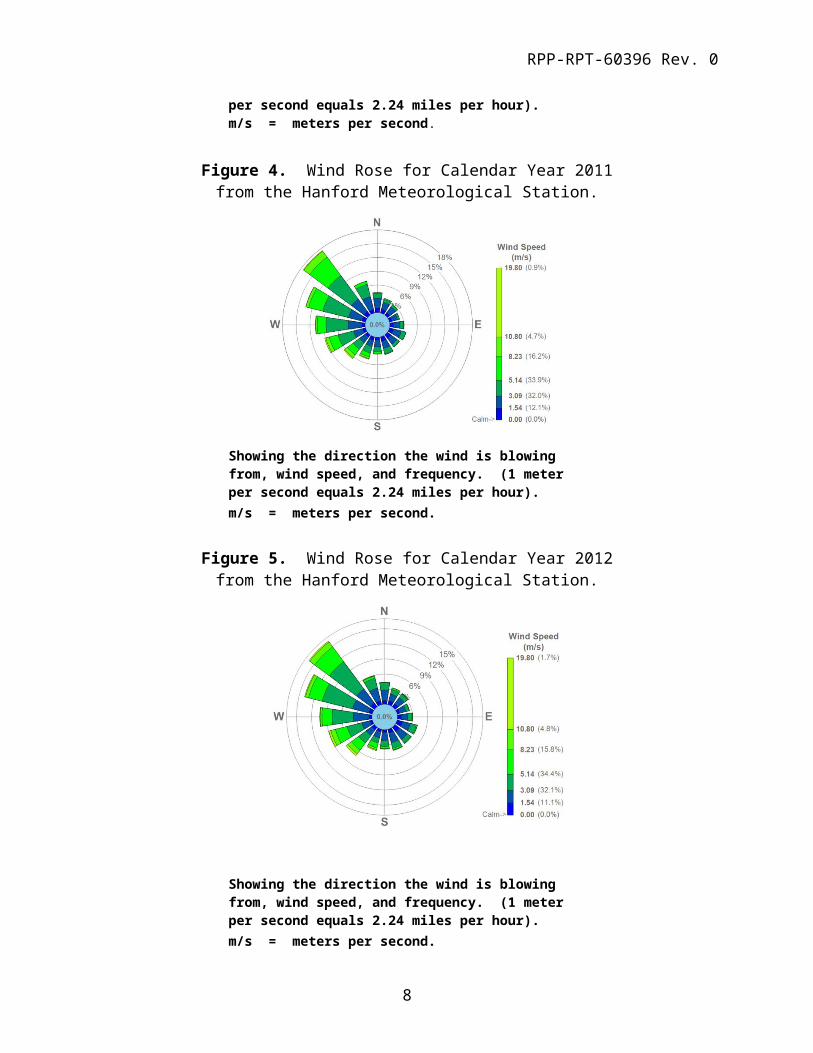
Figure 4. Wind Rose for Calendar Year 2011from the Hanford Meteorological Station.
Showing the direction the wind is blowing from, wind speed, and frequency. (1 meter per second equals 2.24 miles per hour).m/s = meters per second.
Figure 5. Wind Rose for Calendar Year 2012from the Hanford Meteorological Station.
Showing the direction the wind is blowing from, wind speed, and frequency. (1 meter per second equals 2.24 miles per hour).m/s = meters per second.
6
RPP-RPT-60396 Rev. 0
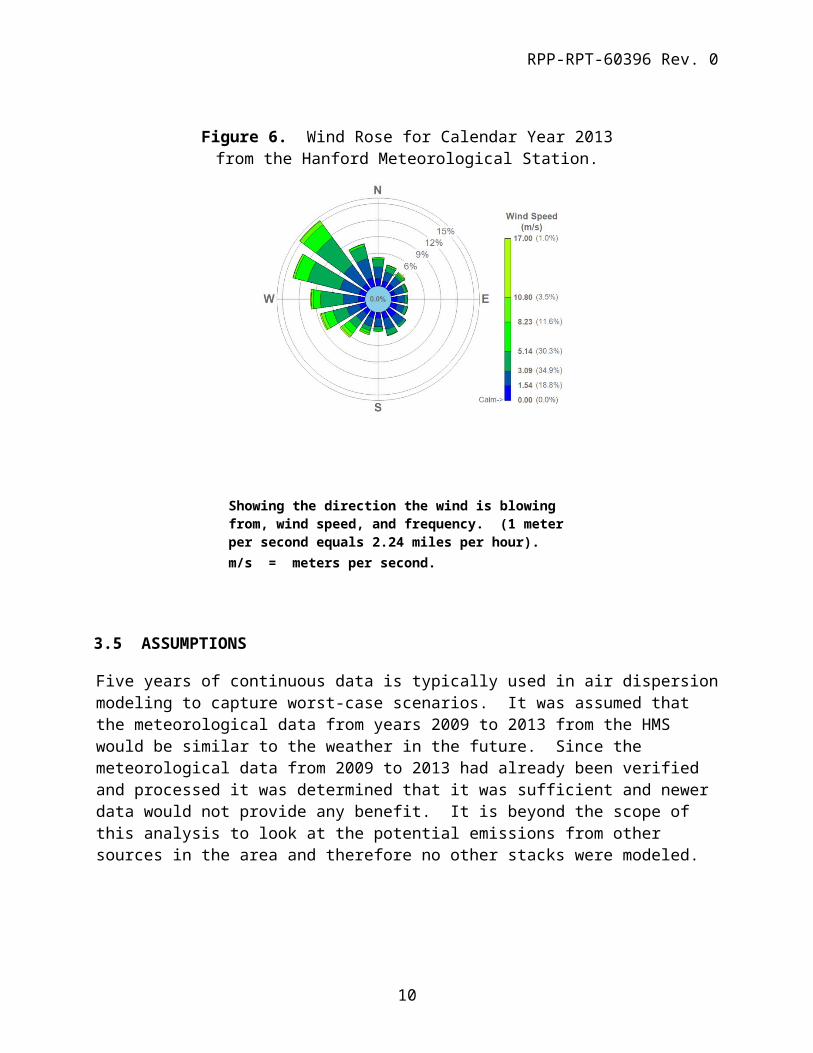
Figure 6. Wind Rose for Calendar Year 2013from the Hanford Meteorological Station.
Showing the direction the wind is blowing from, wind speed, and frequency. (1 meter per second equals 2.24 miles per hour).m/s = meters per second.
3.5 ASSUMPTIONS
Five years of continuous data is typically used in air dispersion modeling to capture worst-case scenarios. It was assumed that the meteorological data from years 2009 to 2013 from the HMS would be similar to the weather in the future. Since the meteorological data from 2009 to 2013 had already been verified and processed it was determined that it was sufficient and newer data would not provide any benefit. It is beyond the scope of this analysis to look at the potential emissions from other sources in the area and therefore no other stacks were modeled.
3.6 LIMITATIONS
The HMS data was assumed to be representative to the conditions in the vicinity of A Farm and the upper air data from the National Weather Service in Spokane was also assumed to be representative of the area.
7

RPP-RPT-60396 Rev. 0
4.0 EXHAUSTER MODEL OPTIONS
A Farm has many sites for the placement of the exhausters, with each location having advantages and disadvantages. Multiple locations were tested, as well as stack heights, operating flow rates, and turning on and off the AERMOD downwash feature. Initially, a location in the south-central part of the farm was modeled. Several other locations were modeled to better understand the locations where the exhauster emissions were influenced by the 242-A Evaporator Building. The AERMOD building downwash feature was turned on and off to better understand how the peak ground level concentration changed at different exhauster placement locations in A Farm.
4.1 OPTION 1: SOUTH-CENTRAL STACK LOCATION
The first option modeled was a south-central A Farm location along the southern fence line just to the north and east of the 242-A Evaporator Building. The advantage of this location is that it is close to the tanks so that ducting and routing exhauster condensation back to the tanks is minimized and also allows for easy access around the farm for equipment, such as cranes. The disadvantage of this location is that it is upwind and very close to the 242-A Evaporator Building and there is the potential for building downwash. For this initial site, one exhauster was run at both 1,500 cfm and 3,000 cfm. Downwash was turned on and off for each scenario.
Two exhausters were also modeled at the same time. It was found that since both exhausters are so close to each other, both plumes end up at approximately the same location. Since one of the modeling assumptions is that one tank retrieval is going on for each exhauster, modeling two exhausters simultaneous could potentially bias the result. Both stacks would have to be emitting the same chemicals at the same rate for the dilution ratio data to be interpretable. Therefore, one stack results were modeled and are shown.
A stack height of 50 feet and flow rates of 1,500 and 3,000 cfm were modeled.
4.2 OPTION 2: SOUTH-CENTRAL STACK LOCATION, MULTIPLE STACK HEIGHTS
The results for Option 1, shown in Section 5.1, showed that the plume from the 50 foot stack would be captured by the 242-A Evaporator Building. Option 2 was developed to increase the stack height of the exhauster at the south-central location in A Farm with the goal of determining if the stack height could be raised enough to avoid the plume experiencing building downwash from the 242-A Evaporator Building. The 1,500 cfm modeling scenario was selected because it was determined to be the worst-case since doubling the flow rate would increase the plume height.
The following stack heights were modeled.
1. 50 feet2. 60 feet3. 70 feet4. 80 feet5. 90 feet
8
RPP-RPT-60396 Rev. 0
4.3 OPTION 3: MODELING MULTIPLE SITES
The results of Option 2, shown in Section 5.2, show that increasing the stack height decreased the building downwash effect on the plume, therefore decreasing ground level concentrations near the 242-A Evaporator Building and A Farm. However, extending the stack can be a costly redesign. Option 3 was developed to evaluate the sites all over A Farm to determine the areas where a 50-foot stack could be located without the plume experiencing downwash from the 242-A Evaporator Building. A grid of exhausters spaced 10 meters (m), (33 feet) apart was modeled. The AERMOD output was analyzed for the plume impacting the ground near the 242-A Evaporator Building. Option 3 was not attempting to identify worst-case concentrations, but only a comparison of dispersion; therefore, only year 2010 was modeled for analysis.
4.4 OPTION 4: ACTUAL EMISSIONS AND MODELED CONCENTRATIONS
After modeling sites across A Farm in Option 3, the goal was to understand the actual concentrations at ground level and compare those modeled concentrations to WRPS occupational exposure levels (OEL) (WRPS-1604188, “Chemicals of Potential Concern”). Actual headspace data was downloaded from the Tank Waste Information Network System (TWINS) and the Site Wide Industrial Hygiene Database (SWIHD). The headspace data was converted to emission rates from the tanks. Since the emission rates were taken when the waste was not being disturbed, a factor of 100 was applied to estimate emissions during retrieval operations. Those emissions were then multiplied by the modeled emission factors and the results compared to the OEL levels.
5.0 RESULTS
The results for the exhauster model options described in Section 4 are shown below.
5.1 OPTION 1: SOUTH-CENTRAL STACK LOCATION
Option 1 has the exhauster located in the south-central location with one exhauster running with and without downwash and at flow rates of 1,500 and 3,000 cfm. When calculating the dilution ratio, the emission rate is constant at 1 g/s and thus the stack concentration is half at 3,000 cfm versus 1,500 cfm.
Table 1 shows one exhauster running with both 1,500 and 3,000 cfm and with AERMOD downwash turned on and off. Shown are the top ten worst-case 1-hour averaging time dilution ratios for all five years. For the 3,000 cfm case, turning on AERMOD downwash resulted in a decrease in the ground level dilution by a factor ranging from 2.5 to 6.2. For the 1,500 cfm case, turning on AERMOD downwash resulted in a decrease in the ground level dilution by a factor ranging from 4.8 to 7.5.
9
RPP-RPT-60396 Rev. 0
Table 1. Dilution ratio, one A Farm exhauster south-central location, 1-hour averaging, with and without building downwash, flow rates of 1,500 and 3,000 cfm.
Flow Rate 3,000 cfm Flow Rate 1,500 cfmRank No Downwash Downwash No Downwash Downwash
1st 2,187 861 4,226 8802nd 4,527 868 7,221 1,0003rd 5,121 906 7,467 1,0124th 5,368 988 7,854 1,1005th 5,538 1,030 8,312 1,1586th 6,095 1,041 8,680 1,1797th 6,417 1,083 9,159 1,2278th 6,596 1,095 9,197 1,2279th 6,830 1,100 9,375 1,23210th 6,852 1,103 9,437 1,252
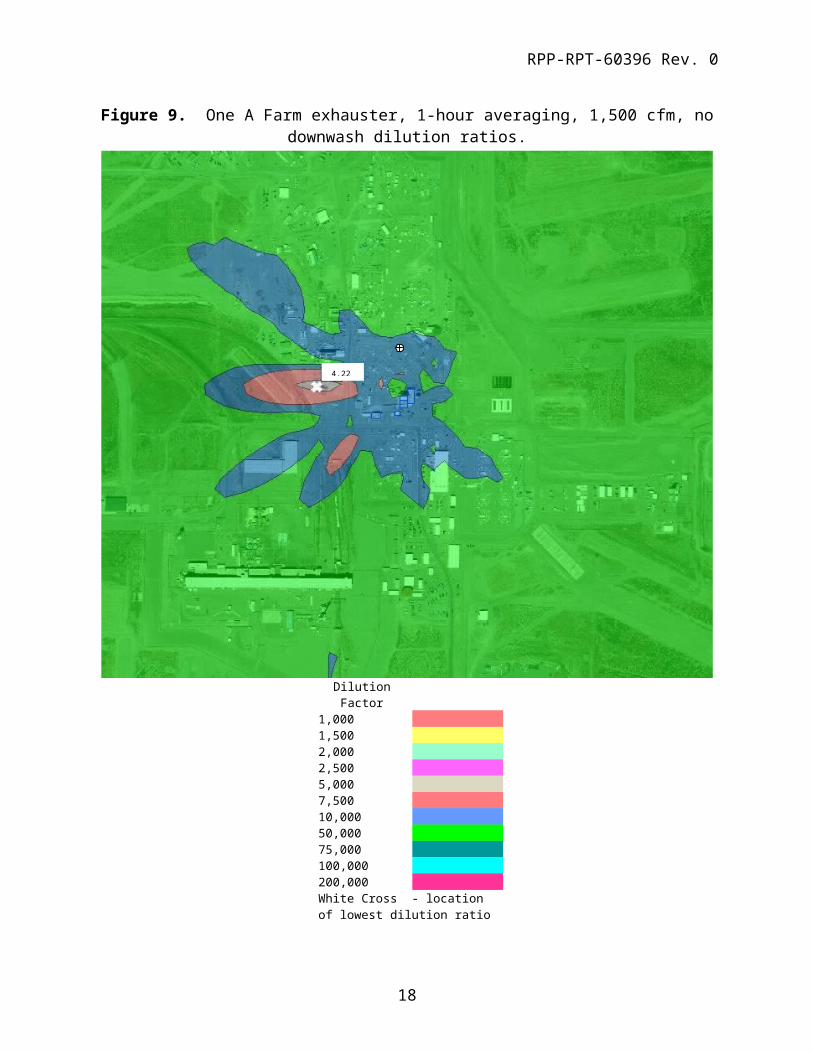
Figures 7 - 10 show contour plots of the dilution ratios around A Farm for one exhauster running for the worst-case 1-hour averaging times.
Figures 7 and 8 shows one A Farm exhauster running at 3,000 cfm at a 1-hour averaging time without and with building downwash. The worst-case (lowest) dilution ratio without building downwash is located away from A Farm and to the west. The worst-case dilution ratio with building downwash is located just to the south of the 242-A Evaporator Building.
Figures 9 and 10 shows one A Farm exhauster running at 1,500 cfm at 1-hour averaging time without and with building downwash. Worst-case dilution ratios are in similar locations as for the 3,000 cfm model runs. The ratio with downwash was lower than without downwash.
10

RPP-RPT-60396 Rev. 0
Figure 7. One A Farm exhauster, 1-hour averaging, 3,000 cfm, no downwash dilution ratios.
Dilution Factor1,000 1,500 2,000 2,500 5,000 7,500 10,000 50,000 75,000 100,000 200,000 White Cross - location of lowest dilution ratio
2,187
11
RPP-RPT-60396 Rev. 0
Figure 8. One A Farm exhauster, 1-hour averaging, 3,000 cfm, downwash dilution ratios.
Dilution Factor1,000 1,500 2,000 2,500 5,000 7,500 10,000 50,000 75,000 100,000 200,000 White Cross - location of lowest dilution ratio
861
12

RPP-RPT-60396 Rev. 0
Figure 9. One A Farm exhauster, 1-hour averaging, 1,500 cfm, no downwash dilution ratios.
Dilution Factor1,000 1,500 2,000 2,500 5,000 7,500 10,000 50,000 75,000 100,000 200,000 White Cross - location of lowest dilution ratio
4,226
13
RPP-RPT-60396 Rev. 0
Figure 10. One A Farm exhauster, 1-hour averaging, 1,500 cfm, downwash dilution ratios.
Dilution Factor1,000 1,500 2,000 2,500 5,000 7,500 10,000 50,000 75,000 100,000 200,000 White Cross - location of lowest dilution ratio
880
14

RPP-RPT-60396 Rev. 0
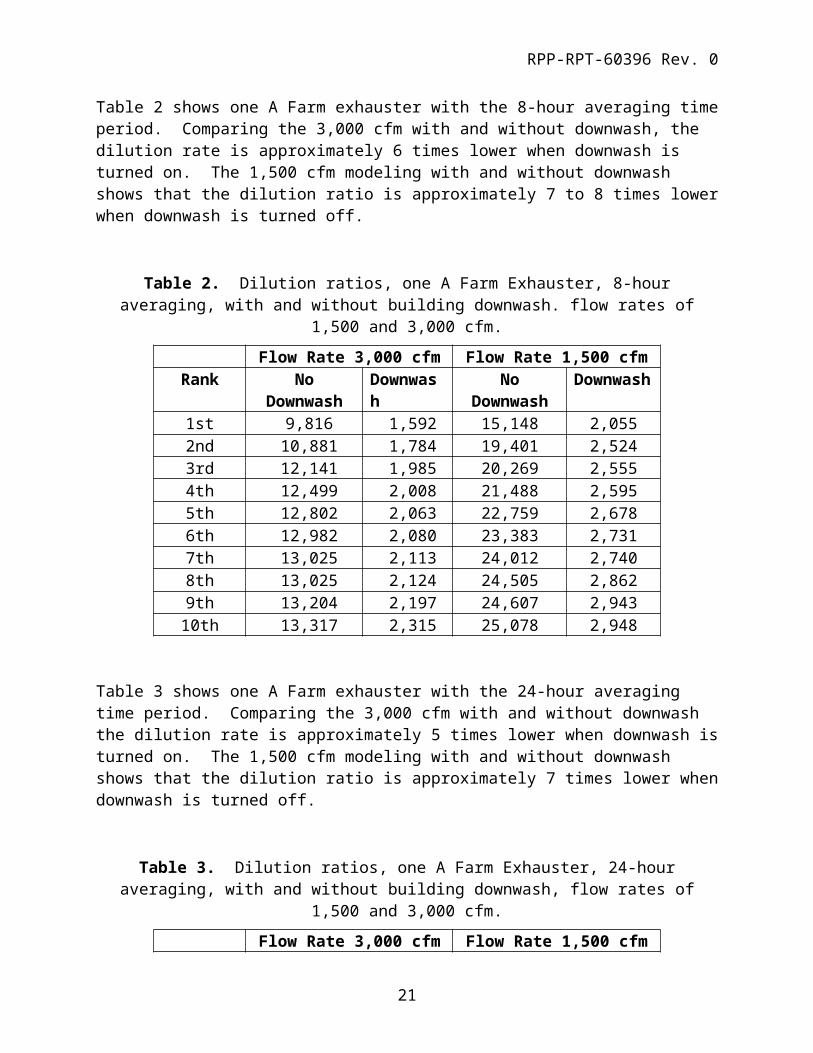
Table 2 shows one A Farm exhauster with the 8-hour averaging time period. Comparing the 3,000 cfm with and without downwash, the dilution rate is approximately 6 times lower when downwash is turned on. The 1,500 cfm modeling with and without downwash shows that the dilution ratio is approximately 7 to 8 times lower when downwash is turned off.
Table 2. Dilution ratios, one A Farm Exhauster, 8-hour averaging, with and without building downwash. flow rates of 1,500 and 3,000 cfm.
Flow Rate 3,000 cfm Flow Rate 1,500 cfmRank No Downwash Downwash No Downwash Downwash
1st 9,816 1,592 15,148 2,0552nd 10,881 1,784 19,401 2,5243rd 12,141 1,985 20,269 2,5554th 12,499 2,008 21,488 2,5955th 12,802 2,063 22,759 2,6786th 12,982 2,080 23,383 2,7317th 13,025 2,113 24,012 2,7408th 13,025 2,124 24,505 2,8629th 13,204 2,197 24,607 2,94310th 13,317 2,315 25,078 2,948
Table 3 shows one A Farm exhauster with the 24-hour averaging time period. Comparing the 3,000 cfm with and without downwash the dilution rate is approximately 5 times lower when downwash is turned on. The 1,500 cfm modeling with and without downwash shows that the dilution ratio is approximately 7 times lower when downwash is turned off.
Table 3. Dilution ratios, one A Farm Exhauster, 24-hour averaging, with and without building downwash, flow rates of 1,500 and 3,000 cfm.
Flow Rate 3,000 cfm Flow Rate 1,500 cfmRank No Downwash Downwash No Downwash Downwash
1st 15,528 2,286 27,251 3,1112nd 16,186 3,525 27,675 3,2593rd 16,854 3,529 28,699 3,7074th 16,886 3,553 29,420 4,4275th 17,678 3,664 29,866 4,7046th 18,340 3,718 31,611 5,0027th 18,978 4,127 32,114 5,3558th 19,213 4,154 32,676 5,4109th 19,305 4,182 33,140 5,55910th 19,615 4,192 34,021 5,596
15

RPP-RPT-60396 Rev. 0
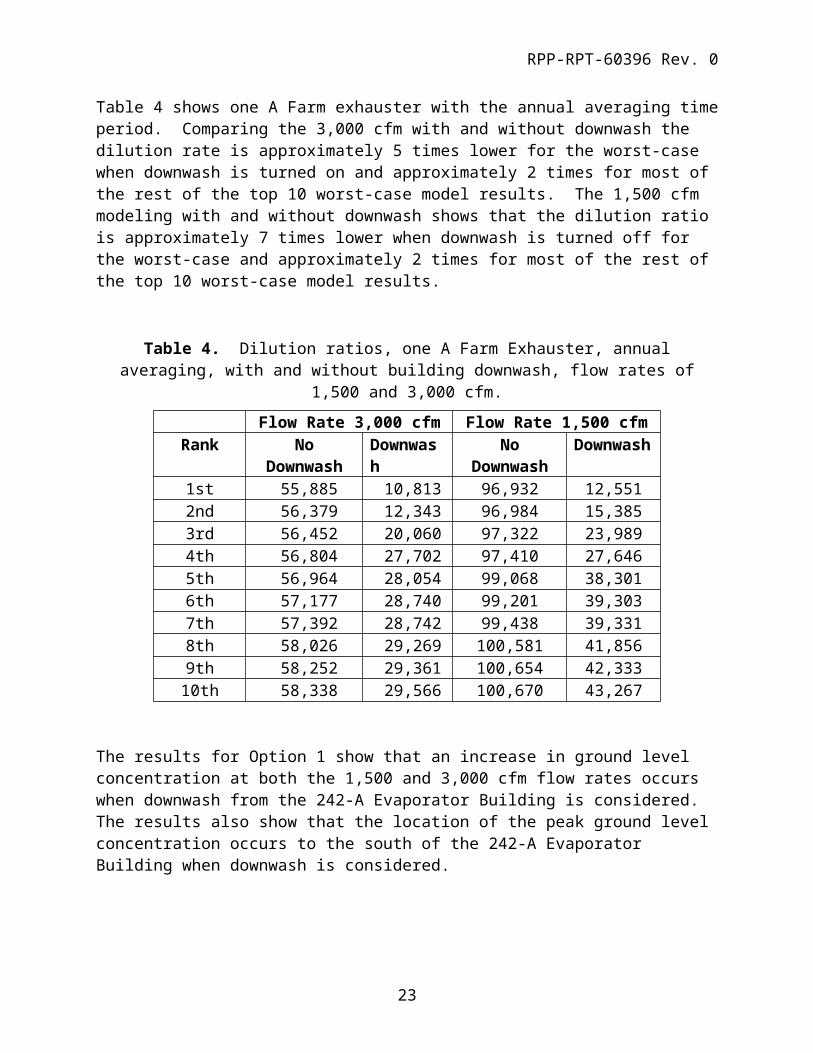
Table 4 shows one A Farm exhauster with the annual averaging time period. Comparing the 3,000 cfm with and without downwash the dilution rate is approximately 5 times lower for the worst-case when downwash is turned on and approximately 2 times for most of the rest of the top 10 worst-case model results. The 1,500 cfm modeling with and without downwash shows that the dilution ratio is approximately 7 times lower when downwash is turned off for the worst-case and approximately 2 times for most of the rest of the top 10 worst-case model results.
Table 4. Dilution ratios, one A Farm Exhauster, annual averaging, with and without building downwash, flow rates of 1,500 and 3,000 cfm.
Flow Rate 3,000 cfm Flow Rate 1,500 cfmRank No Downwash Downwash No Downwash Downwash
1st 55,885 10,813 96,932 12,5512nd 56,379 12,343 96,984 15,3853rd 56,452 20,060 97,322 23,9894th 56,804 27,702 97,410 27,6465th 56,964 28,054 99,068 38,3016th 57,177 28,740 99,201 39,3037th 57,392 28,742 99,438 39,3318th 58,026 29,269 100,581 41,8569th 58,252 29,361 100,654 42,33310th 58,338 29,566 100,670 43,267
The results for Option 1 show that an increase in ground level concentration at both the 1,500 and 3,000 cfm flow rates occurs when downwash from the 242-A Evaporator Building is considered. The results also show that the location of the peak ground level concentration occurs to the south of the 242-A Evaporator Building when downwash is considered.
5.2 OPTION 2: SOUTH-CENTRAL LOCATION, STACK HEIGHTS
The goal in Option 2 is to determine the exhauster stack height at which downwash was not observed in the model. The location is the same at Option 1, in the south-central location just the north of the 242-A Evaporator Building. Similar to Option 1, only one exhauster was modeled for this option.
AERMOD model runs were inspected to look at the location of the peak concentrations to see if they were in the vicinity of the 242-A Evaporator Building to determine if there was downwash.
16

RPP-RPT-60396 Rev. 0
Table 5. Dilution ratios, one A Farm exhauster, 1-Hour averaging, flow rate of 1,500 cfm.
Rank 50 foot 60 foot 70 foot 80 foot 90 foot1st 880 1,373 2,244 5,574 8,479 2nd 1,000 1,529 2,647 7,197 9,507 3rd 1,012 1,550 3,038 8,627 11,289 4th 1,100 1,586 3,184 8,701 12,500 5th 1,158 1,688 3,389 8,807 13,911 6th 1,178 1,717 3,480 8,814 14,103 7th 1,227 1,819 3,588 9,133 14,592 8th 1,227 1,822 3,784 9,392 15,048 9th 1,232 1,883 3,787 9,426 15,120 10th 1,252 1,916 4,015 9,496 15,167
Note: Shading indicates that the dilution ratio is in the downwash zone of the 242-A Evaporator Building.
Table 6. Dilution ratio, one A Farm exhauster, 8-Hour averaging, flow rate of 1,500 cfm.
Rank 50 foot 60 foot 70 foot 80 foot 90 foot1st 2,054 3,270 7,608 13,332 24,851 2nd 2,523 3,394 9,280 16,509 28,478 3rd 2,554 4,709 12,346 20,062 34,467 4th 2,595 4,811 12,723 23,551 42,834 5th 2,677 4,937 12,822 29,136 45,359 6th 2,730 5,098 12,848 30,414 50,735 7th 2,740 5,307 12,967 31,141 52,414 8th 2,861 5,336 13,363 34,558 53,098 9th 2,942 5,488 13,445 35,117 54,647 10th 2,948 5,559 13,743 36,106 56,445
Note: Shading indicates that the dilution ratio is in the downwash zone of the 242-A Evaporator Building.
Table 7. Dilution ratio, one A Farm exhauster, 24-Hour averaging, flow rate of 1,500 cfm.
Rank 50 foot 60 foot 70 foot 80 foot 90 foot1st 3,110 5,491 17,588 29,763 46,428 2nd 3,258 7,722 18,574 36,076 57,027 3rd 3,706 8,232 22,723 37,200 60,037 4th 4,425 8,581 22,902 46,522 76,424 5th 4,703 9,010 23,123 49,521 81,573 6th 5,000 9,193 23,500 50,112 83,425 7th 5,353 9,344 23,628 51,929 87,584 8th 5,408 9,991 24,265 52,036 88,048 9th 5,558 10,076 24,966 54,276 89,204 10th 5,595 10,500 25,266 57,929 91,209
17

RPP-RPT-60396 Rev. 0
Note: Shading indicates that the dilution ratio is in the downwash zone of the 242-A Evaporator Building.
Table 8. Dilution ratio, one A Farm exhauster, annual averaging, flow rate of 1,500 cfm.
Rank 50 foot 60 foot 70 foot 80 foot 90 foot1st 12,547 24,395 82,373 168,172 250,366 2nd 15,380 27,764 84,682 168,376 251,182 3rd 23,983 44,752 103,726 168,618 251,421 4th 27,638 60,896 104,880 168,701 251,537 5th 38,291 61,183 105,390 168,893 253,347 6th 39,292 62,394 106,651 169,854 254,404 7th 39,320 62,533 106,659 170,302 255,553 8th 41,844 63,770 106,949 171,439 255,563 9th 42,321 64,469 107,412 172,005 257,048 10th 43,255 64,502 107,898 172,498 257,648
Note: Shading indicates that the dilution ratio is in the downwash zone of the 242-A Evaporator Building.
Figure 11 shows the 1,500 cfm modeling for a 70 foot stack for the worst-case dilution ratio is still in the building downwash. Figure 12 shows the 1,500 cfm modeling for an 80 foot stack for the worst-case dilution ratio is still in the building downwash. In Figure 13, with a 90 foot stack and the 1,500 cfm flow rate, the modeling shows that the plume is not captured by the building downwash.
18

RPP-RPT-60396 Rev. 0
Figure 11. One A Farm exhauster, 70 foot stack, 1-hour averaging, 1,500 cfm, downwash dilution ratios.
Dilution Factor1,000 1,500 2,000 2,500 5,000 7,500 10,000 50,000 75,000 100,000 200,000 White Cross - location of lowest dilution ratio
2,224
19
RPP-RPT-60396 Rev. 0
Figure 12. One A Farm exhauster, 80 foot stack, 1-hour averaging, 1,500 cfm, downwash dilution ratios.
Dilution Factor1,000 1,500 2,000 2,500 5,000 7,500 10,000 50,000 75,000 100,000 200,000 White Cross - location of lowest dilution ratio
5,574
20

RPP-RPT-60396 Rev. 0
Figure 13. One A Farm exhauster, 90 foot stack, 1-hour averaging, 1,500 cfm, downwash dilution ratios.
Dilution Factor1,000 1,500 2,000 2,500 5,000 7,500 10,000 50,000 75,000 100,000 200,000 White Cross - location of lowest dilution ratio
8,479
21

RPP-RPT-60396 Rev. 0
5.3 OPTION 3: TESTING VARIOUS A FARM LOCATIONS FOR DOWNWASH
Figure 14 shows the locations of all of the exhausters modeled in A Farm. Each marker in the farm is a location that was modeled and the number is the location number. The green markers signify that the model did not indicate any downwash at that location and the red markers signify that downwash was observed in the modeling data from that site. The figure shows that there is an area around the 242-A Evaporator Building that could potentially experience building downwash. The locations to the northwest of the 242-Evaporator Building could potentially experience more downwash due to the prevailing winds being from that location towards the 242-A Evaporator Building
Figure 14. Locations of all exhausters modeled in A Farm with green markers signifying no downwash observed and red markers signifying downwash observed.
5.4 OPTION 4: SITE SPECIFIC CONCENTRATIONS
The SSTs are periodically sampled to determine the chemical constituents and concentrations in the headspace of the tanks that potentially could exit the tank. The TWINS and SWIHD databases were searched for sampling data from the A Farm tanks looking for COPCs listed in the WRPS Tank Farm list of COPCs (WRPS-1604188). Of those chemicals found, only 10 chemicals were above the instrumentation detection limits. These chemicals are listed in Table 9. The tank headspace concentrations were multiplied by an assumed tank breathing rate of 10
22
RPP-RPT-60396 Rev. 0
cfm and converted to a g/s emission rate. The tank g/s emission rate was multiplied by a factor of 100 to account for an increase emission due to waste disturbing activities. The increased emission rate was multiplied by the highest 1-hour modeled concentration over emission rate ((ug/m3) / (1 g/s)) for three sites: Option 1/2 south-central site, Site 36, and Site 57 (Figure 14). The dispersion factors for the Option 1/2 south-central site, Site 36, and Site 57 were 1,605, 249, and 296 ((µg/m3) / (1 g/s)), respectively. Even though the original site modeled concentrations were less than 3% of the OEL, moving the exhauster away from the 242-A Exhauster Building decreases the modeled concentrations by approximately a factor of 5 based upon the dispersion factors.
Table 9. Chemicals of potential concern found in A Farm tank headspace and modeled concentrations with percentage of the Occupational Exposure Levels.
Chemical Emission Rate (g/s)
Emission Factor
IH OEL Conc.
(µg/m3)
South-Central Site 36 Site 57
Conc. (µg/m3)
Percent of
OELConc.
(µg/m3)
Percent of
OELConc.
(µg/m3)
Percent of
OEL
1,3-Butadiene (TWINS) 1.2E-06 100 2,212 1.9E-01 0.01% 2.9E-02 0.00% 3.5E-02 0.00%
1,3-Butadiene (SWIHDS) 4.3E-06 100 2,212 7.0E-01 0.03% 1.1E-01 0.00% 1.3E-01 0.01%
Ammonia (TWINS) 2.6E-03 100 17,413 4.2E+02 2.42%6.5E+0
1 0.38%7.8E+0
1 0.45%
Ammonia (SWIHDS)5.8E-04
100 17,413 9.3E+01 0.54%1.4E+0
1 0.08%1.7E+0
1 0.10%
Nitrous oxide (TWINS) 1.9E-03 100 90,000 3.1E+02 0.35%4.8E+0
1 0.05%5.8E+0
1 0.06%
Furan (TWINS) 1.1E-07 100 2.8 1.7E-02 0.62% 2.7E-03 0.10% 3.2E-03 0.11%Nitrosodimethylamine (TWINS) 1.5E-07 100 0.91 2.5E-02 2.73% 3.8E-03 0.42% 4.6E-03 0.50%
Acetonitrile (TWINS) 5.2E-07 100 33,579 8.3E-02 0.00% 1.3E-02 0.00% 1.5E-02 0.00%
Acetonitrile (SWIHDS) 1.5E-04 100 33,579 2.4E+01 0.07%3.8E+0
0 0.01%4.5E+0
0 0.01%
Formaldehyde (TWINS) 2.2E-07 100 368 3.5E-02 0.01% 5.4E-03 0.00% 6.4E-03 0.00%
Formaldehyde (SWIHDS) 8.9E-07 100 368 1.4E-01 0.04% 2.2E-02 0.01% 2.6E-02 0.01%
Mercury (TWINS) 4.3E-08 100 25 6.9E-03 0.03% 1.1E-03 0.00% 1.3E-03 0.01%
Mercury (SWIHDS) 3.1E-07 100 25 4.9E-02 0.20% 7.6E-03 0.03% 9.1E-03 0.04%Nitrosodiethylamine (SWIHDS) 1.2E-09 100 0.42 1.9E-04 0.05% 2.9E-05 0.01% 3.5E-05 0.01%Nitrosomorpholine (SWIHDS) 3.2E-09 100 2.85 5.1E-04 0.02% 8.0E-05 0.00% 9.5E-05 0.00%
Figure 15 shows the 1-hour concentration location for the exhauster at Site 57. The peak concentration is shown by the white marker to the northwest of the exhauster. The peak ground level concentration to the north of A Farm are well away from the 242-A Evaporator Buildings.
23

RPP-RPT-60396 Rev. 0
Figure 15. Peak 1-hour dilution ground level concentration for the A Farm exhauster located at Site 57.
Dilution Ratio
2,825
5,650
14,126
28,252
141,258
282,516
Peak Dilution
24
RPP-RPT-60396 Rev. 0
6.0 CONCLUSIONS
Atmospheric dispersion modeling for new exhausters in A Farm was performed at various locations, with different stack heights, and considering building downwash. The initial goal was to determine if the plume would be captured in the building downwash and reduce the plume dispersion if the exhausters were located at a location near the 242-A Evaporator Building. It was found that the initial location and stack height of 50 feet would result in the plume being captured in the building downwash. A stack height of 90 feet was required for the plume to avoid the building downwash. Various locations around A Farm were tested and there was a zone around the 242-A Evaporator Building where the plume would experience building downwash.
Actual tank headspace sampling data was used to calculate the tank emissions for 10 COPCs that were found above detection limits. The results showed that the highest COPC was less than 3% of the OEL for the original location. The sites analyzed in Option 3 that showed no building downwash effect on the plume dispersion indicated the peak modeled concentration was less than 0.5%, an improvement of about a factor of 5.
7.0 REFERENCES
08-25-025, Rev 08/2015, 2015, “Guidance Document First, Second, and Third Tier Review of Toxic Air Pollution Sources,” Washington State Department of Ecology, Lacey, Washington.
Cook, K.M., and J.P. Rishel, 2014, “AERMET Software Quality Assurance Plan for Analysis,” Pacific Northwest National Laboratory, September 16.
ECN-713166, Rev.01, 2016, “242-A Vessel Vent Stack Extension Installation,” Washington River Protection Solutions, LLC., Richland, Washington.
EPA-454/B-16-011, 2016, “User's Guide for the AMS/EPA Regulatory Model (AERMOD),” U.S. Environmental Protection Agency, Research Triangle Park, North Carolina.
EPA Support Center for Regulatory Atmospheric Modeling, Queried 0506/2017, https://www.epa.gov/scram/air-quality-dispersion-modeling-preferred-and-recommended-models. Washington River Protection Solutions, Richland, Washington.
MT-50132, Rev. 0, 2017, “242-A Vessel Vent Stack Extension,” Washington River Protection Solutions, LLC., Richland, Washington.
RPP-RPT-60051, Rev. 0, 2017, “AERMOD Version 16216r Validation,” Washington River Protection Solutions, LLC., Richland, Washington.
WRPS-1604188. Rev. 0, 2016, “Chemicals of Potential Concern,” Washington River Protection Solutions, LLC., Richland, Washington.
25