Embed Size (px)
Citation preview
1
Written Testimony on SB 381–Managing for ResultsSenate Budget and Taxation CommitteeMaryland General Assembly
March 23, 2004
Roy T. Meyers Associate Professor of Political ScienceDirector, Sondheim Public Affairs Scholars ProgramUMBC
Mr. Chairman and members of the Committee, thank you for the opportunity to testify.
My views are my own and do not represent the position of my employer. They are based on the
second half of a long paper on Maryland’s budget process which I coauthored this summer with
Thomas Pilkerton, a UMBC student. I distributed copies of this paper to committee members
when you considered SB 370, Senator Hogan’s constitutional amendment.
The basic message of my testimony is that SB 381 addresses an important problem, but
that it should be either amended or summer studied so you can maximize your ability to set
priorities and oversee program management.
Maryland is certainly not among the leading states in performance management, but it has
made some progress with the Managing for Results approach, known as MFRs. Both the
Governor’s budget and agency reports now show numerous performance measures which
illustrate what agencies and programs are producing. Many of these measures relate to goals and
objectives that appear important, and the performance data in some cases appear to be reliable,
2
but as analyses by the Legislative Auditor and others have shown, this is not the case for many
other agencies and programs. SB 381 wisely requires progress in the quality of these
performance data. If these data become more believable, and if you use them in oversight and
budgeting, you will improve the efficiency and effectiveness of programs, certainly more so than
by relying on infrequent, ad hoc and secretive commissions which recommend very limited
changes.
Note I twice used the word “if.” I did so because performance management will be
successful only when the state makes a sustained and serious commitment to it. SB 381 could
make this more likely by creating a statutory framework for performance management.
But this bill’s statutory framework cedes too much responsibility for setting the state’s
goals and objectives to a Strategic Planning Committee that would be dominated by the
executive branch. The Governor would nominate 9 members to this committee, and the General
Assembly would nominate only 4. Not involving the General Assembly more deeply in
consultations about the state’s plan makes it quite likely that the plan will be politically
unrealistic. A classic case is the so-called “strategic plan” issued during the last year of the
Glendening administration, which was entitled “Moving Maryland Forward: 2002 and Beyond.”
Even if Lt. Gov. Townsend had beaten Congressman Ehrlich in 2002, I doubt the General
Assembly would be paying much attention to this plan now. After all, the plan acknowledges not
a single representative of the legislative branch as involved in its preparation.
3
In the 2003 Joint Chairmen Report, the General Assembly argued that among the
problems with Managing for Results was “limited participation in goal-setting by customers and
legislators,” and required that DBM propose modifications to the process. DBM responded in
September by agreeing to add legislative representatives to the MFR Steering Committee, but
then stated the limits of this promise:
DBM asserts that the Steering Committee should provide input on process rather than
policy. For example, the committee’s major activities should include updating the MFR
training program, revising the MFR Guidebook, and promoting good practices.
By stipulating this limitation, the executive branch is shooting itself in its foot, or more
specifically, setting itself up to be blamed by the legislature. Consider another complaint of the
JCR: “a poorly devised implementation plan due to a lack of clear mission statements, goals,
objectives, and more than 10,000 performance measures across executive branch programs.”
Why do agencies have multiple, contradictory, and sometimes unattainable goals, and why do
they report on so many indicators? Solely because of a lack of executive leadership? Or might
not the legislative branch bear some responsibility for this situation? After all, the General
Assembly determines the goals and objectives of programs in statutes, conditions appropriations
with many directives, and actively oversees and audits program implementation.
In other words, the current process permits the legislature to insist that the executive
branch do the impossible. In contrast, strategic planning is supposed to focus elected officials on
4
the most important problems faced by their government and constituents. Consequently, my first
recommendation is that if a strategic planning committee is to be created, the General Assembly
should play a central role on it.
An alternative to a balanced strategic planning committee would be to improve the
Spending Affordability process. This process has made a significant contribution to Maryland’s
record of fiscal responsibility by setting prudent guidelines for spending and debt. However, the
committee’s deliberations and report are less substantive than they should be, focusing instead on
establishing a bargaining position vis-a-vis the Governor. But with all due respect, the difference
between a 4.37% and 4.91% increase in spending is nearly meaningless. The Spending
Affordability process would be more useful if instead it emphasized linking policy priorities to
financial projections.
One reason why a different Spending Affordability process is needed is that governors’
budgets and agencies’ MFRs tend to recoil from realistic assessments of conditions in Maryland.
Here are some examples of general problems:
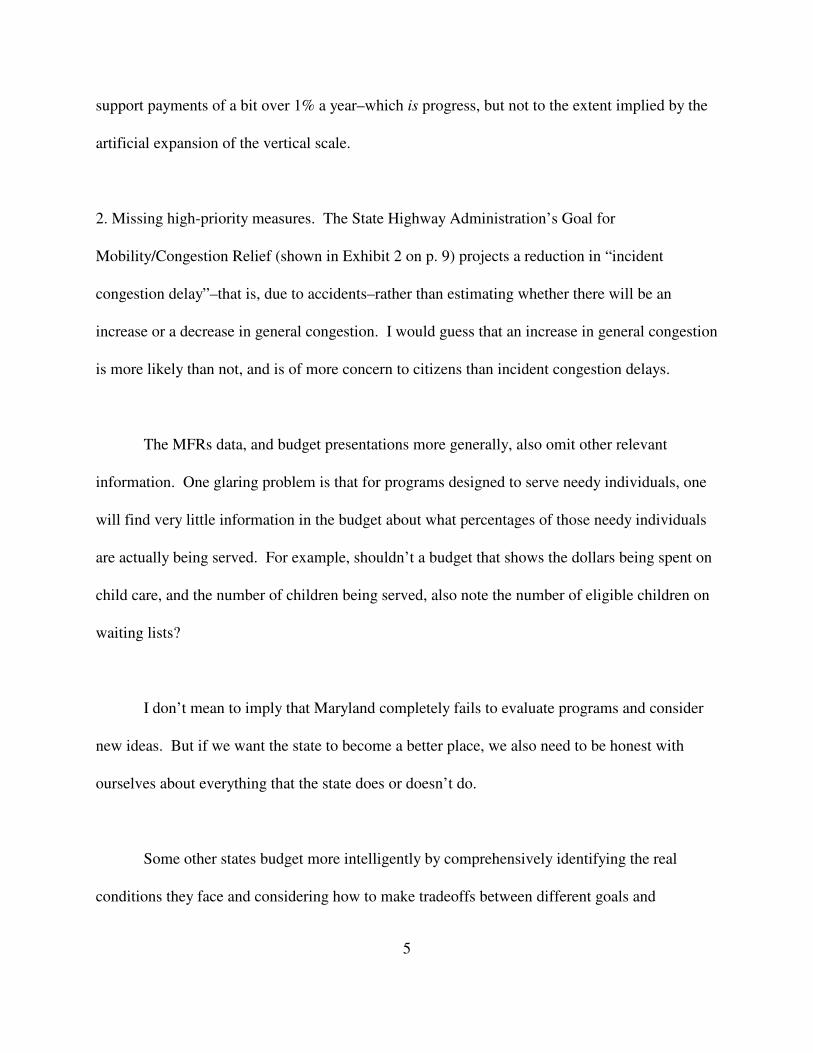
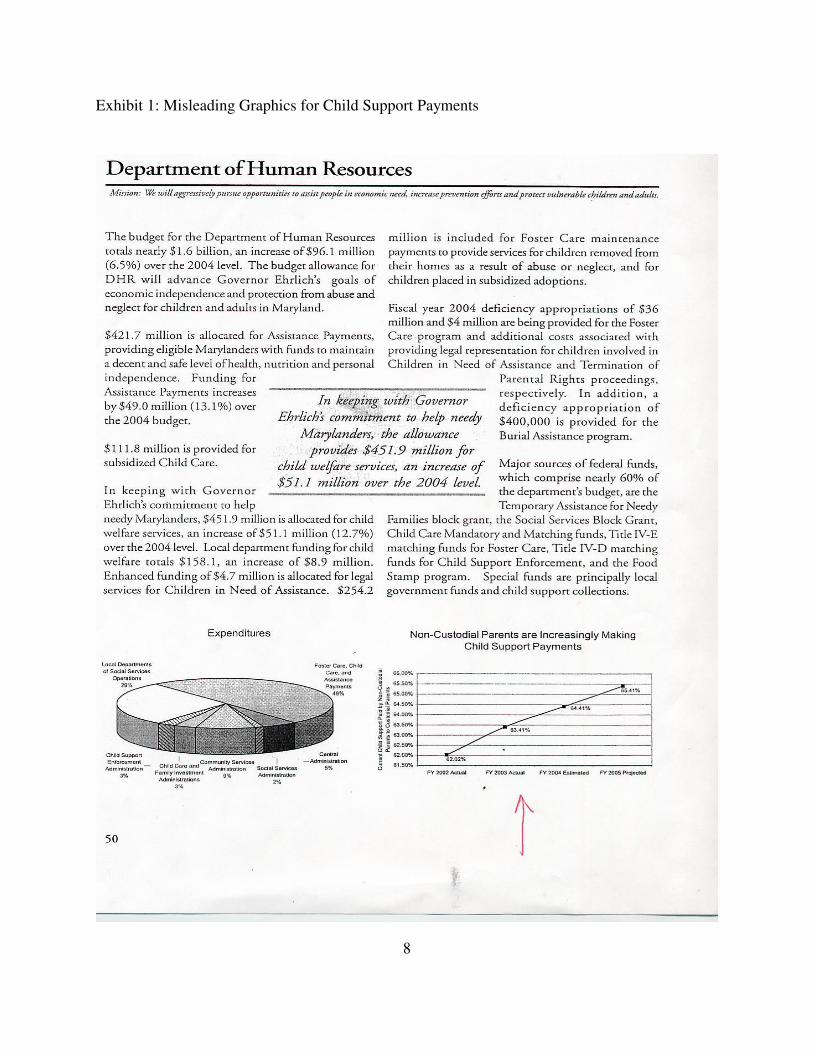
1. Overly optimistic impressions. For example, in the Governor’s Budget Highlights for FY
2005, most of the agency descriptions include graphs that apparently show remarkable progress.
Unfortunately, a good number of these graphs use what graphical expert Professor Edward Tufte
calls a “lie factor”–the size of effect shown in the graphic is much larger than the size of the
effect in the data. The example shown in Exhibit 1 (p. 8) is for a projected increase in child
5
support payments of a bit over 1% a year–which is progress, but not to the extent implied by the
artificial expansion of the vertical scale.
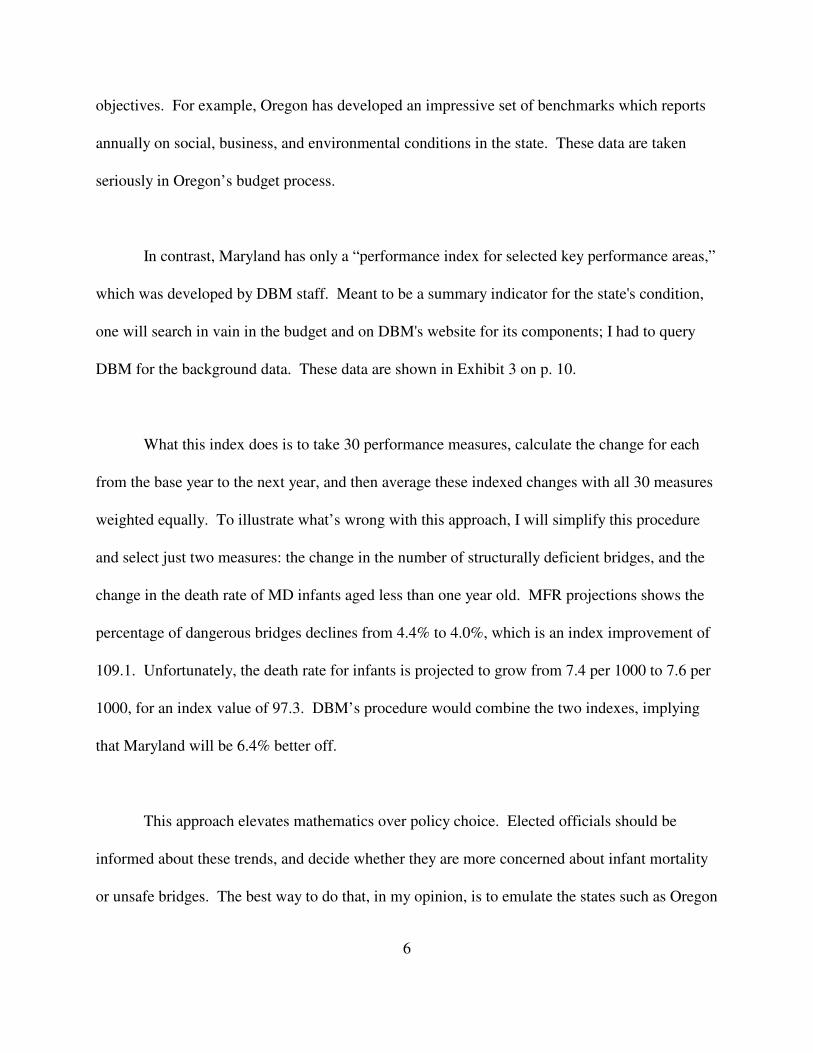
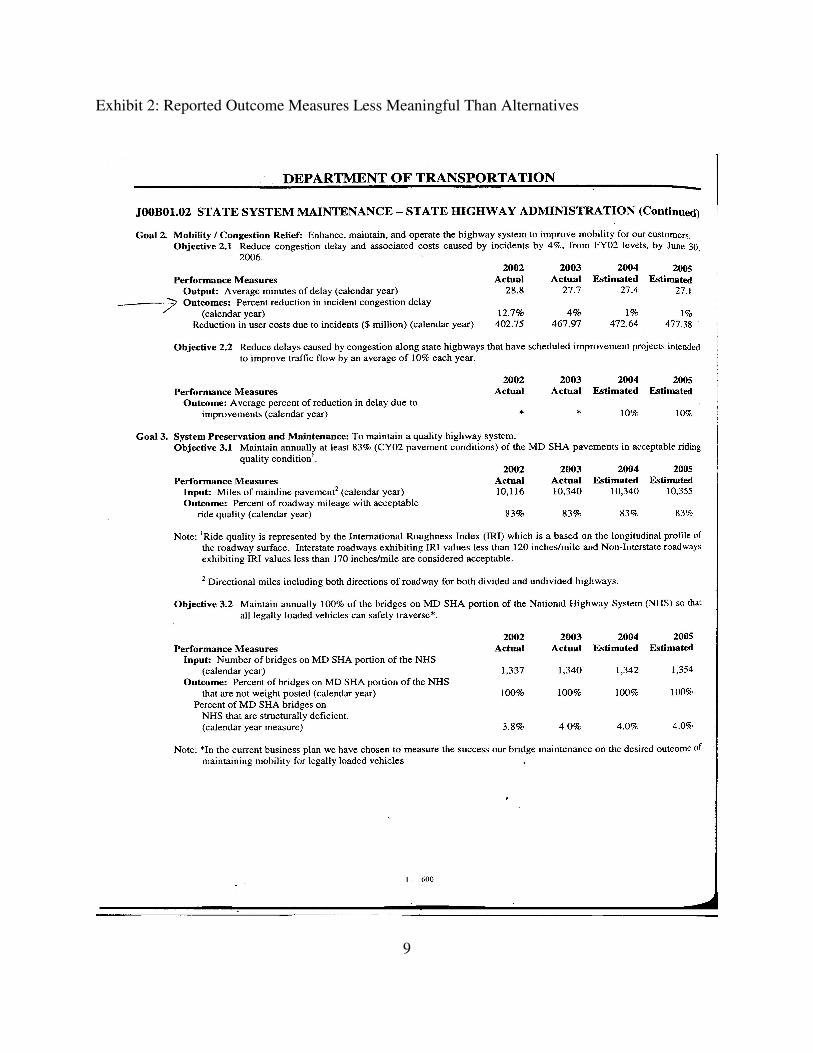
2. Missing high-priority measures. The State Highway Administration’s Goal for
Mobility/Congestion Relief (shown in Exhibit 2 on p. 9) projects a reduction in “incident
congestion delay”–that is, due to accidents–rather than estimating whether there will be an
increase or a decrease in general congestion. I would guess that an increase in general congestion
is more likely than not, and is of more concern to citizens than incident congestion delays.
The MFRs data, and budget presentations more generally, also omit other relevant
information. One glaring problem is that for programs designed to serve needy individuals, one
will find very little information in the budget about what percentages of those needy individuals
are actually being served. For example, shouldn’t a budget that shows the dollars being spent on
child care, and the number of children being served, also note the number of eligible children on
waiting lists?
I don’t mean to imply that Maryland completely fails to evaluate programs and consider
new ideas. But if we want the state to become a better place, we also need to be honest with
ourselves about everything that the state does or doesn’t do.
Some other states budget more intelligently by comprehensively identifying the real
conditions they face and considering how to make tradeoffs between different goals and
6
objectives. For example, Oregon has developed an impressive set of benchmarks which reports
annually on social, business, and environmental conditions in the state. These data are taken
seriously in Oregon’s budget process.
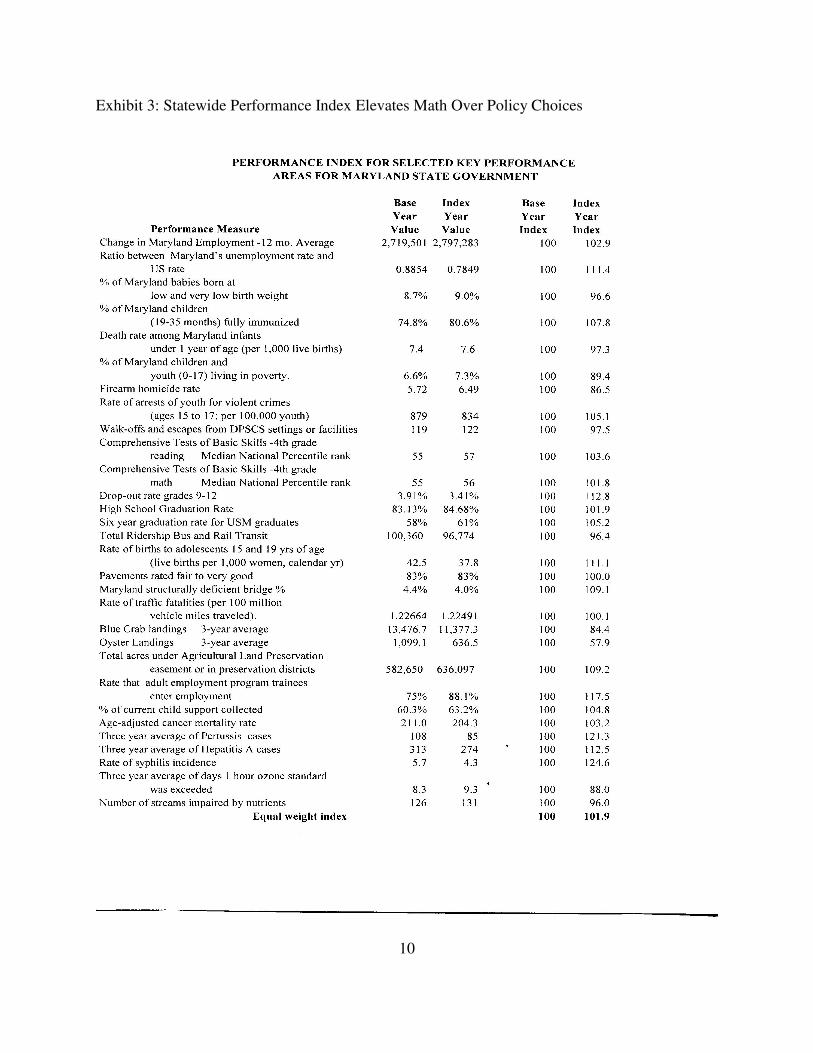
In contrast, Maryland has only a “performance index for selected key performance areas,”
which was developed by DBM staff. Meant to be a summary indicator for the state's condition,
one will search in vain in the budget and on DBM's website for its components; I had to query
DBM for the background data. These data are shown in Exhibit 3 on p. 10.
What this index does is to take 30 performance measures, calculate the change for each
from the base year to the next year, and then average these indexed changes with all 30 measures
weighted equally. To illustrate what’s wrong with this approach, I will simplify this procedure
and select just two measures: the change in the number of structurally deficient bridges, and the
change in the death rate of MD infants aged less than one year old. MFR projections shows the
percentage of dangerous bridges declines from 4.4% to 4.0%, which is an index improvement of
109.1. Unfortunately, the death rate for infants is projected to grow from 7.4 per 1000 to 7.6 per
1000, for an index value of 97.3. DBM’s procedure would combine the two indexes, implying
that Maryland will be 6.4% better off.
This approach elevates mathematics over policy choice. Elected officials should be
informed about these trends, and decide whether they are more concerned about infant mortality
or unsafe bridges. The best way to do that, in my opinion, is to emulate the states such as Oregon

7
and Utah which use a benchmark priority setting process. Making that transition to a more
informed method of setting priorities will obviously require the state to learn how to do that well.
Therefore, I suggest that you defer passage of this bill until after you use the summer study
process to consult with experts from states with more experience.
Thank you, and I will be glad to answer any questions you might have. Please contact me
at 410-455-2196 or [email protected].
---
The long paper from which ideas in this testimony are drawn may be accessed at:
http://userpages.umbc.edu/%7Emeyers/improveMD.pdf
See also our compilation of Oregon Benchmark-style measures for Maryland at:
http://userpages.umbc.edu/%7Emeyers/MD%20Benchmark%20Example.pdf
8
Exhibit 1: Misleading Graphics for Child Support Payments
9
Exhibit 2: Reported Outcome Measures Less Meaningful Than Alternatives
10
Exhibit 3: Statewide Performance Index Elevates Math Over Policy Choices

11