Embed Size (px)
Citation preview
1
# Algebra Name: Date: Period:
Writing Linear Equations and Inequalities
Linear Equation/Inequalities – equations/inequalities that will be represented using lines on the coordinate plane.
(1) Write each equation in SIF and Standard Form:
Page 276 #3,7; Page 282 #3,6; Page 288 #9,12; Page 312 #54, 58
(2) Write each equation in SIF and Standard Form:
Page 276 #13,19; Page 282 #12,21; Page 288 #21,27; Page 312 #55, 59
(3) Write each equation in SIF and Standard Form:
Page 276 #14,18; Page 282 #14,23; Page 288 #23,35; Page 312 #56,60
(4) Page 304 #39 – 45 LEFT, 51, 54
(5) Write each equation in SIF and Standard Form:
Page 283 #32, 35, 38; Page 289 #45, 46,47;
(6) Write each equation in SIF and Standard Form: Worksheet #2 – 12 Even **Quiz Tomorrow*
(7) Page 276 #20, 23; Page 282 #24, 27; Page 288 #18, 19
(8) Page 364 #43 – 48; 61 – 63
(9) Page 277 #34 – 37; Page 283 #46 – 49
(10) Page 284 #50, Page 289 #51, 52; Page 365 #66, 67
(11) Page 296 – 297 #6, 13, 17 – 22
(12) Page 319 #3, 5 – 9; Page 320 #17 – 22
(13) Page 320 #23 – 30
(14) Chapter Review
(15) Standardized Test Practice Page 328 – 329 #1 – 20
2
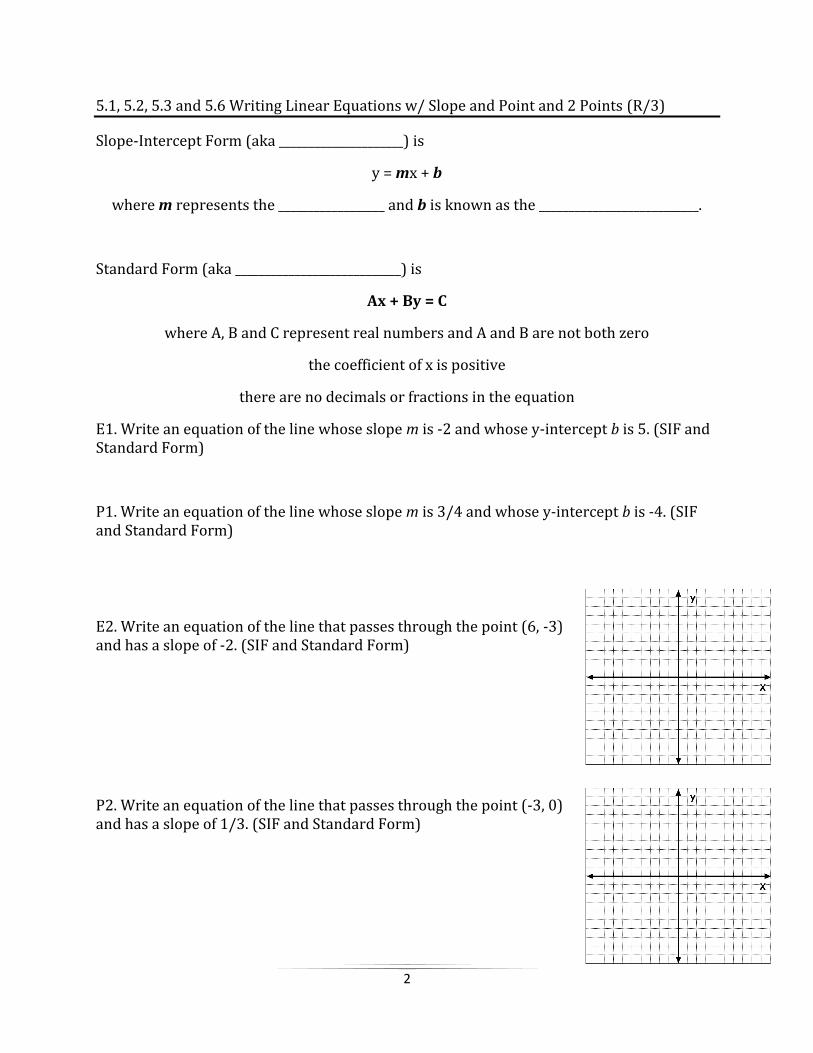
5.1, 5.2, 5.3 and 5.6 Writing Linear Equations w/ Slope and Point and 2 Points (R/3)
Slope-Intercept Form (aka _____________________) is
y = mx + b
where m represents the __________________ and b is known as the ___________________________.
Standard Form (aka ____________________________) is
Ax + By = C
where A, B and C represent real numbers and A and B are not both zero
the coefficient of x is positive
there are no decimals or fractions in the equation
E1. Write an equation of the line whose slope m is -2 and whose y-intercept b is 5. (SIF and Standard Form)
P1. Write an equation of the line whose slope m is 3/4 and whose y-intercept b is -4. (SIF and Standard Form)
E2. Write an equation of the line that passes through the point (6, -3) and has a slope of -2. (SIF and Standard Form)
P2. Write an equation of the line that passes through the point (-3, 0) and has a slope of 1/3. (SIF and Standard Form)
3
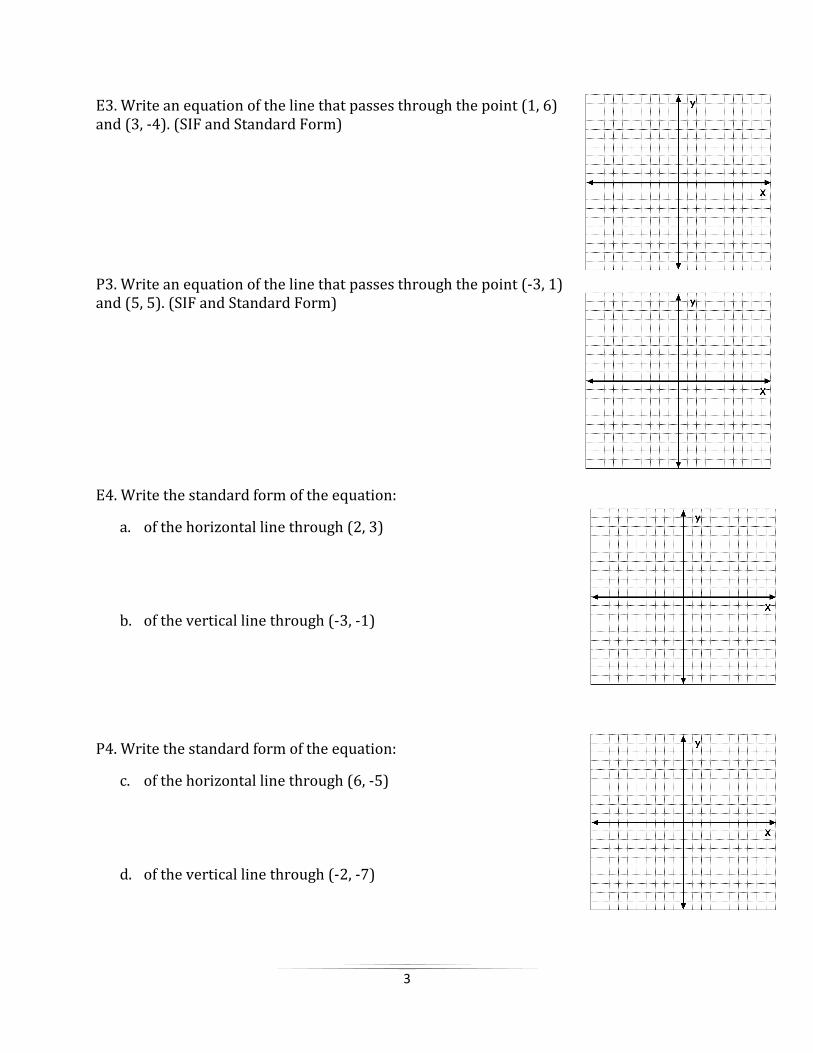
E3. Write an equation of the line that passes through the point (1, 6) and (3, -4). (SIF and Standard Form)
P3. Write an equation of the line that passes through the point (-3, 1) and (5, 5). (SIF and Standard Form)
E4. Write the standard form of the equation:
a. of the horizontal line through (2, 3)
b. of the vertical line through (-3, -1)
P4. Write the standard form of the equation:
c. of the horizontal line through (6, -5)
d. of the vertical line through (-2, -7)
4
5.5 Point Slope Form of a Linear Equation (I,E/2)
The ________________-_________________ form of the equation of the non-vertical line that passes through a given point (x1, y1) with a slope of m is
y – y1 = m(x – x1)
E1. Write an equation in point-slope form of the line that passes through (2, 5) and has a slope of 2/3.
P1. Write an equation in point-slope form of the line that passes through (-2, 3) and has a slope of -2.
E2. Write an equation in point-slope form of the line that passes through (-3, 6) and (1, -2).
P2. Write an equation in point-slope form of the line that passes through (3, 1) and (1, -2).
5
5.2 and 5.3 Writing Linear Equations using Parallel and Perpendicular (I,E/2)
E1. Two non-vertical lines are parallel if and only if (iff) they have the same slope. Write an equation of the line that is parallel
to the line y =
x-2 and passes through the point (-2, 1).
(SIF and Standard Form).
P1. Write an equation of the line that is parallel to the line y = -3x - 2 and passes through the point (3, -4). (SIF and Standard Form)
E2. Two non-vertical lines are perpendicular if and only if (iff) their slopes are negative reciprocals of each other. Write an equation of the line that is perpendicular to the line passing through (-6, 1) and (0, 4) and containing the point (-4, -3). (SIF and Standard Form)
P2. Write an equation of the line that is perpendicular to the line passing through the points (-1, 2) and (2, 3) and containing the point (3, -4). (SIF and Standard Form)
6
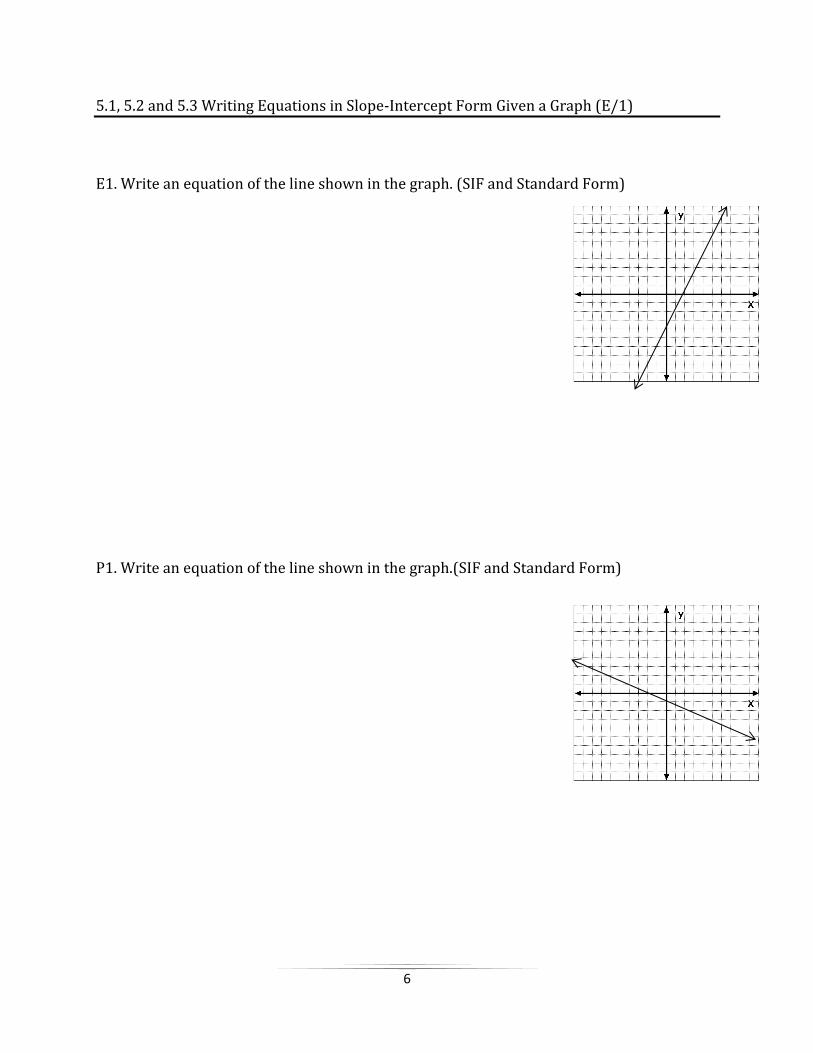
5.1, 5.2 and 5.3 Writing Equations in Slope-Intercept Form Given a Graph (E/1)
E1. Write an equation of the line shown in the graph. (SIF and Standard Form)
P1. Write an equation of the line shown in the graph.(SIF and Standard Form)
7
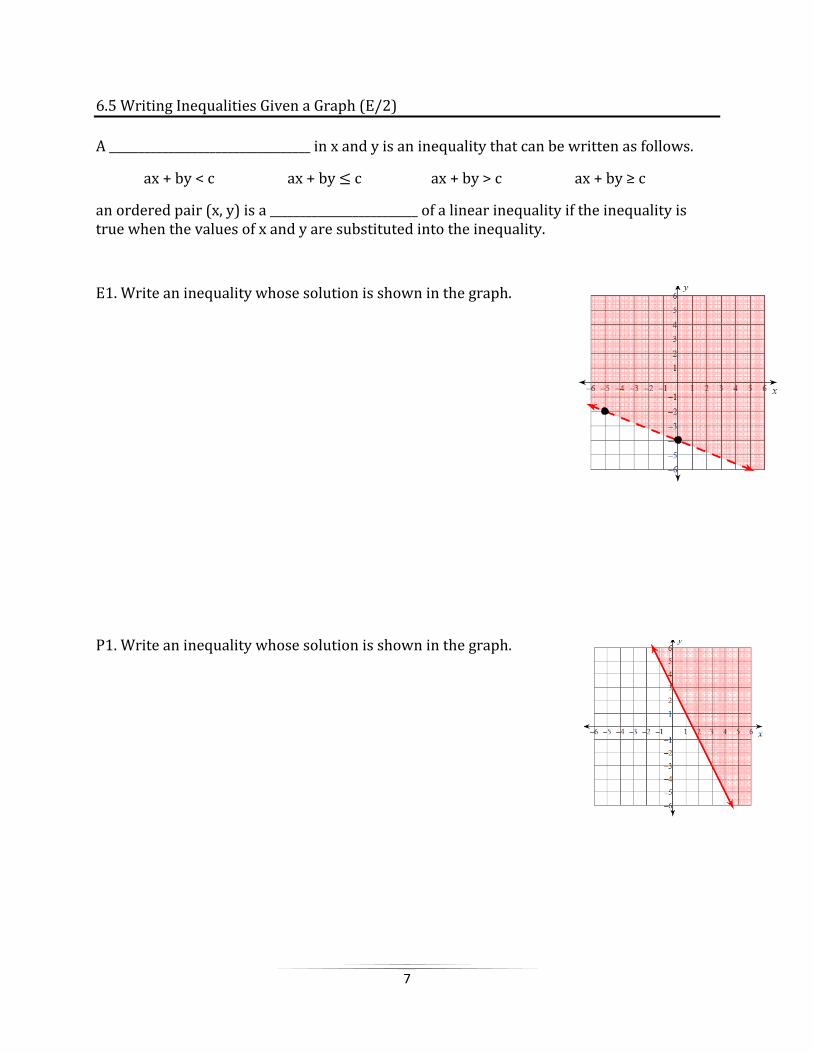
6.5 Writing Inequalities Given a Graph (E/2)
A __________________________________ in x and y is an inequality that can be written as follows.
ax + by < c ax + by c ax + by > c ax + by ≥ c
an ordered pair (x, y) is a _________________________ of a linear inequality if the inequality is true when the values of x and y are substituted into the inequality.
E1. Write an inequality whose solution is shown in the graph.
P1. Write an inequality whose solution is shown in the graph.
8
Keystone Released Equations of Lines and Linear Inequalities Applications (E/2)
Create a model from to represent a given situation E1. A rental company charges a flat fee of $30 and an additional $.25 per mile to rent a moving van.
a. Write an equation to model the total charge y (in dollars) in terms of x, the number of miles driven.
b. Use the model to determine the total charge, if you were to use the van for a total of 50 miles.
P1. At the start of your second year as a vet technician, you receive a raise of $750. You expect to receive the same raise every year. Your total yearly salary after your first raise is $18,000 per year.
a. Write an equation that models your total salary s in terms of the number of years n since you started as a technician.
b. Calculate your yearly salary after six years as a veterinary technician.
9
E2. In the last quarter of a high school football game, your team is behind by 21 points. A field goal is 3 points and a touchdown (with point-after-touchdown) is 7 points. Let x represent the number of field goals scored. Let y represent the number of touchdowns scored.
Write an inequality that models the different numbers of field goals and touchdowns your team could score and still not win or tie. (Assume the other team scores no more points.)
P2. You have $12 to spend on fruit for a meeting. Grapes cost $1 per pound and peaches cost $1.50 per pound. Let x represent the number of pounds of grapes you can buy. Let y represent the number of pounds of peaches you can buy.
Write an inequality to model the amount of grapes and peaches you can buy.
10
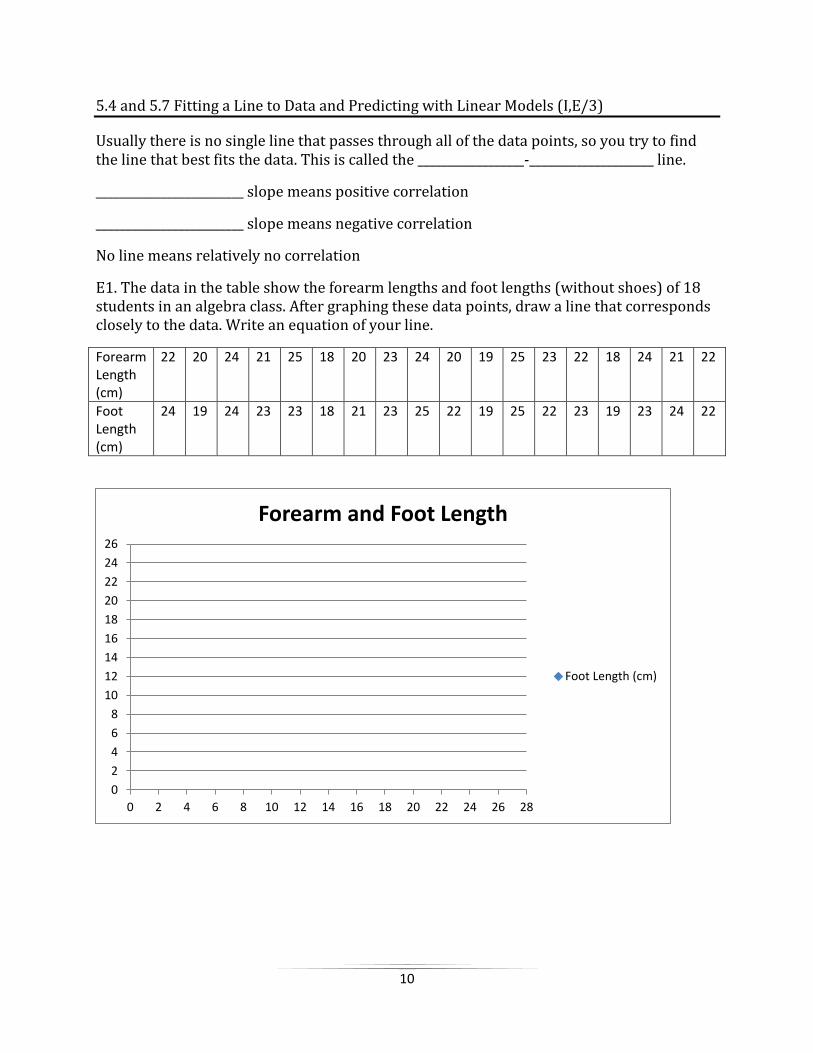
5.4 and 5.7 Fitting a Line to Data and Predicting with Linear Models (I,E/3)
Usually there is no single line that passes through all of the data points, so you try to find the line that best fits the data. This is called the __________________-_____________________ line.
_________________________ slope means positive correlation
_________________________ slope means negative correlation
No line means relatively no correlation
E1. The data in the table show the forearm lengths and foot lengths (without shoes) of 18 students in an algebra class. After graphing these data points, draw a line that corresponds closely to the data. Write an equation of your line.
Forearm Length (cm)
22 20 24 21 25 18 20 23 24 20 19 25 23 22 18 24 21 22
Foot Length (cm)
24 19 24 23 23 18 21 23 25 22 19 25 22 23 19 23 24 22
0
2
4
6
8
10
12
14
16
18
20
22
24
26
0 2 4 6 8 10 12 14 16 18 20 22 24 26 28
Forearm and Foot Length
Foot Length (cm)
11
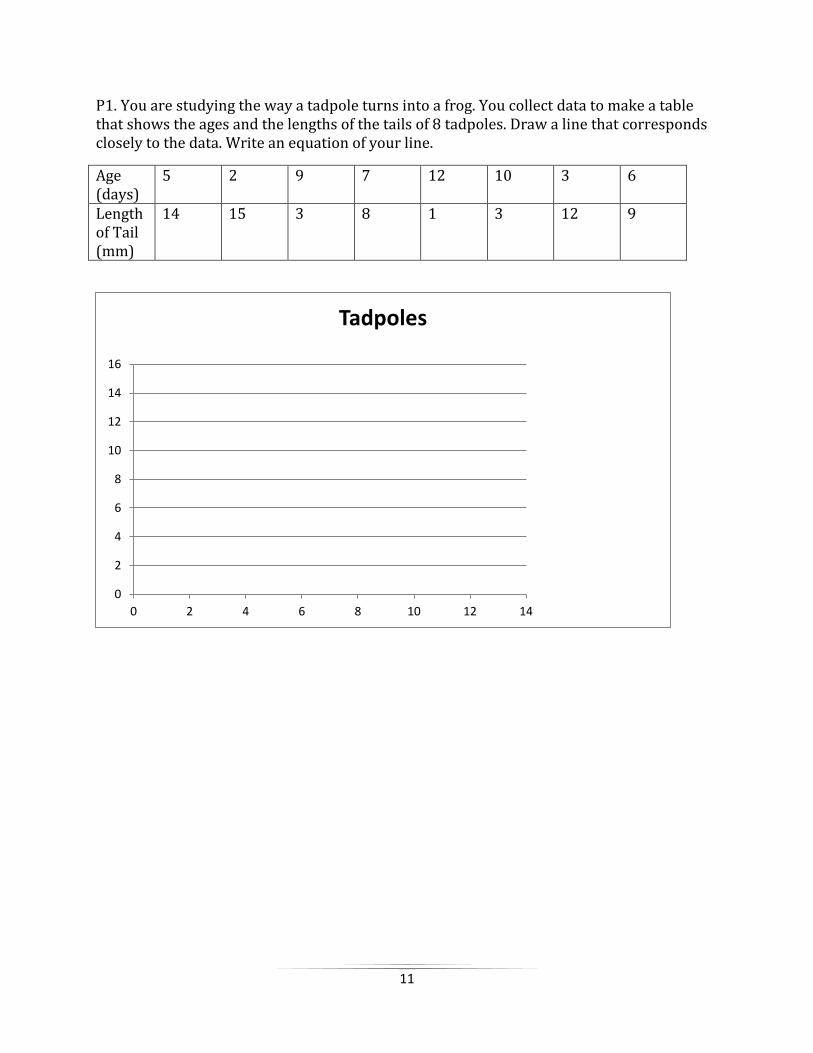
P1. You are studying the way a tadpole turns into a frog. You collect data to make a table that shows the ages and the lengths of the tails of 8 tadpoles. Draw a line that corresponds closely to the data. Write an equation of your line.
Age (days)
5 2 9 7 12 10 3 6
Length of Tail (mm)
14 15 3 8 1 3 12 9
0
2
4
6
8
10
12
14
16
0 2 4 6 8 10 12 14
Tadpoles
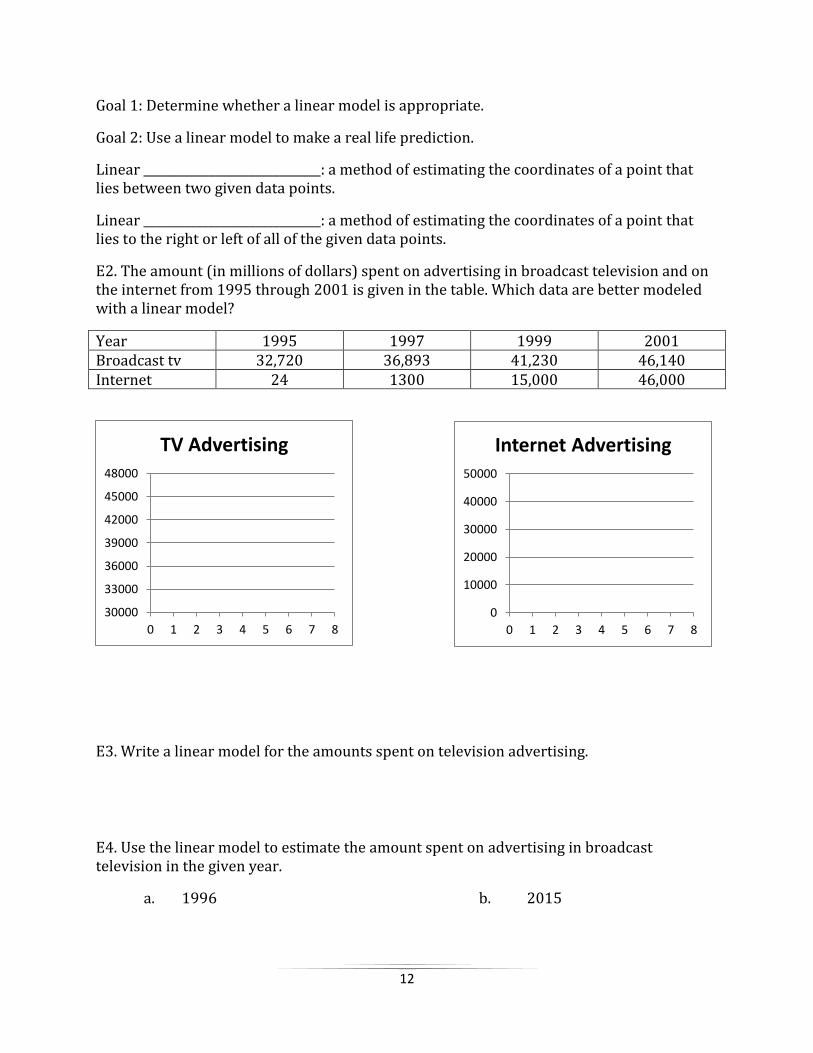
12
30000
33000
36000
39000
42000
45000
48000
0 1 2 3 4 5 6 7 8
TV Advertising
0
10000
20000
30000
40000
50000
0 1 2 3 4 5 6 7 8
Internet Advertising
Goal 1: Determine whether a linear model is appropriate.
Goal 2: Use a linear model to make a real life prediction.
Linear ______________________________: a method of estimating the coordinates of a point that lies between two given data points.
Linear ______________________________: a method of estimating the coordinates of a point that lies to the right or left of all of the given data points.
E2. The amount (in millions of dollars) spent on advertising in broadcast television and on the internet from 1995 through 2001 is given in the table. Which data are better modeled with a linear model?
Year 1995 1997 1999 2001 Broadcast tv 32,720 36,893 41,230 46,140 Internet 24 1300 15,000 46,000
E3. Write a linear model for the amounts spent on television advertising.
E4. Use the linear model to estimate the amount spent on advertising in broadcast television in the given year.
a. 1996 b. 2015
13
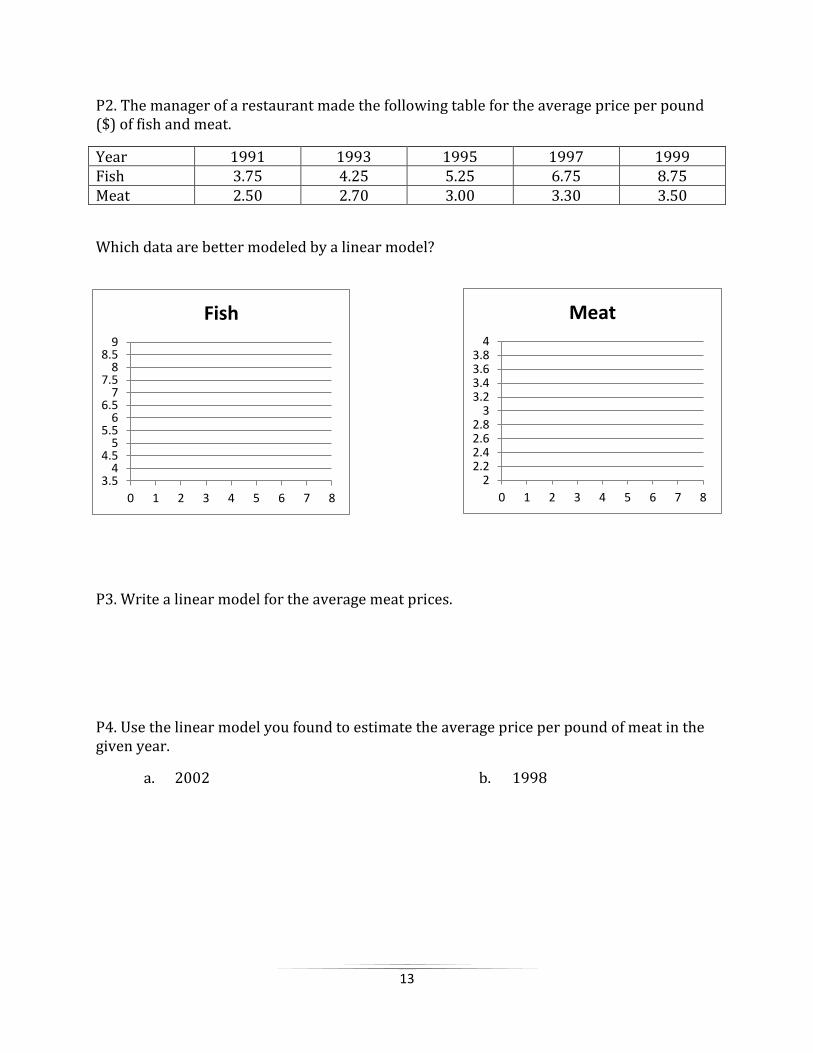
3.54
4.55
5.56
6.57
7.58
8.59
0 1 2 3 4 5 6 7 8
Fish
22.22.42.62.8
33.23.43.63.8
4
0 1 2 3 4 5 6 7 8
Meat
P2. The manager of a restaurant made the following table for the average price per pound ($) of fish and meat.
Year 1991 1993 1995 1997 1999 Fish 3.75 4.25 5.25 6.75 8.75 Meat 2.50 2.70 3.00 3.30 3.50
Which data are better modeled by a linear model?
P3. Write a linear model for the average meat prices.
P4. Use the linear model you found to estimate the average price per pound of meat in the given year.
a. 2002 b. 1998