Embed Size (px)
Citation preview

Writing A New Story Writing A New Story for North Carolina’s for North Carolina’s 21 21 st st Century Economy Century Economy
Bill Prindle Deputy Director American Council for an EnergyEfficient Economy
February 8, 2008
Overview
How North Carolinians can use energy efficiency to write a new story for its 21 st Century economy
• The 19 th early 20 th century story is ending…. …. a new story awaits
• Efficiency can help write this new story because it is a state’s best energy investment
• Efficiency is available now, in large quantities, and is ready to report for duty!
• But efficiency requires state policy leadership • North Carolina can join the many states writing a new clean energy story, beginning with energy efficiency

The 19 th /Early 20 th Century EnergyEconomy Story
• Rapidly industrializing economy • Building out the modern power grid • Proliferation/saturation of end uses necessary for economic development
• Fossils fuels cheap and abundant • The environment was “free”—or at least the accounting was delayed

In the late 20 th Century…
• …the story changed: – Economic development shifted from industrial growth to service growth
– Energy systems reached economic maturity – The environmental cost of conventional fuels began to be reckoned
– The energy demand/services infrastructure matured
– Energy resource opportunities began shifting to the demand side
The 21 st Century Stage is Set
• The era of cheap energy has ended • Conventional energy is harder to deliver • Environmental cost of fossil fuels will further drive up
prices • Energy efficiency and other clean energy technologies
have become serious economic contributors • We are in a race for clean and affordable energy • Energy efficiency is the ‘first fuel’ in this race
…..Without efficiency, demand will grow too fast for ANY supply resource to keep up

Energy: Cheap No Longer
6
6.5
7
7.5
8
8.5
9
9.5
10
Jan00
Jul00
Jan01
Jul01
Jan02
Jul02
Jan03
Jul03
Jan04
Jul04
Jan05
Jul05
Jan06
Electricity
Pric
e (cen
ts/kWh)
2.00
4.00
6.00
8.00
10.00
12.00
14.00
16.00
18.00
Price ($/MMBtu)
Electricity Heating Oil Natural Gas NatGas Well Head
Residential Energy Prices

Energy: Cheap No Longer
20
30
40
50
60
2002 2003 2004 2005 2006 2007 2008 2009 2010 2011 2012 2013 2014 2015 2016 2017 2018 2019 2020 2021 2022 2023 2024 2025
World Oil Price (2004$ per barrel)
AEO 2005
AEO 2006
Crude Oil Price Forecast: 2006 vs. 2005
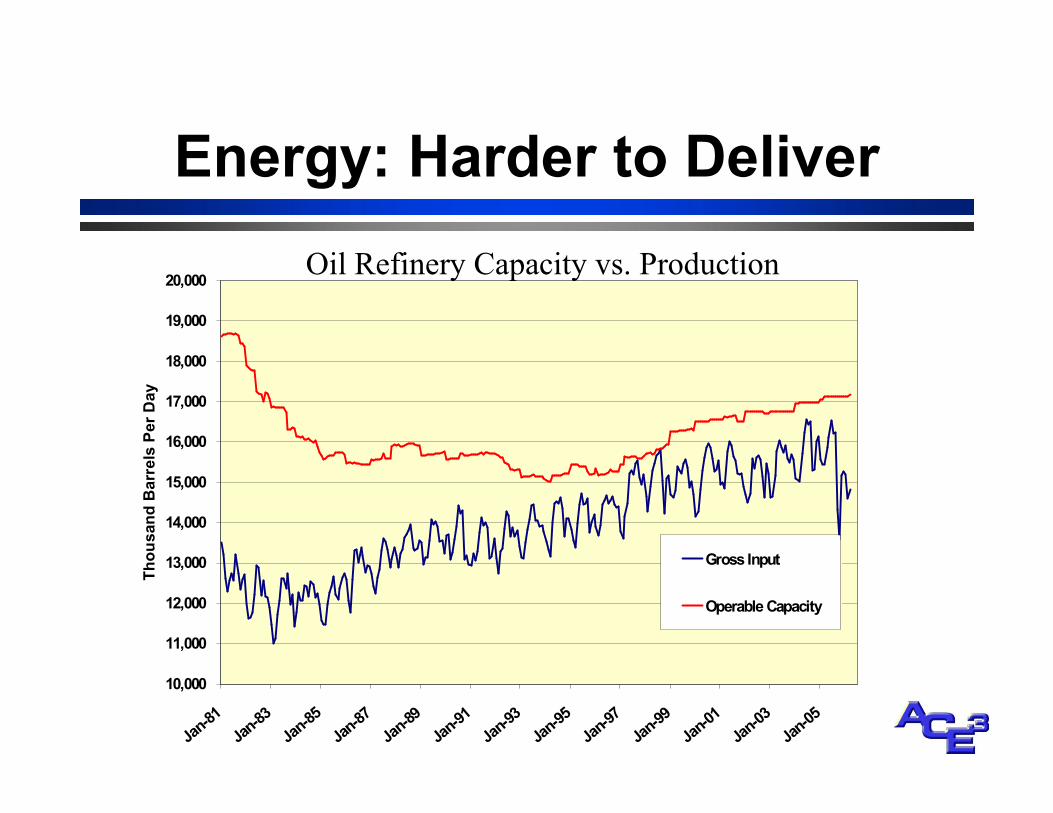
Energy: Harder to Deliver
10,000
11,000
12,000
13,000
14,000
15,000
16,000
17,000
18,000
19,000
20,000
Jan81
Jan83
Jan85
Jan87
Jan89
Jan91
Jan93
Jan95
Jan97
Jan99
Jan01
Jan03
Jan05
Thou
sand
Barrels Per Day
Gross Input
Operable Capacity
Oil Refinery Capacity vs. Production

Energy: Harder to Deliver
Natural Gas Capacity vs. Production

Energy: Harder to Deliver
0
10
20
30
40
50
60
Mar02
Jun02
Sep02
Dec02
Mar03
Jun03
Sep03
Dec03
Mar04
Jun04
Sep04
Dec04
Mar05
Jun05
Sep05
Dec05
Days Su
pply
0
50,000
100,000
150,000
200,000
250,000
300,000
Coa
l (short ton
s)
Consumption Stocks Days Supply
Coal Usage and Powerplant Stocks
Will We See Cheap and Abundant Energy Again?
• Prices not returning to 20 th century lows • Delivery problems mounting
– Resources ‘in ground’ mean less than deliverability capacity
• Bringing any new resources to energy markets is harder than ever
• U.S. energy markets are in a “straitjacket” situation
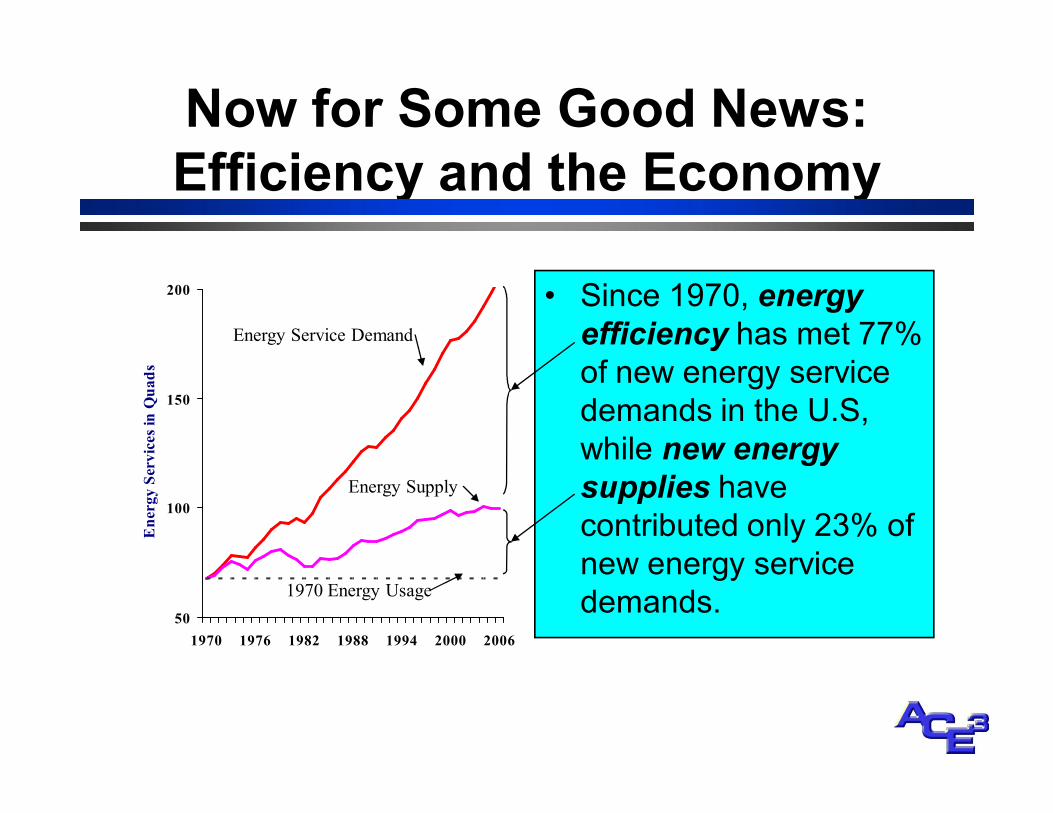
Now for Some Good News: Efficiency and the Economy
50
100
150
200
1970 1976 1982 1988 1994 2000 2006
Energy Services in Quads
• Since 1970, energy efficiency has met 77% of new energy service demands in the U.S, while new energy supplies have contributed only 23% of new energy service demands.
Energy Service Demand
Energy Supply
1970 Energy Usage

How Efficiency Meets New Service Demand
The humble refrigerator…
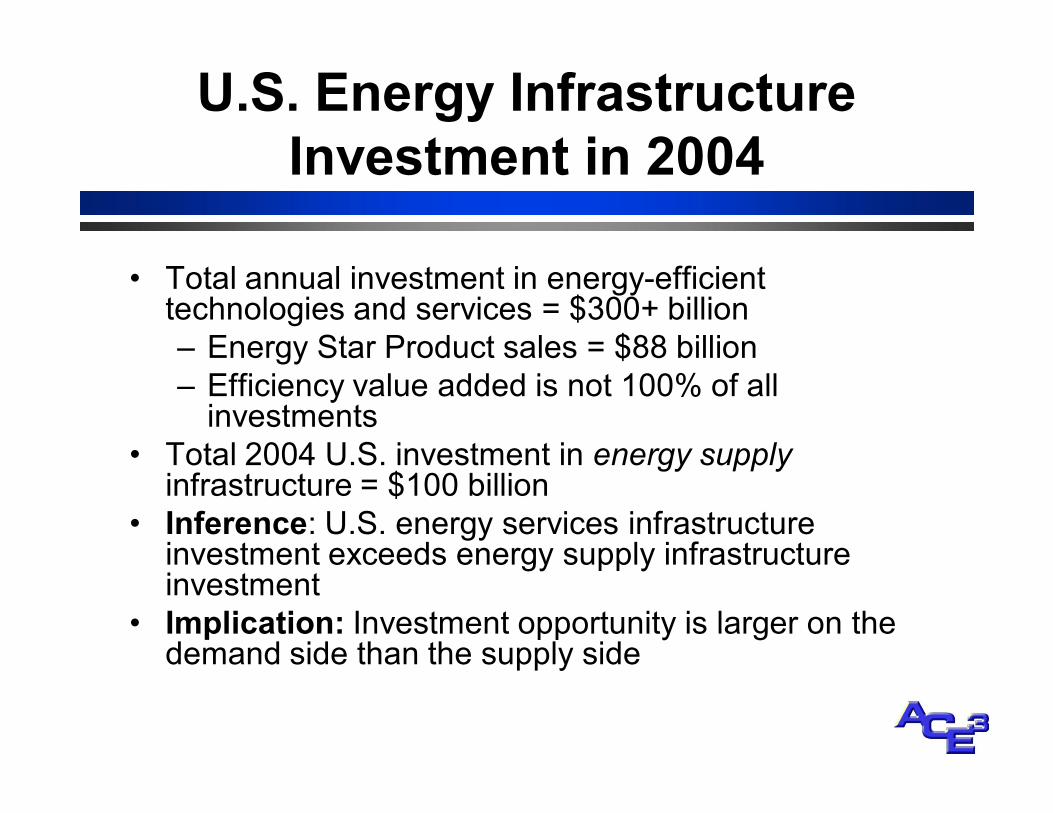
U.S. Energy Infrastructure Investment in 2004
• Total annual investment in energyefficient technologies and services = $300+ billion – Energy Star Product sales = $88 billion – Efficiency value added is not 100% of all investments
• Total 2004 U.S. investment in energy supply infrastructure = $100 billion
• Inference: U.S. energy services infrastructure investment exceeds energy supply infrastructure investment
• Implication: Investment opportunity is larger on the demand side than the supply side

Efficiency Investment and Job Creation
• 2004 energy efficiency investment supports 1.6 million U.S. jobs – 230,000 directly attributable to efficiency value added
– Distributed among manufacturing, services, construction
– Jobs created in more laborintensive sectors than those stimulated by energy supply investments
– Direct jobs multiplier: • > 6 jobs per $ million invested, vs. • ~ 2 jobs/$ million for typical supply investments

The ‘Eternal Caveat’ on Job Creation
“Your Majesty, my voyage will not only forge a new route to the spices of the East, but it will also create over 3,000 jobs.”

Efficiency and Future Energy Service Demands
• ACEEE efficiency potential studies show we can meet most energy service demand growth through efficiency
• Efficiency and renewables together can meet most future demand growth
• EE and RE provide price hedge and other value to resource portfolios
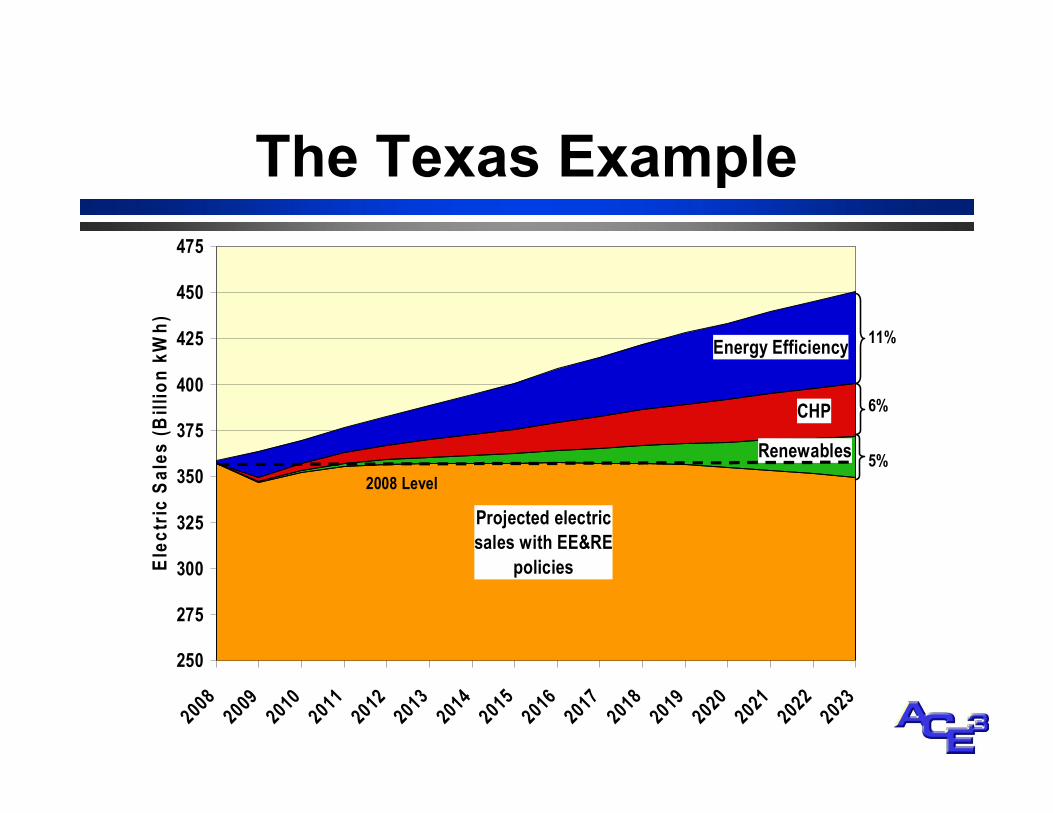
The Texas Example
Projected electric sales with EE&RE
policies
Renewables
CHP
Energy Efficiency
250
275
300
325
350
375
400
425
450
475
2008
2009
2010
2011
2012
2013
2014
2015
2016
2017
2018
2019
2020
2021
2022
2023
Elec
tric S
ales
(Billion kW
h)
2008 Level
11%
5%
6%

Efficiency: a Renewable Resource
• In the beginning, there was…not much • Today, we have efficient technologies in all enduse sectors
• Efficiency potential studies show we can cut demand growth by more than half
• Efficiency potentials stay high; new technologies and cost drops keep “refilling the well”

The Cheapest kWh
3.0
4.0
5.0
6.0
7.0
8.0
9.0
10.00
0 10 20 30 40 50
Levelized Cost of Electricity by Source
Wind @ 29% CF
IGCC w/o CCS
NGCC @ $6 gas Biomass
Nuclear Pulverized Coal w/o CCS Energy Efficiency
Cents per K
Wh
Carbon price: Dollars per ton
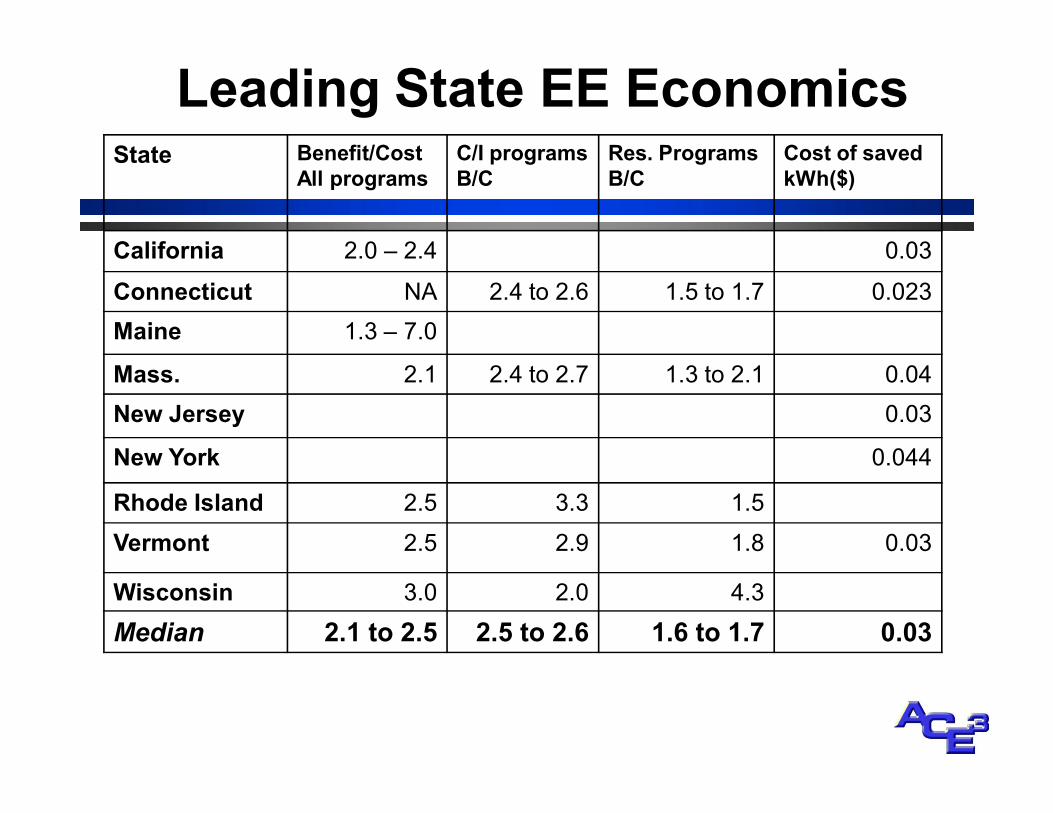
Leading State EE Economics State Benefit/Cost
All programs C/I programs B/C
Res. Programs B/C
Cost of saved kWh($)
California 2.0 – 2.4 0.03 Connecticut NA 2.4 to 2.6 1.5 to 1.7 0.023 Maine 1.3 – 7.0
Mass. 2.1 2.4 to 2.7 1.3 to 2.1 0.04 New Jersey 0.03
New York 0.044
Rhode Island 2.5 3.3 1.5 Vermont 2.5 2.9 1.8 0.03
Wisconsin 3.0 2.0 4.3 Median 2.1 to 2.5 2.5 to 2.6 1.6 to 1.7 0.03

Rising Powerplant Costs New pulverized coal capital costs
1,100
1,280 1,400
1,730 1,667
2,168
100 333
508
1,200 1,250
1,500 1,504 1,519 1,667 1,667
1,875 2,083
2,333 2,500
0 500 1,000 1,500 2,000 2,500 3,000
TXU 11 plants (TX) Prairie State Original (IL)
CliffsideDuke Original (NC) EIA (AEO 2006)
EPRI (2004) EPA (2003)
Weston 4 (WI) Council Bluffs (IA)
Prairie State Revised (IL) Westar Original (KS)
Black & Veatch (2006) Big Stone II Original (SD)
CliffsideDuke Revised (NC) Oak Creek (WI)
Westar Revised (KS) Springfield (IL)
Big Stone II Revised (SD)
$/kW
Generation Transmission Total

But: Policy Leadership is Needed To Spur EE Markets
• Markets work, but won’t reap enough EE fast enough – Income elasticity and crosselasticity block price elasticity
– Principalagent barriers—builderbuyer, landlordtenant – Informationcost barriers—consumers don’t have time/$ to study each purchase
• IEA study: over half of building heating/cooling/hot water is affected by the principalagent barrier
• Utility regulation must be reformed for the 21 st century
• Bottom line: policy action is need to make markets work for a clean energy future
States Have Become the Leaders on Energy Policy
• Congress struggling to move transformational energy policies
• States more and more the laboratories of innovation and effectiveness
• States now outspending the federal government by 3:1
• State leadership more important than ever

Why are So Many States Leading with Efficiency?
• It’s the only resource reliably available in EVERY STATE
• Most conventional energy dollars go out of state—more of the efficiency dollar STAYS HOME—so it’s an economic winner
• It’s something you can do NOW (IMTOO) • It’s a great hedge, against rising prices, supply problems, environmental problems
…that’s why we call it the ‘first fuel

Spending on Utility Sector Efficiency Programs
0.0
0.5
1.0
1.5
2.0
2.5
1993 1996 1997 1998 1999 2000 2003 2004 2005 2006
$ billion
s (nom
inal)
Three Utility Regulatory Issues
• Allowing timely cost recovery for direct costs of EE programs
• Removing the disincentives of “lost revenues” resulting from energy efficiency programs
• Creating earnings potential from energy efficiency program investments
Where’s the Electricity Business Heading?
• A shift in electricity industry strategy – Slowing load growth – Rising fuel prices and capital costs – Capacity shortages – Carbon risk – Growing understanding of demand side investment potential
– Consideration of new business models
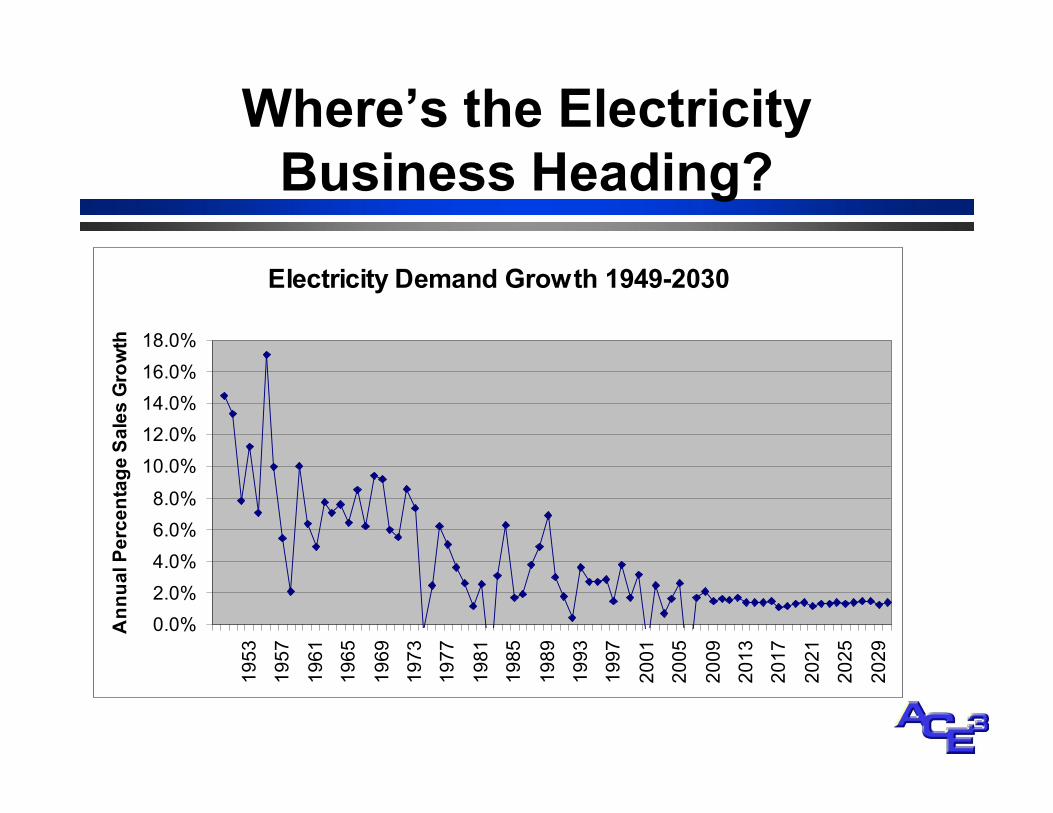
Where’s the Electricity Business Heading?
Electricity Demand Growth 19492030
0.0% 2.0% 4.0% 6.0% 8.0%
10.0% 12.0% 14.0% 16.0% 18.0%
1953
1957
1961
1965
1969
1973
1977
1981
1985
1989
1993
1997
2001
2005
2009
2013
2017
2021
2025
2029 Ann
ual P
ercentag
e Sales Growth
Where’s the Electricity Business Heading?
• Proliferating state EERS encouraging federal action
• Housepassed RPS bill in August requires 15% renewable electricity supply by 2020 – Allows EE to meet up to 27% of requirements – Could become part of federal climate bill
• Resembles the NC REPS • States may see a federal requirement driving EE and well as RE resource acquisition
Where Does North Carolina’s Energy Story Go From Here?
• There’s no turning back the clock – Energy prices aren’t falling – Fuels aren’t getting easier to deliver – The climate challenge is growing
• The rest of the story starts with energy efficiency – Policies that spur investment in EE for job creation and balanced economic growth
• The happy ending comes from building a 21 st century economy on clean technology

Contact Information
Bill Prindle Deputy Director ACEEE
1001 Conn. Ave, NW, Suite 801 Washington, DC 20036
2024298873 [email protected]
http://www.aceee.org/energy