Embed Size (px)
Citation preview
© 2015 Water Research Foundation. ALL RIGHTS RESERVED.© 2015 Water Research Foundation. ALL RIGHTS RESERVED. No part of this presentation may be copied, reproduced, or otherwise utilized without permission.
WRF Webcast
A Snapshot of Water Loss:
Examining the Country’s Water
Audit Submissions
November 5, 2015
© 2015 Water Research Foundation. ALL RIGHTS RESERVED.
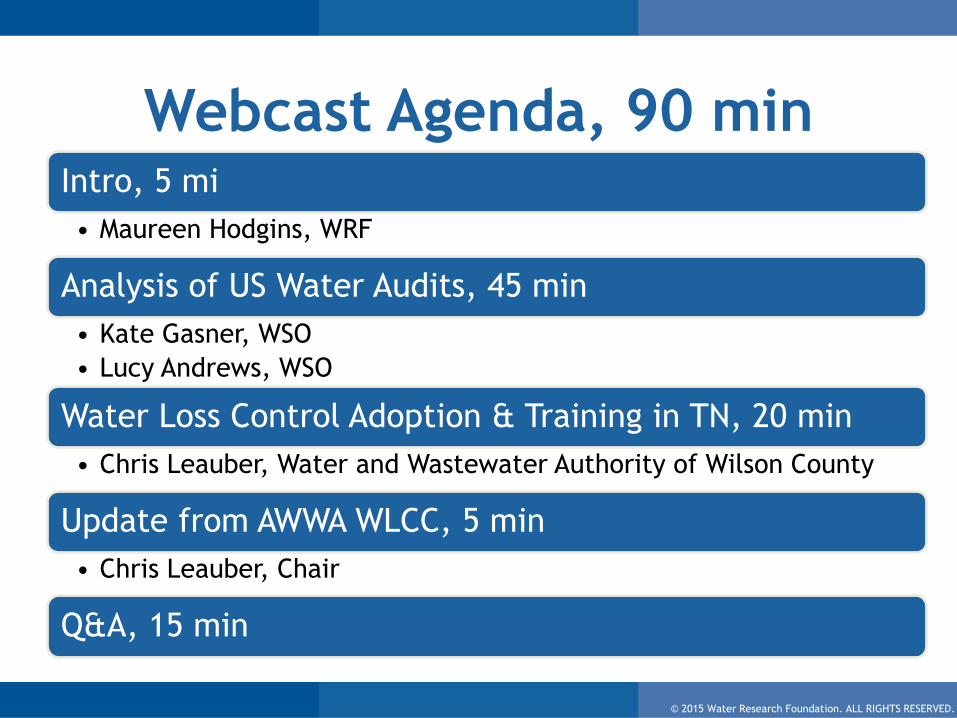
Webcast Agenda, 90 minIntro, 5 mi
• Maureen Hodgins, WRF
Analysis of US Water Audits, 45 min
• Kate Gasner, WSO
• Lucy Andrews, WSO
Water Loss Control Adoption & Training in TN, 20 min
• Chris Leauber, Water and Wastewater Authority of Wilson County
Update from AWWA WLCC, 5 min
• Chris Leauber, Chair
Q&A, 15 min
© 2015 Water Research Foundation. ALL RIGHTS RESERVED.
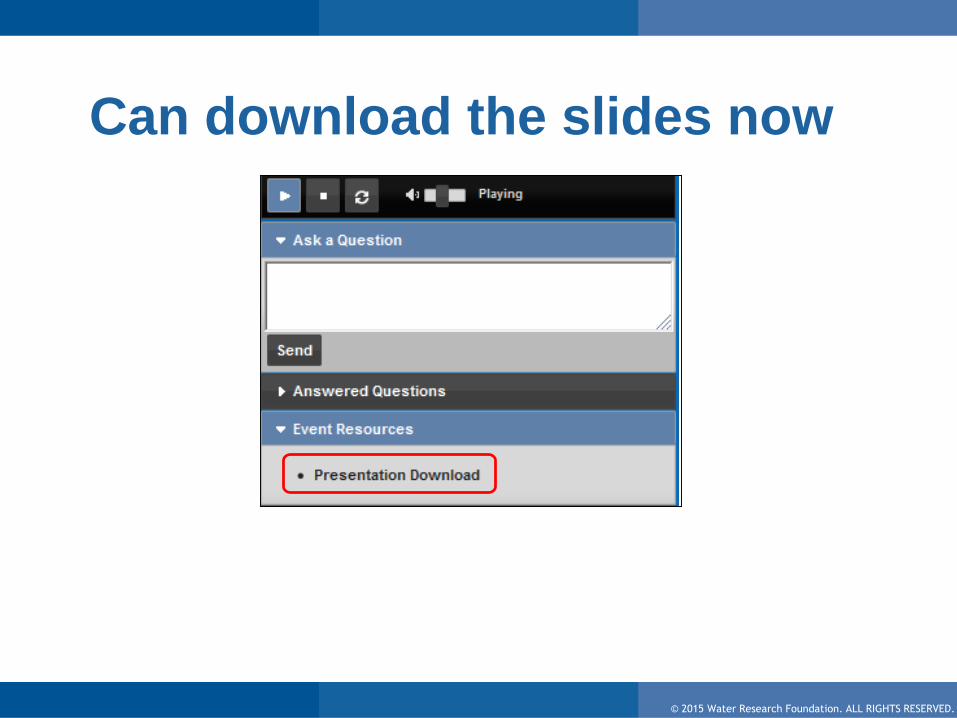
Can download the slides now

© 2015 Water Research Foundation. ALL RIGHTS RESERVED.
Audience Questions
Type in your questions here & hit Send
Questions on the webcast content will be answered in the last 15 minutes

© 2015 Water Research Foundation. ALL RIGHTS RESERVED.
Information available on
www.waterrf.org
• 4372b report – now, search for 4372
• Webcast slides and recording - within 24
hours after the webcast
© 2015 Water Research Foundation. ALL RIGHTS RESERVED.
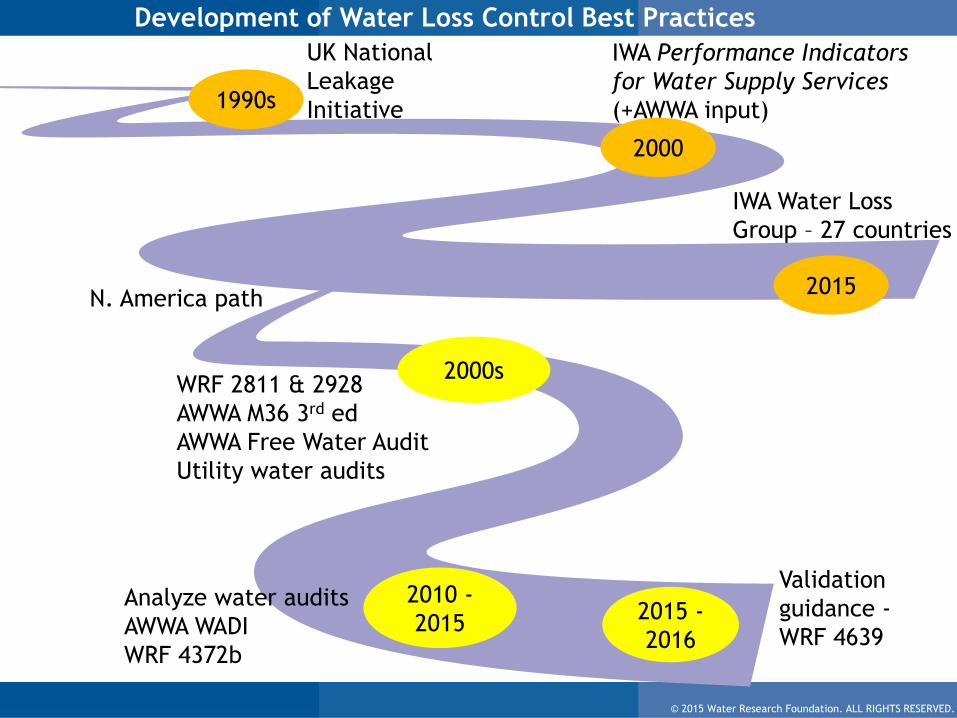
1990s
UK National
Leakage
Initiative
2000
IWA Performance Indicators
for Water Supply Services
(+AWWA input)
WRF 2811 & 2928
AWWA M36 3rd ed
AWWA Free Water Audit
Utility water audits
2000s
2015
IWA Water Loss
Group – 27 countries
2010 -
20152015 -
2016
Analyze water audits
AWWA WADI
WRF 4372b
Validation
guidance -
WRF 4639
Development of Water Loss Control Best Practices
N. America path
© 2015 Water Research Foundation. ALL RIGHTS RESERVED.© 2015 Water Research Foundation. ALL RIGHTS RESERVED.
Kate Gasner
Director of Water and Energy Efficiency
Water Systems Optimization
Today’s Speakers
Chris Leauber
Executive Director
Water and Wastewater Authority of Wilson County, TN
Chair, AWWA Water Loss Control Committee
Lucy Andrews
Project Manager
Water Systems Optimization
© 2015 Water Research Foundation. ALL RIGHTS RESERVED.© 2015 Water Research Foundation. ALL RIGHTS RESERVED.
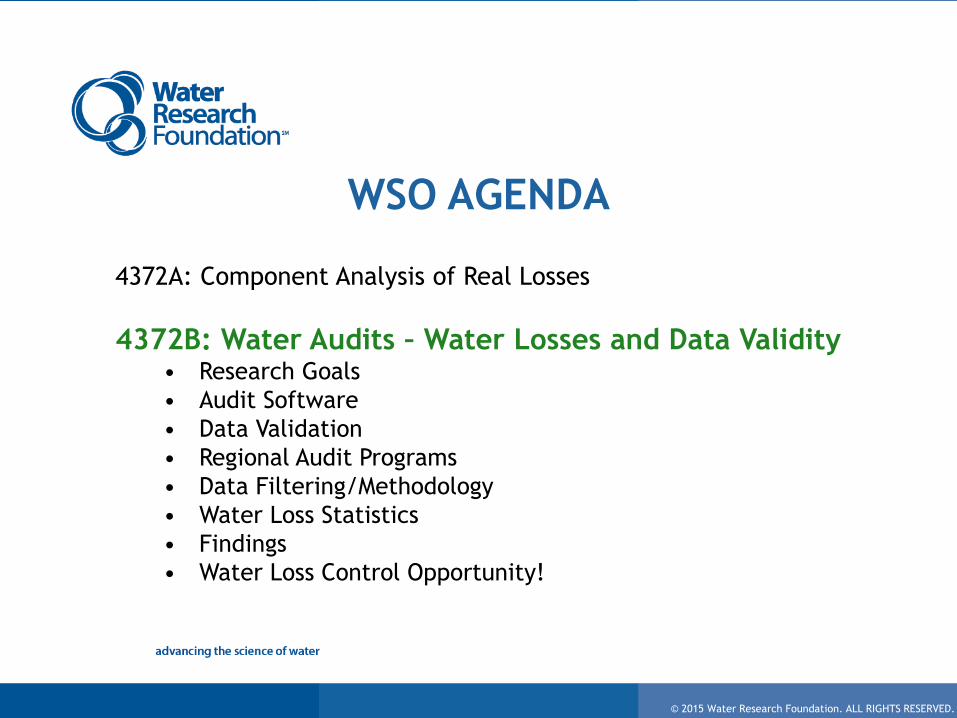
WSO AGENDA
4372A: Component Analysis of Real Losses
4372B: Water Audits – Water Losses and Data Validity• Research Goals
• Audit Software
• Data Validation
• Regional Audit Programs
• Data Filtering/Methodology
• Water Loss Statistics
• Findings
• Water Loss Control Opportunity!
© 2015 Water Research Foundation. ALL RIGHTS RESERVED.
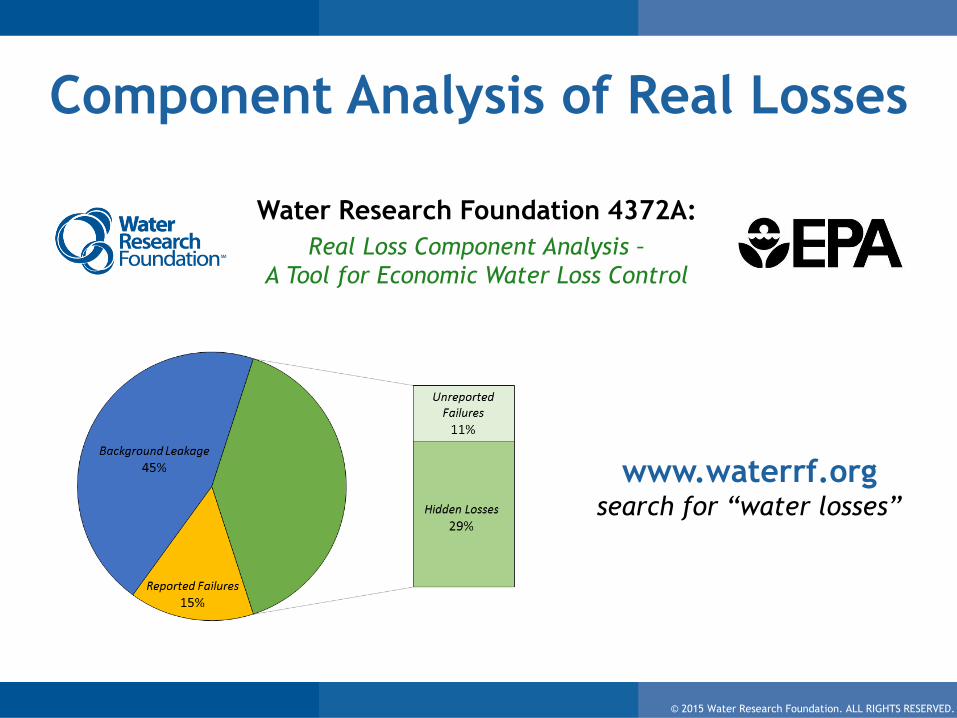
Component Analysis of Real Losses
www.waterrf.orgsearch for “water losses”
Water Research Foundation 4372A:
Real Loss Component Analysis –
A Tool for Economic Water Loss Control

© 2015 Water Research Foundation. ALL RIGHTS RESERVED.
Component Analysis of Real Losses
AUDIT SOFTWARE 1 2 COMPONENT ANALYSIS MODEL
WATER
AUDIT
TOTAL
REAL
LOSSESBACKGROUND
REPORTED
UNREPORTED

© 2015 Water Research Foundation. ALL RIGHTS RESERVED.
Research Goals
Water Research Foundation 4372B:
Water Audits in the United States –
A Review of Water Losses and Data Validity
1. What are the reporting frameworks of states that track water loss?
2. Is data submitted in water audits reasonable?
3. Has audit data quality changed with repeated auditing?
4. Have reported water loss volumes and relevant metrics changed with repeated auditing?
5. What trends in water loss and cost figures can be observed in the composite data set?
6. How is the quality of audit data affected by reporting requirements and validation?
DATA VALIDITY WATER LOSS METRICS
© 2015 Water Research Foundation. ALL RIGHTS RESERVED.
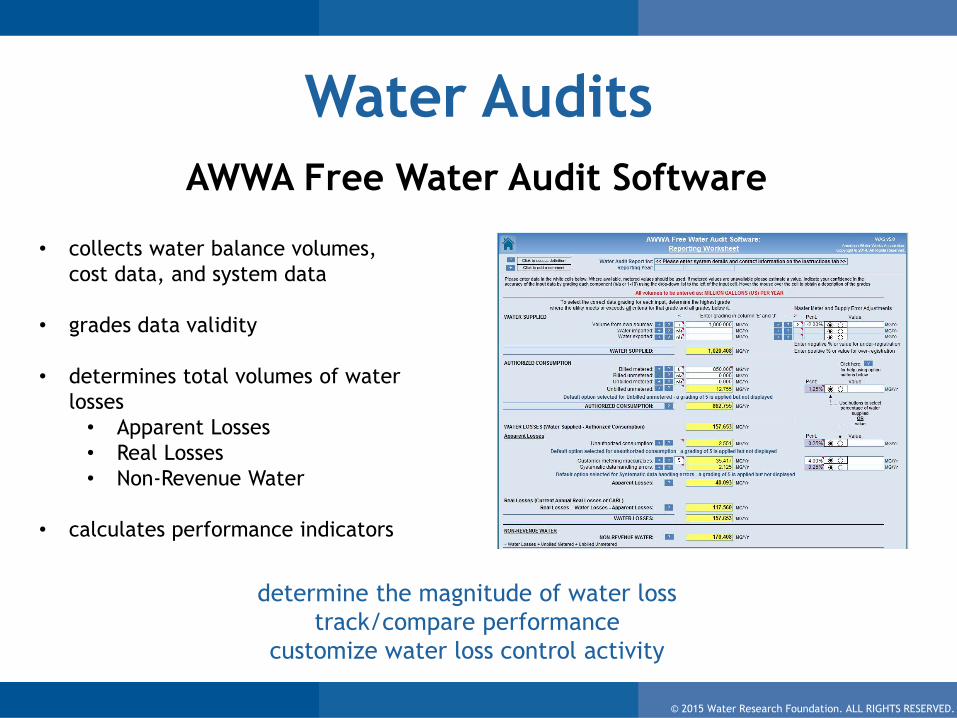
Water Audits
AWWA Free Water Audit Software
• collects water balance volumes,
cost data, and system data
• grades data validity
• determines total volumes of water
losses
• Apparent Losses
• Real Losses
• Non-Revenue Water
• calculates performance indicators
determine the magnitude of water loss
track/compare performance
customize water loss control activity

© 2015 Water Research Foundation. ALL RIGHTS RESERVED.
Performance Indicators
• Real Losses / service conn / day
• Apparent Losses / service conn / day
• Infrastructure Leakage Index (ILI)
Unavoidable
Annual Real
Losses
Current Annual Real Losses
ILI = technical minimum Real Losses
actual Real Losses
percent values not preferred as performance indicator
© 2015 Water Research Foundation. ALL RIGHTS RESERVED.
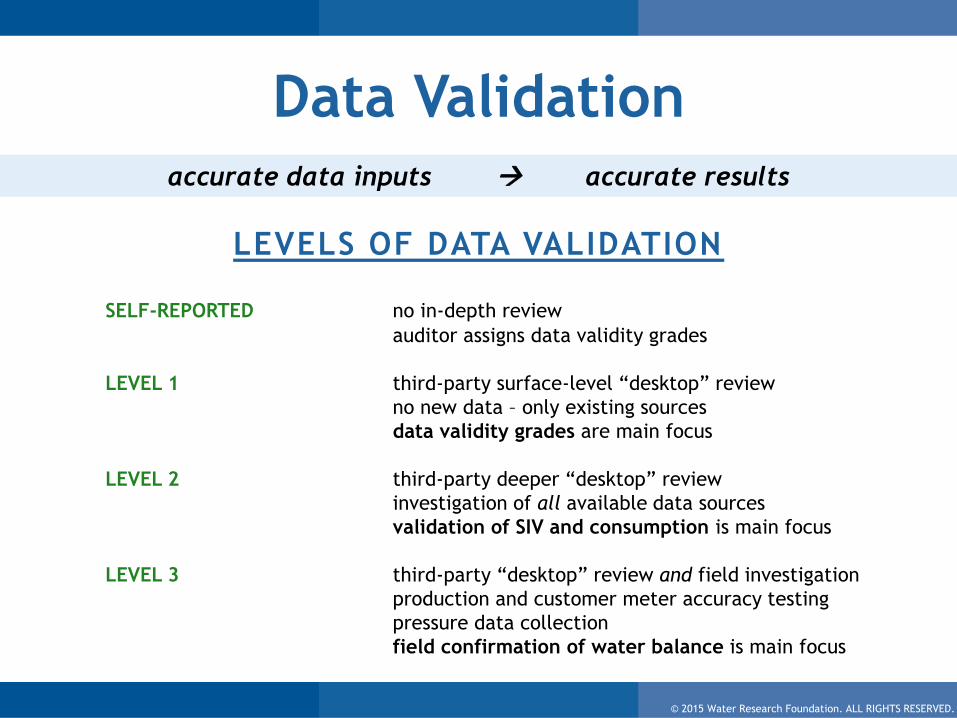
Data Validationaccurate data inputs accurate results
LEVELS OF DATA VALIDATION
SELF-REPORTED no in-depth review
auditor assigns data validity grades
LEVEL 1 third-party surface-level “desktop” review
no new data – only existing sources
data validity grades are main focus
LEVEL 2 third-party deeper “desktop” review
investigation of all available data sources
validation of SIV and consumption is main focus
LEVEL 3 third-party “desktop” review and field investigation
production and customer meter accuracy testing
pressure data collection
field confirmation of water balance is main focus

© 2015 Water Research Foundation. ALL RIGHTS RESERVED.
REGIONAL AUDIT PROGRAMS
ENTITY ABBREVIATIONPROGRAM
START
LEVEL OF
VALIDATION
California Urban Water Conservation Council CA 2010 self-reported
Delaware River Basin Commission DRBC 2012 self-reported
Georgia Department of Natural Resources GA 2012 level 1
Tennessee Comptroller of the Treasury TN 2013 self-reported
Texas Water Development Board TX 2005 self-reported
PROGRAMMATIC CONSIDERATIONS
amount of training, ongoing education, and technical support
extent of validation
driving forces and purpose of auditing
(allocation of funds, quantification of losses, scarcity, etc.)

© 2015 Water Research Foundation. ALL RIGHTS RESERVED.
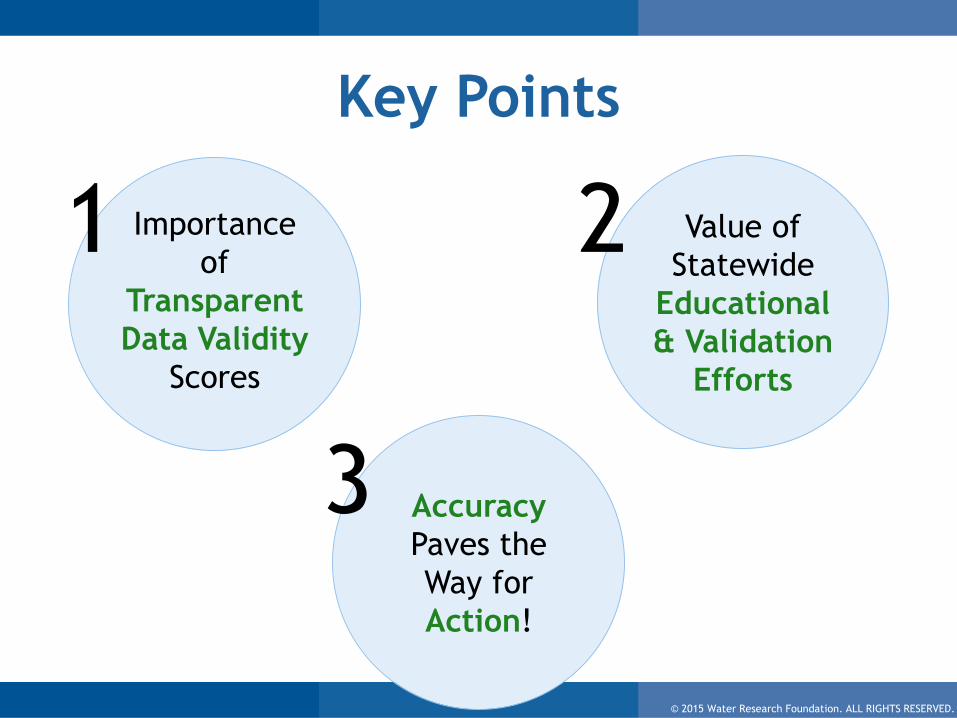
Key Points
Importance
of
Transparent
Data Validity
Scores
1 Value of
Statewide
Educational
& Validation
Efforts
2
Accuracy
Paves the
Way for
Action!
3

© 2015 Water Research Foundation. ALL RIGHTS RESERVED.
Filtering Process
are self-reported audits realistic?
all audit submissions
audits included for further
analysis, statistics, totals
filtering process
© 2015 Water Research Foundation. ALL RIGHTS RESERVED.
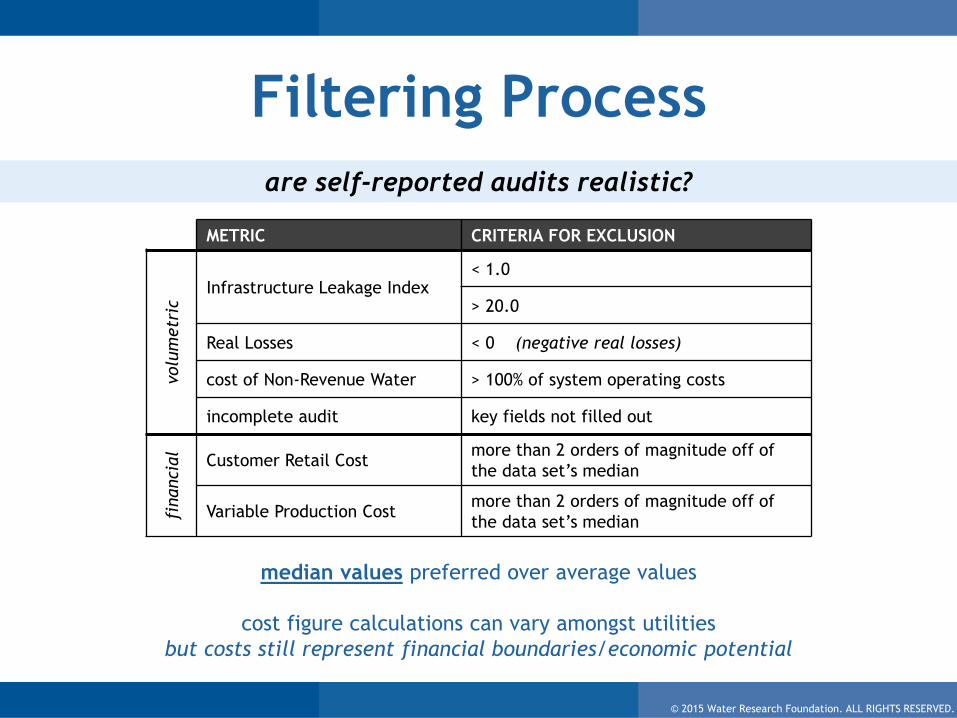
Filtering Process
are self-reported audits realistic?
METRIC CRITERIA FOR EXCLUSION
volu
metr
ic
Infrastructure Leakage Index< 1.0
> 20.0
Real Losses < 0 (negative real losses)
cost of Non-Revenue Water > 100% of system operating costs
incomplete audit key fields not filled out
financi
al
Customer Retail Costmore than 2 orders of magnitude off of
the data set’s median
Variable Production Costmore than 2 orders of magnitude off of
the data set’s median
median values preferred over average values
cost figure calculations can vary amongst utilities
but costs still represent financial boundaries/economic potential

© 2015 Water Research Foundation. ALL RIGHTS RESERVED.
Performance Indicators
composite data set = most recent realistic audits from each region
PERFORMANCE INDICATOR MEDIAN AVERAGE UNIT
financi
al customer retail unit cost $4.67 $8.33 $ / 1,000 gal
variable production cost $950.00 $2,085.28 $ / million gal
NRW as % of operating cost 7.8% 10.2% % of operating cost
volu
metr
ic
Apparent Losses 5.73 14.9 gal / serv conn / day
Real Losses (serv conns) 39.9 51.8 gal / serv conn / day
Real Losses (mains) 785.5 1,132.4 gal / mile of main / day
Real Losses (pressure) 0.6 0.8 gal / serv conn / day / PSI
ILI 2.48 3.12 (dimensionless)
data validity score 73.1 71.7 points out of 100
data set is skewed – averages are far above medians
values indicate potential magnitudes – not absolute measurements
© 2015 Water Research Foundation. ALL RIGHTS RESERVED.
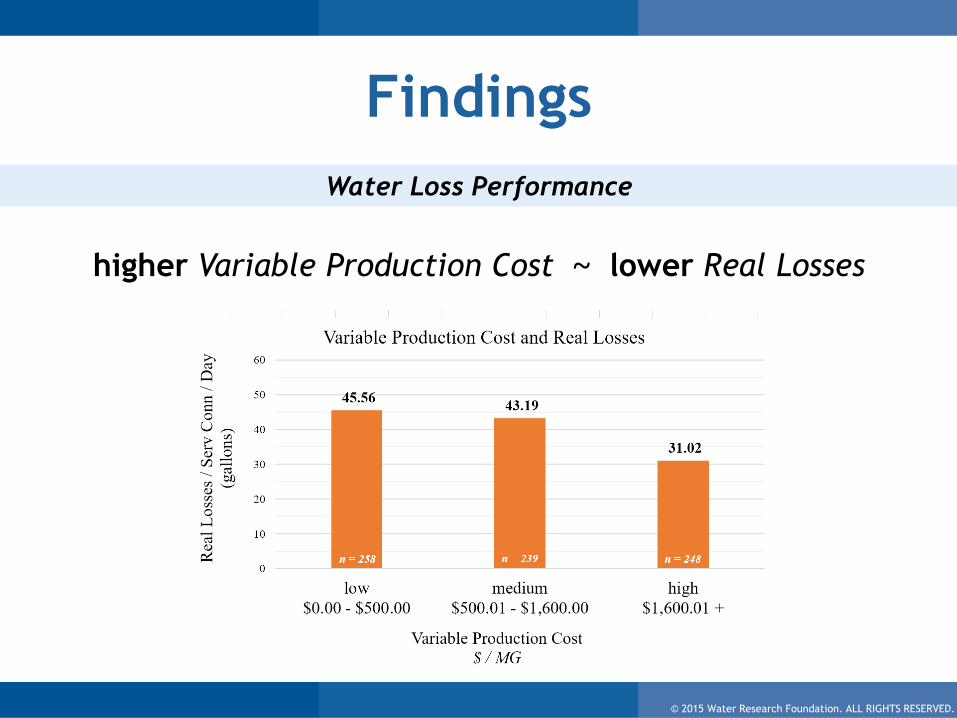
Findings
Water Loss Performance
higher Variable Production Cost ~ lower Real Losses

© 2015 Water Research Foundation. ALL RIGHTS RESERVED.
Findings
Water Loss Performance
more water imported ~ lower Real Losses

© 2015 Water Research Foundation. ALL RIGHTS RESERVED.
Findings
Water Loss Performance
higher operating pressure ~ higher Real Losses

© 2015 Water Research Foundation. ALL RIGHTS RESERVED.
CA DRBC GA TN TX
total audits 300 517 452 629 2,646
# of unrealistic audits 100 130 74 122 1,065
% of unrealistic audits 33% 25% 16% 19% 40%
Findings
Data Validity
• many audits are unrealistic
• more training (ie GA, TN) produces fewer unrealistic audits
• even level 1 validation doesn’t fully eliminate unrealistic audits
© 2015 Water Research Foundation. ALL RIGHTS RESERVED.
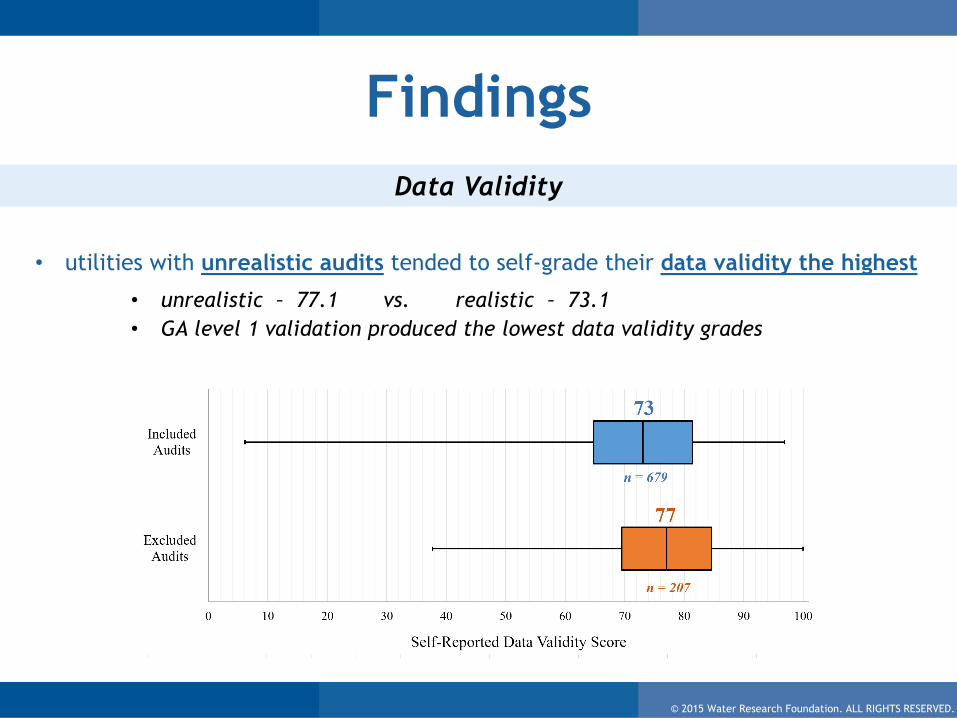
Findings
Data Validity
• utilities with unrealistic audits tended to self-grade their data validity the highest
• unrealistic – 77.1 vs. realistic – 73.1
• GA level 1 validation produced the lowest data validity grades
© 2015 Water Research Foundation. ALL RIGHTS RESERVED.
Key Points
Importance
of
Transparent
Data Validity
Scores
1 Value of
Statewide
Educational
& Validation
Efforts
2
Accuracy
Paves the
Way for
Action!
3
© 2015 Water Research Foundation. ALL RIGHTS RESERVED.
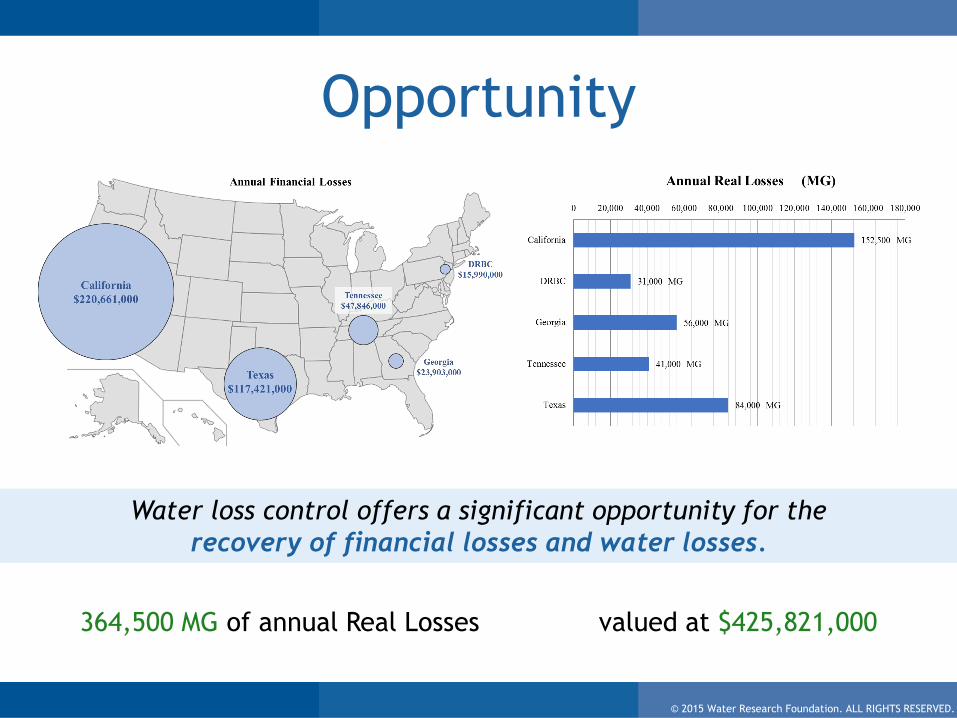
Opportunity
Water loss control offers a significant opportunity for the
recovery of financial losses and water losses.
364,500 MG of annual Real Losses valued at $425,821,000

© 2015 Water Research Foundation. ALL RIGHTS RESERVED.© 2015 Water Research Foundation. ALL RIGHTS RESERVED.
Water Loss Control Adoption & Training in Tennessee
Chris Leauber
Executive Director
Water and Wastewater Authority of Wilson County, TN
© 2015 Water Research Foundation. ALL RIGHTS RESERVED.
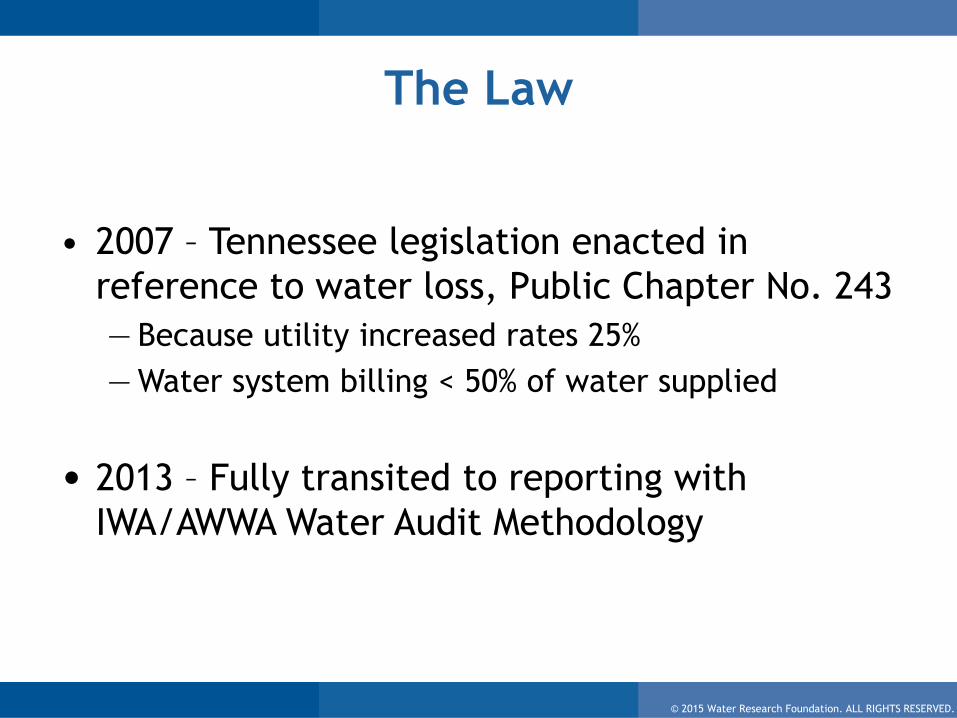
The Law
• 2007 – Tennessee legislation enacted in
reference to water loss, Public Chapter No. 243
— Because utility increased rates 25%
— Water system billing < 50% of water supplied
• 2013 – Fully transited to reporting with
IWA/AWWA Water Audit Methodology
© 2015 Water Research Foundation. ALL RIGHTS RESERVED.
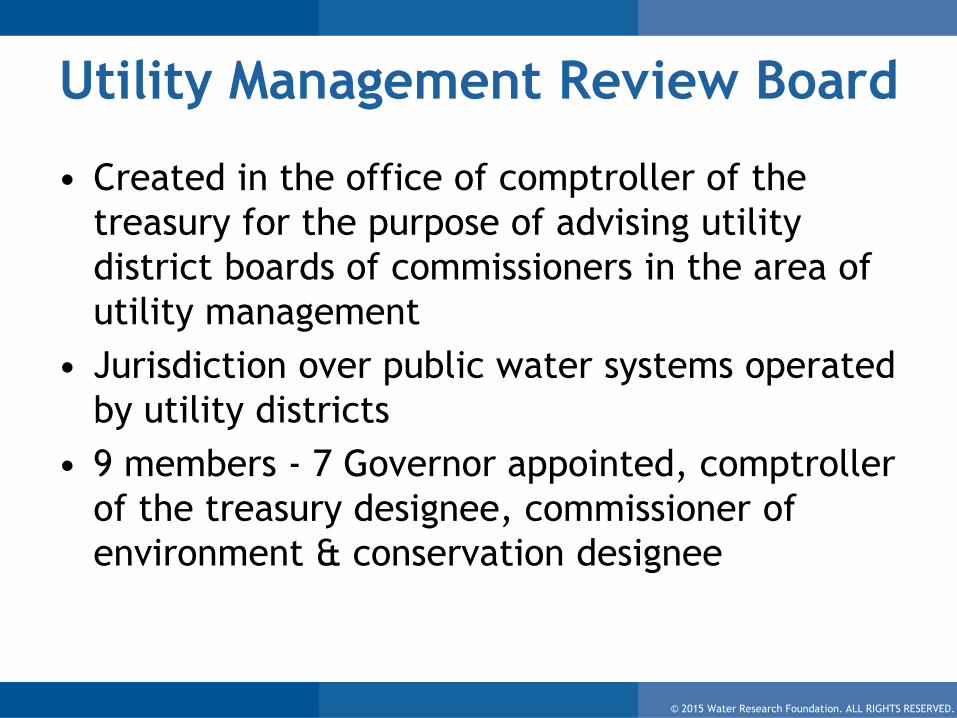
Utility Management Review Board
• Created in the office of comptroller of the
treasury for the purpose of advising utility
district boards of commissioners in the area of
utility management
• Jurisdiction over public water systems operated
by utility districts
• 9 members - 7 Governor appointed, comptroller
of the treasury designee, commissioner of
environment & conservation designee
© 2015 Water Research Foundation. ALL RIGHTS RESERVED.
Water & Wastewater Financing Board
• Established in the office of the comptroller of
the treasury to determine and ensure the
financial integrity of certain water systems and
wastewater facilities
• Jurisdiction over self-supporting water systems
(municipalities) & treatment authorities
• 9 members - 7 Governor appointed, comptroller
of the treasury designee, commissioner of
environment & conservation designee
© 2015 Water Research Foundation. ALL RIGHTS RESERVED.
0
10
20
30
40
50
60
0 1 2 3 4 5 6 7*T
N U
na
cco
un
ted
fo
r W
ate
r (U
FW
) %
**Infrastructure Leakage Index (ILI)
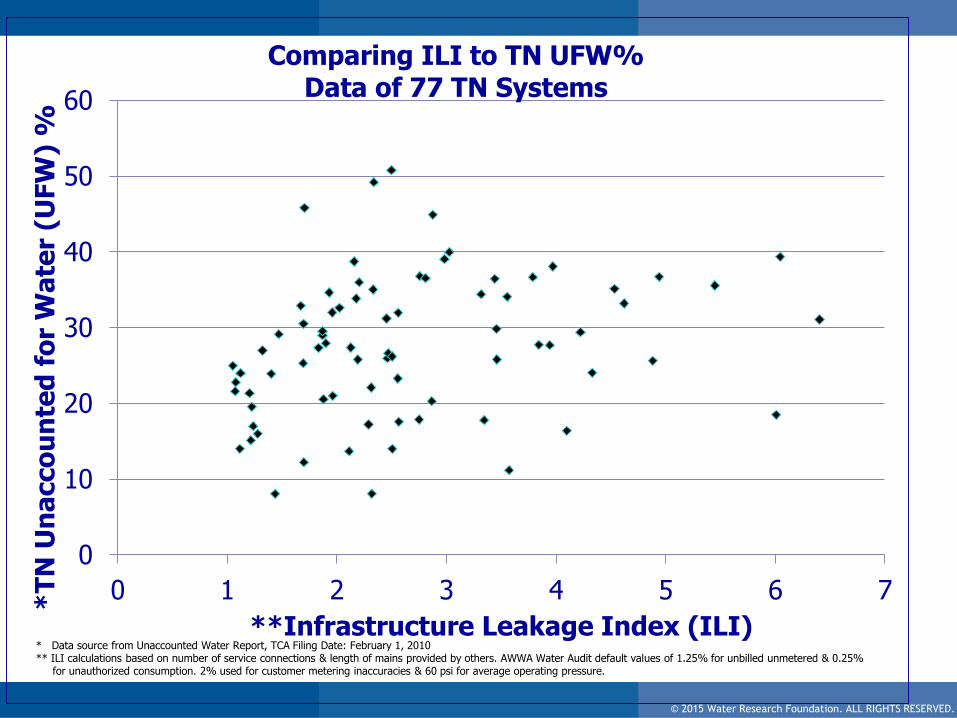
Comparing ILI to TN UFW%Data of 77 TN Systems
* Data source from Unaccounted Water Report, TCA Filing Date: February 1, 2010** ILI calculations based on number of service connections & length of mains provided by others. AWWA Water Audit default values of 1.25% for unbilled unmetered & 0.25%
for unauthorized consumption. 2% used for customer metering inaccuracies & 60 psi for average operating pressure.
© 2015 Water Research Foundation. ALL RIGHTS RESERVED.
© 2015 Water Research Foundation. ALL RIGHTS RESERVED.
Excessive Water Loss
• October, 2010 – UMRB & WWFB set an
excessive water loss percentage at 35%
UFW (the comptroller’s method)
– Must recalculate with AWWA method
– Adopted AWWA method for financial reports
received after 1/1/2013
– Motion approved to seek to change verbiage
in state law to reflect that the water loss be
determined in a manner described by Board

© 2015 Water Research Foundation. ALL RIGHTS RESERVED.
Legislation Changed TCA
• May, 2011 –Tennessee SB 742 & HB 876 Passed
– Deletes term “percentage”
– Allows Boards instead of comptroller of the
treasury to determine manner systems report
water loss
▪ Will allow Boards to adopt AWWA water audit method
• April, 2013 – Tennessee SB 764 & HB 60 Passed
—Deletes term “unaccounted for” and “average
unaccounted for water”
—Uses term “water loss” instead
© 2015 Water Research Foundation. ALL RIGHTS RESERVED.
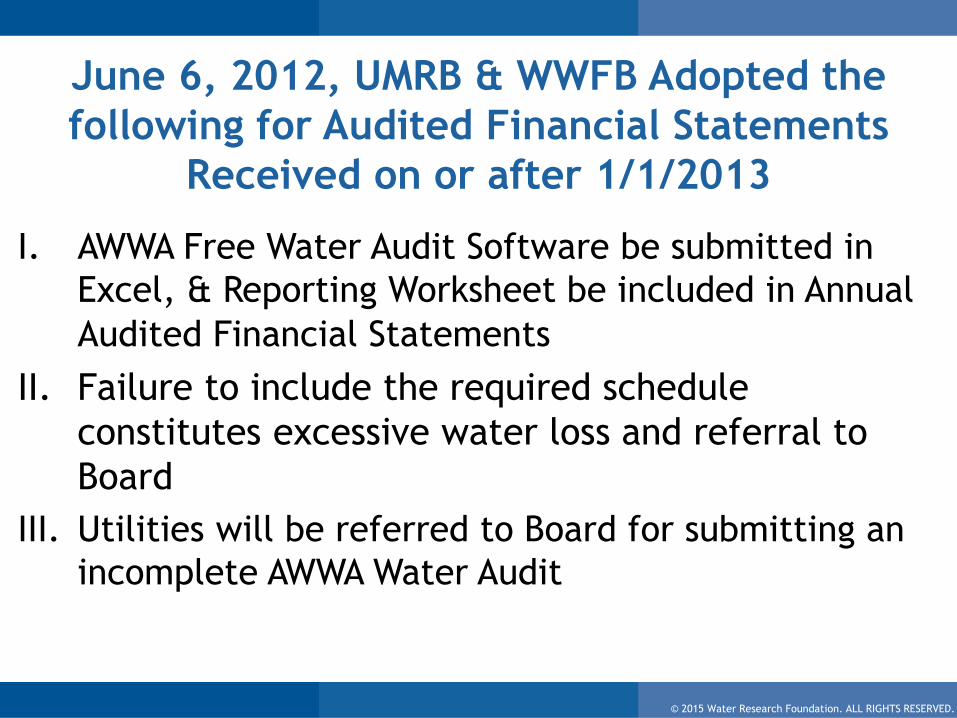
June 6, 2012, UMRB & WWFB Adopted the
following for Audited Financial Statements
Received on or after 1/1/2013
I. AWWA Free Water Audit Software be submitted in
Excel, & Reporting Worksheet be included in Annual
Audited Financial Statements
II. Failure to include the required schedule
constitutes excessive water loss and referral to
Board
III. Utilities will be referred to Board for submitting an
incomplete AWWA Water Audit

© 2015 Water Research Foundation. ALL RIGHTS RESERVED.
TN Regulatory AWWA Water Audit
Triggers for Referral to Board
Table 2.3 Tennessee reporting thresholds requiring improvement plan submission
DATE EFFECTIVE DATA VALIDITY SCORE NRW AS % OF OPERATING COST
1/1/2013 65 or lower 30% or greater
1/1/2015 70 or lower 25% or greater
1/1/2017 75 or lower 20% or greater
1/1/2019 80 or lower 20% or greater
Sturm, R., K. Gasner, and L. Andrews. 2015. Water Audits in the United States: A Review of Water Losses and Data Validity. Denver, Colo:
Water Research Foundation. Reprinted with permission.
© 2015 Water Research Foundation. ALL RIGHTS RESERVED.
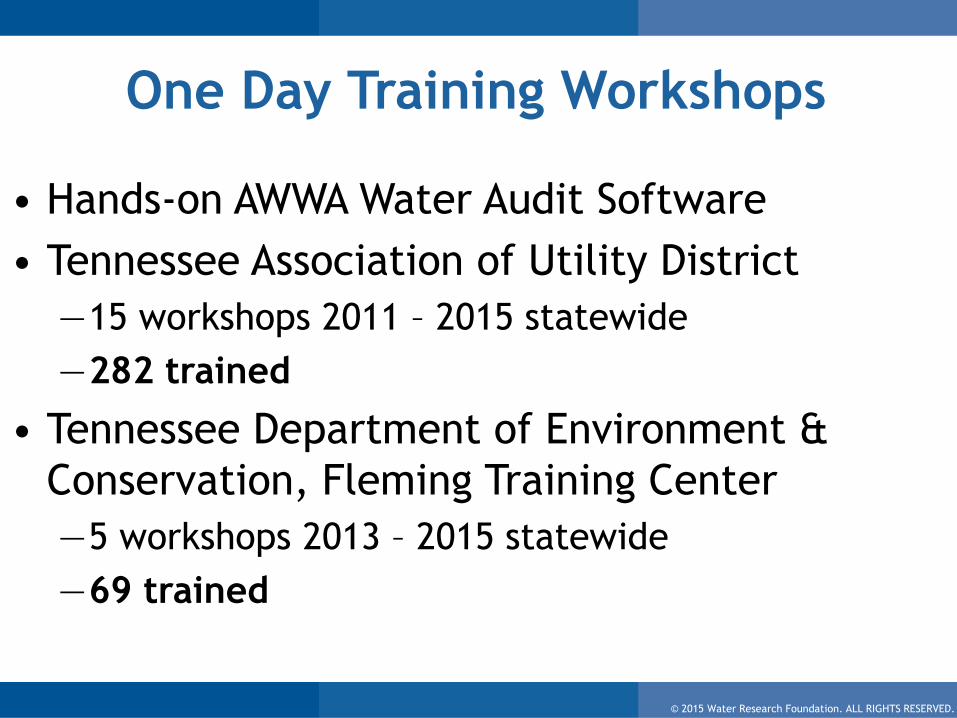
One Day Training Workshops
• Hands-on AWWA Water Audit Software
• Tennessee Association of Utility District
—15 workshops 2011 – 2015 statewide
—282 trained
• Tennessee Department of Environment &
Conservation, Fleming Training Center
—5 workshops 2013 – 2015 statewide
—69 trained
© 2015 Water Research Foundation. ALL RIGHTS RESERVED.
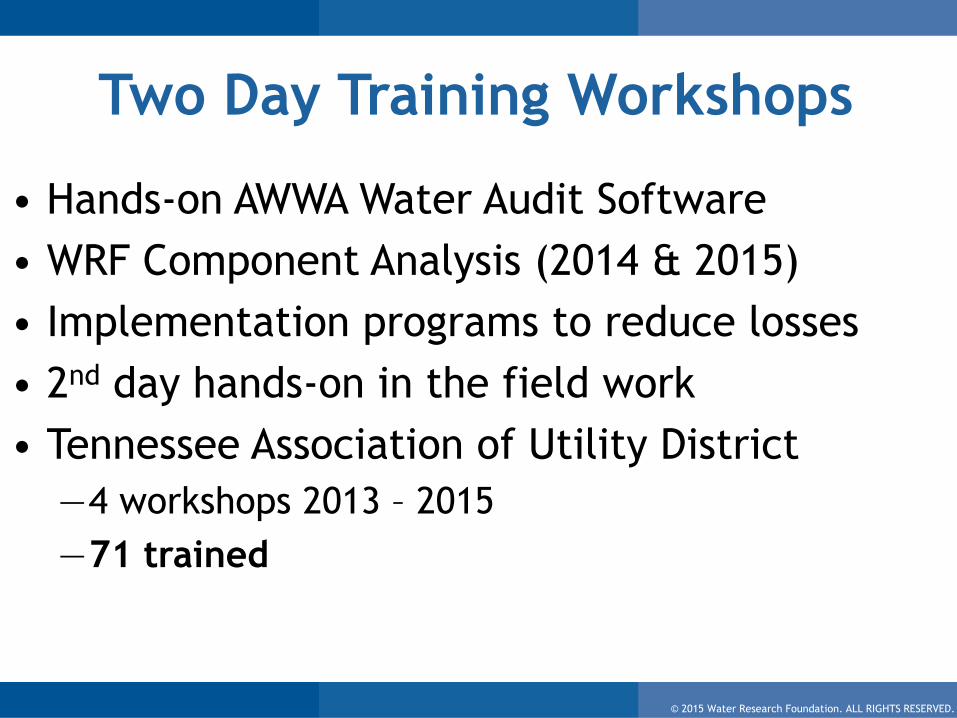
Two Day Training Workshops
• Hands-on AWWA Water Audit Software
• WRF Component Analysis (2014 & 2015)
• Implementation programs to reduce losses
• 2nd day hands-on in the field work
• Tennessee Association of Utility District
—4 workshops 2013 – 2015
—71 trained
© 2015 Water Research Foundation. ALL RIGHTS RESERVED.
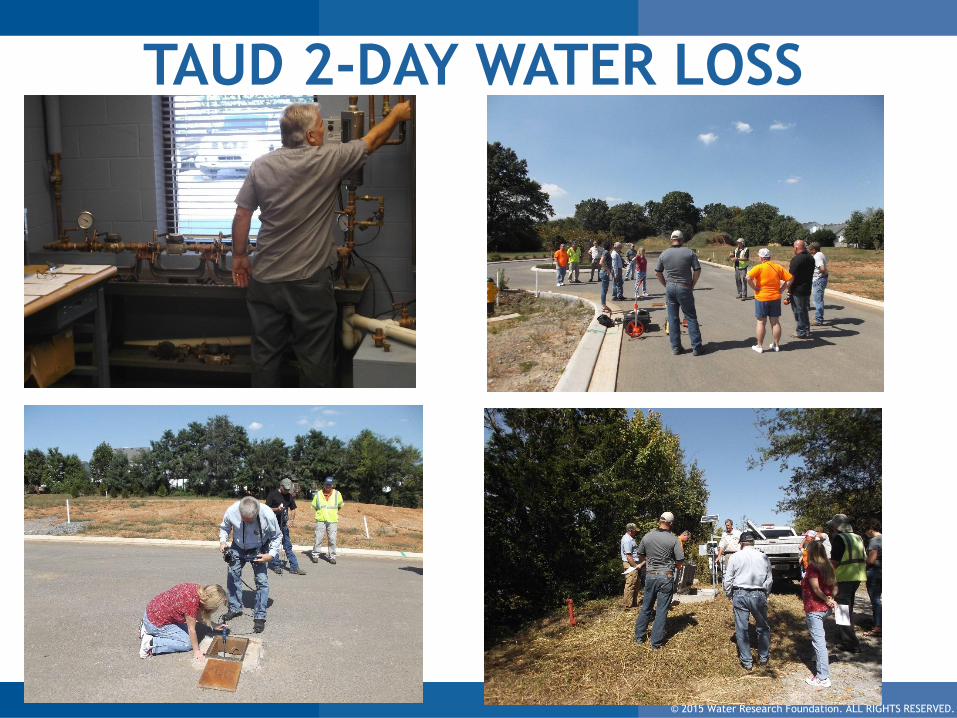
TAUD 2-DAY WATER LOSS
© 2015 Water Research Foundation. ALL RIGHTS RESERVED.
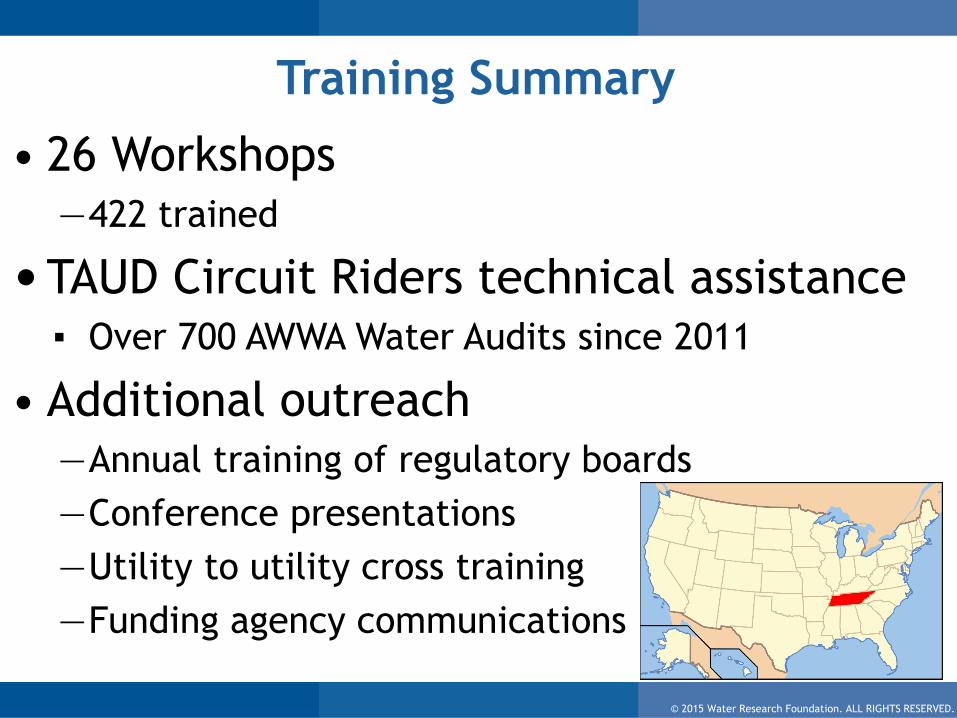
Training Summary
• 26 Workshops—422 trained
•TAUD Circuit Riders technical assistance▪ Over 700 AWWA Water Audits since 2011
• Additional outreach—Annual training of regulatory boards
—Conference presentations
—Utility to utility cross training
—Funding agency communications
© 2015 Water Research Foundation. ALL RIGHTS RESERVED.
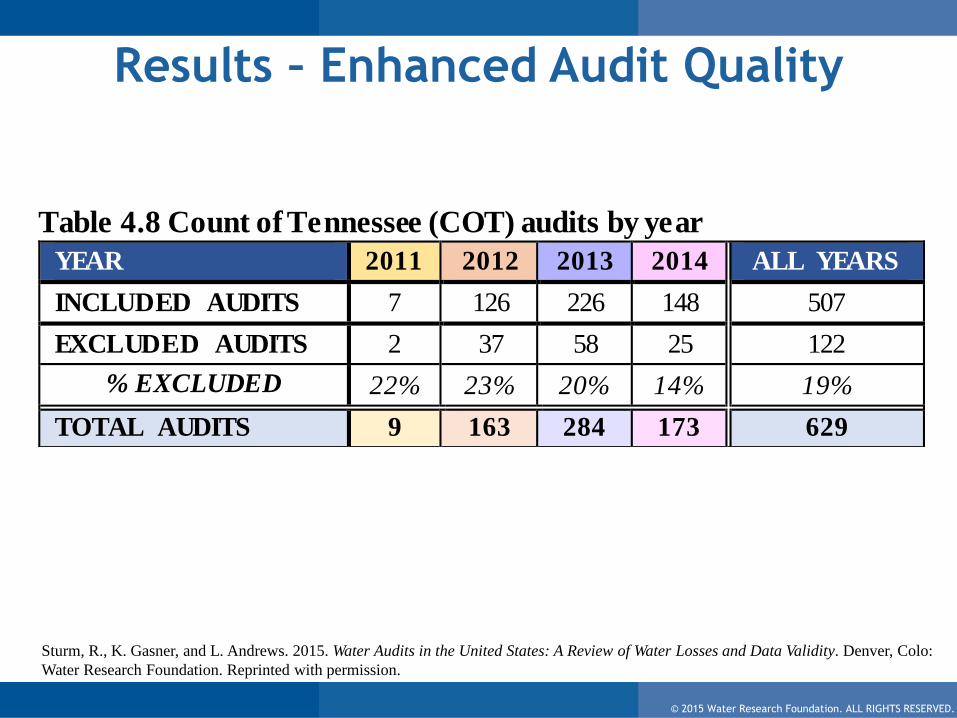
Results – Enhanced Audit Quality
Sturm, R., K. Gasner, and L. Andrews. 2015. Water Audits in the United States: A Review of Water Losses and Data Validity. Denver, Colo:
Water Research Foundation. Reprinted with permission.
Table 4.8 Count of Tennessee (COT) audits by year
YEAR 2011 2012 2013 2014 ALL YEARS
INCLUDED AUDITS 7 126 226 148 507
EXCLUDED AUDITS 2 37 58 25 122
% EXCLUDED 22% 23% 20% 14% 19%
TOTAL AUDITS 9 163 284 173 629

© 2015 Water Research Foundation. ALL RIGHTS RESERVED.
Program Review• Must have organization to do outreach
• Training, training & more training
• Utility presented case studies
• Reliable data challenges
—Data validation
• Financial assistance
—Data validation
—Implementation to reduce losses
• Implementation of available tools
—WRF Real Loss Component Analysis Model
© 2015 Water Research Foundation. ALL RIGHTS RESERVED.© 2015 Water Research Foundation. ALL RIGHTS RESERVED.
Update on AWWA Water Loss Control Committee
Chris Leauber
Chair, AWWA WLCC

© 2015 Water Research Foundation. ALL RIGHTS RESERVED.
AWWA Water Loss Control Committee
• 76 Members
• Seven Subcommittees
—M-36 Publication
—Apparent Losses
—Real Losses
—Outreach & Education
—Strategic Business Planning for Water Loss Control
—Regulatory Practices for Water Audits
—Water Audit Software

© 2015 Water Research Foundation. ALL RIGHTS RESERVED.
WLCC - The Way Forward
• M36 “Water Audits & Loss Control Programs” Fourth
Edition, February 2016
• Continued Outreach & Education
• Water Audit Data Validity
• Production Meter Accuracy
• District Metered Areas/Night Flow Analysis
• Background Leakage
• Pressure Management
• Water-Energy Nexus
• Cost-effective Water Loss Control Planning
© 2015 Water Research Foundation. ALL RIGHTS RESERVED.
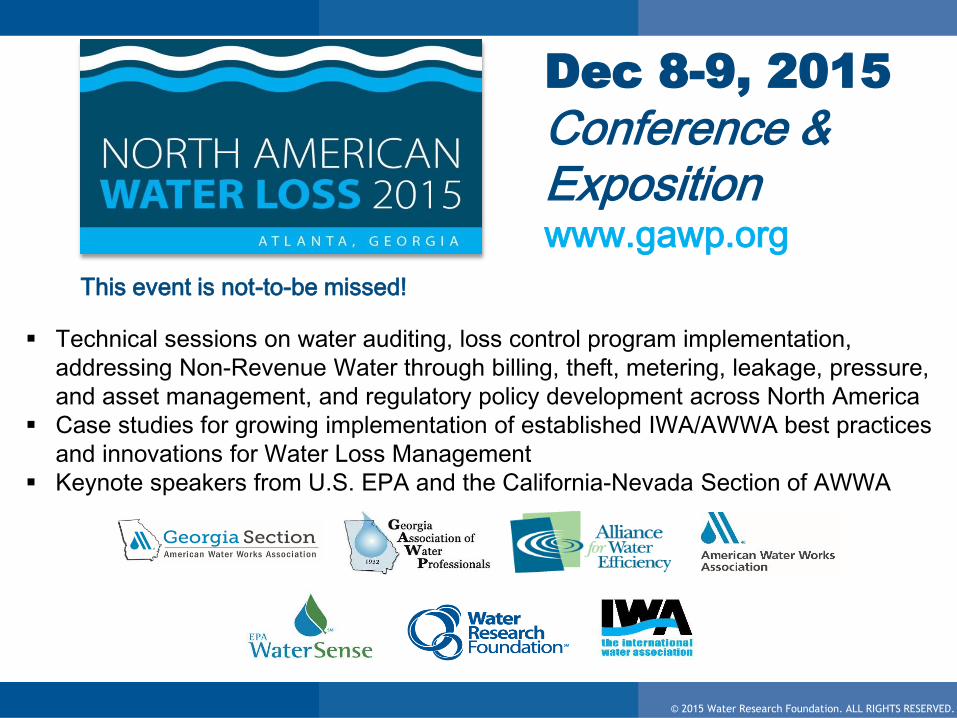
Dec 8-9, 2015
Conference & Expositionwww.gawp.org
Technical sessions on water auditing, loss control program implementation,
addressing Non-Revenue Water through billing, theft, metering, leakage, pressure,
and asset management, and regulatory policy development across North America
Case studies for growing implementation of established IWA/AWWA best practices
and innovations for Water Loss Management
Keynote speakers from U.S. EPA and the California-Nevada Section of AWWA
This event is not-to-be missed!
© 2015 Water Research Foundation. ALL RIGHTS RESERVED.© 2015 Water Research Foundation. ALL RIGHTS RESERVED.
Q&A
© 2015 Water Research Foundation. ALL RIGHTS RESERVED.© 2015 Water Research Foundation. ALL RIGHTS RESERVED.
Thank You!
Comments or questions, please contact:
For more information visit:
www.waterrf.org

© 2015 Water Research Foundation. ALL RIGHTS RESERVED.
WRF Resources - Water Loss Control
Fanner, Sturm, et al. 2007. Evaluating Water Loss and Planning Loss Reduction Strategies, Report 2811.
Fanner, Sturm, et al. 2007. Leakage Management Technologies, Report 2928.
Barfuss et al. 2011. Accuracy of In-Service Water Meters at Low and High Flow Rates, Report 4028.
Hughes et al. 2011. Continuous System Leak Monitoring-From Start To Repair, Report 3183.
Hughes et al. 2014. Pipe Location and Leakage Management for Small Water Systems, Report 4144.
Cunningham et al. 2014. Effects of Weather on Leakage and Bursts, Report 4392.
LeChevallier et al. 2014. Pressure Management: Industry Practices and Monitoring Procedures, Report 4321.
Sturm et al. 2014. Real Loss Component Analysis: A Tool for Economic Water Loss Control, Report 4372a.
Sturm, Gasner and Andrews, 2015. Water Audits in the United States: A Review of Data Validity and Results, Report 4372b.
Ongoing - Project 4639, Establishing Water Utility Guidance And Methodology For Water Audit Validation.
© 2015 Water Research Foundation. ALL RIGHTS RESERVED.
Compilations of Water Audits
Chastain-Howley et al. 2013. Water loss: The North American Dataset. Journal AWWA, 105 (6): 57–60.
Sturm et al. 2014. Real Loss Component Analysis: A Tool for Economic Water Loss Control, Report 4372a. Denver, CO: WRF.
Jernigan. 2014. Trending & Analysis of Validated Water Loss Audits in Georgia. Water Smart Innovations, October 2014.
Sayers, D.A., Najjar, K.F., Barr, J.K. 2015. Analysis of Calendar Year 2012 Water Audit Data from Public Water Supply Systems in the Delaware River Basin. Delaware River Basin Commission. West Trenton, NJ. February 2015.
TODAY’S TALK: Sturm, Gasner and Andrews, 2015. Water Audits in the United States: A Review of Data Validity and Results, Report 4372b. Denver, CO: WRF.
© 2015 Water Research Foundation. ALL RIGHTS RESERVED.
Water Loss Control
Manuals and References
American Water Works Association. 2009. Manual M36 –
Water Audits and Loss Control Programs. 3rd ed. AWWA.
Denver, CO.
• 4th edition to be published Feb 2016
AWWA Water Loss Control Resource Community website
Thornton, Sturm et al. 2008. Water Loss Control, 2nd ed.
McGraw-Hill Professional.