Embed Size (px)
DESCRIPTION
WRAP RMC Phase II Wind Blown Dust Project. ENVIRON International Corporation and University of California, Riverside WRAP Dust Emission Joint Forum Meeting Reno, Nevada July 27, 2004. Outline. Phase I Summary Objectives Methodology Data Sources Results/Limitations Phase II Overview - PowerPoint PPT Presentation
Citation preview

WRAP RMC Phase II Wind Blown Dust Project
ENVIRON International Corporation
and
University of California, Riverside
WRAP Dust Emission Joint Forum Meeting
Reno, Nevada
July 27, 2004

Outline• Phase I Summary
– Objectives– Methodology– Data Sources– Results/Limitations
• Phase II Overview– Objectives– Recent Literature and Models– Revised Methodology– Data Sources– Model Performance Evaluation– Schedule

Phase I Project Summary• Objectives
– Develop general methodology based on ‘MacDougall Method’ – Develop 1996 gridded PM inventory of WB Dust for the Western
States
• Estimation Methodology– Categorize vacant land & soil types (disturbance, vegetative cover,
soil texture)– Identify wind tunnel emission factors– Assign threshold wind velocities, wind & precipitation events,
reservoir characteristics– Apply emission factors to vacant land as a function of wind speed
& soil texture

• Data Sources– Land Use/Land Cover (LULC)
• BELD3, NALCC, NLCD
– Soil Characteristics
• STATSGO; Soil Landscape of Canada; Intl. Soil
Reference and Information Centre
– Meteorological Data
• 1996 36-km MM5
– Agricultural Data
• BELD3; RUSLE2; CTIC

Phase I Results• 20mph 10-meter wind • 15mph 10-meter wind

Phase I Project Summary
• Limitations– Threshold surface friction velocities– Emission factors– Vacant land stability– Dust reservoirs– Rain events– Vegetation density

Phase II Project Overview
• Objectives– Develop improved general methodology based on Phase I
recommendations and recent literature review
– Develop 2002 gridded PM inventory of WB Dust for the Inter-RPO regional modeling domain
– Development of surface friction velocities and threshold friction velocities
– Develop improved emission flux relationships
– Improved characterization of disturbed lands
– Characterize vacant lands using more up-to-date databases
– Conduct model performance evaluation
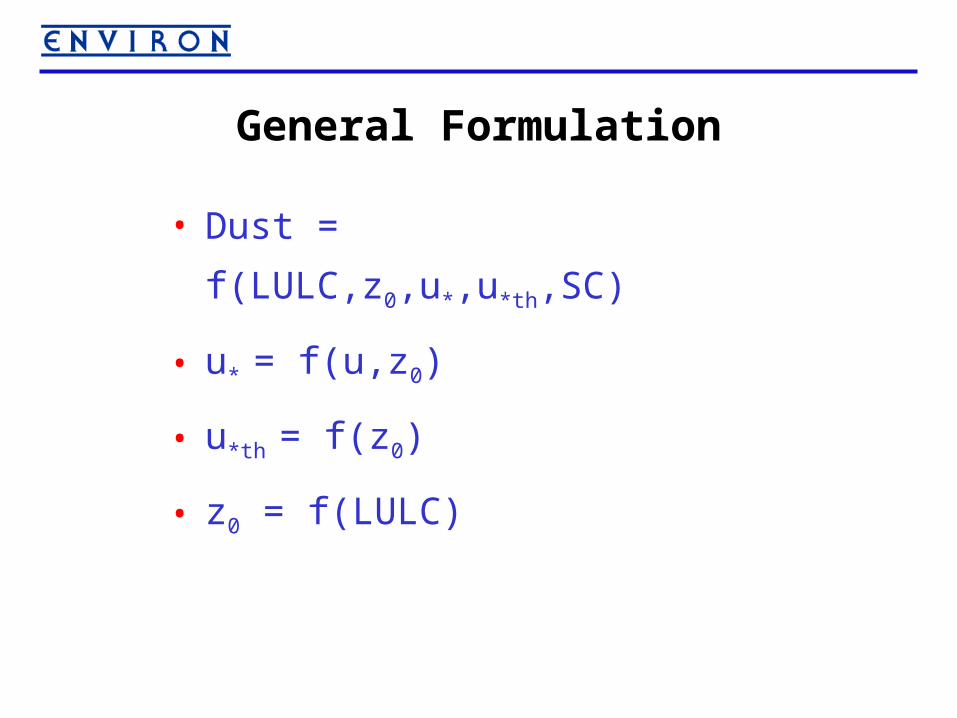
General Formulation
• Dust = f(LULC,z0,u*,u*th,SC)
• u* = f(u,z0)
• u*th = f(z0)
• z0 = f(LULC)

Recent Literature and Models• Draxler, et al., 2001
– Regional model application – Dust emissions a function of u*, u*th, z0
– z0 correlated with soil properties of Persian Gulf region– Assumed all soils disturbed
• Zender, et al., 2003– Global model application – Dust emissions a function of u*, u*th, z0
– Global z0 = 0.01 cm– Uniform soil texture
• Shao, 2001– Dust emissions a function of u*, u*th, z0
– Emphasis on particle size distribution and micro forces

Revised Methodology
• Threshold velocities
• Emission factors
• LULC characteristics
• Soil characteristics
• Reservoir characteristics
• Agricultural adjustments
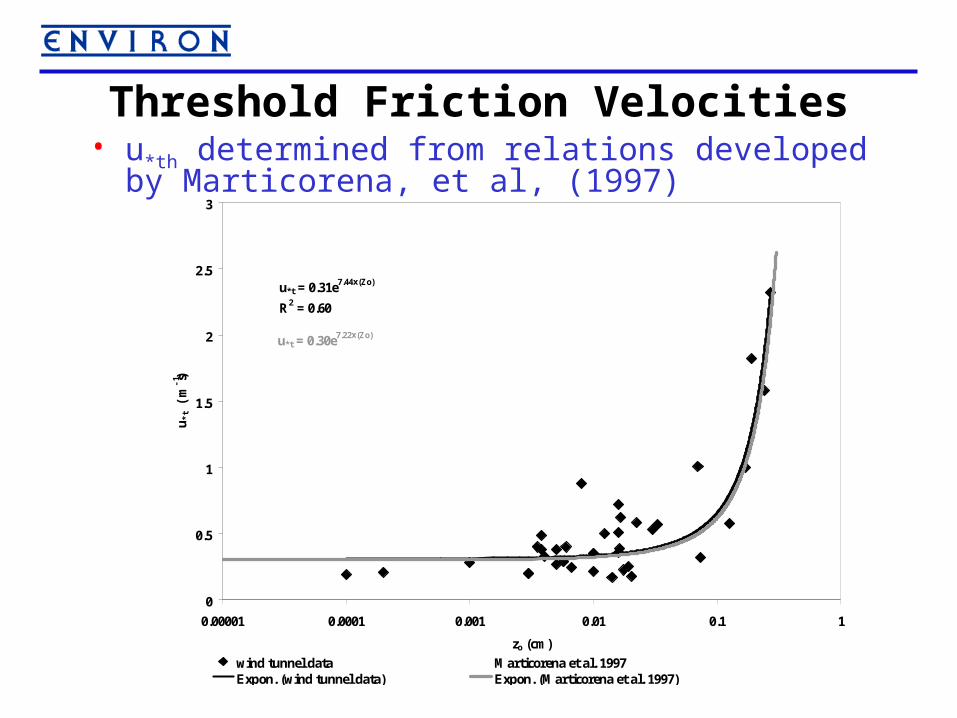
Threshold Friction Velocities• u*th determined from relations developed by Marticorena, et
al, (1997)
u*t = 0.31e7.44x(Zo)
R2 = 0.60
u*t = 0.30e7.22x(Zo)
0
0.5
1
1.5
2
2.5
3
0.00001 0.0001 0.001 0.01 0.1 1
zo (cm)
u*t
(m
s-1
)
wind tunnel data Marticorena et al. 1997Expon. (wind tunnel data) Expon. (Marticorena et al. 1997)

Surface Roughness Lengths
Land Use Type z0 (cm)
Urban 50
USGS cropland/pasture 5
Grassland 0.1
Shrubland 0.05
Forest 50
Barren/Desert 0.002
Bare Agricultural 0.031

Emission Rates• Determined from results of Alfaro and Gomes (2001)• Dependent on soil type
FFS
F = 2.45x10⁻⁶ (u*)3.97
FS
F = 9.33x10⁻⁷ (u*)2.44
MS
F = 1.243x10⁻⁷(u*)2.64
CS
F = 1.24x10⁻⁷ (u*)3.44
0.000000001
0.00000001
0.0000001
0.000001
0.00001
0 0.1 0.2 0.3 0.4 0.5 0.6 0.7 0.8 0.9 1
Friction Velocity (m s-1)
Em
issi
on F
lux
(F, g
cm
-2 s
-1)
FSS
FS
MSCS
Power (FSS)
Power (FS)
Power (MS)Power (CS)

Soil Characteristics• Soil texture mapped to 4 soil groups

Soil CharacteristicsU.S. soil texture Chatenet (1996) Chatenet (1996)
Soil Texture (from Chamley, 1987) Groupings
sand sand CS
loamy sand sand CS
sandy loam silty sand MS
sandy clay loam clayey sand MS
sandy clay clayey sand MS
(medium) loam clayey silty sand MS
clay loam clayey silty sand MS
silty loam clayey sandy silt FS
silty clay loam clayey silt FFS
silt silt FFS
silty clay silty clay FFS
clay sandy clay FS
(10-50% sand, 75-50% clay)
clay sandy silty clay FS
(10-45% sand, 12-45% silt, 35-75% clay)

Soil Characteristics
• Soil disturbance
– Disturbed soils have a greater potential for erosion
– Results in reduced threshold surface friction velocities
– Soils are assumed to be undisturbed
– Assumed percentage of disturbance by land use type
– Threshold velocities reduced from ~20% – 90%

Reservoir Characteristics
• Amount and condition of soils impact dust emissions
• Climatological effects (rain, snow, etc.)
• Sandy soils dry fastest, loams medium range, clays
dry slowest.
• Evapotranspiration rates ~ twice as high in summer
than winter; ~ 1.4 times higher than spring/fall

Reservoir Characteristics
Soil Type Spring/Fall Summer Winter
Sand 3 2.1 4.2
Sandy Loam 3 2.1 4.2
Fine Sand Loam 3 2.1 4.2
Loam 4 2.9 3.8
Silt Loam 4 2.9 3.8
Sandy Clay Loam 4 2.9 3.8
Clay Loam 5 3.6 7.2
Silty Clay Loam 6 4.3 8.6
Clay 7 5 10
# days after precip to re-initiate wind erosion (> 2inches of rain)

Reservoir Characteristics
Soil Type Spring/Fall Summer Winter
Sand 1 0.7 1.4
Sandy Loam 1 0.7 1.4
Fine Sand Loam 1 0.7 1.4
Loam 2 1.4 2.8
Silt Loam 2 1.4 2.8
Sandy Clay Loam 2 1.4 2.8
Clay Loam 3 2 4
Silty Clay Loam 4 2.8 5.6
Clay 5 3.6 7.2
# days after precip to re-initiate wind erosion (< 2inches of rain)

Agricultural Adjustments
• Non-climatic factors significantly decrease soil loss from agricultural lands
• Similar approach to CARB, 1997 (as in Phase I)
• Five “adjustment” factors simulate these effects:– Bare soil within fields
– Bare borders surrounding fields
– Long-term irrigation
– Crop canopy cover
– Post-harvest vegetative cover (residue)

Data Sources
• Land Use/Land Cover
– National Land Cover Database (NLCD)
– Biogenic Emissions Landcover Database (BELD3)
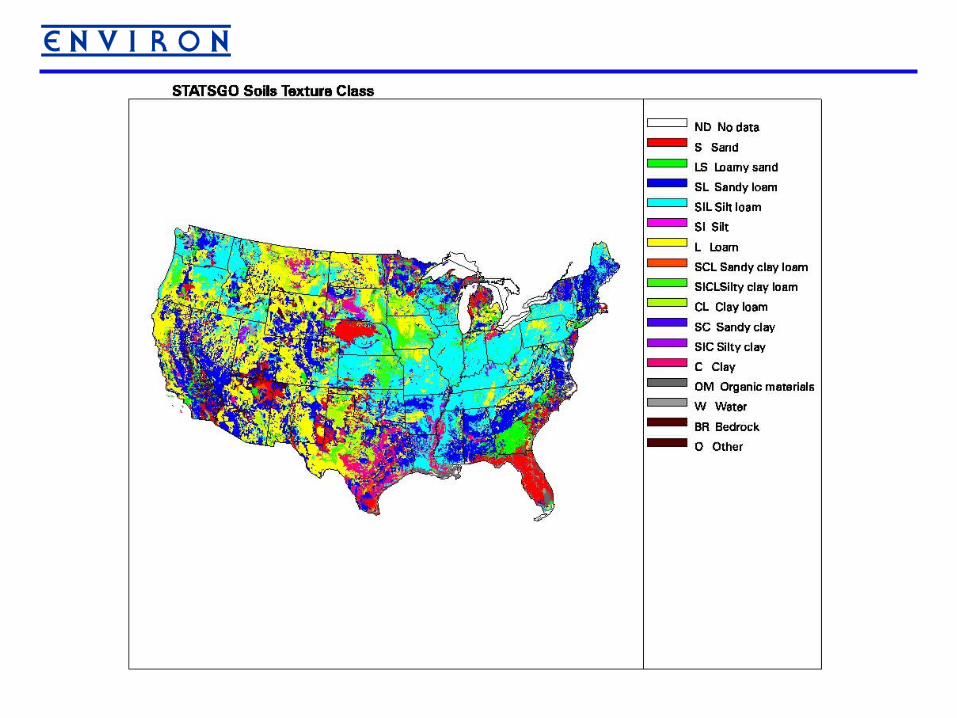
• Soils
– State Soil Geographic Database (STATSGO)
– Soil Landscape of Canada (SLC)
– International Soil Reference and Information Centre
• Meteorology
– 2002 36-km Gridded MM5


NLCD Summary
NLCD Land Use Summary (Continental US)
Land Use Type Total Area (acres) % % excluding waterWater 98,484,739 5.0%Urban 35,629,865 1.8% 1.9%Barren 37,204,176 1.9% 2.0%Forest 556,424,387 28.1% 29.6%Shrubland 355,796,082 18.0% 18.9%Grasslands 302,601,621 15.3% 16.1%Agricultural 515,624,831 26.0% 27.4%Wetlands 78,127,135 3.9% 4.2%Total 1,979,892,836 100.0%
Total excluding water 1,881,408,097 100.0%
Model Performance Evaluation• Evaluate model results for reasonableness and accuracy
• Compare predicted WB dust emissions near IMPROVE monitors with measured IMPROVE dust extinction (Bdust)
– Identify occurrences of:
1) Zero WB dust and near-zero Bdust
2) Enhanced WB dust and near-zero Bdust
3) No WB dust and elevated Bdust
4) Enhanced WB dust and elevated Bdust
• Enhancements to CMAQ to track WB and other dust
• Evaluate model CMAQ model performance with and with out WB dust emissions

Model Performance Evaluation• Refined model performance evaluation using results of
Etyemezian, et al.• For events characterized as wind blown dust events,
determine whether dust model predicts impacts• Model and measurements agree …
– Analyze for trends– Systematic over- or under-prediction ?
• Model and measurements disagree …– Wind speed errors ? – Landuse type mischaracterization ?– Other ?

Project Schedule
• Draft 2002 Dust Emission Inventory: July 30, 2004
• Final 2002 Dust Inventory & Project Report: August 20, 2004
• Initial Model Performance Evaluation Report: August 31, 2004
• Refined Model Performance Evaluation Report: October 31, 2004