Embed Size (px)
Citation preview

Wragg, Christopher (2010) Evaluation of enzymatic techniques for screening amphetamines and alcohol in oral fluid. MSc(R). http://theses.gla.ac.uk/2258/ Copyright and moral rights for this thesis are retained by the author A copy can be downloaded for personal non-commercial research or study, without prior permission or charge This thesis cannot be reproduced or quoted extensively from without first obtaining permission in writing from the Author The content must not be changed in any way or sold commercially in any format or medium without the formal permission of the Author When referring to this work, full bibliographic details including the author, title, awarding institution and date of the thesis must be given
Glasgow Theses Service http://theses.gla.ac.uk/
Evaluation of Enzymatic Techniques for Screening
Amphetamines and Alcohol in Oral Fluid
Thesis Submitted in Accordance with the Requirements of the University of Glasgow
for the Degree of Master of Science (Medical Science)
by
Christopher Wragg
BSc (Hons) AMRSC
Forensic Medicine and Science
September 2010
Copyright © Christopher Wragg 2010

Page i
Acknowledgements
I would like to thank all of the toxicologists, technicians, pathologists, receptionists
and students in the Department of Forensic Medicine and Science at the University
of Glasgow, in particular, my project supervisor, Dr Gail Cooper for all of their help
and support throughout my project. Special thanks also go to Quantum Diagnostics
(Essex, UK) and the Centre for Drug Misuse Research (Glasgow, UK) for providing
oral fluid samples for this project. I would also like to thank my friends, family and
girlfriend, Laura, for their help and support throughout my project.
I would also like to dedicate this thesis to my gran, who sadly lost her battle with
cancer during its completion.

Page ii
Contents
Acknowledgements..................................................................................................... i
Contents......................................................................................................................ii
List of Tables.............................................................................................................vii
List of Figures .......................................................................................................... viii
List of Equations ........................................................................................................ x
List of Appendices......................................................................................................xi
List of Abbreviations..................................................................................................xii
Abstract....................................................................................................................xiv
1 Introduction ......................................................................................................... 1
1.1 Background.................................................................................................. 1
1.2 Oral Fluid ..................................................................................................... 2
1.2.1 Anatomy of Saliva Glands..................................................................... 2
1.2.2 Advantages of Oral Fluid Testing.......................................................... 3
1.2.3 Disadvantages of Oral Fluid Testing..................................................... 4
1.2.4 Applications of Oral Fluid Testing ......................................................... 6
1.3 Abuse of Drugs and Alcohol......................................................................... 8
1.4 Screening Methods .................................................................................... 10
1.4.1 Drugs of Abuse ................................................................................... 10
1.4.2 Alcohol ................................................................................................ 12
1.4.3 Other Screening Methods ................................................................... 13
1.5 Confirmatory Methods................................................................................ 13
1.5.1 Drugs of Abuse (Amphetamines)........................................................ 13
1.5.2 Alcohol ................................................................................................ 14
1.6 Quality Control ........................................................................................... 14
1.7 Quantisal Oral Fluid Collection Device....................................................... 15
Page iii
1.8 Aims and Objectives .................................................................................. 16
2 Evaluation of Multi-Analyte Oral Fluid Controls Using Immunalysis ELISA....... 17
2.1 Materials and Reagents ............................................................................. 17
2.1.1 Enzyme Linked Immunosorbent Assay (ELISA) Test Kits .................. 17
2.1.2 Drug Standards................................................................................... 18
2.1.3 Collection of Blank Oral Fluid.............................................................. 20
2.1.4 Preparation of Calibrators ................................................................... 21
2.1.5 Preparation of Controls ....................................................................... 23
2.1.6 Equipment........................................................................................... 24
2.1.7 Case Samples .................................................................................... 25
2.2 Methods ..................................................................................................... 25
2.2.1 Method of Analysis (ELISA) ................................................................ 25
2.2.2 Data Processing ................................................................................. 27
2.2.3 Method of Analysis (Confirmations) .................................................... 28
2.2.4 GC-MS Conditions.............................................................................. 30
2.2.5 Processing of Results ......................................................................... 31
2.3 Experimental Section ................................................................................. 31
2.3.1 Response of Calibrators ..................................................................... 31
2.3.2 Limit of Detection ................................................................................ 32
2.3.3 Preparation of Shewart-Style Quality Control Charts.......................... 32
2.3.4 Criteria for Acceptability ...................................................................... 32
2.3.5 Stability of Drugs in Oral Fluid ............................................................ 33
2.3.6 Sensitivity and Specificity.................................................................... 33
2.4 Results and Discussion.............................................................................. 34
2.4.1 Calibration........................................................................................... 34
2.4.2 Limit of Detection ................................................................................ 34
Page iv
2.4.3 Stability of Drugs in Neat Oral Fluid.................................................... 36
2.4.4 Stability of Drugs in Diluted Oral Fluid ................................................ 39
2.4.5 Amphetamine and Methamphetamine ELISA Control Chart
Conclusions ...................................................................................................... 47
2.4.6 Amphetamine QC Charts for GC-MS.................................................. 48
2.4.7 Case Samples .................................................................................... 49
2.4.8 Sensitivity and Specificity.................................................................... 52
2.4.9 Case Sample Conclusions.................................................................. 52
3 Alcohol Enzymatic Analysis .............................................................................. 54
3.1 Materials and Reagents ............................................................................. 54
3.1.1 Immunalysis Corporation (Pomona, CA) Oral Fluid Alcohol Kit .......... 54
3.1.2 Ethanol Standards .............................................................................. 54
3.1.3 Reagents ............................................................................................ 56
3.1.4 Materials ............................................................................................. 56
3.1.5 Collection of Neat Oral Fluid ............................................................... 56
3.1.6 Preparation of Calibrators ................................................................... 56
3.1.7 Preparation of Controls ....................................................................... 56
3.1.8 Preparation of Alcohol Internal Standard (1-propanol)........................ 57
3.1.9 Equipment........................................................................................... 57
3.1.10 Case Samples .................................................................................... 58
3.2 Methods ..................................................................................................... 58
3.2.1 Manufacturer�s Instructions for Alcohol Enzymatic Assay................... 58
3.2.2 Method for Alcohol Confirmations....................................................... 59
3.2.3 GC-FID Conditions ............................................................................. 59
3.3 Experimental Section ................................................................................. 60
3.3.1 Response of Calibrators (Linearity) .................................................... 60
Page v
3.3.2 Limit of Detection ................................................................................ 60
3.3.3 Precision ............................................................................................. 60
3.3.4 Preparation of QC Charts ................................................................... 60
3.3.5 Stability of Calibrators ......................................................................... 61
3.3.6 Stability of Alcohol Controls in Oral Fluid ............................................ 61
3.3.7 Sensitivity and Specificity.................................................................... 62
3.4 Results and Discussion.............................................................................. 62
3.4.1 Linearity .............................................................................................. 62
3.4.2 Limit of Detection ................................................................................ 63
3.4.3 Precision ............................................................................................. 64
3.4.4 Stability of Calibrators ......................................................................... 65
3.4.5 Stability of Alcohol Controls in Oral Fluid ............................................ 67
3.4.6 QC Charts........................................................................................... 70
3.5 Case Samples............................................................................................ 71
3.5.1 Confirmed Samples ............................................................................ 71
3.5.2 Unconfirmed Samples......................................................................... 74
3.5.3 Sensitivity and Specificity.................................................................... 74
3.6 Conclusions ............................................................................................... 74
4 Conclusions ...................................................................................................... 77
5 Further Work ..................................................................................................... 79
6 References........................................................................................................ 81
7 Appendices ....................................................................................................... 85
7.1 Appendix 1 � Amphetamine Worksheet..................................................... 85
7.2 Appendix 2 � ELISA Assay Specification................................................... 87
7.2.1 Immunalysis Amphetamine ELISA Specification ................................ 87
7.2.2 Immunalysis Benzodiazepine ELISA Specification ............................. 88
Page vi
7.2.3 Immunalysis Cannabinoid ELISA Specification .................................. 89
7.2.4 Immunalysis Cocaine ELISA Specification ......................................... 90
7.2.5 Immunalysis Methadone ELISA Specification..................................... 91
7.2.6 Immunalysis Methamphetamine ELISA Specification......................... 92
7.2.7 Immunalysis Opiate ELISA Specification............................................ 93
7.3 Appendix 3 � ELISA QC Charts ................................................................. 94
7.3.1 Benzodiazepine Control Charts .......................................................... 94
7.3.2 Cannabinoid Control Charts................................................................ 95
7.3.3 Cocaine Control Charts....................................................................... 97
7.3.4 Methadone Control Charts.................................................................. 98
7.3.5 Opiate Control Charts ....................................................................... 100
7.4 Appendix 4 � Confirmation QC Charts..................................................... 101
7.4.1 Methamphetamine Control Chart...................................................... 101
7.4.2 MDA Control Chart ........................................................................... 102
7.4.3 MDMA Control Chart......................................................................... 102
7.4.4 MDEA Control Chart ......................................................................... 103
7.5 Appendix 5 � Alcohol Assay Specification ............................................... 104
7.6 Appendix 6 � Alcohol Stability Charts ...................................................... 110
7.6.1 0mg/dL Calibrator ............................................................................. 110
7.6.2 25mg/dL Calibrator ........................................................................... 110
7.6.3 80mg/dL Calibrator ........................................................................... 111
Page vii
List of Tables
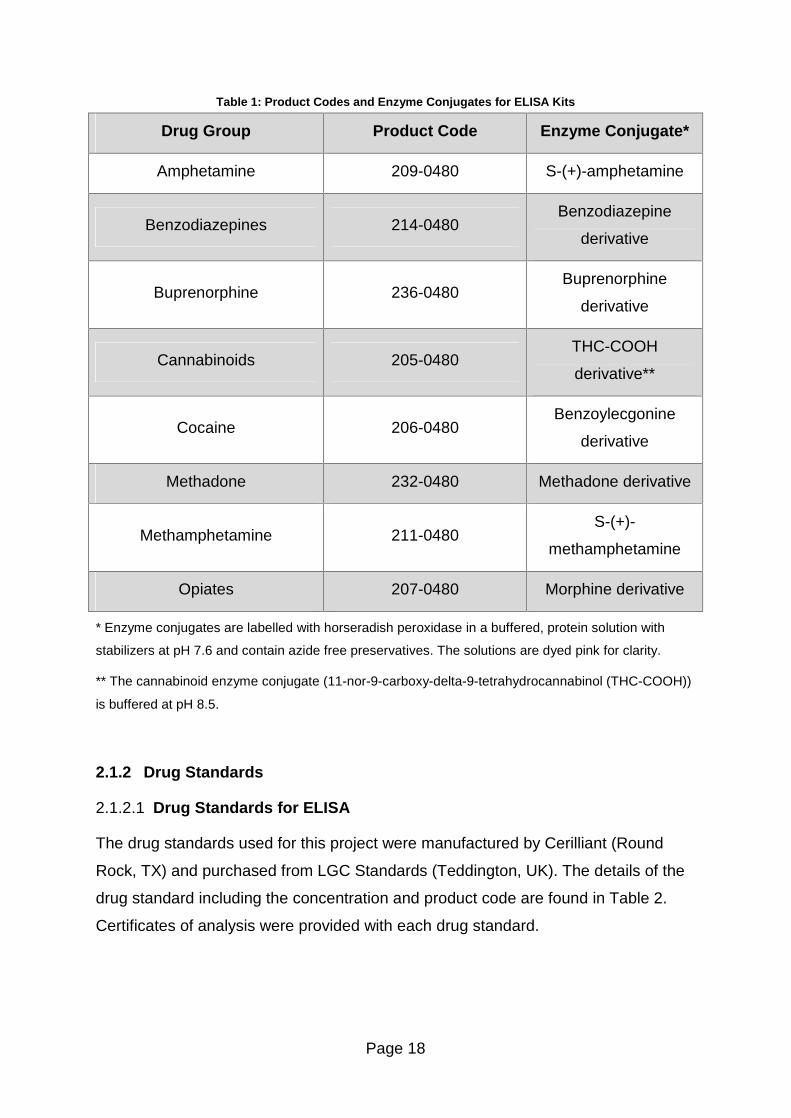
Table 1: Product Codes and Enzyme Conjugates for ELISA Kits ............................ 18
Table 2: Drug Standards for ELISA.......................................................................... 19
Table 3: Drug Standards for Amphetamine Confirmations....................................... 20
Table 4: Internal Standards for Amphetamine Confirmations................................... 20
Table 5: Preparation of ELISA Calibrators ............................................................... 22
Table 6: Preparation of in-house ELISA Controls .................................................... 23
Table 7: Volume of Mixed Amphetamine Standard for Amphetamines Extraction ... 30
Table 8: Ions Monitored in SIM Mode ...................................................................... 31
Table 9: Limit of Detection Results .......................................................................... 35
Table 10: Percentage Binding of Drugs of Abuse in Neat Oral Fluid at the Cut-off
Concentration........................................................................................................... 36
Table 11: Percentage Binding of Drugs of Abuse in Neat Oral Fluid at 50% Below
the Cut-off Concentration ......................................................................................... 36
Table 12: Percentage Binding of Drugs of Abuse in Neat Oral Fluid at 50% Above
the Cut-off Concentration ......................................................................................... 36
Table 13: Cut-off Concentration for Drugs of Abuse in Diluted Oral Fluid ................ 40
Table 14: 50% Below Cut-off Concentration for Drugs of Abuse in Diluted Oral Fluid
................................................................................................................................. 40
Table 15: 50% Above Cut-off Concentration for Drugs of Abuse in Diluted Oral Fluid
................................................................................................................................. 41
Table 16: Results from Amphetamine Confirmations............................................... 50
Table 17: Product Codes for Ethanol Calibrators..................................................... 55
Table 18: Product Codes for Alcohol Controls ......................................................... 55
Table 19: LOD Results............................................................................................. 64
Table 20: Intra- and Inter Day Precision................................................................... 64
Table 21: Confirmation Results for Alcohol Samples ............................................... 72
Page viii
List of Figures
Figure 1: The Saliva Glands courtesy of The Free Dictionary (10) ............................ 3
Figure 2: Alcohol Related Death Rates by sex in the United Kingdom 1991 � 2007
(31)............................................................................................................................. 9
Figure 3: Drug Related Deaths in Scotland 1996 � 2009 (30).................................. 10
Figure 4: Principle of ELISA Courtesy of Pharmaceutical Press (36)....................... 12
Figure 5: Flowchart Showing the ELISA Method...................................................... 26
Figure 6: Flowchart for Confirmation of Amphetamines in Oral Fluid....................... 29
Figure 7: ELISA Control Chart for Amphetamines in Neat Oral Fluid at the Cut-off
Concentration........................................................................................................... 37
Figure 8: ELISA Control Chart for Amphetamines in Neat Oral Fluid at 50% Below
the Cut-off Concentration ......................................................................................... 38
Figure 9: ELISA Control Chart for Amphetamines in Neat Oral Fluid at 50% Above
the Cut-off Concentration ......................................................................................... 39
Figure 10: Cut-off Concentration for Amphetamine in Diluted Oral Fluid ................. 42
Figure 11: 50% Below Cut-off Concentration for Amphetamine in Diluted Oral Fluid
................................................................................................................................. 43
Figure 12: 50% Above Cut-off Concentration for Amphetamine in Diluted Oral Fluid
................................................................................................................................. 44
Figure 13: Cut-off Concentration for Methamphetamine in Diluted Oral Fluid.......... 45
Figure 14: 50% Below Cut-off Concentration for Methamphetamine in Diluted Oral
Fluid ......................................................................................................................... 46
Figure 15: 50% Above Cut-off Concentration for Methamphetamine in Diluted Oral
Fluid ......................................................................................................................... 47
Figure 16: Amphetamine Control Chart.................................................................... 49
Figure 17: Method for Alcohol Screening................................................................. 59
Figure 18: Example of Linearity of Full Calibration................................................... 62
Page ix
Figure 19: Example of Alcohol Oral Fluid Linearity .................................................. 63
Figure 20: Stability of Alcohol Calibrators over a Two Week Period ........................ 65
Figure 21: Calibrator Response versus Time........................................................... 66
Figure 22: Stability of Spiked Oral Fluid Samples Stored in a Refrigerator Over
Fourteen Days.......................................................................................................... 67
Figure 23: Stability of Spiked Oral Fluid Samples Stored at Room Temperature Over
Fourteen Days.......................................................................................................... 68
Figure 24: Stability of Spiked Oral Fluid Samples Stored in the Fridge Over Fourteen
Days ......................................................................................................................... 69
Figure 25: Stability of Spiked Oral Fluid Samples Stored at Room Temperature Over
Fourteen Days.......................................................................................................... 69
Figure 26: Alcohol Control Chart Cut-off Value ........................................................ 70
Figure 27: Alcohol Control Chart 50% Below Cut-off ............................................... 70
Figure 28: Alcohol Control Chart 50% Above Cut-off ............................................... 71

Page x
List of Equations
Equation 1................................................................................................................ 13
Equation 2................................................................................................................ 27
Equation 3................................................................................................................ 33
Equation 4................................................................................................................ 33
Page xi
List of Appendices
Appendix 1 � Amphetamine Worksheet....................................................................85
Appendix 2 � ELISA Assay Specification..................................................................87
Appendix 3 � ELISA QC Charts.................................................................................94
Appendix 4 � Confirmation QC Charts....................................................................101
Appendix 5 � Alcohol Assay Specification...............................................................104
Appendix 6 � Alcohol Stability Charts......................................................................110
Page xii
List of Abbreviations
Abbreviation Definition
AMP Amphetamine
ATS Amphetamine type stimulants
CH3CHO Acetaldehyde
CV Coefficient of Variation
DIP Drug intervention programme
EI Electron Impact
ELISA Enzyme linked immunosorbant assay
EQC External Quality Control
EtOH Ethanol
GC-FID Gas chromatography - flame ionisation detector
GC-MS Gas chromatography mass spectrometry
HPLC High Pressure Liquid Chromatography
IEC International Electrotechnical Commisson
IQC Internal Quality Control
ISO International Organisation for Standardisation
LC-MS-MS Liquid chromatography �mass spectrometry � mass spectrometry
LOD Limit of Detection
Ltd Limited
MAMP Methamphetamine
MDA 3,4-methylenedioxyamphetamine
MDEA 3,4-methylenedioxy-n-ethylamphetamine
Page xiii
Abbreviation Definition
MDMA 3,4-methylenedioxymethamphetamine
NAD Nicotinamide adenine dinucleotide
PFPA Pentafluoropropionic anhydride
PIT Preliminary impairment test
QC Quality Control
RIA Radioimmunoassay
SD Standard Deviation
SIM Selected Ion Monitoring
SPE Solid phase extraction
THC Tetrahydrocannabinol
THC-COOH 11-nor-9-carboxy-delta-9-tetrahydrocannabinol
TMB 3, 3�, 5, 5� tetramethylbenzidine
UK United Kingdom
UKAS United Kingdom Accreditation Service
UKNEQAS United Kingdom National External Quality Assessment Service
Page xiv
Abstract
Evaluations of the Immunalysis enzyme linked immunosorbent assay (ELISA) and
Immunalysis enzymatic assay for ethyl alcohol were undertaken to evaluate their
suitability for screening drugs of abuse (namely amphetamine and
methamphetamine) and alcohol in oral fluid samples collected with the Quantisal
Collection Device. Multi-analyte controls were prepared for the drugs of abuse
screen and diluted with Quantisal buffer prior to analysis to match the dilution in the
Quantisal Oral Fluid Collection Device that was used to collect the samples. These
samples were analysed over time to evaluate stability and case samples were
analysed to evaluate sensitivity and specificity.
Alcohol calibrators and controls were evaluated for linearity and stability before being
applied to case samples to evaluate the sensitivity and specificity of the method.
The amphetamine assay was found to be highly sensitive and specific. The
methamphetamine assay was found to be highly specific but no positive samples
were analysed so the sensitivity could not be evaluated. The multi-analyte controls
were found to be stable over a fourteen month period. The Immunalysis ELISA
assays were found to be suitable for screening oral fluid samples.
The alcohol assay was found to be linear over the 0 � 300mg/dL range and the
calibrators and controls were found to be stable over time. The assay was found to
be highly sensitive and specific and best suited to high throughput laboratories
expecting mainly negative samples. However, it would not be cost effective for
smaller laboratories or those expecting a high number of positives, where going
straight to confirmation by head-space gas chromatography with flame ionisation
detection would be recommended.
Page 1
1 Introduction
1.1 Background
Toxicology is the study of poisons and their effects, and has a wide range of
applications in medicine, law and sport. A poison is defined as any substance,
which either formed in the body or taken into the body can cause an impairment of
health (1, 2). This allows for the fact that almost all substances (including everyday
essentials such as water and oxygen) can act as poisons and impair health if a high
enough dose is taken (2). Other substances such as cyanide can be fatal even if
only a small dose is received. Paracelsus reported this fact in the early 16th century
noting that even medicinal substances could be poisonous if a large quantity was
consumed.
�Alle Dinge sind ein Gift und nichts ist ohne Gift,
nur die Dosis bewirkt, daß ein Ding kein Gift ist.�
�Poison is in everything, and nothing is without poison.
The dosage makes a thing not a poison.�
Paracelsus, 1493-1541
Quotation courtesy of The Handbook of Pesticide Toxicology: Principles (3)
The dose required for toxic effects to be produced is known as the toxic dose but the
actual quantity involved varies between individuals according to a number of factors.
These include height, weight, sex, age, body water content, health, previous
exposure to the drug, tolerance, mood at time the drugs were taken, effects of other
drugs and the route of administration.
Over the years, many matrices have been used to analyse for drugs and poisons in
humans with tissues such as the liver, which have higher concentrations than the
matrices commonly used today, being used for post mortem toxicology. Blood and
urine are presently the most common matrices used in forensic toxicology for drugs
of abuse testing. This is because these matrices are readily available and there is a
lot of published information about typical concentrations of drugs found, thus aiding
interpretation. Other �alternative� matrices which can be used in post mortem
Page 2
toxicology include the brain, liver, lung, muscle, stomach contents, bile, vitreous
humour, hair, oral fluid, sweat and nail clippings. Over the last few decades,
advances in technology has seen better sensitivity of instrumentation and this has
brought hair and oral fluid testing, which typically have lower concentrations of drugs
than the traditional matrices, to the front of the field.
This project will look at the suitability of oral fluid as a testing matrix for the screening
and subsequent confirmation of specifically alcohol and amphetamines.
1.2 Oral Fluid
1.2.1 Anatomy of Saliva Glands
The secretion product of the head and mouth salivary glands is commonly known as
saliva. Between half a litre and one and a half litres of saliva is produced daily from
these glands (4-7). Saliva collected from the mouth also contains small amounts of
gingival crevicular fluid, cellular debris and blood. Saliva is composed of 99% water,
0.3% protein (largely amylase) and 0.3% mucins (5, 8). Saliva glands comprise two
regions, the acinar region which contains the cells capable of secretion and the
ductal region lined with water impermeable cells that carry the secretions to the
outlets in the mouth (8, 9).
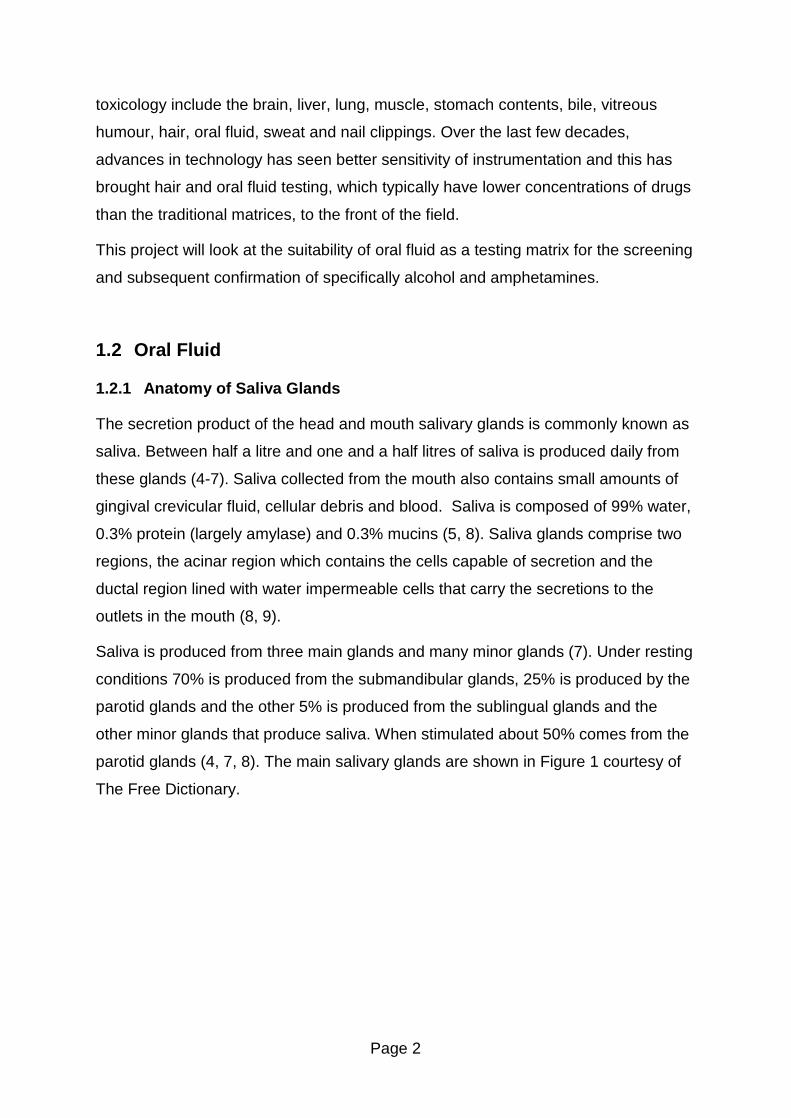
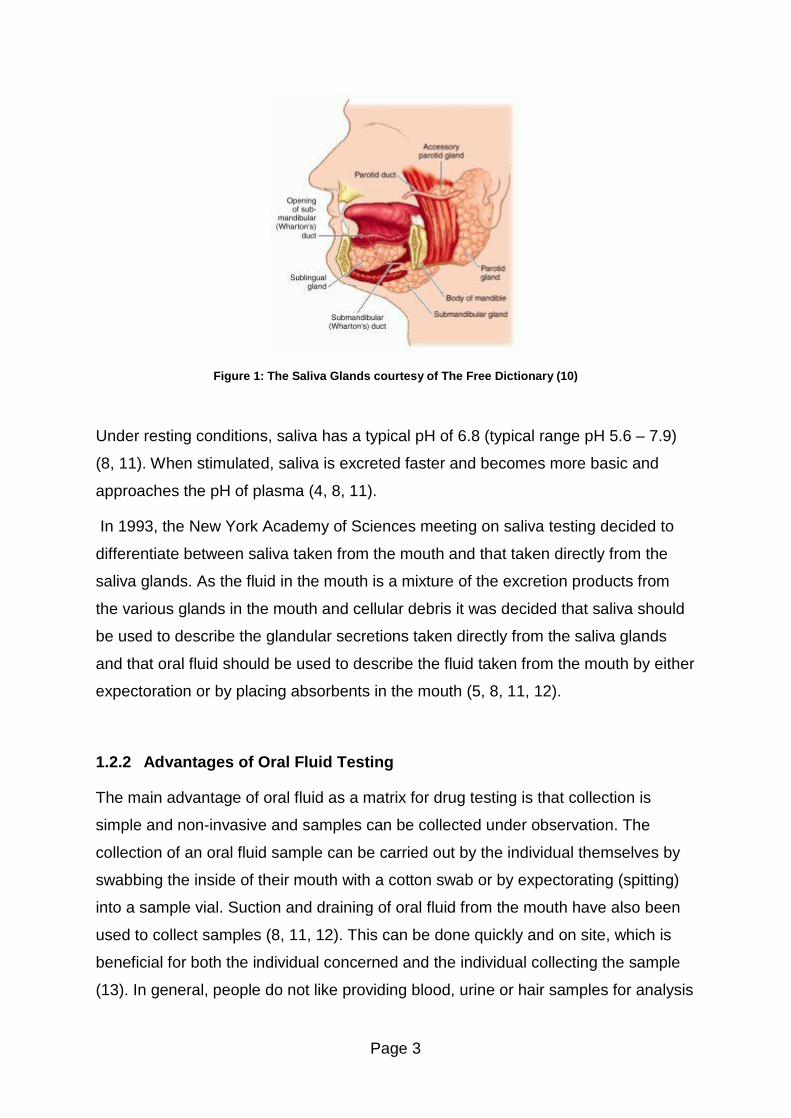
Saliva is produced from three main glands and many minor glands (7). Under resting
conditions 70% is produced from the submandibular glands, 25% is produced by the
parotid glands and the other 5% is produced from the sublingual glands and the
other minor glands that produce saliva. When stimulated about 50% comes from the
parotid glands (4, 7, 8). The main salivary glands are shown in Figure 1 courtesy of
The Free Dictionary.
Page 3
Figure 1: The Saliva Glands courtesy of The Free Dictionary (10)
Under resting conditions, saliva has a typical pH of 6.8 (typical range pH 5.6 � 7.9)
(8, 11). When stimulated, saliva is excreted faster and becomes more basic and
approaches the pH of plasma (4, 8, 11).
In 1993, the New York Academy of Sciences meeting on saliva testing decided to
differentiate between saliva taken from the mouth and that taken directly from the
saliva glands. As the fluid in the mouth is a mixture of the excretion products from
the various glands in the mouth and cellular debris it was decided that saliva should
be used to describe the glandular secretions taken directly from the saliva glands
and that oral fluid should be used to describe the fluid taken from the mouth by either
expectoration or by placing absorbents in the mouth (5, 8, 11, 12).
1.2.2 Advantages of Oral Fluid Testing
The main advantage of oral fluid as a matrix for drug testing is that collection is
simple and non-invasive and samples can be collected under observation. The
collection of an oral fluid sample can be carried out by the individual themselves by
swabbing the inside of their mouth with a cotton swab or by expectorating (spitting)
into a sample vial. Suction and draining of oral fluid from the mouth have also been
used to collect samples (8, 11, 12). This can be done quickly and on site, which is
beneficial for both the individual concerned and the individual collecting the sample
(13). In general, people do not like providing blood, urine or hair samples for analysis
Page 4
as they feel this is an invasion of their privacy (8). Urine samples can be easily
adulterated or switched to avoid the detection of drugs, as the sample collection
cannot be easily witnessed. This is not the case with oral fluid as there is a waiting
time before sample collection in which any adulterants in the mouth will have been
swallowed, diluted or expectorated (8). Also, the fact that sample collection is
witnessed means the possibility of switching the sample to a sample known to be
free from drugs is greatly reduced.
Oral fluid provides information about recent drug use (i.e. drugs taken within a few
hours of the sample being collected and up to 48 hours after use for some drugs)
due to the short window of detection. As a consequence, oral fluid provides a good
indication of the drugs that were present in the blood stream at the time of collection
and therefore has the potential to provide information relating to the effects the
individual was experiencing at the time of collection (8).
Another advantage is that the concentration of drugs in oral fluid can be related to
the concentration of drugs in plasma. Drugs found in oral fluid are typically the non-
ionised, unbound parent drug. Since it is the free lipophilic drug and drug metabolites
that can cross cell membranes, such as the blood � brain barrier, and cause
physiological effects, free drug concentrations in plasma and in oral fluid can
potentially be correlated with drug effects (5). Cone et al (14) found that for cocaine,
the saliva concentrations correlated well with effects. In a separate study, Cone et al
(15) stated that amphetamine in oral fluid parallels the plasma drug concentration. In
contrast, many papers state that there is no correlation between oral fluid and
plasma drug concentrations. Schepers et al (16) found a poor correlation between
the oral fluid and plasma concentrations for amphetamine and methamphetamine.
The results supported those from an earlier study by Cook et al (17). In 2007, Willie
et al (18) carried out a multi � drug study on oral fluid: blood ratios from drivers
suspected of driving under the influence of drugs and found the ratios to be highly
variable.
1.2.3 Disadvantages of Oral Fluid Testing
As oral fluid is a biological fluid, it has the potential to transmit infectious diseases.
Thus samples need to be handled with care like other biological fluids such as blood
Page 5
and urine. Saliva production is reduced by some drugs, both prescription drugs (such
as amitryptaline and paracetamol) and illicit drugs (such as amphetamine), drugs
which block the central nervous system, and also by some medical conditions,
including stress and diabetes (5, 7, 8, 11).This can make collection of oral fluid
samples from individuals who fall into these categories difficult. There are also some
individuals who are repulsed by spitting and thus rules out the use of expectoration
methods for the collection of oral fluid.
Although this is also classed as an advantage, another drawback with oral fluid
testing is the short window of detection (8). Drugs with short half lives or those which
are rapidly metabolised will not be detectable in oral fluid for a long period of time, as
it is generally the parent drug that is found in oral fluid. As a result, in cases of those
suspected of being under the influence of drugs it is vital that the oral fluid sample is
collected as soon as possible to maximise the chance of detection. The generally
accepted window of detection of oral fluid is from the time of administration to
approximately four half lives after it enters the body (5). The half-life of a drug is the
time taken for its concentration to decrease by a half.
One of the biggest drawbacks with oral fluid testing is the small volume of sample
collected (8). Many collection devices will only allow approximately 1mL of sample to
be collected which, if many analyses are required, can present a problem. Many
collection devices also dilute this 1mL of sample with buffer which can present a
problem if the drugs are present at a low concentration, as it may be approaching the
limit of detection of the analytical instrumentation. This problem was recently
highlighted in a study by Gjerde et al, who carried out a large scale drug and alcohol
study in Norway using the Statsure oral fluid collection device (19). This device used
a collection pad to collect (up to) 1mL of oral fluid and diluted it with 1mL buffer. The
authors reported that they were unable to recover 1mL of the oral fluid/buffer mixture
meaning in most cases they had less than 1mL of sample to analyse (19).
Another disadvantage relates to recent administration of a drug in oral form as
residue from smoking or small fragments of the drug may remain in the mouth and
as such will contaminate the oral fluid sample and give a much higher concentration
of the drug than is actually present (11).
Page 6
1.2.4 Applications of Oral Fluid Testing
With drug testing becoming more widespread, companies such as those involved in
drug maintenance programs, many private companies who offer drug testing for
employers and the police (roadside and as part of the drug interventions program
(DIP)), have been looking to move towards oral fluid testing as a method for drug
testing as it is easier to collect than other matrices. The police for example can
collect an oral fluid sample at the roadside rather than having to take the suspect to
the station to provide a blood or urine sample which wastes time and money. The
DIP programme tests those arrested for certain offences and aims to identify those
taking drugs and giving them the option of deferring a prison sentence by enrolling
them in drug treatment programmes. The test results from the DIP programme are
not used in court against the suspect. As part of health and safety regulations
employers are able to test employees for the presence of alcohol or drugs only if
consent is given and there is a genuine reason for the test (20). Employers are
required to have a policy on drug and alcohol testing if they wish to carry out such
tests. Not all companies have such a policy in place, but areas such as the transport
and manufacturing sectors, where intoxication could endanger the lives of others,
are most likely to have one in place.
While a policy on workplace drug testing or consent is required for drug testing in
most cases, it is a legal requirement in certain areas, such as the public transport
industry. The Transport and Works Act 1992 (21) states that it is an offence for
anyone working on public transport systems to be intoxicated while at work.
As a result of the current recession, many companies which have not had a legal
requirement to carry out workplace testing have started to test employees in an effort
to dismiss them from their job without redundancy pay in a bid to save costs (22).
Many people argue that an employee�s human rights to privacy may be breached if
testing is carried out using urine and hair, as they have longer windows of detection
and as such do not reflect what, if any, effects the person is currently experiencing
whilst at work. The longer windows of detection from these matrices could detect any
recreational use of drugs out-with working hours that can be argued, are not
affecting the person during work hours.
Page 7
Drug maintenance programmes are used to monitor a person�s abstinence from
drugs. This may be for many reasons with child custody cases and conditions of bail
being amongst the most common reasons. Drug maintenance programmes are also
used to monitor those on the methadone programme to ensure that they are not
continuing to abuse heroin while on methadone and to ensure that they are indeed
taking their methadone and not selling it to provide money for other drug habits.
The police in England and Wales also use oral fluid drug testing as a way of getting
drug users who have been arrested for trigger crimes into treatment. Tests are
routinely carried out on those who are arrested for petty crimes such as burglary or
theft as part of the drug interventions programme (DIP) (23). This initiative aims to
reduce crime carried out by drug abusers by getting them into treatment and the
indications are that it has been working with a report published in November 2007
indicating a 26% reduction in crime by those entering DIP (24).
To test for alcohol intoxication at the roadside, the police use a hand-held
breathalyzer, however there is currently no equivalent hand-held device approved to
test for drug use at the roadside. Several collection devices have been tested over
the years but as yet none has been deemed acceptable for roadside testing (11).
The preliminary impairment test (PIT) is used to determine if a person is unfit to drive
through drug intoxication and involves a series of simple tests and the measurement
of pupil size. Technology is constantly evolving and in 2008 a British-based company
announced they would be releasing a new handheld oral fluid drug testing device
(25). The device will be unveiled in November 2010 and will undergo performance
evaluation tests before being made commercially available but the manufacturers
hope that the device will meet any criteria set out by the British government for
roadside drug testing devices (26). The North Review, published by the Department
of Transport in June 2010, states that the government is looking to implement a
device that can detect drugs in oral fluid (27). British police were given the power to
carry out preliminary impairment tests on drivers suspected of using drugs in 2003,
but as yet no suitable device for such a test exists. Section 6C of the Railways and
Transport Safety Act 2003 (28) states that:
�A preliminary drug test is a procedure by which a specimen of sweat or saliva is�
(a) obtained, and
Page 8
(b) used for the purpose of obtaining, by means of a device of a type approved by
the Secretary of State, an indication whether the person to whom the test is
administered has a drug in his body.�
The Home Office Scientific Development Branch stated that �there is currently no
type approval specification for roadside screening devices to detect drugs and so
they cannot be used for enforcement purposes� and that they were working with
external agencies on the specification and design of a suitable device (29). They
went on to state that �it will be a couple of years before our multi-drug device is
available and type-approved for use as the scientific development work behind it is
highly complex� (29).
1.3 Abuse of Drugs and Alcohol
Drug and alcohol abuse is a growing problem in the United Kingdom (30, 31).
Alcohol is the most commonly abused substance in the United Kingdom although
drugs such as cannabis are also widely abused. According to the world drug report
2009, Scotland was the amphetamine abuse capital of Europe with 2.2% of the
population (2006 data) abusing amphetamines and amphetamine type stimulants
(ATS) (excluding ecstasy) (32). Recently published data in the world drug report
2010 indicates that the Czech Republic has now overtaken Scotland as the
amphetamine and amphetamine type stimulants (ATS) (excluding ecstasy) capital of
Europe, as use in Scotland has dropped to 1.4% (2009 data) (33). Scotland also has
the second highest rate of ecstasy abuse in Europe at 2.5% of the population (2009
data), down from 3.2% in 2006, with only the Czech Republic having a higher rate at
3.6% (2008 data) (3.5% in 2004) (32, 33). Scotland has a higher rate of
amphetamine and ATS abuse than England and Wales (1.4% in Scotland compared
to 1.0% in England and Wales (2009 data)) (33). Scotland also has a higher rate of
ecstasy abuse than England and Wales (2.5% in Scotland compared to 1.8% in
England and Wales (2009 data)) (33).
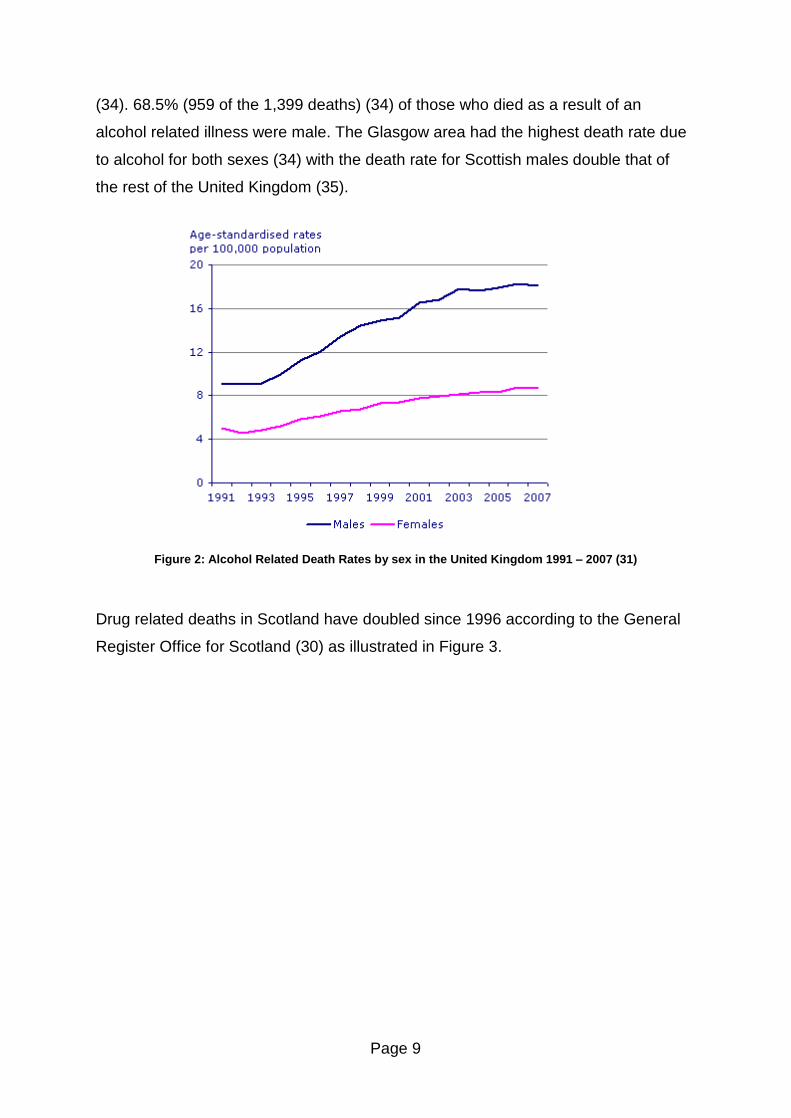
Alcohol related deaths in the United Kingdom have doubled between 1991 and 2007
according to the office for national statistics (31) as illustrated in Figure 2.
In 2007 there were 1,399 deaths which listed alcohol as the underlying cause of
death in Scotland with a further 966 listing alcohol as a contributory cause of death
Page 9
(34). 68.5% (959 of the 1,399 deaths) (34) of those who died as a result of an
alcohol related illness were male. The Glasgow area had the highest death rate due
to alcohol for both sexes (34) with the death rate for Scottish males double that of
the rest of the United Kingdom (35).
Figure 2: Alcohol Related Death Rates by sex in the United Kingdom 1991 � 2007 (31)
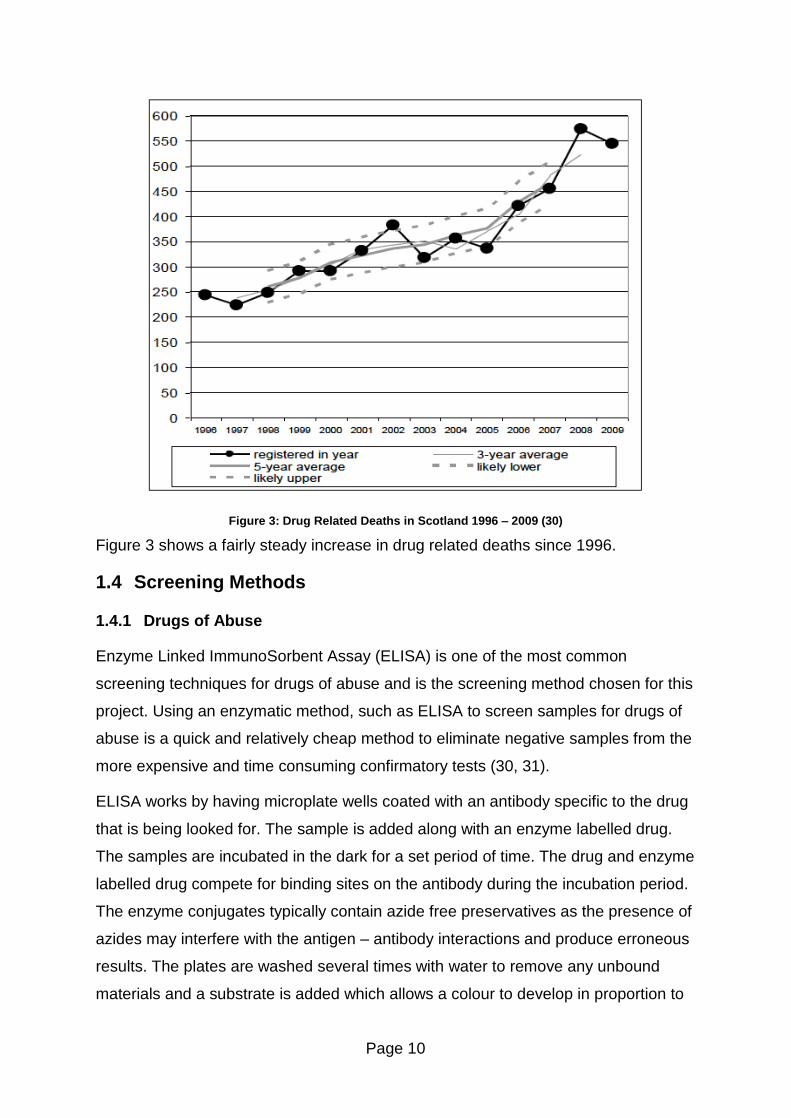
Drug related deaths in Scotland have doubled since 1996 according to the General
Register Office for Scotland (30) as illustrated in Figure 3.
Page 10
Figure 3: Drug Related Deaths in Scotland 1996 � 2009 (30)
Figure 3 shows a fairly steady increase in drug related deaths since 1996.
1.4 Screening Methods
1.4.1 Drugs of Abuse
Enzyme Linked ImmunoSorbent Assay (ELISA) is one of the most common
screening techniques for drugs of abuse and is the screening method chosen for this
project. Using an enzymatic method, such as ELISA to screen samples for drugs of
abuse is a quick and relatively cheap method to eliminate negative samples from the
more expensive and time consuming confirmatory tests (30, 31).
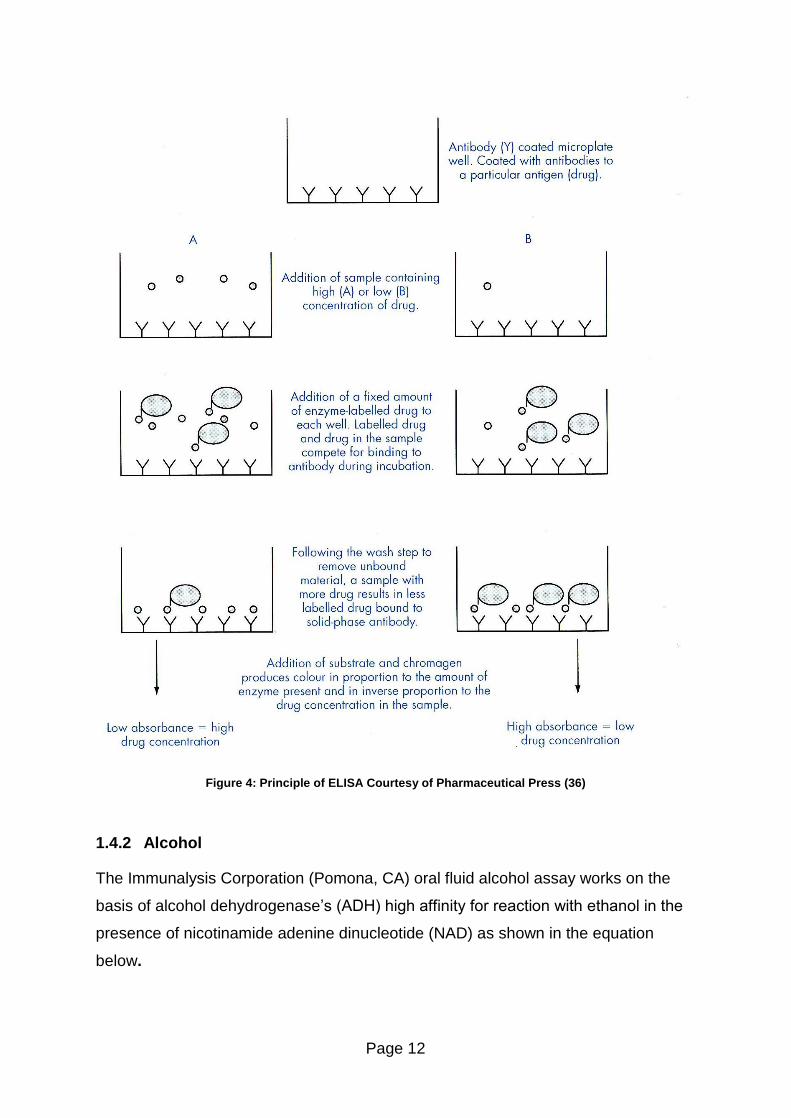
ELISA works by having microplate wells coated with an antibody specific to the drug
that is being looked for. The sample is added along with an enzyme labelled drug.
The samples are incubated in the dark for a set period of time. The drug and enzyme
labelled drug compete for binding sites on the antibody during the incubation period.
The enzyme conjugates typically contain azide free preservatives as the presence of
azides may interfere with the antigen � antibody interactions and produce erroneous
results. The plates are washed several times with water to remove any unbound
materials and a substrate is added which allows a colour to develop in proportion to
Page 11
the amount of enzyme present (and inversely proportional to the concentration of
drug in the sample well). The samples are incubated for a set period of time in the
dark. After this incubation period, a stop solution (typically an acid) is added to
destroy any unbound substrate and prevent further reaction. The colour of the
solution is changed by the addition of the stop solution. The absorbance of the plates
is then read. The process taking place in the wells is shown in Figure 4.
Page 12
Figure 4: Principle of ELISA Courtesy of Pharmaceutical Press (36)
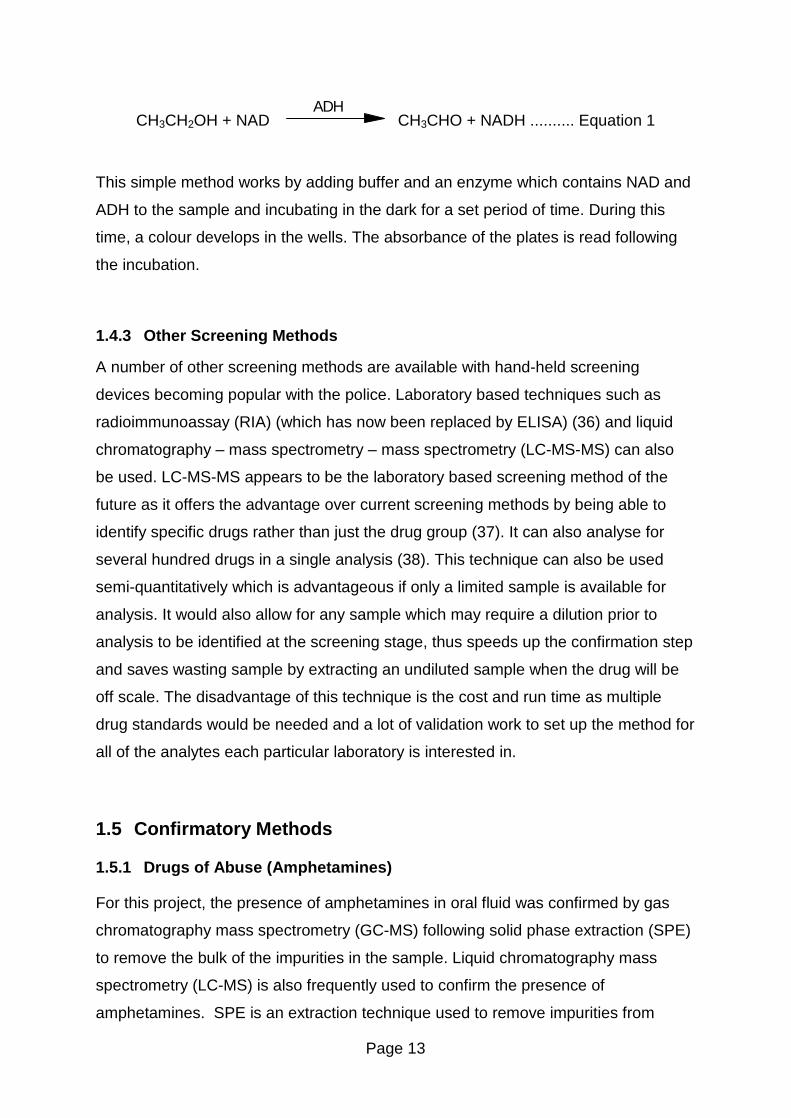
1.4.2 Alcohol
The Immunalysis Corporation (Pomona, CA) oral fluid alcohol assay works on the
basis of alcohol dehydrogenase�s (ADH) high affinity for reaction with ethanol in the
presence of nicotinamide adenine dinucleotide (NAD) as shown in the equation
below.
Page 13
CH3CH2OH + NAD ADH
CH3CHO + NADH .......... Equation 1
This simple method works by adding buffer and an enzyme which contains NAD and
ADH to the sample and incubating in the dark for a set period of time. During this
time, a colour develops in the wells. The absorbance of the plates is read following
the incubation.
1.4.3 Other Screening Methods
A number of other screening methods are available with hand-held screening
devices becoming popular with the police. Laboratory based techniques such as
radioimmunoassay (RIA) (which has now been replaced by ELISA) (36) and liquid
chromatography � mass spectrometry � mass spectrometry (LC-MS-MS) can also
be used. LC-MS-MS appears to be the laboratory based screening method of the
future as it offers the advantage over current screening methods by being able to
identify specific drugs rather than just the drug group (37). It can also analyse for
several hundred drugs in a single analysis (38). This technique can also be used
semi-quantitatively which is advantageous if only a limited sample is available for
analysis. It would also allow for any sample which may require a dilution prior to
analysis to be identified at the screening stage, thus speeds up the confirmation step
and saves wasting sample by extracting an undiluted sample when the drug will be
off scale. The disadvantage of this technique is the cost and run time as multiple
drug standards would be needed and a lot of validation work to set up the method for
all of the analytes each particular laboratory is interested in.
1.5 Confirmatory Methods
1.5.1 Drugs of Abuse (Amphetamines)
For this project, the presence of amphetamines in oral fluid was confirmed by gas
chromatography mass spectrometry (GC-MS) following solid phase extraction (SPE)
to remove the bulk of the impurities in the sample. Liquid chromatography mass
spectrometry (LC-MS) is also frequently used to confirm the presence of
amphetamines. SPE is an extraction technique used to remove impurities from
Page 14
samples to stop them interfering with the chromatography on the instrument.
Cartridges have a silica based packing material and the analytes of interest bind to it
allowing the impurities to be washed out. The analytes of interest are then selectively
eluted without the impurities. In the case of amphetamines the samples were
derivatised (in this instance, with pentafluoropropionic anhydride (PFPA)) to improve
the chromatography. The internal standards, used to quantify the drug
concentrations, were deuterated analogues of each of the analytes of interest.
Deuterated standards will have similar retention times as the standards themselves
and allows for easier identification.
1.5.2 Alcohol
The presence of alcohol in oral fluid samples was confirmed by using headspace gas
chromatography with a flame ionisation detector (GC-FID). For this project, the
standards and controls were diluted with Quantisal buffer (one part sample, three
parts buffer) to match the dilution in the oral fluid collection device. A semi-automatic
diluter was used to dilute the standards, controls and case samples with internal
standard in clearly labelled headspace vials. All samples were analysed in duplicate.
The vials were capped and placed in the carousel for analysis by headspace GC-
FID.
1.6 Quality Control
Although there is no formal requirement for drug testing laboratories in the United
Kingdom to have accreditation to the international testing standard, ISO/IEC 17025,
many laboratories that carry out the testing do have this accreditation, however, only
a limited number have accreditation for oral fluid testing. As part of quality control
measures, there are various proficiency testing schemes in operation in the UK
which accredited laboratories must participate in. However, these generally focus on
the traditional matrices used in forensic toxicology such as blood and urine. As part
of the proficiency testing scheme, spiked samples are sent to the accredited
laboratories to ensure that they are correctly identifying the drugs present and
accurately quantifying the concentrations in the sample. The concentration of the
drugs in the sample is not given to the testing laboratories until after they have
Page 15
submitted their results for the samples. Samples similar to this are commercially
available as external quality controls (EQC�s) but these samples detail the
concentrations of the drugs present. At present, the EQC�s are widely available for
traditional matrices such as blood and urine with only a limited number being
available for other matrices, such as oral fluid, and thus making internal quality
controls (IQC�s) very important in oral fluid testing. IQC�s are control samples for the
desired analytes that are prepared in-house to a known concentration and serve the
same purpose as the EQC�s. In order to gain accreditation to ISO/IEC 17025,
laboratories must meet certain requirements. These include the validation of
methods to ensure they are robust and fit for purpose, in addition to having standard
operating procedures for all aspects of the testing process. A quality control system
should be implemented and as there are currently no external quality control
schemes available for oral fluid, the quality control samples must therefore be
prepared in-house. The United Kingdom National External Quality Assessment
Service (UKNEQAS) has a proficiency testing scheme that is currently being piloted
for oral fluid testing but this is only at the developmental stage and has not been fully
rolled out as yet. Schewart style quality control charts will be used to monitor the
results of the IQC�s and EQC�s.
1.7 Quantisal Oral Fluid Collection Device
The Quantisal oral fluid collection device was used to collect oral fluid samples for
this project. The device has a pad with a volume adequacy indicator that turns blue
when 1mL of oral fluid has been collected. The pad is then stored in 3mL of
Quantisal buffer to give a total volume of 4mL. Filters can be used to squeeze the
fluid out of the pad and allow the oral fluid/buffer mixture to be transferred to labelled
vials prior to analysis. A study by Langel et al showed the Quantisal device had
recoveries in excess of 80% for amphetamine, 3,4-
methylenedioxymethamphetamine (MDMA) and ethanol (39).
Page 16
1.8 Aims and Objectives
The aims of this project were to evaluate a commercially available ELISA assay for
drugs of abuse, in particular, amphetamine and methamphetamine in oral fluid and
to evaluate a commercially available enzymatic assay for ethanol in oral fluid.
To evaluate the ELISA assay, multi-analyte controls were prepared and analysed
over time to evaluate the stability of the controls and assess the suitability of the
assays. To make the method more time and cost effective, the oral fluid samples
were evaluated using the same ELISA method that is presently used in-house for
other matrices (e.g. blood and urine) to allow oral fluid samples to be screened within
the same batch as other matrices. The method was then applied to case samples
collected with a commercially available oral fluid collection device and any
amphetamine or methamphetamine positives will be confirmed using the in-house
confirmation method of analysis by gas chromatography mass spectrometry (GC-
MS). Some negative samples were also confirmed to allow the sensitivity and
specificity of the assay to be evaluated. Confirmations for other drug groups were not
carried out during this project as there is not a validated in-house method for these
drugs in oral fluid.
To evaluate the enzymatic assay for ethanol in oral fluid, ethanol controls were
prepared and analysed over time to evaluate the stability of the controls and assess
the suitability of the assay. The method was then applied to case samples collected
with a commercially available oral fluid collection device and any positives confirmed
for alcohol using the in-house confirmation method of analysis by headspace gas
chromatography flame ionisation detector (headspace GC-FID). Some negative
samples were also confirmed to allow the sensitivity and specificity of the assay to
be evaluated.
Page 17
2 Evaluation of Multi-Analyte Oral Fluid Controls Using
Immunalysis ELISA
2.1 Materials and Reagents
The following materials and reagents were used in this project.
2.1.1 Enzyme Linked Immunosorbent Assay (ELISA) Test Kits
Drugs of abuse testing kits for each of the drugs of interest were manufactured by
Immunalysis Corporation (Pomona, CA) and purchased from their UK distribution
company, Agriyork 400 Ltd (Pocklington, UK). The product code for each kit is
detailed in Table 1. Each kit contained all the necessary reagents for the analysis,
including an enzyme conjugate, a substrate solution and a stop solution. The
substrate solution for all of the assays was 3, 3�, 5, 5� tetramethylbenzidine (TMB)
and urea peroxidase in buffer. The stop solution (1M hydrochloric acid) was the
same for all assays. The enzyme conjugate for each assay is different and detailed
in Table 1. The manufacturer�s specification for each assay is given in Appendix 2 �
ELISA Assay Specification.
The calibrators were diluted with 100mM phosphate buffer solution (product code:
PBS-1000) and Quantisal dilution buffer (product code: EXTBUF-1000) was used to
dilute oral fluid controls. These buffers were also manufactured by Immunalysis
Corporation (Pomona, CA) and purchased from their UK distribution company,
Agriyork 400 Ltd (Pocklington, UK). The assays and buffers were stored at or below
8°C in the refrigerator.
Page 18
Table 1: Product Codes and Enzyme Conjugates for ELISA Kits
Drug Group Product Code Enzyme Conjugate*
Amphetamine 209-0480 S-(+)-amphetamine
Benzodiazepines 214-0480 Benzodiazepine
derivative
Buprenorphine 236-0480 Buprenorphine
derivative
Cannabinoids 205-0480 THC-COOH
derivative**
Cocaine 206-0480 Benzoylecgonine
derivative
Methadone 232-0480 Methadone derivative
Methamphetamine 211-0480 S-(+)-
methamphetamine
Opiates 207-0480 Morphine derivative
* Enzyme conjugates are labelled with horseradish peroxidase in a buffered, protein solution with
stabilizers at pH 7.6 and contain azide free preservatives. The solutions are dyed pink for clarity.
** The cannabinoid enzyme conjugate (11-nor-9-carboxy-delta-9-tetrahydrocannabinol (THC-COOH))
is buffered at pH 8.5.
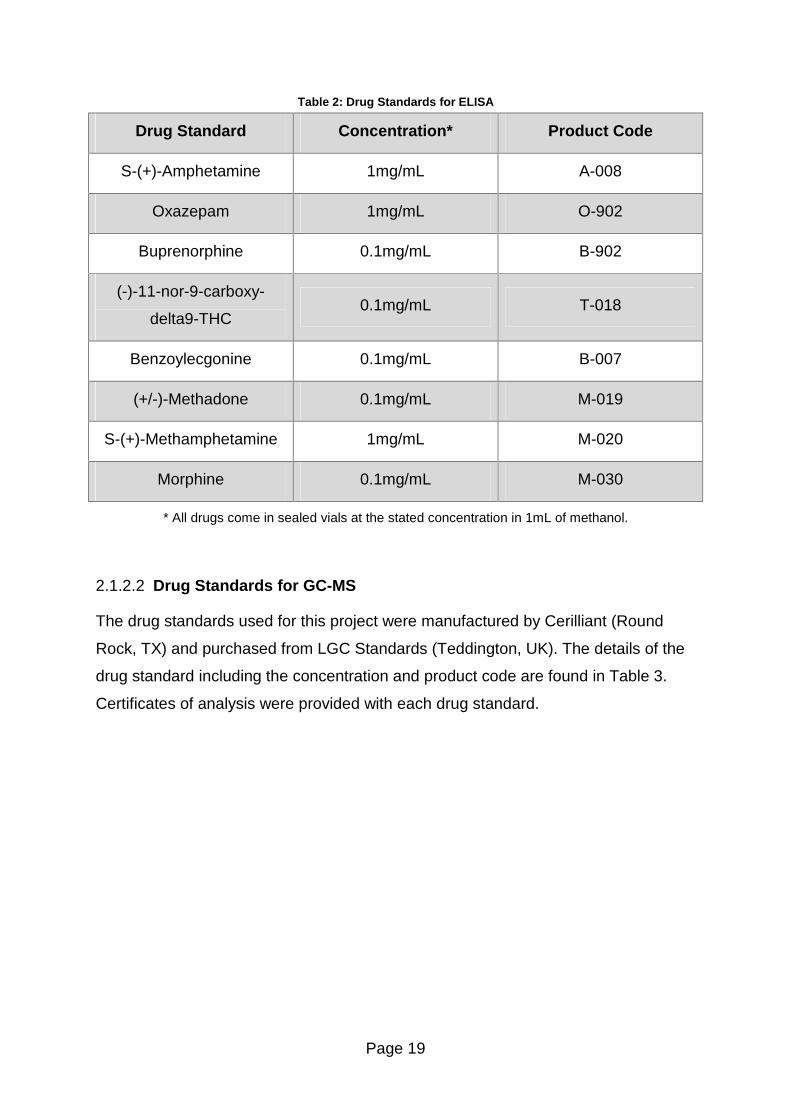
2.1.2 Drug Standards
2.1.2.1 Drug Standards for ELISA
The drug standards used for this project were manufactured by Cerilliant (Round
Rock, TX) and purchased from LGC Standards (Teddington, UK). The details of the
drug standard including the concentration and product code are found in Table 2.
Certificates of analysis were provided with each drug standard.
Page 19
Table 2: Drug Standards for ELISA
Drug Standard Concentration* Product Code
S-(+)-Amphetamine 1mg/mL A-008
Oxazepam 1mg/mL O-902
Buprenorphine 0.1mg/mL B-902
(-)-11-nor-9-carboxy-
delta9-THC 0.1mg/mL T-018
Benzoylecgonine 0.1mg/mL B-007
(+/-)-Methadone 0.1mg/mL M-019
S-(+)-Methamphetamine 1mg/mL M-020
Morphine 0.1mg/mL M-030
* All drugs come in sealed vials at the stated concentration in 1mL of methanol.
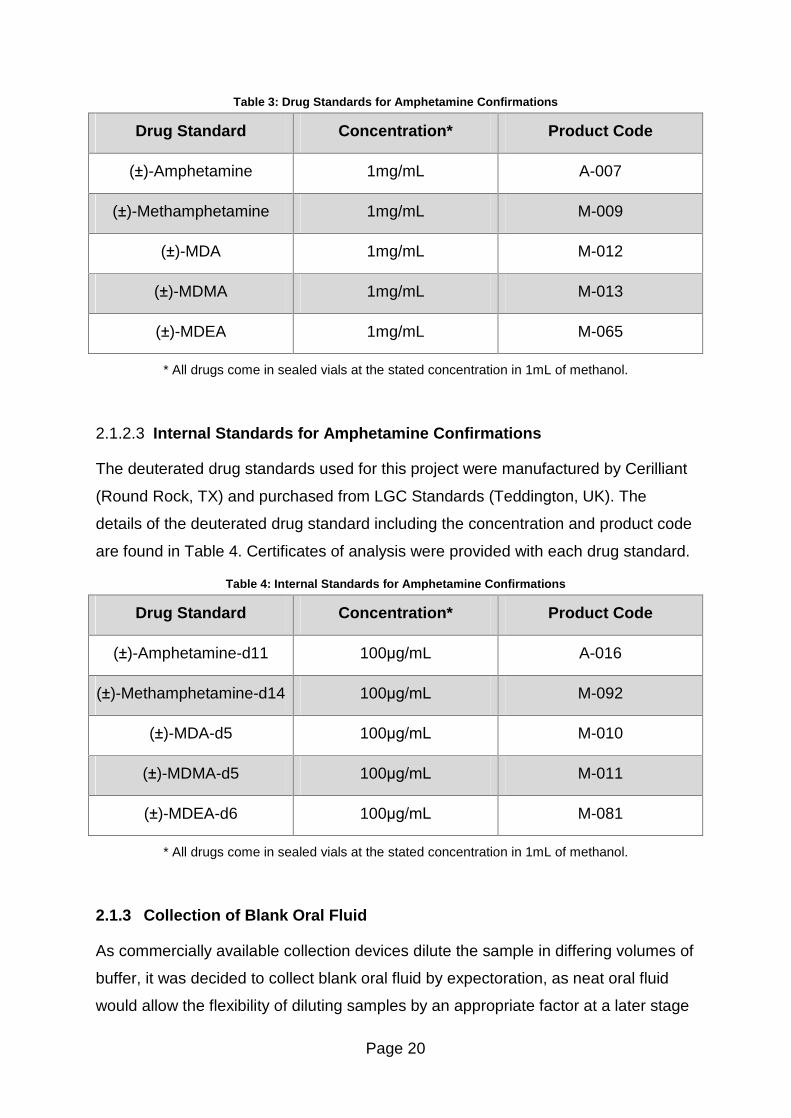
2.1.2.2 Drug Standards for GC-MS
The drug standards used for this project were manufactured by Cerilliant (Round
Rock, TX) and purchased from LGC Standards (Teddington, UK). The details of the
drug standard including the concentration and product code are found in Table 3.
Certificates of analysis were provided with each drug standard.
Page 20
Table 3: Drug Standards for Amphetamine Confirmations
Drug Standard Concentration* Product Code
(±)-Amphetamine 1mg/mL A-007
(±)-Methamphetamine 1mg/mL M-009
(±)-MDA 1mg/mL M-012
(±)-MDMA 1mg/mL M-013
(±)-MDEA 1mg/mL M-065
* All drugs come in sealed vials at the stated concentration in 1mL of methanol.
2.1.2.3 Internal Standards for Amphetamine Confirmations
The deuterated drug standards used for this project were manufactured by Cerilliant
(Round Rock, TX) and purchased from LGC Standards (Teddington, UK). The
details of the deuterated drug standard including the concentration and product code
are found in Table 4. Certificates of analysis were provided with each drug standard.
Table 4: Internal Standards for Amphetamine Confirmations
Drug Standard Concentration* Product Code
(±)-Amphetamine-d11 100µg/mL A-016
(±)-Methamphetamine-d14 100µg/mL M-092
(±)-MDA-d5 100µg/mL M-010
(±)-MDMA-d5 100µg/mL M-011
(±)-MDEA-d6 100µg/mL M-081
* All drugs come in sealed vials at the stated concentration in 1mL of methanol.
2.1.3 Collection of Blank Oral Fluid
As commercially available collection devices dilute the sample in differing volumes of
buffer, it was decided to collect blank oral fluid by expectoration, as neat oral fluid
would allow the flexibility of diluting samples by an appropriate factor at a later stage
Page 21
to match the dilution factor in the collection device of the sample in question should
the sample be collected with a different collection device. Neat oral fluid was
collected from a single donor who had not taken any of the drugs included in the
analysis or those closely related to them prior to sample collection. Collection of oral
fluid was carried out in one day by expectorating approximately 300mL into a beaker.
The oral fluid was transferred to a large storage bottle and stored in the freezer until
required.
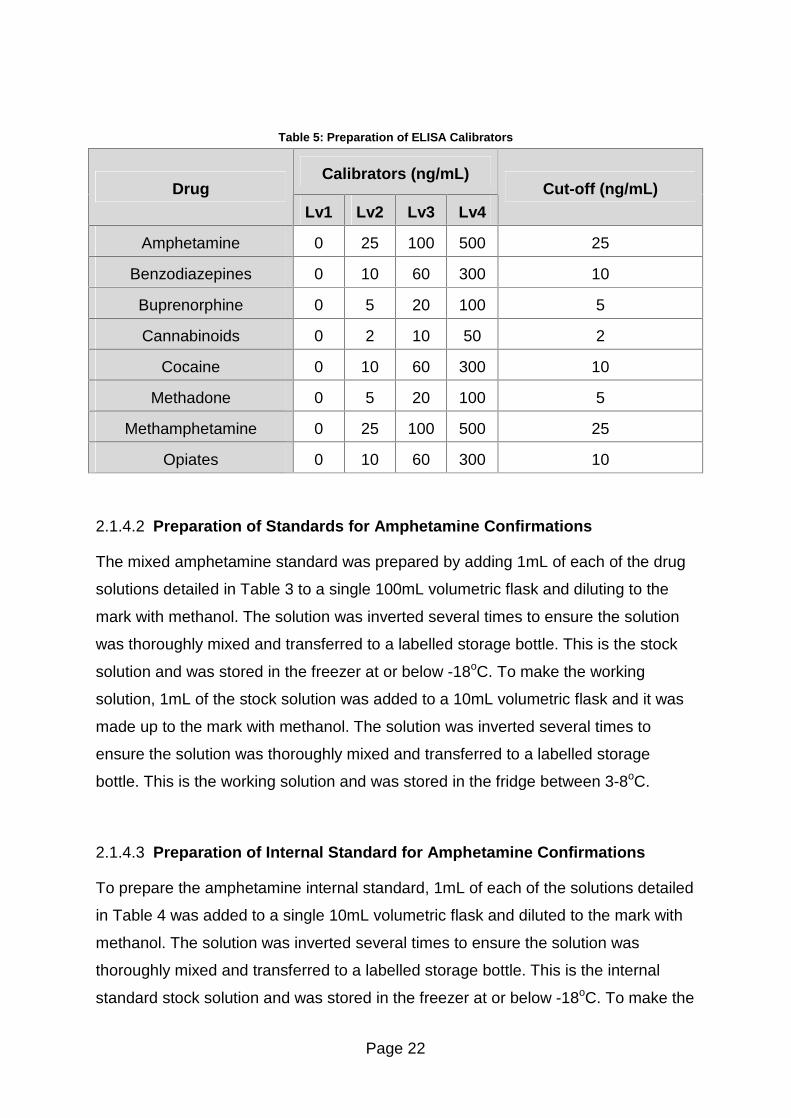
2.1.4 Preparation of Calibrators
2.1.4.1 Preparation of Calibrators for ELISA
As the in-house calibrators for this assay were also used for the routine blood and
urine analysis which was accredited to ISO/IEC 17025, the calibrators were prepared
by a member of technical staff to comply with the accreditation. The calibrators were
prepared in the following way: The levels were prepared from stock solutions of the
drugs at a higher concentration than required and diluted to the required
concentration with 25mL of water. The concentration of each drug in the four levels
used for the calibration is shown in Table 5. The calibrators were stored in amber
bottles at or below 8°C in the refrigerator. The calibrators were diluted with buffer
prior to use.
Page 22
Table 5: Preparation of ELISA Calibrators
Calibrators (ng/mL) Drug
Lv1 Lv2 Lv3 Lv4 Cut-off (ng/mL)
Amphetamine 0 25 100 500 25
Benzodiazepines 0 10 60 300 10
Buprenorphine 0 5 20 100 5
Cannabinoids 0 2 10 50 2
Cocaine 0 10 60 300 10
Methadone 0 5 20 100 5
Methamphetamine 0 25 100 500 25
Opiates 0 10 60 300 10
2.1.4.2 Preparation of Standards for Amphetamine Confirmations
The mixed amphetamine standard was prepared by adding 1mL of each of the drug
solutions detailed in Table 3 to a single 100mL volumetric flask and diluting to the
mark with methanol. The solution was inverted several times to ensure the solution
was thoroughly mixed and transferred to a labelled storage bottle. This is the stock
solution and was stored in the freezer at or below -18oC. To make the working
solution, 1mL of the stock solution was added to a 10mL volumetric flask and it was
made up to the mark with methanol. The solution was inverted several times to
ensure the solution was thoroughly mixed and transferred to a labelled storage
bottle. This is the working solution and was stored in the fridge between 3-8oC.
2.1.4.3 Preparation of Internal Standard for Amphetamine Confirmations
To prepare the amphetamine internal standard, 1mL of each of the solutions detailed
in Table 4 was added to a single 10mL volumetric flask and diluted to the mark with
methanol. The solution was inverted several times to ensure the solution was
thoroughly mixed and transferred to a labelled storage bottle. This is the internal
standard stock solution and was stored in the freezer at or below -18oC. To make the
Page 23
working solution, 1mL of the stock solution was added to a 10mL volumetric flask
and it was made up to the mark with methanol. The solution was inverted several
times to ensure the solution was thoroughly mixed and transferred to a labelled
storage bottle. This is the working internal standard solution and was stored in the
fridge between 3-8oC.
2.1.5 Preparation of Controls
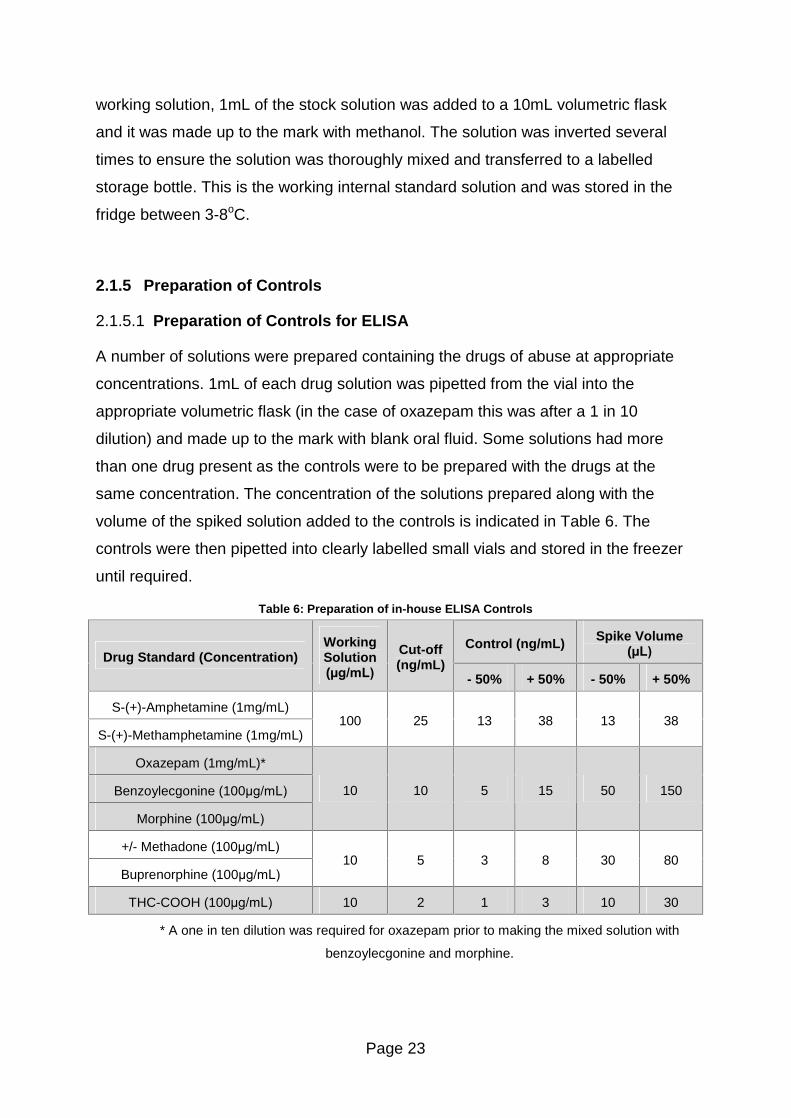
2.1.5.1 Preparation of Controls for ELISA
A number of solutions were prepared containing the drugs of abuse at appropriate
concentrations. 1mL of each drug solution was pipetted from the vial into the
appropriate volumetric flask (in the case of oxazepam this was after a 1 in 10
dilution) and made up to the mark with blank oral fluid. Some solutions had more
than one drug present as the controls were to be prepared with the drugs at the
same concentration. The concentration of the solutions prepared along with the
volume of the spiked solution added to the controls is indicated in Table 6. The
controls were then pipetted into clearly labelled small vials and stored in the freezer
until required.
Table 6: Preparation of in-house ELISA Controls
Control (ng/mL) Spike Volume (µL) Drug Standard (Concentration)
Working Solution (µg/mL)
Cut-off (ng/mL)
- 50% + 50% - 50% + 50%
S-(+)-Amphetamine (1mg/mL)
S-(+)-Methamphetamine (1mg/mL) 100 25 13 38 13 38
Oxazepam (1mg/mL)*
Benzoylecgonine (100µg/mL)
Morphine (100µg/mL)
10 10 5 15 50 150
+/- Methadone (100µg/mL)
Buprenorphine (100µg/mL) 10 5 3 8 30 80
THC-COOH (100µg/mL) 10 2 1 3 10 30
* A one in ten dilution was required for oxazepam prior to making the mixed solution with
benzoylecgonine and morphine.
Page 24
Amphetamine and methamphetamine formed one of the drug mixtures, oxazepam,
morphine and benzoylecgonine formed another and methadone and buprenorphine
formed the third. The cannabis solution was not part of a mixed drug solution.
2.1.5.2 Preparation of Controls for Amphetamine Confirmations
A separate bottle of amphetamine stock solution (10µg/mL) was prepared as
described above and marked as for controls only. From this solution, 0.45mL is
added to a 100mL volumetric flask and made up to the mark with blank oral fluid.
This gives a control spiked at 45ng/mL. The solution was inverted several times to
ensure it was thoroughly mixed and 1.2mL aliquots were transferred to screw cap
vials which were labelled as amphetamine oral fluid controls and stored in the
freezer until required.
2.1.6 Equipment
Samples were washed using an MRX plate washer and analysed using an MRX
microplate reader using a 450nm filter, all of which were purchased from Dynex
Technologies (Chantilly, VA). Revelation software version 4.25 was used to process
the results.
The pipettes used in this project were calibrated by the United Kingdom
Accreditation Service (UKAS) to ISO/IEC 17025 standard. Standards were prepared
in volumetric flasks provided by Fisherbrand (Leicestershire, UK).
The samples were analysed by GC-MS using an Agilent 7890A gas chromatograph
coupled to an Agilent 5975C mass spectrometer. The system was automated using
an Agilent 7683B series auto-sampler and processed using MSD Chemstation
software (version G1701EA E.02.00.493). The gas chromatograph was fitted with a
DB-5MA + DG column (30m x 0.25mm x 0.25µm). All GC-MS related components
were purchased from Agilent Technologies (Berkshire, UK).
Page 25
2.1.7 Case Samples
Case samples for this project were provided from three sources. Quantum
Diagnostics (Essex, UK) provided approximately 100 samples for this project. The
Centre for Drug Misuse Research based at the University of Glasgow (Glasgow, UK)
provided approximately 210 samples for this project. Nine further samples were
analysed as part of the United Kingdom National External Quality Assessment
Service (UKNEQAS) proficiency testing scheme for oral fluid.
2.2 Methods
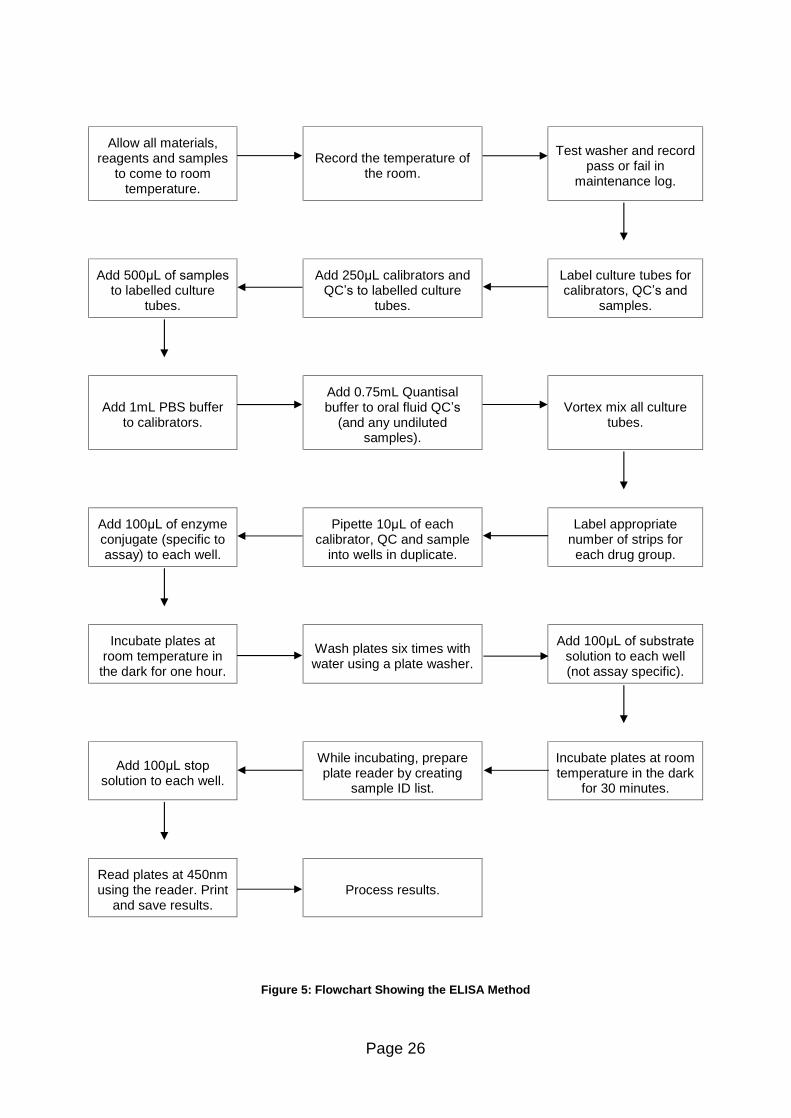
2.2.1 Method of Analysis (ELISA)
The flowchart below shows the method for the diluted oral fluid controls which were
generally used. An initial comparison of neat controls was done and the oral fluid
QC�s were not diluted with 750µL Quantisal buffer. The method used for ELISA is
detailed in Figure 5.
Page 26
Allow all materials, reagents and samples
to come to room temperature.
Record the temperature of
the room.
Test washer and record
pass or fail in maintenance log.
Add 500µL of samples
to labelled culture tubes.
Add 250µL calibrators and QC�s to labelled culture
tubes.
Label culture tubes for calibrators, QC�s and
samples.
Add 1mL PBS buffer to calibrators.
Add 0.75mL Quantisal buffer to oral fluid QC�s
(and any undiluted samples).
Vortex mix all culture
tubes.
Add 100µL of enzyme conjugate (specific to assay) to each well.
Pipette 10µL of each calibrator, QC and sample
into wells in duplicate.
Label appropriate number of strips for each drug group.
Incubate plates at room temperature in the dark for one hour.
Wash plates six times with water using a plate washer.
Add 100µL of substrate
solution to each well (not assay specific).
Add 100µL stop
solution to each well.
While incubating, prepare plate reader by creating
sample ID list.
Incubate plates at room temperature in the dark
for 30 minutes.
Read plates at 450nm using the reader. Print
and save results.
Process results.
Figure 5: Flowchart Showing the ELISA Method
Page 27
2.2.2 Data Processing
To process the results, the percentage binding of the calibrators and controls were
calculated. The absorbance for the first positive calibrator was chosen as the cut-off
value for the assay. The binding of the blank calibrator and the blank control were
assumed to have 100% binding. The ratio of the absorbance of the other calibrators
to the absorbance of the blank calibrator allows the percentage binding to be
calculated for the calibrators and in a similar fashion the ratio of the positive controls
absorbance to the blank control allows the percentage binding for the controls to be
calculated. The formula used to calculate the percentage binding is given below:
Percentage binding = (B/B0) x 100.......... Equation 2
Where B is the mean absorbance of calibrator or control and B0 is the mean
absorbance of the blank calibrator or blank control.
Using a different blank for the controls and calibrators allows any matrix effects on
the absorbance to be considered. Using the percentage binding is a good way to
normalize the results as the absorbance recorded will vary from day to day due to
different assays and length of time incubated. The ratio between the levels should
remain relatively constant and this will be monitored using a QC chart for each of the
assays investigated. The results were used to construct Schewart style control
charts as detailed in section 2.3.3.
As the samples are analysed in duplicate, the mean absorbance value for the
sample is used for the calculation outlined above. The variation between these
duplicate results is also monitored and if it is out with an acceptable level then the
outlier can be discarded and the absorbance value from the other well used for the
percentage binding calculation. The acceptable level of variation between the
duplicate calibrators is 15% and between duplicate samples is 20%.
Page 28
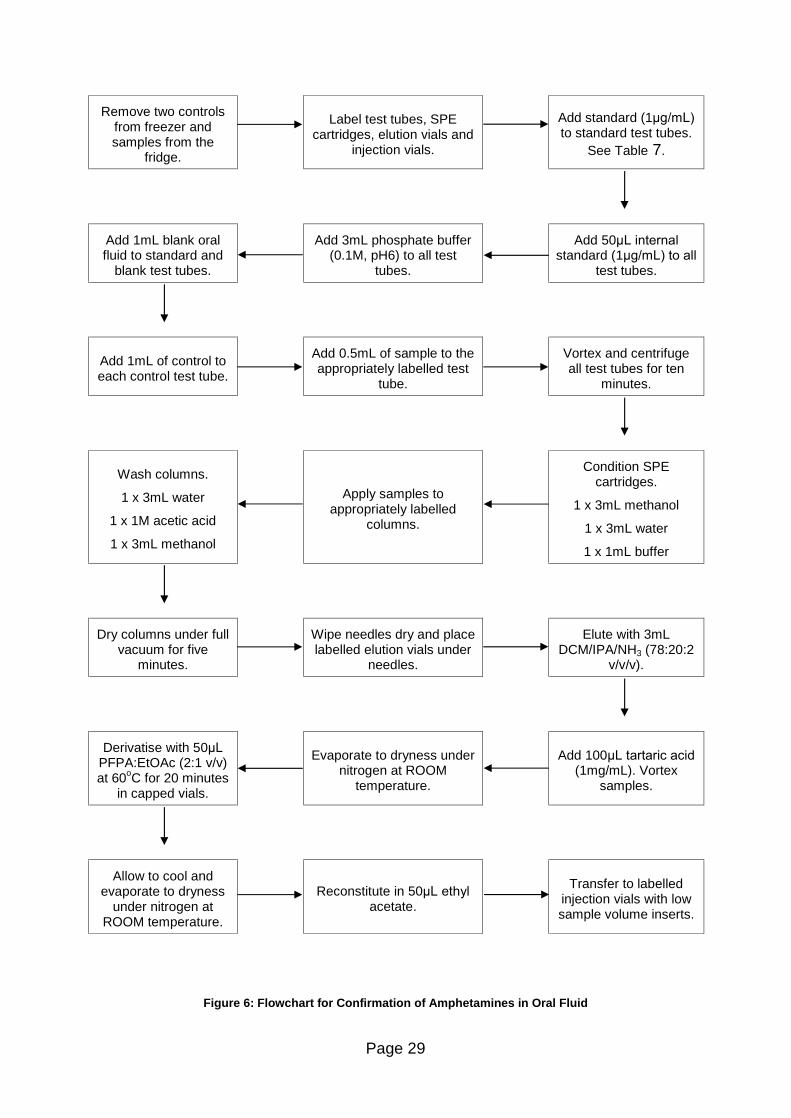
2.2.3 Method of Analysis (Confirmations)
Amphetamines are extracted by a solid phase extraction method. The extraction
procedure for amphetamines in oral fluid is shown in Figure 6. A worksheet for the
extraction procedure utilised was required to be filled in as part of the accreditation
and is shown in Appendix 1.
Page 29
Remove two controls from freezer and samples from the
fridge.
Label test tubes, SPE
cartridges, elution vials and injection vials.
Add standard (1µg/mL)
to standard test tubes. See Table 7.
Add 1mL blank oral fluid to standard and
blank test tubes.
Add 3mL phosphate buffer (0.1M, pH6) to all test
tubes.
Add 50µL internal
standard (1µg/mL) to all
test tubes.
Add 1mL of control to each control test tube.
Add 0.5mL of sample to the appropriately labelled test
tube.
Vortex and centrifuge all test tubes for ten
minutes.
Wash columns.
1 x 3mL water
1 x 1M acetic acid
1 x 3mL methanol
Apply samples to appropriately labelled
columns.
Condition SPE cartridges.
1 x 3mL methanol
1 x 3mL water
1 x 1mL buffer
Dry columns under full vacuum for five
minutes.
Wipe needles dry and place labelled elution vials under
needles.
Elute with 3mL DCM/IPA/NH3 (78:20:2
v/v/v).
Derivatise with 50µL
PFPA:EtOAc (2:1 v/v) at 60oC for 20 minutes
in capped vials.
Evaporate to dryness under
nitrogen at ROOM temperature.
Add 100µL tartaric acid
(1mg/mL). Vortex samples.
Allow to cool and evaporate to dryness
under nitrogen at ROOM temperature.
Reconstitute in 50µL ethyl
acetate.
Transfer to labelled
injection vials with low sample volume inserts.
Figure 6: Flowchart for Confirmation of Amphetamines in Oral Fluid
Page 30
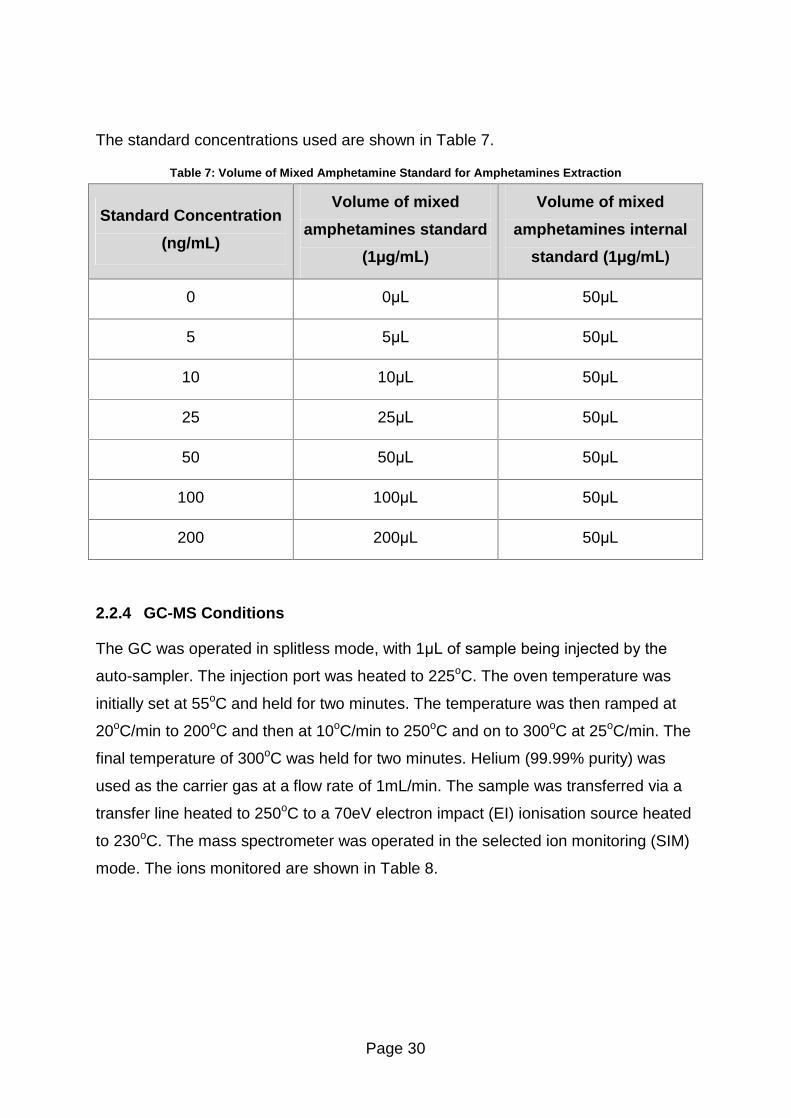
The standard concentrations used are shown in Table 7.
Table 7: Volume of Mixed Amphetamine Standard for Amphetamines Extraction
Standard Concentration
(ng/mL)
Volume of mixed
amphetamines standard
(1µg/mL)
Volume of mixed
amphetamines internal
standard (1µg/mL)
0 0µL 50µL
5 5µL 50µL
10 10µL 50µL
25 25µL 50µL
50 50µL 50µL
100 100µL 50µL
200 200µL 50µL
2.2.4 GC-MS Conditions
The GC was operated in splitless mode, with 1µL of sample being injected by the
auto-sampler. The injection port was heated to 225oC. The oven temperature was
initially set at 55oC and held for two minutes. The temperature was then ramped at
20oC/min to 200oC and then at 10oC/min to 250oC and on to 300oC at 25oC/min. The
final temperature of 300oC was held for two minutes. Helium (99.99% purity) was
used as the carrier gas at a flow rate of 1mL/min. The sample was transferred via a
transfer line heated to 250oC to a 70eV electron impact (EI) ionisation source heated
to 230oC. The mass spectrometer was operated in the selected ion monitoring (SIM)
mode. The ions monitored are shown in Table 8.
Page 31
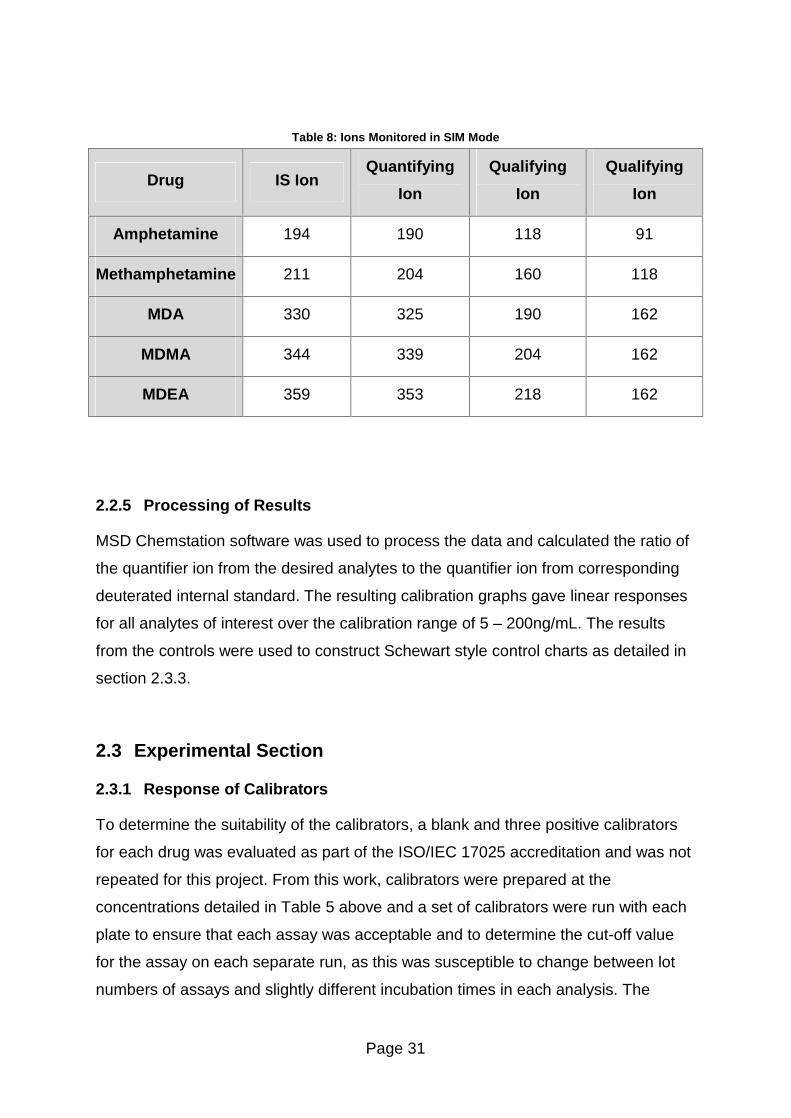
Table 8: Ions Monitored in SIM Mode
Drug IS Ion Quantifying
Ion
Qualifying
Ion
Qualifying
Ion
Amphetamine 194 190 118 91
Methamphetamine 211 204 160 118
MDA 330 325 190 162
MDMA 344 339 204 162
MDEA 359 353 218 162
2.2.5 Processing of Results
MSD Chemstation software was used to process the data and calculated the ratio of
the quantifier ion from the desired analytes to the quantifier ion from corresponding
deuterated internal standard. The resulting calibration graphs gave linear responses
for all analytes of interest over the calibration range of 5 � 200ng/mL. The results
from the controls were used to construct Schewart style control charts as detailed in
section 2.3.3.
2.3 Experimental Section
2.3.1 Response of Calibrators
To determine the suitability of the calibrators, a blank and three positive calibrators
for each drug was evaluated as part of the ISO/IEC 17025 accreditation and was not
repeated for this project. From this work, calibrators were prepared at the
concentrations detailed in Table 5 above and a set of calibrators were run with each
plate to ensure that each assay was acceptable and to determine the cut-off value
for the assay on each separate run, as this was susceptible to change between lot
numbers of assays and slightly different incubation times in each analysis. The
Page 32
responses for the assays of interest are detailed in the results section. The mixed
drug calibrators were used for each drug group.
2.3.2 Limit of Detection
To determine the limit of detection of the assays, twelve replicates of the blank
control were run in duplicate on one plate. The mean and standard deviation for
these samples were calculated and the mean minus two times the standard
deviation was calculated (as the blank for the ELISA assays is the highest value) to
determine the limit of detection. This work was only carried out for the amphetamine
and methamphetamine plates.
2.3.3 Preparation of Shewart-Style Quality Control Charts
The mean value for the control chart was determined by averaging the percentage
binding values from the first positive calibrator over a period of ten runs. The data
from these runs was also used to calculate the mean ±2SD and the mean ±3SD and
these values are indicated on the appropriate charts. Control charts for both the 50%
above and 50% below the cut-off controls were constructed in the same way to that
of the cut-off control charts. The same procedure was followed for the preparation of
control charts for the amphetamine confirmation method.
Any subsequent sets of controls which were prepared were evaluated and if the
results fell within the limits of the previous control, they were plotted on the previous
control chart. If the values were out with the limits, a new control chart was
constructed in the same way as the original charts. The results for the amphetamine
and methamphetamine assays can be found in section 2.4.4. The charts for the
other drugs can be found in Appendix 3 � ELISA QC Charts.
2.3.4 Criteria for Acceptability
All results should fall within three standard deviations of the mean and ideally within
two standard deviations of the mean. One control outwith the mean ±2SD is
acceptable provided the other is within that range. Trends of controls being higher or
lower than �normal� may be observed due to small differences in the preperation of
Page 33
calibrators. When the controls are repeatedly falling out with the acceptable range it
indicates that the controls are no longer stable for the drug group in question.
2.3.5 Stability of Drugs in Oral Fluid
To evaluate the stability of drugs in oral fluid the percentage binding of the controls
were calculated as described above (in section 2.2.2) and plotted on a QC chart. The
stability of the controls is monitored over time by monitoring any significant change in
the percentage binding, as indicated on the QC chart by the points being out with the
acceptable range of the mean ±2SD. Over time, drugs will become unstable and
start to break down resulting in an upward trend being observed in the QC charts. As
multi-analyte controls were prepared, trends for other drugs groups were also
monitored. The controls were stored in neat oral fluid, while case samples were
diluted with buffer.
2.3.6 Sensitivity and Specificity
The sensitivity of the assay is defined as the efficiency of the assay in detecting
positive samples and was calculated as follows and expressed as a percentage:
Sensitivity = (TP/ (TP + FN)) *100 .......... Equation 3
Where TP = True positives and FN = False negatives.
The specificity of the assay is defined as the efficiency of the assay in detecting
negative samples and was calculated as follows and expressed as a percentage:
Specificity = (TN/ (TN + FP)) *100 .......... Equation 4
Where TN = True negatives and FP = False positives.
Page 34
2.4 Results and Discussion
2.4.1 Calibration
The calibration for the assays used for oral fluid analysis was calculated using
revelation software. The software displayed an error message if the calibration was
not acceptable.
2.4.2 Limit of Detection
The limit of detection for amphetamine and methamphetamine in diluted oral fluid
using Immunalysis ELISA assays is shown in Table 9.
The absorbance value for the limit of detection for amphetamine within this batch is
1.706 which is much higher than the absorbance value of the cut off concentration
from this batch (0.594), thus there is no problem with sensitivity for this assay.
Similarly methamphetamine, which has an absorbance value of 1.264 for the limit of
detection in this batch, is sufficiently sensitive as the LOD is much higher than the
absorbance value at the cut-off concentration (0.557) from this batch.
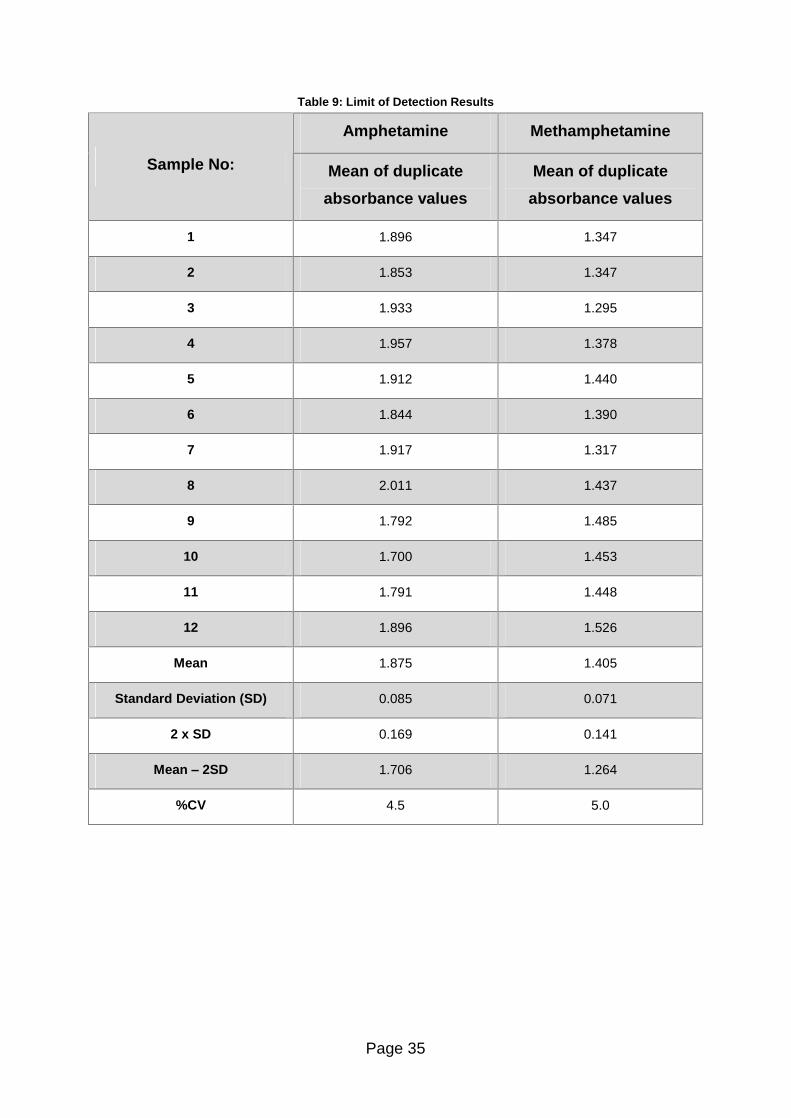
Page 35
Table 9: Limit of Detection Results
Amphetamine Methamphetamine
Sample No: Mean of duplicate
absorbance values
Mean of duplicate
absorbance values
1 1.896 1.347
2 1.853 1.347
3 1.933 1.295
4 1.957 1.378
5 1.912 1.440
6 1.844 1.390
7 1.917 1.317
8 2.011 1.437
9 1.792 1.485
10 1.700 1.453
11 1.791 1.448
12 1.896 1.526
Mean 1.875 1.405
Standard Deviation (SD) 0.085 0.071
2 x SD 0.169 0.141
Mean � 2SD 1.706 1.264
%CV 4.5 5.0
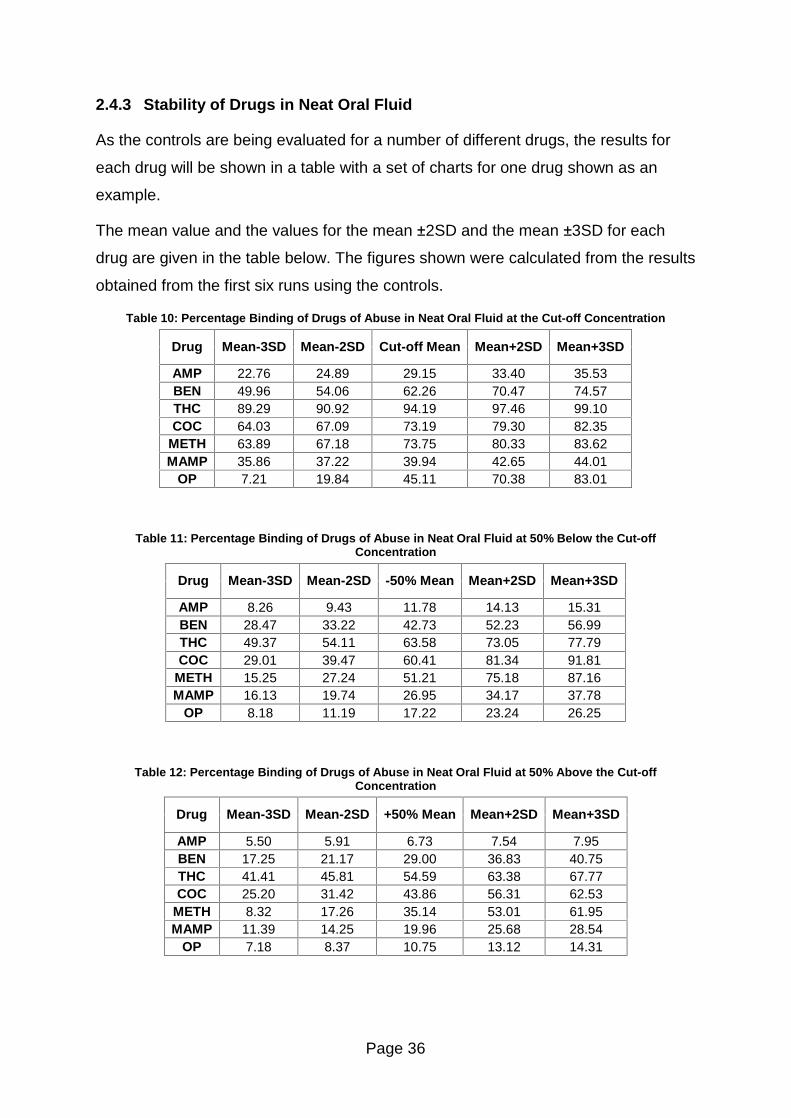
Page 36
2.4.3 Stability of Drugs in Neat Oral Fluid
As the controls are being evaluated for a number of different drugs, the results for
each drug will be shown in a table with a set of charts for one drug shown as an
example.
The mean value and the values for the mean ±2SD and the mean ±3SD for each
drug are given in the table below. The figures shown were calculated from the results
obtained from the first six runs using the controls.
Table 10: Percentage Binding of Drugs of Abuse in Neat Oral Fluid at the Cut-off Concentration
Drug Mean-3SD Mean-2SD Cut-off Mean Mean+2SD Mean+3SD
AMP 22.76 24.89 29.15 33.40 35.53 BEN 49.96 54.06 62.26 70.47 74.57 THC 89.29 90.92 94.19 97.46 99.10 COC 64.03 67.09 73.19 79.30 82.35
METH 63.89 67.18 73.75 80.33 83.62 MAMP 35.86 37.22 39.94 42.65 44.01
OP 7.21 19.84 45.11 70.38 83.01
Table 11: Percentage Binding of Drugs of Abuse in Neat Oral Fluid at 50% Below the Cut-off Concentration
Drug Mean-3SD Mean-2SD -50% Mean Mean+2SD Mean+3SD
AMP 8.26 9.43 11.78 14.13 15.31 BEN 28.47 33.22 42.73 52.23 56.99 THC 49.37 54.11 63.58 73.05 77.79 COC 29.01 39.47 60.41 81.34 91.81
METH 15.25 27.24 51.21 75.18 87.16 MAMP 16.13 19.74 26.95 34.17 37.78
OP 8.18 11.19 17.22 23.24 26.25
Table 12: Percentage Binding of Drugs of Abuse in Neat Oral Fluid at 50% Above the Cut-off Concentration
Drug Mean-3SD Mean-2SD +50% Mean Mean+2SD Mean+3SD
AMP 5.50 5.91 6.73 7.54 7.95 BEN 17.25 21.17 29.00 36.83 40.75 THC 41.41 45.81 54.59 63.38 67.77 COC 25.20 31.42 43.86 56.31 62.53
METH 8.32 17.26 35.14 53.01 61.95 MAMP 11.39 14.25 19.96 25.68 28.54
OP 7.18 8.37 10.75 13.12 14.31
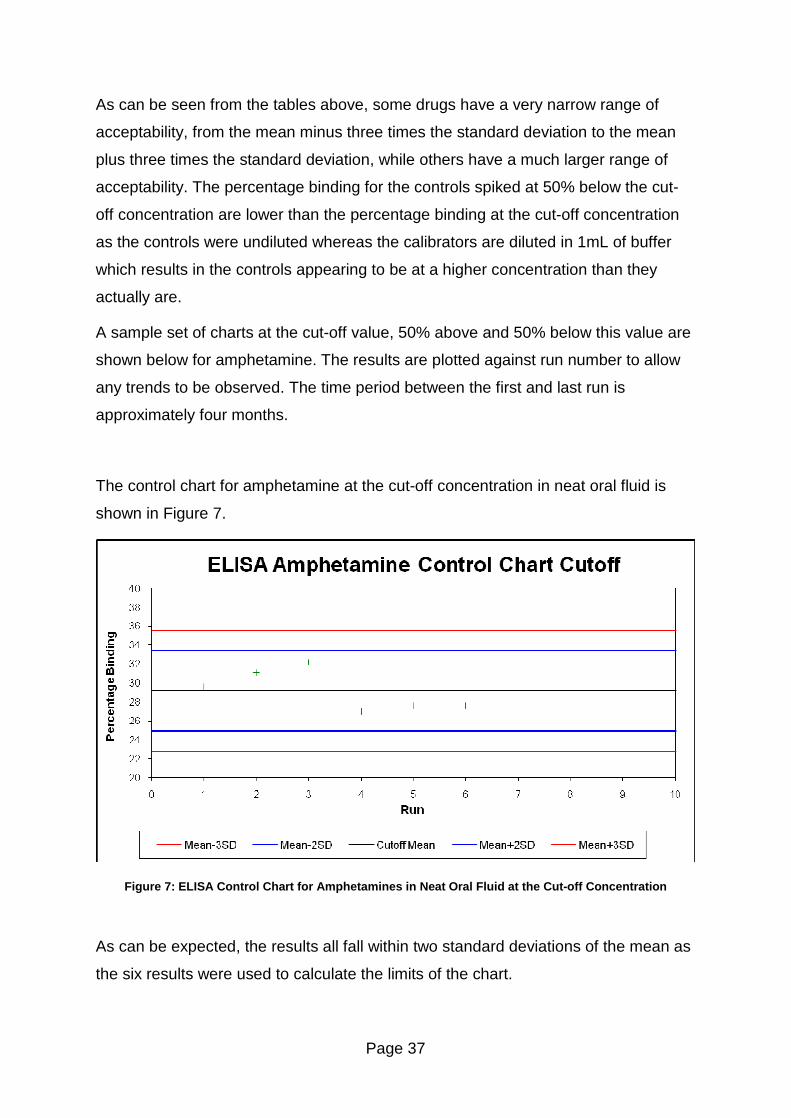
Page 37
As can be seen from the tables above, some drugs have a very narrow range of
acceptability, from the mean minus three times the standard deviation to the mean
plus three times the standard deviation, while others have a much larger range of
acceptability. The percentage binding for the controls spiked at 50% below the cut-
off concentration are lower than the percentage binding at the cut-off concentration
as the controls were undiluted whereas the calibrators are diluted in 1mL of buffer
which results in the controls appearing to be at a higher concentration than they
actually are.
A sample set of charts at the cut-off value, 50% above and 50% below this value are
shown below for amphetamine. The results are plotted against run number to allow
any trends to be observed. The time period between the first and last run is
approximately four months.
The control chart for amphetamine at the cut-off concentration in neat oral fluid is
shown in Figure 7.
Figure 7: ELISA Control Chart for Amphetamines in Neat Oral Fluid at the Cut-off Concentration
As can be expected, the results all fall within two standard deviations of the mean as
the six results were used to calculate the limits of the chart.
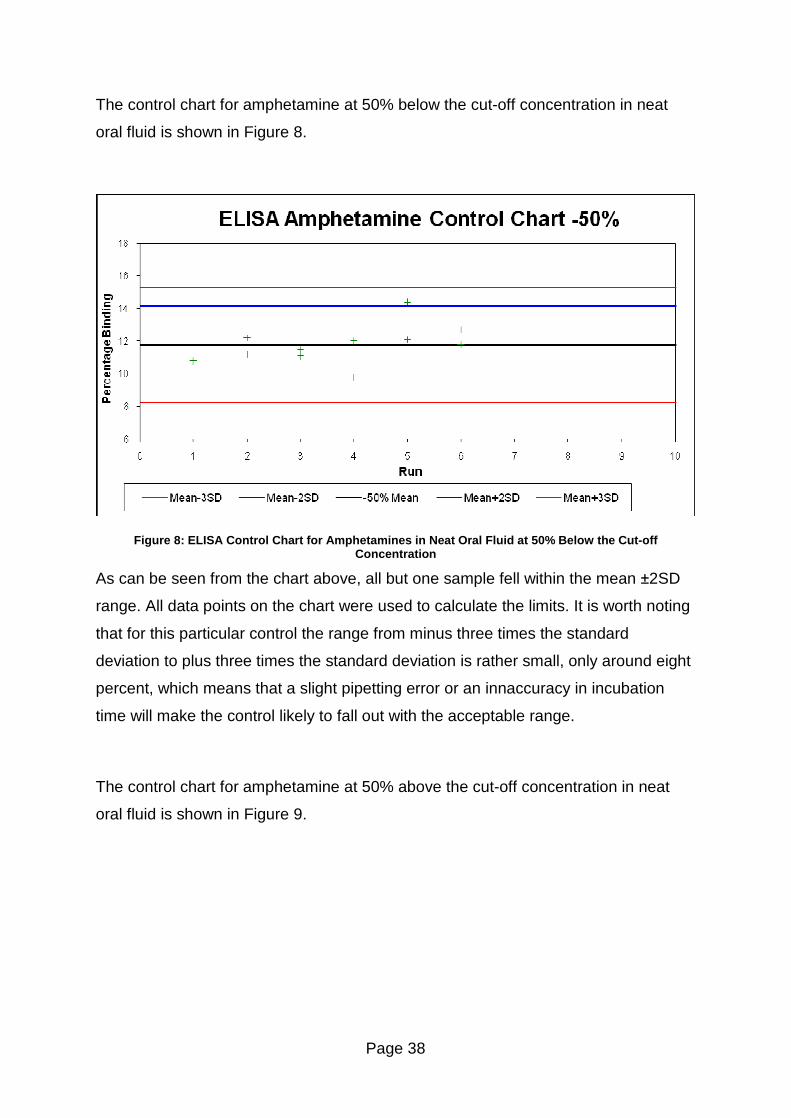
Page 38
The control chart for amphetamine at 50% below the cut-off concentration in neat
oral fluid is shown in Figure 8.
Figure 8: ELISA Control Chart for Amphetamines in Neat Oral Fluid at 50% Below the Cut-off Concentration
As can be seen from the chart above, all but one sample fell within the mean ±2SD
range. All data points on the chart were used to calculate the limits. It is worth noting
that for this particular control the range from minus three times the standard
deviation to plus three times the standard deviation is rather small, only around eight
percent, which means that a slight pipetting error or an innaccuracy in incubation
time will make the control likely to fall out with the acceptable range.
The control chart for amphetamine at 50% above the cut-off concentration in neat
oral fluid is shown in Figure 9.
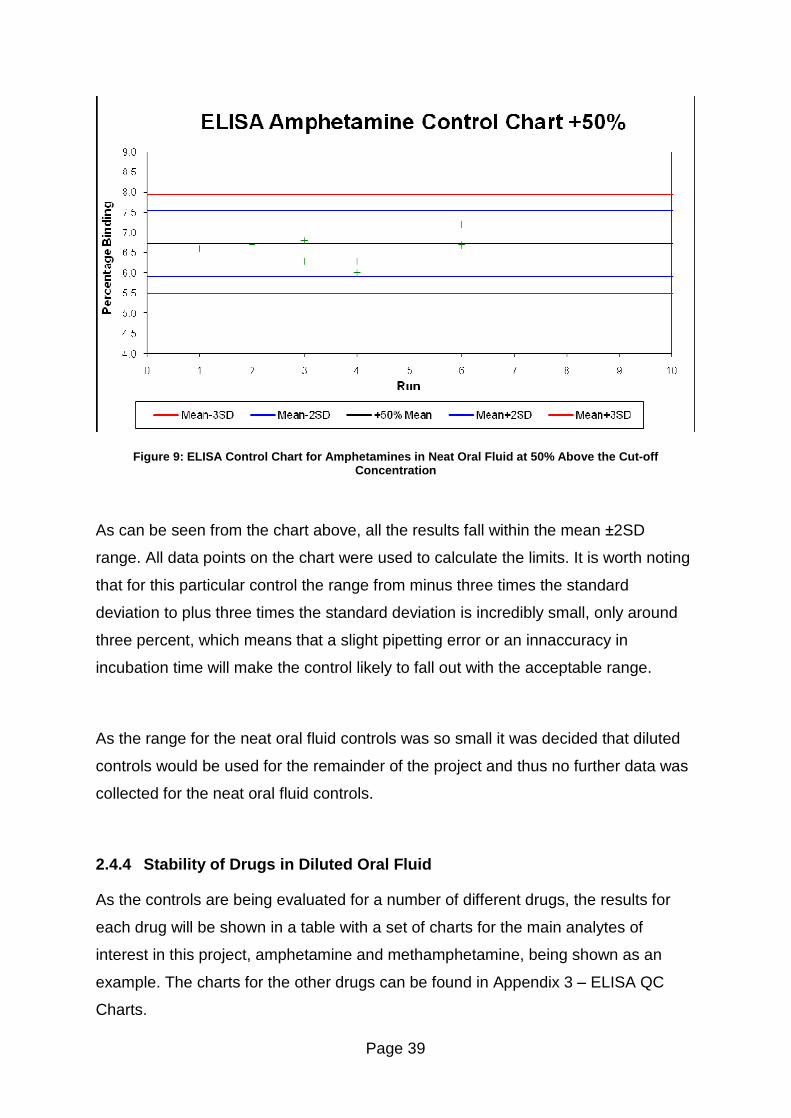
Page 39
Figure 9: ELISA Control Chart for Amphetamines in Neat Oral Fluid at 50% Above the Cut-off Concentration
As can be seen from the chart above, all the results fall within the mean ±2SD
range. All data points on the chart were used to calculate the limits. It is worth noting
that for this particular control the range from minus three times the standard
deviation to plus three times the standard deviation is incredibly small, only around
three percent, which means that a slight pipetting error or an innaccuracy in
incubation time will make the control likely to fall out with the acceptable range.
As the range for the neat oral fluid controls was so small it was decided that diluted
controls would be used for the remainder of the project and thus no further data was
collected for the neat oral fluid controls.
2.4.4 Stability of Drugs in Diluted Oral Fluid
As the controls are being evaluated for a number of different drugs, the results for
each drug will be shown in a table with a set of charts for the main analytes of
interest in this project, amphetamine and methamphetamine, being shown as an
example. The charts for the other drugs can be found in Appendix 3 � ELISA QC
Charts.
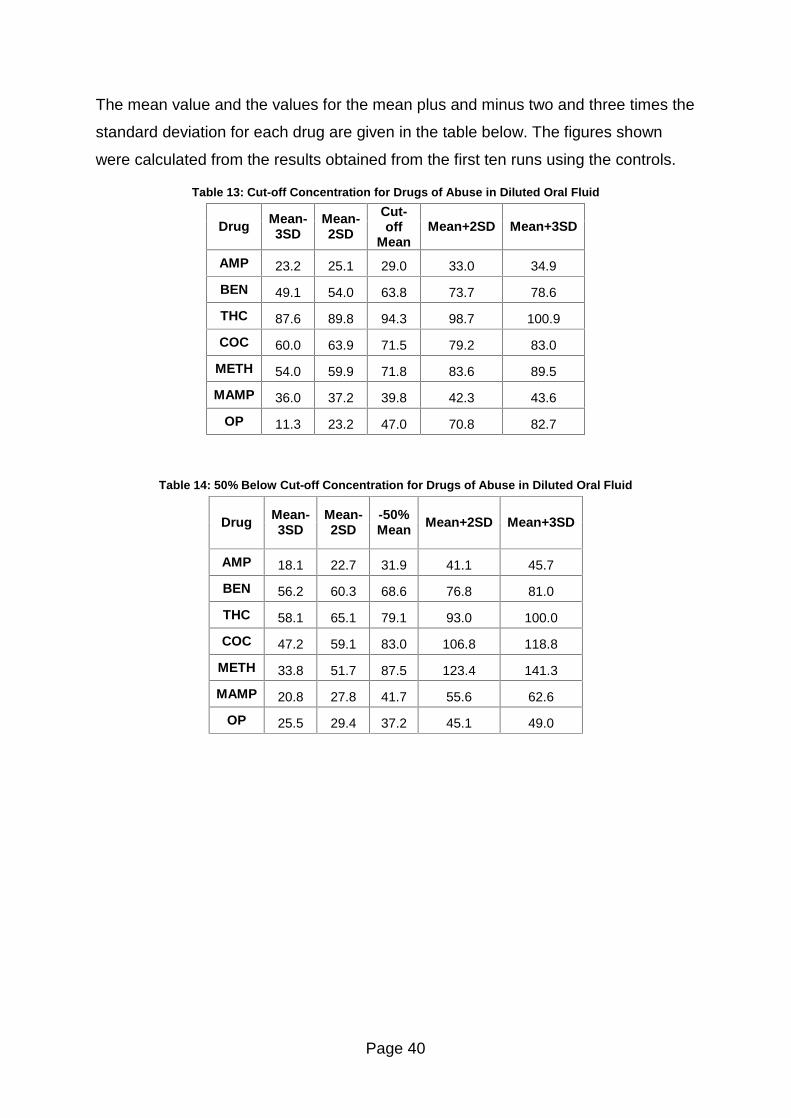
Page 40
The mean value and the values for the mean plus and minus two and three times the
standard deviation for each drug are given in the table below. The figures shown
were calculated from the results obtained from the first ten runs using the controls.
Table 13: Cut-off Concentration for Drugs of Abuse in Diluted Oral Fluid
Drug Mean-3SD
Mean-2SD
Cut-off
Mean Mean+2SD Mean+3SD
AMP 23.2 25.1 29.0 33.0 34.9
BEN 49.1 54.0 63.8 73.7 78.6
THC 87.6 89.8 94.3 98.7 100.9
COC 60.0 63.9 71.5 79.2 83.0
METH 54.0 59.9 71.8 83.6 89.5
MAMP 36.0 37.2 39.8 42.3 43.6
OP 11.3 23.2 47.0 70.8 82.7
Table 14: 50% Below Cut-off Concentration for Drugs of Abuse in Diluted Oral Fluid
Drug Mean-3SD
Mean-2SD
-50% Mean Mean+2SD Mean+3SD
AMP 18.1 22.7 31.9 41.1 45.7
BEN 56.2 60.3 68.6 76.8 81.0
THC 58.1 65.1 79.1 93.0 100.0
COC 47.2 59.1 83.0 106.8 118.8
METH 33.8 51.7 87.5 123.4 141.3
MAMP 20.8 27.8 41.7 55.6 62.6
OP 25.5 29.4 37.2 45.1 49.0
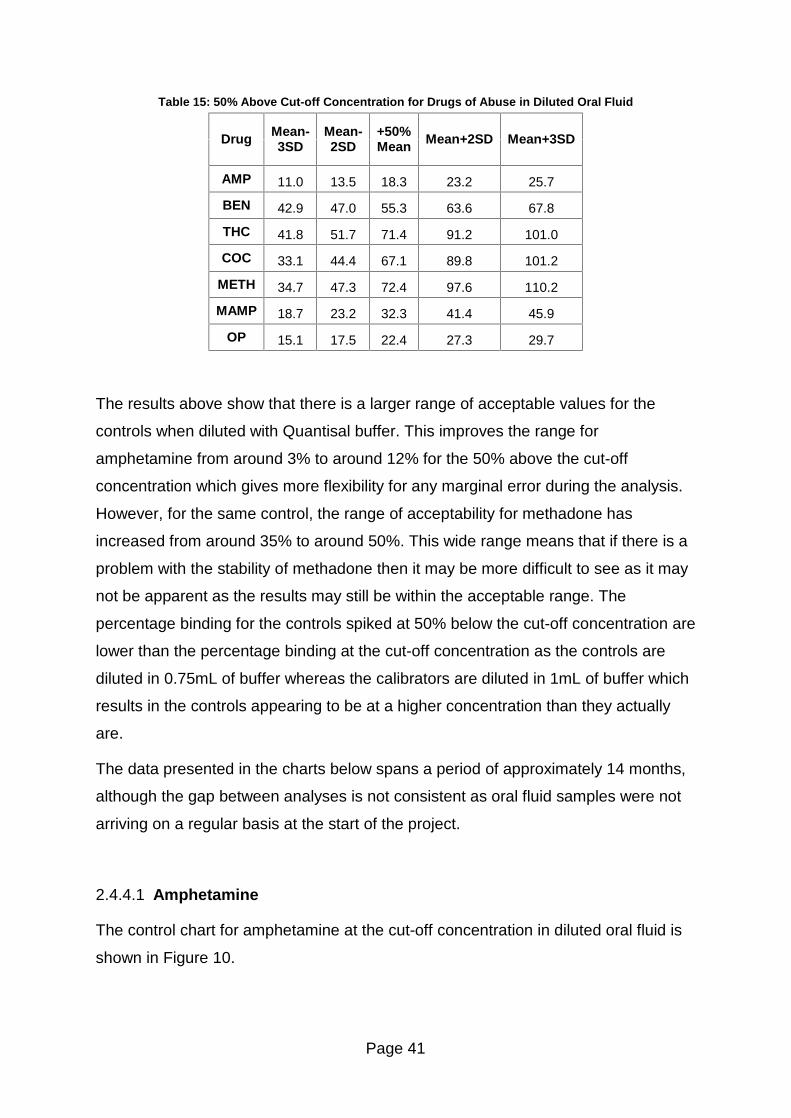
Page 41
Table 15: 50% Above Cut-off Concentration for Drugs of Abuse in Diluted Oral Fluid
Drug Mean-3SD
Mean-2SD
+50% Mean Mean+2SD Mean+3SD
AMP 11.0 13.5 18.3 23.2 25.7
BEN 42.9 47.0 55.3 63.6 67.8
THC 41.8 51.7 71.4 91.2 101.0
COC 33.1 44.4 67.1 89.8 101.2
METH 34.7 47.3 72.4 97.6 110.2
MAMP 18.7 23.2 32.3 41.4 45.9
OP 15.1 17.5 22.4 27.3 29.7
The results above show that there is a larger range of acceptable values for the
controls when diluted with Quantisal buffer. This improves the range for
amphetamine from around 3% to around 12% for the 50% above the cut-off
concentration which gives more flexibility for any marginal error during the analysis.
However, for the same control, the range of acceptability for methadone has
increased from around 35% to around 50%. This wide range means that if there is a
problem with the stability of methadone then it may be more difficult to see as it may
not be apparent as the results may still be within the acceptable range. The
percentage binding for the controls spiked at 50% below the cut-off concentration are
lower than the percentage binding at the cut-off concentration as the controls are
diluted in 0.75mL of buffer whereas the calibrators are diluted in 1mL of buffer which
results in the controls appearing to be at a higher concentration than they actually
are.
The data presented in the charts below spans a period of approximately 14 months,
although the gap between analyses is not consistent as oral fluid samples were not
arriving on a regular basis at the start of the project.
2.4.4.1 Amphetamine
The control chart for amphetamine at the cut-off concentration in diluted oral fluid is
shown in Figure 10.
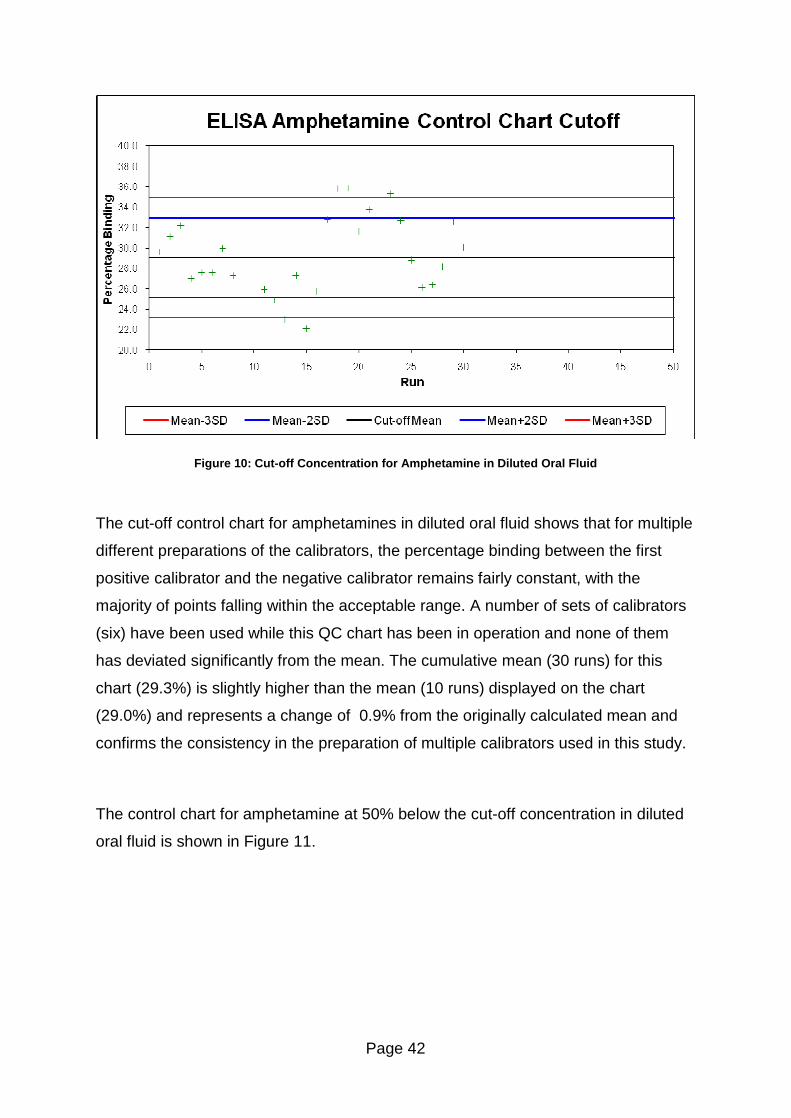
Page 42
Figure 10: Cut-off Concentration for Amphetamine in Diluted Oral Fluid
The cut-off control chart for amphetamines in diluted oral fluid shows that for multiple
different preparations of the calibrators, the percentage binding between the first
positive calibrator and the negative calibrator remains fairly constant, with the
majority of points falling within the acceptable range. A number of sets of calibrators
(six) have been used while this QC chart has been in operation and none of them
has deviated significantly from the mean. The cumulative mean (30 runs) for this
chart (29.3%) is slightly higher than the mean (10 runs) displayed on the chart
(29.0%) and represents a change of 0.9% from the originally calculated mean and
confirms the consistency in the preparation of multiple calibrators used in this study.
The control chart for amphetamine at 50% below the cut-off concentration in diluted
oral fluid is shown in Figure 11.
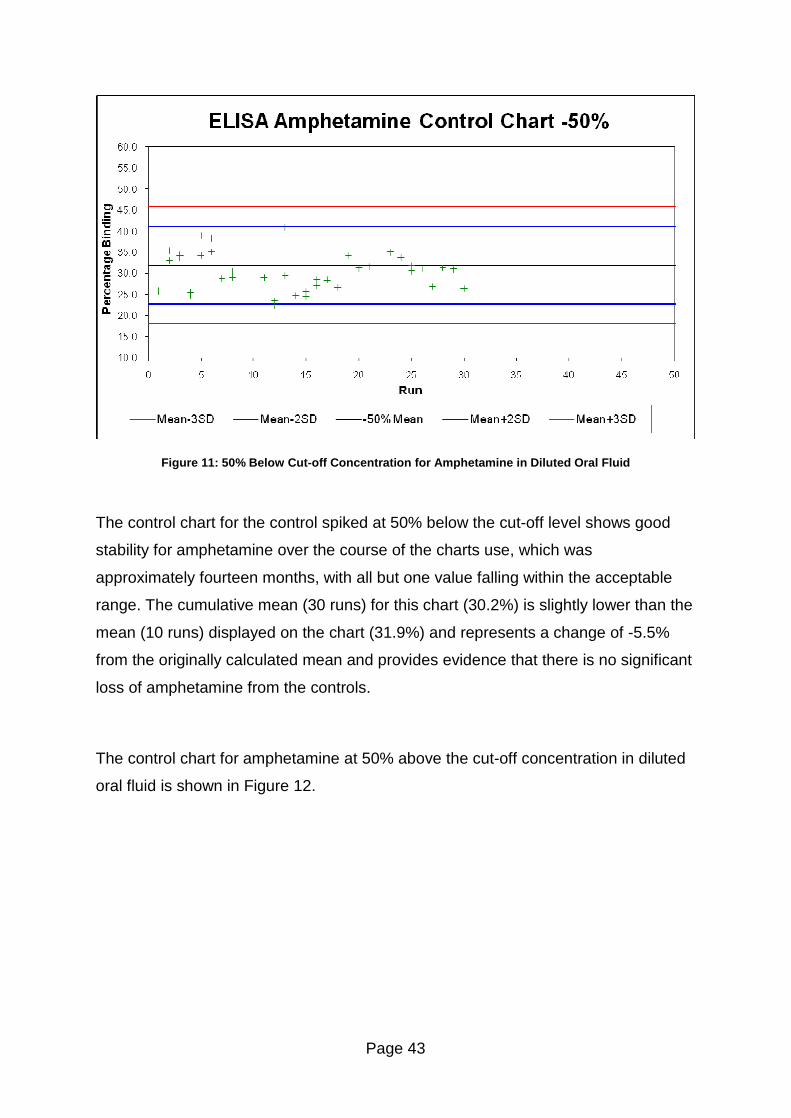
Page 43
Figure 11: 50% Below Cut-off Concentration for Amphetamine in Diluted Oral Fluid
The control chart for the control spiked at 50% below the cut-off level shows good
stability for amphetamine over the course of the charts use, which was
approximately fourteen months, with all but one value falling within the acceptable
range. The cumulative mean (30 runs) for this chart (30.2%) is slightly lower than the
mean (10 runs) displayed on the chart (31.9%) and represents a change of -5.5%
from the originally calculated mean and provides evidence that there is no significant
loss of amphetamine from the controls.
The control chart for amphetamine at 50% above the cut-off concentration in diluted
oral fluid is shown in Figure 12.
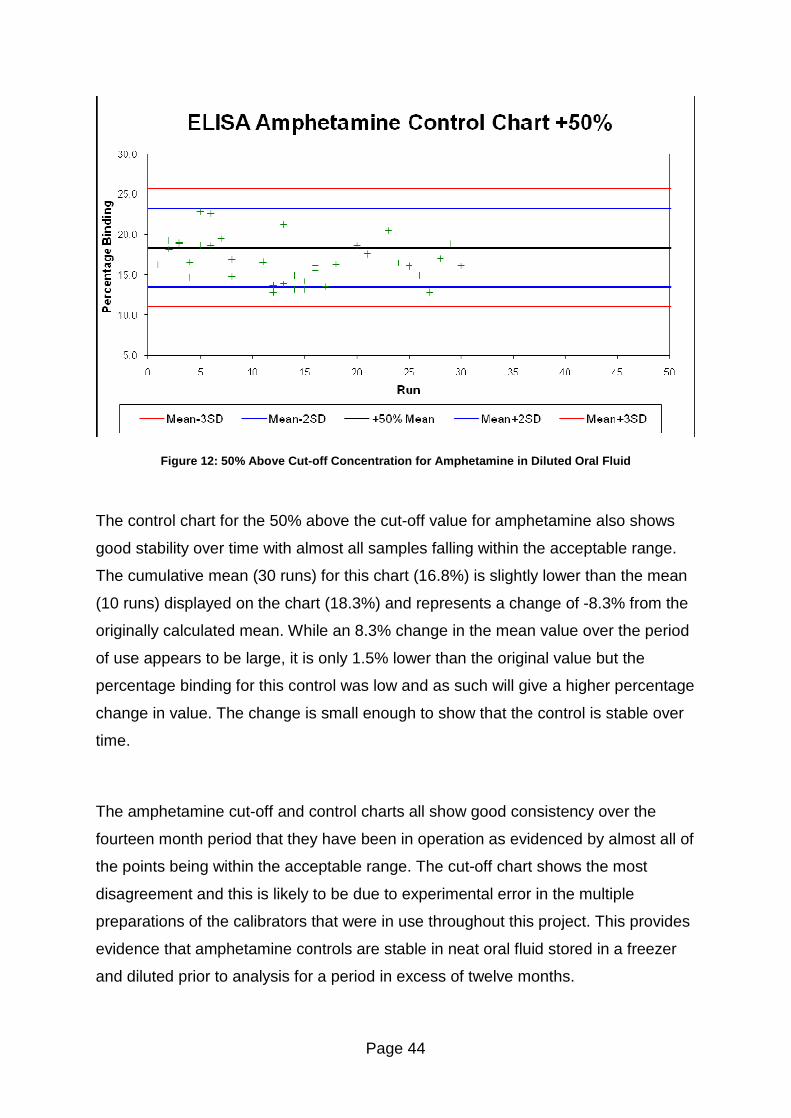
Page 44
Figure 12: 50% Above Cut-off Concentration for Amphetamine in Diluted Oral Fluid
The control chart for the 50% above the cut-off value for amphetamine also shows
good stability over time with almost all samples falling within the acceptable range.
The cumulative mean (30 runs) for this chart (16.8%) is slightly lower than the mean
(10 runs) displayed on the chart (18.3%) and represents a change of -8.3% from the
originally calculated mean. While an 8.3% change in the mean value over the period
of use appears to be large, it is only 1.5% lower than the original value but the
percentage binding for this control was low and as such will give a higher percentage
change in value. The change is small enough to show that the control is stable over
time.
The amphetamine cut-off and control charts all show good consistency over the
fourteen month period that they have been in operation as evidenced by almost all of
the points being within the acceptable range. The cut-off chart shows the most
disagreement and this is likely to be due to experimental error in the multiple
preparations of the calibrators that were in use throughout this project. This provides
evidence that amphetamine controls are stable in neat oral fluid stored in a freezer
and diluted prior to analysis for a period in excess of twelve months.
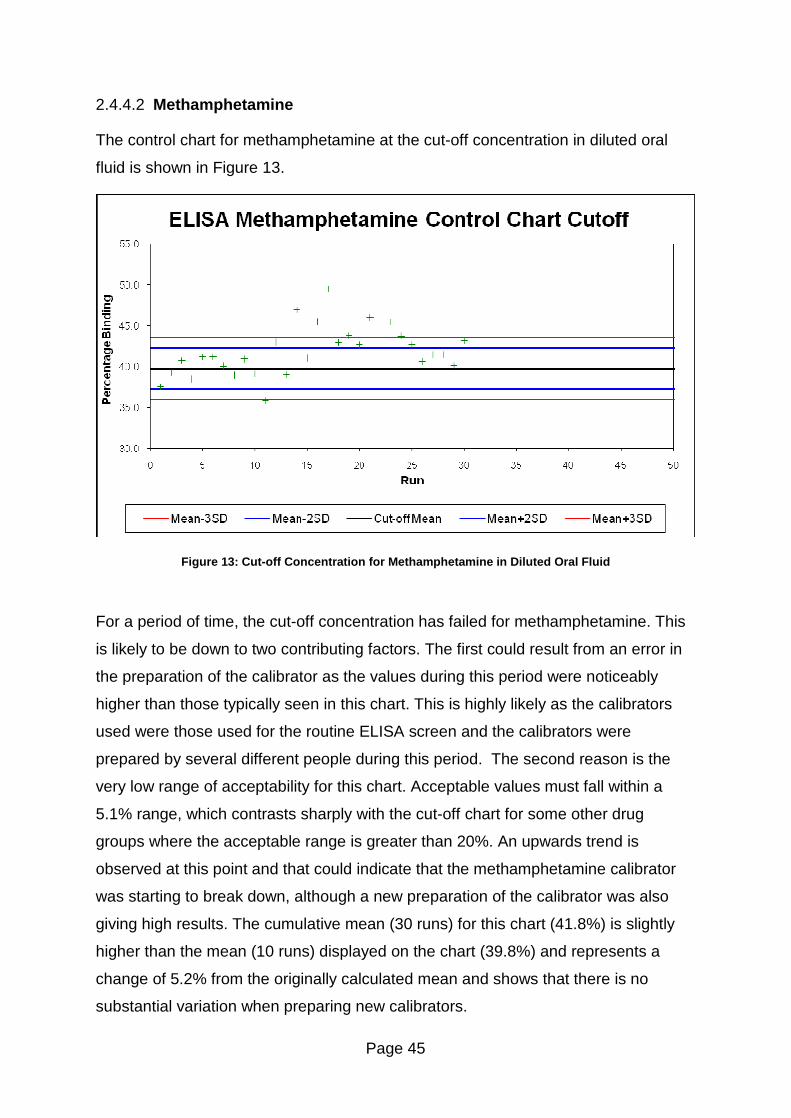
Page 45
2.4.4.2 Methamphetamine
The control chart for methamphetamine at the cut-off concentration in diluted oral
fluid is shown in Figure 13.
Figure 13: Cut-off Concentration for Methamphetamine in Diluted Oral Fluid
For a period of time, the cut-off concentration has failed for methamphetamine. This
is likely to be down to two contributing factors. The first could result from an error in
the preparation of the calibrator as the values during this period were noticeably
higher than those typically seen in this chart. This is highly likely as the calibrators
used were those used for the routine ELISA screen and the calibrators were
prepared by several different people during this period. The second reason is the
very low range of acceptability for this chart. Acceptable values must fall within a
5.1% range, which contrasts sharply with the cut-off chart for some other drug
groups where the acceptable range is greater than 20%. An upwards trend is
observed at this point and that could indicate that the methamphetamine calibrator
was starting to break down, although a new preparation of the calibrator was also
giving high results. The cumulative mean (30 runs) for this chart (41.8%) is slightly
higher than the mean (10 runs) displayed on the chart (39.8%) and represents a
change of 5.2% from the originally calculated mean and shows that there is no
substantial variation when preparing new calibrators.
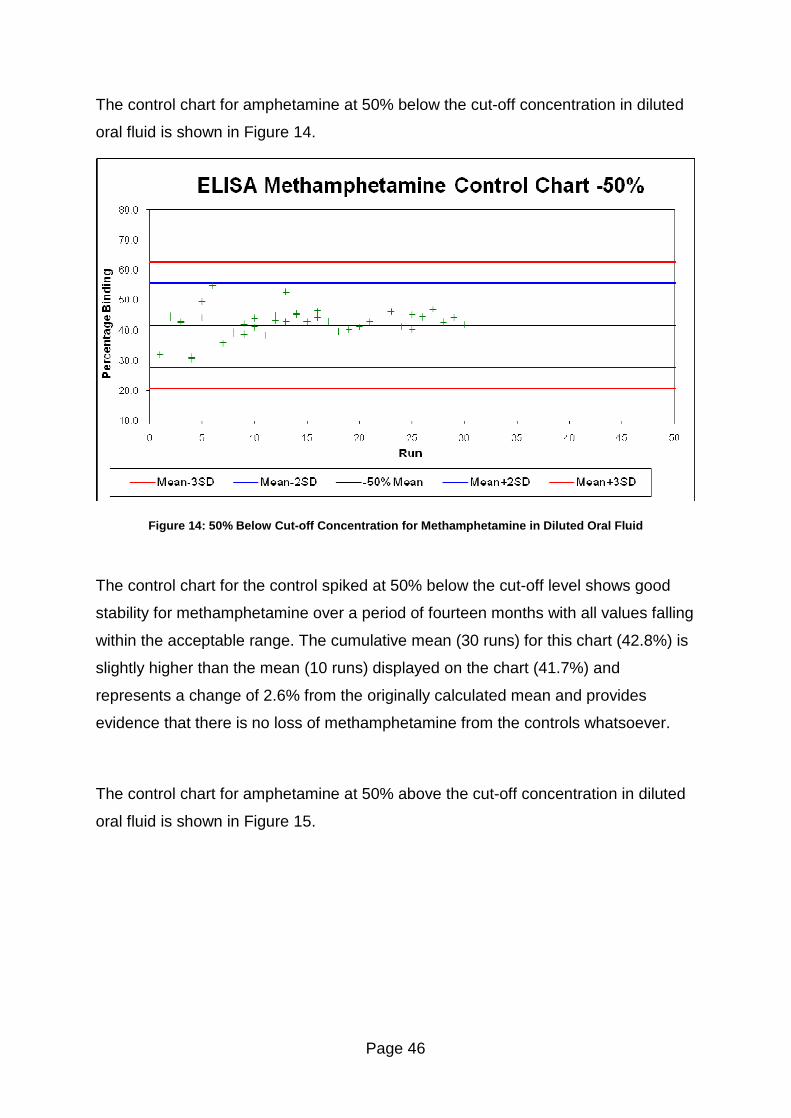
Page 46
The control chart for amphetamine at 50% below the cut-off concentration in diluted
oral fluid is shown in Figure 14.
Figure 14: 50% Below Cut-off Concentration for Methamphetamine in Diluted Oral Fluid
The control chart for the control spiked at 50% below the cut-off level shows good
stability for methamphetamine over a period of fourteen months with all values falling
within the acceptable range. The cumulative mean (30 runs) for this chart (42.8%) is
slightly higher than the mean (10 runs) displayed on the chart (41.7%) and
represents a change of 2.6% from the originally calculated mean and provides
evidence that there is no loss of methamphetamine from the controls whatsoever.
The control chart for amphetamine at 50% above the cut-off concentration in diluted
oral fluid is shown in Figure 15.
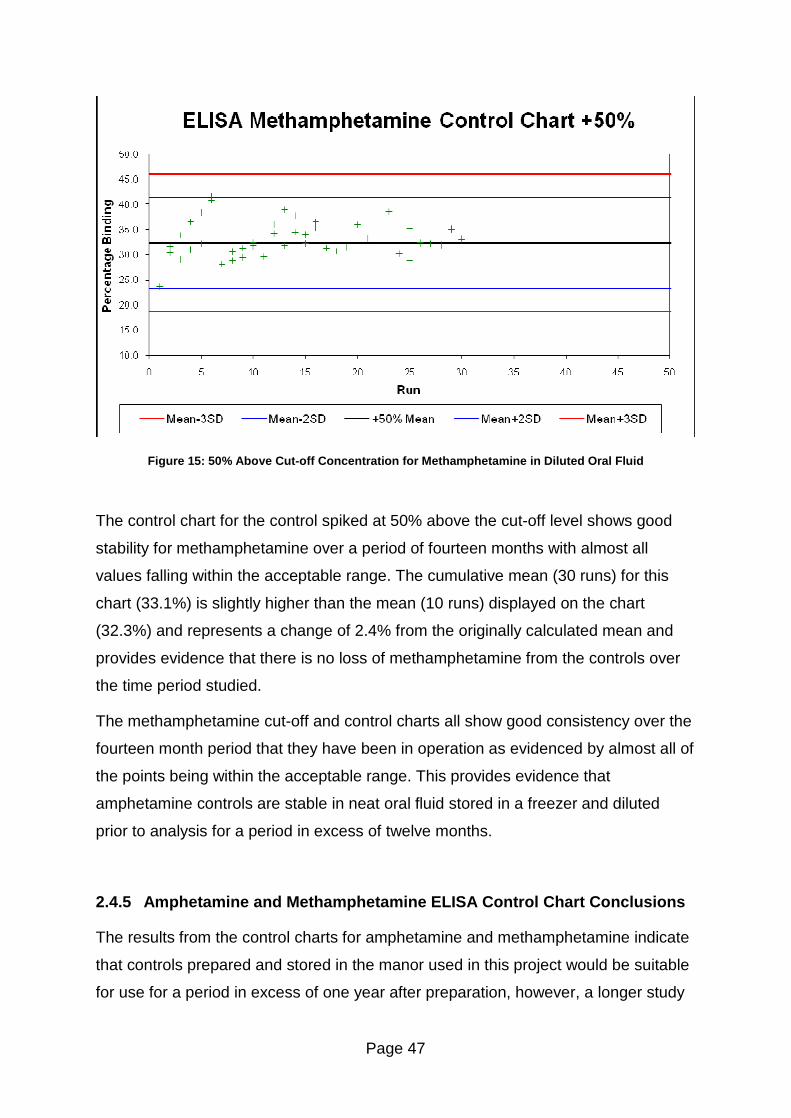
Page 47
Figure 15: 50% Above Cut-off Concentration for Methamphetamine in Diluted Oral Fluid
The control chart for the control spiked at 50% above the cut-off level shows good
stability for methamphetamine over a period of fourteen months with almost all
values falling within the acceptable range. The cumulative mean (30 runs) for this
chart (33.1%) is slightly higher than the mean (10 runs) displayed on the chart
(32.3%) and represents a change of 2.4% from the originally calculated mean and
provides evidence that there is no loss of methamphetamine from the controls over
the time period studied.
The methamphetamine cut-off and control charts all show good consistency over the
fourteen month period that they have been in operation as evidenced by almost all of
the points being within the acceptable range. This provides evidence that
amphetamine controls are stable in neat oral fluid stored in a freezer and diluted
prior to analysis for a period in excess of twelve months.
2.4.5 Amphetamine and Methamphetamine ELISA Control Chart Conclusions
The results from the control charts for amphetamine and methamphetamine indicate
that controls prepared and stored in the manor used in this project would be suitable
for use for a period in excess of one year after preparation, however, a longer study
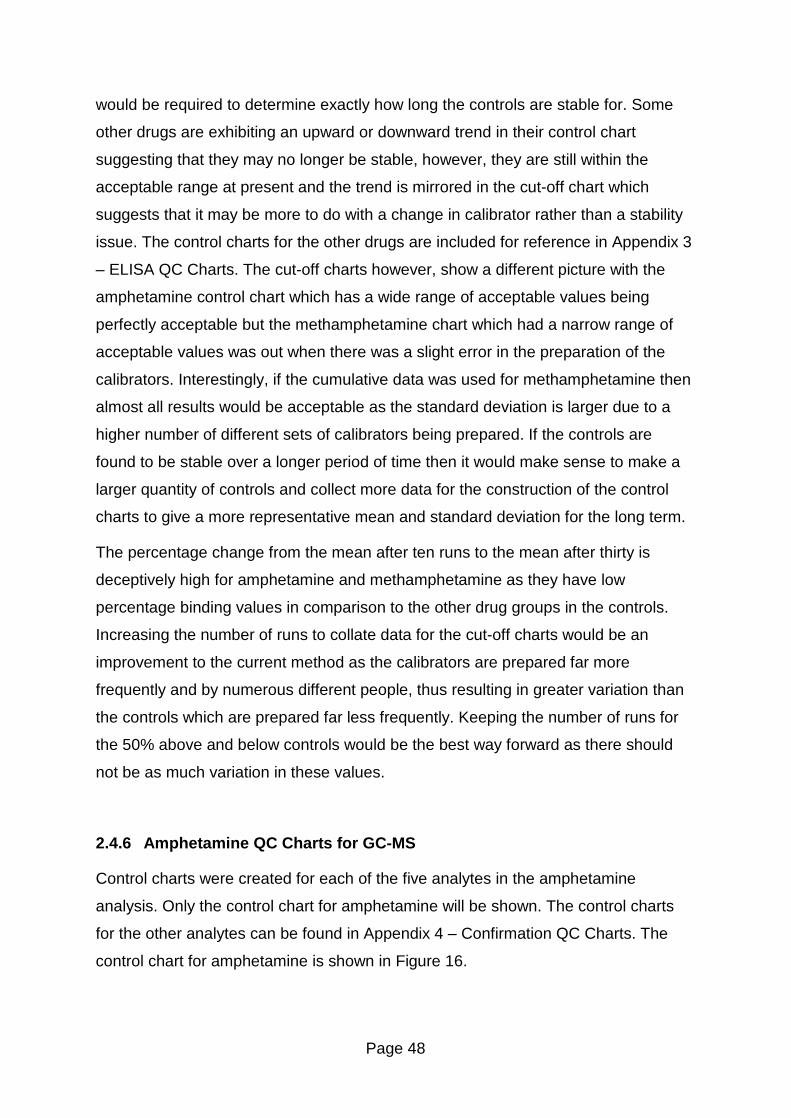
Page 48
would be required to determine exactly how long the controls are stable for. Some
other drugs are exhibiting an upward or downward trend in their control chart
suggesting that they may no longer be stable, however, they are still within the
acceptable range at present and the trend is mirrored in the cut-off chart which
suggests that it may be more to do with a change in calibrator rather than a stability
issue. The control charts for the other drugs are included for reference in Appendix 3
� ELISA QC Charts. The cut-off charts however, show a different picture with the
amphetamine control chart which has a wide range of acceptable values being
perfectly acceptable but the methamphetamine chart which had a narrow range of
acceptable values was out when there was a slight error in the preparation of the
calibrators. Interestingly, if the cumulative data was used for methamphetamine then
almost all results would be acceptable as the standard deviation is larger due to a
higher number of different sets of calibrators being prepared. If the controls are
found to be stable over a longer period of time then it would make sense to make a
larger quantity of controls and collect more data for the construction of the control
charts to give a more representative mean and standard deviation for the long term.
The percentage change from the mean after ten runs to the mean after thirty is
deceptively high for amphetamine and methamphetamine as they have low
percentage binding values in comparison to the other drug groups in the controls.
Increasing the number of runs to collate data for the cut-off charts would be an
improvement to the current method as the calibrators are prepared far more
frequently and by numerous different people, thus resulting in greater variation than
the controls which are prepared far less frequently. Keeping the number of runs for
the 50% above and below controls would be the best way forward as there should
not be as much variation in these values.
2.4.6 Amphetamine QC Charts for GC-MS
Control charts were created for each of the five analytes in the amphetamine
analysis. Only the control chart for amphetamine will be shown. The control charts
for the other analytes can be found in Appendix 4 � Confirmation QC Charts. The
control chart for amphetamine is shown in Figure 16.
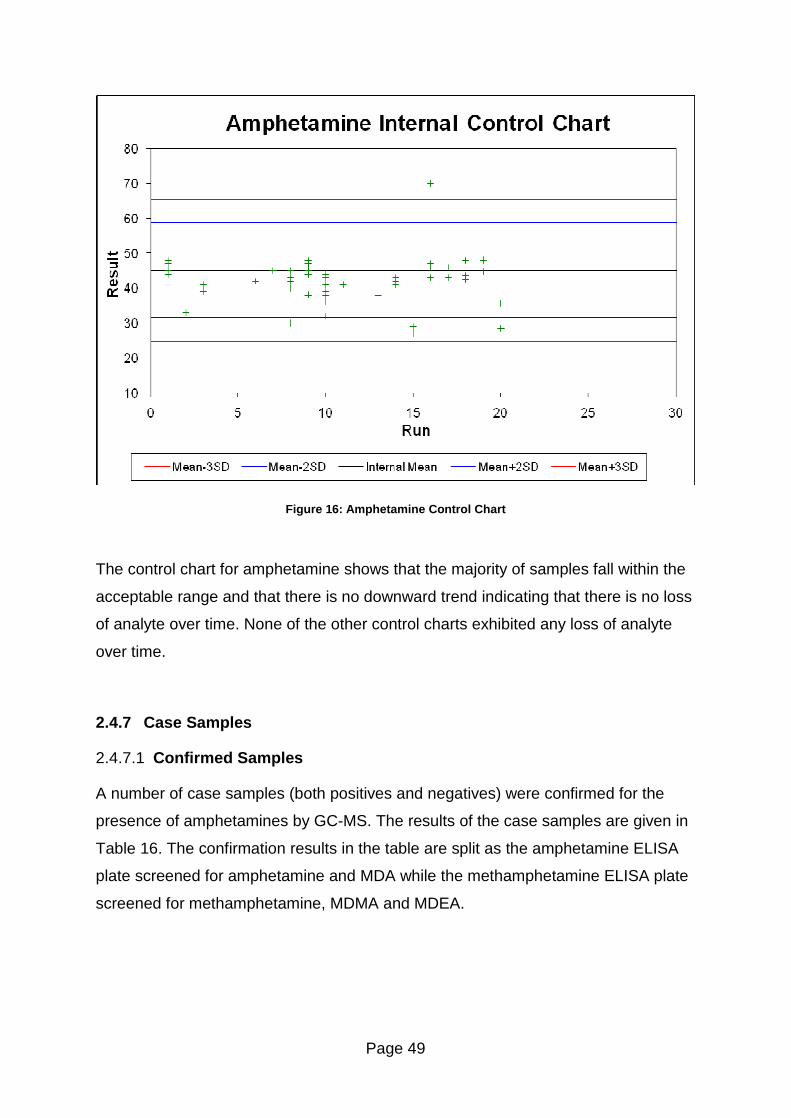
Page 49
Figure 16: Amphetamine Control Chart
The control chart for amphetamine shows that the majority of samples fall within the
acceptable range and that there is no downward trend indicating that there is no loss
of analyte over time. None of the other control charts exhibited any loss of analyte
over time.
2.4.7 Case Samples
2.4.7.1 Confirmed Samples
A number of case samples (both positives and negatives) were confirmed for the
presence of amphetamines by GC-MS. The results of the case samples are given in
Table 16. The confirmation results in the table are split as the amphetamine ELISA
plate screened for amphetamine and MDA while the methamphetamine ELISA plate
screened for methamphetamine, MDMA and MDEA.
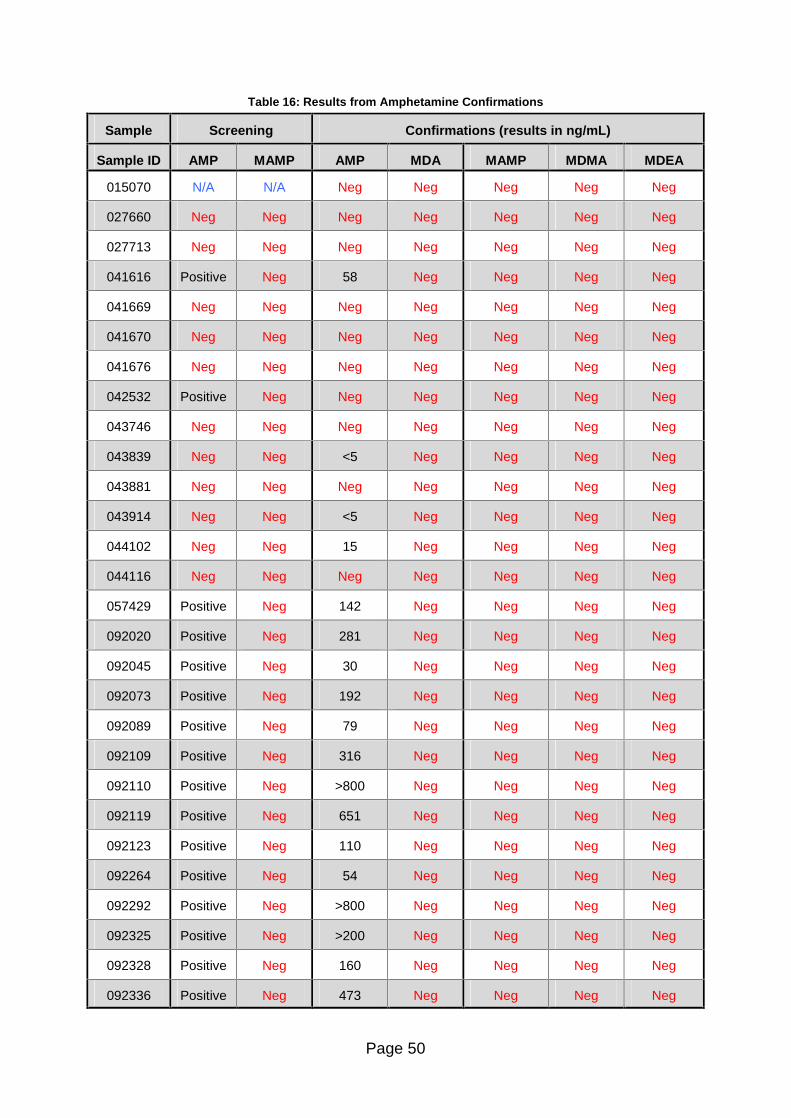
Page 50
Table 16: Results from Amphetamine Confirmations
Sample Screening Confirmations (results in ng/mL)
Sample ID AMP MAMP AMP MDA MAMP MDMA MDEA
015070 N/A N/A Neg Neg Neg Neg Neg
027660 Neg Neg Neg Neg Neg Neg Neg
027713 Neg Neg Neg Neg Neg Neg Neg
041616 Positive Neg 58 Neg Neg Neg Neg
041669 Neg Neg Neg Neg Neg Neg Neg
041670 Neg Neg Neg Neg Neg Neg Neg
041676 Neg Neg Neg Neg Neg Neg Neg
042532 Positive Neg Neg Neg Neg Neg Neg
043746 Neg Neg Neg Neg Neg Neg Neg
043839 Neg Neg <5 Neg Neg Neg Neg
043881 Neg Neg Neg Neg Neg Neg Neg
043914 Neg Neg <5 Neg Neg Neg Neg
044102 Neg Neg 15 Neg Neg Neg Neg
044116 Neg Neg Neg Neg Neg Neg Neg
057429 Positive Neg 142 Neg Neg Neg Neg
092020 Positive Neg 281 Neg Neg Neg Neg
092045 Positive Neg 30 Neg Neg Neg Neg
092073 Positive Neg 192 Neg Neg Neg Neg
092089 Positive Neg 79 Neg Neg Neg Neg
092109 Positive Neg 316 Neg Neg Neg Neg
092110 Positive Neg >800 Neg Neg Neg Neg
092119 Positive Neg 651 Neg Neg Neg Neg
092123 Positive Neg 110 Neg Neg Neg Neg
092264 Positive Neg 54 Neg Neg Neg Neg
092292 Positive Neg >800 Neg Neg Neg Neg
092325 Positive Neg >200 Neg Neg Neg Neg
092328 Positive Neg 160 Neg Neg Neg Neg
092336 Positive Neg 473 Neg Neg Neg Neg
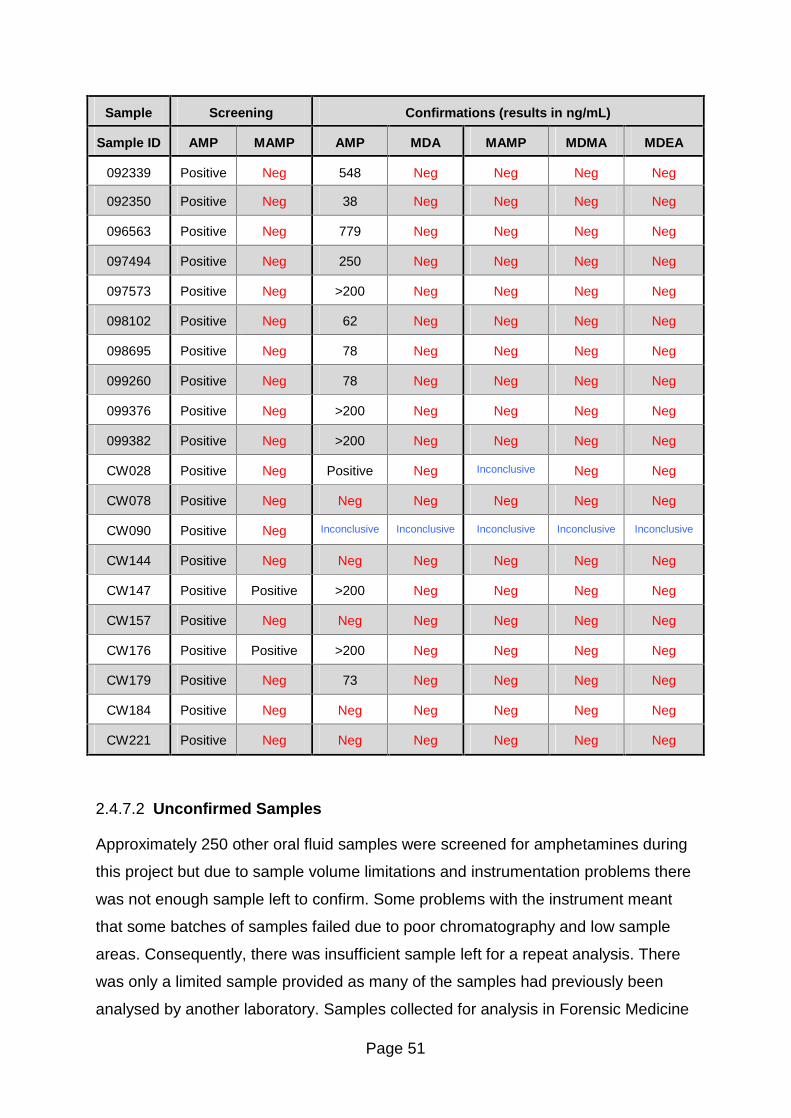
Page 51
Sample Screening Confirmations (results in ng/mL)
Sample ID AMP MAMP AMP MDA MAMP MDMA MDEA
092339 Positive Neg 548 Neg Neg Neg Neg
092350 Positive Neg 38 Neg Neg Neg Neg
096563 Positive Neg 779 Neg Neg Neg Neg
097494 Positive Neg 250 Neg Neg Neg Neg
097573 Positive Neg >200 Neg Neg Neg Neg
098102 Positive Neg 62 Neg Neg Neg Neg
098695 Positive Neg 78 Neg Neg Neg Neg
099260 Positive Neg 78 Neg Neg Neg Neg
099376 Positive Neg >200 Neg Neg Neg Neg
099382 Positive Neg >200 Neg Neg Neg Neg
CW028 Positive Neg Positive Neg Inconclusive
Neg Neg Neg
CW078 Positive Neg Neg Neg Neg Neg Neg
CW090 Positive Neg Inconclusive Inconclusive Inconclusive Inconclusive Inconclusive
CW144 Positive Neg Neg Neg Neg Neg Neg
CW147 Positive Positive >200 Neg Neg Neg Neg
CW157 Positive Neg Neg Neg Neg Neg Neg
CW176 Positive Positive >200 Neg Neg Neg Neg
CW179 Positive Neg 73 Neg Neg Neg Neg
CW184 Positive Neg Neg Neg Neg Neg Neg
CW221 Positive Neg Neg Neg Neg Neg Neg
2.4.7.2 Unconfirmed Samples
Approximately 250 other oral fluid samples were screened for amphetamines during
this project but due to sample volume limitations and instrumentation problems there
was not enough sample left to confirm. Some problems with the instrument meant
that some batches of samples failed due to poor chromatography and low sample
areas. Consequently, there was insufficient sample left for a repeat analysis. There
was only a limited sample provided as many of the samples had previously been
analysed by another laboratory. Samples collected for analysis in Forensic Medicine
Page 52
and Science were part of a drug treatment program and were frequently analysed for
other drug groups, thus being insufficient in volume for amphetamine analysis.
2.4.8 Sensitivity and Specificity
2.4.8.1 Amphetamine and MDA
This assay screened for amphetamine and MDA so the following calculations apply
to these drugs as a group and not individually. There were 29 true positives, 11* true
negatives, 6 false positives and no* false negatives for the amphetamine assay.
*Three samples confirmed positive but screened negative as they were below the
screening method cut-off and were thus deemed to be true negatives and not false
negatives.
Following the calculation given in section 2.3.6 the sensitivity of the amphetamine
assay was calculated as 100% and the specificity was calculated as 65%.
2.4.8.2 Methamphetamine, MDMA and MDEA
This assay screened for methamphetamine, MDMA and MDEA so the following
calculations would normally apply to these drugs as a group and not individually.
However, in this case, as there were no positives for any of the drugs, the calculation
does hold true for each drug individually. There were no true positives, 44 true
negatives, 2 false positives and no false negatives for the methamphetamine assay.
Following the calculation given in section 2.3.6 the sensitivity of the
methamphetamine assay was unable to be calculated as there were no positive
confirmations and the specificity was calculated as 96%.
2.4.9 Case Sample Conclusions
Most of the confirmation results matched up with the screening results for the 48
confirmation tests carried out. However, there were a few discrepancies. Inevitably,
some of these are false positives which are to be expected, but there were a few
�false negatives� which is worrying. Admittedly, the �false negatives�, when
confirmed gave results below the lowest standard and after taking the dilution factor
Page 53
into account (only 0.25mL of sample was available for analysis), the results were
below the in-house ELISA cut-off concentration and were therefore correctly marked
as negative by ELISA. The amphetamine assay was found to be very sensitive and
correctly detected 100% of the positive samples. Both assays of interest had high
specificity of 65% and 96% for amphetamines and methamphetamines respectively,
which shows both assays were good at eliminating negative results from
confirmation tests.
Overall the amphetamine and methamphetamine ELISA assays work well and the
controls prepared in-house are stable over time. This method can be used as an
effective screening tool in a routine toxicology laboratory as only samples which
confirmed as below the screening cut-off concentration were falsely screened as
negative. However, some further work on the sensitivity of the assay at low
concentrations would be recommended to ensure complete confidence in the
assays.
Page 54
3 Alcohol Enzymatic Analysis
3.1 Materials and Reagents
3.1.1 Immunalysis Corporation (Pomona, CA) Oral Fluid Alcohol Kit
An alcohol oral fluid kit (502-0500, Lot No: EK4354) containing reagent A (Tris buffer
with 0.1% sodium azide as a preservative), reagent E (containing ADH and NAD in
Tris buffer with stabilizers and 0.1% sodium azide as a preservative) and Quantisal
extraction buffer (product code: EXTBUF-1000) along with blank 96 well plates were
manufactured by Immunalysis Corporation (Pomona, CA) and purchased from
Agriyork 400 Ltd (Pocklington, UK), their UK based distributor. The kits were stored
at or below 8°C in the refrigerator. The specification for the assay is given in
Appendix 5 � Alcohol Assay Specification.
3.1.2 Ethanol Standards
3.1.2.1 Calibrators
Ethanol certified reference standards in 1.2mL of water at the concentrations
detailed in Table 17, were manufactured by Cerilliant (Round Rock, TX), and
purchased from their UK based distributor, LGC Standards (Teddington, UK). The
standards were stored at or below 8°C in the refrigerator. The same calibrators were
used for the screening and confirmation methods.
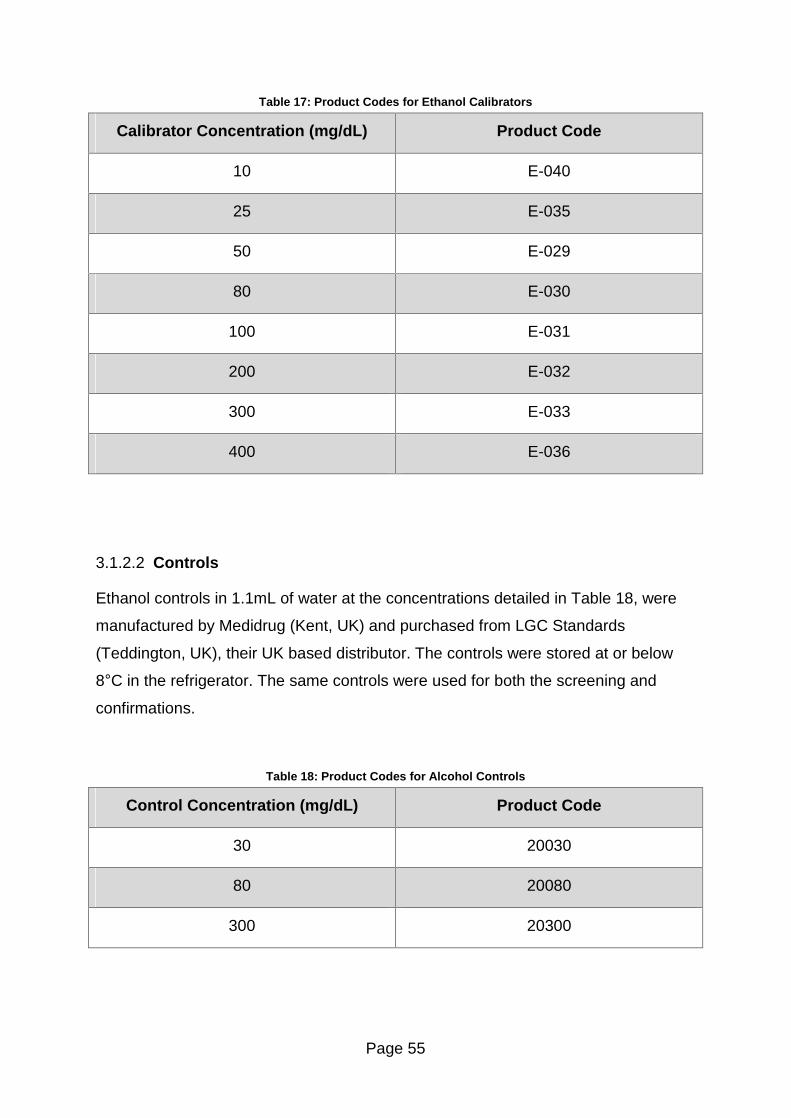
Page 55
Table 17: Product Codes for Ethanol Calibrators
Calibrator Concentration (mg/dL) Product Code
10 E-040
25 E-035
50 E-029
80 E-030
100 E-031
200 E-032
300 E-033
400 E-036
3.1.2.2 Controls
Ethanol controls in 1.1mL of water at the concentrations detailed in Table 18, were
manufactured by Medidrug (Kent, UK) and purchased from LGC Standards
(Teddington, UK), their UK based distributor. The controls were stored at or below
8°C in the refrigerator. The same controls were used for both the screening and
confirmations.
Table 18: Product Codes for Alcohol Controls
Control Concentration (mg/dL) Product Code
30 20030
80 20080
300 20300
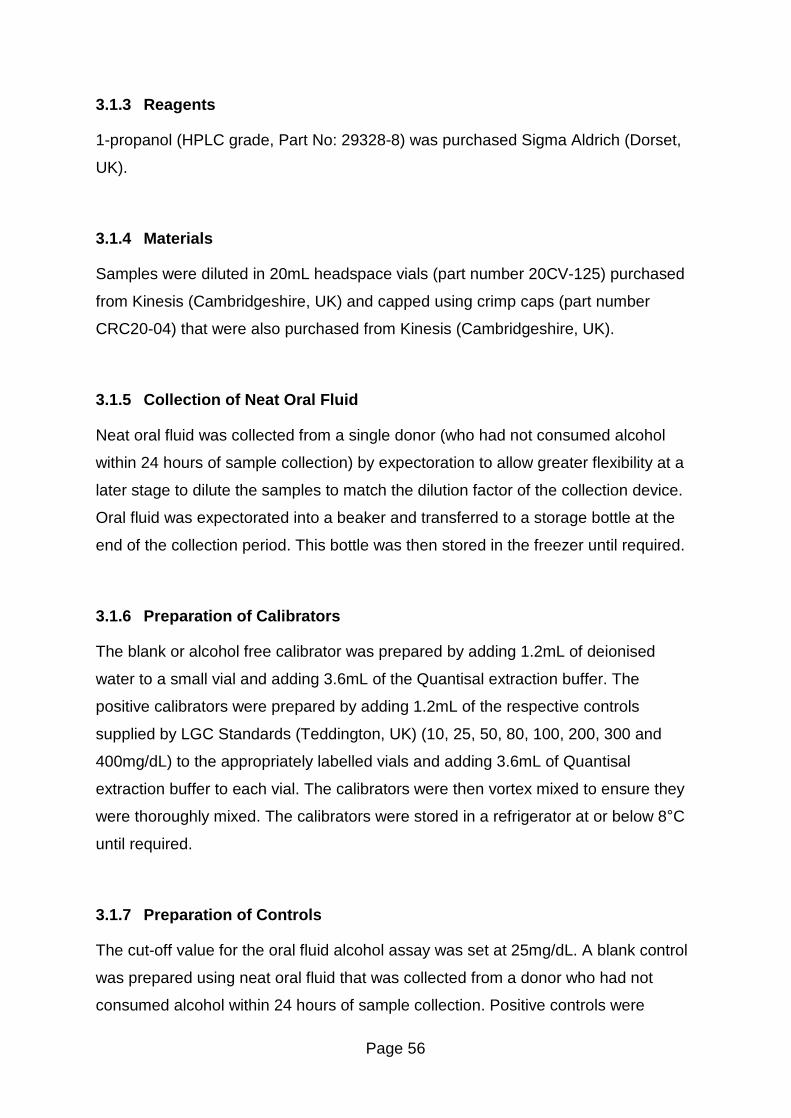
Page 56
3.1.3 Reagents
1-propanol (HPLC grade, Part No: 29328-8) was purchased Sigma Aldrich (Dorset,
UK).
3.1.4 Materials
Samples were diluted in 20mL headspace vials (part number 20CV-125) purchased
from Kinesis (Cambridgeshire, UK) and capped using crimp caps (part number
CRC20-04) that were also purchased from Kinesis (Cambridgeshire, UK).
3.1.5 Collection of Neat Oral Fluid
Neat oral fluid was collected from a single donor (who had not consumed alcohol
within 24 hours of sample collection) by expectoration to allow greater flexibility at a
later stage to dilute the samples to match the dilution factor of the collection device.
Oral fluid was expectorated into a beaker and transferred to a storage bottle at the
end of the collection period. This bottle was then stored in the freezer until required.
3.1.6 Preparation of Calibrators
The blank or alcohol free calibrator was prepared by adding 1.2mL of deionised
water to a small vial and adding 3.6mL of the Quantisal extraction buffer. The
positive calibrators were prepared by adding 1.2mL of the respective controls
supplied by LGC Standards (Teddington, UK) (10, 25, 50, 80, 100, 200, 300 and
400mg/dL) to the appropriately labelled vials and adding 3.6mL of Quantisal
extraction buffer to each vial. The calibrators were then vortex mixed to ensure they
were thoroughly mixed. The calibrators were stored in a refrigerator at or below 8°C
until required.
3.1.7 Preparation of Controls
The cut-off value for the oral fluid alcohol assay was set at 25mg/dL. A blank control
was prepared using neat oral fluid that was collected from a donor who had not
consumed alcohol within 24 hours of sample collection. Positive controls were
Page 57
prepared at 50% below and 50% above the cut-off value (i.e. 12.5 and 37.5mg/dL
respectively). Two vials (1.1mL each) of 300mg/dL alcohol control (Medidrug) were
added to a small vial. This was followed by 4.4mL of water to dilute the solution to
100mg/dL. The solution was vortex mixed. To prepare the 50% below and 50%
above controls, 1.25mL and 3.75mL of the 100mg/dL alcohol solution was added to
the appropriately labelled 10mL volumetric flasks and made up to the mark with
blank oral fluid. The solutions were inverted several times to ensure the solution was
thoroughly mixed then transferred to a storage bottle and 30mL of Quantisal buffer
was added to each control to match the dilution of the calibrators and samples. The
controls were stored in a refrigerator at or below 8°C until required.
3.1.8 Preparation of Alcohol Internal Standard (1-propanol)
The alcohol internal standard was prepared by adding 1-propanol (0.33mL) to a 1L
volumetric flask and making up to the mark with de-ionised water to give a
concentration of 150mg/dL. The solution was inverted several times to ensure it was
thoroughly mixed and transferred to a labelled bottle and stored at room
temperature.
3.1.9 Equipment
Plates were read using a MRX microplate reader using a 340nm filter which was
purchased from Dynex Technologies. Revelation software (version 4.25) was used
to control the MRX microplate reader and read the absorbance of the samples.
The pipettes used in this project were calibrated by the United Kingdom
Accreditation Service (UKAS) to ISO/IEC 17025 standard. Standards were prepared
in volumetric flasks provided by Fisherbrand (Leicestershire, UK).
The dilutions for the alcohol confirmations were carried out using a Compudil 300
dilutor which was purchased from Hood & Tucker (Surrey, UK).
Alcohol confirmations were carried out on two GC-FIDs. Both instruments were fitted
with ThermoQuest Trace GC 2000 series gas chromatographs purchased from
Thermo Scientific (Hertfordshire, UK). The instruments were fitted with different auto-
samplers, one used a ThermoQuest HS 2000 auto-sampler and the other used a
Page 58
ThermoQuest HS 850 auto-sampler. Both auto-samplers were purchased from
Thermo Scientific (Hertfordshire, UK). ChromQuest software (version 2.53) was used
on both instruments and was purchased from Thermo Scientific (Hertfordshire, UK).
The gas chromatographs were fitted with a RXT-1 (30m x 0.25mm x 0.25µm) and a
RXT-2 (30m x 0.25mm x 0.25µm) GC column purchased from Thames Restek
(Buckinghamshire, UK).
3.1.10 Case Samples
Case samples for this project were provided from a single source. Quantum
Diagnostics (Essex, UK) provided approximately 100 samples for this project.
3.2 Methods
3.2.1 Manufacturer�s Instructions for Alcohol Enzymatic Assay
The procedure used in this project was an adapted version of the method
recommended by the manufacturer (Immunalysis Corporation (Pomona, CA)
Corporation Catalog Number 502-0500, Version 6/2006), who recommend the use of
a five point calibration at 0, 20, 40, 80 and 160mg/dL. To allow this method to follow
the in-house ELISA method for drugs of abuse, it was decided to use a four point
calibration including a blank. A flowchart detailing the steps in this procedure is
shown in Figure 17.
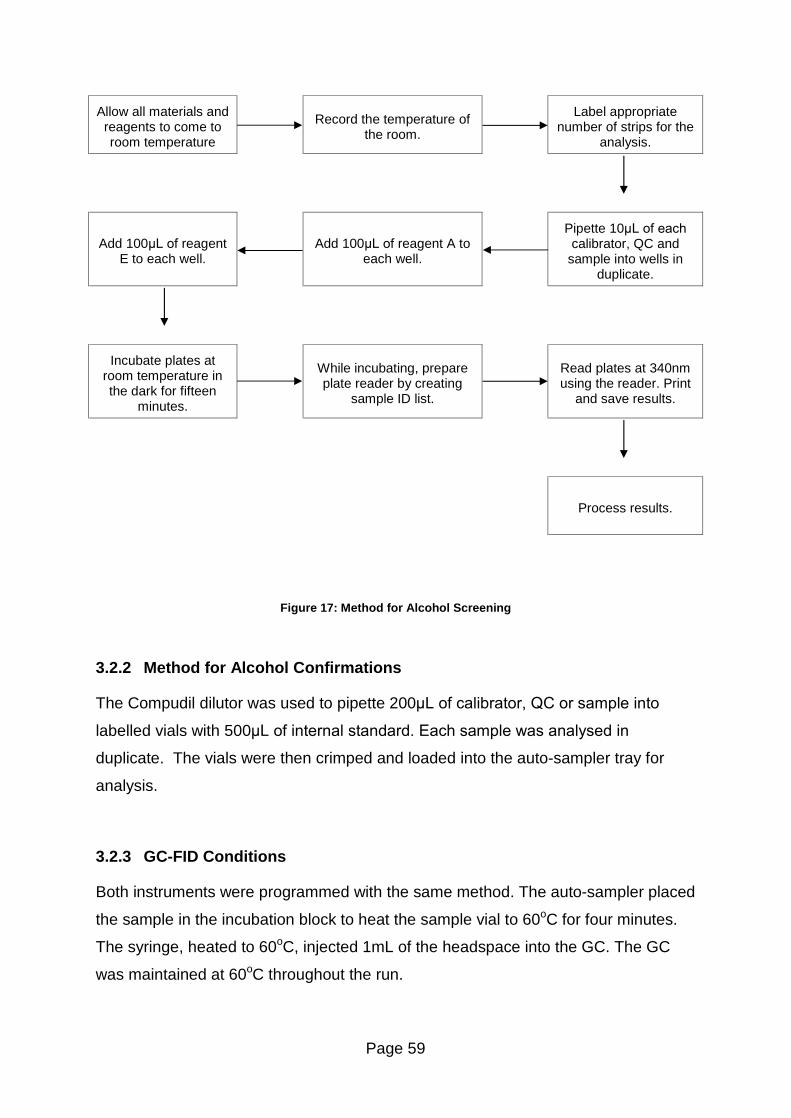
Page 59
Allow all materials and reagents to come to room temperature
Record the temperature of
the room.
Label appropriate number of strips for the
analysis.
Add 100µL of reagent E to each well.
Add 100µL of reagent A to
each well.
Pipette 10µL of each
calibrator, QC and sample into wells in
duplicate.
Incubate plates at room temperature in the dark for fifteen
minutes.
While incubating, prepare plate reader by creating
sample ID list.
Read plates at 340nm using the reader. Print
and save results.
Process results.
Figure 17: Method for Alcohol Screening
3.2.2 Method for Alcohol Confirmations
The Compudil dilutor was used to pipette 200µL of calibrator, QC or sample into
labelled vials with 500µL of internal standard. Each sample was analysed in
duplicate. The vials were then crimped and loaded into the auto-sampler tray for
analysis.
3.2.3 GC-FID Conditions
Both instruments were programmed with the same method. The auto-sampler placed
the sample in the incubation block to heat the sample vial to 60oC for four minutes.
The syringe, heated to 60oC, injected 1mL of the headspace into the GC. The GC
was maintained at 60oC throughout the run.
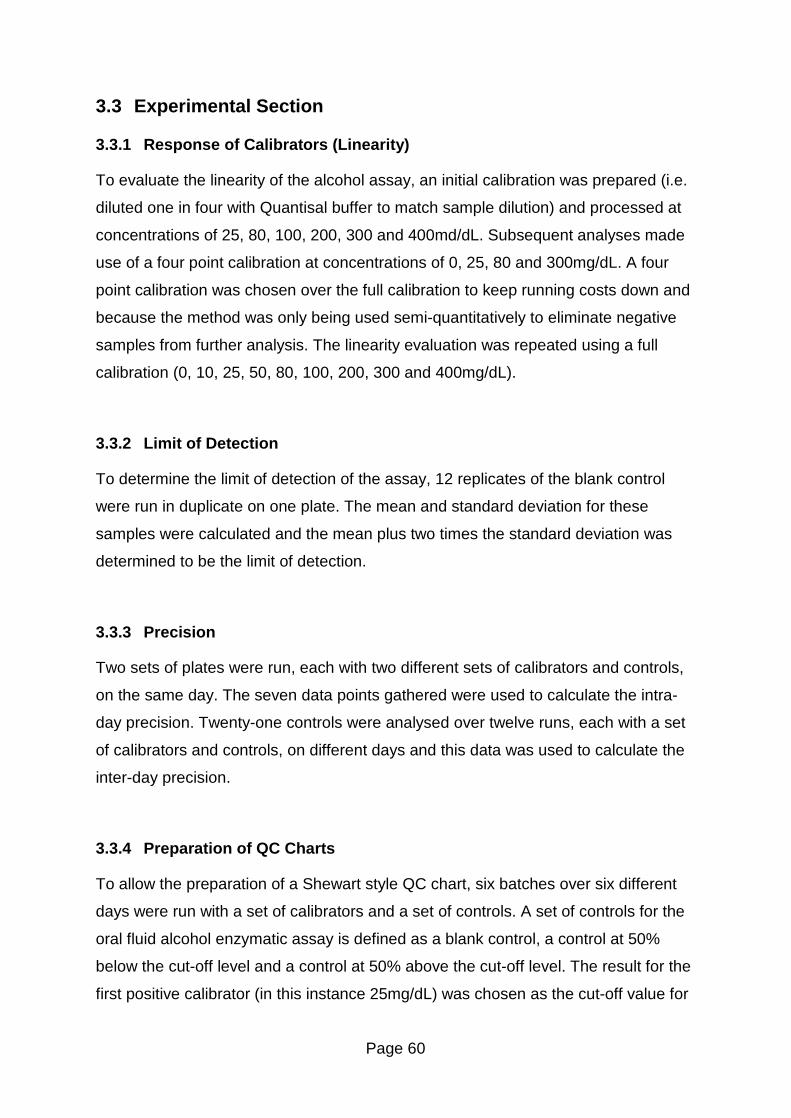
Page 60
3.3 Experimental Section
3.3.1 Response of Calibrators (Linearity)
To evaluate the linearity of the alcohol assay, an initial calibration was prepared (i.e.
diluted one in four with Quantisal buffer to match sample dilution) and processed at
concentrations of 25, 80, 100, 200, 300 and 400md/dL. Subsequent analyses made
use of a four point calibration at concentrations of 0, 25, 80 and 300mg/dL. A four
point calibration was chosen over the full calibration to keep running costs down and
because the method was only being used semi-quantitatively to eliminate negative
samples from further analysis. The linearity evaluation was repeated using a full
calibration (0, 10, 25, 50, 80, 100, 200, 300 and 400mg/dL).
3.3.2 Limit of Detection
To determine the limit of detection of the assay, 12 replicates of the blank control
were run in duplicate on one plate. The mean and standard deviation for these
samples were calculated and the mean plus two times the standard deviation was
determined to be the limit of detection.
3.3.3 Precision
Two sets of plates were run, each with two different sets of calibrators and controls,
on the same day. The seven data points gathered were used to calculate the intra-
day precision. Twenty-one controls were analysed over twelve runs, each with a set
of calibrators and controls, on different days and this data was used to calculate the
inter-day precision.
3.3.4 Preparation of QC Charts
To allow the preparation of a Shewart style QC chart, six batches over six different
days were run with a set of calibrators and a set of controls. A set of controls for the
oral fluid alcohol enzymatic assay is defined as a blank control, a control at 50%
below the cut-off level and a control at 50% above the cut-off level. The result for the
first positive calibrator (in this instance 25mg/dL) was chosen as the cut-off value for

Page 61
the assay. A QC chart was constructed after six replicates of the controls had been
run. Subsequent data points were plotted on this chart to monitor the stability of the
controls over time.
QC charts were constructed for the cut-off value and the controls at 50% above and
50% below the cut-off value. As all samples are analysed in duplicate, the variation
between these results was monitored and any outlying points could be disregarded.
The acceptable level of variation between the calibrators was 15% and between
samples was 20%.
3.3.5 Stability of Calibrators
As ethanol is a volatile substance, it was decided to evaluate the stability of the
controls over a two week period to determine if any ethanol was lost when the
calibrators were stored in screw cap reagent bottles in the refrigerator. The
absorbance of each of the calibrators was recorded and plotted on one graph to
show any changes. Analyses were carried out on the day of preparation and on
seven other occasions over the fourteen day period.
3.3.6 Stability of Alcohol Controls in Oral Fluid
The stability of oral fluid samples spiked with alcohol at 40mg/dL was examined over
a fourteen day period. Spiked oral fluid was prepared by adding 0.5mL of 400mg/dL
alcohol standard to a 5mL volumetric flask and making up to the mark with neat oral
fluid. This solution was transferred to a 20mL volumetric flask and made up to the
mark with Quantisal buffer. 1mL aliquots of this solution were pipetted into small
storage vials with half being stored in the refrigerator below 8°C and the other half
stored in a cupboard at room temperature (typically 16 - 21°C). Two vials from each
set of storage conditions were analysed on six separate days. Samples were
analysed on the day of preparation and on five further occasions over the two week
period.
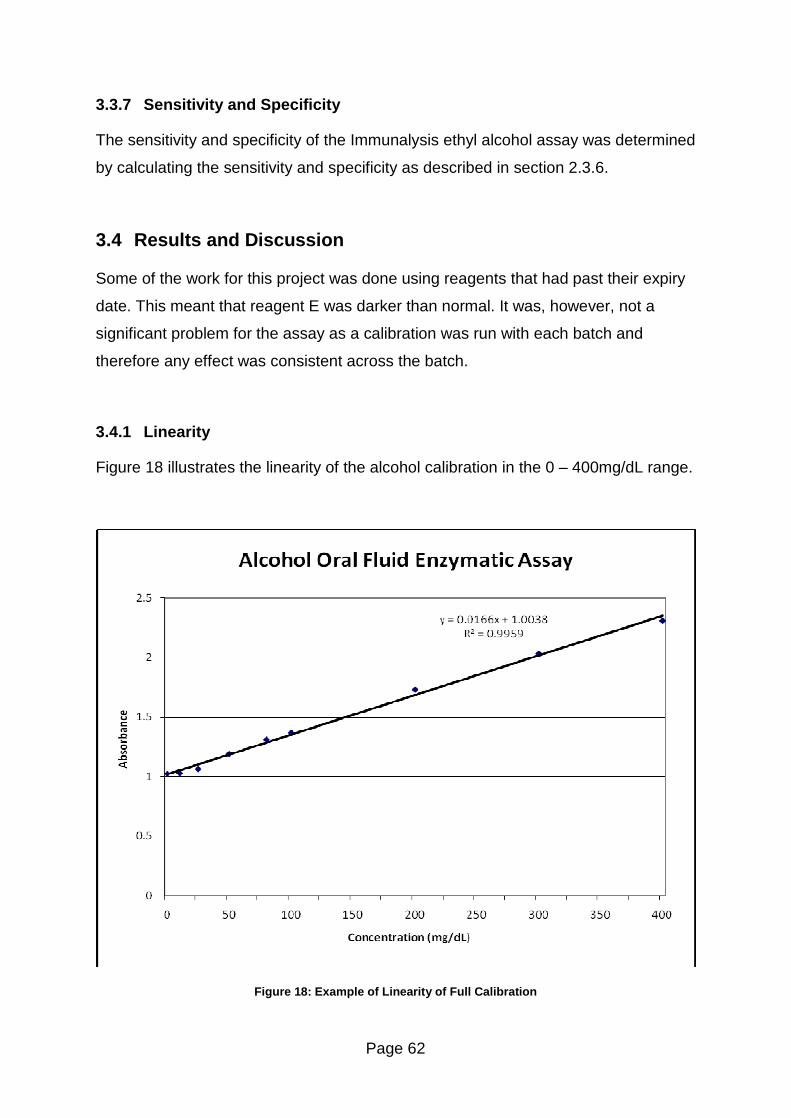
Page 62
3.3.7 Sensitivity and Specificity
The sensitivity and specificity of the Immunalysis ethyl alcohol assay was determined
by calculating the sensitivity and specificity as described in section 2.3.6.
3.4 Results and Discussion
Some of the work for this project was done using reagents that had past their expiry
date. This meant that reagent E was darker than normal. It was, however, not a
significant problem for the assay as a calibration was run with each batch and
therefore any effect was consistent across the batch.
3.4.1 Linearity
Figure 18 illustrates the linearity of the alcohol calibration in the 0 � 400mg/dL range.
Figure 18: Example of Linearity of Full Calibration
Page 63
As can be seen above, the Immunalysis Corporation (Pomona, CA) alcohol oral fluid
assay demonstrates good linearity over the 0 � 400mg/dL range as evidenced by the
R2 value, which was above 0.99. As this method was being evaluated as a screening
method, a full calibration was not necessary, and four points from the calibration
above were run with all other batches.
An example of this four point calibration is shown in Figure 19.
Figure 19: Example of Alcohol Oral Fluid Linearity
The Immunalysis Corporation (Pomona, CA) alcohol oral fluid assay demonstrates
good linearity when used with a four point calibration over the 0 � 300mg/dL range
as evidenced by the R2 value, which was above 0.99.
3.4.2 Limit of Detection
Table 19 summarises the statistical variation of twelve replicates of the blank control
that were analysed in duplicate in a single batch.
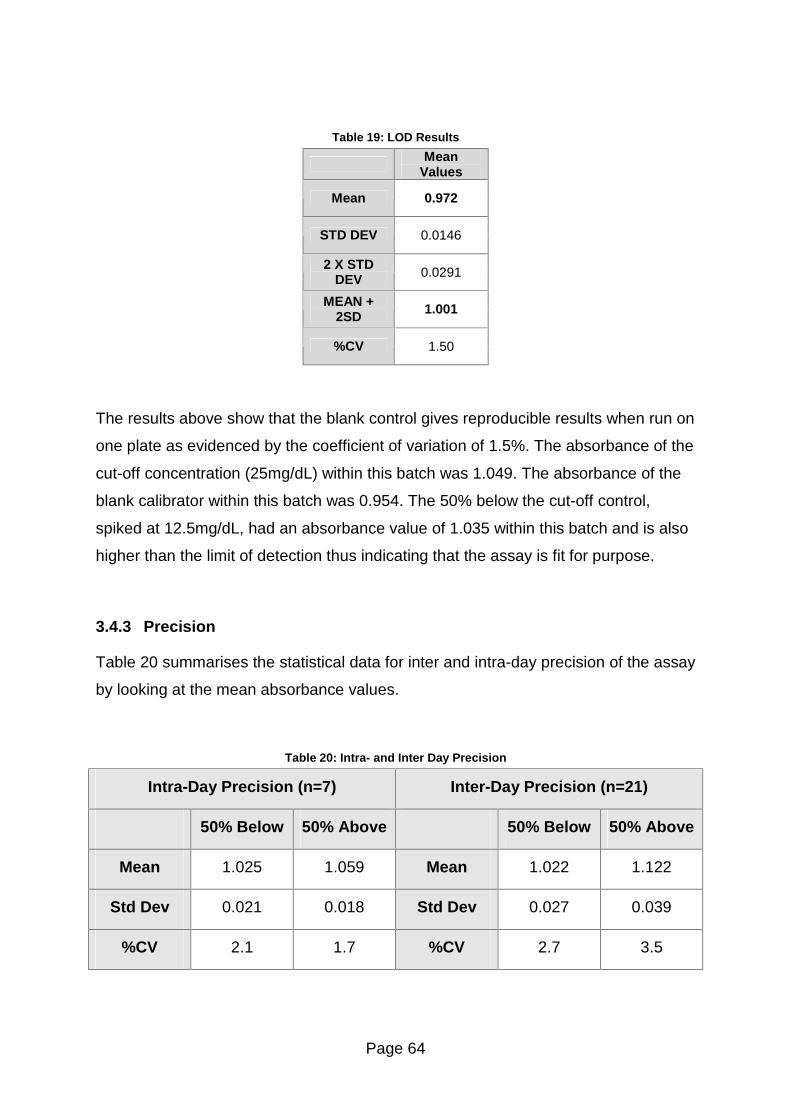
Page 64
Table 19: LOD Results
Mean Values
Mean 0.972
STD DEV 0.0146
2 X STD DEV 0.0291
MEAN + 2SD 1.001
%CV 1.50
The results above show that the blank control gives reproducible results when run on
one plate as evidenced by the coefficient of variation of 1.5%. The absorbance of the
cut-off concentration (25mg/dL) within this batch was 1.049. The absorbance of the
blank calibrator within this batch was 0.954. The 50% below the cut-off control,
spiked at 12.5mg/dL, had an absorbance value of 1.035 within this batch and is also
higher than the limit of detection thus indicating that the assay is fit for purpose.
3.4.3 Precision
Table 20 summarises the statistical data for inter and intra-day precision of the assay
by looking at the mean absorbance values.
Table 20: Intra- and Inter Day Precision
Intra-Day Precision (n=7) Inter-Day Precision (n=21)
50% Below 50% Above 50% Below 50% Above
Mean 1.025 1.059 Mean 1.022 1.122
Std Dev 0.021 0.018 Std Dev 0.027 0.039
%CV 2.1 1.7 %CV 2.7 3.5
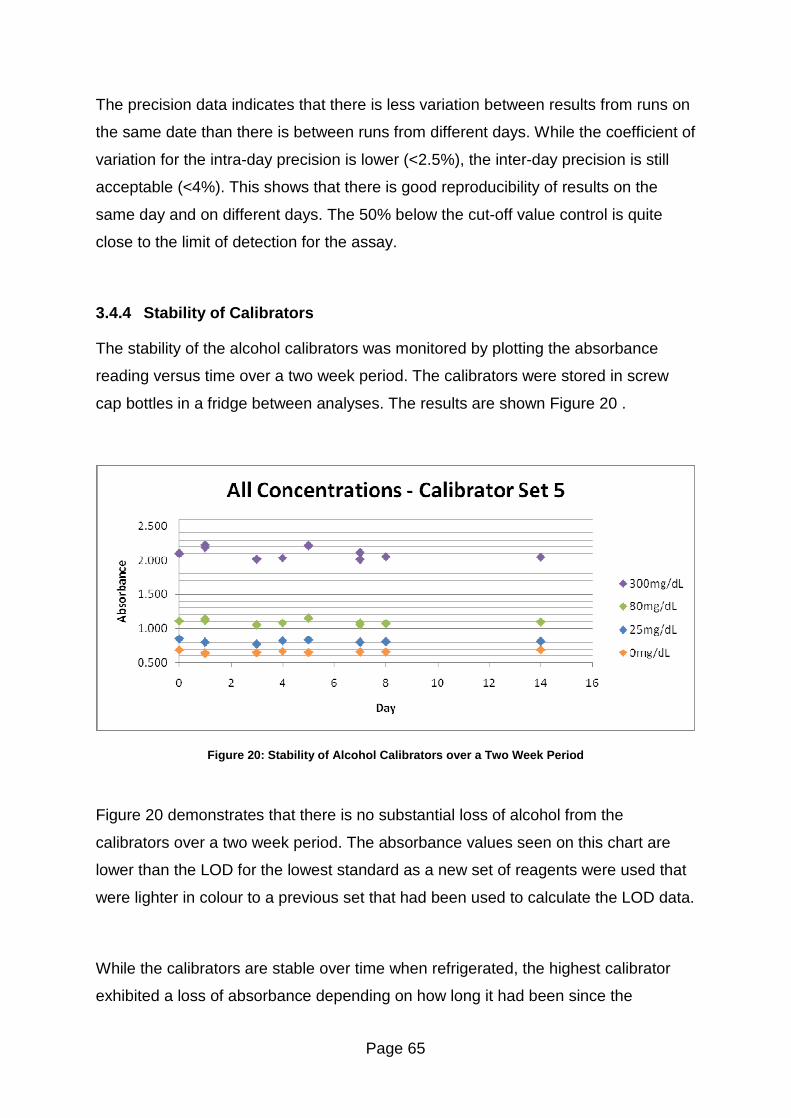
Page 65
The precision data indicates that there is less variation between results from runs on
the same date than there is between runs from different days. While the coefficient of
variation for the intra-day precision is lower (<2.5%), the inter-day precision is still
acceptable (<4%). This shows that there is good reproducibility of results on the
same day and on different days. The 50% below the cut-off value control is quite
close to the limit of detection for the assay.
3.4.4 Stability of Calibrators
The stability of the alcohol calibrators was monitored by plotting the absorbance
reading versus time over a two week period. The calibrators were stored in screw
cap bottles in a fridge between analyses. The results are shown Figure 20 .
Figure 20: Stability of Alcohol Calibrators over a Two Week Period
Figure 20 demonstrates that there is no substantial loss of alcohol from the
calibrators over a two week period. The absorbance values seen on this chart are
lower than the LOD for the lowest standard as a new set of reagents were used that
were lighter in colour to a previous set that had been used to calculate the LOD data.
While the calibrators are stable over time when refrigerated, the highest calibrator
exhibited a loss of absorbance depending on how long it had been since the
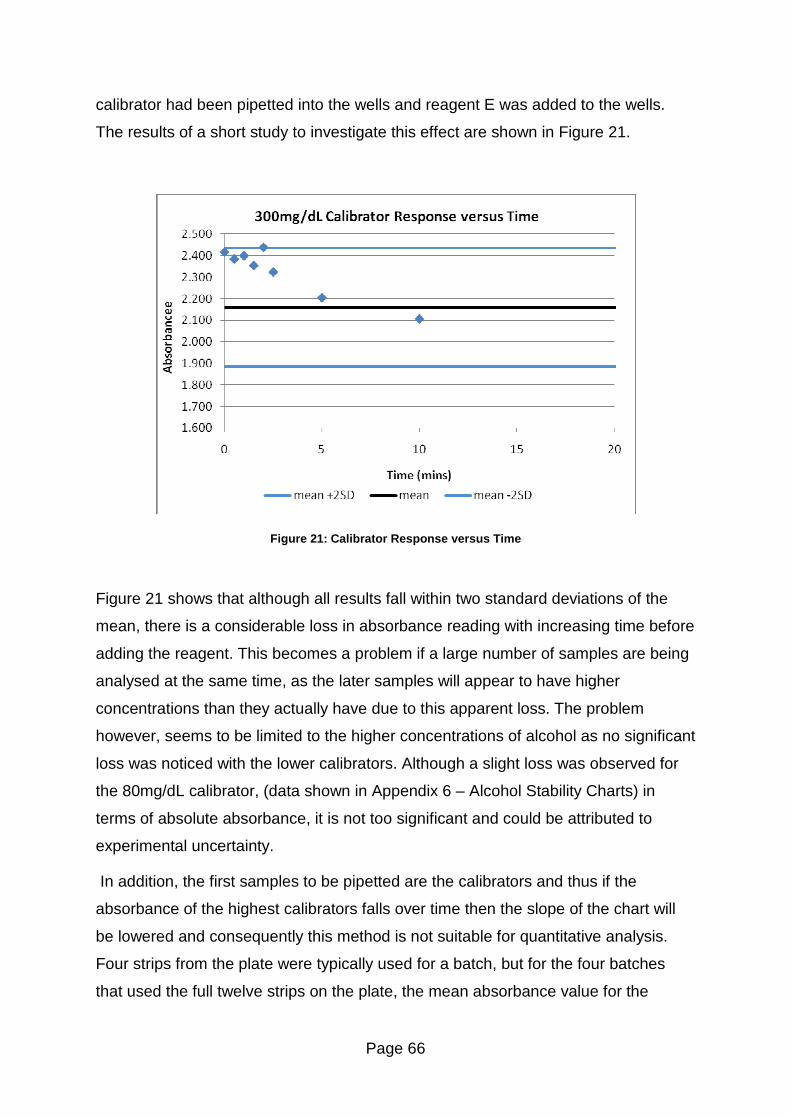
Page 66
calibrator had been pipetted into the wells and reagent E was added to the wells.
The results of a short study to investigate this effect are shown in Figure 21.
Figure 21: Calibrator Response versus Time
Figure 21 shows that although all results fall within two standard deviations of the
mean, there is a considerable loss in absorbance reading with increasing time before
adding the reagent. This becomes a problem if a large number of samples are being
analysed at the same time, as the later samples will appear to have higher
concentrations than they actually have due to this apparent loss. The problem
however, seems to be limited to the higher concentrations of alcohol as no significant
loss was noticed with the lower calibrators. Although a slight loss was observed for
the 80mg/dL calibrator, (data shown in Appendix 6 � Alcohol Stability Charts) in
terms of absolute absorbance, it is not too significant and could be attributed to
experimental uncertainty.
In addition, the first samples to be pipetted are the calibrators and thus if the
absorbance of the highest calibrators falls over time then the slope of the chart will
be lowered and consequently this method is not suitable for quantitative analysis.
Four strips from the plate were typically used for a batch, but for the four batches
that used the full twelve strips on the plate, the mean absorbance value for the

Page 67
300mg/dL calibrator from those batches was 1.438, which if plotted on the QC chart,
Figure 21, would be well outside the acceptable range. This could represent a
problem for any routine laboratory that was analysing large numbers of samples.
3.4.5 Stability of Alcohol Controls in Oral Fluid
The stability of oral fluid controls was evaluated for different storage conditions.
Eppendorf vials and screw cap vials were used for the comparison with a set of each
being evaluated while at room temperature and one set stored in a refrigerator.
3.4.5.1 Eppendorf Vials
The stability of the oral fluid samples spiked with alcohol and refrigerated in
eppendorf vials are illustrated in Figure 22. Set 1 was only run for seven days.
Figure 22: Stability of Spiked Oral Fluid Samples Stored in a Refrigerator Over Fourteen Days
Figure 22 demonstrates that oral fluid samples spiked with alcohol are stable over a
fourteen day period if stored in eppendorf vials in a refrigerator at or below 8°C. The
variation between the results is due to experimental error and not due to a loss of
any sample thus it can be deduced that storing samples in eppendorf vials in a
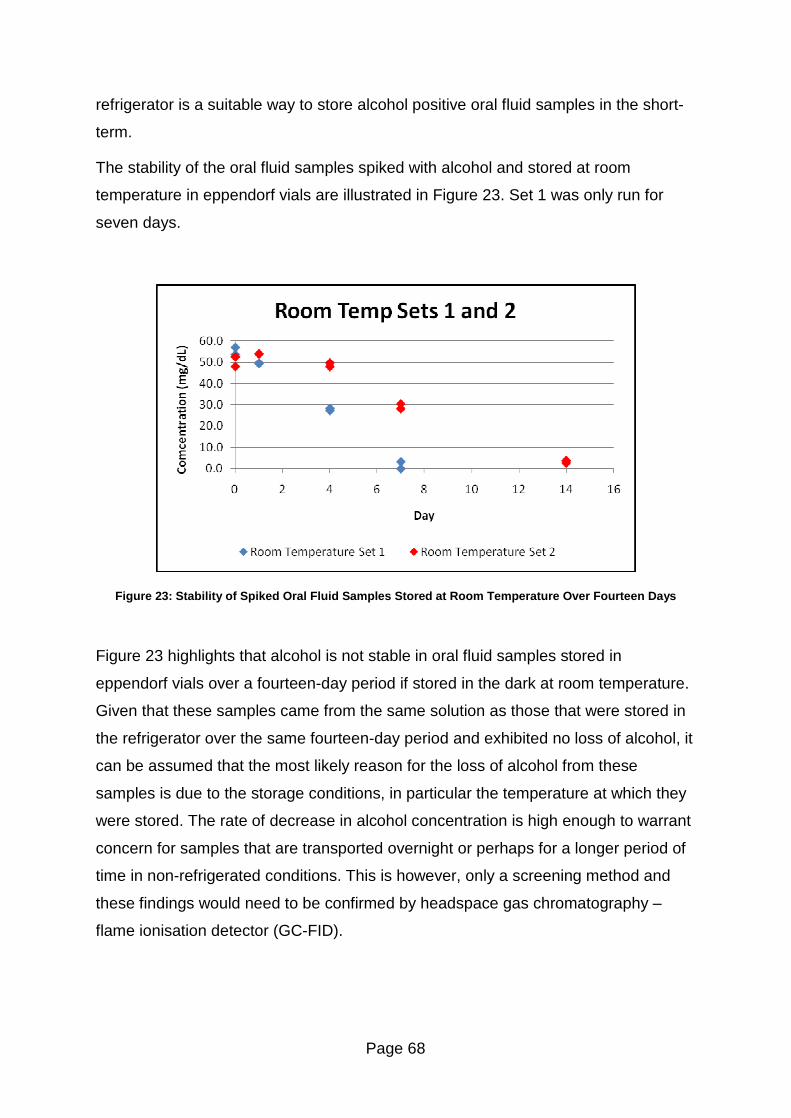
Page 68
refrigerator is a suitable way to store alcohol positive oral fluid samples in the short-
term.
The stability of the oral fluid samples spiked with alcohol and stored at room
temperature in eppendorf vials are illustrated in Figure 23. Set 1 was only run for
seven days.
Figure 23: Stability of Spiked Oral Fluid Samples Stored at Room Temperature Over Fourteen Days
Figure 23 highlights that alcohol is not stable in oral fluid samples stored in
eppendorf vials over a fourteen-day period if stored in the dark at room temperature.
Given that these samples came from the same solution as those that were stored in
the refrigerator over the same fourteen-day period and exhibited no loss of alcohol, it
can be assumed that the most likely reason for the loss of alcohol from these
samples is due to the storage conditions, in particular the temperature at which they
were stored. The rate of decrease in alcohol concentration is high enough to warrant
concern for samples that are transported overnight or perhaps for a longer period of
time in non-refrigerated conditions. This is however, only a screening method and
these findings would need to be confirmed by headspace gas chromatography �
flame ionisation detector (GC-FID).
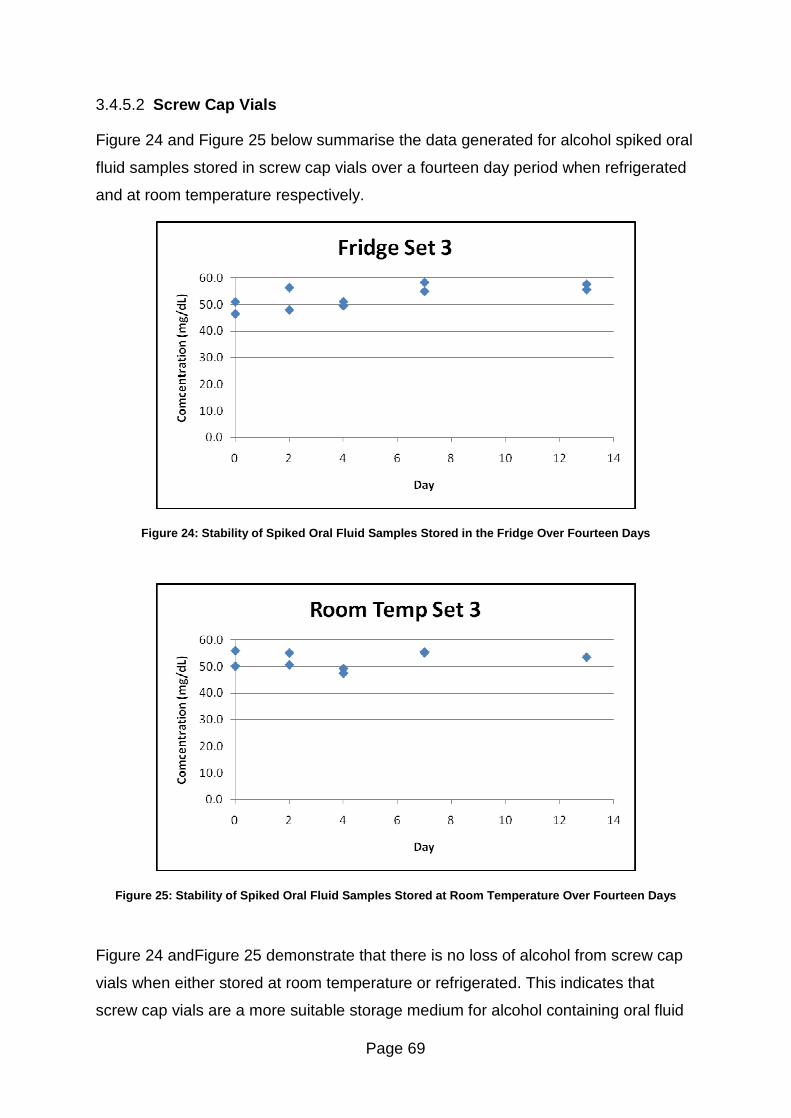
Page 69
3.4.5.2 Screw Cap Vials
Figure 24 and Figure 25 below summarise the data generated for alcohol spiked oral
fluid samples stored in screw cap vials over a fourteen day period when refrigerated
and at room temperature respectively.
Figure 24: Stability of Spiked Oral Fluid Samples Stored in the Fridge Over Fourteen Days
Figure 25: Stability of Spiked Oral Fluid Samples Stored at Room Temperature Over Fourteen Days
Figure 24 andFigure 25 demonstrate that there is no loss of alcohol from screw cap
vials when either stored at room temperature or refrigerated. This indicates that
screw cap vials are a more suitable storage medium for alcohol containing oral fluid
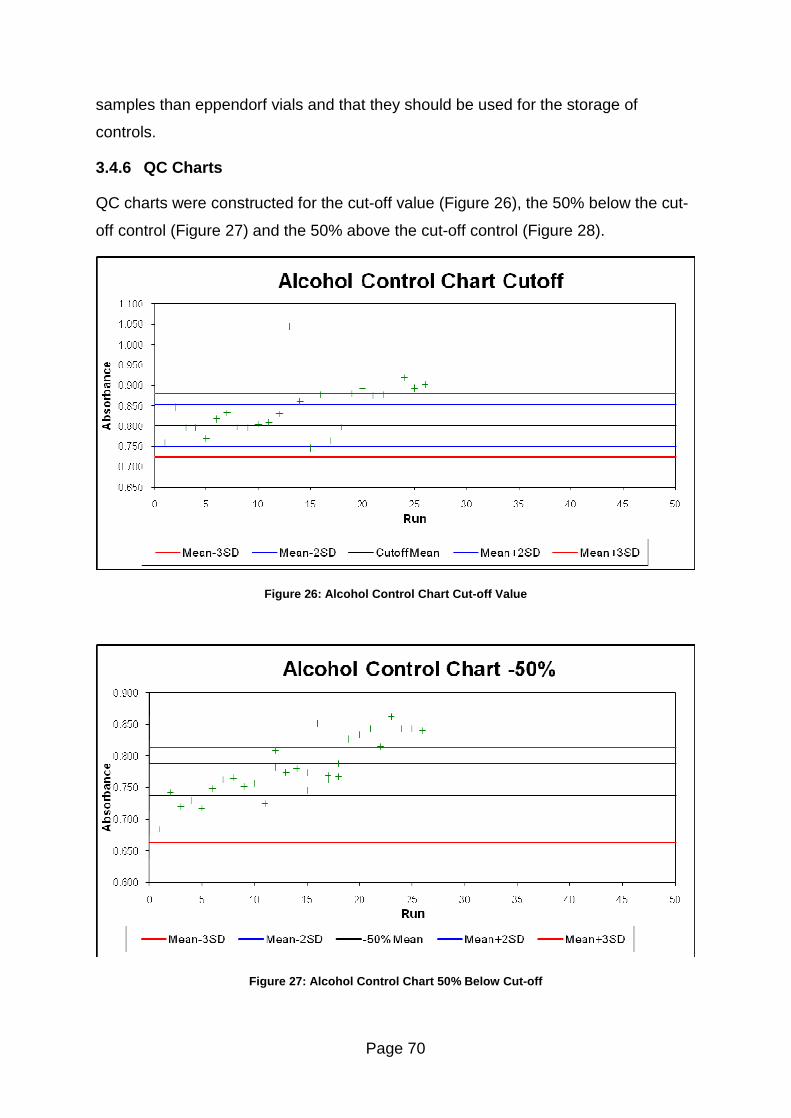
Page 70
samples than eppendorf vials and that they should be used for the storage of
controls.
3.4.6 QC Charts
QC charts were constructed for the cut-off value (Figure 26), the 50% below the cut-
off control (Figure 27) and the 50% above the cut-off control (Figure 28).
Figure 26: Alcohol Control Chart Cut-off Value
Figure 27: Alcohol Control Chart 50% Below Cut-off
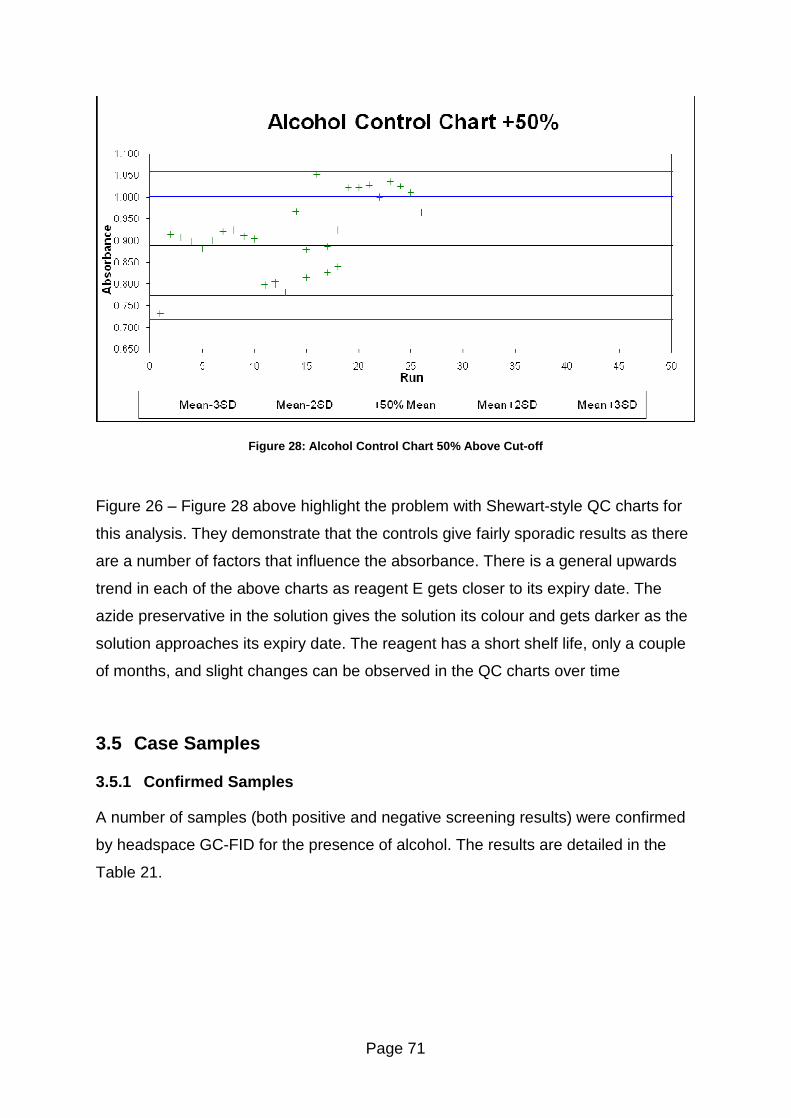
Page 71
Figure 28: Alcohol Control Chart 50% Above Cut-off
Figure 26 � Figure 28 above highlight the problem with Shewart-style QC charts for
this analysis. They demonstrate that the controls give fairly sporadic results as there
are a number of factors that influence the absorbance. There is a general upwards
trend in each of the above charts as reagent E gets closer to its expiry date. The
azide preservative in the solution gives the solution its colour and gets darker as the
solution approaches its expiry date. The reagent has a short shelf life, only a couple
of months, and slight changes can be observed in the QC charts over time
3.5 Case Samples
3.5.1 Confirmed Samples
A number of samples (both positive and negative screening results) were confirmed
by headspace GC-FID for the presence of alcohol. The results are detailed in the
Table 21.
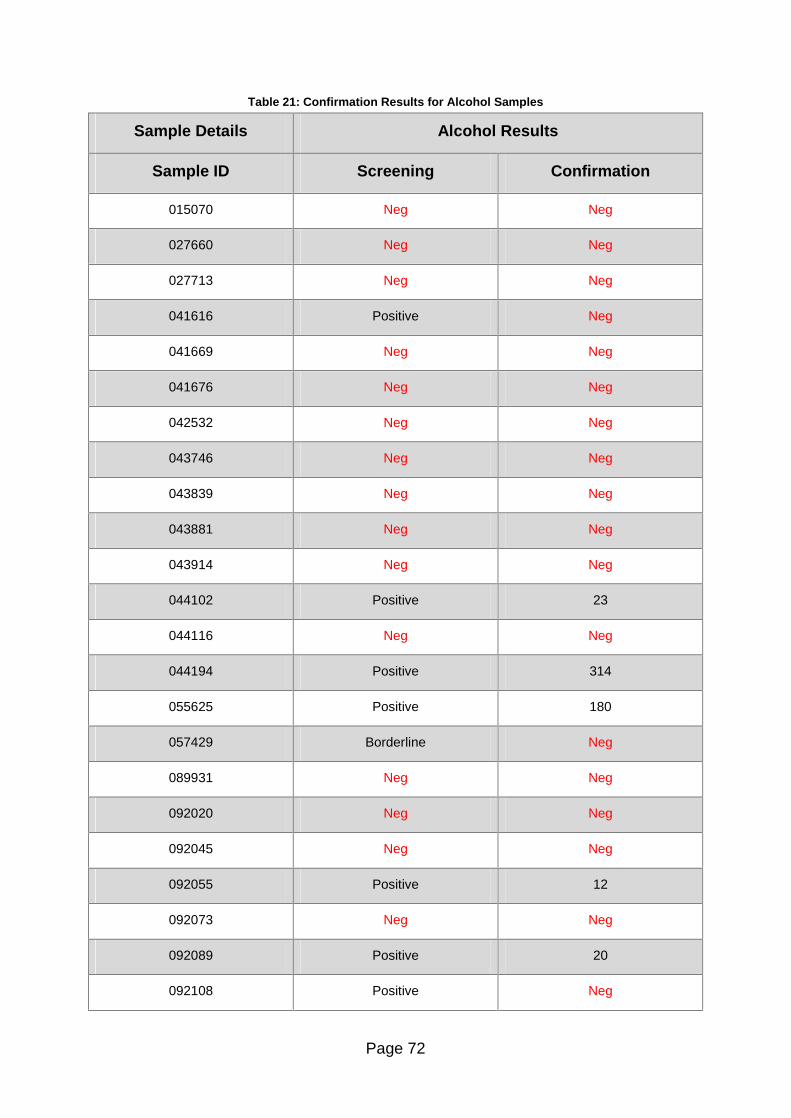
Page 72
Table 21: Confirmation Results for Alcohol Samples
Sample Details Alcohol Results
Sample ID Screening Confirmation
015070 Neg Neg
027660 Neg Neg
027713 Neg Neg
041616 Positive Neg
041669 Neg Neg
041676 Neg Neg
042532 Neg Neg
043746 Neg Neg
043839 Neg Neg
043881 Neg Neg
043914 Neg Neg
044102 Positive 23
044116 Neg Neg
044194 Positive 314
055625 Positive 180
057429 Borderline Neg
089931 Neg Neg
092020 Neg Neg
092045 Neg Neg
092055 Positive 12
092073 Neg Neg
092089 Positive 20
092108 Positive Neg

Page 73
Sample Details Alcohol Results
Sample ID Screening Confirmation
092109 Neg Neg
092110 Neg Neg
092113 Neg Neg
092119 Positive Neg
092123 Borderline Neg
092264 Neg Neg
092290 Positive 22
092292 Neg Neg
092302 Borderline 11
092325 Neg Neg
092328 Neg Neg
092336 Neg Neg
092339 Neg Neg
092350 Neg Neg
096563 Borderline Neg
097494 Neg Neg
097573 Neg Neg
098102 Neg Neg
099249 Positive 31
099260 Neg Neg
099376 Neg Neg
099382 Neg Neg
Page 74
The confirmation results generally match the screening results and there were no
false negatives from the samples that were confirmed. This is somewhat surprising
as there is not a large difference between the blank and cut-off calibrators
absorbance values so more false negatives would have been expected. These
results indicate that the assay would be useful as a screening technique for alcohol
screening.
3.5.2 Unconfirmed Samples
Approximately fifty other oral fluid samples were screened as part of this project but
due to the limited sample volumes obtained by oral fluid collection devices there was
not enough left for confirmations as the samples had previously been analysed by
another laboratory.
3.5.3 Sensitivity and Specificity
There were 8 true positives, 31 true negatives, 6 false positives and no false
negatives for the alcohol assay.
NB: For the purposes of this calculation, borderline cases were treated as being
positives.
Following the calculation given in section 2.3.6 the sensitivity of the alcohol assay
was calculated as 100% and the specificity was calculated as 84%.
3.6 Conclusions
The Immunalysis Ethyl Alcohol Screening Kit has shown potential as a screening
method but would require further work and validation before it demonstrated as fit for
use in a routine testing laboratory. The calibrators and controls have shown short
term stability over a two week period, which is the likely time frame for sample
analysis in a high throughput routine testing laboratory.
A more suitable method of evaluating the performance of the control samples would
need to be devised and evaluated as the current QC charts are unsuitable for a
Page 75
small laboratory who would not use all of the reagent in one or two days and would
therefore limit the assay�s use to high throughput laboratories.
The assay consistently produced a linear response for the calibration range tested
and as such has potential as a semi-quantitative test, which would be useful for
highlighting any samples that may require a dilution prior to analysis. However, the
issue of the highest calibrator �losing� absorbance over time would need to be
thoroughly investigated as this would lower the gradient of the calibration and
samples pipetted later in the plate would appear to be of a higher concentration than
they actually are, while earlier low concentration samples could appear negative.
This would forfeit the point of the screening test as false negatives would be
produced and samples requiring dilution would not be properly identified.
If the issues outlined are successfully addressed and the analysis of test samples
proves successful then this method could be used as a screening procedure for
alcohol in oral fluid. The main benefits of the assay are that it is simple to use and
provides a fast screening result. In addition, it has the potential to be used semi-
quantitatively if the issues mentioned above are resolved. However, the assay does
have its limitations in that the sample preparation step for analysis is to pipette the
sample into wells, which is the same as the confirmation method. So in this respect,
the sample preparation is as time-consuming as the confirmation method and it
would make more sense to go straight to the confirmation method even though the
results for the screening test would be obtained within 15 minutes whereas the
confirmation method would take several hours. If the assay was being used in a
setting where most samples were expected to be negative, for example in the
workplace, then it would be a good choice.
In a laboratory that gets many positives, such as a forensic laboratory that carries
out alcohol testing in road traffic cases then this method is only likely to add to the
workload and therefore could not be justified.
Overall, the assay would not be recommend for a laboratory that is only analysing a
small number of alcohol analyses a day as it would offer no significant advantage
due to the issues highlighted above. In addition, it would not be recommend the for a
high throughput laboratory analysing several hundred samples daily if they are
expecting many positives as it would be an added expense and waste of time. It
Page 76
would however, be very useful if utilized in a laboratory analysing samples for drug
abstinence in the workplace.
Initial results from real samples gave promising results, but further real samples
should be tested before this method is put to use routinely in a laboratory.
Page 77
4 Conclusions
The Immunalysis ELISA assays worked well with oral fluid that had been diluted one
in four with Quantisal buffer. The Quantisal oral fluid collection device dilutes 1mL of
sample with 3mL of buffer giving one of the largest dilutions of all commercially
available oral fluid collectors. This raised the possibility of screening results giving
false negatives due to the buffer diluting the sample below the cut-off concentration.
This did not appear to be the case and means that the Quantisal oral fluid collection
device offers the distinct advantage of having more oral fluid/buffer mixture to
analyse than other commercially available devices.
The Immunalysis ELISA assays for drugs of abuse that were used for this project
proved sufficiently sensitive to detect the low drug concentrations found in the diluted
oral fluid/buffer mixture. The assays did raise a couple of questions with very low
amphetamine concentrations that were below the lowest calibrator. The confirmation
results for the samples that �falsely� screened negative showed that they were below
the ELISA assay�s in-house cut-off limit and were therefore accurately marked as
negative by ELISA. The Immunalysis ELISA assays are therefore suitable for use as
a laboratory based screening technique for oral fluid samples.
The alcohol enzymatic assay showed some potential as a screening technique for
oral fluid. The assay showed good linearity and of the confirmed samples, there were
no false negatives identified. The study did highlight some issues that would require
further investigation before being used routinely in a toxicology laboratory. This study
showed a worrying trend of the absorbance of the highest calibrator falling with time
between addition to the well and addition of the other reagents. From a single
analysis, this relationship appeared to be linear but further investigation would be
required to confirm this relationship.
One of the reagents appeared to get darker in colour, and thus gave different values
for its absorbance once opened and this meant that the preferred in-house method
of using Shewart-style QC charts was unsuitable for this analysis. No obvious
alternative method of monitoring quality control was available and this would need to
be rectified if the assay was to be used in a laboratory accredited to ISO/IEC 17025
where the monitoring of quality control samples is so important. The reagent
Page 78
becoming darker was observed after one day and this could present a problem to
small scale laboratories that are not carrying out many analyses.
Overall, this method has the potential to be valuable to laboratories testing oral fluid
samples where sample volume is limited and also to high throughput laboratories
where most of the samples are expected to be negative, such as laboratories that
carry out workplace testing.
Page 79
5 Further Work
Further work to evaluate the stability of the controls would be to prepare several
litres of the controls and analyse weekly for up to five years to assess the long term
stability of multi-analyte controls. Several batches of controls should be prepared
simultaneously and analysed at the same time to ensure the results are
reproducible.
Concurrently, controls could be prepared and stored, ready diluted in Quantisal
buffer, to allow a comparison between the stability of diluted and neat controls over
time. Both the neat and diluted controls should be prepared on the same day with
the same blank oral fluid and drug stock solutions and stored in the same freezer to
minimise the differences between the controls, thus reducing the number of variable
factors which may affect the stability.
Another step would be to examine why some drug groups have such a wide range of
acceptable values and others have a narrow range. Examining whether each drug�s
assay works better at a specific temperature and whether that is a reason for the
more sporadic results for some drugs, could improve the reproducibility of the results
for some assays.
As the calibrators for ELISA used a different buffer to the oral fluid controls (to keep
the method in line with the in-house blood and urine method), the effect of this could
be investigated to see if there is any matrix effects from the different buffers.
Further samples should be collected and analysed purely for amphetamines if
possible to allow sufficient sample to be analysed and any repeats carried out. This
would allow the questionable false negatives to be clarified and further data to be
collected to allow for a more accurate confirmation of the borderline positive
confirmations.
Spiking samples at and below the lowest calibrator from the confirmation method
would provide information about the assays suitability at low concentrations.
The first step would be to devise a more suitable method of quality control. Once this
is in place, the next step would be to evaluate the long term stability of the calibrators
and controls. Longer stability would reduce the running costs of the screening test as
certified alcohol standards are expensive. While the stability study is underway, an
Page 80
evaluation of the effect of reagent E could be undertaken by analysing two batches
of calibrators and controls, one with a new reagent E each time and the other using a
previously opened reagent E. My results indicated that there was a slight increase in
the absorbance after just one day, however, that could have been due to slight
differences in the analysis such as a slightly longer incubation time or a change in
laboratory temperature. The effect of these should also be investigated.
The apparent loss of alcohol from the highest calibration over time is a serious issue
that would also need to be fully investigated prior to being implemented in a
laboratory. This could be done by analysing controls on one plate and leaving a set
period of time between the additions of controls to each strip and adding reagents A
and E once all strips have had sample added. Also, a strip of calibrators could be
added to a plate every two minutes to see any change in absorbance when reagents
A and E are added to all strips at the same time.
Page 81
6 References
1. Duffus J, Worth H. Fundamental Toxicology: RSC; 2006.
2. Anderson RA. Forensic Toxicology. In: White PC, editor. Crime Scene to
Court. 2nd ed. Cornwall: RSC; 2004. p. 318-49.
3. Krieger R, editor. Handbook of Pesticide Toxicology: Principles. 2nd ed.
California, USA: Academic Press; 2001.
4. Diem K, Lentner C, editors. Scientific Tables. 7th ed. Macclesfield: Geigy
Pharmaceuticals; 1973.
5. Spiehler V. Drugs in Saliva. In: Moffat AC, Osselton MD, Widdop B, editors.
Clarke's Analysis of Drugs and Poisons: Pharmaceutical Press; 2004. p. 109-23.
6. Ritschel WA, Tompson GA. Monitoring of Drug Concentrations in Saliva: A
Non-invasive Pharmacokinetic Procedure. Methods and Findings in Experimental
and Clinical Pharmacology. [Article]. 1983;5(8):511-25.
7. Aps JK, Martens LC. Review: The physiology of saliva and transfer of drugs
into saliva. Forensic Science International2005 Jun 10;150(2-3):119-31.
8. Spiehler V, Cooper G. Drugs-of-Abuse Testing in Saliva or Oral Fluid. In:
Jenkins AJ, editor. Drug Testing in Alternate Biological Specimins: Humana Press
Inc; 2008. p. 83-99.
9. Turner R. Mechanisms of Fluid Secretion by Salivary Glands. Annals of the
New York Academy of Sciences1993;694(Saliva as a Diagnostic Fluid):24-35.
10. Gland Salivary. [cited 05/01/2009]; Available from:
http://img.tfd.com/dorland/thumbs/gland_salivary.jpg.
11. Gallardo E, Queiroz JA. The Role of Alternative Specimens in Toxicological
Analysis. Biomedical Chromatography2008;22(8):795-821.
12. Malamud D. Guidelines for Saliva Nomenclature and Collection. Annals of the
New York Academy of Sciences1993;694(Saliva as a Diagnostic Fluid):xi-xii.
13. Cone EJ, Oyler J, Darwin WD. Cocaine Disposition in Saliva Following
Intravenous, Intranasal, and Smoked Administration. J Anal Toxicol. [Article]. 1997
Oct;21(6):465-75.
Page 82
14. Cone EJ, Kumor K, Thompson LK, Sherer M. Correlation of Saliva Cocaine
Levels with Plasma-Levels and with Pharmacologic Effects After Intravenous
Cocaine Administration in Human-Subjects. J Anal Toxicol. [Article]. 1988 Jul-
Aug;12(4):200-6.
15. Cone E, Huestis M. Interpretation of Oral Fluid Tests for Drugs of Abuse.
Annals of the New York Academy of Sciences2007;1098(1):51-103.
16. Schepers RJF, Oyler JM, Joseph RE, Cone EJ, Moolchan ET, Huestis MA.
Methamphetamine and amphetamine pharmacokinetics in oral fluid and plasma after
controlled oral methamphetamine administration to human volunteers. Clinical
Chemistry2003 Jan;49(1):121-32.
17. Cook CE, Jeffcoat AR, Sadler BM, Hill JM, Voyksner RD, Pugh DE, et al.
Pharmacokinetics of Oral Methamphetamine and Effects of Repeated Daily Dosing
in Humans. Drug Metab Dispos. [Article]. 1992 Nov-Dec;20(6):856-62.
18. Wille SMR, Raes E, Lillsunde P, Gunnar T, Laloup M, Samyn N, et al.
Relationship Between Oral Fluid and Blood Concentrations of Drugs of Abuse in
Drivers Suspected of Driving Under the Influence of Drugs. Ther Drug Monit. 2009
Aug;31(4):511-9.
19. Gjerde H, Normann P, Christopherson A. The Prevalence of Alcohol and
Drugs in Sampled Oral Fluid is Related to Sample Volume. J Anal
Toxicol2010;34:416 - 9.
20. Directgov. Drug Testing and Employee Monitoring. 2009 [12/07/2009];
Available from:
http://www.direct.gov.uk/en/Employment/HealthAndSafetyAtWork/DG_1002659
4.
21. Office of Public Sector Information. Transport and Works Act 1992. 1992
[14/07/2009]; Available from:
http://www.opsi.gov.uk/acts/acts1992/ukpga_19920042_en_4#pt2-ch1.
22. Taylor D. Rise in use of Drug Testing to Sack Employee's Without
Redundancy Pay. The Gaurdian. 2009 18/05/2009.
Page 83
23. Home Office. Drug Interventions Programme (DIP). 2003 [12/07/2009];
Available from: http://drugs.homeoffice.gov.uk/drug-interventions-
programme/strategy/.
24. Home Office. The Drug Interventions Programme (DIP): Addressing Drug use
and Offending Through �Tough Choices�. 2007 [12/07/2009]; Available from:
http://www.homeoffice.gov.uk/rds/pdfs07/horr02c.pdf.
25. Concateno. Philips and Concateno Announce Revolutionary Drugs-of-Abuse
Testing System Concateno PLC; 2008 [12/07/2009]; Available from:
http://www.concateno.com/index.php?cPath=78_193&news_id=123.
26. Concateno. Oslo: Concateno to preview new portable drug testing device at
ICADTS. Concateno PLC; 2010 [15/09/2010]; Available from:
http://www.concateno.com/news-events-publications/press-releases/16171/.
27. Jackson P, Hilditch C. A Review of Evidence Related to Drug Driving in the
UK: A Report Submitted to the North Review Team. London, UK: Clockwork
Research LTD, Transport Df;2010.
28. Crown Office. Railways and Transport Safety Act 2003. 2003 [15/09/2010];
Available from: http://www.legislation.gov.uk/ukpga/2003/20/schedule/7.
29. Home Office Scientific Developement Branch. Drug Driver Testing. 2010
[15/09/2010]; Available from:
http://tna.europarchive.org/20100413151426/http://scienceandresearch.homeof
fice.gov.uk/hosdb/drug-detection/drug-driver-testing/index.html.
30. General Register Office for Scotland. Drug-Related Deaths in Scotland in
2009. In: Scotland GROf, editor. Edinburgh: General Register Office for Scotland;
2009.
31. Office for National Statistics. Alcohol Deaths. 2009 [updated
13/07/200921/07/2009]; Available from:
http://www.statistics.gov.uk/CCI/nugget.asp?ID=1091.
32. United Nations Office on Drugs and Crime. World Drug Report 2009. Vienna:
United Nations; 2009.
33. United Nations. World Drug Report 2010. Vienna: United Nations; 2010.
Page 84
34. NHS Scotland. Alcohol Statistics Scotland 2009. 2009 [21/07/2009]; Available
from:
http://www.alcoholinformation.isdscotland.org/alcohol_misuse/files/alcohol_st
ats_bul_09.pdf.
35. Audit Scotland. Drug and Alcohol Services in Scotland. Audit Scotland; 2009
[14/07/2009]; Available from: http://www.audit-
scotland.gov.uk/docs/health/2009/nr_090326_drugs_alcohol.pdf.
36. Hand C, Baldwin D. Immunoassays. In: Jickells S, Negrusz A, editors.
Clarke's Analytical Toxicology. Cambridge: Pharmaceutical Press; 2008. p. 375 - 91.
37. Yong CY, Chua WT, Moy HY, Yao YJ, Lui CP. Screening of drug of abuse in
urine by LC/MS/MS. Clinica Chimica Acta;411(11-12):910-1.
38. Dresen S, Ferreiros N, Gnann H, Zimmermann R, Weinmann W. Detection
and identification of 700 drugs by multi-target screening with a 3200 Q TRAP(A (R))
LC-MS/MS system and library searching. Anal Bioanal Chem. [Proceedings Paper].
Apr;396(7):2425-34.
39. Langel K, Engblom C, Pehrsson A, Gunnar T, Arinieme K, Lillsunde P. Drug
Testing in Oral Fluid� Evaluation of Sample Collection Devices. J Anal
Toxicol2008;32:9.
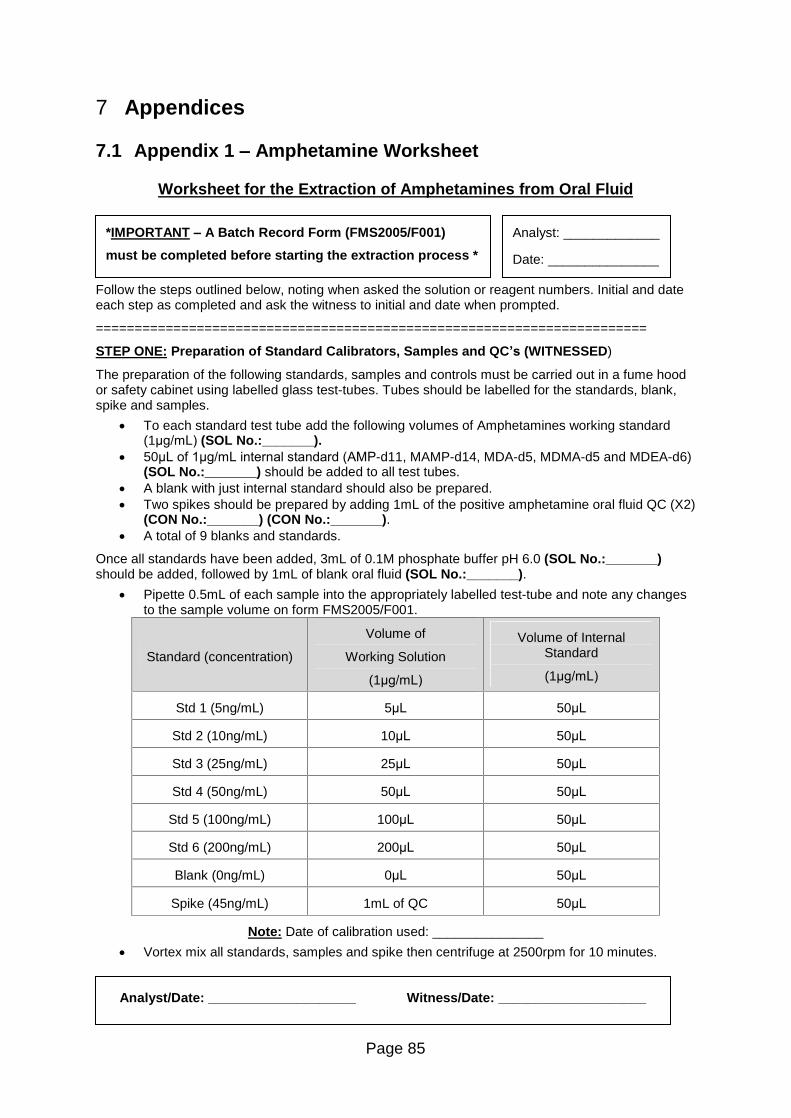
Page 85
7 Appendices
7.1 Appendix 1 � Amphetamine Worksheet
Worksheet for the Extraction of Amphetamines from Oral Fluid
Follow the steps outlined below, noting when asked the solution or reagent numbers. Initial and date each step as completed and ask the witness to initial and date when prompted.
=======================================================================
STEP ONE: Preparation of Standard Calibrators, Samples and QC�s (WITNESSED)
The preparation of the following standards, samples and controls must be carried out in a fume hood or safety cabinet using labelled glass test-tubes. Tubes should be labelled for the standards, blank, spike and samples.
To each standard test tube add the following volumes of Amphetamines working standard (1ìg/mL) (SOL No.:_______).
50ìL of 1ìg/mL internal standard (AMP-d11, MAMP-d14, MDA-d5, MDMA-d5 and MDEA-d6) (SOL No.:_______) should be added to all test tubes.
A blank with just internal standard should also be prepared. Two spikes should be prepared by adding 1mL of the positive amphetamine oral fluid QC (X2)
(CON No.:_______) (CON No.:_______). A total of 9 blanks and standards.
Once all standards have been added, 3mL of 0.1M phosphate buffer pH 6.0 (SOL No.:_______) should be added, followed by 1mL of blank oral fluid (SOL No.:_______).
Pipette 0.5mL of each sample into the appropriately labelled test-tube and note any changes to the sample volume on form FMS2005/F001.
Standard (concentration)
Volume of
Working Solution
(1ìg/mL)
Volume of Internal Standard
(1ìg/mL)
Std 1 (5ng/mL) 5ìL 50ìL
Std 2 (10ng/mL) 10ìL 50ìL
Std 3 (25ng/mL) 25ìL 50ìL
Std 4 (50ng/mL) 50ìL 50ìL
Std 5 (100ng/mL) 100ìL 50ìL
Std 6 (200ng/mL) 200ìL 50ìL
Blank (0ng/mL) 0ìL 50ìL
Spike (45ng/mL) 1mL of QC 50ìL
Note: Date of calibration used: _______________
Vortex mix all standards, samples and spike then centrifuge at 2500rpm for 10 minutes.
*IMPORTANT � A Batch Record Form (FMS2005/F001)
must be completed before starting the extraction process *
Analyst: _____________
Date: _______________
Analyst/Date: ____________________ Witness/Date: ____________________
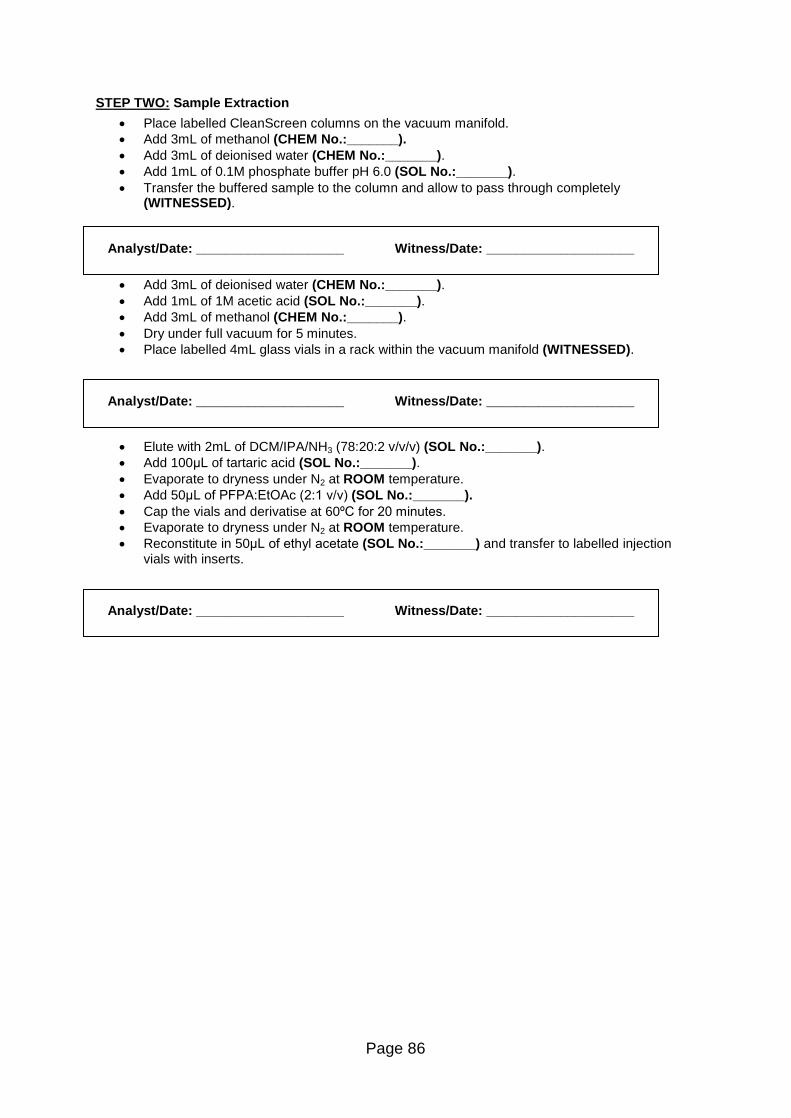
Page 86
STEP TWO: Sample Extraction
Place labelled CleanScreen columns on the vacuum manifold. Add 3mL of methanol (CHEM No.:_______). Add 3mL of deionised water (CHEM No.:_______). Add 1mL of 0.1M phosphate buffer pH 6.0 (SOL No.:_______). Transfer the buffered sample to the column and allow to pass through completely
(WITNESSED).
Add 3mL of deionised water (CHEM No.:_______). Add 1mL of 1M acetic acid (SOL No.:_______). Add 3mL of methanol (CHEM No.:_______). Dry under full vacuum for 5 minutes. Place labelled 4mL glass vials in a rack within the vacuum manifold (WITNESSED).
Elute with 2mL of DCM/IPA/NH3 (78:20:2 v/v/v) (SOL No.:_______). Add 100ìL of tartaric acid (SOL No.:_______). Evaporate to dryness under N2 at ROOM temperature. Add 50ìL of PFPA:EtOAc (2:1 v/v) (SOL No.:_______). Cap the vials and derivatise at 60ºC for 20 minutes. Evaporate to dryness under N2 at ROOM temperature. Reconstitute in 50ìL of ethyl acetate (SOL No.:_______) and transfer to labelled injection
vials with inserts.
Analyst/Date: ____________________ Witness/Date: ____________________
Analyst/Date: ____________________ Witness/Date: ____________________
Analyst/Date: ____________________ Witness/Date: ____________________
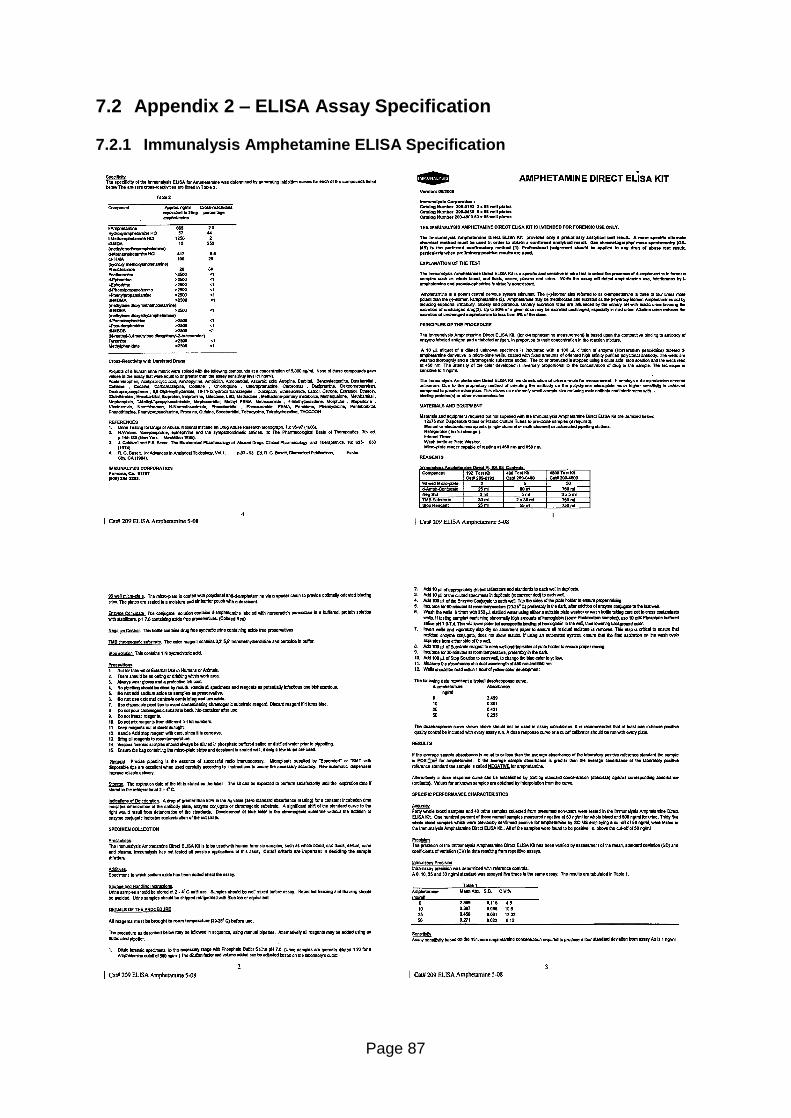
Page 87
7.2 Appendix 2 � ELISA Assay Specification
7.2.1 Immunalysis Amphetamine ELISA Specification
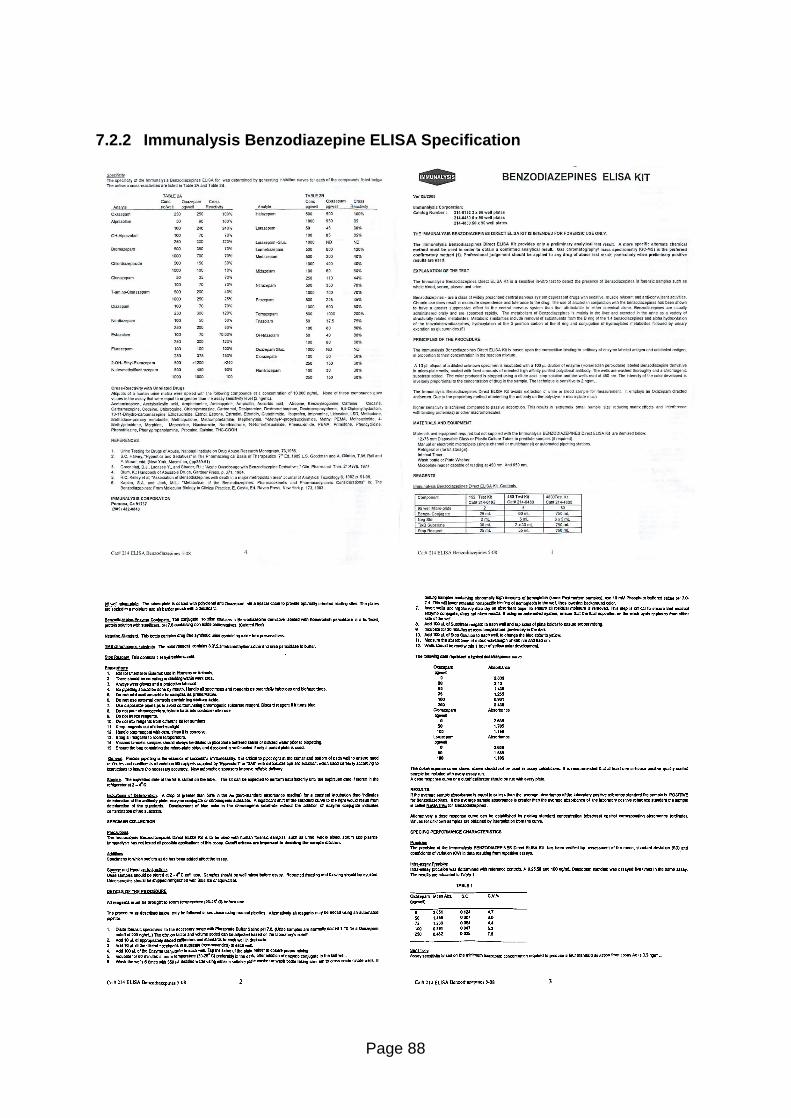
Page 88
7.2.2 Immunalysis Benzodiazepine ELISA Specification
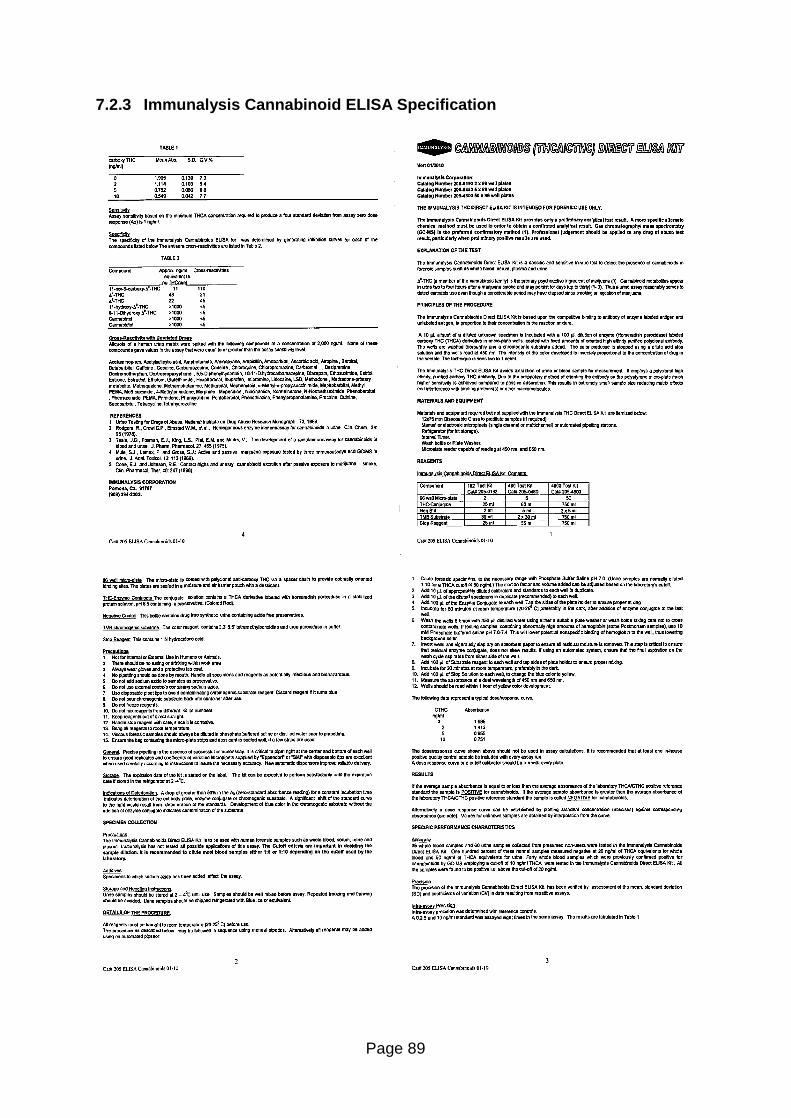
Page 89
7.2.3 Immunalysis Cannabinoid ELISA Specification
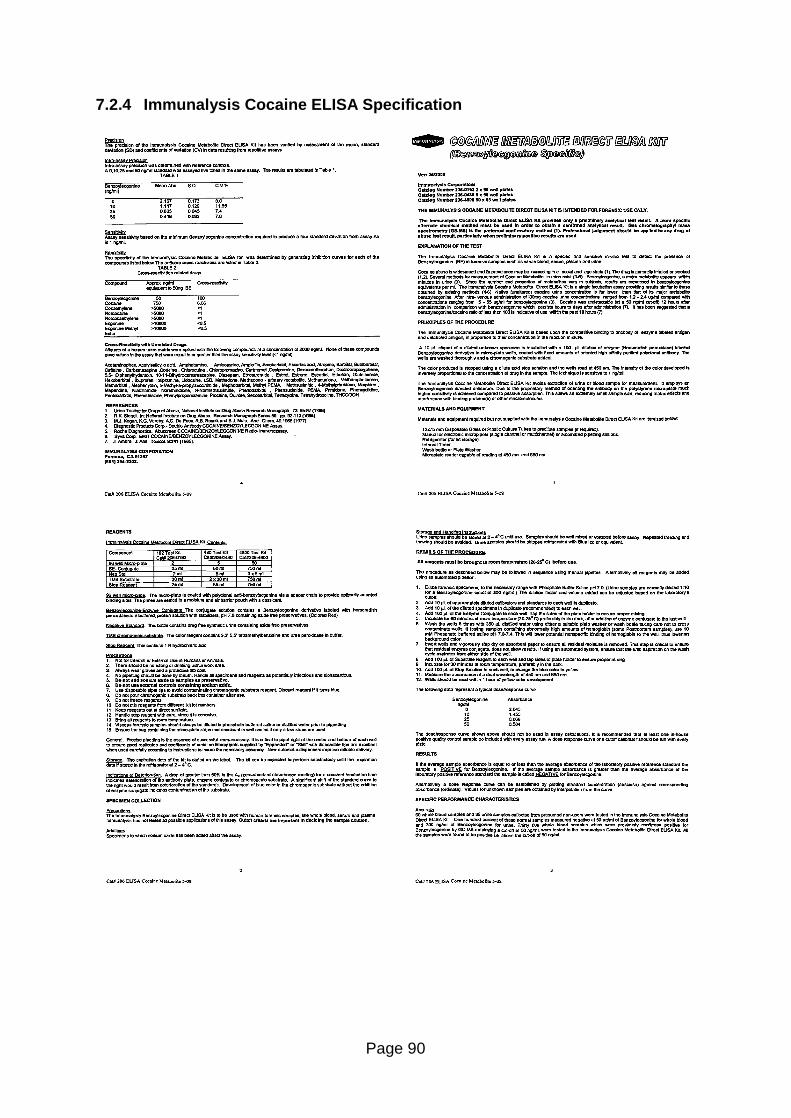
Page 90
7.2.4 Immunalysis Cocaine ELISA Specification
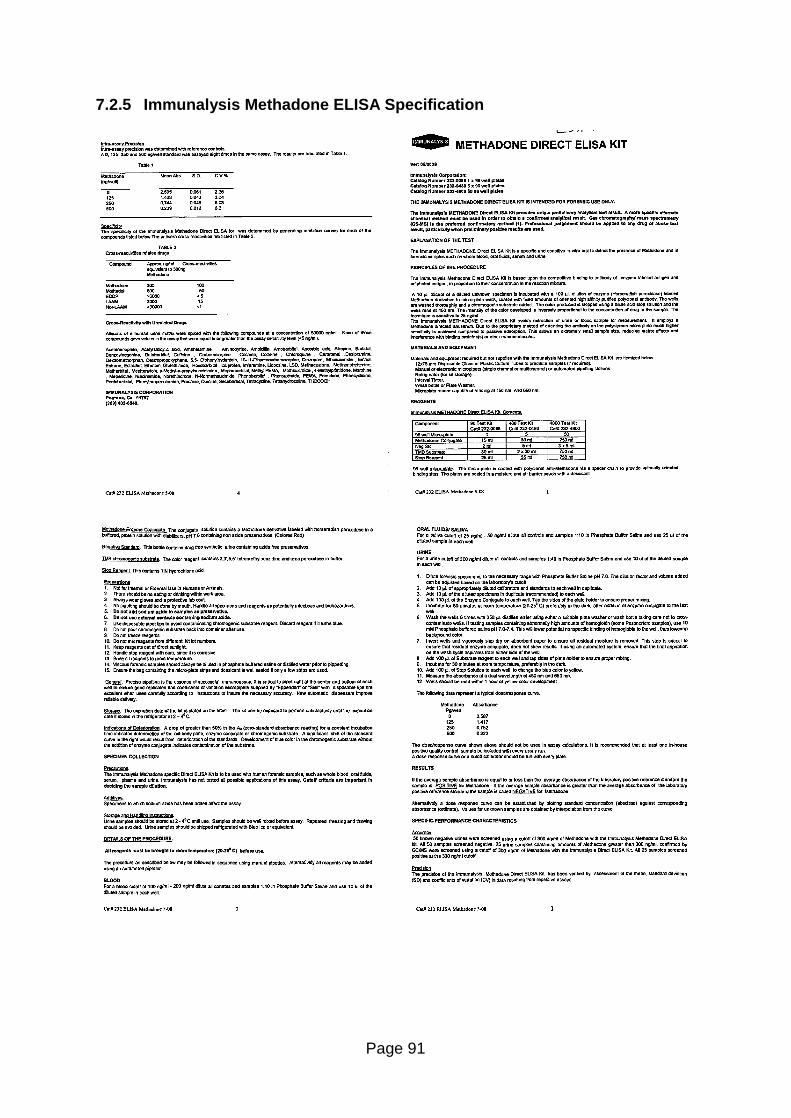
Page 91
7.2.5 Immunalysis Methadone ELISA Specification
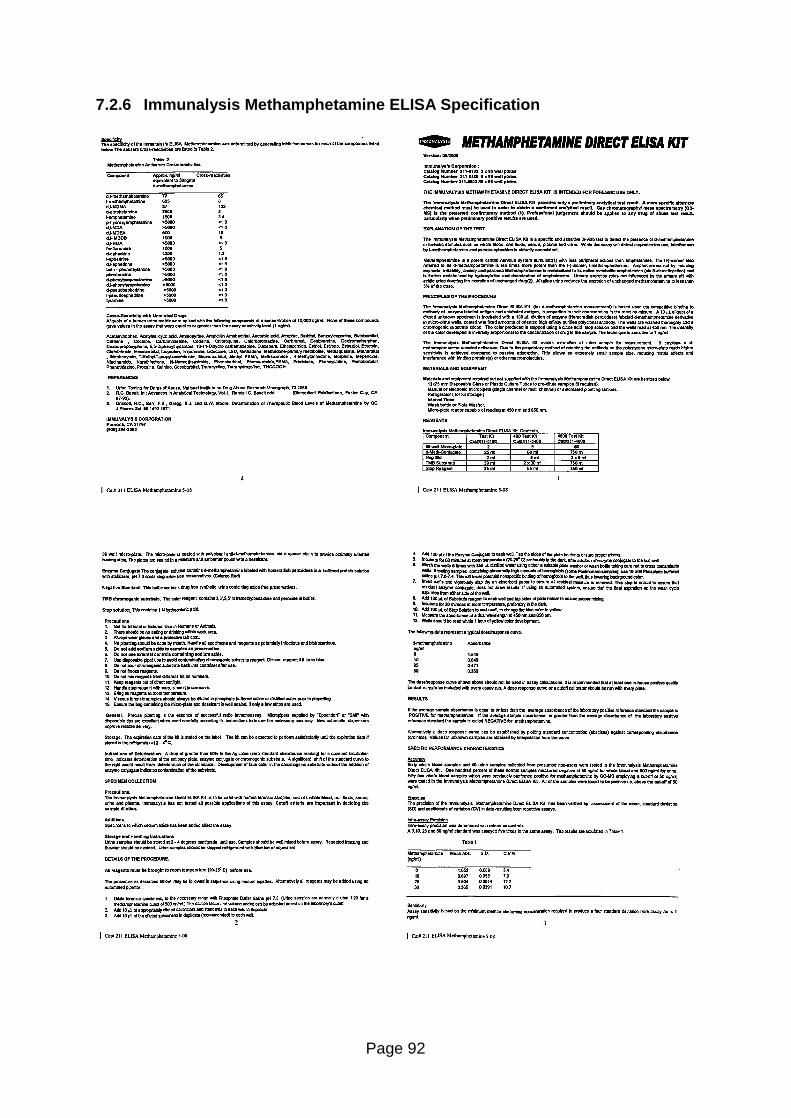
Page 92
7.2.6 Immunalysis Methamphetamine ELISA Specification
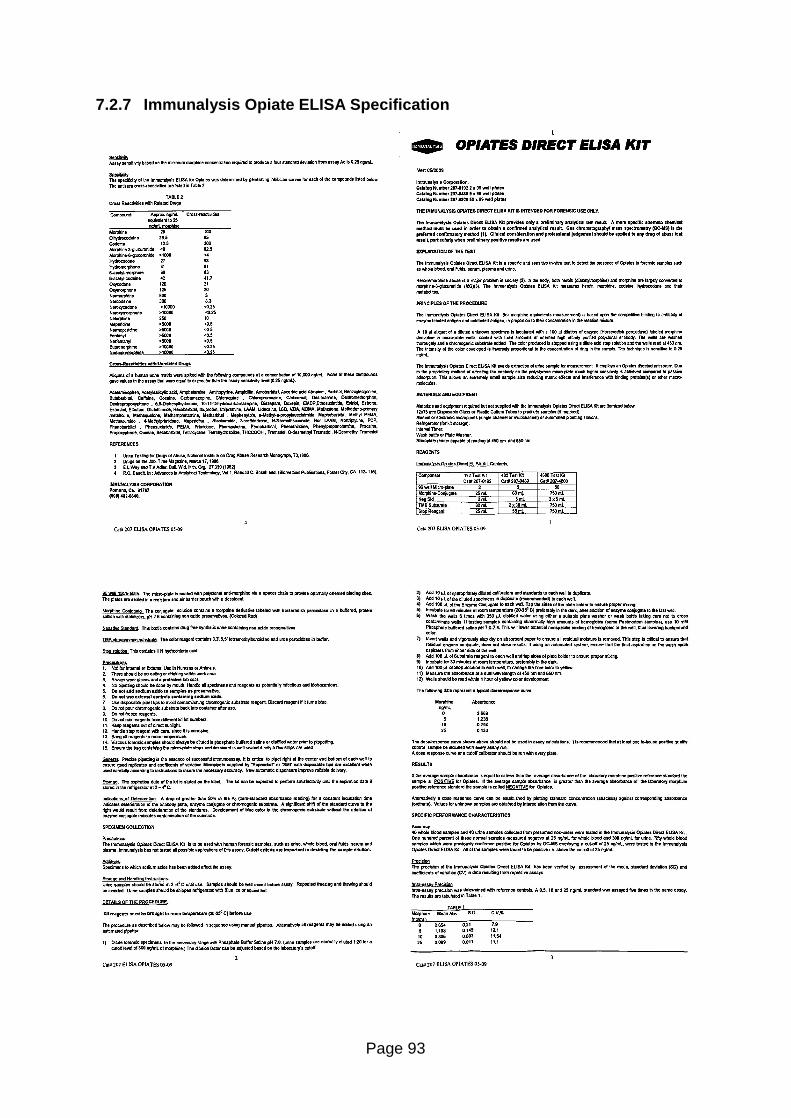
Page 93
7.2.7 Immunalysis Opiate ELISA Specification
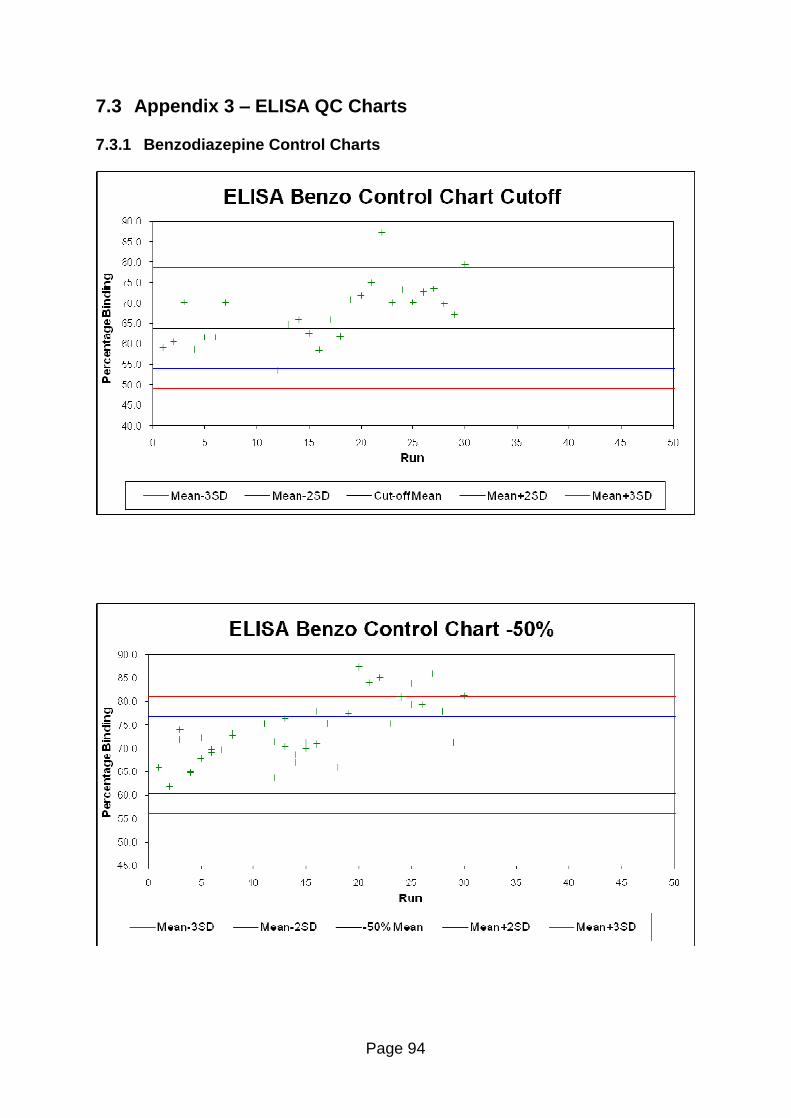
Page 94
7.3 Appendix 3 � ELISA QC Charts
7.3.1 Benzodiazepine Control Charts
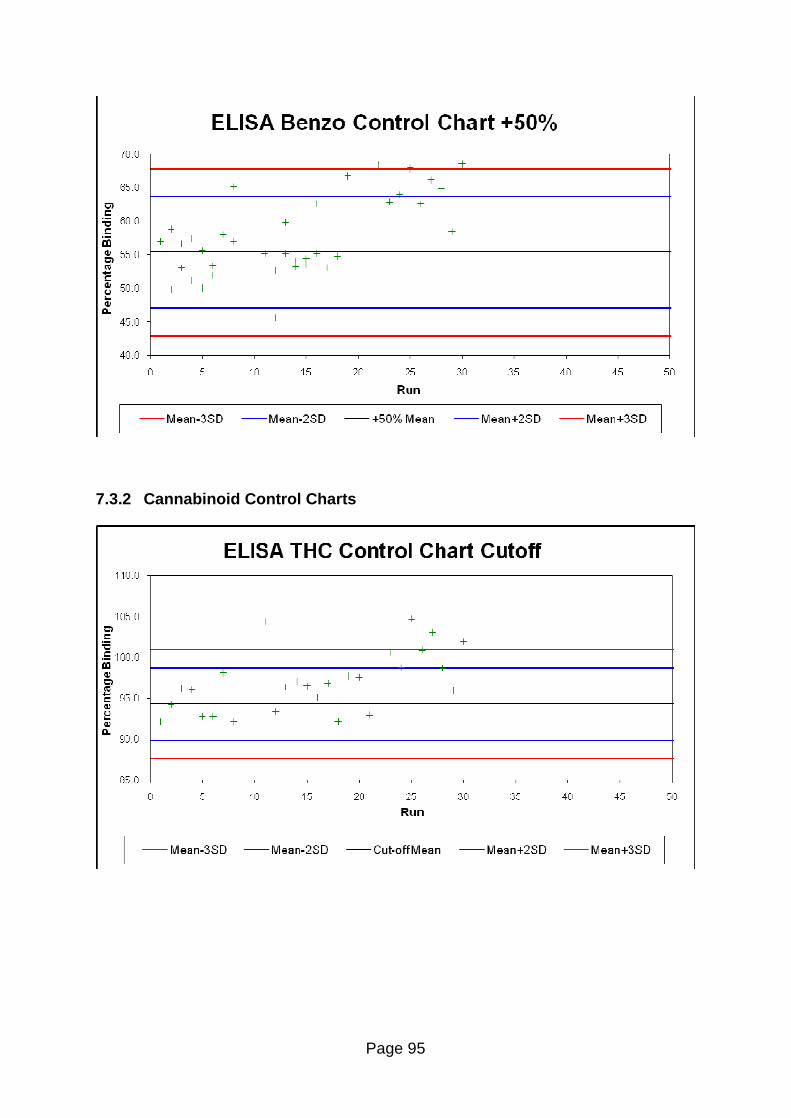
Page 95
7.3.2 Cannabinoid Control Charts
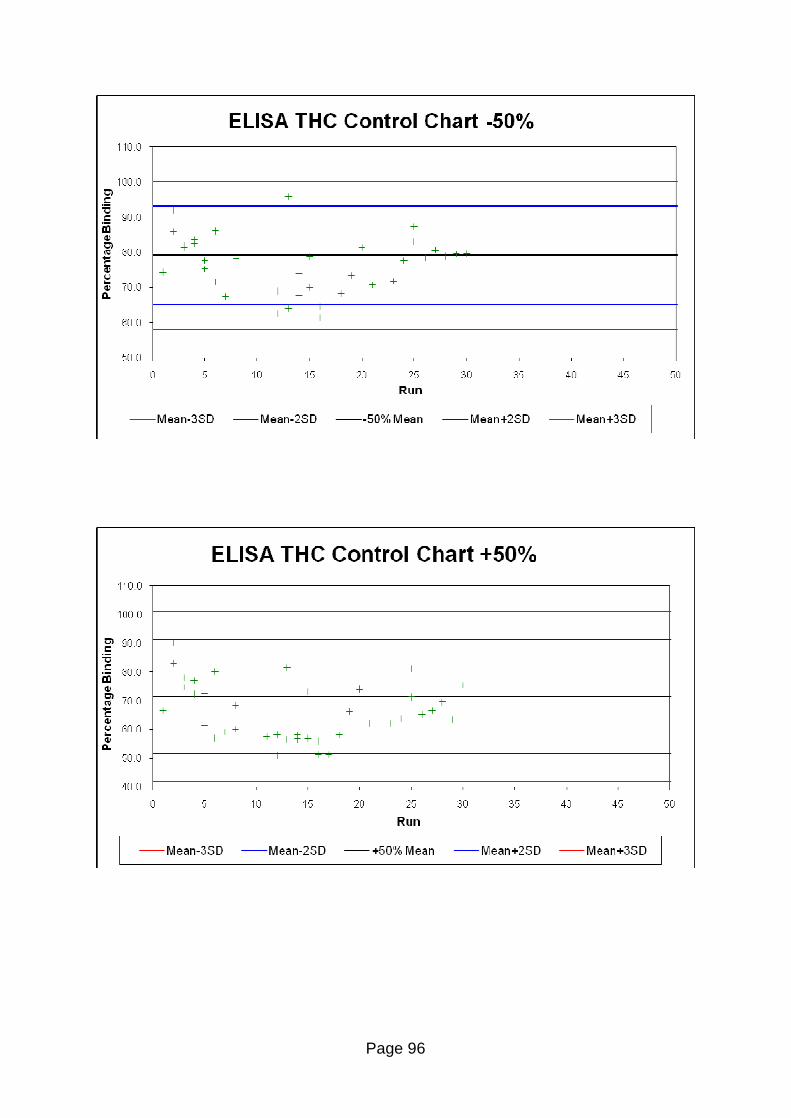
Page 96
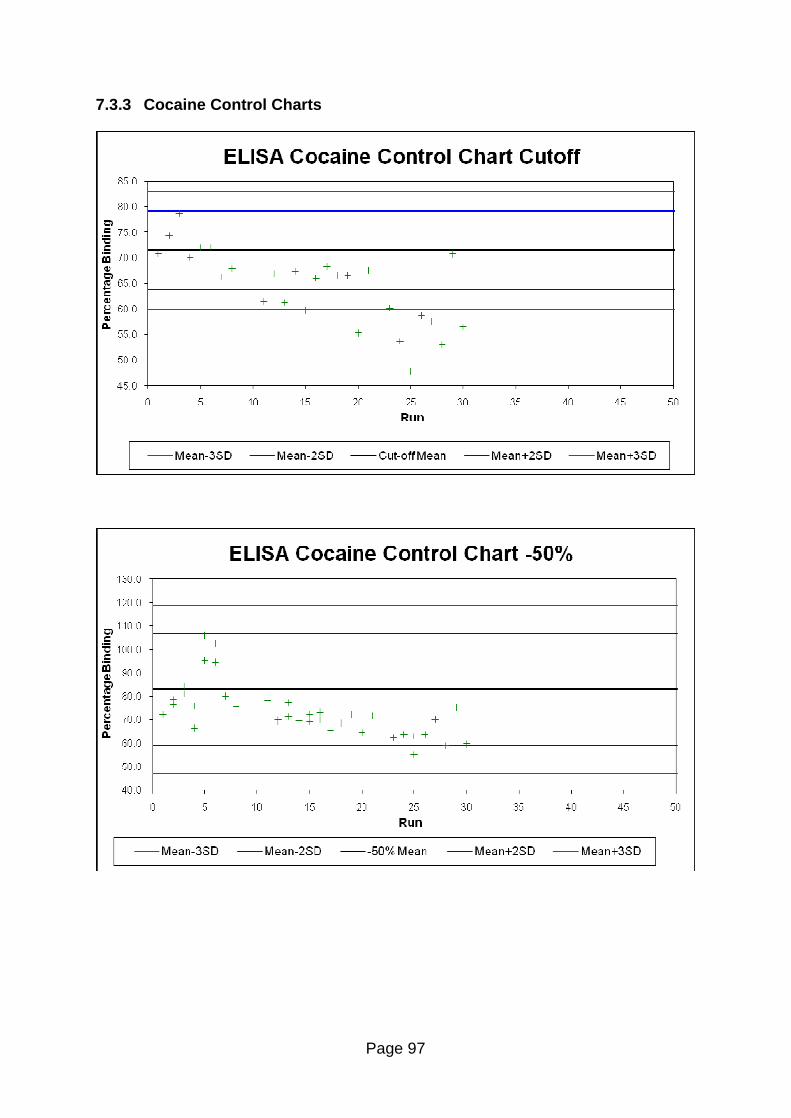
Page 97
7.3.3 Cocaine Control Charts
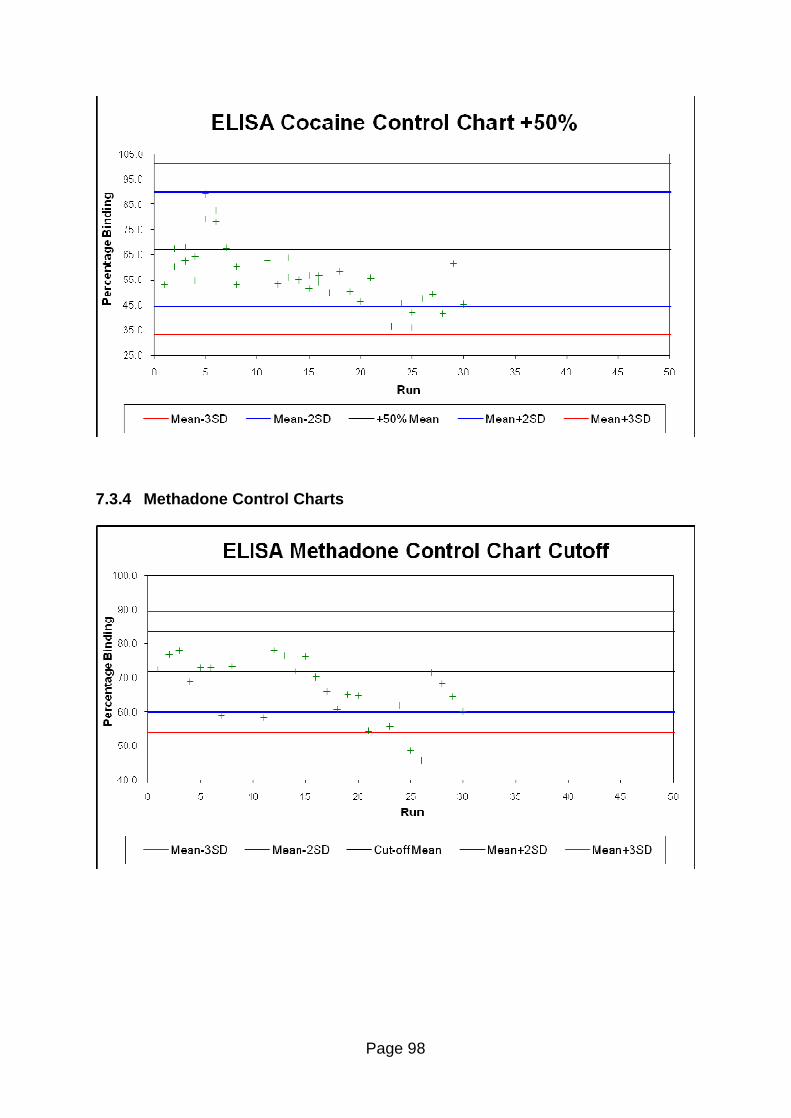
Page 98
7.3.4 Methadone Control Charts
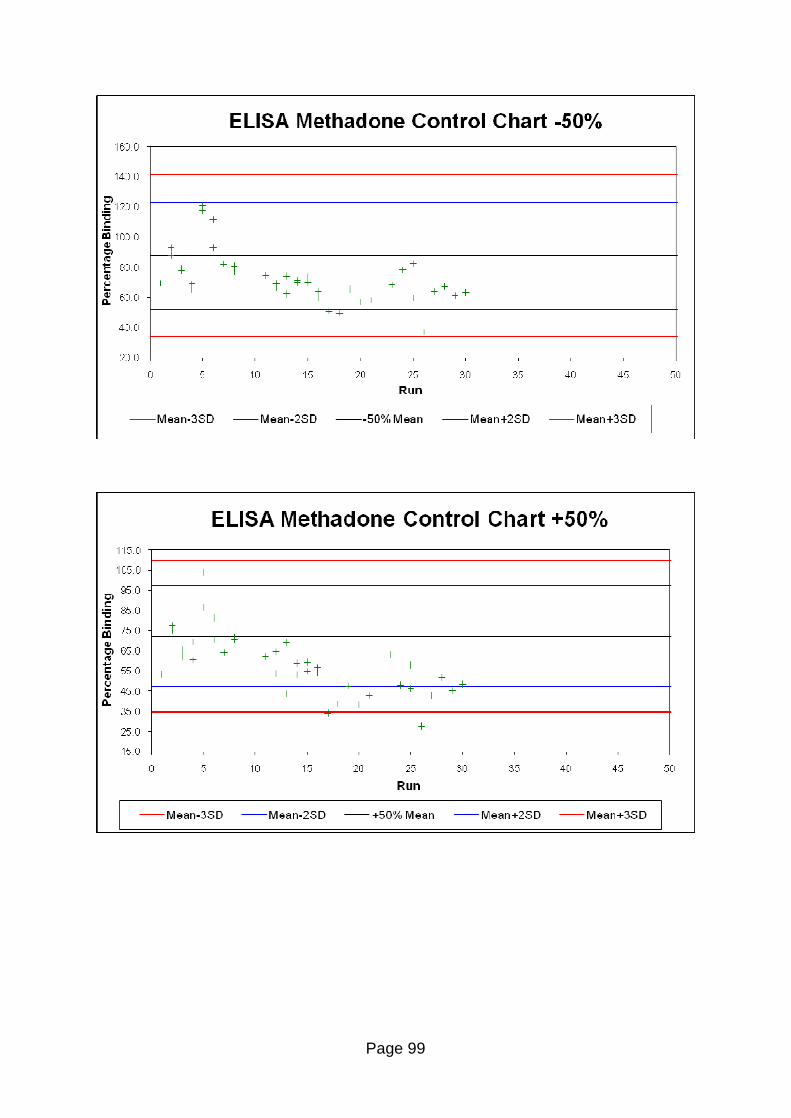
Page 99
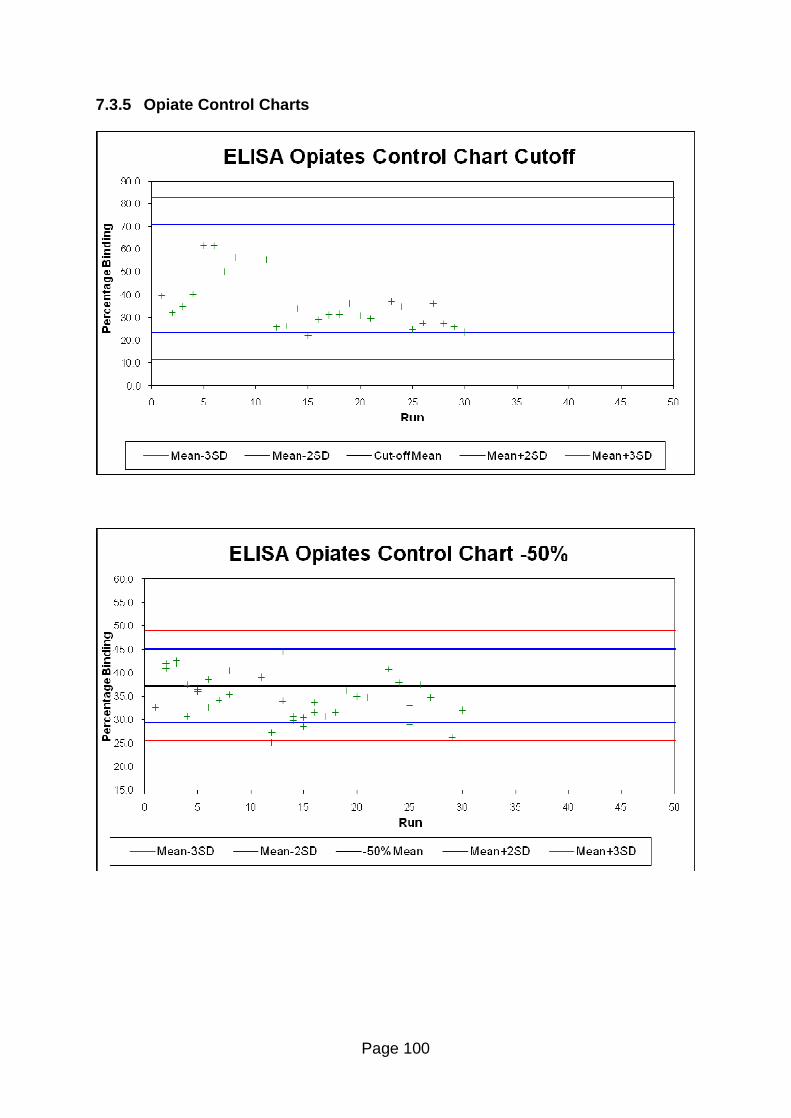
Page 100
7.3.5 Opiate Control Charts
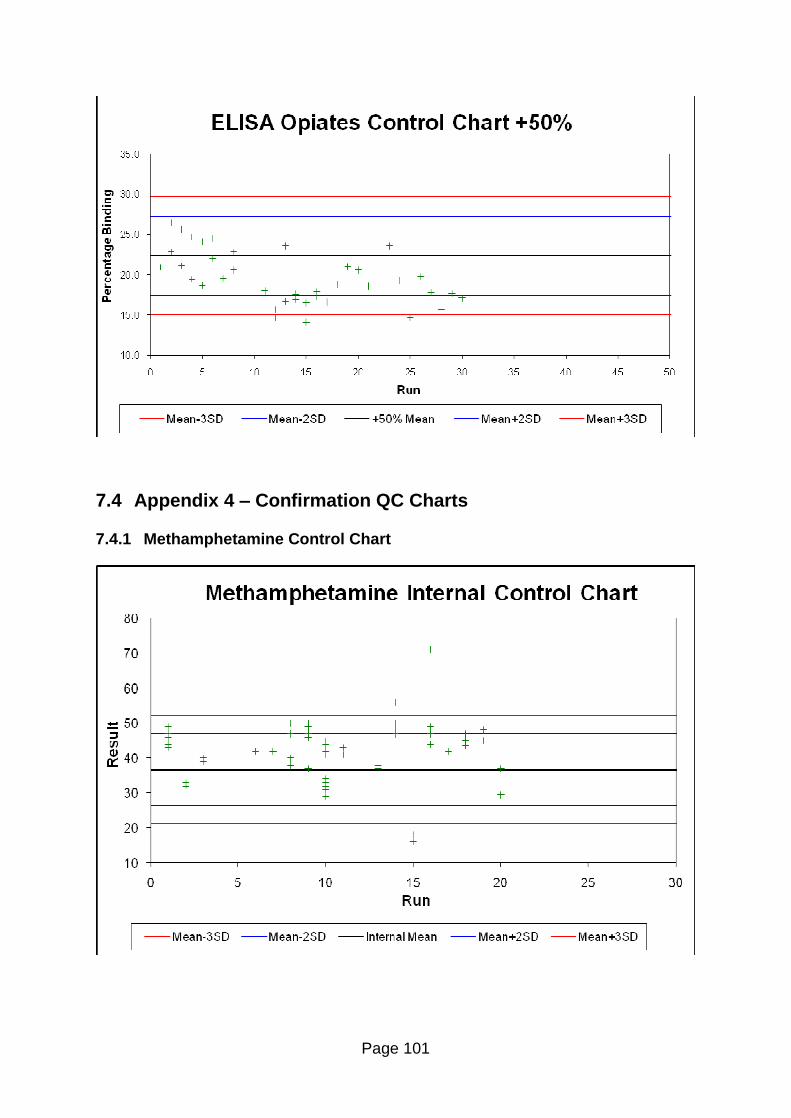
Page 101
7.4 Appendix 4 � Confirmation QC Charts
7.4.1 Methamphetamine Control Chart
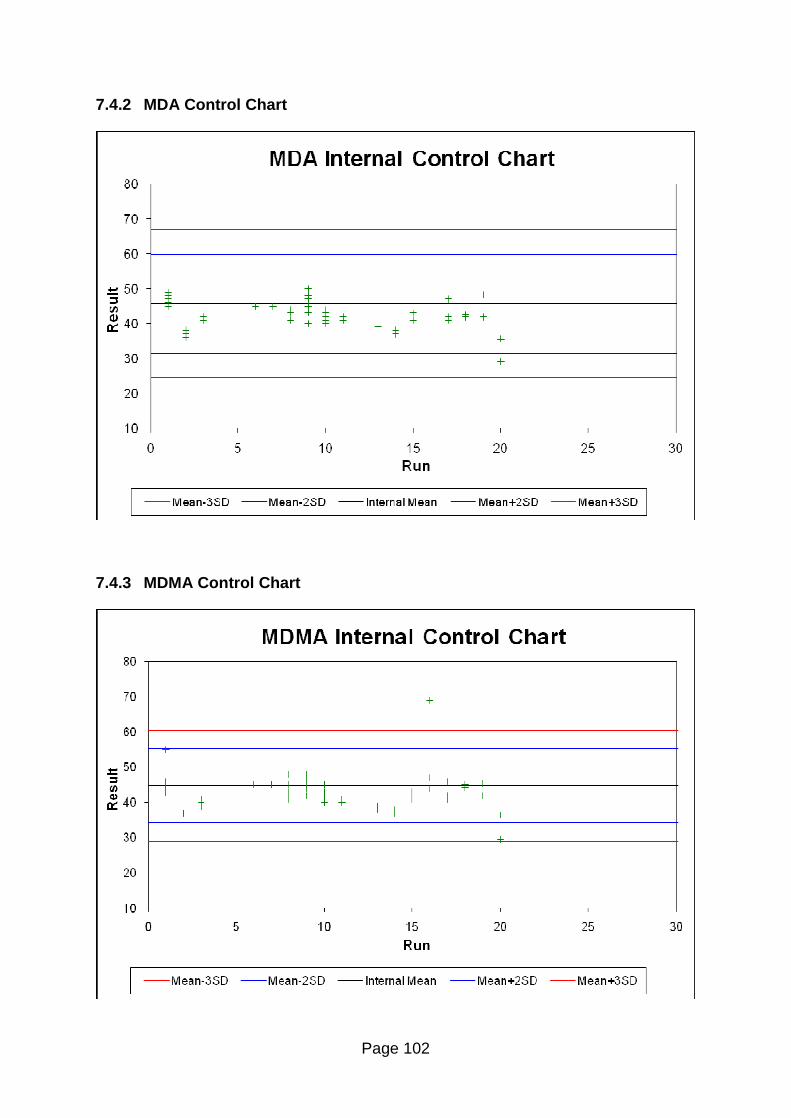
Page 102
7.4.2 MDA Control Chart
7.4.3 MDMA Control Chart
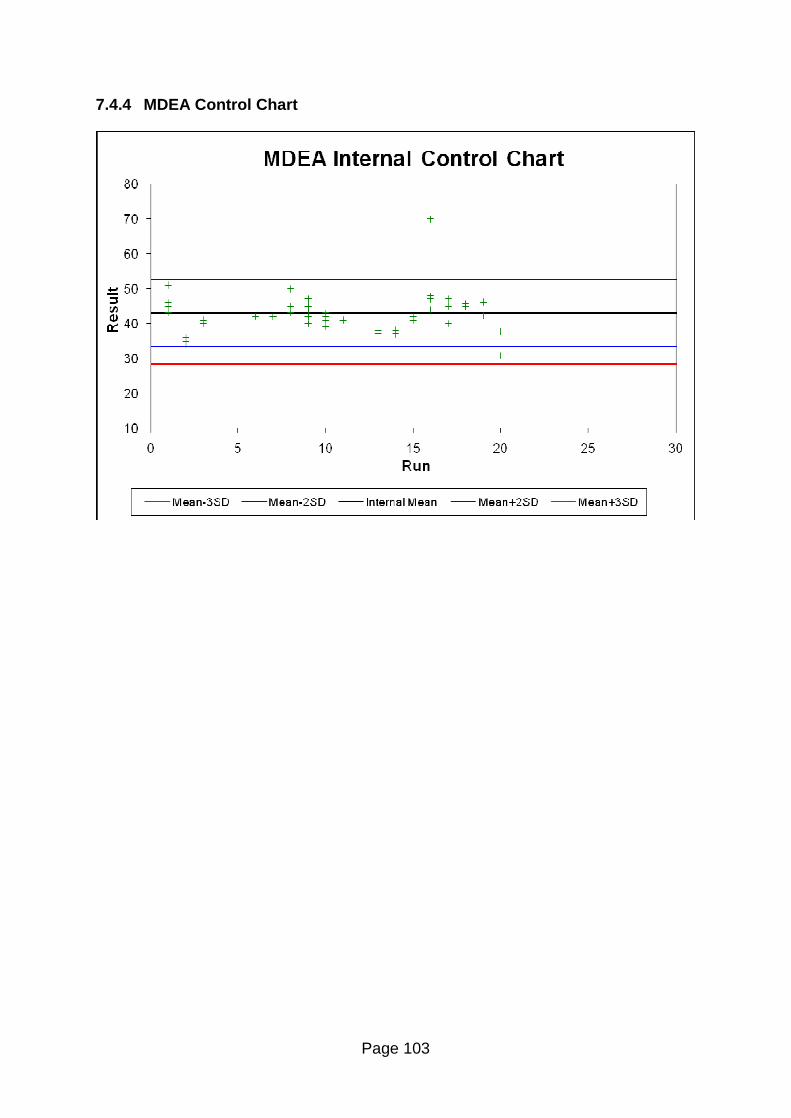
Page 103
7.4.4 MDEA Control Chart
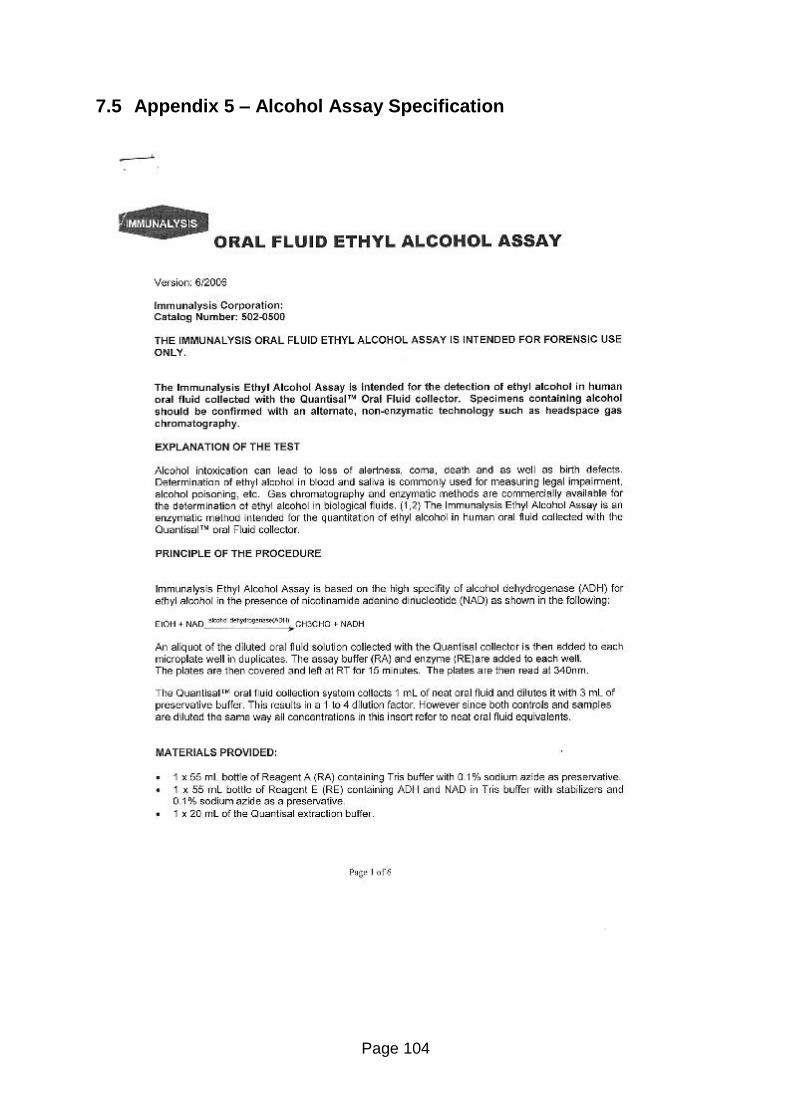
Page 104
7.5 Appendix 5 � Alcohol Assay Specification
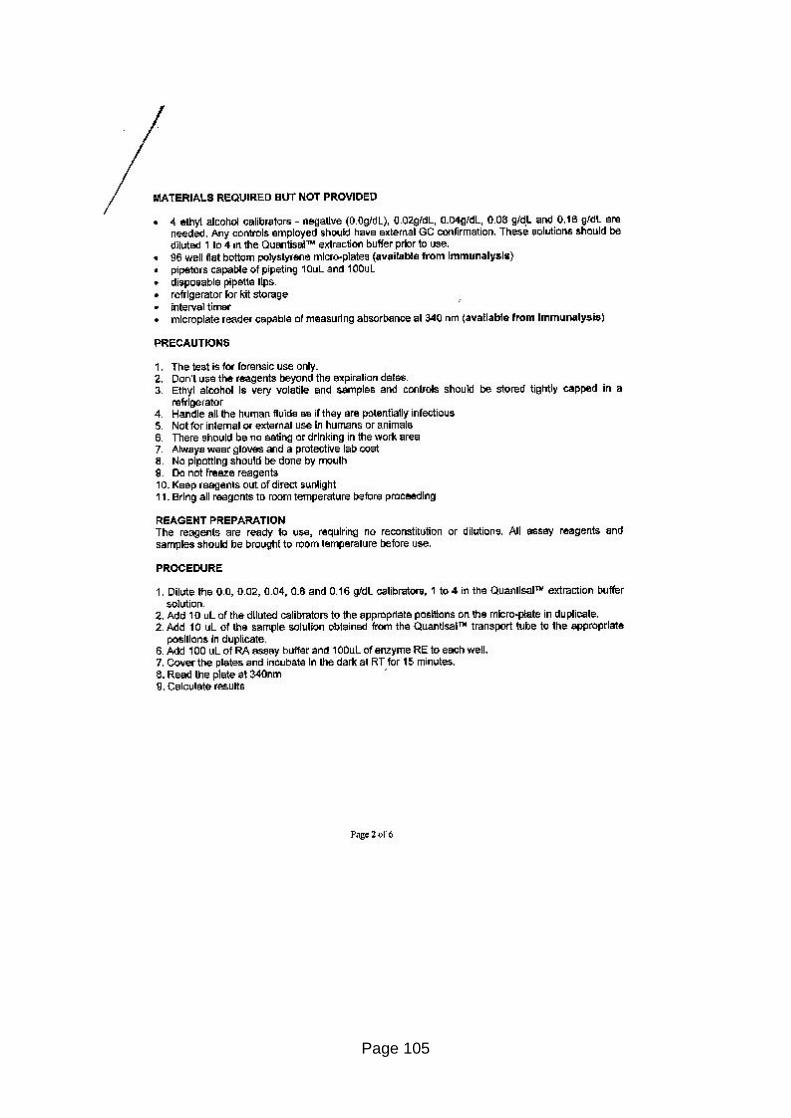
Page 105
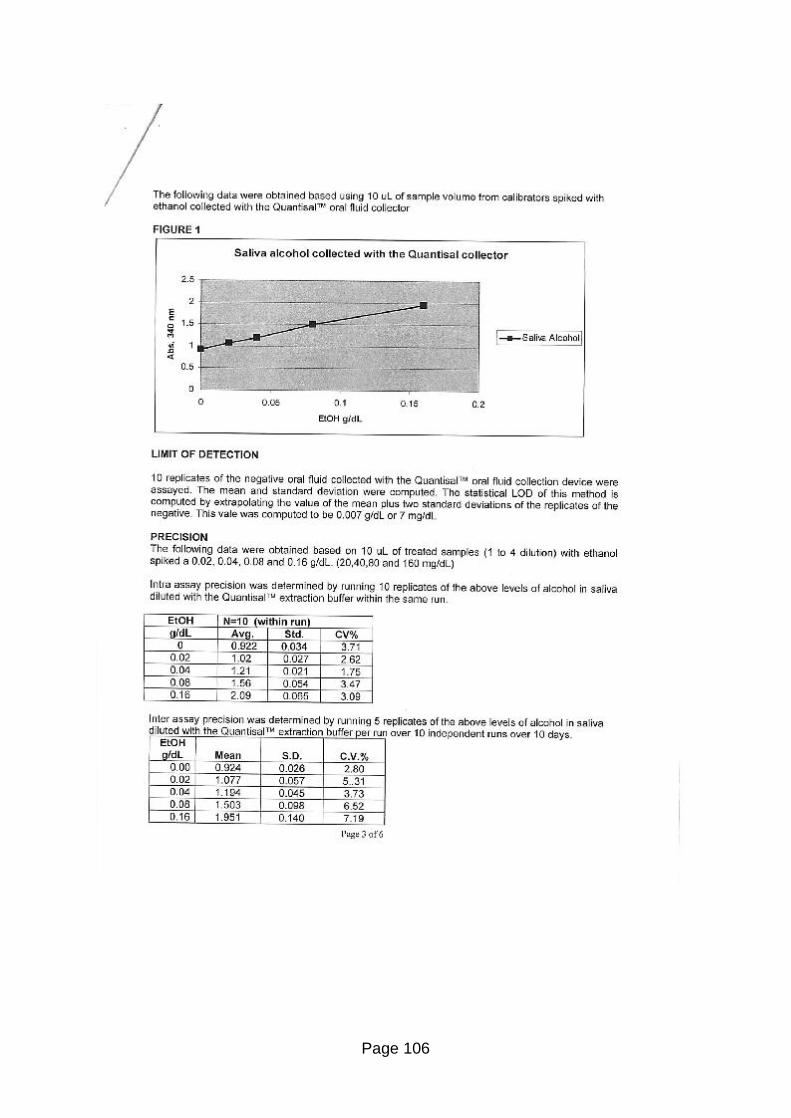
Page 106

Page 107
Page 108
Page 109
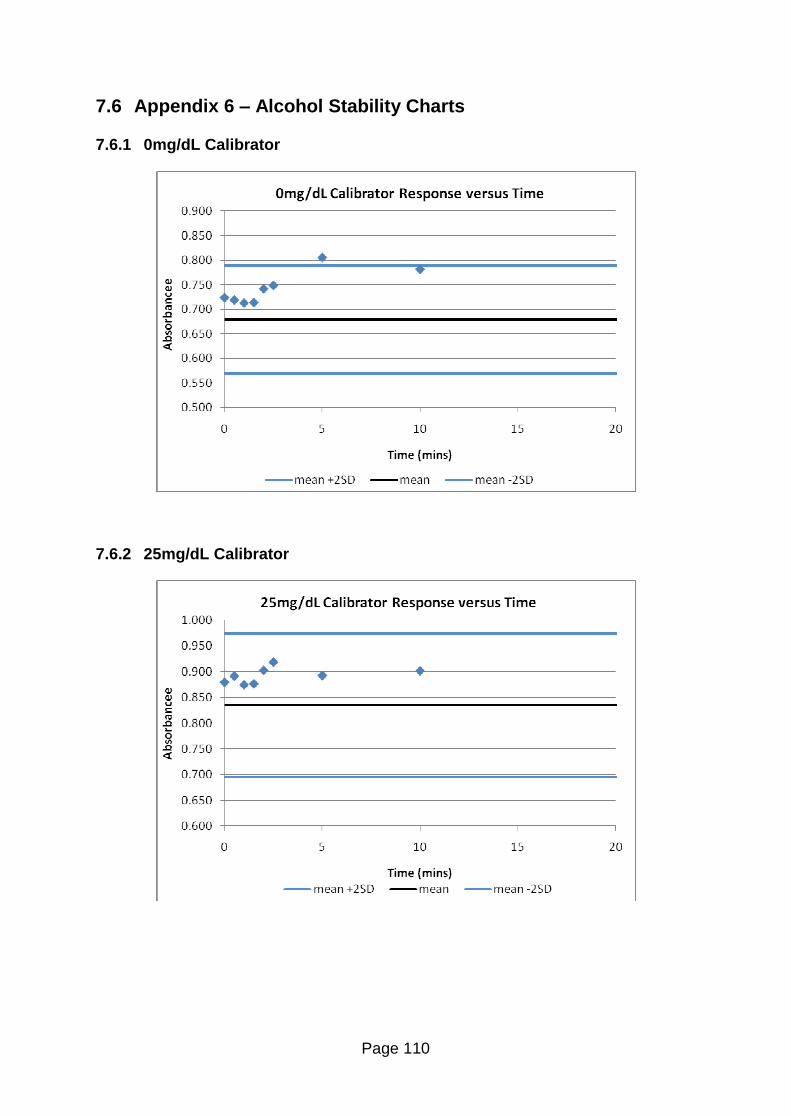
Page 110
7.6 Appendix 6 � Alcohol Stability Charts
7.6.1 0mg/dL Calibrator
7.6.2 25mg/dL Calibrator
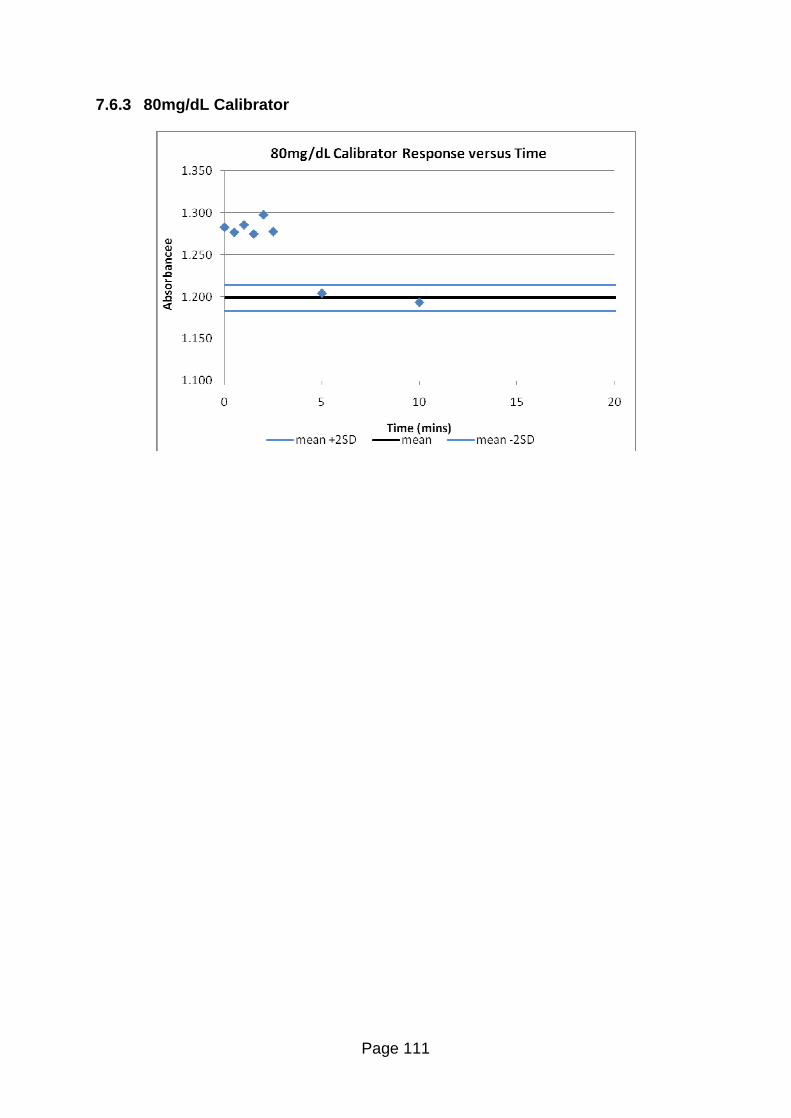
Page 111
7.6.3 80mg/dL Calibrator


![[XLS] · Web viewA7_Register_Registration A7_Register_Registration Alan Wragg #.1 Alan Wragg Special Racing Offset Single Seater 2014-Oct - Ex-VAR-GB - Query Ref CHASSIS#?, ENGINE#?,](https://img.pdfslide.us/doc/110x75/5af0fdb97f8b9ac2468eca78/xls-viewa7registerregistration-a7registerregistration-alan-wragg-1-alan.jpg)