Embed Size (px)
Citation preview

- Roshan Santhosh, MS in Data Science, Penn
WPA Case Study - Staff Mobility
1.Analysis & Findings

3
Mobility Metrics
Number of Posts/Time
Number of Locations/Time
Average hardship faced
Range of hardship faced
Number of HQ postings/Time
Success Metrics
Success in Internal Applications
Professional Growth in Grade
Promotion Speed
Average Performance Ratings
Operationalization of Concepts

4
Linear Regression and Random Forest models were used to measure the relationship between success & mobility
Demographic ControlsMobility Measures
● Number of locations● Mean hardship of posts● Range of hardship of
posts● Number of HQ postings● Number of grade 5 and
6 postings
●●
Success Measures
● Gender● Age● Nationality● Tenure Length● Starting Grade level
● Success in Internal Applications
● Professional Growth● Promotion Speed● Performance Ratings Random Forest
Linear Regression
Modeling
5
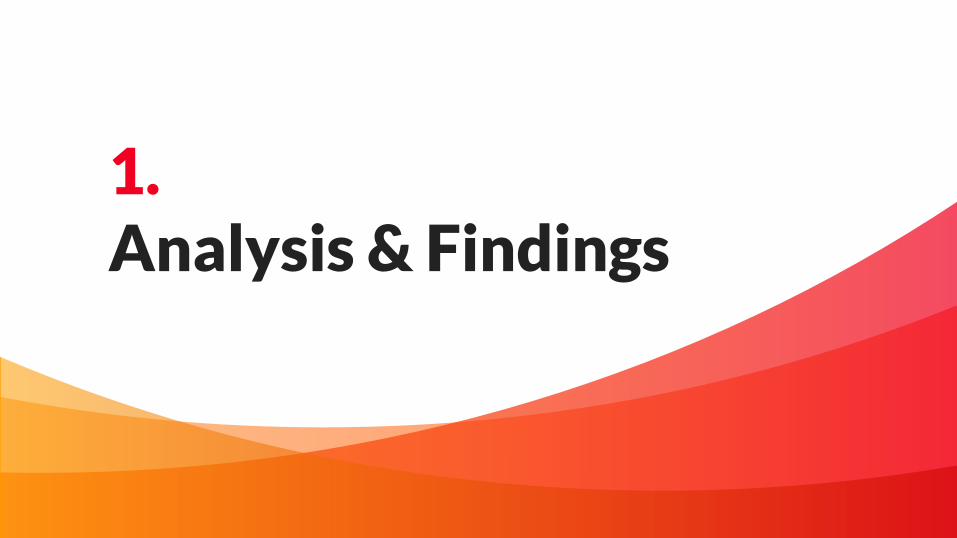
Dependent Variable Model R2 Significant Predictors (direction of impact + or -)
Professional Growth Score 0.340 Number of diff roles (+), Male Gender (-), Tenure (+), No of diff countries served in (+)
Success Rate in Internal Apps 0.144 No of diff countries served in (+), Application Count (+)
Average Performance Rating 0.023 Range of Hardship Faced (+)
Promotion Speed 0.280 Range of Hardship Faced (+), Tenure (+)(For women more postings with Family was likely to
positively impact promotions)
The Range of Hardship faced was a more significant predictor than its Average,signalling that mobility matters more than simply taking up a difficult posting
Significant Predictors: No of Posts, No of Locations and the Range of Hardship
Linear Regression models revealed an observable relationship between Mobility and Success
Modeling
6
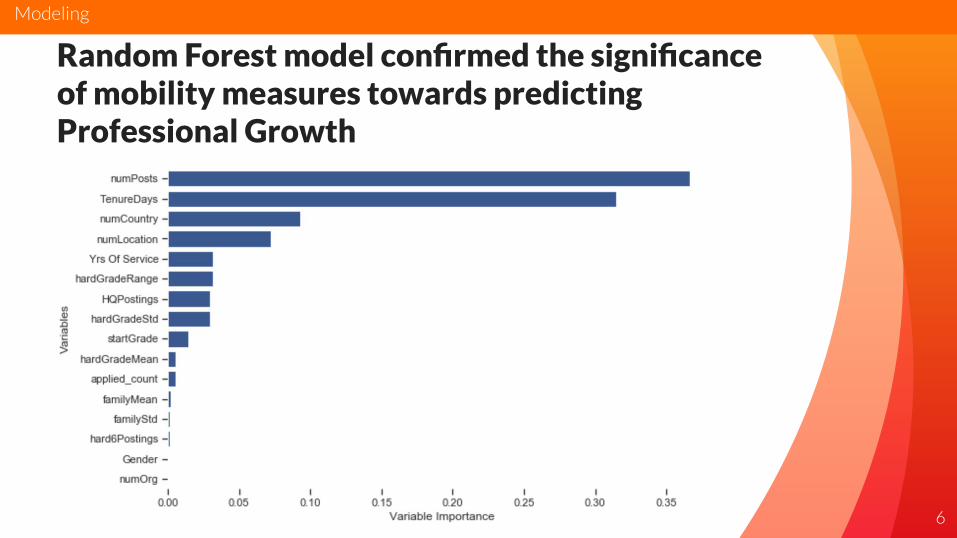
Random Forest model confirmed the significance of mobility measures towards predicting Professional Growth
Modeling

7
Key Segmentations
Level of Entry
● Low level Employees who enter the system through low grade positions (A1-A12)
General Service, National Officer
● High levelEmployees who enter the system through high grade positions (A12 and above)
International Professional
Home Country
We observed that the majority of categorised into 2 buckets
● Work in their home country
● Work outside of their home country
Relationship between Growth and Mobility

8
Controlling for Tenure length, we found a positive relationship between Range of Hardship faced and Professional Growth
Tenure Length
Relationship between Growth and Mobility
9
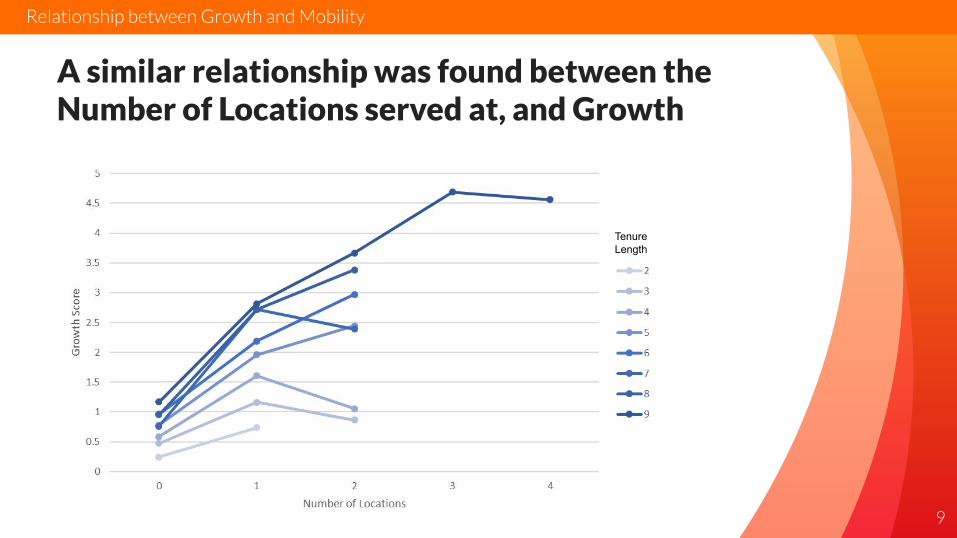
A similar relationship was found between the Number of Locations served at, and Growth
Tenure Length
Relationship between Growth and Mobility
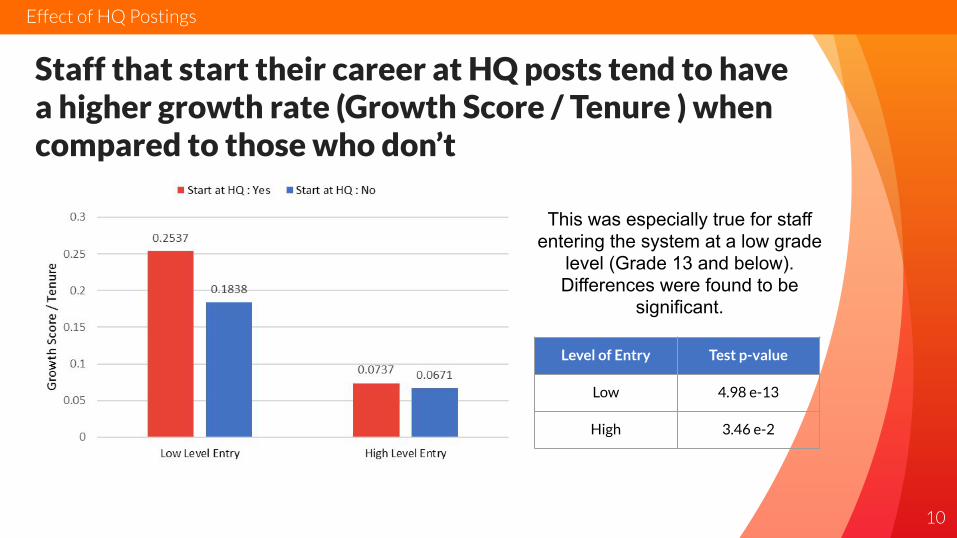
Staff that start their career at HQ posts tend to have a higher growth rate (Growth Score / Tenure ) when compared to those who don’t
10
This was especially true for staff entering the system at a low grade
level (Grade 13 and below). Differences were found to be
significant.
Level of Entry Test p-value
Low 4.98 e-13
High 3.46 e-2
Effect of HQ Postings
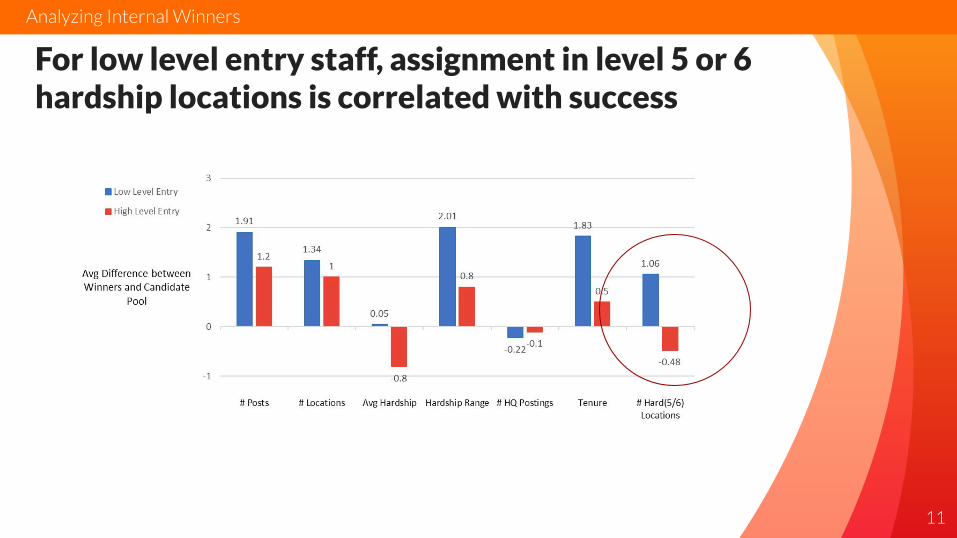
For low level entry staff, assignment in level 5 or 6 hardship locations is correlated with success
11
Analyzing Internal Winners
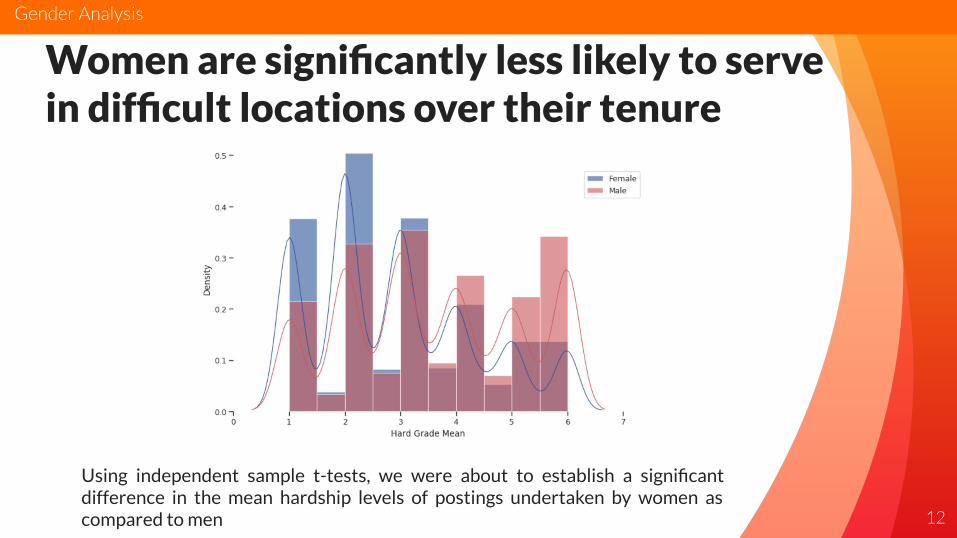
Women are significantly less likely to serve in difficult locations over their tenure
12
Using independent sample t-tests, we were about to establish a significant difference in the mean hardship levels of postings undertaken by women as compared to men
Gender Analysis
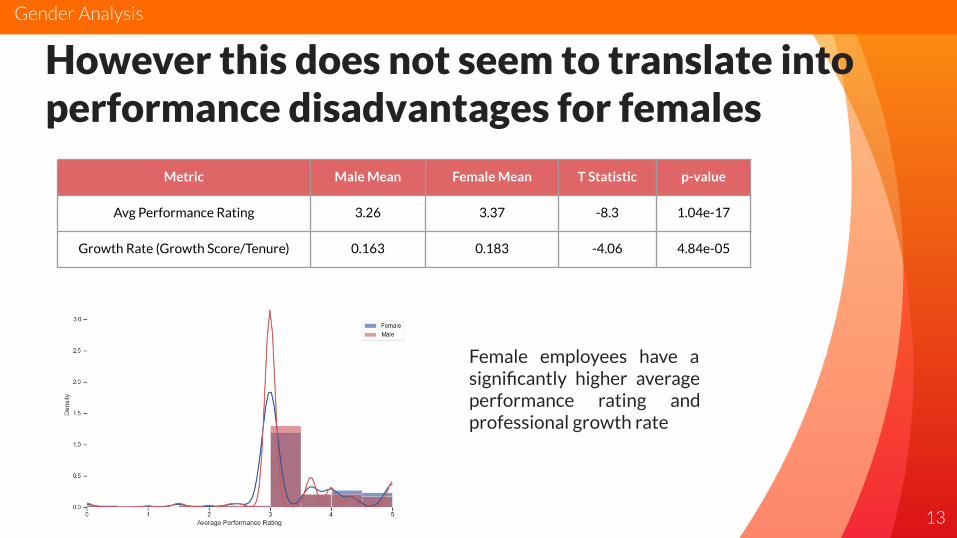
However this does not seem to translate into performance disadvantages for females
13
Metric Male Mean Female Mean T Statistic p-value
Avg Performance Rating 3.26 3.37 -8.3 1.04e-17
Growth Rate (Growth Score/Tenure) 0.163 0.183 -4.06 4.84e-05
Female employees have a significantly higher average performance rating and professional growth rate
Gender Analysis
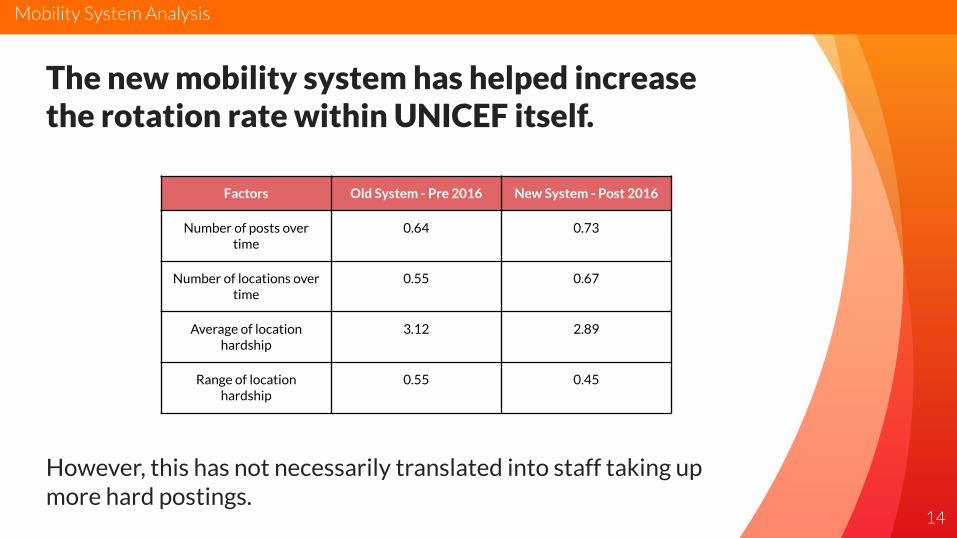
The new mobility system has helped increase the rotation rate within UNICEF itself.
However, this has not necessarily translated into staff taking up more hard postings.
14
Factors Old System - Pre 2016 New System - Post 2016
Number of posts over time
0.64 0.73
Number of locations over time
0.55 0.67
Average of location hardship
3.12 2.89
Range of location hardship
0.55 0.45
Mobility System Analysis

15
UNICEF outperforms UNDP on mobility measures, particularly post 2016
Mobility System Analysis
2.Recommendations
17
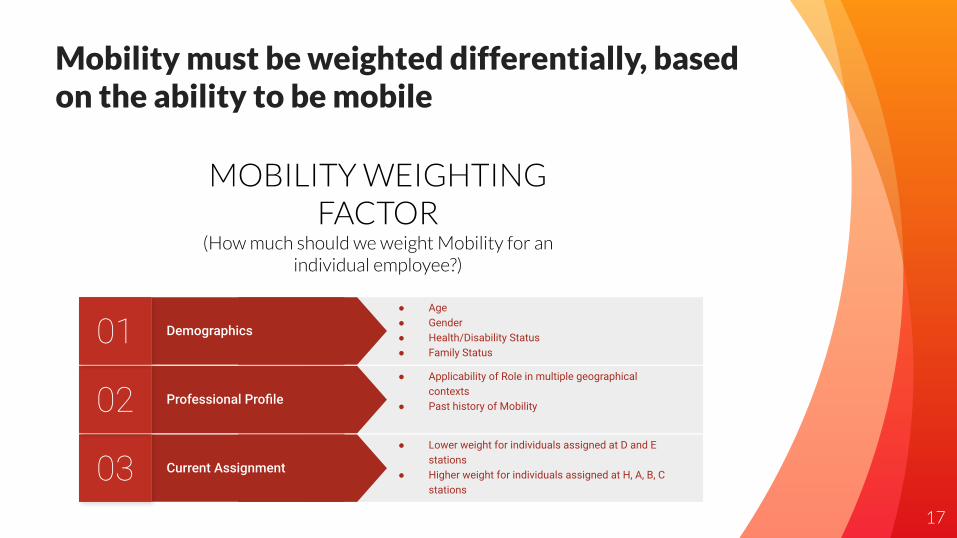
Mobility must be weighted differentially, based on the ability to be mobile
Current Assignment03● Lower weight for individuals assigned at D and E
stations● Higher weight for individuals assigned at H, A, B, C
stations
Professional Profile02● Applicability of Role in multiple geographical
contexts● Past history of Mobility
Demographics01● Age● Gender● Health/Disability Status● Family Status
MOBILITY WEIGHTING FACTOR
(How much should we weight Mobility for an individual employee?)

18
Standardize employee training and roles across geographies to create opportunities for mobility
Standardization of Roles: Improved ease of movement for staff
Development of Transferable Skills: Trainings to reduce inequities in opportunities for mobility across geographies. Better preparedness.
19
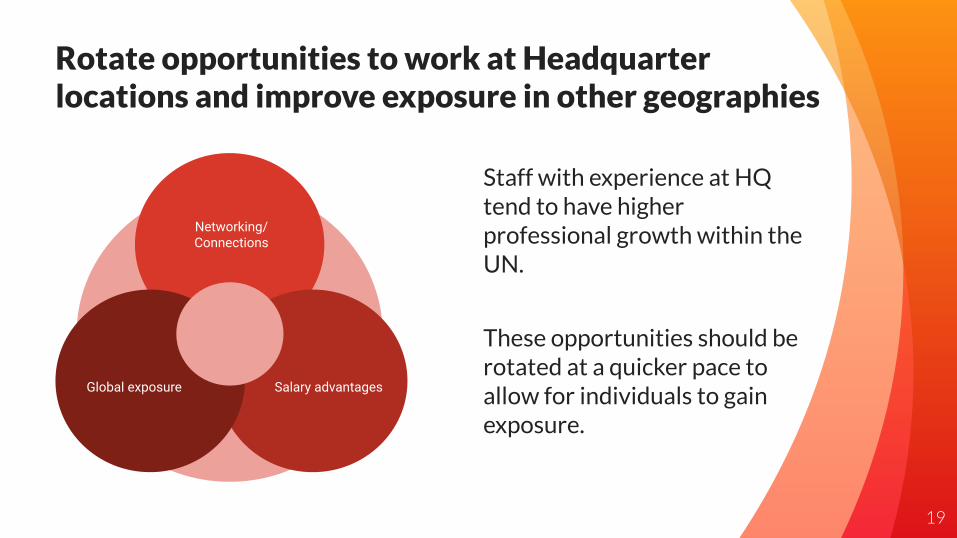
Rotate opportunities to work at Headquarter locations and improve exposure in other geographies
Networking/Connections
Salary advantagesGlobal exposure
Staff with experience at HQ tend to have higher professional growth within the UN.
These opportunities should be rotated at a quicker pace to allow for individuals to gain exposure.
20
Additional Recommendations
◦ Ease movement from hardship locations to HQ
◦ Adopt 5 level performance rating system