Embed Size (px)
DESCRIPTION
Employment in northern India
Citation preview

WORKING PAPER NO. 134
NORTHERN STATES VERSUS SOUTHERN STATES:A COMPARATIVE ANALYSIS
MATHEW JOSEPH
May, 2004
INDIAN COUNCIL FOR RESEARCH ON INTERNATIONAL ECONOMIC RELATIONSCore-6A, 4th Floor, India Habitat Centre, Lodi Road, New Delhi-110 003
website1: www.icrier.org, website2: www.icrier.res.in
NORTHERN STATES VERSUS SOUTHERN STATES:A COMPARATIVE ANALYSIS
MATHEW JOSEPH
May, 2004
The views expressed in the ICRIER Working Paper Series are those of the author(s) and do notnecessarily reflect those of the Indian Council for Research on International Economic Relations (ICRIER).

Content
Foreword ............................................................................................................................... i
Abstract ................................................................................................................................ ii
I Introduction ............................................................................................................. 1
II Size and Population ................................................................................................. 1
III Growth and its Pattern ........................................................................................... 3
IV Agriculture ............................................................................................................. 10
V Industry .................................................................................................................. 16
VI State Level Public Enterprises (SLPEs) .............................................................. 23
VII Power Sector .......................................................................................................... 25
VIII State Finances ........................................................................................................ 33
IX Banking and Institutional Finance ...................................................................... 42
X Social Sector ........................................................................................................... 46
XI IT and E-Governance............................................................................................ 51
XII Biotechnology......................................................................................................... 59
XIII Summary and Policy Conclusions........................................................................ 61
References .......................................................................................................................... 70

i
Foreword
The reforms of the 1990s significantly improved the growth rate of the Indian
economy but their impact has not been uniform across all states. Southern states grew
faster while northern states, which were at the forefront of the growth performance in the
1980s, grew much slower. On the human development front as well the North lagged
behind in the post-reform period. The experience of the 1990s has also brought out that
reforms at the state level has become crucial to the future growth and well being of the
country.
The study undertakes a deep analysis of the post-reform developments in the states
of both northern and southern regions. It examines the developments in these states with
regard to sector-wise economic performance, social progress, state finances, banking
infrastructure, power, IT & biotechnology, and the reform initiatives undertaken in
different areas including e-governance. The study also proposes important policy
measures needed for reviving agriculture and industry in these states as well as improving
their finances.
Arvind VirmaniDirector & Chief Executive
ICRIERMay 2004

ii
Northern States versus Southern States: A Comparative Analysis
Mathew Joseph *
Abstract
The performance of the northern states deteriorated economically and more so
socially in the last decade or so while the states in the South surged ahead in the post-
reform period. Southern states led by Andhra Pradesh and Karnataka have undertaken
wide-ranging reforms for some time now whereas northern states have initiated reforms in
a limited way. States in both the regions have a long way to go in restoring fiscal balance
and revitalising their agriculture and industry.
* The author would like to thank Bibek Debroy, N.J. Kurian and Rupa Rege Nitsure for their valuable
comments on an earlier draft of the paper.

1
I Introduction
The performance of India depends on the performance of its constituent states. Yet
all major indicators of performance are collected, compiled and analysed separately for the
country and for the states. However, there is an increasing realisation that unless each state
performs on its own, India cannot do well at all. The focus of attention has been moving to
the happenings in the states1. The Tenth Five Year Plan (2002-07), for the first time,
specifies targets of overall and by broad sector, the growth rate for each state to be
consistent with the national target of growth rate at 8 percent per annum.
The last decade or so following reforms saw an improvement in economic growth
and social development in the country as a whole. The performance of all the states,
however, has not been uniform during this period and a number of states have
underperformed. While southern states and, to some extent, western states made significant
progress, northern states in general did not do well. This has pushed down their relative
position vis-à-vis other states and sharpened inter-state disparities. This is a matter of
serious concern for planners and policy makers. The past tepid performance of northern
states is reflected in a number of areas and has important implications on the ability of the
country to climb further up the development ladder. An attempt has been made in this
paper to understand the various facets of underperformance of the northern states in
comparison with other regions particularly the southern states and all-India, and suggest
the possible ways by which these states could raise their future economic and social
performance.
II Size and Population
Rajasthan is the largest state in the country with 10.8 per cent of India’s
geographical area and Uttar Pradesh the fifth largest with 7.6 per cent area. Uttar Pradesh
is the most populous state with 16.2 per cent of India’s population. Haryana and Punjab
1 The need to pay greater attention to growth performance of individual states and the role of state
government policies in determining state level performance has been well articulated in Ahluwalia(2002). This paper compares the economic performance of major states in the post-reform period up to1997-98 in comparison with their performance in the 1980s.

2
registered a fast growth in urbanisation in the last decade with the ratio of the urban
population going up from 24.6 per cent in 1991 to 29.0 per cent in 2001 for the former and
from 29.5 per cent to 33.9 per cent for the latter. Chandigarh and Delhi are predominantly
urban with the urban population ratio touching 90 per cent and 93 per cent respectively in
2001. The rest of the northern states have had low and slow urbanisation with Himachal
Pradesh at just 9.8 per cent in 2001, Uttar Pradesh 20.8 per cent, Rajasthan 23.4 per cent
and Jammu & Kashmir at 24.9 per cent, all below the national average of 27.8 per cent.
Annual population growth during 1991-2001 has been higher than the national
average in all northern states and UTs except Himachal Pradesh and Punjab where the
growth has been 1.6 per cent and 1.8 per cent per annum respectively against the national
growth of 1.9 per cent per annum in the last decade. Being fast growing cities, Chandigarh
and Delhi registered a high population growth of 3.4 per cent and 3.8 per cent per annum
respectively during the last decade. In Haryana, Jammu & Kashmir, Rajasthan and Uttar
Pradesh, the rate of population growth either increased or remained the same in the range
of 2.3 to 2.6 per cent per annum in the last decade. The northern states, as a whole,
remained the area of highest population growth of 2.4 per cent and it is unique in not
registering any fall during the last decade where as it declined in all other regions in this
period.
The density of population in 2001 remained significantly above the national
average of 324 persons per sq. km. in Uttar Pradesh (689 persons), Punjab (482) and
Haryana (477) which occupied the fourth, fifth and sixth positions respectively in this
regard among the states. Delhi (9294 persons per sq. km) and Chandigarh (7903 persons)
remained the first and second densely populated among the UTs in 2001. On the contrary,
Himachal Pradesh, Jammu & Kashmir, Rajasthan and Uttranchal are sparsely populated
having density of population much below the national average.
Andhra Pradesh is the biggest south Indian state with an area that comes fourth in
India and a population that is fifth in the country. In size, Karnataka comes next to Andhra
Pradesh among the southern states, and in population, third after Andhra Pradesh and

3
Tamil Nadu. Thus Kerala is the smallest south Indian state in size and population. Kerala,
however, has the highest population density in the South, which is the third in the country
after West Bengal and Bihar. Andhra Pradesh and Karnataka are sparsely populated states
with density of population lower than the all-India average.
Tamil Nadu is the most urbanised state in the country with about 44 per cent of
population living in urban areas in 2001 (34 per cent in 1991) against 42 per cent for
Maharashtra (39 per cent in 1991). Urbanisation grew slowly in Karnataka during the last
decade to 34 per cent in 2001 from 31 per cent in 1991. In Andhra Pradesh and Kerala the
process of urbanisation has come to a virtual stand still at 26 to 27 per cent with no change
in the last decade.
All south Indian states except Karnataka have made substantial progress in
population control with Kerala registering the lowest growth in population in the country
of 0.9 per cent per annum during the last decade followed by Tamil Nadu (1.1 per cent)
and Andhra Pradesh (1.3 per cent). Karnataka’ s annual population growth also declined in
the last decade to 1.6 per cent from 1.9 per cent and remains below the all-India growth.
III Growth and its Pattern
Table 1 gives an account of the growth performance and its sectoral composition
for the states and UTs in northern and southern regions during the last two decades in
comparison with the average growth and its pattern in other regions. This brings out some
interesting facts. Firstly, there has been an all-round deterioration in the growth rates of the
northern and northeastern regions during the 1990s, while growth performance improved
in all other regions in this period. Secondly, the South showed improved performance by
a full percentage point from 5 per cent per annum in 1980s to 6 per cent in the 1990s, and
this has been reflected in the better performance in all the three sectors: agriculture,
industry and services. Thirdly, the West and East could improve its growth record only
marginally in the 1990s and this is due to the poor show of their agriculture sector in this
period.

4
Looking more closely at the individual northern states, we note the following facts:
The growth in all the northern states except Himachal Pradesh and Jammu & Kashmir
decelerated in the 1990s; the growth of agriculture in all the northern states except perhaps
in Jammu & Kashmir either deteriorated significantly (except Uttar Pradesh) or remained
stagnant at low levels (Uttar Pradesh); industrial growth also suffered in all the states
except Himachal Pradesh and Rajasthan where growth accelerated in fact in the 1990s; the
growth in the services sector also worsened in the last decade in all northern states except
Punjab and perhaps Jammu & Kashmir. This is in sharp contrast with individual southern
states where growth accelerated in the 1990s except a mild deceleration in the case of
Andhra Pradesh.
While a sharp fall in the share of agriculture in state economies over the past
decades has happened also in the northern states, the agriculture sector remains more
Agriculture Industry Services Total Agriculture Industry Services Total
3.9 8.4 8.1 6.1 2.7 5.9 7.5 5.22.8 6.3 7.0 5.0 0.7 10.3 6.2 5.7n.a n.a n.a 3.1 4.5 1.2 7.8 5.4
Punjab 5.5 7.7 4.6 5.7 2.6 6.7 5.6 4.6Rajasthan 5.0 6.9 8.4 6.5 2.0 8.4 6.6 5.4
2.5 7.9 6.5 4.9 2.5 4.9 4.6 3.9Chandigarh n.a n.a n.a n.a -1.9 10.1 9.5 9.4Delhi 3.9 8.7 7.6 7.8 -3.7 5.9 7.1 6.6
3.6 7.8 6.9 5.6 2.4 6.1 5.8 4.8
Total WEST 3.1 6.3 7.2 5.6 0.4 7.0 7.6 5.8
Andhra Pradesh 3.9 5.4 6.3 5.1 2.7 6.0 6.0 4.9Karnataka 3.2 6.5 7.5 5.6 4.9 7.0 8.9 7.1Kerala 1.2 3.3 5.0 3.3 3.2 5.9 7.2 5.8Tamil Nadu 4.4 4.6 6.6 5.4 3.3 6.2 7.8 6.3Pondicherry 0.3 4.7 5.4 4.2 0.6 8.4 10.0 7.4Total SOUTH 3.4 5.0 6.5 5.0 3.5 6.3 7.4 6.0
Total EAST 3.2 5.0 5.2 4.4 1.3 4.4 7.1 4.5
2.8 6.6 5.8 4.7 1.7 3.9 4.9 4.0
3.4 6.1 6.5 5.2 2.0 6.2 6.9 5.3
ALL-INDIA 3.4 7.0 6.9 5.6 2.7 5.9 7.4 5.6
Source: Computed from CSO data.
Total NORTHEAST
TOTAL: All States/U.Ts
Note: For Chandigarh, the growth rates in the nineties pertain to the period 1994-01.
Himachal PradeshJammu & Kashmir
Uttar Pradesh
Total NORTH
Table 1: Growth in Gross State Domestic Product by Sector at Constant Prices:Northern and Southern States & UTs (% Per Annum)
1981-90 1990-01
Haryana

5
important than industry in all the northern states (except Himachal Pradesh and Rajasthan),
an attribute that is shared with the states in the East and Northeast (Table 2). Punjab
had about 39 per cent of GSDP originating from agriculture in 2000-01, Uttar Pradesh
32 per cent, for Haryana 31 per cent and Jammu & Kashmir at 29 per cent. In contrast,
there has been substantial industrialisation in the states of Himachal Pradesh and Rajasthan
in the last decade leading to the share of industry in these states rising from less than a
fourth at the end of 1980s to nearly a third in recent years. For the UTs of Chandigarh and
Delhi, services sector is preeminent with 71 per cent and 80 per cent of their economies
respectively, and agriculture sector constituting hardly 2 per cent in 2000-01.
The sectoral compositions of the economies of the four southern Indian states show
a diverse mix (Table 2). Among these states, Tamil Nadu has the biggest industrial sector
share (33 per cent) in 2000-01, almost equal to that in Maharashtra, and Kerala, the
smallest (22 per cent) and the other two states in between at about 25 per cent each which
is some what lower than the all-India share of about 27 per cent. Tamil Nadu has relatively
the smallest agriculture sector in the state economy (16 per cent) whereas Andhra Pradesh
has the highest (30 per cent), followed by Karnataka (27.5 per cent) and Kerala (24 per
cent). Thus for Andhra Pradesh and Karnataka, agriculture is more dominant in their
economies than in the national economy where its share is about 25 per cent. The relative
importance of the services sector in the state economy is highest for Kerala (54.5 per cent)
followed by Tamil Nadu (51.5 per cent) and Karnataka (47 per cent). Andhra Pradesh has
the smallest services sector in the South constituting only 45 per cent of the total. The
share of services sector in both Andhra Pradesh and Karnataka is smaller than for the all-
India average (48 per cent) in 2000-01. It may be noted that a rapid tertiarisation of the
Kerala economy has occurred in recent years since 1996-97 along with an equally rapidly
shrinking of its agricultural sector.

6
Agriculture Industry Services Agriculture Industry Services Agriculture Industry Services Haryana 53.4 19.8 26.8 43.1 24.7 32.2 31.3 29.9 38.7Himachal Pradesh 46.8 20.1 33.1 35.4 24.7 39.9 26.7 33.2 40.1Jammu & Kashmir n.a n.a n.a n.a n.a n.a 29.4 18.4 52.2Punjab 49.1 20.0 30.9 45.0 23.0 32.0 39.1 24.5 36.4Rajasthan 48.9 20.9 30.1 42.1 22.1 35.7 27.3 30.3 42.4Uttar Pradesh 50.4 16.9 32.8 39.5 23.0 37.5 32.3 23.8 43.9Chandigarh n.a n.a n.a n.a n.a n.a 1.3 28.0 70.6Delhi 4.0 25.3 70.7 4.3 25.6 70.2 1.6 18.9 79.6All NORTH 46.3 19.0 34.6 37.7 23.3 38.9 28.1 25.2 46.7
All WEST 34.4 31.9 33.7 28.4 33.4 38.2 15.9 35.7 48.5
Andhra Pradesh 42.9 20.1 37.0 35.2 23.5 41.3 29.6 25.1 45.2Karnataka 43.1 23.3 33.6 34.5 26.3 39.1 27.5 25.5 47.0Kerala 36.6 25.3 38.1 30.4 27.6 42.1 23.6 21.9 54.5Tamil Nadu 24.3 35.0 40.7 20.8 34.8 44.4 15.7 32.8 51.5Pondicherry 18.5 54.3 27.2 15.7 46.2 38.1 7.1 44.2 48.7All SOUTH 36.2 26.4 37.4 29.9 28.3 41.8 23.8 27.2 49.0
All EAST 39.1 27.5 33.4 36.2 28.5 35.3 30.1 23.2 46.7
All NORTHEAST 44.7 14.7 40.6 35.8 27.5 36.8 33.2 22.3 44.5
TOTAL: All States/U.Ts 39.3 25.7 35.0 32.9 28.4 38.7 24.0 28.3 47.7ALL-INDIA 38.9 24.5 36.6 31.3 27.6 41.2 24.9 26.6 48.5
Table 2: Sectoral Distribution (%) of Gross State Domestic Product: Northern and Southern States & U.Ts
1980-81 1989-90 2000-01
Source: Constructed from CSO data.
The predominance of the services sector in Kerala is expected to pick up further
speed in the future with the emphasis on tourism, technical education and health care
services in the state. The World Travel and Tourism Council (WTTC) and Oxford
Economic Forecasting (OEF) group study has forecast a near tripling of the current level of
tourist arrivals (domestic and foreign combined) from 0.7 million to 2 million by 2012. It
has estimated an 11.6 per cent annual growth in tourist arrivals in Kerala in the next
decade, overtaking Turkey who is currently the fastest growing tourist destination.
Kerala government has opened up technical education to private enterprise in 2001.
As a result, the number of engineering colleges sanctioned has increased from 17 in 1999
to 71 in 2002 and the number of engineering seats from about 6000 to 16,000. This change
has come too late for Kerala as its neighboring states have made significant strides in
technical education by allowing private sector to set up large number of engineering
colleges long ago. A number of engineering seats are now vacant in Kerala and as the state
is going to allow students from other states also to seek admission in engineering colleges

7
of Kerala, the vacancy position in engineering colleges of other southern states who are
currently facing overcapacity will further aggravate2.
With high per capita income, the long tradition of nursing and paramedical
education and NRI doctors, Kerala has become an ideal place for setting up super-
speciality hospitals. A number of such medium and large hospitals have already come up
in cities like Kozhikode in Kerala, which are funded by NRI money, and many more are
expected3.
The North as a whole has been able to preserve its share in aggregate domestic
product at about 27 to 28 per cent of all-States & UTs during the last two decades. This is
similar to the West, which although had raised its share to almost 30 per cent in the mid-
1990s came down to 28 per cent in 2000-01 (Table 3). Only the South improved its share
continuously over the last two decades from about 23 per cent in 1980-81 to nearly 27 per
cent in 2000-01. The East lost its share from about 18 per cent in 1980-81 to 15 per cent in
2000-01 and the Northeast marginally from above 3 per cent to less than 3 per cent in the
same period.
2 The vacant seats in the engineering colleges of Tamil Nadu were 24 per cent during 2001-02 and 13 per
cent in Karnataka. (See The Economic Times, Mumbai, 15 May 2003.3 See The Economic Times, Mumbai, 16 May 2003.
8
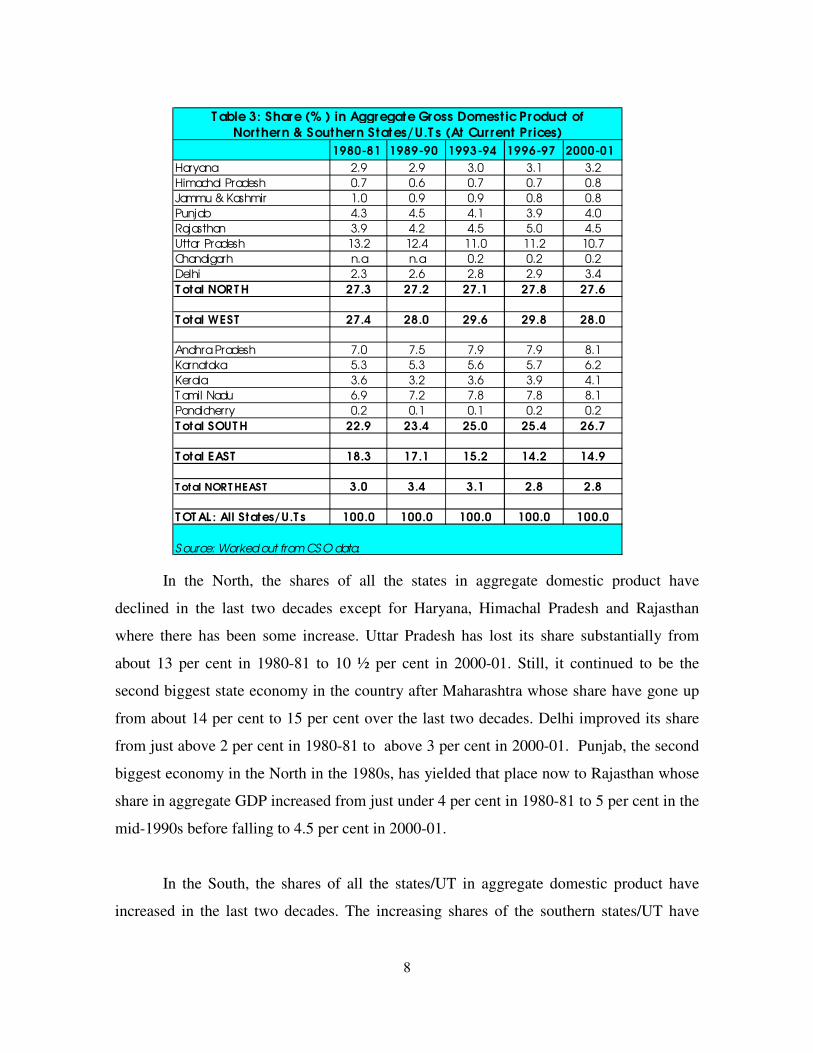
1980-81 1989-90 1993-94 1996-97 2000-01Haryana 2.9 2.9 3.0 3.1 3.2Himachal Pradesh 0.7 0.6 0.7 0.7 0.8Jammu & Kashmir 1.0 0.9 0.9 0.8 0.8Punjab 4.3 4.5 4.1 3.9 4.0Rajasthan 3.9 4.2 4.5 5.0 4.5Uttar Pradesh 13.2 12.4 11.0 11.2 10.7Chandigarh n.a n.a 0.2 0.2 0.2Delhi 2.3 2.6 2.8 2.9 3.4T otal NORT H 27.3 27.2 27.1 27.8 27.6
T otal WEST 27.4 28.0 29.6 29.8 28.0
Andhra Pradesh 7.0 7.5 7.9 7.9 8.1Karnataka 5.3 5.3 5.6 5.7 6.2Kerala 3.6 3.2 3.6 3.9 4.1T amil Nadu 6.9 7.2 7.8 7.8 8.1Pondicherry 0.2 0.1 0.1 0.2 0.2T otal SOUT H 22.9 23.4 25.0 25.4 26.7
T otal EAST 18.3 17.1 15.2 14.2 14.9
T otal NORT HEAST 3.0 3.4 3.1 2.8 2.8
T OT AL : All States/U.T s 100.0 100.0 100.0 100.0 100.0
S ource: Worked out from CS O data.
T able 3: Share (% ) in Aggregate Gross Domest ic Product of Northern & Southern States/U.T s (At Current Prices)
In the North, the shares of all the states in aggregate domestic product have
declined in the last two decades except for Haryana, Himachal Pradesh and Rajasthan
where there has been some increase. Uttar Pradesh has lost its share substantially from
about 13 per cent in 1980-81 to 10 ½ per cent in 2000-01. Still, it continued to be the
second biggest state economy in the country after Maharashtra whose share have gone up
from about 14 per cent to 15 per cent over the last two decades. Delhi improved its share
from just above 2 per cent in 1980-81 to above 3 per cent in 2000-01. Punjab, the second
biggest economy in the North in the 1980s, has yielded that place now to Rajasthan whose
share in aggregate GDP increased from just under 4 per cent in 1980-81 to 5 per cent in the
mid-1990s before falling to 4.5 per cent in 2000-01.
In the South, the shares of all the states/UT in aggregate domestic product have
increased in the last two decades. The increasing shares of the southern states/UT have

9
been steady in the 1980s and 1990s except for Kerala and Pondicherry which registering
diminished shares in the 1980s, recovered more than those declines in the 1990s.
The growth in per capita income, a function of growth in both state domestic
product (SDP) and population, declined significantly in the 1990s in real terms in all the
northern states except Himachal Pradesh and Jammu & Kashmir (Table 4). Region-wise,
the Northeast is the only other region where deceleration in real per capita income occurred
during the 1990s. While in the 1980s the per capita income growth in the northern region
was only marginally lower than that of the all-India average, in the 1990s the per capita
income growth in the northern region has slipped much below that of the national average.
Southern states recorded the highest growth in per capita real income growth in the 1990s
as in the 1980s. Among the southern states, Andhra Pradesh alone suffered a decline in the
average growth in per capita real income in the 1990s in comparison with the 1980s.
1 9 8 1 - 9 0 1 9 9 0 - 0 1H a r y a n a 3 .6 3 .0H i m a c h a l P r a d e s h 3 .1 3 .3J a m m u & K a s h m i r -0 .3 2 .0P u n j a b 3 .8 2 .5R a j a s t h a n 3 .8 2 .7U t t a r P r a d e s h 2 .5 1 .4C h a n d i g a r h n .a 5 .8D e l h i 3 .4 4 .1A l l N O R T H 3 .1 2 .3
A l l W E S T 3 .1 3 .4
An dh r a P r ades h 4 .3 3 .7K ar n at ak a 3 .4 5 .4K er ala 1 .4 4 .7T am i l N adu 3 .8 5 .1P o n dich er r y 1 .2 5 .1A l l S O U T H 3 .5 4 .7
A l l E A S T 2 .2 2 .4
A l l N O R T H E A S T 2 .0 1 .7
A L L - I N D I A ( P e r C a p i t a N N P ) 3 .2 3 .5N o te : R e g io n a l a v e r a g e s a r e c o m p u te d u s in g G S D P s h a r e s o f r e s p e c t iv e s t a t e s /U .T s i n t h e b a s e y e a r s a s w e ig h t s . F o r C h a n d ig a r h , t h e g r o w th r a t e i n t h e 1 9 9 0 s p e r ta in s t o t h e p e r io d , 1 9 9 4 - 0 1 .
S o u r ce : W o r k e d o u t fr o m C S O data.
T a b l e 4 : G r o w t h i n P e r C a p i t a N e t S t a t e D o m e s t i c P r o d u c t a tC o n s t a n t P r i c e s : A l l N o r t h e r n & S o u t h e r n S t a t e s ( % P e r A n n u m )

10
IV Agriculture
Uttar Pradesh is a major producer of diverse agricultural crops in the country. It is
the largest producer of wheat, pulses, sugarcane, tobacco, potato and milk; the second
largest producer of rice, fruits & vegetables; and the third largest producer of coarse grains.
For wheat, sugarcane, potato and tobacco, the share of Uttar Pradesh varies from 30 to 40
per cent of the country’ s production. Punjab has concentrated its agricultural production on
a select few crops like wheat for which it is the second largest in the country; and rice,
cotton and potato for all of which it is the fourth largest producer. Punjab is also the second
largest producer of milk in the country after Uttar Pradesh. Haryana comes next in the
North for agricultural production and is the third biggest producer of wheat, cotton and
rapeseed & mustard in the country. Rajasthan is the third largest producer of milk in the
county and also the largest producer of some relatively minor products like bajra and
rapeseed & mustard.
India is a major producer of a number of agricultural crops. It is first in the
production of tea, pulses, and milk; second in the production of rice, wheat, groundnut,
sugarcane, onion, and fruits & vegetables; and third in the production of potato and
tobacco. Although India is a major producer of a number of agricultural crops, the
productivity levels of agricultural crops in India is much lower than the international
average levels except for wheat, sugarcane and tobacco where Indian yields are
comparable with the world levels. While Uttar Pradesh is a major producer of a large
number of agricultural crops, the productivity levels are the highest for Punjab: Punjab
ranks highest in yield per unit of land in the country for rice, wheat, coarse cereals, and
cotton. For oilseeds and potato, Punjab while being a very small producer, ranks third and
fourth in yield respectively. Haryana ranks second in the county for yield in wheat,
oilseeds and cotton. Uttar Pradesh has the highest yield in the country for pulses and
tobacco and third highest yield in potato and onion. Rajasthan comes very low in yield in
all the agricultural crops.
11
There is a distinct contrast between the agricultural sector of Kerala and that of
other southern states; for Kerala, commercial crops dominate its agriculture whereas for
the other three states it is more balanced between food crops and cash crops. Kerala
produces over 90 per cent of India’ s natural rubber, over 95 per cent of pepper, over 70 per
cent of cardamom, over 40 per cent of coconut, about 20 per cent of coffee beans and
cashew nut, and slightly less than 10 per cent of India’ s tea output. Steep fall in prices of
most of the commercial crops since the mid-nineties till very recently affected Kerala’ s
agriculture severely.
Andhra Pradesh is the biggest producer of groundnut in the country (33 per cent of
India’ s output in 2000-01) and eggs (20 per cent), second biggest producer of cotton (17
per cent) and cashew nut (19%), and third biggest producer of rice, sunflower, onion,
tobacco and fruits & vegetables. The state’ s fertile regions are north and south coastal
zones and Nellore, but they are afflicted by drainage, salinity, cyclones and floods. Andhra
Pradesh has large livestock population and rich aqua resources. Karnataka is the largest
producer of maize and sunflower; second largest producer of jowar and onion; and third
largest producer of groundnut, coconut, and sugarcane. The state has a large arid zone,
second only to Rajasthan in the country. Nearly one-sixth of the cultivable area is under
horticulture crops. Karnataka has ten different agro-climatic zones offering huge potential
for horticulture. Kerala is the biggest producer of raw rubber, spices and coconut, second
biggest producer of cashew nut, and third biggest producer of fish after West Bengal and
Gujarat. Tamil Nadu is the second largest producer of groundnut, coconut and eggs.
Tamil Nadu scores over other southern states in agricultural productivity. It has the
highest yield in the country for jowar, bajra, groundnut and sugarcane in 2000-01 and
second highest yield after Punjab in rice. Karnataka is the most efficient producer of maize
in the country and the second most efficient producer of sugarcane. Andhra Pradesh is the
most efficient producer of none of the major agricultural produce but the second most
efficient producer of groundnut (after Tamil Nadu), onion (after Gujarat), tobacco (after
Uttar Pradesh), and cashew nut (after Maharashtra). Kerala, the biggest producer of

12
coconut in the country has lost out heavily to Tamil Nadu and Andhra Pradesh in
productivity.
The yield structure of agricultural crops has been related to the irrigation
coverage in the respective states. Northern states are blessed with high irrigation intensity
topped by Punjab at 92 per cent in 1998-99 followed by Haryana at 80 per cent and Uttar
Pradesh at 66 per cent (Table 5). Rajasthan and Himachal Pradesh are less irrigated at
32 per cent and 20 per cent respectively in 1998-99, much below the low national average
of 39 per cent.
IrrigatedA rea (% )
C anals &Tanks (% )
H aryana 79.8 50.6H imachal Pradesh 18.8 2.9Jam mu & K ashmir 41.4 92.9Punjab 92.2 32.4Rajasthan 31.8 30.0U ttaranchal 43.8 n.aU ttar Pradesh 66.4 25.2D elhi 80.0 7.7Total N orth 58.1 30.9Total W est 23.7 36.3A ndhra Pradesh 44.7 53.9K arnataka 25.3 48.4K erala 14.4 38.7Tamil N adu 54.9 50.5Total South 37.4 51.0Total East 34.5 29.0Total N ortheast 15.2 4.2A ll-India 39.2 36.3
Source: M inistry of Agriculture, G ovt. of India and CM IE.
T able 5: Irrigation C overage & Irrigation through C analsand T anks, 1998-99
Southern states, on the whole, are less irrigated than the all-India average.
However, Tamil Nadu has the largest coverage under irrigation in southern region at about
55 per cent followed by Andhra Pradesh at about 45 per cent. Karnataka has a low
coverage of irrigated area at 25 per cent, which is much lower than the all-India average of
39 per cent. Kerala is the least irrigated state in the South with about only 14 per cent

13
coverage, which can be compared only to northeastern states. The share of irrigated area
moved up substantially in the case of Tamil Nadu in the 1990s whereas the pace of
irrigation was slower in other southern states.
There has been a progressive decline in the share of irrigation through government
sources, predominantly from canals and tanks, at all-India level from more than half in the
early 1970s to just above a third in the late 1990s. In the case of northern states, the
average share of public irrigation has come down even lower to about 30 per cent and
below by 1998-99 for all states except Haryana and Jammu & Kashmir (Table 5). This is
also reflected in the low proportion of government expenditure on irrigation, particularly
on capital expenditure, which has continued to decline through the 1990s in almost all the
northern states (Table 6).
1991-92*
1996-97
2001-02A. Total spending on
irrigat ionHaryana
10.5 6.2 6.7 HimachalPradesh
1.4 2.4 1.8 Jammu &Kashmir
3.2 2.9 3.1
Punjab6.3 4.9 5.3
Rajasthan8.4 8.9 6.1
UttarPradesh@
7.9 8.5 4.4
Delhi1.4 0.9 0.7
TotalNorth
7.0 6.7 4.5 All-Sta tes
8 .5 7 .4 5 .1
B. Capital spending onirrigat ionHaryana
3.7 2.7 1.9 HimachalPradesh
0.7 1.2 0.9 Jammu &Kashmir
1.5 0.9 1.3
Punjab3.7 2.0 3.1
Rajasthan4.4 4.6 2.1
UttarPradesh@
1.7 2.2 2.0
Delhi0.8 0.4 0.3
TotalNorth
2.6 2.4 1.9 All-Sta tes
4 .0 3 .4 2 .6*1992-93 for All-States & 1993-94 for Delhi @ Includes alsoUttaranchal.Source : CMIE andRBI.
Table 6 : Governm ent Expenditure on I rr iga t ion and FloodCont rol as aProport ion of Aggrega te Expenditure
( Per Cent )
Despite the high level of irrigation coverage in the northern states, productivity
levels, which are relatively high in certain states have either stagnated or slowed down due
to several reasons. There has been a secular shift to private irrigation from public sources,

14
deterioration of soil quality with excessive use of chemical fertilizers and pesticides,
repetition of same crops year after year and the fall in underground water table due to
indiscriminate use of pump-sets.
The sluggish growth in irrigation in the country is reflected in the fall in investment
in agriculture from about 1.6 per cent of GDP in 1993-94 to 1.3 per cent in 2001-02
(Economic Survey 2003, p.172). While the state government capital expenditure on
irrigation & flood control had risen by a satisfactory 14 to 15 per cent per annum during
1999-02 in Andhra Pradesh and Tamil Nadu, the growth in that expenditure in Karnataka
and Kerala had been just 4 per cent per annum during the same period. For the states as a
whole, the capital expenditure on irrigation & flood control had gone up by about 7 per
cent per annum during 1999-02.
In the 1990s, the share of public investment in agriculture declined sharply to 28
per cent from 45 per cent in the 1980s. This is mainly due to the enlarging government
subsidies on food, fertilisers, and power for farmers, which together accounted for 2.4 per
cent of GDP in 2001-02. While the private sector investment in agriculture has been rising
to partly compensate the falling public sector investment, the former has been in minor
irrigation like tube wells and pump sets as against the large and medium irrigation done by
the public sector in the form of canals and tanks. With no price for water and low or no
price for electricity, that had led to the overexploitation of ground water bringing water
tables down and waterlogging. Many studies have indicated that any subsidy meant for the
poor is captured mostly by the better-off sections of society (Mohan, 2000; and Howes and
Murgai, 2003). One politically feasible solution for reducing input subsidies to the farmer
has been made by Rao (2003a and 2003b). The suggestion is to empower Water Users’
Associations (WUAs) and panchayati raj institutions (PRIs) to charge and collect water
and electricity rates from the farmers and, if needed, to give subsidy at a flat rate on the
estimated use of electricity on holdings up to one or two hectares either to all farmers or to
the small and marginal farmers. This will reduce the massive waste that characterises the
present system of open-ended and opaque subsidies to farmers.

15
During the 1990s, the share of agriculture in the state economies has come down in
most states except West Bengal and Orissa (Soman, 2002). Along with this, the share of
employment in agriculture also declined in all the states. Among the northern states, the
decline in the share of agriculture has been the smallest in the case of Punjab (less than 5
percentage points) and largest in Rajasthan (17 percentage points) followed by Haryana
(12.5 percentage points) (Table 7). In contrast, the decline in the share of employment in
agriculture has been highest in Punjab (about 16 percentage points) and lowest for
Rajasthan (less than 3 percentage points) followed by Haryana (6 percentage points). This
reflects the sharply falling labour intensity of agriculture in the most agrarian state in the
country and this distinguishes Punjab from the rest of the northern states as well as all
other states in the country. This is also corroborated by the fastest urbanisation in Punjab
among the northern states, which went up from 29.5 per cent in 1991 to 34 per cent in
2001.
Among the southern states, the decline in employment in agriculture has been
sharper in Tamil Nadu and Kerala in relation to the fall in importance of agriculture in
these state economies than in Andhra Pradesh and Karnataka. This indicates the high
relative labour productivity of agriculture in Tamil Nadu and Kerala in comparison with
the Andhra Pradesh and Karnataka agriculture. For Tamil Nadu the high labour
productivity could be due to the high irrigation coverage and for Kerala, it could be due to
the predominance of commercial crops, which are more remunerative. With regard to the
U r b a n isa t io n R a tio1 9 9 0 -9 1 2 0 0 0 -0 1 1 9 9 1 2 0 0 1 1 9 9 1 2 0 0 1
H a ry a n a 4 3 .8 3 1 .3 5 7 .8 5 1 .6 2 4 .6 2 9 .0H im a c h a l P ra d e sh 3 3 .9 2 6 .7 n .a n .a 8 .7 9 .8P u n ja b 4 4 .0 3 9 .1 5 5 .3 3 9 .4 2 9 .5 3 3 .9R a ja s th a n 4 4 .5 2 7 .3 6 8 .8 6 6 .0 2 2 .9 2 3 .4U tta r P ra d e sh 4 0 .7 3 2 .3 7 2 .2 6 5 .6 1 9 .8 2 0 .8
A n d h ra P ra d e sh 3 5 .6 2 9 .6 6 8 .6 6 2 .3 2 6 .9 2 7 .1K a rn a ta k a 3 4 .2 2 7 .5 6 3 .1 5 5 .9 3 0 .9 3 4 .0K e ra la 3 0 .1 2 3 .6 3 7 .8 2 3 .3 2 6 .4 2 6 .0T a m il N a d u 1 8 .8 1 5 .7 5 9 .5 4 9 .5 3 4 .2 4 3 .9A ll-In d ia 3 1 .3 2 4 .9 6 4 .8 5 8 .4 2 5 .7 2 7 .8
S o u rc e : C S O a n d S o m a n (2 0 0 2 )
G S D P E m p lo y m e n t
T a b le 7 : S h a r e o f A g r ic u ltu r e in G S D P a n d E m p lo y m e n t & R a te o f U r b a n isa tio n in N o r th e r n & S o u th e r n S ta te s (% )

16
overall share of employment in agriculture, in Tamil Nadu, Karnataka and Andhra Pradesh
about 50 to over 60 per cent of employment still originates from agriculture. This is similar
for the country as a whole where nearly 60 per cent of employment is still in agriculture. In
sharp contrast, in Kerala the share of employment in agriculture is below a fourth.
V Industry
We saw earlier that industrial growth slowed down in most of the northern states in
the 1990s except Himachal Pradesh and Rajasthan where there had been a substantial
hastening of industrial growth in the last decade resulting in a sharp rise in the share of
industry in these two states. However, at least in the case of Rajasthan, employment
generation has continued to be predominantly in agriculture (Table 7).
The Annual Survey of Industries (ASI) being conducted by the Central Statistical
Organisation (CSO) is the most comprehensive source for nationwide and state-wise
manufacturing data covering all power-driven factories employing 10 or more workers and
manufacturing units employing 20 or more workers without using power. Table 8
summarises the regional shares of manufacturing value added of industries under major
groupings with detailed break-ups for the northern states. It indicates that the North has a
share of only about 19 per cent while the West dominates the manufacturing sector with a
share of about 45 per cent of the value added, followed by a distance by the South at 26 per
cent.
Among the northern states, Uttar Pradesh has the highest share in manufacturing
value added of nearly 7 per cent, which is the fifth highest in the country. This, however,
as we have seen earlier, is much lower than Uttar Pradesh’ s share in aggregate gross
domestic product at about 10 ½ per cent. Next is Haryana with over 4 per cent share in
manufacturing value added, followed by Punjab at 3 per cent and Rajasthan closely behind
at 2 ½ per cent.

17
Haryana HP J&K Punjab Rajasthan UP Delhi Total*Food products & beverages 3.4 0.5 0.4 6.3 2.7 9.3 3.3 26.5 41.6 24.4 7.5 100.0Tobacco products 0.1 1.6 0.0 0.0 0.7 18.6 0.7 21.6 21.3 45.4 11.7 100.0Textiles 2.7 1.7 0.2 8.5 4.8 4.2 0.4 22.5 40.5 28.3 8.6 100.0Wearing apparel 12.7 0.0 0.0 0.1 1.4 5.4 16.3 35.9 11.3 52.1 0.7 100.0Leather and products 8.0 0.3 0.0 4.4 0.7 9.5 1.9 24.8 5.6 54.6 15.0 100.0Wood and products 39.1 0.0 0.4 0.6 6.0 14.0 0.3 61.2 10.0 11.1 17.7 100.0Paper and products 2.8 0.1 0.1 2.4 0.9 9.4 1.3 21.5 36.7 35.6 6.2 100.0Publishing printing & media 0.3 0.1 0.0 0.4 3.0 10.0 3.9 20.6 39.0 30.0 10.4 100.0Coke & refinery products 0.0 0.0 0.0 0.0 4.0 0.0 0.0 4.0 38.5 21.5 36.0 100.0Chemicals and products 0.2 0.3 0.0 1.0 1.8 5.1 1.7 10.2 61.3 28.0 0.5 100.0Rubber and plastic products 5.4 0.4 0.0 1.5 1.3 9.4 0.7 18.8 54.2 24.0 2.7 100.0Other mineral products 3.1 3.9 0.2 0.4 11.7 5.4 0.1 25.2 32.8 30.1 12.0 100.0Basic metals 1.4 0.2 0.9 1.7 1.4 7.7 0.6 14.0 34.0 14.0 38.0 100.0Metal products 4.5 0.4 0.2 3.6 0.7 3.4 2.0 15.0 49.3 28.8 6.9 100.0Machinery and equipment 7.6 0.5 0.1 4.5 3.3 5.5 0.7 22.8 48.9 24.2 4.2 100.0Office machinery 14.0 2.1 0.0 0.0 0.6 25.2 0.0 40.6 22.6 36.6 0.2 100.0Electrical machinery 31.7 0.1 0.0 0.6 0.7 4.9 1.2 41.0 33.4 21.4 4.2 100.0Radio, TV & communication equipment 2.3 1.6 1.3 3.8 0.0 11.9 2.6 23.2 49.5 23.2 4.0 100.0Instruments, watches and clocks 8.2 1.6 0.0 0.4 2.3 4.3 4.3 21.7 37.4 38.2 2.7 100.0Motor vehicles 0.4 0.4 0.0 3.2 0.7 7.8 1.7 14.3 47.2 33.1 5.4 100.0Other transport equipment 16.6 0.0 0.0 9.8 3.8 9.0 0.3 39.6 39.4 17.8 3.2 100.0Furniture manufacture 0.5 0.1 0.0 3.3 2.8 8.3 0.8 15.8 77.9 4.7 1.6 100.0Others 0.3 0.2 0.0 0.8 0.3 3.9 2.1 7.9 65.2 19.7 7.2 100.0Total 4.1 0.6 0.2 3.0 2.6 6.6 1.8 19.2 45.1 26.3 9.5 100.0 *IncludingUttaranchal and Chandigarh. Source: Worked out from Annual Survey of Industries (ASI) data, CSO.
Table 8: Share in Gross Value Added in Manufacturing of Northern States, 1999-00 (%)
East & Northeast TotalSouthWest
North

18
Uttar Pradesh, which produces a wide variety of manufacturing products, is the
biggest manufacturer of office machinery in the country (25 per cent); second biggest in
wood & products (14 per cent) and furniture (8 per cent); and third biggest producer in
tobacco products (19 per cent), leather & products (9 ½ per cent) and food products &
beverages (9 per cent). Haryana is number one in the country for the manufacture of wood
& products (39 per cent) and electrical machinery (32 per cent); number two for the
manufacture of transport equipment other than motor vehicles (16 ½ per cent); and number
three for office machinery (14 per cent). Punjab’ s major industries are transport
equipment other than motor vehicles for which the state is the third biggest producer (10
per cent of country’ s manufacturing value added), textiles (8 ½ per cent), and food
products & beverages (6 per cent). While weak in manufacturing, Rajasthan is the largest
producer in the country of mineral products including cement contributing to 12 per cent of
the manufacturing value added. Delhi is not a major manufacturing centre but it accounts
for over 16 per cent of India’ s manufacture of wearing apparel, being the third largest for
that in the country.
Tamil Nadu, Andhra Pradesh and Karnataka have a balanced mix of large, medium
and small industries, producing a large spectrum of industrial products. Kerala, on the
other hand, has predominantly medium and small industries (except the large number of
state and central public enterprises) concentrating on a narrow range of products (food
products, textile products, wood products, chemicals and rubber products) that are
relatively less capital intensive. Data from the Annual Survey of Industries (ASI) indicate
that the industry in Kerala has a low capital-output ratio and labour-capital ratio in
comparison with the industry in other southern states and for all-India (Table 9). Labour
productivity as measured by the value of output per unit wage in all southern states is
surprisingly lower than the all-India average and much below most of the northern states
and Gujarat. Here Karnataka is at the bottom among the southern states, followed by
Andhra Pradesh.

19
ASI data for 1999-00 also show that capital efficiency of industry, which is the
reciprocal of capital-output ratio, is higher in Haryana, J & K, Punjab, Chandigarh and
Delhi than the national average (Table 9). Labour efficiency as measured by the value
of output per worker is higher in Haryana, Himachal Pradesh, Punjab, Rajasthan, Uttar
Pradesh and Delhi than the national average. Capital intensity vis-à-vis labour is lower in
Punjab, Chandigarh and Delhi than the national average. More interestingly, the value of
output in industry per unit wage in almost all the northern states and U.Ts, (except Jammu
& Kashmir, Uttaranchal and Chandigarh) has been higher than the national average. In
short, by most of the indicators on manufacturing efficiency, the northern states score over
the average for the rest of India.
Table 10 summarises the regional share of manufacturing value added of industries
under major groupings with detailed break-ups for the four southern states as given in ASI
data. Among the southern states, Tamil Nadu has the highest share of 9.1 per cent,
followed closely by Karnataka at 8.6 per cent, and Andhra Pradesh at 5.7 per cent and
Kerala coming last at just 2.4 per cent of the manufacture value added. Tamil Nadu is
number one in the country for textiles, wearing apparel, and leather goods contributing 18
C a p i t a l -o u t p u t r a t i o
C a p i t a l p e r w o r k e r ( R s .
l a k h )
V a l u e o f o u t p u t p e r w o r k e r ( R s . l a k h )
V a l u e o f o u t p u t p e r u n i t w a g e ( R s . )
H a r y a n a 0 . 4 8 7 . 1 9 1 4 . 8 9 2 1 . 8 6 H i m a c h a l P r a d e s h 0 . 7 8 1 0 . 3 4 1 3 . 2 0 2 6 . 7 4 J a m m u & K a s h m i r 0 . 3 6 2 . 2 2 6 . 2 6 1 4 . 4 4 P u n j a b 0 . 4 7 5 . 2 7 1 1 . 2 7 2 4 . 5 0 R a j a s t h a n 0 . 8 2 1 0 . 5 2 1 2 . 7 7 2 3 . 1 3 U t t a r a n c h a l 0 . 7 0 6 . 3 7 9 . 1 5 1 6 . 7 2 U t t a r P r a d e s h 0 . 8 3 8 . 9 0 1 0 . 6 8 1 9 . 1 8 C h a n d i g a r h 0 . 3 4 3 . 6 3 1 0 . 6 5 1 4 . 5 5 D e l h i 0 . 2 9 3 . 7 3 1 3 . 0 3 2 3 . 0 8 G u j a r a t 0 . 7 2 1 0 . 4 3 1 4 . 4 1 2 3 . 9 6 M a h a r a s h t r a 0 . 5 8 8 . 6 0 1 4 . 9 0 1 7 . 6 7 A n d h r a P r a d e s h 0 . 6 6 4 . 2 5 6 . 4 3 1 7 . 3 6 K a r n a t a k a 0 . 8 5 7 . 3 8 8 . 6 4 1 4 . 5 2 K e r a l a 0 . 4 0 3 . 2 7 8 . 2 0 1 8 . 4 9 T a m i l N a d u 0 . 5 7 4 . 9 1 8 . 5 7 1 8 . 3 4A L L - I N D I A 0 . 6 3 6 . 9 3 1 0 . 9 9 1 8 . 7 7
S o u r c e : W o r k e d o u t f r o m A n n u a l S u r v e y o f I n d u s t r i e s , C S O a s r e p o r t e d i n E c o n o m i c T i m e s , O c t o b e r 1 4 , 2 0 0 2 a n d S e p t e m b e r 1 , 2 0 0 3 .
T a b l e 9 : C a p i t a l a n d L a b o u r R a t i o s o f I n d u s t r y i n V a r i o u s S t a t e s a n d U T s , 1 9 9 9 - 0 0

20
per cent, 34 per cent and 49 per cent respectively of the gross value added in these sectors
in the county; number two in paper & products (12.5 per cent), metal products (14 per
cent), instruments, watches & clocks (19.5 per cent) and motor vehicles (22 per cent).
Andhra Pradesh is the biggest in value added for tobacco products (24 per cent), and
second biggest in food products & beverages (10 per cent) and mineral products (11 per
cent). Karnataka is the second largest producer in tobacco products (20 per cent of gross
valued added), wearing apparel (17 per cent), and radio, TV & communication equipment
(15 per cent); and third largest in chemicals and products (16 per cent), coke & refinery
products (8 per cent), electrical machinery (9 per cent), instruments, watches & clocks (12
per cent), and motor vehicles (7 per cent). As mentioned earlier, Kerala’ s industrial base
is not strong. However, the state has a few agro-based industries such as food products &
beverages (6 per cent), wood & products (8 per cent), and rubber & plastic products (6 per
cent). In fact, the share of Kerala in value added of the factory sector in the country
declined from 3.3 per cent in 1980-81 to 2.3 per cent in 1999-00, and in capital invested in
the factory sector also from 2.9 per cent to 1.8 per cent in the same period (Jeromi, 2003).
Despite the indicators of a relatively higher manufacturing efficiency, the northern
region lags behind the West and the South in attracting corporate investment. Its share in
domestic industrial investment proposals during the post-liberalisation period up to June
2003 had been about 20 per cent against the shares of 47 per cent and 24 per cent
respectively for the West and South (Table 11). With regard to the foreign direct
investment (FDI) approvals, the share of the North had been still lower at 17 per cent
against the West’ s share of 28 per cent and South’ s share of 22 per cent in the same period.
However, Uttar Pradesh ranked four with about 7 per cent share of post-liberalisation
industrial investment proposals after Maharashtra (21 per cent), Gujarat (16 per cent), and
Andhra Pradesh (11 per cent). Punjab’ s share in domestic industrial investment proposals
has been 4 ½ per cent, followed by Rajasthan at 3 ½ per cent and Haryana at nearly 3 per
cent. Delhi although not attracting much domestic investment proposals, has obtained
about 12 per cent of FDI approvals in the country during the post-liberalisation period,
second only to Maharashtra (17 per cent). However, all the northern states obtained very

21
limited foreign direct investment approvals with Uttar Pradesh accounting for the largest at
just less than 2 per cent share in the country.
Industry has been sluggish in Kerala for long since mid-1970s due to militant trade
unionism, high-cost labour, bureaucratic over-regulation and poor economic infrastructure
Andhra Pradesh
Karna- taka Kerala
Tamil Nadu Total*
Food products & beverages 26.5 41.6 9.9 3.7 6.3 4.1 24.4 7.5 100.0Tobacco products 21.6 21.3 23.7 20.0 0.3 1.4 45.4 11.7 100.0Textiles 22.5 40.5 5.9 2.3 1.6 18.2 28.3 8.6 100.0Wearing apparel 35.9 11.3 0.1 17.3 0.3 34.4 52.1 0.7 100.0Leather and products 24.8 5.6 0.2 3.9 0.5 48.7 54.6 15.0 100.0Wood and products 61.2 10.0 0.0 2.1 7.6 1.9 11.1 17.7 100.0Paper and products 21.5 36.7 7.7 9.9 4.6 12.5 35.6 6.2 100.0Publishing printing & media 20.6 39.0 13.3 3.0 4.4 9.1 30.0 10.4 100.0Coke & refinery products 4.0 38.5 2.8 8.3 4.1 6.3 21.5 36.0 100.0Chemicals and products 10.2 61.3 3.9 16.0 1.8 5.5 28.0 0.5 100.0Rubber and plastic products 18.8 54.2 4.4 3.6 5.8 9.6 24.0 2.7 100.0Other mineral products 25.2 32.8 11.0 6.6 2.0 9.8 30.1 12.0 100.0Basic metals 14.0 34.0 6.2 3.2 1.1 3.3 14.0 38.0 100.0Metal products 15.0 49.3 3.7 9.3 0.8 14.2 28.8 6.9 100.0Machinery and equipment 22.8 48.9 5.0 6.2 0.6 12.2 24.2 4.2 100.0Office machinery 40.6 22.6 2.2 11.0 3.4 2.1 36.6 0.2 100.0Electrical machinery 41.0 33.4 8.0 9.0 0.3 3.9 21.4 4.2 100.0Radio, TV & communication equipment 23.2 49.5 2.8 14.6 3.2 2.6 23.2 4.0 100.0Instruments, watches and clocks 21.7 37.4 1.5 12.5 3.8 19.5 38.2 2.7 100.0Motor vehicles 14.3 47.2 3.5 7.1 0 22.3 33.1 5.4 100.0Other transport equipment 39.6 39.4 2.6 3.3 2.7 8.7 17.8 3.2 100.0Furniture manufacture 15.8 77.9 0.0 1.1 0.6 3.1 4.7 1.6 100.0Others 7.9 65.2 2.5 4.8 2.1 10.3 19.7 7.2 100.0Total 19.2 45.1 5.7 8.6 2.4 9.1 26.3 9.5 100.0 *Including Pondicherry. Source: Worked out from Annual Survey of Industries (ASI) data, CSO.
TotalEast & NortheastNorth West
South
Table 10: Share in Gross Value Added in Manufacturing of Southern States, 1999-00 (%)

22
including the shortage of power4. All these factors can be summed up as poor investment
climate. Andhra Pradesh along with Tamil Nadu and Karnataka are now termed as “good
climate” states for investment by the World Bank-CII study (2002) based on a survey of
business managers in India in selected 10 states. These states are just behind Maharashtra
and Gujarat, which are termed as “best climate” states. Kerala along with West Bengal and
Uttar Pradesh are called as “poor climate” states by the study. Delhi and Punjab are
credited with an investment climate termed as “medium”. This is also reflected in the share
of industrial investment proposals and foreign direct investment approvals received by
these states during the post-liberalisation period (Table 11).
4 The ET-CMIE State Infrastructure Survey released in May 2003 has placed Kerala third in 2000 after
Delhi and Goa, an improvement from fourth (Punjab in third position) in 1991 and 1995. The survey hastaken the indicators of power infrastructure as the proportion of electrified villages and the proportion ofdomestic electricity consumers, which do not capture the shortage and frequent load shedding thatcharacterises the Kerala power scene. The Survey has given Tamil Nadu the fifth rank, Karnataka theeighth rank (improvement from 12 in 1995) and Andhra Pradesh the tenth rank. (The Economic Times,Mumbai, 30 May2003)
R s. B illion % to T otal R ank R s. B illion % to T otal R ankN O R T H 2339 .94 19 .9 492 .43 17 .2 H aryana 341 .8 2 .9 13 36 .59 1 .3 11 H im achal P radesh 99 .9 0 .8 17 11 .74 0 .4 16 Jam m u & K ashm ir 17 .16 0 .1 0 .08 0 .0 P un jab 544 .63 4 .6 7 19 .68 0 .7 13 R ajasthan 412 .47 3 .5 10 30 .06 1 .0 12 U ttaranchal 66 .2 0 .6 20 1 .26 0 .0 20 U ttar Pradesh 787 .99 6 .7 4 48 .58 1 .7 10 C handigarh 4 .58 0 .0 1 .9 0 .1 17 D elhi 65 .21 0 .6 21 342 .54 12 .0 2W E S T 5579.43 47 .4 795 .91 27 .8SO U T H * 2761 .59 23 .5 637 .84 22 .3 A ndhra P radesh 1278 .91 10 .86 3 133 .03 4 .64 6 K arnataka 586 .12 4 .98 6 237 .78 8 .30 4 K erala 107 .07 0 .91 16 15 .31 0 .53 14 T am il N adu 708 .24 6 .01 5 239 .27 8 .35 3E A S T 970 .82 8 .2 181 .54 6 .3N O R T H E A ST 104 .36 1 .0 0 .75 0 .0O thers (unspecified) 3 .95 0 .0 757 .83 26 .4A ll-Ind ia 11774 .72 100 .0 2866 .28 100 .0* Includ ing P ond icherry and Lakshadeep .Source: S IA S ta tistics & N ew sletter, M in is try o f Industry , G ovt. of Ind ia, Ju ly 2003 .
F oreign D irect Investm ent A pprovals
T ab le 11: Sh are o f In d ustrial In vestm en t Proposa ls an d Foreign D irect Investm en t A pp rovals du rin g A u gu st 1991 to Ju ne 2003
Industria l Investm ent P roposa ls

23
VI State Level Public Enterprises (SLPEs)
In tune with the thinking of the times and the practice at the central government
level, state governments directly invested in a wide range of industries to help the
industrialisation of the states. But over a period of time, these enterprises accumulated
huge losses and have become a drag on the economy and finances of these states. Data on
SLPEs are released with a long lag and financial results of these enterprises in most states
are not available beyond 1999-00 or 2000-01. Even for those years, only 25-30 per cent of
the companies might have finalised their accounts. The government of India’ s ministry of
disinvestment publishes in its website the broad numbers regarding SLPEs for each state
including their position on disinvestments. The important indicators of state public
enterprises in northern and southern states and their respective position regarding
divestment as available so far are given in Table 12.
Among the northern states, Uttar Pradesh, Punjab and Rajasthan are large investors
in state level public enterprises (SLPEs). Still, the total investments in SLPEs by these
states are lower than those by the states like Andhra Pradesh, Gujarat, Maharashtra,
Karnataka and West Bengal. Uttar Pradesh’ s total investment up to 1999-00 has been
No. of Total Accumu- Loss-making Non-working Identified Companies Companies Companies
Enterprises Investment lated loss* Companies Companies for disin- where privatised closed
(Rs. Bn.) (Rs. Bn.) vestment/ process down
wind up/re- initiated
structuring
Haryana 45 4.43 3.84 10 4 8 6 1 4Himachal Pradesh 21 47.31 6.05 13 2 15 8 3 2Jammu & Kashmir 20 19.48 5.87 16 1 7 2 0 0Punjab 53 133.84 14.35 25 28 11 11 1 6Rajasthan 28 115.76 3.15 11 8 10 6 1 1Uttar Pradesh 41 177.73 53.27 21 19 25 25 1 14Delhi 15 109.64 69.95 3 0 0 1 1 0Andhra Pradesh 128 487.94 29.19 62 9 87 79 13 38Karnataka 85 278.13 18.88 30 7 39 20 2 12Kerala 111 164.29 35.10 52 13 55 40 0 10Tamil Nadu 59 61.92 22.92 33 12 29 29 0 7All-India 1036 2522.42 505.51 507 209 399 300 36 111*Relates to only those enterprises which have finalised their accounts which could be only 25-30% of the total companies.Source: Ministry of Disinvestment, Govt. of India.
Table 12: State Level Public Enterprises: Status of Disinvestment in Northern States

24
about Rs. 178 billion in 41 SLPEs, followed by Punjab at Rs. 139 billion in 53 units and
Rajasthan at Rs. 116 billion in 28 enterprises. Himachal Pradesh has invested about Rs. 47
billion in 21 public sector units. Haryana’ s public enterprises are relatively small units with
a total investment of a modest Rs. 4 billion in 45 enterprises. In Uttar Pradesh, out of 41
public enterprises, 21 are chronically loss making and 19 are nonworking. They have a
huge net accumulated loss of Rs. 53 billion by 1999-00. The union territory of Delhi with
15 public enterprises of total investment of Rs. 110 billion have a net accumulated loss of
Rs. 70 billion nearly equal to the largest cumulative loss of 71 billion for SLPEs in West
Bengal. In Punjab, out of 53 SLPEs 25 are loss making and the remaining 28 are not
working. They have a net accumulated loss of over Rs. 134 billion. Rajasthan has
relatively less number of loss making SLPEs (11 out of 28) and non-working (8)
companies and a low net accumulated loss of about Rs. 3 billion. Himachal Pradesh and
Haryana have 13 and 10 loss-making companies respectively and had a net accumulated
loss of about Rs. 6 billion and Rs. 4 billion respectively. J & K has 20 SLPEs with a total
investment of about Rs. 19 billion but also a small accumulated loss of less than Rs. 6
billion.
Coming to the southern states, Andhra Pradesh has the largest number of SLPEs in
the country (128 enterprises) with the largest investment of about Rs. 488 billion and
Tamil Nadu the lowest number among the southern states (59 enterprises) with the lowest
investment of about Rs. 62 billion. Kerala has the second largest number of SLPEs in the
country (111 SLPEs) having a total investment of about Rs. 164 billion. Kerala has the
largest accumulated loss among the southern states amounting to about Rs. 35 billion
followed by Andhra Pradesh at about Rs. 29 billion. In all the southern states except
Karnataka about half the number of the SLPEs is perpetually loss making.
All the four southern state governments had realised the need to reform their public
enterprises and have taken steps towards restructuring them. They all set up their own
Public Sector Reforms/Restructuring Committee/Commission for the purpose. Andhra
Pradesh is the most advanced in this regard in the country with the process of
disinvestment initiated in 79 companies and 13 companies have already been privatised.

25
The state government has also put in place a social safety net programme with the
assistance from World Bank to minimize the impact of redundancy on workers. Karnataka
is the next best in the South with the disinvestment process underway in the case of 20
companies and 2 companies already privatised. Kerala and Tamil Nadu started late but
have initiated the process for 40 and 25 companies respectively. They are however yet to
privatise any unit although closed down 10 and 7 companies respectively.
All the northern sates have initiated steps to bring about reform in SLPEs through
privatisation, restructuring or closing down in a phased manner. Haryana has already
closed down 4 companies, privatised one company and have identified 8 companies for
divestment/wind up/restructuring. Himachal Pradesh has sold three companies to the
private sector, and has identified 15 companies for privatisation/wind up/ restructuring.
Punjab has closed down 6 companies and the process of disinvestment has been initiated in
the case of 11 companies of which one is privatised recently. Rajasthan has privatised one
company and closed down another and have decided to close down/privatise another 10
companies. Uttar Pradesh has closed down 14 companies and privatised one and is in the
process of disinvestment/closure of 25 public enterprises. Jammu & Kashmir has already
decided to close down 7 non-viable units and has initiated steps to close down two. Delhi
has already privatised power distribution and proposes to unbundle and privatise Delhi
Transport Corporation (DTC). DTC had incurred a loss of Rs. 8.5 billion in 2001 and had
borrowed about Rs. 7.2 billion from the government of Delhi which remain unpaid for the
last 5 years.
VII Power Sector
Power is most critical to the growth of the economy but this sector is bristling with
problems in all the states. The basic issue is that power is predominantly produced by
government entities and distributed by them at much below costs to agriculture and
household sectors partly compensated by prohibitive prices charged on industry and
commercial sectors. The overall returns on these public utilities are chronically negative –
commercial loss without subsidy reached an alarming Rs. 332 billion, equivalent of 1.5 per
cent of GDP, in 2001-02 - on account of several factors including huge pilferage,

26
transmission & distribution loss and low level of metering and collection. The restoration
of financial viability of state power entities is the crux of the problem and this is crucially
dependent on the progress of distribution reforms. Future private investments in the power
sector also hinges on the solution of the distribution issues.
The capacity growth during the Ninth Plan (1997-02) has been nominal in all
northern states except Punjab and Rajasthan and virtually no private sector capacity
addition took place in any of these states. The plant load factor (PLF) of thermal plants in
2001-02 of most of the northern states also had been much lower than the all-India level
except for Punjab and Rajasthan. The officially reported T & D loss has been quite high at
47 per cent in J & K in 2001-02, 45 per cent in Delhi, 39 per cent in Uttar Pradesh and 33
per cent in Haryana, all much higher than the national average of about 28 per cent.
Himachal Pradesh and Punjab have reported lower T & D loss of about 17 per cent and
Rajasthan at 28 per cent, equal to all-India average. Punjab, Haryana and Delhi have per
capita consumption of power much higher than the national average. Other northern states
have lower per capita power consumption than the all-India average and Uttar Pradesh in
particular has abysmally low per capita consumption of 176 Kwh in 2001-02, just half of
the all-India average of 355 Kwh.
The average power tariff realised in almost all the northern states except Uttar
Pradesh and Delhi has been lower than the all-India average particularly because of the
high proportion of agricultural power consumption which is priced substantially low in
most of these states or given free (till very recently in Punjab). In Haryana, agricultural
consumption of power constituted 47 per cent of total power consumption in 2001-02, in
Rajasthan 40 per cent, and in Punjab over 35 per cent, all much above the all-India
consumption by agriculture of 29 per cent. In Himachal Pradesh, J & K, Uttar Pradesh,
and Delhi, agriculture constitutes a low proportion of power consumption ranging from
less than 1 per cent for Himachal Pradesh to 18 per cent for Uttar Pradesh but these
states/U.T. have a large domestic sector (households) which also pay low tariff and
consumes about 20 per cent (Himachal Pradesh) to 42 per cent (J & K) of power.

27
The cost of power supply is much higher than the national average in most northern
states other than Himachal Pradesh and Punjab where the cost is low due to the low rate
charged on power purchase by the state from central power utilities. A major reason for the
rising cost of power supply has been the falling share of hydro power which is cheaper to
produce. The share of hydel generation has come down from 51 per cent in 1992-93 for
Haryana to 4 per cent in 2001-02, for Punjab from 55 per cent to 20 per cent, Rajasthan
from 43 per cent to 5 per cent and Uttar Pradesh from 23 per cent to 9 per cent. Power
generation in only hydel in Himachal Pradesh and J & K and is 100 per cent themal in
Delhi.
The power entities of all the northern states incur huge commercial losses. The
highest loss (without state subsidy) was registered by Uttar Pradesh at Rs. 27 billion in
2001-02, followed by Rajasthan at Rs. 24 billion, Haryana at Rs. 19 billion, Punjab Rs.16
billion, J & K and Delhi each at Rs. 11 billion and the least by Himachal Pradesh at less
than Rs.1 billion. The return of power entities in these states are all negative topped by
Haryana at minus 79 per cent in 2001-02, followed closely behind by J & K and Rajasthan
at about minus 75 per cent, Delhi at minus 44 per cent, Uttar Pradesh and Punjab at about
minus 20 per cent and Himachal Pradesh at just minus 4 per cent.
Among the southern states, per capita consumption of electricity is very low in
Kerala at 262 kWh during 1999-00, which is even much below the all-India average of 355
kWh, reflecting the low level of industrialisation of the state. Tamil Nadu, on the other
hand, has the highest per capita power consumption in the South at 484 kWh, much above
the country average, thanks to the advanced stage of industrialisation in the state. The low
pricing of electricity to agriculture and domestic sectors and high pricing of industry, over
the years has led to the share of the former sectors rising while the share of the latter sector
falling particularly as the industrial sector has been moving to captive generation. An
exception is Kerala where agriculture sector remained a marginal consumer of power
(below 5 per cent) stemming from the sharp diminishing share of agriculture in the state
economy and the low irrigation coverage. Domestic sector, however, is the largest sector in
Kerala accounting for just under half the power consumption in 2001-02 followed by
28
industry consuming slightly above a third. For both Andhra Pradesh and Karnataka,
agriculture is the biggest consumer of power representing two fifths of total consumption.
Tamil Nadu has a more reasonable consumption share for industry accounting for the
largest share of 36 per cent in 2001-02 down from 40 per cent in 1996-97. However, the
share of agriculture in power consumption in Tamil Nadu at about 28 per cent in 2001-02
(26 per cent in 1996-97) is high in relation to its share in GSDP (16 per cent in 2000-01),
and is a result from free power to this sector till very recently.
As already noted, a major reason for the rising cost of power supply has been the
falling share of hydroelectricity, which is relatively cheap to produce. This decline in the
hydel-thermal mix has been also sharp in the case of southern states. In Andhra Pradesh
the share of hydropower in total power generation declined from 48 per cent in 1992-93 to
17 per cent in 2001-02 and Karnataka from 79 per cent to 44 per cent in the same period.
In Kerala the hydropower share declined to a lesser extent from 100 per cent to 90 per cent
and Tamil Nadu from 33 per cent to 15 per cent in the same period. At the
all-India level, the fall in hydel share has been much less from 23 per cent to 14 per
cent. The plant load factor (PLF), an index of efficiency of the thermal power plants, has
been much higher in the
South in relation to the all-India average. Andhra Pradesh recorded the highest PLF
among all states at 86 per cent in 2001-02. Karnataka and Tamil Nadu registered a PLF of
81 per cent and 78 percent respectively. These are considerably higher than the all-India
average of about 70 per cent.
Among the southern states, the cost of power supply is lowest in Tamil Nadu (Paise
310/KWh in 2001-02) despite the high proportion of thermal generation (85 per cent).
This is perhaps due to a lower transmission and distribution (T & D) loss at 16 per cent in
Tamil Nadu compared to the national average of 28 per cent. Andhra Pradesh and
Karnataka power sectors have high levels of T & D losses estimated at 33 per cent 36 per
cent respectively. Low level of metering is a serious problem in both Andhra Pradesh and
Karnataka where it is estimated at about only 40 per cent or below. Although Kerala has

29
low T & D loss of 17 per cent and a high hydropower component, its cost of power supply
shot up dramatically in recent years perhaps due to decline in labour productivity. From the
lowest among the southern states and much below the all-India average in 1996-97,
Kerala’ s unit cost of power supply in 2001-02 has been more than that in Tamil Nadu but
still lower than in Karnataka and Andhra Pradesh and nearly equal to the all-India average.
Commercial loss of electricity boards of these states without subsidy from the
respective governments has ranged from Rs. 13.54 billion for Kerala (lowest) during 2001-
02 to Rs. 28.20 billion for Andhra Pradesh (highest). The negative return on capital
without subsidy was also highest at –102 per cent for Andhra Pradesh, followed by
Karnataka at –81 per cent. Tamil Nadu has had the highest return on capital at –33 per
cent in 2001-02, which is even higher than the all-India average of –44 per cent. The
subsidy from the state government to partly cover the commercial loss has been highest
from Karnataka government at Rs. 24.26 billion in 2001-02 followed by Andhra Pradesh
government at Rs. 16.26 billion. Tamil Nadu government made the lowest subsidy
contribution to its electricity board at Rs. 2.50 billion in 2001-02.
During the last five years, 1997-02, Andhra Pradesh made the largest addition to
installed capacity among the southern states at 1495 MW followed closely by Karnataka at
1461 MW. Tamil Nadu added capacity of 895 MW and Kerala the lowest addition of 638
MW. What has been the record of reforms in the power sector in these states?
Andhra Pradesh has been one of the pioneering states to launch power sector
reforms by enacting the reform law in October 1998. Andhra Pradesh State Electricity
Board (APSEB) has been reorganized into two corporations under the Companies Act:
APGENCO in charge of generation and APTRANSCO in charge of transmission and
distribution with effect from February 1999. In April 2000 the distribution business has
been separated from transmission and made into four subsidiary companies. The
privatisation of distribution is being planned. An independent statutory Regulatory
Commission came into place in April 1999 and has been delivering tariff orders every year
from 2000-01. World Bank has sanctioned a loan of US$ 1 billion to be drawn in five

30
tranches under the Adaptable Programme of Lending (APL) for strengthening the
transmission and distribution network of APTRANSCO. The government has also secured
funds from DFID, UK (Rs. 5.42 bn.) and JBIC, Japan (Rs. 7.01 bn.) for revamping
distribution system and for certain evacuation schemes respectively. The state government
has also obtained assistance from the Government of India under the Accelerated Power
Development Programme (Rs. 1.95 bn.) for improvement in the distribution system, and
renovation and modernization of existing plants. The government passed legislative
amendment effective end-July 2000 providing for stringent penalties for power theft and
has registered several cases since then leading to improved revenue collection. There has
been a massive campaign for regularisation of unauthorised connections leading to
legalisation of nearly 2 million connections in the household sector and over a quarter
million in the agriculture sector. The state has achieved 85% consumer metering by end of
2002-03. Andhra Pradesh stood first in the comprehensive performance rating of state
power sectors carried out by CRISIL and ICRA recently scoring 71.5 out of 1005.
However, the state is yet to undertake rationalisation of the tariff structure, a necessary
prerequisite for reaching financial viability, and the agriculture sector is paying on an
average only 14 paise per kWh.
Karnataka followed Andhra Pradesh in introducing the power reform law in June
1999 and in setting up the Regulatory Commission in November 1999. Karnataka
Electricity Board was dissolved and in its place Karnataka Power Transmission
Corporation Ltd. (KPTCL), a transmission & distribution company, and Visvesvaraya
Vidhyut Nigam Ltd. (VVNL), a generating company, have been incorporated under the
Companies Act effective April 2000. The separation of transmission and distribution has
also been effected and four distribution companies have started functioning from June
2002. Privatisation of distribution is planned in the current financial year. The Electricity
(Amendment) Act, 2001 was passed to check theft, pilferage and wastage of electricity
with stringent penal provisions. This came into effect from April 2002 after which many
5 This is done at the instance of Ministry of Power, Government of India, based on a number of parameters
such as business risk (25 points), state government related matters (20 points), matters relating to the stateelectricity regulatory commission (20 points), financial risk of the boards/utilities (30 points) and otherfactors (5 points) (See ICRA-CRISIL Report, 2003).
31
cases were detected for power theft and proceeded against. Power tariffs were raised twice
in recent years over 15 per cent each. The state has achieved 100% consumer metering by
end of last year, an incredible achievement. Karnataka stood second in the country after
Andhra Pradesh, scoring 68 out of 100 in the comprehensive rating carried out by CRISIL
and ICRA.
The power sector has become a big drag on the Karnataka fisc as the subsidy given
by the state government of about Rs. 25.00 billion is about three quarters of the revenue
deficit of the state government in 2001-02. Although electricity is supplied to the
agriculture sector at heavily subsidised rate, the recoveries from this sector are hardly 10
per cent6. It is largely due to the inability of the power sector to deliver on the reform
parameters that the state could not draw the third tranche of the Karnataka Economic
Restructuring Loan of Rs. 12.00 billion from the World Bank last year.
Tamil Nadu and Kerala are latecomers in the power reform area. Both the
governments have signed a Memorandum of Understanding with the Ministry of Power,
Government of India, committing to power reform and have also set up state regulatory
commissions recently. The Kerala state carried out a 25 per cent hike in power tariff in
2001 and another similar hike very recently. Kerala government plans to reorganise the
SEB into three separate profit centres for generation, transmission and distribution. Also,
the government wants the distribution to be further split into three separate profit centres.
Tamil Nadu Electricity Board’ s proposal for a tariff hike across the board including a
positive tariff of 50 paise per unit for the agriculture sector was cleared by the Tamil Nadu
Electricity Regulatory Commission in March 2003. The state proposes to undertake
reforms with technical and financial assistance from Power Finance Corporation (PFC).
Tamil Nadu is below the halfway score getting 47.5 out of 100 in the CRISIL-ICRA
comprehensive rating exercise. Kerala is way behind with a rating score of 32.5 out of 100
meaning that it is far away from reaching a satisfactory performance.
6 Karnataka State Budget (2003).

32
The thrust of reforms in the power sector has been in the distribution sector and
states in the northern region have stepped up reform in recent years. They have all signed
MOUs with the central government to carry forward the reform process starting with Uttar
Pradesh in February 2000 followed by other northern states and finally Delhi in March
2003. Excepting J&K, all these states and Delhi have constituted state electricity
regulatory commissions (SERCs) starting with Haryana in as early as 1998. All these
SERCs have issued tariff orders including the very recent one in September 2003 from the
SERC of Uttaranchal reducing for the first time in the country power tariffs for industrial
and household consumers. Reform law in the power sector has been passed in northern
states first by Haryana in 1998 followed by Uttar Pradesh in 1999. However, Himachal
Pradesh, J&K and Punjab are yet to enact the reform legislation. Among the nine states,
which have unbundled and corporatised their power utilities in the country, include the
four northern states and Delhi. The northern states of Himachal Pradesh, J & K, and
Punjab have not unbundled their power utilities although The Power Reforms Committee
set up by the Punjab government has recommended it for that state.
Delhi is the second in the country to undertake privatisation of power distribution
in July 2002 after Orissa in 1998. Uttar Pradesh is the only state in northern region which
has enacted the anti-theft law bringing in stringent punishment for the offence of stealing
electricity. Only five states in the country have this in place so far. Punjab though not
enacted the anti-theft legislation, has made a one-time anti-theft drive in certain important
cities recently. Haryana, Himachal Pradesh and Delhi have the distinction of being among
just five states/U.T., which have achieved 100 per cent consumer metering so far. The
other states are Karnataka and Kerala. J & K and Uttar Pradesh have a poor consumer
metering of about 40 per cent and 59 per cent respectively against the national average of
84 per cent, Uttaranchal has reached 84 per cent, Punjab 85 per cent and Rajasthan a high
97 per cent.
Both Haryana and Rajasthan scores 64 out of 100 in the rating coming third in the
country after Andhra Pradesh and Karnataka who scored 71.5 and 68 respectively. Delhi

33
gets just above the halfway score of 52.5 out of 100, Himachal Pradesh 49.4, Punjab 45
and Uttar Pradesh 42.8 and J&K a poor score of 32.5.
VIII State Finances
Indian public finances at the centre began to deteriorate in the early 1980s. The
persistent high levels of revenue and fiscal deficits became unsustainable by the early
1990s resulting in a full-blown economic crisis with a collapse in growth, high inflation
and India on the brink of an external payments default. The finances of the state
governments, which were, sound in the 1980s with revenue surpluses till mid-1980s, began
to deteriorate from the early 1990s and reached unsustainable levels by the late 1990s. By
the early 2000s, all-States average revenue deficit stayed over 2.5 per cent GDP, fiscal
deficit in the range of 4 to 4.5 per cent of GDP and outstanding debt rising to about 28 per
cent of GDP by the end of 2002-03. The combined finances of the centre and states, after
indicating an improvement in the first half of the 1990s deteriorated thereafter. The
combined centre and states fiscal situation in India has worsened in recent years and the
levels of government deficits and public debt have overtaken the previous worst of the
early 1990s.
Table 13 gives the position of revenue and fiscal deficits of individual northern
states and the average for all-States during the 1990s and the early 2000s. In the northern
region, except Delhi and, to some extent, Haryana the finances of all other states are in a
very precarious condition. The worst case is Himachal Pradesh, where the revenue deficit
has been in the range of 6 to 10 per cent GSDP and fiscal deficit in the range of 10 to 14
per cent in the last few years (1999-03). This is followed by J & K, where, while revenue
deficit appears to have been brought under control, fiscal deficit remains in the range of 4.5
to 14 per cent of GSDP. In both Himachal Pradesh and J & K, the state governments’
outstanding debt has been alarmingly high at about 60 per cent of GSDP. Punjab has the
next high deficits of 3.5 to 5 per cent of GSDP on the revenue account and 6 to 7 per cent
of GSDP on the fiscal account and an outstanding debt of over 45 per cent of GSDP.
Rajasthan has also equally high revenue and fiscal deficits of 3.5 to 4.5 per cent of GSDP

34
and 5.5 to 7.5 per cent respectively during the period 1999-03 with outstanding debt of
over 40 per cent of GSDP. Uttar Pradesh also has high deficits above all-States average in
the range of 2.5 to 4 per cent of GSDP on the revenue side and 4.5 per cent to 6 per cent of
GSDP on the fiscal account and an outstanding debt nearing 40 per cent of GSDP. In
contrast, the union territory to Delhi has been having a revenue surplus of 2 to 3 per cent of
GSDP, a low fiscal deficit of 2.5 to 3 per cent of GSDP, and an outstanding debt of only
about 12 per cent GSDP. The state of Haryana also has been in a relatively better fiscal
position with a revenue deficit of 1 to 2 per cent of GSDP, a fiscal deficit of 4 to 4.5 per
cent and an outstanding debt of below 30 per cent of GSDP.
Besides the high outstanding debt, some of the northern states have been extending
large amount of guarantees for borrowing by their respective state enterprises. For
Haryana, Himachal Pradesh and Rajasthan, the outstanding guarantees reached about 15
per cent of their GSDP by end-March 2001 and for Punjab about 9 per cent, all above the
all-States’ average of 8.1 per cent, and J & K about 8 per cent of GSDP. Uttar Pradesh
government has been able to limit the outstanding guarantees to just 3.5 per cent of GSDP
by end-March 2001.

35
Table 14 gives an analysis of the growth in broad components of the budgets of the
northern states and for all-States during the nineties and the early 2000s divided into two
sub-periods. This clearly brings out the factors behind the deterioration of the finances
since the mid-1990s. For the states of Haryana, Himachal Pradesh, Rajasthan and Uttar
Pradesh the growth in non-tax revenues has either sharply declined or remained stagnant at
low levels. For the states of Haryana and J & K, there has been a marked decline in the
growth in transfers of central tax and grants. For the states of Punjab and Uttar Pradesh,
there has been substantial growth in expenditure, both revenue and capital. For Himachal
Pradesh and J & K, there has been substantial growth in revenue expenditure in the latter
Rs. crore % GSDP Rs. crore % GSDP Rs. crore % GSDP Rs. crore % GSDP Rs. crore % GSDP Rs. crore % GSDP1991-92 32 0.2 375 2.3 -9 -0.3 224 6.8 -104 -2.5 449 10.91992-93 2 0.0 444 2.6 93 2.4 312 8.2 -267 -5.9 203 4.51993-94 -80 -0.4 480 2.2 -114 -2.4 152 3.2 -459 -7.2 88 1.41994-95 390 1.5 535 2.0 308 5.3 620 10.6 -702 -10.1 -23 -0.31995-96 347 1.2 986 3.3 150 2.2 521 7.8 -741 -9.2 97 1.21996-97 719 2.0 1099 3.1 155 2.0 572 7.4 -792 -8.7 166 1.81997-98 719 1.9 1128 2.9 529 6.0 1202 13.6 -808 -7.9 444 4.31998-99 1540 3.5 2240 5.1 1022 9.6 1662 15.5 400 3.2 1054 8.41999-00 1185 2.5 2132 4.4 106 0.9 190 1.6 542 4.0 1338 9.82000-01 608 1.1 2265 4.2 1331 10.3 1845 14.3 1259 8.3 2166 14.32001-02 (R.E) 1170 2.0 2686 4.5 831 5.8 1468 10.2 -736 -4.4 748 4.42002-03 (B.E) 1056 1.6 2618 4.0 1186 7.4 1860 11.7 -77 -0.4 1613 8.6
Rs. crore % GSDP Rs. crore % GSDP Rs. crore % GSDP Rs. crore % GSDP Rs. crore % GSDP Rs. crore % GSDP1991-92 481 2.1 1150 5.0 49 0.2 792 3.4 725 1.1 2837 4.41992-93 636 2.4 1252 4.8 110 0.4 1159 4.3 1014 1.4 3711 5.21993-94 767 2.5 1493 4.9 301 0.9 1467 4.4 1149 1.4 3166 3.91994-95 742 2.2 1785 5.2 425 1.0 1763 4.2 2003 2.1 4766 5.11995-96 450 1.2 1365 3.5 702 1.5 2574 5.4 2341 2.2 4381 4.11996-97 1357 3.1 1465 3.3 866 1.5 2506 4.4 3179 2.5 5956 4.61997-98 1484 3.0 2478 5.1 582 0.9 2552 4.0 4624 3.4 7576 5.51998-99 2629 4.7 3779 6.8 2996 4.1 5151 7.0 8696 5.6 11632 7.51999-00 2727 4.4 3195 5.1 3640 4.5 5361 6.7 7253 4.3 11099 6.52000-01 2337 3.4 3904 5.7 2634 3.4 4313 5.6 6289 3.5 10180 5.62001-02 (R.E) 3842 5.1 5257 6.9 3510 4.1 5753 6.7 7757 3.9 12431 6.22002-03 (B.E) 3018 3.6 4970 5.9 3852 4.2 6956 7.6 5276 2.4 9744 4.5
Rs. crore % GSDP Rs. crore % GSDP Rs. crore % GDP Rs. crore % GDP1991-92 n.a n.a n.a n.a 5651 0.9 18900 2.91992-93 n.a n.a n.a n.a 5114 0.7 20891 2.81993-94 -59 -0.3 232 1.1 3812 0.4 20596 2.41994-95 -550 -2.1 389 1.5 6156 0.6 27697 2.71995-96 0 0.0 1004 3.6 8201 0.7 31426 2.61996-97 -764 -2.3 690 2.1 16114 1.2 37251 2.71997-98 -1159 -2.8 726 1.8 16333 1.1 44200 2.91998-99 -820 -1.7 959 2.0 43642 2.5 74254 4.31999-00 -751 -1.4 1382 2.6 53797 2.7 91480 4.72000-01 -1748 -3.0 1610 2.8 53569 2.5 89532 4.32001-02 (R.E) -1381 -2.2 2009 3.1 60540 2.6 106595 4.62002-03 (B.E) -2139 -3.0 1765 2.5 48223 1.9 102848 4.0
Source: CMIE, State Governments, CSO and RBI.
Revenue deficit Fiscal deficit Revenue deficit Fiscal deficit
Uttar Pradesh
AII-States
Fiscal deficit
Revenue deficit Fiscal deficit
Revenue deficit
Punjab
HaryanaRevenue deficit
Revenue deficit Fiscal deficit
Delhi
Jammu & Kashmir
Table 13: Fiscal Deficit Indicators: Northern StatesHimachal Pradesh
Revenue deficit Fiscal deficit
Fiscal deficit Revenue deficit Fiscal deficit
Rajasthan
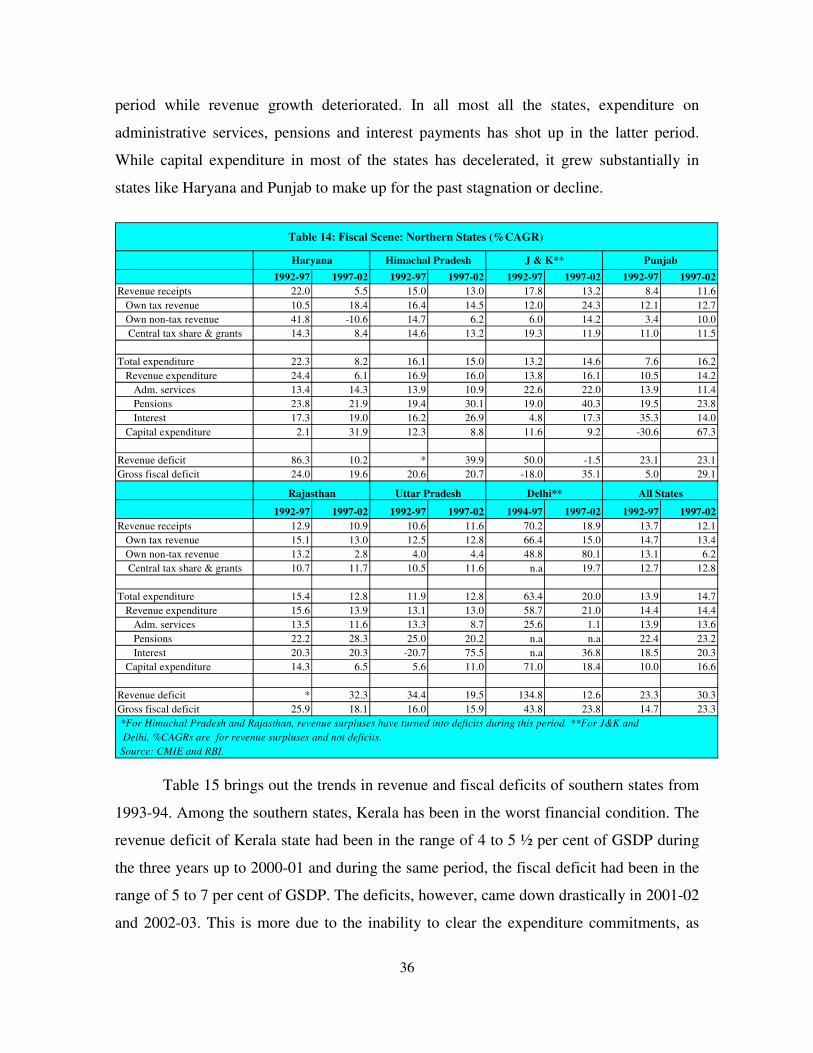
36
period while revenue growth deteriorated. In all most all the states, expenditure on
administrative services, pensions and interest payments has shot up in the latter period.
While capital expenditure in most of the states has decelerated, it grew substantially in
states like Haryana and Punjab to make up for the past stagnation or decline.
Table 15 brings out the trends in revenue and fiscal deficits of southern states from
1993-94. Among the southern states, Kerala has been in the worst financial condition. The
revenue deficit of Kerala state had been in the range of 4 to 5 ½ per cent of GSDP during
the three years up to 2000-01 and during the same period, the fiscal deficit had been in the
range of 5 to 7 per cent of GSDP. The deficits, however, came down drastically in 2001-02
and 2002-03. This is more due to the inability to clear the expenditure commitments, as
1992-97 1997-02 1992-97 1997-02 1992-97 1997-02 1992-97 1997-02Revenue receipts 22.0 5.5 15.0 13.0 17.8 13.2 8.4 11.6 Own tax revenue 10.5 18.4 16.4 14.5 12.0 24.3 12.1 12.7 Own non-tax revenue 41.8 -10.6 14.7 6.2 6.0 14.2 3.4 10.0 Central tax share & grants 14.3 8.4 14.6 13.2 19.3 11.9 11.0 11.5
Total expenditure 22.3 8.2 16.1 15.0 13.2 14.6 7.6 16.2 Revenue expenditure 24.4 6.1 16.9 16.0 13.8 16.1 10.5 14.2 Adm. services 13.4 14.3 13.9 10.9 22.6 22.0 13.9 11.4 Pensions 23.8 21.9 19.4 30.1 19.0 40.3 19.5 23.8 Interest 17.3 19.0 16.2 26.9 4.8 17.3 35.3 14.0 Capital expenditure 2.1 31.9 12.3 8.8 11.6 9.2 -30.6 67.3
Revenue deficit 86.3 10.2 * 39.9 50.0 -1.5 23.1 23.1Gross fiscal deficit 24.0 19.6 20.6 20.7 -18.0 35.1 5.0 29.1
1992-97 1997-02 1992-97 1997-02 1994-97 1997-02 1992-97 1997-02Revenue receipts 12.9 10.9 10.6 11.6 70.2 18.9 13.7 12.1 Own tax revenue 15.1 13.0 12.5 12.8 66.4 15.0 14.7 13.4 Own non-tax revenue 13.2 2.8 4.0 4.4 48.8 80.1 13.1 6.2 Central tax share & grants 10.7 11.7 10.5 11.6 n.a 19.7 12.7 12.8
Total expenditure 15.4 12.8 11.9 12.8 63.4 20.0 13.9 14.7 Revenue expenditure 15.6 13.9 13.1 13.0 58.7 21.0 14.4 14.4 Adm. services 13.5 11.6 13.3 8.7 25.6 1.1 13.9 13.6 Pensions 22.2 28.3 25.0 20.2 n.a n.a 22.4 23.2 Interest 20.3 20.3 -20.7 75.5 n.a 36.8 18.5 20.3 Capital expenditure 14.3 6.5 5.6 11.0 71.0 18.4 10.0 16.6
Revenue deficit * 32.3 34.4 19.5 134.8 12.6 23.3 30.3Gross fiscal deficit 25.9 18.1 16.0 15.9 43.8 23.8 14.7 23.3 *For Himachal Pradesh and Rajasthan, revenue surpluses have turned into deficits during this period. **For J&K and Delhi, %CAGRs are for revenue surpluses and not deficits. Source: CMIE and RBI.
Haryana Himachal Pradesh J & K** Punjab
Rajasthan Uttar Pradesh Delhi** All States
Table 14: Fiscal Scene: Northern States (%CAGR)

37
funds were not available. The revenue deficit of Andhra Pradesh has been low as a
proportion of GSDP and even lower than Tamil Nadu and Karnataka, but its fiscal deficit
has been very high at about 4 ½ to 5 per cent of GSDP in the last three years. Karnataka
and Tamil Nadu have almost similar fiscal deficit ratios. For Tamil Nadu, the deficit ratios
after dipping for two years, 2000-01 and 2001-02, more due to artificial compression of
expenditure7, have again spurted thereafter.
The worsening fiscal and revenue deficit positions of the state governments are
reflected in the debt and guarantee positions of these governments. Table 16 gives a
snapshot picture in this regard for the southern states. Kerala’ s debt situation is the most
serious recording a growth about 19 per cent per annum in the past five years to reach a
high of 35 per cent of its GSDP at the end of 2001-02. Kerala state’ s debt ratio is
estimated to go up further to 37 per cent by the end of 2003-04. Andhra Pradesh and
Karnataka had a debt stock of over 28 per cent and 30 per cent respectively of their GSDP
at the end of 2001-02. The debt ratios are estimated to go up further to 31 and 34 per cent
7 Tamil Nadu State Budget (2003).
Rs. Bn % GSDP Rs. Bn % GSDP Rs. Bn % GSDP Rs. Bn % GSDP Rs. Bn % GSDP Rs. Bn % GSDP1993-94 -2.32 -0.4 18.33 3.2 -1.16 -0.3 12.54 3.1 3.71 1.4 9.35 3.61994-95 7.28 1.1 23.48 3.4 2.96 0.6 15.13 3.2 4.00 1.3 11.09 3.51995-96 7.39 0.9 24.17 3.0 -0.62 -0.1 14.57 2.6 4.03 1.0 13.03 3.41996-97 31.99 3.5 28.12 3.1 5.79 0.9 19.44 3.0 6.43 1.4 15.42 3.51997-98 7.03 0.7 24.28 2.5 2.77 0.4 16.10 2.2 11.23 2.3 24.14 4.91998-99 26.84 2.3 57.06 5.0 12.15 1.4 31.12 3.5 20.30 3.6 30.12 5.41999-00 12.33 1.0 49.76 4.0 23.25 2.4 42.76 4.4 36.24 5.6 45.37 7.02000-01 35.95 2.6 73.06 5.3 18.62 1.8 42.19 4.0 31.47 4.2 38.78 5.12001-02 28.81 1.9 67.23 4.5 32.85 3.0 58.70 5.4 26.06 3.4 32.70 4.32002-03 (R.E) 31.65 1.9 73.41 4.5 34.06 2.9 57.60 4.9 18.99 2.3 28.45 3.42003-04 (B.E) 21.32 1.2 73.38 4.0 21.35 1.6 60.33 4.6 26.65 2.9 33.07 3.6
Rs. Bn % GSDP Rs. Bn % GSDP Rs. Bn % GSDP Rs. Bn % GSDP1993-94 6.92 1.2 14.33 2.5 38.12 0.4 205.96 2.41994-95 4.16 0.6 14.96 2.2 61.56 0.6 276.97 2.71995-96 3.11 0.4 12.56 1.6 82.01 0.7 314.26 2.61996-97 11.04 1.2 24.45 2.7 161.14 1.2 372.51 2.71997-98 13.64 1.3 21.22 2.0 163.33 1.1 442.00 2.91998-99 34.37 2.9 47.77 4.0 436.42 2.5 742.54 4.31999-00 44.00 3.5 53.82 4.2 537.97 2.7 914.8 4.72000-01 34.36 2.5 50.76 3.7 535.69 2.5 895.32 4.32001-02 27.39 1.9 47.39 3.2 605.40 2.6 1065.95 4.62002-03 (R.E) 59.17 3.8 81.05 5.1 482.23 1.9 1028.48 4.02003-04 (B.E) 39.33 2.3 69.44 4.1 n.a n.a n.a n.a
Source: CMIE, RBI and State Budget documents.
Andhra Pradesh Karnataka Kerala
Table 15: Fiscal Deficit Indicators: Southern States
Fiscal deficitRevenue deficit Fiscal deficit Revenue deficit Fiscal deficit Revenue deficit
Fiscal deficitTamil Nadu All- States
Revenue deficit Fiscal deficit Revenue deficit

38
respectively by end of 2003-04. The outstanding debt of Andhra Pradesh has been rising
by over 20 per cent per annum in the past 5 years. Tamil Nadu’ s debt position is the least
serious among the southern states, having had a total debt amounting to only 23 per cent of
GSDP at the end of 2001-02 up from about 16 per cent in 1997-98. State guarantees also
have been mounting and have reached 15.5 per cent GSDP for Kerala 11 per cent for
Karnataka and 10 per cent for Andhra Pradesh by the end of 2001-02. These are all above
the all-states guarantees ratio of 7.2 per cent.
Table 17 provides the growth in the broad components of the budgets of the four
southern states during the last decade divided into two sub-periods. The data brings out
the sharp deterioration that has taken since the mid-1990s. However, there is a major
distinction between what has been happening in the states of Karnataka, Kerala & Tamil
Nadu on the one hand, and what has been happening in Andhra Pradesh, on the other.
Andhra Pradesh Karnataka Kerala
Tamil Nadu All-States
Total debt (Rs. Bn.) 424.92 329.40 269.51 338.08 5892.18 % of GSDP 28.3 30.1 35.4 23.1 25.7
Guarantees (Rs. Bn.) 148.55 122.79 118.18 123.88* 1661.16 % of GSDP 9.9 11.2 15.5 9.0* 7.2 *End-March 2001.
Source: Reserve Bank of India and State government documents.
End-March 2002Table 16: Debt and Guarantees of Southern States,

39
In these three states, the growth in revenue receipts under all major items has
sharply declined in the second period whereas they have improved in the case of Andhra
Pradesh. This is primarily due to the accrual from taxes on Indian made foreign liquor
(IFML) in Andhra Pradesh following the lifting of prohibition in 1997 after its introduction
two years ago. Among the different items under revenue receipts, the growth in the
component of central tax share & grants to states, however, has declined in the second
period for all states except for Tamil Nadu, where there has been a marginal improvement
in the second period. On the expenditure side, there has been a dip in the second period
from an already high growth in the earlier period in all the southern states except Tamil
Nadu. Tamil Nadu, on the other hand, registered a higher growth in expenditure in the
latter period both on the capital and revenue accounts. Among the other states where
expenditure growth slowed down in the second period, it was due to slowdown in revenue
expenditure in Andhra Pradesh and Karnataka. In these states, capital expenditure that was
growing sluggishly in the early period did really pick up in the latter period and very
strongly in the case of Andhra Pradesh.
Andhra Pradesh had, in fact, a negative growth in capital expenditure during 1992-
97 solely due to the disruption and collapse in capital outlay in 1996-97 to just Rs. 1.31
billion from Rs. 24.22 billion in the previous year. Capital outlay picked up gradually
1992-97 1997-02 1992-97 1997-02 1992-97 1997-02 1991-96 1996-01 1992-97 1997-02Revenue receipts 12.2 14.6 15.0 10.6 16.6 10.2 15.8 11.7 13.7 12.1 Own tax revenue 9.8 19.0 14.0 11.9 18.4 11.1 18.0 11.9 14.7 13.4 Own non-tax revenue 10.6 12.7 16.7 -2.0 16.9 6.9 17.6 10.8 13.1 6.2 Central tax share & grants 15.8 10.0 14.9 12.9 12.9 9.0 10.4 11.2 12.7 12.8
Total expenditure 15.4 14.3 13.9 12.2 16.1 10.7 13.8 15.3 13.9 14.7 Revenue expenditure 17.4 11.8 15.5 13.2 16.1 11.8 14.1 15.4 14.4 14.4 Salaries 11.2 13.7 14.8 19.4* 13.6 11.2 12.5@ 15.1 13.9 13.6 Pensions 19.6 18.0 19.2 20.4 17.3 19.0 19.6 30.0 22.4 23.2 Interest 21.5 21.4 18.6 18.6 18.0 15.6 23.2 18.3 18.5 20.3 Capital expenditure -0.9 37.1 6.4 8.6 15.9 1.0 10.5 14.5 10 16.6
Revenue deficit 79.8 -1.3 26.5 39.0 12.1 24.0 -10.9 66.0 23.3 30.3Gross fiscal deficit 20.1 21.1 16.2 21.5 13.9 12.8 2.2 35.7 14.7 23.3
*For 1997-00 @For 1992-96. Source: CMIE and Budget documents of respective state governments.
Table 17: Fiscal Scene: Southern States (%CAGR) Andhra Pradesh Karnataka Kerala Tamil Nadu All States

40
thereafter to cross the 1995-96 level only in 2000-01 at Rs. 32.52 billion. Andhra Pradesh
has the highest average ratio of capital expenditure to total expenditure in the southern
states of about 14 per cent in the last three years ending 2002-03 followed by Karnataka at
about 12 per cent. Tamil Nadu and Kerala are in contrast making too little capital spending
at an average of only 8 and 6 per cent respectively of total expenditure in the last three
years reflecting the acute fiscal crises in their states.
In Andhra Pradesh, the moderate growth in revenue expenditure during the past
five years (1997-02) has been achieved despite high growth in salaries, pensions and
interest indicating that the government has put in place an expenditure control mechanism
that could bring down revenue deficits from the previous high levels. This is in sharp
contrast to the massive growth in revenue deficits in the other three southern states being
driven by the explosive growth in salaries, pensions, interest payments and subsidies.
Kerala’ s case is standing out as up to 2000-01 revenue expenditure grew explosively and
capital expenditure declined in absolute terms. The government had to bring down the
runaway expenditure by pruning plan outlay by 25 per cent in 2000-01 and 2001-02 and
delaying revenue expenditure like salaries, contractors’ payment, unemployment assistance
and pensions. This has lead to considerable reduction in revenue and fiscal deficits in
2001-02 and further in 2002-03 (Table 15).
All the southern state governments are acutely conscious of the need to bring the
fiscal situation under control. Andhra Pradesh, Karnataka and Tamil Nadu have introduced
medium-term fiscal programmes with targets for eliminating revenue deficits and bringing
down the fiscal deficit to below 2 to 3 per cent of GSDP over a period of over four to five
years. Andhra Pradesh proposes to eliminate power subsidy by 2005-06. It has introduced
food coupons to better target the rice subsidy. It set up a Sinking Fund in 1999-00 to
service the debt obligations and later a Guarantee Redemption Fund. Andhra Pradesh
government also has imposed a cap on fresh recruitment except for certain specilised jobs.
Karnataka has enacted the Fiscal Responsibility legislation in August 2002, the first state
in the country to do so. This will provide legal and administrative backing towards the

41
achievement of fiscal balance. The government has also introduced legislation to restrict
the future guarantees to 80 per cent of revenue receipts of the previous two years.
Tamil Nadu government recognises the gravity of fiscal situation and has reiterated
the need for reforms to bring fiscal consolidation in a medium-term framework. The recent
Budget contains a number steps based on recommendations of the Tax Reforms and
Revenue Augmentation Commission under the chairmanship of Dr. Raja J. Chelliah. This
included, besides the proposal to shift to state VAT, contained rationalisation of electricity
tax, introduction of a ‘Green Tax’ on old motor vehicles, revision of vehicle tax and
introduction of a state tax on cable TV operators. The Staff and Expenditure Reforms
Commission had identified surplus employees and the government proposes to abolish
existing vacant posts against the surplus posts. It has also proposed to introduce a
contributory pension scheme for all new government employees recruited from April 2003
against the earlier decision to do it for employees recruited from December 2001. Tamil
Nadu government had last year announced strict control of administrative expenditure
based on the recommendations of the Staff and Expenditure Reforms Commission. Zero-
base budgeting; rationalization of subsidies, block grants and grants-in-aid to institutions;
and targeting of subsidies to the needy have also been proposed. Last year’ s abolition of
the “ free sari and dhoti” scheme involving the withdrawal of about Rs. 1.4 billion of
subsidies indicates the determination of the government to implement the above proposals.
The government had also proposed legislation to restrict government guarantees to a
certain percentage of its revenue receipts and to set up a Guarantee Redemption Fund.
This year Budget has announced the plan to introduce a bill on Fiscal Responsibility in the
current session of the Legislative Assembly. The Budget has also announced the
determination for disinvestment and restructuring of public sector and co-operative sector
enterprises in the manufacturing sector. A VRS scheme for employees in these
undertakings has been implemented to facilitate such restructuring.
Kerala government had released the White Paper on State Finances in June 2001
and also proposed a Fiscal Accountability Bill in 2002-03 Budget. This year’ s Budget also
repeated the promise of placing the bill in the Assembly. A bill to cap guarantees is

42
introduced and a Sinking Fund for redeeming public debt has been created. The recent hike
in electricity tariff following a similar one in the previous year is a step in the right
direction. Kerala government has received the first tranche of Rs. 601 crore under the
Kerala ‘Modernising Government Programme’ (MGP) and Fiscal Reforms Package
financed by the Asian Development Bank (ADB) and the government of Netherlands. The
scheme aims to help the government, among other things, to improve quality of
governance by streamlining administration, ensuring accountability and transparency, and
reducing or eliminating deficits and subsidies.
IX Banking and Institutional Finance
The banking infrastructure in certain northern states and U.Ts is reasonably good.
In Himachal Pradesh, Punjab, Uttaranchal, and U.Ts of Chandigarh and Delhi, the banking
intensity (measured by the inverse of population per branch) is much higher than the
national average (Table 18). Uttar Pradesh while having the largest number of bank
branches in the country has one of the lowest banking intensity in the country similar to
some of the states in East and Northeast. Rajasthan too has a low banking intensity, lower
than the national average. The northern region as a whole had mobilised nearly a third of
bank deposits by end-March 2002 but had got disbursed a lower proportion of 27 per cent
of bank credit in the country accounting for a lower credit-deposit ratio8 (CD ratio) of 48.6
per cent against the all-India ratio of 58.4 per cent. The average CD ratio of the North is
markedly lower than those of all other regions except the East9. The CD ratios of Himachal
Pradesh, Uttaranchal and also Uttar Pradesh have been abysmally low at 32.5 per cent,
26.0 per cent and 34.3 per cent respectively. In sharp contrast, the U.T of Chandigarh has
registered a very high CD ratio of 102 per cent. Delhi’ s CD ratio is about the same as the
8 The credit-deposit ratio used here is based on actual utilisation of credit within the respective states which
includes not only the credit utilised in the state of sanction but also that out of the credit sanctioned inother states.
9 The average CD ratios of the South have been 68.9 per cent, West 68.8 per cent, East 41.4 per cent andthe Northeast 53.2 per cent as at end-March 2002.

43
all-India average but it alone accounted for about 11 per cent of bank deposits as well as
bank credit in the country up to end-March 2002.
If we take into account the investments of commercial banks in the form of
holdings of state-level securities such as state government loans; and shares, bonds,
debentures etc. of regional rural banks, co-operative institutions, state electricity boards,
municipal corporations, port trusts, SFCs, SIDCs, housing boards, state transport
corporations, etc.; we find that the states of Rajasthan and, to some extent, Haryana have a
comfortable investment plus credit-deposit ratio of 74 per cent and 63 per cent respectively
against the national average of 66 per cent.
Given the relatively larger importance of rural sector in northern states, the regional
rural banks (RRBs) play an important role in these states. Nearly 40 per cent of deposits
gathered by RRBs in the country come from this region. The credit distributed by RRBs in
the region had been lower at 31 per cent by end-March 2001 and the credit-deposit ratio of
northern RRBs had been about 31 per cent (about the same as the average for the East and
Northeast) against the all-India ratio of 41.5 per cent. However, Haryana has a higher
proportion of RRB credit than RRB deposits deployed leading to a fairly high RRB CD
ratio of about 50 per cent. Rajasthan has a nearly equal proportion of deposits for and
credit from RRBs leading to a CD ratio equal to the national average. RRBs from Uttar
Pradesh mobilise over a quarter of deposits accruing to all RRBs in the country and
provide just 18 per cent of credit disbursed by all RRBs.
Northern states attracted nearly 21 per cent of the cumulative disbursements by all-
India financial institutions up to end-March 2002 of which about half is accounted for by
Delhi and Uttar Pradesh which had a share of 6.2 and 4.5 per cent respectively. In per
capita terms, Uttar Pradesh has got very low cumulative disbursements of just Rs. 1564
and Delhi a very high of Rs. 19087 against the national average of Rs. 4588. Himachal
Pradesh, Haryana and Chandigarh have received a larger per capita cumulative
disbursement than the national average and the rest of the northern states below the
national average.

44
Southern states are blessed with an excellent banking infrastructure. Andhra
Pradesh has the largest number of commercial bank branches (5208 at end-March 2002) in
the South (Table 19) and the third largest in the country after UP (8178) and Maharashtra
(6306). However, population per bank branch is lowest in Kerala (9604), fourth lowest
state in the country after Goa (4123), Himachal Pradesh (7752) and Punjab (9492).
Population per branch is highest in Andhra Pradesh in the South followed by Tamil Nadu
but all the southern states have much lower population per bank branch than the all-India
average of 15496.
Haryana Himachal Pradesh
Jammu & Kashmir Punjab Rajas-
thanUttar
Pradesh1. No. of bank branches (end-M ar 2002) 1549 784 824 2559 3329 81782. Population per branch 13611 7752 12221 9492 16964 203053. Share in deposits (%) 2.1 0.8 1.0 4.6 2.8 8.84. Share in credit (%) 2.0 0.4 0.7 3.4 2.7 5.25. Credit-deposit ratio (%) 55.0 32.5 40.9 43.9 55.4 34.36. Investment plus credit-deposit ratio* 63.1 45.4 50.1 49.2 74.3 46.17. No. of RRB branches (end-M ar 2001) 292 130 263 203 1025 28248. Share in RRB deposits (%) 2.7 1.3 1.2 1.6 6.2 25.89. Share in RRB credit (%) 3.2 0.8 0.7 1.4 6.1 18.310. RRB credit-deposit ratio (%) 50.2 39.2 23.4 36.4 41.1 30.811. Share in AIFI disbursements@ (%) 2.4 0.9 0.2 2.3 3.2 4.512. Per capita AIFI disbursements#(Rs.) 5286 7206 833 4442 2787 1564
Uttaran-chal
Chandi-garh Delhi All-North All-India
1. No. of bank branches (end-M ar 2002) 842 179 1456 19700 662762. Population per branch 10071 5033 9466 n.a 154963. Share in deposits (%) 1.0 0.8 10.8 32.6 100.04. Share in credit (%) 0.5 1.4 10.9 27.1 100.05. Credit-deposit ratio (%) 26.0 102.3 59.1 48.6 58.46. Investment plus credit-deposit ratio* 27.6 102.3 59.2 n.a 65.67. No. of RRB branches (end-M ar 2001) 170 0 0 4907 143138. Share in RRB deposits (%) n.a 0 0 38.8 100.09. Share in RRB credit (%) 0.8 0 0 31.3 100.010. RRB credit-deposit ratio (%) n.a 0 0 34.1 41.511. Share in AIFI disbursements@ (%) 0.9 0.1 6.2 20.7 100.012. Per capita AIFI disbursements# (Rs.) 102 5484 19087 n.a 4588*Investment represents holdings of state govt. loans and shares, bonds, debentures etc. of RRBs, co-operative institutions, SEBs, muncipal corporations, port trusts, SFCs, SIDCs, housing boards, State Transport Corporations, etc. up to end-Mar 2001. @Cumulative up to end-March 2002. #Cumulative up to end-March 2001.Note: RRB - Regional rural bank; AIFI - All-India financial institution. Source: RBI, NABARD and IDBI.
Table 18: Banking and Institutional Finance in Northern States, 2001-02

45
Andhra Pradesh
Karna-taka Kerala Tamil
Nadu All-South All-India
1. No. of bank branches (end-Mar 02) 5208 4776 3315 4751 18141@ 662762. Population per branch 14541 11041 9604 13073 12317@ 154963. Share in deposits (%) 5.8 5.8 4.8 6.8 23.4@ 100.04. Share in credit (%) 5.7 5.6 3.3 9.2 23.9@ 100.05. Credit-deposit ratio (%) 67.7 68.9 43.7 88.5 68.9@ 58.46. No. of RRB branches (end-Mar 01) 1101 1093 325 212 2731 143137. Share in RRB deposits (%) 8.1 6.4 2.1 1.3 17.9 100.08. Share in RRB credit (%) 12.9 12.5 6.1 2.0 33.5 100.09. RRB credit-deposit ratio (%) 65.9 81.4 120.9 63.6 77.7 41.510. Share in AIFI disbursements* (%) 6.3 6.3 1.5 7.7 21.8 100.011.Per capita AIFI disbursements* (Rs.) 3914 5637 2230 5876 4414 4588Note: RRB - Regional rural bank; AIFI - All-India financial institution; *Cumulative up to end-March 2001. @Including Lakshadweep and Pondicherry.Source: RBI, NABARD and IDBI.
Table 19: Banking and Institutional Finance in Southern States, 2001-02
The four southern states had 23 percent total bank deposits in the country in March
2002 and their share in bank credit was somewhat larger at about 24 per cent. Their credit-
deposit (CD) ratio, therefore, had been higher at 68.9 per cent at end-March 2002 against
58.4 per cent for all-India. Tamil Nadu had a very high CD ratio of 88.5 per cent in March
2002 which was even higher than the ratio in Mahrashtra at 77.5 per cent, the highest for a
state in the country. Kerala, in contrast, had the lowest CD ratio in South at 43.7 per cent,
which was way below the all-India CD ratio of 58.4 per cent. Andhra Pradesh had a CD
ratio of 67.7 per cent and Karnataka at 68.9 per cent, both much above the all-India ratio.
Regional rural banks (RRBs) have also taken deep roots in the South for disbursing
credit to the rural areas. While their deposit share has been about 18 per cent of the all-
India level, their share in credit has been over a third. This is reflected in the high credit-
deposit ratio of about 78 per cent in the south in March 2001 against the national average
of 41.5 per cent. In sharp contrast to the commercial banking scene, where Tamil Nadu
had a very high CD ratio, for RRBs, it had the lowest CD ratio of about 64 per cent against
southern average of 78 per cent. Kerala, most surprisingly, had the highest RRB CD ratio
in the country of 121 per cent followed by Karnataka at 81 per cent, which is the third
highest in the country after Kerala (121 per cent) and Arunachal Pradesh (107 per cent).
Andhra Pradesh had a RRB CD ratio of about 66 per cent, which is lower than the all-India
ratio.

46
Tamil Nadu had the highest share among the southern states in cumulative
disbursements from all-India financial institutions (AIFIs) at 7.7 per cent up to 2000-01,
followed by both Andhra Pradesh and Karnataka almost equal at 6.3 per cent. Kerala got a
meagre 1.5 per cent of AIFI disbursements. In per capita terms as well, Tamil Nadu got
the highest AIFI cumulative assistance up to 2000-01 at Rs. 5876 followed by Karnataka at
Rs. 5637 against an all-India average of Rs. 4588. Andhra Pradesh obtained a lower Rs.
3914 per capita AIFI assistance and Kerala a very low Rs. 2230, both much below the all-
South and all-India average.
X Social Sector
Planning Commission has been constructing decadal Human Development Index
(HDI) for all-India and for all major states of India and the latest such index is available for
2001 (Planning Commission, 2002b). This is a composite measure of a number of
indicators relating to health, educational and economic attainments. Table 20 lays out the
comparative position with regard to the HDI and certain individual social indicators for the
northern states and it also compares the regional average for the northern states with the
average for the rest of the regions.
HDI for only four states (Haryana, Punjab, Rajasthan and Uttar Pradesh) in the
northern region are available from 1981 through 2001 and while the average HDI for these
states has been rising rapidly, the average HDI in 2001 still remained lower than those for
the southern and western regions. More importantly, the gap between the average HDI for
the North and the all-India average widened steadily over the last two decades, from 8 per
cent in 1981 to 11 per cent in 2001. However, Punjab stood second among the major states
in HDI through out the period, 1981 to 2001 and similarly Haryana in the fifth place all
through this period. Rajasthan improved its position in HDI from 12 in 1981 to 9 in 2001
but continued to remain below the national average. Uttar Pradesh slipped down from 13th
place in 1981 to 14th in 1991 but restored its rank to 13th in 2001.

47
Considering individual social indicators, for literacy, the average rate for the
northern region is much lower than that for the West, South and Northeast. Excluding the
U.Ts of Chandigarh and Delhi which have a high literacy rate of about 82 per cent each,
Himachal Pradesh is the most literate in the northern region at 77 per cent followed by
Uttaranchal (72 per cent) and the least literate among the northern region is J & K (54 per
cent) followed by Uttar Pradesh (57 per cent). Rajasthan while having a relatively low
literacy rate of about 61 per cent in 2001, recorded the highest growth in literacy in the last
decade from just below 39 per cent in 1991. For life expectancy, the North’ s average
number is lower than that for the South, West and East. While Punjab (68 per cent)
followed by Haryana (64 per cent) have life expectancy at birth above the national average
(61 per cent), Rajasthan (60 per cent) and Uttar Pradesh (58 per cent) have lower life
expectancy than the national average. The data in this regard is not available for states like
Himachal Pradesh, J & K and Uttaranchal and the U.Ts of Chandigarh and Delhi. With
regard to infant mortality rate (IMR), the average for the North in 1998 is higher than that
for any other region in the country. This is due to the high IMR in Uttar Pradesh (85 per
1000 live births) and Rajasthan (83 per 1000 live births).

48
With regard to per capita income, the regional average for the North had been just
below the West in the early 1980s but by the late 1990s, the South has overtaken the North
to be just below the West. Nonetheless, Punjab continued to be the second richest state
after Goa and, Haryana the fourth after Maharashtra. Chandigarh and Delhi are the
richest union territories in the country in that order. Himachal Pradesh progressed from a
(per 1000 live births)1981 1991 2001 1991 2001 1981-85 1993-97 1991 1998
Haryana 0.360 (5) 0.443 (5) 0.509 (5) 55.85 68.59 60.3 64.1 52 69Himachal Pradesh n.a n.a n.a 63.86 77.13 n.a n.a 82 64Jammu & Kashmir n.a n.a n.a n.a 54.46 n.a n.a n.a 45Punjab 0.411 (2) 0.475 (2) 0.537 (2) 58.51 69.95 63.1 67.7 74 54Rajasthan 0.256 (12) 0.347 (11) 0.424 (9) 38.55 61.03 53.5 60.0 87 83Uttar Pradesh 0.255 (13) 0.314 (14) 0.388 (13) 41.60 57.36 50.0 57.6 99 85Uttaranchal n.a n.a n.a n.a 72.28 n.a n.a n.a n.aChandigarh n.a n.a n.a 77.81 81.76 n.a n.a 48 32Delhi n.a n.a n.a 75.29 81.82 n.a n.a 54 51Total NORTH 0.278 0.345 0.419 45.42 61.68 52.7 59.5 89 77
Total WEST 0.321 0.403 0.475 56.85 71.14 56.8 61.2 96 66
Total SOUTH 0.353 0.442 0.495 58.95 70.29 60.0 64.7 57 53
Total EAST 0.267 0.349 0.416 47.37 58.65 54.5 60.4 79 67
Total NORTHEAST 0.272 0.348 0.386 54.41 65.72 51.9 56.7 84 68
All-INDIA 0.302 0.381 0.472 52.21 65.38 55.5 61.1 77 71
1980-81 1989-90 2000-01 1991 2001 1993-94 1999-00Haryana 2370 6233 23742 865 861 25.05 8.74Himachal Pradesh 1704 4375 18920 976 970 28.44 7.63Jammu & Kashmir 1776 3618 12399 896 900 25.17 3.48Punjab 2674 7624 25048 882 874 11.77 6.16Rajasthan 1222 3241 11986 910 922 27.41 15.28Uttar Pradesh 1278 3087 9721 876 896 40.85 31.15Uttaranchal n.a n.a n.a 936 964 n.a n.aChandigarh n.a n.a 44397 790 773 11.35 5.75Delhi 4030 10019 38864 827 821 14.69 8.23Total NORTH 1910 5006 18163 883 896 33.06 21.38
Total WEST 2070 5536 20290 926 927 35.93 23.47
Total SOUTH 1478 4066 18652 979 988 28.87 17.86
Total EAST 1403 3386 12251 921 936 46.78 32.76
Total NORTHEAST 1310 3740 11464 926 937 39.63 34.72
All-INDIA 1741 4693 16707 927 933 35.97 26.10Notes: 1. Regional averages are computed using poulation shares as weights except for p. c. income for which GSDP shares are the weights. 2. Figures in parenthesis under Human Development Index are ranks of the respective states included in the index.Source: Planning Commission, Census of India, Economic Survey and CSO.
Value (Rank)
Table 20: Social Indicators of Northern States and Union TerritoriesInfant Mortality RateLife Expectancy
at BirthLiteracy RateHuman Development Index
Per Capita Income at Current Prices (Rs.)
Sex Ratio (Females Poverty Ratioper 1000 Males)

49
per capita income below the national average in the 1980s to above the national average by
the early 1990s. The per capita income in Rajasthan continued to be way below the
national average through out the 1980s and the 1990s. Uttar Pradesh also lagged far behind
the national average in per capita income and, more importantly, its gap with the national
average progressively widened over the last two decades, from 27 per cent in 1980-81 to
42 per cent in 2000-01. Jammu & Kashmir slipped down from a higher per capita income
than the national average in the early 1980s to below the national average thereafter.
Sex ratio (females per 1000 males) is also another social development index and
the average sex ratio is most adverse (the lowest) for the northern region (896 in 2001) and
is much below the national average (933). In fact among the states, Haryana has the lowest
sex ratio (861) where the ratio has been declining in the last two decades followed by
Punjab (874) where it declined in the last decade. The states of Himachal Pradesh and the
new state of Uttaranchal have relatively better sex ratios of 970 and 964 respectively in
2001. The northern U.Ts of Chandigarh and Delhi also have extremely adverse sex ratios
of 773 and 821 respectively in 2001, both lower than those in 1991.The official data
indicate substantial reduction in poverty ratio during the nineties and the pace of reduction
has been sharpest in the South, followed by the North and West almost by an equal
proportion (Table 20). The level of poverty ratio in 1999-00 is the lowest in the South at
18 per cent followed by the North at 21 per cent, both below the national average poverty
ratio of about 26 per cent. There has been substantial reduction in poverty ratio in the
1990s in almost all the northern states and U.Ts except in Uttar Pradesh where the decline
has been moderate from about 41 per cent in 1993-94 to 31 per cent in 1999-00. Except
Uttar Pradesh, all the states and U.Ts in northern region have poverty ratios much lower
than the all-India average.
With regard to social aspects, there is no doubt that Kerala scores over not only all
other southern states but also all Indian states).. Kerala has been number one in HDI from
1981, the earliest date for which the index is available. However, the distance between the
HDI of Kerala and the all-India average HDI has been narrowing from two-thirds to about

50
one-third over the last two decades. Tamil Nadu10 which was number seven in HDI in
1981 rapidly improved to number three in 1991 and continued to be in that position in
2001 with Punjab remaining at number two place through out. Karnataka, which had 6th
rank in HDI in 1981, slipped to 7th rank in both 1991 and 2001. Andhra Pradesh had been
in the 9th position in both 1981 and 1991 and her position deteriorated to 10th place in
2001.
Table 21 indicates the comparative position of the southern states based on certain
key individual social indicators besides the human development index. On literacy rate,
Andhra Pradesh is not only having the lowest ratio in South, but its ratio is lower than the
all-India average. Tamil Nadu is the second most literate state in South after Kerala but her
all-India position is 6th. Karnataka’ s literacy rate is not much above the all-India average.
10 Dreze (2003) recounts the pleasant experience of the visits he made in April 2003 to primary schools,
health centres and ration shops in the rural areas of three districts of Tamil Nadu, which he found to be asharp contrast to the depressing experience of his several earlier visits to north Indian villages. He posesthe question why social services function so much better in Tamil Nadu or Kerala than in the bulk ofnorth India and the difference according to him partly relates to the role of women in society.
Tamil Nadu All-India
Quantity Comments Quantity Comments Quantity Comments Quantity Comments Quantity
1. Human development index 2001 0.416 10th rank 0.478 7th rank 0.638 1st rank 0.531 3rd rank 0.472
2. Litaracy rate (%) 2001 61.1 Lowest 67.0 Not high 90.9 Highest 73.5 6th highest 65.4in South
3. Per capita NSDP at current price (Rs.) 2000-01 16373 Lowest 18041 21046 Highest 19889 16707
in South in South (NNP)4. Life expectancy 1993-97 62.40 Lowest 63.3 Not high 73.30 Highest 64.1 4th highest 61.1 at birth in South among
major states5. Infant mortality rate (per 1000) 1999 66 Highest in 58 6th lowest 14 Lowest 52 3rd lowest 70
South among major states
6. Sex ratio (Females to 1000 males) 2001 978 4th highest 964 7th highest 1058 Highest 986 2nd highest 933
7. Poverty ratio (%) 1999-00 15.8 9th lowest 20.0 11th lowest 12.7 6th lowest 21.1 Highest in 26.1South
Source:(1) National Human Development Report 2001, Planning Commission, Govt. of India, (2) Economic Survey 2001-02, Govt. of India, and (3) CSO. Govt. of India.
Table 21: Social Sector in Southern States
YearKarnataka KeralaAndhra Pradesh

51
XI IT and E-Governance
Information technology (IT) has revolutionalised the economy and life in recent
times and has become the new source of comparative advantage in this age of knowledge
and information. While developed countries are in a significantly advantageous position to
exploit the productivity gains from IT, India is placed in a unique position to be part of the
information revolution due to her vast reservoir of skilled human resources. The World
Economic Forum in its latest Global Information Technology Report (2003-04) has placed
India at 45, six places above China (rank 51) among 102 countries considered for the
computation of their “ networked readiness index” , a measure for the nation’ s preparedness
to capture the benefits of information and communication technologies.
While at the national level India has demonstrated her IT power through huge
growth in the software and related services, state governments have been vying with each
other in offering an enabling environment for the growth of IT sector in their respective
states. Indian software industry is increasingly export-oriented with domestic sales
constituting less than a quarter of total sales in 2002-03. Karnataka (Rs. 141 billion out of
total software exports of Rs. 475 billion in 2002-03), followed by a distance, Tamil Nadu
(Rs. 75 billion) and Maharashtra (71 billion)11 dominates software exports from the
country. Uttar Pradesh (Rs. 45 billion) and Delhi (Rs. 44 billion) are now the fourth and
fifth largest software exporters respectively above Andhra Pradesh (Rs. 41 billion).
Haryana (Rs. 27 billion) has also now become a large software exporter mostly from its
city of Gurgaon. Punjab, Rajasthan and Chandigarh, however, had exported less than Rs. 1
billion each.
All southern state governments are actively engaged in promoting information
technology (IT) industry in their respective states and in the use of IT in government.
Andhra Pradesh, Karnataka and Tamil Nadu governments took early lead and laid down
11 The data is from Electronics and Computer Software Export Promotion Council (ESC) as reported in
Business Standard, New Delhi, November 3, 2003, p. 3.

52
their IT policies giving an array of incentives and concessions to investment in IT sector in
their respective states as early as 1997 whereas Kerala government started the emphasis on
IT by announcing its first IT policy in 1998.
Karnataka for long has been the leader in the country for software industry. The
state software industry is concentrated in Bangalore referred to as the Silicon Valley of
India and contributes now to about 30 per cent of India’ s total software exports. Karnataka
exports bulk of its software the bulk of from the Software Technology Park (STP) in
Bangalore. The government facilitated the setting up of two more STPs in Manipal and
Mysore and proposed to set up two more in Hubli and Mangalore. It is interesting to note
that the international quality certification for software industry, SEI CMM Level 5, were
received by 18 Bangalore companies against 29 for all-India and 40 companies for all-
world. The state plans to set up IT incubation centres in 12 districts of the state to foster IT
entrepreneurship. The government has established training centres under Yuva.com in 229
locations so far in the state in partnership with leading IT training schools to impart IT
skills to the educated unemployed youth especially in the rural areas. The state has
provided for IT education for classes 8 to 10 in all districts.
Karnataka has made substantial headway in computerizing the various departments
and activities starting with the Chief Minister’ s office. The most celebrated achievement of
the state in this regard is Bhoomi, the digitization of land records. This has been completed
in all 176 taluks in the state involving 20 million land records of 6.7 million landowners
with provision for online mutation (change in land title) and collection of authenticated
print outs from Kiosks at taluk offices. Courts could use this online land record database
to adjudicate civil disputes, and banks for planning their farm credit activities and also to
monitor the creation of charge on land of crop loan borrowers. This is by far the most
significant case of application of IT in rural areas in India. This has the unique distinction
of turning into a profitable enterprise as well with about Rs. 180 million already recovered
out of the total expenditure on the project of Rs. 200 million by charging a nominal fee of

53
Rs. 15 for a certified printout of land record12. Other achievements of the Karnataka
government include the provision of online reservation for KSRTC buses and
computerisation of RTO offices in Bangalore and Gulburga and of ration cards in
Bailhongal taluk of Belgaum district.
Andhra Pradesh has made rapid progress in the area of IT in the last seven years or
so. A NASSCOM survey conducted in May 1998 revealed that about 23 per cent of Indian
IT professionals worldwide originates from Andhra Pradesh. Engineering colleges in the
state increased from 32 in 1995 to 174 now and the engineers graduating every year from
there rose from 8000 to 46,000 in the same period. The state government has set up a state-
of-the art IT park, HITEC (Hyderabad Information Technology & Engineering
Consultancy) City at Madhapur spread over 151 acres with 5 million sq. ft. of office space
and world-class infrastructure. Software Technology Parks of India (STPI), Hyderabad, set
up by the Government of India is in operation from 1991-92. 1320 software export units
(of which, 404 foreign companies) have been registered with STPI, Hyderabad as at the
end of March, 2002 with a total capital investment of Rs. 23.37 billion and an employment
of 58,000 professional staff and 6000 supporting staff. Software exports by units of STPI,
Hyderabad, have been Rs. 41 billion during 2002-03 up from a meager Rs. 1.34 billion in
1996-97. Andhra Pradesh is the sixth in software exports after Karnataka, Tamil Nadu,
Maharashtra, Uttar Pradesh and Delhi.
A Gartner Study on Indian Business Processing Outsourcing (BPO) released in
September 2002 has indicated that Andhra Pradesh along with Tamil Nadu and Karnataka
have become the preferred destinations for the fast-growing BPO industry, immediately
following Delhi and Maharashtra13. Andhra Pradesh is not only the first to announce an
ITES policy in January 2002, but it also the first to set up a nodal agency, APFIRST, for
promoting and facilitating investment in remote services in June 2002. Andhra Pradesh has
12 This information is based on the presentation of Bhoomi Project made by Government of Karnataka in
the Annual World Bank Conference on Development Economics, 21-23 May 2003, Bangalore, India.13 The study has rated 13 states based on six different criteria namely, availability of quality human
resources, telecom infrastructure, power, air connectivity, government support for BPO and industrialdevelopment (Reported by The Economic Times, Mumbai, 9 September 2002).

54
been the biggest ITES exporter from South securing Rs. 14.11 billion in 2002-03, followed
by Karnataka (Rs. 9.88 billion) and Tamil Nadu (5.23 billion)14.
Extensive networks of optical fibre cables (22,000 kms) have been laid through out
Andhra Pradesh by BSNL, which is being used for by the AP State Wide Area Network
(APSWAN) for connecting state headquarters with each district as part of a government
Intranet. Private companies such as Reliance Infocom (3000 kms), Bharati Telecom (2500
kms) and Tata Teleservices (1750 kms) have been setting up high-speed digital networks
in the state taking advantage of the liberal right of way policy announced by the
government. APNet project is being launched on a pilot basis with the use of Ku Band
transponder and with the assistance of ISRO. This is aimed at taking the benefits of IT to
rural areas for applications like distance education, telemedicine, and e-Governance.
With regard to e-Governance initiatives, Andhra Government now occupies the
most advanced position in the country followed by Karnataka, Kerala and Maharashtra15.
The major successful projects of Andhra Pradesh include the following:
� CARD (Computer-Aided Administration of Registration Department) project under whichan end-to-end solution for the automation of registration process, cutting down the time forsales registration from 10 days to less than a hour, is provided.
� E-Seva is a one-stop-shop for citizen services providing a wide spectrum of services underone roof like payment of public utilities bills, tax payments, issue of certificates,licenses/permits, reservations, etc. Currently there are 21 centres with 200 countersoperating in the twin cities and it is proposed to extend it to 56 more towns.
� FAST (Fully-Automated System for Transport) where 37 offices of Regional TransportOffices are being connected and services like the issue of learner’ s licenses, drivinglicenses and registration of vehicles have been computerised.
Tamil Nadu has also been doing well in software exports recording a fast growth to
reach Rs. 75 billion in 2002-03 securing the second position after Karnataka.. The state has
more than 930 software companies including over 90 MNCs employing about 50,000
professionals. The state also exported Rs. 9.98 billion worth of hardware in 2002-03. The
14 See The Economic Times, Mumbai, 12 May 2003.15 In a study on e-Governance in 10 states of India by NASSCOM, has put Andhra Pradesh, Karnataka,
Kerala and Maharashtra in the first four positions followed by Tamil Nadu and Madhya Pradesh (TheEconomic Times, Mumbai, 30 September and 17 October 2002).

55
government announced a new IT policy in September 2002 extending further incentives
such as capital subsidy, relaxation of FSI to the extent of 100 per cent to IT parks,
concessional (50 per cent) stamp duty and registration fee, etc. After the completion of
“ TIDEL Park” , a one million sq. ft. IT park in Chennai with its entire space fully marketed,
another 1000 acre IT park is being developed in Siruseri village near South Chennai for
allotment to IT companies. Tamil Nadu has now a fibre optic cable network of more than
14,000 kms set up by both private and public sector units across the state. The state
government intends to use this extensive network to launch its e-governance operations
right down to the taluk and block levels. Chennai is also emerging as a major hub for ITES
including the business process operations (BPO). The World Bank and major foreign
banks like ABN Amro, Standard Chartered and Citibank have set up their BPO centres in
Chennai.
Tamil Nadu has made considerable progress in computerization of government
departments such as district registrars and sub-registrars offices, regional and zonal
transport offices and transport commissioner’ s office, sales tax department in Chennai and
Coimbatore circles. A video-conferencing facility has been set up in the state headquarters
and all district headquarters. Six agencies have been permitted to create high bandwidth
optic fibre networks covering every district in the state.
A pilot project called “ Sustainable Access in Rural India” (SARI) has been
implemented in Madurai district for providing both telephone and Internet access in every
village through “ Wireless in Local Loop” technology developed by IIT, Madras. This is a
collaborative effort between MIT Media Lab, Harvard University Centre for International
Development, IIT, Madras and I-Gyan foundation. After its successful piloting in
Madurai, it is now extended to 9 more districts. 1250 villages from these districts would
have Internet-based information kiosks within a year. The “ SARI” project is now been
renamed “ RASI” (Rural Access to Services through Internet). It is facilitating
dissemination of all kinds of useful information to the villagers at a low cost; enabling the
villagers to obtain crop-related help from agricultural universities; and using of
telemedicine to treat rural patients.

56
Kerala government has facilitated the set up the Techno-park in
Thiruvananathapuram, which provides world-class environment for high-tech electronics
and software companies in a 156-acre campus with a built-up space of 1.5 million sq. ft. It
is now hosting more than 55 international and domestic companies employing around 5000
IT professionals. Software exports from Techno-park was Rs. 1.45 billion in 2000-01.
The government inaugurated an ITES Habitat Centre at Kochi in May 2003 with modern
facilities to create a pool of skilled manpower for ITES industry within Kerala. The state
has also set up an Indian Institute of Information Technology and Management (IIITM-K)
as the centre of excellence in IT offering advanced training programmes, cutting edge
curriculum, strong linkages with IT industry and affiliations with internationally reputed
universities.
The Kerala state has made reasonable progress in computerisation in government
and provision of citizen services online. Some of the areas where digitization is in
progress are motor vehicle department, commercial taxes, civil supplies department,
treasuries department, employment exchanges, road transport depots, introduction of
electronic ticketing machines, and videoconferencing facility between the office of Chief
Minister and district collectors and networking of all the 1157 local bodies. The online
processing of registration called “ PEARL” (Package for effective administration of
registration laws) is being implemented in 14 sub-registrar offices covering all the 14
districts. The state has developed digital database for public distribution and has started
issuing new ration cards based on this. A pilot project for issuing smart cards as ration
cards has been launched in Thiruvananthapuram. Automation of land records is planned.
Computerisation in the Secretariat, and Collectorates has also been launched.
In the area of citizen services, Kerala government introduced “ FRIENDS” (Fast,
reliable, instant, efficient, network for disbursement of services), an integrated service
centre offering facility to remit public utility bill payments, make tax payments, submit
application and fee for ration cards, licenses/permits from motor vehicle department,
deposit university exam fees, etc. Starting from Thiruvananthapuram, the facility is

57
available now in all the fourteen district headquarters. Another important achievement is
the launching of computerised rural information centres in all 14 districts called “ Sevena”
whereby information on various government schemes, local bodies and other facts of
relevance to rural citizens are made freely accessible through Internet.
The Department of Information Technology of the Central government has recently
brought out a study on e-readiness assessment of states, union territories and central
ministries/departments (India: E-Readiness Assessment Report, 2003). One can loosely
define e-readiness as the preparedness and ability of the people and government to exploit
the potential of IT in efficiently satisfying the needs of society and economy including
governance. For the state level assessment, the study, following the methodology
developed by the Center for International Development at Harvard University with some
modifications, constructed a composite index based on a six-fold criteria: network access,
network learning, network society, network economy, network policy and e-governance16.
The composite scores of the states and union territories have been categorized into six
groups by the study and are summarized in the table below.
Table 22: E-Readiness of Indian States/U.Ts
1. Leaders Karnataka, Maharashtra, Tamil Nadu andAndhra Pradesh
2. Aspiring Leaders Gujarat, Goa, Delhi and Chandigarh
3. Expectants West Bengal, Uttar Pradesh and Kerala
4. Average Achievers Madhya Pradesh, Punjab, Pondicherry, Haryanaand Rajasthan
5. Below Average Achievers Himachal Pradesh, Uttaranchal, Chattisgarh,Orissa, Mizoram, Tripura, Meghalaya and A &N Islands
6. Least Achievers Assam, Jharkhand, Lakshadweep, Bihar, J & K,Sikkim, Arunachal Pradesh, Nagaland, Daman& Diu, Manipur, and D & N Haveli.
Source: India: E-Readiness Assessment Report (2003)
16 The study has employed the principal component analysis, an econometric technique to assign objective
weights to the different variables in finally arriving at a composite index for e-readiness at the state level.The weights are given to the different variables on the principle that the variation in the linear compositeof these variables is the maximum.

58
Table 22 indicates that the southern and western states and the union territories of
Delhi and Chandigarh in the North are clearly in the lead with regard to e-readiness in the
country. Among the northern states, surprisingly Uttar Pradesh alone is above the average.
Punjab, Haryana and Rajasthan belong to the group of average achievers and Himachal
Pradesh, and Uttaranchal are below the average. J & K belong to the last group of the least
achievers.
The study also categorises the states and union territories on the basis of each of the
six attributes of e-readiness. With regard to e-governance, one of the attributes of e-
readiness, a composite index is computed based on six indicators: special efforts of the
government, government preparedness, e-services, infrastructure, data systems, and
leadership & awareness. The classification of states and U.Ts into different levels of e-
governance arrived at by the study is indicated in Table 23. This shows the northern states
in a better light: the states of Himachal Pradesh, Uttar Pradesh, Rajasthan, Uttaranchal and
the U.T of Delhi are in level 2 of e-governance and Punjab, Chandigarh and Haryana in
level 3. Only J&K is in a relatively lower level of 5 in e- governance within the northern
region.
Table 23: Categoristion of the States/U.Ts in terms of E-Governance
Level 1 Karnataka, Andhra Pradesh, Tamil Nadu and Gujarat
Level 2 Himachal Pradesh, Uttar Pradesh, Rajasthan,Uttaranchal, Kerala, Delhi, Madhya Pradesh,Maharashtra and Goa
Level 3 West Bengal, Punjab, Chandigarh and Haryana
Level 4 Tripura, Bihar, Assam, Pondicherry, Orissa,Chattisgarh, Meghalaya, A & N Islands
Level 5 Lakshadweep, J & K, Arunachal Pradesh, Mizoramand Sikkim
Level 6 D & N Haveli, Manipur, Daman & Diu, Nagalandand Jharkhand.
Source: India: E-Readiness Assessment Report (2003).

59
XII Biotechnology
India has a natural edge in biotech with its huge reservoir of low-cost scientific
talent and a globally competitive pharmaceuticals sector, along with rising cost of research
in the US and Europe. A well-trained technician in India is paid US$ 10,000 to US$
20,000 a year whereas in the US he is paid US$ 100,000 (Fast Eastern Economic Review,
2002). State governments in Karnataka and Andhra Pradesh have sensed this opportunity
and have taken proactive steps to nurture the industry in their respective states.
Karnataka government announced the “ Millennium Biotech Policy” in March
2000, which provided for a set of incentives and concessions such as fiscal relief (stamp
duty reduction on land registration, exemption from payment of entry tax, etc.), rebate on
land cost, certain relaxation in labour laws, etc. Two biotech parks in Bangalore and
Dharwad and a marine biotech park in Karwar are being set up. The government is also
setting up an Institute of Agri-biotechnology (at Dharwad) and an Institute of Bio-
informatics applied Biotechnology. Under the Policy, the government has instituted a
single-window agency to clear all projects of biotechnology industry. It has established
Karnataka Biotechnology Development Council to oversee the growth of this industry in
the state. Further a “ vision group” on biotechnology has been set up under by Ms Kiran
Mazumdar-Shaw, the chairperson of Biocon India, India’ s most prominent biotechnology
company based in Bangalore, to work out future strategies. During 2001-02, the
government cleared 23 small and medium biotech projects and one large project.
Andhra Pradesh has a natural advantage in biotechnology as nearly a third of
India’ s bulk drugs is produced in and around Hyderabad. Also, Andhra Pradesh has
abundant and diverse agriculture and forest wealth, large marine resources, and cattle
population providing opportunities for the development of biotech industry. Besides,
Andhra Pradesh has a large network of research laboratories including the Centre for
Cellular and Molecular Biology (CCMB), Centre for DNA Fingerprinting and Diagnostics
(CDFD), International Crop Research Institute for Arid and Semi-Arid Tropics
(ICRISAT), ICICI Knowledge Park Ltd, etc., offering the necessary support for the
development of this industry. Andhra Pradesh has nine universities offering courses in
60
biotechnology bringing out about 900 students at the graduate level and 200 students at
postgraduate level every year. Recently six Bio-informatics centres have been set up
through private initiatives in Hyderabad. The state has several pioneers in biotech industry
such as Shanta Biotechniques Pvt. Ltd., Bharat Biotech International Ltd., and Biological
E. Ltd., and Dr. Reddy’ s Laboratories, providing a critical mass to the biotech industry.
ICICI Knowledge Park at Turkapalli village near Hyderabad has been set up with
the assistance from the Andhra Pradesh government. The first module of 10,000 sq. ft.
ready-to-use laboratories is now available on lease basis to companies along with support
services. Developed land on long-term lease basis is also available to private companies to
set up their own independent research facilities. The Department of Science and
Technology, Govt. of India has declared the Knowledge Park as a scientific and industrial
research organization (SIRO).
The government of Andhra Pradesh has announced that 600 sq. kms. covering the
mandals of Shamirpet, Medchal, Keesra, and Uppal in Ranga Reddy district as the
“ Genome Valley” in which biotech activities will be encouraged and promoted. The
government has also introduced a number of incentives for biotech units in the form of
sales tax concessions, rebate on land, exemption from power cuts, exemption from certain
labour regulations, etc.
Tamil Nadu government has also shown keenness in promoting biotech industry in
the state. TIDCO is setting up a Biotechnology Park at Chennai, which will be equipped
with a bio-resource centre and customized labs. A state-of-the-art Bio-informatics and
Genomics Centre which will develop and commercialise advanced laboratory technology
for DNA sequencing is also being set up. Kerala government is expected to announce a
Biotechnology policy shortly. It is setting up a Biotechnology Park in Thiruvananthapuram
with a Technology Incubation Centre, pilot plant and facilities for walk in and
manufacture.

61
XIII Summary and Policy Conclusions
First the southern states. We have seen that Karnataka has been the top economic
performer in southern India in the post-reform period followed by Tamil Nadu. The growth
performance of Andhra Pradesh and Kerala has been below par. The strong performance of
a number of years has brought Tamil Nadu to a position of an advanced industrialised state
although in the recent period the industrial growth in that state has slowed down. Its
agriculture also is the most efficient among the southern states a major reason being that it
is the most irrigated state in the South. Andhra Pradesh, Karnataka and Tamil Nadu have a
mix of small, medium and large industries covering a large spectrum of products; Kerala is
industrially weak having mostly small and medium industries in limited product
categories, which are relatively less capital intensive. There is good investment climate in
all southern states except Kerala where labour militancy, low labour productivity, poor
infrastructure, and bureaucratic over-regulation have made the state investment unfriendly.
Agriculture also suffered severely in Kerala till very recently as the prices of its major
crops, mostly cash crops, collapsed since the mid-1990s. In this connection, it may be
noted that Kerala has the largest unemployment rate in the country, which on current-daily-
status basis increased from 15.5 per cent (against the national average of 6.0 per cent) in
1993-94 to 21.0 per cent (against national average of 7.3 per cent) in 1999-00. Besides,
there was hardly any growth in employment in the state during the post-reform period, the
worst case among the major Indian states (Planning Commission, 2002c, p.145).
All the southern states have a large number of SLPEs, which are in dire straits. The
commercial loss and the rate of return are the worst for Kerala and the least problematic for
Karnataka. The recent turnaround in Karnataka State Road Transport Corporation
(KSRTC) to become the only profitable public transport corporation in the country is a
sign of positive changes taking place in that state17. Power sector in all the four southern
states are in a bad shape and the worst financial condition of the sector is in Andhra
17 The KSRTC had made a loss of Rs. 940 million in 1996-97 and the loss declined progressively and
turned into a profit of Rs. 386 million in 2001-02 and still higher Rs. 611 million in 2002-03. This waspossible due to better management and increased efficiency and the fares remain low in comparison withother public transport corporations (Jairaj, 2003).

62
Pradesh followed by Karnataka. The power reforms in these states are yet to produce
tangible results.
State finances of all the four states are also in a severe condition and here again
Kerala is the worst case followed by Karnataka and Andhra Pradesh, and Tamil Nadu is
the least bad. Own tax-GSDP ratio in Andhra Pradesh has improved since 1996-97 but
they continue to decline in other southern states. Tamil Nadu has taken a number of
measures to improve tax buoyancy in last year’ s Budget. Shift to state VAT, empowerment
of the states to tax and collect services tax, and better tax administration are the ultimate
solutions for improving tax buoyancy in states. Own non-tax revenue-GSDP ratio has
been falling in all the states including the southern states reflecting their inability so far to
raise user charges and the resultant poor cost recovery of economic and social services, and
the increasing losses from state level public enterprises. Some action is seen in Andhra
Pradesh and in Karnataka to some extent, for restructuring of public enterprises but in
Tamil Nadu and Kerala the process is somewhat slow.
All the four southern states have good banking infrastructure and the regional rural
banks are in good shape in all the four states. However, Tamil Nadu could make use of
banking and institutional finance system the best on account of is fast industrialisation and
urbanisation and Kerala is the polar opposite case where the poor investment climate does
not make the official financial intermediaries seek many bankable projects. Regional rural
banks, on the other hand, have been most intensively used in Kerala and least intensively
in Tamil Nadu.
With regard to social indicators, Kerala has been at the top for not only in south
India but also in the entire country for several decades. But the social gap between Kerala
and the rest of the country has been narrowing over the years as other states are catching
up. Tamil Nadu made rapid progress in this regard in the 1980s and has kept the pace since
then. Andhra Pradesh’ s position has deteriorated in the 1990s and remains the worst in the
South, and Karnataka also slipped behind in this regard. With regard to per capita income,
Kerala remained at the top in the South by the late 1990s closely followed by Tamil Nadu,

63
and Andhra Pradesh stayed at the bottom. On literacy, life expectancy and infant mortality
Andhra Pradesh has remained behind all other southern states followed by Karnataka.
However, on poverty, Tamil Nadu has the highest ratio in the South followed by
Karnataka. Kerala again has the lowest poverty ratio in the South followed by Andhra
Pradesh.
An analysis of the policy initiatives of the southern states in recent years has shown
that Andhra Pradesh has made substantial progress followed by Karnataka. This is evident
from the SLPE restructuring, power sector reforms, reforms in the irrigation sector, the
steps to bring state finances under balance without affecting capital spending on projects,
promotion of IT and biotech industry, e-Governance efforts, etc. While social development
will follow economic growth, the Andhra Pradesh government has also taken direct
measures to reduce poverty like massive social mobilisation of rural and urban poor into
self-help groups who in turn organising and implementing developmental activities. Kerala
continues to remain at the bottom of the league of reformers although the government has
taken a few recent positive steps18.
The biggest challenge before all these states is to revive the commodity producing
sectors, the agriculture and the manufacturing sector both of which have suffered since the
mid-1990s. The agricultural productivity in most crops in India remains much lower than
the world levels and the productivity in south Indian states for many crops is below the
best ones in India. Andhra Pradesh and Tamil Nadu have been raising the public
investment on irrigation in recent years. Karnataka and Kerala have to allocate much more
funds for investment in irrigation, as they remain thinly irrigated. All the states have to
bring down the huge wastage of agricultural subsidies and in turn, raise their investment in
rural infrastructure including irrigation, rural roads, rural electrification, rural marketing,
cold chain, agricultural research and extension services.
18 Among the recent reform measures taken by the Kerala Government, one must also mention the
enactment of the Kerala Loading and Unloading (Regulation of Wages and Restriction of UnlawfulActivities) Bill in August 2002 which aims to curb the notoriously restrictive trade union activitypracticed by the head-load workers in Kerala.

64
Poor agriculture is constraining the growth of food processing industry, which is
identified as one of the most promising industry in the country. The central government is
actively making legislative changes to facilitate the growth of food industry such as
amending the Essential Commodities Act, Prevention of Food Adulteration Act, and
Forward Contracts (Regulation) Act. The states have to remove the various restrictions on
storing and movement and of foodgrains by the private sector. They also have to bring in
changes in the State Agricultural Produce Marketing Regulation Act pertaining to each
state, to liberalise agricultural marketing permitting direct sale of produce to processors
and thereby reducing the number of unproductive intermediaries in the food chain, and to
allowing for contract farming. The government has to facilitate seed research, ensure better
linkage between farm and laboratory and give copyright protection for proprietary planting
material. The initial success with Bt cottonseeds in India has to be replicated for other
crops like pulses, oilseeds and other cash crops.
While the revival of industrial and agricultural growth should be the prime concern
and their revival will, to some extent, help alleviating the fiscal crisis in the states by
increasing own- revenues, Kerala is different and its development strategy has to be
different from the other states. While the welfare-orientation of the successive
governments in Kerala made the huge advances in social progress possible, the
sustainability of this model is under threat with the huge fiscal crisis of the state. Kerala’ s
specialisation in commercial crops would continue but it cannot escape the vagaries of
international markets as India has liberalised the trade regime. Among the industries, no
major industries other than food processing and some agro-based manufacturing do seem
to have much scope in the state. The major thrust, however, will have to continue to be the
services sector predominantly tourism, IT & IT-enabled services, health care services and
retailing which appear to suit the factor endowments of Kerala. Andhra Pradesh, which is
in the forefront of reforms, have to pursue them further and the results may take more time,
as the initial economic and social disadvantages of that state are large. Karnataka too has
big social challenges ahead though it has achieved the most impressive growth
performance in the 1990s. Tamil Nadu could achieve quicker results with the hastening of
reforms, as its social and economic foundations are already strong.

65
Now the northern states. Northern states as a whole constituted about 28 per cent of
the geographical area of the country and about 30 per cent of the population in 2001. These
states now account for a little below 28 per cent of the aggregate GDP of the country
which is almost the same share they had two decades ago. This constancy of northern
share, however, hides the steady fall in the share of Uttar Pradesh, still the second biggest
state economy in the country. J & K also lost its GDP share during the last two decades
and Punjab too marginally. More importantly, the average per capita income of northern
states has fallen below that of the southern region by the end of the 1990s. A major
contributory factor in this regard has been the highest population growth in the northern
region, the only region where the rate of population growth did not fall in the last decade.
The demographic exceptions in the region are Himachal Pradesh and Punjab where the
annual population growth has been low and declining.
The northern region’ s GDP growth has slowed down in the 1990s, the northeastern
region being the only other region to be so. The slowdown happened in all the northern
states except Himachal Pradesh and J&K. It occurred in all the three sectors of the state
economies except for industry in Himachal Pradesh and Rajasthan where there had been
rapid industrialization in the last decade. All the northern states except Himachal Pradesh
and Rajasthan have an agricultural sector bigger than the industrial sector, an attribute
similar to the states in the east and northeastern regions.
Although a major producer of a large variety of agricultural products, land
productivity of agriculture in the northern states is low except in Punjab and Haryana.
There has been a sharp reduction in the share of government sources of irrigation in these
states except in Haryana and J&K. This is also reflected in the continued declining of the
government expenditure on irrigation in most of these states in the 1990s.
New industrial investment proposals by domestic and foreign companies after
liberalization have been considerably lower in this region than in western and southern
regions. This is despite the fact that industrial efficiency in the northern region is above the

66
national average. Bank credit absorption and assistance by all-India financial institutions
remain dismally low in all the northern states and the situation becomes particularly
pathetic if Delhi, which accounts for a disproportionately high share in bank credit and
AIFI disbursements, is excluded19.
State finances are in severe disarray in all the northern states with the exception of
Delhi and, to some extent, Haryana. There is an acute crisis in the power sector of the
northern states arising from huge losses being incurred by the state power entities. There
has been no major private sector investment in power sector in northern region during the
Ninth Plan (1997-02) and major capacity addition even by the public sector was confined
to the states of only Punjab and Rajasthan. Investment in and accumulated loss by the state
level public enterprises are relatively small in northern states except in the case of Delhi
and Uttar Pradesh where the accumulated loss from SLPEs is one of the largest in the
country.
The northern region is socially much behind the southern and western regions. The
states of Punjab and Haryana as well as the U.Ts of Delhi and Chandigarh are exceptions
in this regard but in these states/U.Ts there is an adverse sex ratio extremely biased against
the females. The per capita income of Rajasthan, Uttar Pradesh and J&K are lagging
behind the national average and for Uttar Pradesh the gap has widened over the last two
decades. The decline in poverty ratio in Uttar Pradesh has been rather moderate unlike in
other northern states and the ratio remains above the national average in that state also
unlike other northern states.
19 Dr. Rupa Rege Nitsure, who is one of reviewers of this paper has asked, among other things, two
pertinent questions. The are: why northern states despite being scoring above average on manufacturingefficiency indicators remain industrially weak and why Delhi’ s investment climate being just mediumattracts huge bank credit and disbursements from all-India financial institutions. With regard to the first,the reviewer’ s conjuncture is that most of manufacturing indicators available are partial productivityindicators and are not able to capture the total productivity. The author’ s reasoning is that while themanufacturing efficiency may be high, these states are not attracting sufficient investments due to lack ofcongenial investment climate including sound governance. Regarding the second, the author’ s guess isthat, among the manufacturing units registered in Delhi, several operate in the emerging enclaves ofneighbouring states like Gurgaon and Noida. Also, Delhi being a major trading centre may be attractinglarge bank credit by its trade sector.

67
Northern region has registered rapid growth of the export-oriented software
industry in recent years. In 2002-03, the region accounted for about a quarter of total
software exports from the country, second only to the share of the southern region at 55 per
cent. Uttar Pradesh, Delhi and Haryana have become large exporters of software from the
country.
The states and U.Ts of the northern region are on different stages of e-readiness.
Delhi and Chandigarh belong to the group of aspiring leaders in e-readiness just below the
real leaders of Karnataka, Maharashtra, Tamil Nadu and Andhra Pradesh. Uttar Pradesh is
just above the average and the states of Punjab, Haryana and Rajasthan belong to the group
of average achievers. Himachal Pradesh and Uttaranchal are below the average and J&K
belong to the long list of least achievers in e-readiness, mostly from the eastern and
northeastern regions.
E-governance, which is the use of IT in efficient delivery of information and
services to the people, is part of e-readiness of the states. Most of the northern states
belong to the level 2 (Himachal Pradesh, Uttar Pradesh, Rajasthan, Uttaranchal and Delhi)
and 3 (Punjab, Chandigarh and Haryana) of the stages of e-governance the exception being
only J&K, which is placed at level 5.
The northern states are basically agrarian contributing about a half of the country’ s
foodgrains production and over a four-fifth of milk, sugarcane and potato. But they have
reached the limit of their agricultural growth for various reasons and that, in turn, has led
to the falling growth of its industry and services sectors as well. Employment in agriculture
remained high at two-thirds of labour force in the big states of Uttar Pradesh and
Rajasthan. The most important task facing these states is to revitalise the agricultural sector
and create an investment climate for reviving manufacturing. The state governments have
to gear up their governance in supporting economic growth and delivery of public services.
Diminishing returns have set in for the agriculture of these states that were in the
forefront of the green revolution and a part of the white revolution of yester years. A new

68
strategy to increase productivity of the agriculture sector has to be chalked out and
implemented urgently by these states. This should involve the following. Give high
priority for efficient maintenance of existing public irrigation projects and set up new
medium and large irrigation projects. Promote result-oriented research especially in the
area of agricultural biotechnology and deliver the results through efficient extension
services. Enhance rural connectivity through construction of rural roads. Liberalise rural
markets, support cold chain development, and improve rural electrification. The contract
farming which is being actively supported by certain state governments like Punjab has to
be put on the state statutes by amending their laws on land use and marketing (Sud, 2003).
A second agricultural revolution has to be ushered in through deregulation and
encompassing crops, horticulture, livestock and fisheries. Agriculture diversification has to
be based on consumer demand for nutritionally rich products and would involve a shift
from land and water-intensive to labour intensive products. This has to be buttressed by a
complete revamping of the present support price, public procurement and distribution
policies.
While rural development will provide the essential background for industrial
growth in the northern states, it has to be bolstered by policy changes to improve
investment climate. This involves not just tax concessions and subsidies (which have been
liberally given by state governments one after the other) but more importantly, the creation
of an industry-friendly mind-set at the bureaucratic and political levels for providing
hassle-free clearances and offering flexible labour markets. Above all, the governance of
these states has to improve considerably to inspire confidence in domestic and foreign
investors. Each state has its own industries and areas in which it has comparative
advantage and they will flourish once the congenial environment is created.
While the northern states in general are below par with regard to e-readiness, most
of them except J&K are fast catching up with the southern and western states in regard to
e-governance. They have to rapidly use I.T for delivery of public services to even far-
flung rural areas. Information technology should be increasingly used to plug tax leaks at
the check posts like in Gujarat, for land records and registration like in Karnataka, for

69
online receipts and payments, efficient cash-flow management and transfer of funds, and
these states should outsource non-core activities like billing, recoveries, collections,
payments, etc.
The reform process has caught on in these states in the recent period spurred by the
acute financial crises of most of these states and the prodding by the central government.
There is a flurry of activity in the state capitals after new governments took over in these
states. The governments have to face up to the severe financial crises in their states by
enhancing both tax and non-tax revenues. Collection of taxes can be improved through
better tax administration rather than levying new taxes, shift to the state value added tax
including for services and above all through the pick up in the economies of these states.
The yield on non-tax revenues has to go up substantially through the levy and collection of
appropriate user charges on power, transport, water, health and education especially higher
education. The expenditure pattern has to be restructured towards productive directions of
economic and social infrastructure and away from wasteful subsidies and bloated
bureaucracy. The development of crucial infrastructure like power, roads, transport, urban
infrastructure, however, cannot be solely undertaken by the states. They can be
increasingly catalysed through government guarantees secured through surcharge on
power, fuel, and road tax in the form of a first loss default guarantee fund (FLDGF) to be
set up in the states.
Northern states have vast economic potential. The realisation of this potential is a
matter of management at the political and bureaucratic levels by offering better governance
and an atmosphere for investment. The study has indicated a high correlation between
economic prosperity and social progress. The new governments in most of these states
have a golden opportunity to set these states into a high trajectory of growth and social
progress. India cannot pull ahead firmly so long as the big states of northern India like
Uttar Pradesh and Rajasthan continue to lag behind.

70
References
Acharya, Shankar (2002): “ What ails agriculture” , The Economic Times, Mumbai, March7.
---------- (2003): “ Can India grow without Bharat?” , Business Standard, New Delhi,November 25.
Ahluwalia, M.S. (2002), “ The Economic Performance of the States in the Post-ReformsPeriod” , Facets of the Indian Economy: The NCAER Golden Jubilee Lecturesedited by Rakesh Mohan, Oxford University Press, New Delhi, pp. 215-247.
Biotechnology Policy (2001), Policy announcements of the governments of AndhraPradesh, Karnataka and Tamil Nadu on Biotechnology, available of therespective websites.
Debroy, Bibek (2003): “ Reform Issues in Indian Agriculture” , Enabling AgriculturalMarkets for the Small Indian Farmer, Bibek Debroy and Amir Ullah Khan(eds.), Bookwell, New Delhi, Ch. 5, pp. 235-276.
Dreze, Jean (2003), “ Where Welfare Works: Plus Points of the TN Model” , The Times ofIndia, Mumbai, May 24.
Economic Review (2001), “ State Finances” , Economic Review 2001, State PlanningBoard, Government of Kerala, Ch 2.
Economic Survey (2001-02), Government of Andhra Pradesh.
Economic Survey (2002), Government of Karnataka, Planning, Statistics and Science &Technology Department, 2001-02.
Economic Survey (2003), “ Agriculture” , Economic Survey 2002-03, Ministry of Financeand Company Affairs, Government of India, New Delhi, Ch. 8.
EPW Research Foundation (2003): Domestic Product of States of India 1960-61 to 2000-01, Economic and Political Weekly Research Foundation, Mumbai, June.
Far Eastern Economic Review (2002), “ Biotechnology: Bangalore’ s New Buzz” bySadanand Dhume, July 4, pp. 28-30.
Governor’ s Speech (2002), Speech of Governor of Kerala to the Budget session of theLegislative Assembly, March.
Howes, S. and R. Murai (2003), “ Karnataka: Incidence of Agricultural Power Subsidies –An Estimate” , Economic and Political Weekly, Mumbai, pp. 1533-35.

71
ICRA-CRISIL Report (2003): Report on Rating of State Power Sectors, ICRA andCRISIL, Ministry of Power, Government of India, New Delhi, January 8.
India: E-Readiness Assessment Report (2003): Department of Information Technology,Ministry of Communications and Information Technology, Government ofIndia and the World Bank, April.
Information Technology Policy (2002), Policy statements announced by the four southernstate governments on IT available from their respective websites.
ITES Policy (2002), Policy announcements on IT-Enabled Services by the respective stategovernments available from their websites
Jairaj, K. (2003), “ Improvements in Service Delivery: Case Study of Public Transport inKarnataka” , presentation made at the World Bank Annual Bank Conference onDevelopment Economics, 21-23 May, Bangalore.
Jeromi, P.D. (2003), “ What Ails Kerala’ s Economy: A Sectoral Exploration” , Economicand Political Weekly, Mumbai, April 19, pp. 1584-1600.
Karnataka State Budget (2003), Speech of the Finance Minister, Karnataka State Budget,2003-04, Bangalore.
Mohan, Rakesh (2000), “ Fiscal Correction for Economic Growth: Data Analysis andSuggestions” , Economic and Political Weekly, Mumbai, June 10-16, pp. 2027-36.
------------ (2002): “ A Decade after 1991: New Challenges Facing the Indian Economy” ,Reserve Bank of India Bulletin, Mumbai, November, pp. 771-788.
Per Pinstrup- Anderson (2002): Reshaping Indian Food and Agricultural Policy to Meetthe Challenges and Opportunities of Globalisation, Exim BankCommencement Day Annual Lecture, Mumbai, April 22.
Planning Commission (2002a): Tenth Five Year Plan (2002-07), Ch 2, Vol I and Chs, 1 to3, Vol III, Planning Commission, Government of India, New Delhi.
---------- (2002b): National Human Development Report 2001, Planning Commission,Government of India, New Delhi, March.
--------- (2002c), Report of the Special Group on Targeting Ten Million EmploymentOpportunities Per Year over the Tenth Plan Period, New Delhi, May.
---------- (2002d): Annual Report of the Working of State Electricity Boards and ElectricityDepartments, Planning Commission, Government of India, New Delhi, May.
72
Reserve Bank of India (2003a): “ State Finances: A Study of Budgets of 2002-03” , ReserveBank of India, Mumbai, February.
---------- (2003b): “ Finances of State Governments – 2003-04: A Summary of MajorFeatures” , Reserve Bank of India Bulletin, Mumbai, November.
Rao, C.H. Hanumantha (2003a), “ Reform Agenda for Agriculture” , Economic andPolitical Weekly, Mumbai, February 15, pp. 615-620.
Rao, C.H. Hanumantha (2003b), “ Economic Reforms and Challenges Ahead: AnOverview” , Economic and Political Weekly, Mumbai, March 22-29, pp. 1130-1141.
Rao, M. Govinda (2002), “ State Finances in India: Issues and Challenges” , Economic andPolitical Weekly, August3, pp. 3261-3271.
Sidhu, H S (2002): “ Crisis in Agrarian Economy in Punjab: Some Urgent Steps” ,Economic and Political Weekly, Mumbai, July 27, pp 3132-3138.
Soman, Mangesh (2002), “ Bottoming out: Value Addition, jobs decline on the farm front” ,Economic Times, Mumbai, September 17.
State Budgets (2002-03), Budget speeches and documents of Governments of AndhraPradesh, Karnataka, Kerala and Tamil Nadu. Detailed tables are available forall these states except Tamil Nadu from the respective state governmentwebsites.
Strategy Papers (2002), The strategy papers on various sectors like power, irrigation,agriculture & allied sectors, infrastructure (roads, ports, and airports), fiscalreforms, public sector reforms, poverty eradication, etc. as prepared byofficials in the different departments of the Government of Andhra Pradesh,available on the website of Andhra Pradesh government.
Sud, Surinder (2003): “ Contract farming digs in” , The Economic Times, New Delhi,September 9.
Sudan, Randeep (2001), “ Use of Information Technology for Poverty Reduction: A Focuson Andhra Pradesh” , Paper delivered at the Asia and Pacific Forum onPoverty: Reforming Policies and Institutions for Poverty Reduction, held at theAsian Development Bank, Manila, 5-9 February
Tamil Nadu State Budget (2003), Speech of the Finance Minister, Tamil Nadu StateBudget, 2003-04, Chennai.
The Economist (2001): “ A survey of India’ s economy: The plot thickens” , The Economist,London, June 2.

73
White Paper (2002), “ White Paper on Tamil Nadu Government’ s Finances” , Ministry ofFinance, Government of Tamil Nadu. EPW Research Foundation (2003):Domestic Product of States of India 1960-61 to 2000-01, Economic andPolitical Weekly Research Foundation, Mumbai, June.
World Bank-CII (2002): Improving the Investment Climate in India, An investmentclimate assessment prepared by the World Bank Group in collaboration withthe Confederation of Indian Industries, World Bank, February.