Embed Size (px)
Citation preview

17‐808
“FinancialLiteracyandPortfolioDynamics”
MiloBianchi
May2017
Financial Literacy and Portfolio Dynamics�
Milo Bianchiy
May 2017
Forthcoming in Journal of Finance
Abstract
We match administrative panel data on portfolio choices with sur-vey measures of �nancial literacy. When we control for portfolio risk,the most literate households experience 0.4% higher annual returnsthan the least literate households. Distinct portfolio dynamics are thekey determinant of this di�erence. More literate households hold riskierpositions when expected returns are higher. They more actively rebal-ance their portfolios and do so in a way that holds their risk exposurerelatively constant over time. They are more likely to buy assets thatprovide higher returns than the assets that they sell.
�I thank the editor and an anonymous referee for very detailed and constructive com-ments as well as Bruno Biais, Alexander Guembel, S�ebastien Pouget, Jean-Marc Tallon forvery useful discussions. I also thank Henri Luomaranta for excellent research assistanceand AXA, Amundi and SCOR Research Funds for �nancial support. I have no relevantor material �nancial interests that relate to the research described in this paper.
yToulouse School of Economics, University of Toulouse Capitole, Toulouse, France.E-mail: [email protected]
1
1 Introduction
It is well established that households exhibit substantial heterogeneity inboth the performance of their portfolios (Campbell (2006); Calvet, Camp-bell and Sodini (2007)) and their understanding of basic �nancial principles(Lusardi and Mitchell (2011)). Recent evidence also suggests a precise re-lationship between these facts: Households experiencing lower risk-adjustedreturns tend to be less literate (Von Gaudecker (2015)).1
The mechanisms underlying the relationship between �nancial literacyand returns are much less understood. Part of the challenge is empirical.It is di�cult to �nd data that combine detailed information on householdportfolios with measures of household sophistication. Administrative datatypically lack direct measures of �nancial sophistication. Survey data typi-cally lack the details and the panel structure necessary to explore portfoliodynamics. An important dimension of heterogeneity may arise (in our set-ting, it will arise) from how households rebalance their portfolios over timein response to market conditions or to their own returns.
This paper exploits administrative panel data on portfolio choices matchedwith survey measures of �nancial literacy. This allows us to provide the �rstanalysis of how �nancial literacy relates to rebalancing behaviors (or the lackthereof) and to uncover novel mechanisms connecting �nancial literacy andportfolio returns.
We obtained data from a large French �nancial institution. We observeportfolio choices in a widespread investment product, called assurance vie, inwhich households allocate their wealth between relatively safe and relativelyrisky funds - essentially, pre-de�ned bundles of bonds or stocks - and areable to rebalance their portfolios over time. These observations are monthlyand cover the period 2002�2011. In addition, we constructed the returns ofeach portfolio and various counterfactual returns. These data are combinedwith the responses to a survey that we conducted on these clients, whichallows us to obtain a broader picture of clients' �nancial activities outsidethe company and of their behavioral characteristics, notably their �nancialsophistication.
While not covering the whole household portfolio, investments in assur-ance vie often represent a substantial fraction of investors' �nancial wealth.2
Moreover, they display some speci�c features (in addition to their popularityamong French households) that make them particularly useful for our pur-poses. When investing in these contracts, households face the same menuof assets (the funds o�ered by the company), and they select among pre-
1This should be contrasted with explanations of heterogeneous returns based on un-observed preferences or information (see Korniotis and Kumar (2013) for a discussion onthis point).
2For the median household in our sample, the value of the contracts that we observeamounts to approximately 50% of its �nancial wealth.
2
de�ned funds with a given risk pro�le. This choice may be less subject tobehavioral biases than direct stock picking.
We begin our analysis by constructing an index of �nancial literacy foreach investor. Following standard procedures, we ask each subject a seriesof questions related to basic principles of household �nance. Dependingon the number of correct answers, we classify each household on a 1 �7 scale that serves as our main measure of �nancial literacy. Financialliteracy correlates, as expected, with demographic variables (in particular,education and wealth) and with �nancial behaviors elicited in the survey (inparticular, stock market participation and holdings of �nancial products).These relationships con�rm previous �ndings in the literature and providesupport for the consistency of our measure of �nancial literacy.
Our main interest is in how �nancial literacy relates to portfolio choices.We begin with the observation that, in our sample, more literate house-holds experience higher portfolio returns. Controlling for various measuresof portfolio risk, the most literate households experience approximately 0:4%higher yearly returns than the least literate households, relative to an aver-age return of 4:3%. These magnitudes are in line with those estimated byVon Gaudecker (2015) for Dutch households.
The core of our analysis is the relationship between �nancial literacyand portfolio choices, focusing in particular on portfolio rebalancing. Wepursue two main objectives: First, we wish to investigate how speci�c �nan-cial choices help us to understand the above-mentioned relationship betweenliteracy and returns. Cross-sectional variations (for example, di�erent expo-sures to risk at a given point in time) are of little assistance in our setting;portfolio dynamics appear to be more important. Second, we aim to pro-vide direct evidence on whether some speci�c �nancial behaviors (such asinertia or trend chasing) that are commonly believed to result from a lackof sophistication are indeed correlated with low �nancial literacy.
Our �rst result is that more sophisticated households do not always takemore risk. Instead, their risk exposure varies systematically with marketconditions. More sophisticated households hold a larger risky share - thatis, a larger fraction of risky funds in their portfolio - when risky funds areexpected to o�er higher returns.3 According to our estimates, a 1% increasein the expected excess return of risky funds is associated to an increase in therisky share by 2% for each unit of �nancial literacy. This result is distinctfrom the more common observation that stock market participation increaseswith �nancial literacy,4 and it suggests a speci�c mechanism whereby literatehouseholds obtain higher returns.
We then consider portfolio inertia. Several studies have documented
3As detailed below, in this analysis we use realized returns in period t as a proxy forexpected returns in period t, given the information available at the end of t� 1.
4See Christelis, Jappelli and Padula (2010), Van Rooij, Lusardi and Alessie (2011),Grinblatt, Keloharju and Linnainmaa (2011), Arrondel, Debbich and Savignac (2015).
3
inertia in household portfolios; a common claim is that such inertia is theresult of low �nancial sophistication.5 Our data allow to provide a direct testof this claim. Building on Calvet et al. (2009a), we decompose the observedchanges in the risky share over time into active changes due to portfoliorebalancing and passive changes induced by di�erential returns of risky vs.riskless funds. We show that passive changes are relatively more importantfor less sophisticated households. For the least sophisticated households, thepassive change accounts for 64% of the total change in the risky share over12 months. For the most sophisticated households, by contrast, the passivechange accounts for 30%. These estimates provide the �rst direct evidencethat households with lower �nancial literacy display greater portfolio inertia.
Third, we investigate how the direction of rebalancing varies with �-nancial literacy. Trend-chasing behaviors have been often associated witha lack of sophistication, as proxied, for example, by limited market experi-ence.6 We can directly test this relationship by examining how householdsmove their wealth between safe and risky funds, depending on which fundshave gained value relative to others. We show that more literate householdsare more likely to act as contrarians: they tend to move their wealth towardfunds that have experienced relatively lower returns in the past. This allowsthem to hold their risky share relatively constant over time.
Finally, we show that rebalancing behaviors are an important determi-nant of portfolio returns: The returns experienced by more sophisticatedhouseholds tend to exceed those that they would have earned without re-balancing their portfolios. More sophisticated households are more likely tobuy funds that provide higher returns than the funds that they sell.
To the best of my knowledge, no other paper studies how survey measuresof �nancial literacy relate to portfolio dynamics observed in administrativedata. Our analysis contributes to a rapidly growing literature on �nancialliteracy and portfolio choices, as recently reviewed in Hastings, Madrianand Skimmyhorn (2013) and Lusardi and Mitchell (2014). (See also Guisoand Sodini (2013) for a broader survey on household �nance.) Most ofthis literature employs survey data on household portfolios. In particular,as mentioned above, Von Gaudecker (2015) employs detailed survey datato estimate the return loss associated with low �nancial sophistication andanalyze its interaction with professional advising. Compared to our data,survey data are more comprehensive, but they often lack the details andpanel dimension that we exploit to address our questions.
Several studies (reviewed, e.g., in Barber and Odean (2013)) use bro-kerage account data to document how the behavior of individual investorsmay depart from standard benchmarks. By employing explicit measures of
5See Calvet, Campbell and Sodini (2009a), Graham, Harvey and Huang (2009), Bilias,Georgarakos and Haliassos (2010).
6See Goetzmann and Kumar (2008); Greenwood and Nagel (2009); Bilias et al. (2010).
4
�nancial literacy, our analysis provides a more direct test of whether speci�cinvestment behaviors are linked to (a lack of) �nancial sophistication.
A few other studies investigate the e�ects of �nancial sophistication bymatching survey and administrative data. Dorn and Huberman (2005) focuson the relationship between (over)con�dence and portfolio underdiversi�ca-tion. Guiso and Viviano (2015) show that more sophisticated householdsmade better portfolio choices during the 2008 �nancial crisis, although thee�ects of �nancial literacy are small.7 Using Finnish administrative data,Grinblatt et al. (2011) show that investors with higher IQs are more likelyto participate in the stock market and hold better performing portfolios;Grinblatt, Keloharju and Linnainmaa (2012) focus on the trading of indi-vidual stocks and show that investors with higher IQs display better stockpicking and lower trading costs and they are less exposed to herding andthe disposition e�ect. Clark, Lusardi and Mitchell (2015) analyze pensionplan investments and show that more literate investors hold portfolios withhigher expected returns.
Our study is most closely related to Grinblatt et al. (2011), Von Gaudecker(2015) and Clark et al. (2015), and our approach is complementary: theiranalysis is essentially static, while we highlight the dynamics of householdportfolios. Our focus on rebalancing behaviors - as opposed to cross-sectionalvariations in participation or risk taking - provides new insights into the re-lationship between literacy and returns.
Finally, our study can serve as further motivation for the recent theo-retical literature on the e�ects of �nancial literacy. In particular, Lusardi,Michaud and Mitchell (2017) calibrate a stochastic life-cycle model in whichindividuals endogenously choose their investment in �nancial knowledge.They show that di�erences in �nancial literacy amplify di�erences in wealthaccumulation patterns and are a key determinant of wealth inequality. Morebroadly, Lusardi and Mitchell (2014) discuss theoretical approaches to �nan-cial knowledge as a human capital investment.
2 Data
We exploit three sources of data. First, we obtained data on portfolio choicesfrom a large French �nancial institution. Second, we constructed the returnsof these portfolios. The third source is a survey that we designed and ad-ministered to the same clients. These data are also employed in Bianchi andTallon (2016), who focus on the e�ects of ambiguity and risk preferences.
7See also Gerardi, Goette and Meier (2013) on the relationship between numericalability and mortgage default rates, Agarwal and Mazumder (2013) on the relationshipamong math ability, credit card usage and home loan applications and Agarwal, Ben-Davidand Yao (2017) on mistakes in mortgage decisions and (proxies for) �nancial sophistication.
5
2.1 Investment Data
We observe portfolio data for 511 clients at a monthly frequency fromSeptember 2002 to April 2011. These data describe the value and com-position of clients' holdings of an investment product called assurance vie.A typical assurance vie contract (which, despite the name, has no insurancecomponent) establishes the types of funds in which the household wishes toinvest and the amount of wealth allocated to each fund. A key distinctionis between relatively safe vs. relatively risky funds. The �rst assets, whichare called euro funds, are basically bundles of bonds, mostly (French) gov-ernment bonds. Their returns are rather stable, and the capital invested isguaranteed by the company.
The second funds are shares of mutual funds called uc funds. Investorsdo not observe the exact composition of these funds, and they typicallydo not directly select the funds in their contracts. They choose amongpre-de�ned portfolios with broadly de�ned risk characteristics (for example,"aggressive" vs. "conservative" or "Europe" vs. "Emerging Markets").
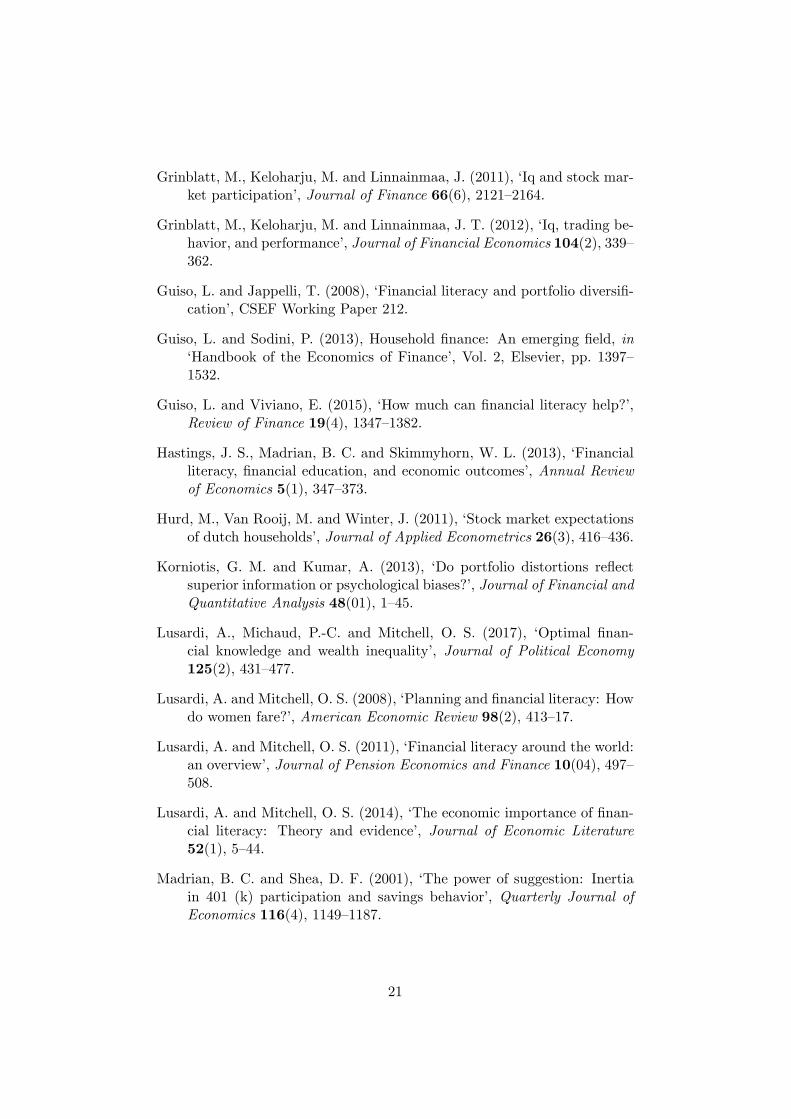
It is however made clear to investors that allocating wealth to uc fundsprovides higher expected returns and greater risk. To give a sense of thetrade-o�, the euro funds in our sample experienced average returns of 0:38%per month, compared to the 0:43% experienced by uc funds, and the formerhave a standard deviation of 0:42% compared to 2:8% for uc funds. In Figure1, we plot the average return of euro funds and uc funds in each month ofour sample to highlight that euro funds provide more stable returns. In thefollowing analysis, we will simply refer to euro funds as riskless assets andto uc funds as risky assets.
Over time, clients are free to change the composition of their portfolios,make new investments and liquidate their contracts in part or in full as theywish. There is some incentive not to liquidate the contract before 8 yearsto secure reduced taxes on capital gains. Investors may also delegate therebalancing of their portfolio according to some pre-speci�ed rule.8 In oursample, less than 10% of investors have chosen this option. As we show, ourresults are not a�ected by these considerations.
Assurance vie contracts are widespread in France, and they are the mostcommon way in which households invest in the stock market. According tothe French National Institute for Statistics (INSEE), 41% of French house-holds held at least one of these contracts in 2010.9 These contracts canrepresent a sizable fraction of households' �nancial wealth. In our sample,the average value of a portfolio is 32; 700 euros and the maximum is 590; 000
8Speci�cally, clients can require the company to hold the fraction of uc funds relativeto euro funds constant over time or to automatically increase the share of euro funds inthe portfolio.
9This makes assurance vie the most widespread �nancial product after livret A, asavings account with returns that are set by the state. See INSEE Premiere n. 1361 -July 2011 (http://www.insee.fr/fr/�c/ipweb/ip1361/ip1361.pdf).
6
euros. On average, that corresponds to approximately 50% of a household's�nancial wealth and approximately 10% of its total wealth.
The portfolio data we obtained from the company include a fund iden-ti�er that can be used to match the corresponding fund in Datastream. Inour sample, we observe 151 distinct euro funds and 150 distinct uc funds.We obtain the monthly returns of each fund, which we aggregate to com-pute the returns experienced by each client on his assurance vie contracts.These returns are computed directly from Datastream and do not includethe management fees collected by the insurance company. These fees aretypically expressed as a percentage of the amount of capital invested, butwe have no direct information on their value in our sample.
2.2 Survey Data
Our third source of data is a survey that we designed and administeredto these clients. The survey was administered by a professional companyat the end of 2010. The sampling was designed by the survey companyfollowing o�cial INSEE classi�cations to obtain a representative sampleof French households in terms of family status, employment status, sectorof employment and revenues.10 For comparison purposes, the median totalwealth in our sample is between 225 and 300 thousand euros, and the median�nancial wealth is between 16 and 50 thousand euros. These �gures are inline with those obtained for the general French population (see Arrondel,Borgy and Savignac (2012)).11
Clients were contacted at their home phone number and asked to connectto the internet. The survey was then completed over the internet while onthe telephone with the surveyor. The response rate was 7%, which is inline with other studies of this type. Non-response was driven primarily by arefusal to respond (40%), having the wrong number or respondent (26%), alack of internet access (18%), or the respondent not being at home (11%).12
We have no information on individuals who were contacted but did notrespond for any of the above-mentioned reasons.
10Speci�cally, the survey company obtained a sample of approximately 30; 000 clientsfrom the insurance company, strati�ed the sample according to geographic regions (IleDe France, North-East, West, South-East, South-West) and then implemented the sur-vey to meet pre-speci�ed quotas of respondents in terms of the above-mentioned socio-demographic characteristics.11For o�cial and comprehensive data, see the 2010 Household
Wealth Survey from the French National Institute for Statistics(http://www.insee.fr/en/methodes/default.asp?page=sources/ope-enquete-patrimoine.htm).12For example, Clark et al. (2015) report a response rate of approximately 17% for
a sample of 16,000 employees. Riedl and Smeets (2017) contacted approximately 38,000investors and obtained response rates of 8% for conventional investors and 12% for sociallyresponsible investors. In both these cases, subjects were contacted via email as opposedto our approach of contacting them over the phone.
7
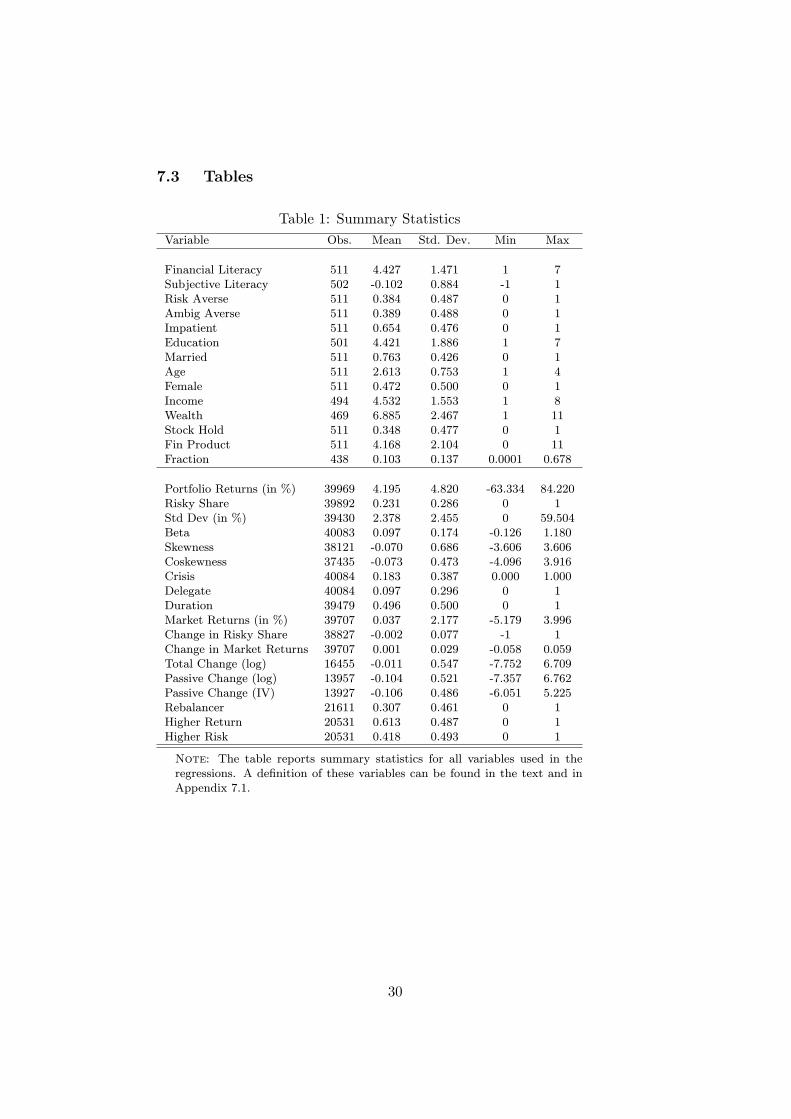
The survey serves two main purposes. First, we wish to gather informa-tion on demographic characteristics, wealth and portfolio holdings outsidethe company. While we do not observe detailed information on the �nancialproducts held outside the company, the survey helps us to obtain a broaderpicture of clients' �nancial activities. Second, we wish to have an idea ofclients' behavioral characteristics. In particular, we focus on measures ofclients' �nancial literacy. In the next section, we describe these measures ingreater detail. Summary statistics of the variables employed in our analysisappear in Table 1.
3 Financial Literacy
Our main measure of �nancial literacy is based on the answers to a seriesof questions related to (basic) principles of household �nance. The measurefollows the spirit of the methodology proposed by Lusardi and Mitchell(2008) and adds some questions that are more speci�c to our institutionalsetting.
Subjects were given seven questions, detailed in the Appendix, whichcover various aspects of �nancial sophistication: the ability to compute com-pound interest, knowledge of �nancial products, information about markettrends, and math ability. We de�ne the variable Financial Literacy as thenumber of correct answers to these questions. The variable takes valuesbetween 1 and 7; with an average of approximately 4:5 and a standard de-viation of approximately 1:5.13
We conduct our main analysis with this aggregate measure of �nancialliteracy. In the Online Appendix, we consider its various components inisolation and investigate their correlation (which is typically positive, asexpected), as well as their separate e�ects on �nancial behaviors. We alsodiscuss the robustness of our �ndings when considering alternative measuresbased on a subset of these questions.
In column 1 of Table 2, we report the correlation between Financial Lit-eracy and a set of demographic variables that will serve as controls through-out the subsequent analysis. Financial Literacy is positively correlated withEducation, Income andWealth. It is negatively correlated withMarried andFemale. Comparing the magnitude of the e�ects (scaling for the standarddeviation of the corresponding variables), we observe that, somewhat intu-itively, Education and Wealth display the largest e�ects.
These correlations are consistent with other �ndings in the literature.Guiso and Jappelli (2008) show that �nancial literacy is positively correlatedwith education, income and wealth and negatively correlated with beingfemale. Almenberg and Dreber (2015) and Fonseca, Mullen, Zamarro and
13Speci�cally, 1.6% of respondents score 1; 8.8% score 2; 17.8% score 3; 24.3% score 4;19.2% score 5; 21.5% score 6; and 6.8% score 7.
8
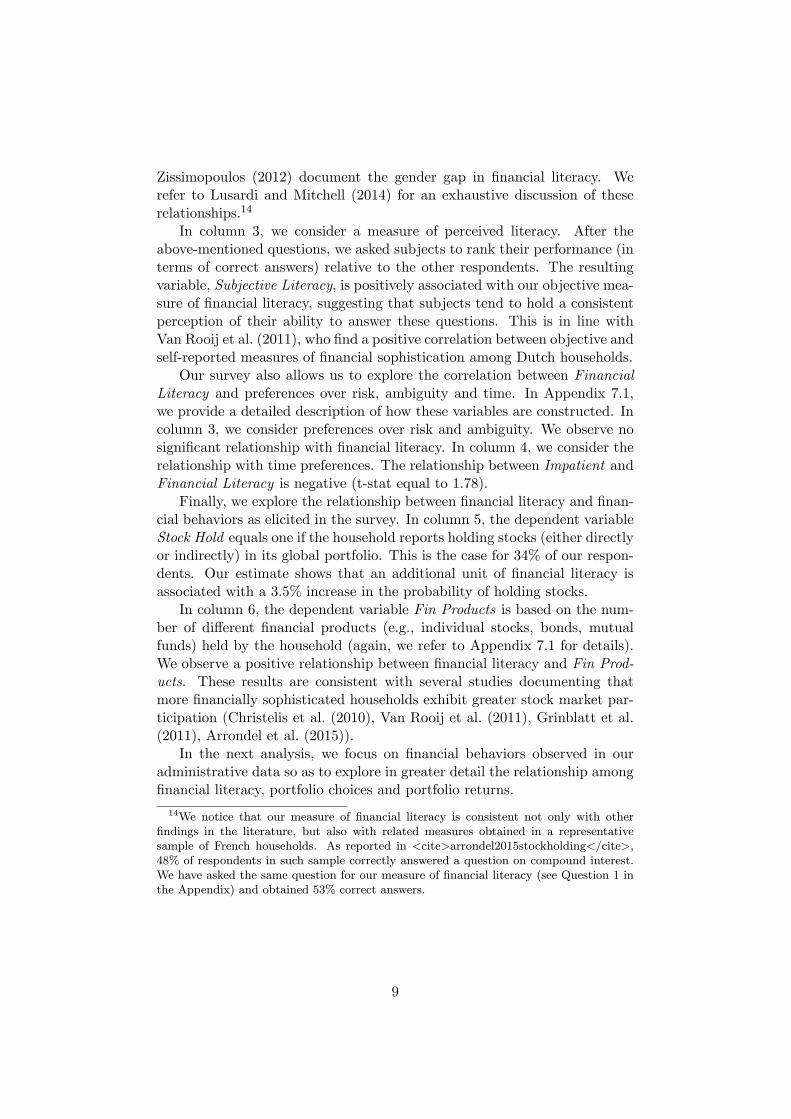
Zissimopoulos (2012) document the gender gap in �nancial literacy. Werefer to Lusardi and Mitchell (2014) for an exhaustive discussion of theserelationships.14
In column 3, we consider a measure of perceived literacy. After theabove-mentioned questions, we asked subjects to rank their performance (interms of correct answers) relative to the other respondents. The resultingvariable, Subjective Literacy, is positively associated with our objective mea-sure of �nancial literacy, suggesting that subjects tend to hold a consistentperception of their ability to answer these questions. This is in line withVan Rooij et al. (2011), who �nd a positive correlation between objective andself-reported measures of �nancial sophistication among Dutch households.
Our survey also allows us to explore the correlation between FinancialLiteracy and preferences over risk, ambiguity and time. In Appendix 7.1,we provide a detailed description of how these variables are constructed. Incolumn 3, we consider preferences over risk and ambiguity. We observe nosigni�cant relationship with �nancial literacy. In column 4, we consider therelationship with time preferences. The relationship between Impatient andFinancial Literacy is negative (t-stat equal to 1:78).
Finally, we explore the relationship between �nancial literacy and �nan-cial behaviors as elicited in the survey. In column 5, the dependent variableStock Hold equals one if the household reports holding stocks (either directlyor indirectly) in its global portfolio. This is the case for 34% of our respon-dents. Our estimate shows that an additional unit of �nancial literacy isassociated with a 3:5% increase in the probability of holding stocks.
In column 6, the dependent variable Fin Products is based on the num-ber of di�erent �nancial products (e.g., individual stocks, bonds, mutualfunds) held by the household (again, we refer to Appendix 7.1 for details).We observe a positive relationship between �nancial literacy and Fin Prod-ucts. These results are consistent with several studies documenting thatmore �nancially sophisticated households exhibit greater stock market par-ticipation (Christelis et al. (2010), Van Rooij et al. (2011), Grinblatt et al.(2011), Arrondel et al. (2015)).
In the next analysis, we focus on �nancial behaviors observed in ouradministrative data so as to explore in greater detail the relationship among�nancial literacy, portfolio choices and portfolio returns.
14We notice that our measure of �nancial literacy is consistent not only with other�ndings in the literature, but also with related measures obtained in a representativesample of French households. As reported in <cite>arrondel2015stockholding</cite>,48% of respondents in such sample correctly answered a question on compound interest.We have asked the same question for our measure of �nancial literacy (see Question 1 inthe Appendix) and obtained 53% correct answers.
9
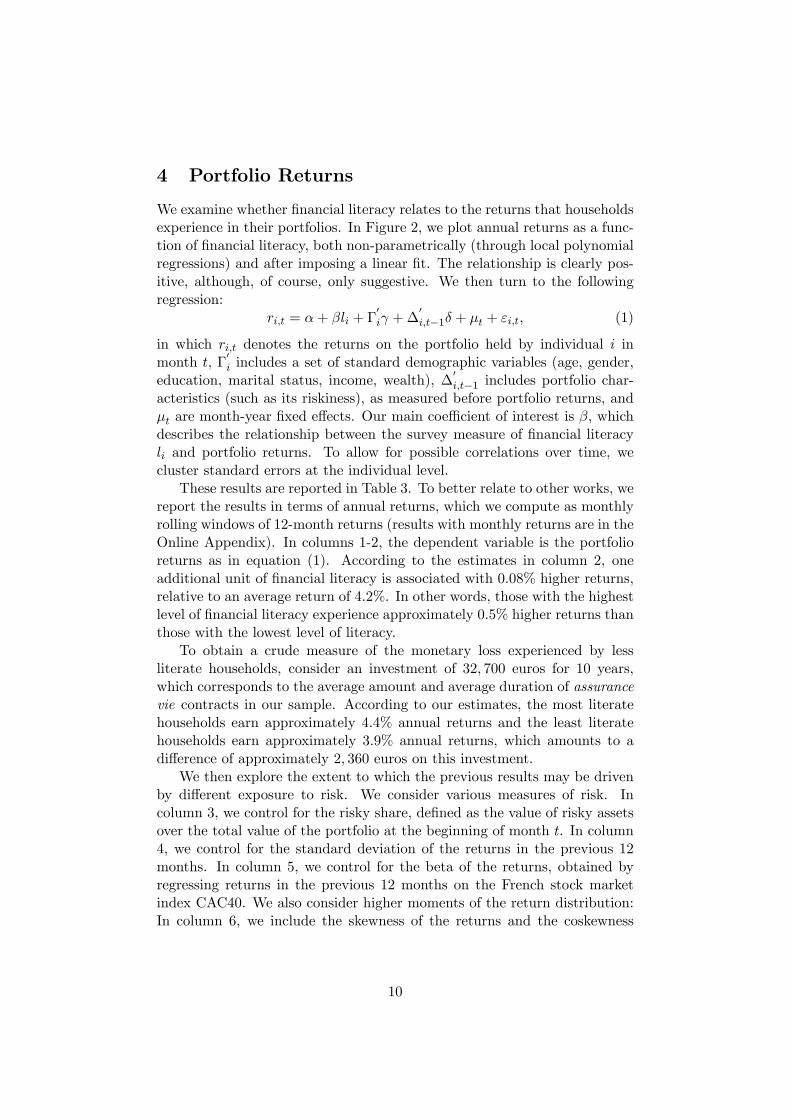
4 Portfolio Returns
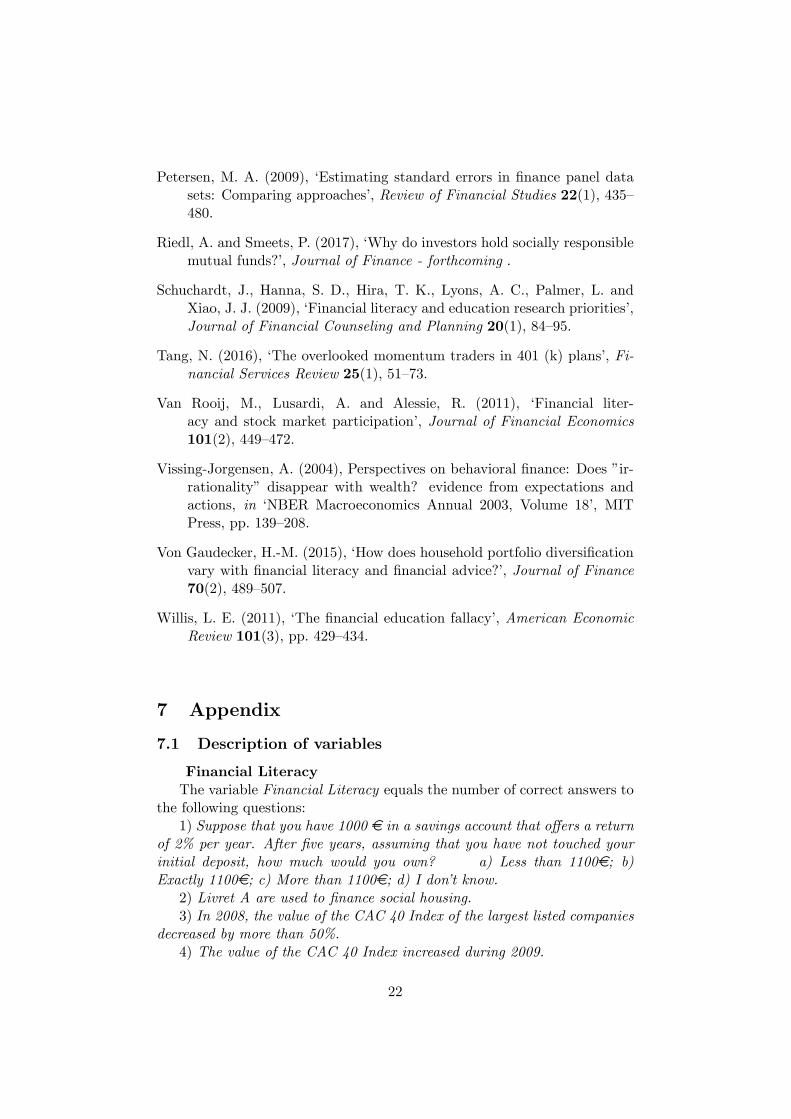
We examine whether �nancial literacy relates to the returns that householdsexperience in their portfolios. In Figure 2, we plot annual returns as a func-tion of �nancial literacy, both non-parametrically (through local polynomialregressions) and after imposing a linear �t. The relationship is clearly pos-itive, although, of course, only suggestive. We then turn to the followingregression:
ri;t = �+ �li + �0i +�
0i;t�1� + �t + "i;t; (1)
in which ri;t denotes the returns on the portfolio held by individual i inmonth t, �
0i includes a set of standard demographic variables (age, gender,
education, marital status, income, wealth), �0i;t�1 includes portfolio char-
acteristics (such as its riskiness), as measured before portfolio returns, and�t are month-year �xed e�ects. Our main coe�cient of interest is �; whichdescribes the relationship between the survey measure of �nancial literacyli and portfolio returns. To allow for possible correlations over time, wecluster standard errors at the individual level.
These results are reported in Table 3. To better relate to other works, wereport the results in terms of annual returns, which we compute as monthlyrolling windows of 12-month returns (results with monthly returns are in theOnline Appendix). In columns 1-2, the dependent variable is the portfolioreturns as in equation (1). According to the estimates in column 2, oneadditional unit of �nancial literacy is associated with 0:08% higher returns,relative to an average return of 4:2%. In other words, those with the highestlevel of �nancial literacy experience approximately 0:5% higher returns thanthose with the lowest level of literacy.
To obtain a crude measure of the monetary loss experienced by lessliterate households, consider an investment of 32; 700 euros for 10 years,which corresponds to the average amount and average duration of assurancevie contracts in our sample. According to our estimates, the most literatehouseholds earn approximately 4:4% annual returns and the least literatehouseholds earn approximately 3:9% annual returns, which amounts to adi�erence of approximately 2; 360 euros on this investment.
We then explore the extent to which the previous results may be drivenby di�erent exposure to risk. We consider various measures of risk. Incolumn 3, we control for the risky share, de�ned as the value of risky assetsover the total value of the portfolio at the beginning of month t. In column4, we control for the standard deviation of the returns in the previous 12months. In column 5, we control for the beta of the returns, obtained byregressing returns in the previous 12 months on the French stock marketindex CAC40. We also consider higher moments of the return distribution:In column 6, we include the skewness of the returns and the coskewness
10
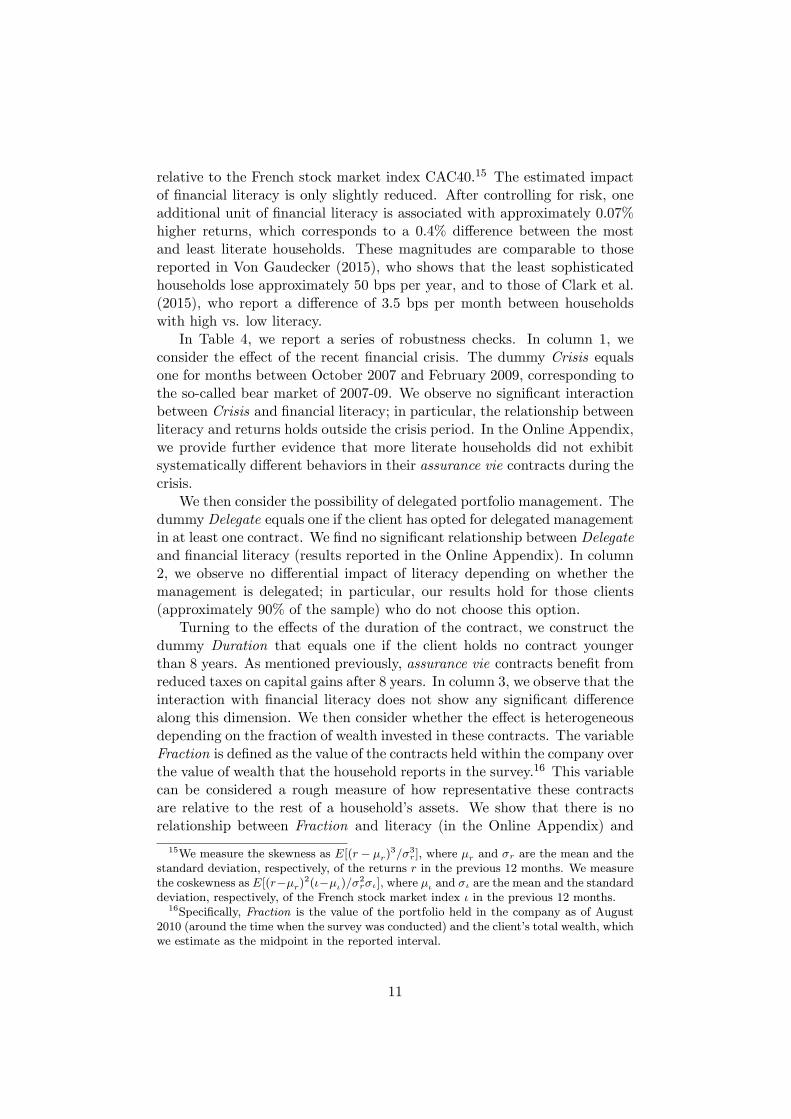
relative to the French stock market index CAC40.15 The estimated impactof �nancial literacy is only slightly reduced. After controlling for risk, oneadditional unit of �nancial literacy is associated with approximately 0:07%higher returns, which corresponds to a 0:4% di�erence between the mostand least literate households. These magnitudes are comparable to thosereported in Von Gaudecker (2015), who shows that the least sophisticatedhouseholds lose approximately 50 bps per year, and to those of Clark et al.(2015), who report a di�erence of 3.5 bps per month between householdswith high vs. low literacy.
In Table 4, we report a series of robustness checks. In column 1, weconsider the e�ect of the recent �nancial crisis. The dummy Crisis equalsone for months between October 2007 and February 2009, corresponding tothe so-called bear market of 2007-09. We observe no signi�cant interactionbetween Crisis and �nancial literacy; in particular, the relationship betweenliteracy and returns holds outside the crisis period. In the Online Appendix,we provide further evidence that more literate households did not exhibitsystematically di�erent behaviors in their assurance vie contracts during thecrisis.
We then consider the possibility of delegated portfolio management. Thedummy Delegate equals one if the client has opted for delegated managementin at least one contract. We �nd no signi�cant relationship between Delegateand �nancial literacy (results reported in the Online Appendix). In column2, we observe no di�erential impact of literacy depending on whether themanagement is delegated; in particular, our results hold for those clients(approximately 90% of the sample) who do not choose this option.
Turning to the e�ects of the duration of the contract, we construct thedummy Duration that equals one if the client holds no contract youngerthan 8 years. As mentioned previously, assurance vie contracts bene�t fromreduced taxes on capital gains after 8 years. In column 3, we observe that theinteraction with �nancial literacy does not show any signi�cant di�erencealong this dimension. We then consider whether the e�ect is heterogeneousdepending on the fraction of wealth invested in these contracts. The variableFraction is de�ned as the value of the contracts held within the company overthe value of wealth that the household reports in the survey.16 This variablecan be considered a rough measure of how representative these contractsare relative to the rest of a household's assets. We show that there is norelationship between Fraction and literacy (in the Online Appendix) and
15We measure the skewness as E[(r � �r)3=�3r], where �r and �r are the mean and thestandard deviation, respectively, of the returns r in the previous 12 months. We measurethe coskewness as E[(r��r)2(����)=�2r��]; where �� and �� are the mean and the standarddeviation, respectively, of the French stock market index � in the previous 12 months.16Speci�cally, Fraction is the value of the portfolio held in the company as of August
2010 (around the time when the survey was conducted) and the client's total wealth, whichwe estimate as the midpoint in the reported interval.
11
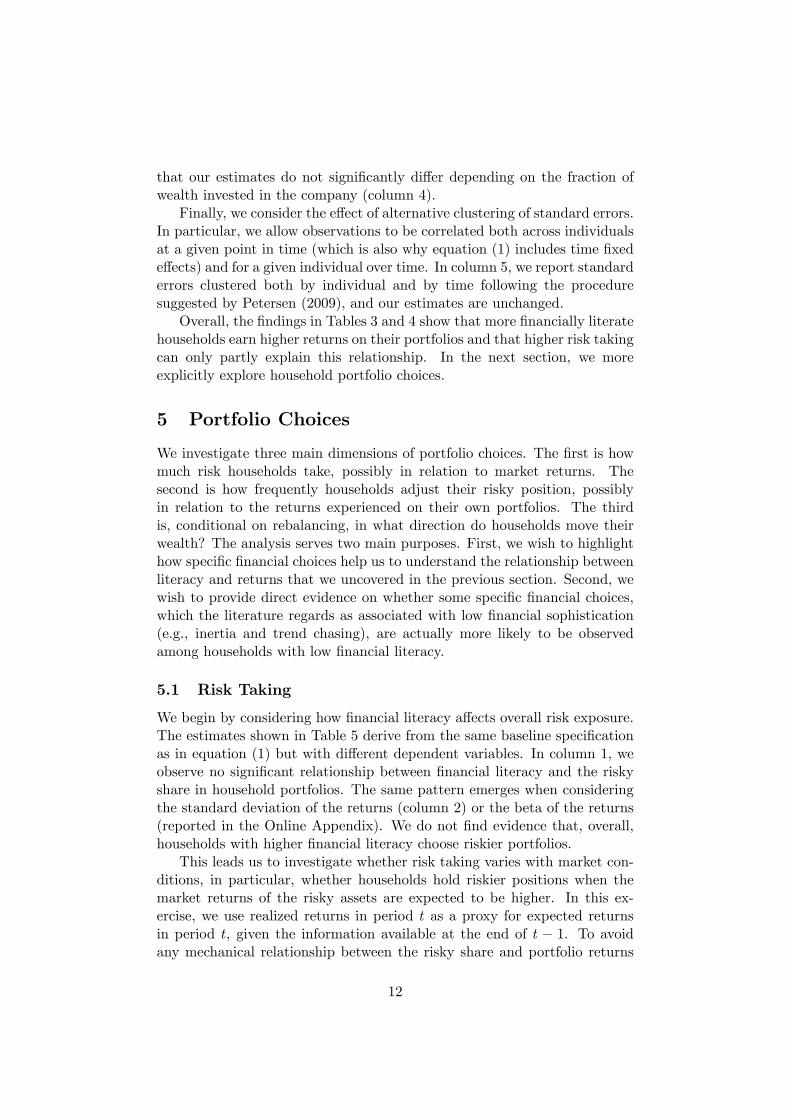
that our estimates do not signi�cantly di�er depending on the fraction ofwealth invested in the company (column 4).
Finally, we consider the e�ect of alternative clustering of standard errors.In particular, we allow observations to be correlated both across individualsat a given point in time (which is also why equation (1) includes time �xede�ects) and for a given individual over time. In column 5, we report standarderrors clustered both by individual and by time following the proceduresuggested by Petersen (2009), and our estimates are unchanged.
Overall, the �ndings in Tables 3 and 4 show that more �nancially literatehouseholds earn higher returns on their portfolios and that higher risk takingcan only partly explain this relationship. In the next section, we moreexplicitly explore household portfolio choices.
5 Portfolio Choices
We investigate three main dimensions of portfolio choices. The �rst is howmuch risk households take, possibly in relation to market returns. Thesecond is how frequently households adjust their risky position, possiblyin relation to the returns experienced on their own portfolios. The thirdis, conditional on rebalancing, in what direction do households move theirwealth? The analysis serves two main purposes. First, we wish to highlighthow speci�c �nancial choices help us to understand the relationship betweenliteracy and returns that we uncovered in the previous section. Second, wewish to provide direct evidence on whether some speci�c �nancial choices,which the literature regards as associated with low �nancial sophistication(e.g., inertia and trend chasing), are actually more likely to be observedamong households with low �nancial literacy.
5.1 Risk Taking
We begin by considering how �nancial literacy a�ects overall risk exposure.The estimates shown in Table 5 derive from the same baseline speci�cationas in equation (1) but with di�erent dependent variables. In column 1, weobserve no signi�cant relationship between �nancial literacy and the riskyshare in household portfolios. The same pattern emerges when consideringthe standard deviation of the returns (column 2) or the beta of the returns(reported in the Online Appendix). We do not �nd evidence that, overall,households with higher �nancial literacy choose riskier portfolios.
This leads us to investigate whether risk taking varies with market con-ditions, in particular, whether households hold riskier positions when themarket returns of the risky assets are expected to be higher. In this ex-ercise, we use realized returns in period t as a proxy for expected returnsin period t, given the information available at the end of t � 1. To avoidany mechanical relationship between the risky share and portfolio returns
12

(whereby, for example, the risky share tends to increase after high returns),the risky share is measured before portfolio returns. Speci�cally, we measurethe risky share on the last day of month t� 1; while the returns in period taccount for changes in the value of the funds between the �rst and the lastday of month t. For example, the risky share is computed as of December31st and the returns correspond to the period January 1st-31st. In thisway, as con�rmed in the Online Appendix, we can rule out any mechanicalrelationship between the two.
We �rst provide descriptive evidence. For each month, we compute theaverage risky share for households with �nancial literacy above the medianin our sample (equal to 4) and the average risky share for those with �nan-cial literacy below the median. The di�erence between the two de�nes thevariable Di�erence in Risky Share, which measures the di�erence in risk ex-posure between more literate and less literate households at the end of t�1.We also construct the variable Market Returns as the di�erence betweenthe average monthly return of risky assets and that of riskless assets at t: InFigure 3, we plot Di�erence in Risky Share and Market Returns over time.We observe that the two curves tend to move together, suggesting that moreliterate households hold a relatively larger risky share when expected returnsare higher. Similarly, Figure 4 plots Di�erence in Risky Share as a functionofMarket Returns and also suggests a positive relationship between the two.
We explore this pattern more systematically in columns 3 and 4 of Table5. We are interested in the interaction term Literacy*Mkt Returns, whichmeasures how the di�erence in risk exposure between more and less so-phisticated households varies with expected market returns. The estimatedcoe�cient is positive, showing that more sophisticated households take morerisk than less sophisticated households when expected returns are higher.
In columns 5 and 6, we report the same regressions in changes instead oflevels. The dependent variable is the change in the risky share relative to theprevious month, and the variable Change Market Returns is the change inrisky returns relative to the previous month. According to these estimates,a 1% increase in Market Returns is associated with a 2% increase in therisky share for each additional unit of �nancial literacy.
These results suggest that one way in which more sophisticated house-holds experience higher returns is by holding a greater exposure to risk whenexpected market returns are higher. This complements the �ndings in Grin-blatt et al. (2012), who show that investors with lower IQs tend to enterthe stock market when returns are low, and with Guiso and Viviano (2015),who show that investors with higher �nancial literacy were more likely toexit the stock market just before the 2008 crash.
13

5.2 Inertia
We further investigate how the dynamics of households' portfolios vary with�nancial literacy. In particular, we consider how much of the observedchange in risk exposure is driven by active rebalancing on the part of thehousehold as opposed to passive changes induced by di�erent returns of riskyvs. riskless assets.
Inertia has been widely documented (Agnew, Balduzzi and Sunden (2003),Madrian and Shea (2001), Ameriks and Zeldes (2004), Brunnermeier andNagel (2008)), and it is typically considered the result of low �nancial abil-ity (Calvet et al. (2009a), Graham et al. (2009), Bilias et al. (2010)). Calvet,Campbell and Sodini (2009b) directly consider a lack of portfolio rebalancingas a measure of a lack of sophistication. Our data allow us to provide directevidence on the relationship between �nancial sophistication and portfolioinertia.
Denote by Xi;t�1 the risky share of individual i in month t�1. If ri;t�rfis the realized excess return of risky assets for individual i between t�1 andt; the passive share is de�ned as
XPi;t =
(1 + ri;t)Xi;t�11 + rf + (ri;t � rf )Xi;t�1
: (2)
If we observe that the risky share moves from Xi;t�1 to Xi;t; we de�ne thepassive change as
�XPi;t = X
Pi;t �Xi;t�1; (3)
the active change as�XA
i;t = Xi;t �XPi;t; (4)
and the total change as
�Xi;t = �XPi;t +�X
Ai;t:
A structural model developed by Calvet et al. (2009a), which we followclosely in the subsequent analysis, allows us to derive measures of inertiaby observing the evolution of �XP
i;t and �XAi;t: The model assumes that
households di�er in their speed of adjustment between the passive risky shareand an unobservable target share. Under some assumptions (detailed in theOnline Appendix), structural parameters such as the speed of adjustmentcan be conveniently estimated in the following equation:
�xi;t = at + b0�xPi;t + b
0wi;t�x
Pi;t + c
0twi;t + w
0i;tDtwi;t +�ui;t: (5)
In (5), �xi;t is the change in the log risky share,
�xi;t = log(Xi;t)� log(Xi;t�1);
14

and �xPi;t is the change in the log passive share,
�xPi;t = log(XPi;t)� log(XP
i;t�1);
where all the changes are expressed in yearly terms. The vector wi;t mayinclude demographic characteristics (age, gender, education, marital status,income, wealth) and portfolio characteristics (returns, standard deviation).The coe�cient b0 measures the fraction of the total change in the risky sharethat is driven by the passive change. The greater portfolio inertia is, thecloser b0 should be to 1: Our main interest is in exploring whether port-folio inertia varies systematically with �nancial literacy, which we includein the set of characteristics wi;t: As is clear from (5), our estimates includeonly portfolios that contain some risky assets (for which Xi;t�1 and Xi;t arepositive); if Xi;t�1 = 0; the passive change in (3) is mechanically zero.
An important observation in Calvet et al. (2009a) is that OLS estimatesof b0 and b in equation (5) may be negatively biased since �x
Pi;t and �ui;t
may be negatively correlated. An instrument for �xPi;t can be de�ned as
�xIVi;t = x̂P � xPt�1;
where
x̂P = ln((1 + ri;t)X
Pt�1
1 + rf + (ri;t � rf )XPt�1):
In words, �xIVi;t is the (log) passive change that would be observed in theevent that the household did not rebalance in period t � 1. As expected,given partial rebalancing, �xIVi;t is indeed highly correlated with �x
Pi;t. The
key assumption for the validity of the instrument is that the returns ri;t areuncorrelated with the error term.
We report our results in Table 6. In column 1, the OLS estimate of �equals 0:38; in column 2, the IV estimate is 0:43: The latter implies that, onaverage, our investors rebalance approximately 57% of their passive changeover 12 months.
Our estimates are comparable to those obtained by Calvet et al. (2009a),who employ the same method on the entire portfolio holdings of Swedishhouseholds and report values of approximately 50%. Brunnermeier andNagel (2008) employ a similar speci�cation using survey data on U.S. house-holds and report a rebalancing of approximately 25% of the passive change.They acknowledge this is likely to be an under-estimation due to the possibil-ity of under-reporting of trades in their data.17 We analyze in greater detail
17Regarding the above-mentioned literature on portfolio inertia, it should be noted thatwe do not observe when portfolios are rebalanced, and thus, we cannot directly estimatethe frequency of rebalancing. Moreover, existing studies indicate some heterogeneity inthis frequency with respect to investment products, from active trading of individualstocks to very infrequent trading in pension accounts (Guiso and Sodini (2013)). In terms
15

individual di�erences in the direction of rebalancing in the next section.Our main interest here is in exploring whether the average e�ect masks
signi�cant heterogeneity with respect to households' �nancial literacy. Cal-vet et al. (2009a) show that the e�ect of passive change is larger for wealth-ier and more educated individuals, which they interpret as re ecting greatersophistication. Our data allow us to directly test the e�ect of �nancial liter-acy, while using demographic characteristics such as wealth and educationas controls.
In columns 3-5, we interact the passive change with our measure of�nancial literacy. According to the IV estimates in column 3, each additionalunit of �nancial literacy decreases the e�ect of the passive change by 5:7%.These magnitudes imply that for the least sophisticated households in oursample (which have �nancial literacy equal to 1), the passive change accountsfor approximately 64% of the total change over 12 months. For the mostsophisticated households (with �nancial literacy equal to 7), the passivechange instead accounts for approximately 30% of the total change.
In column 4, we add interactions between the passive change and de-mographic characteristics. It appears that more educated, older and femaleinvestors display lower levels of inertia. In column 5, we add interactionsbetween the passive change and portfolio characteristics and �nd that port-folios that experience higher returns and higher volatility have lower inertia.The e�ect of �nancial literacy remains. The higher �nancial literacy is, thelower the contribution of the passive change to the total change in risk ex-posure. These �ndings provide direct evidence that more �nancially literatehouseholds more actively rebalance their portfolios.
5.3 Rebalancing
We now explore in greater detail the direction of rebalancing. Trend-chasingbehaviors, for example, are often associated with proxies for unsophisticationsuch as low market experience (Goetzmann and Kumar (2008); Greenwoodand Nagel (2009); Bilias et al. (2010)). Tang (2016) shows that a large frac-tion of traders in 401(k) accounts are na��ve momentum traders and obtainlower performance.
We ask how, conditional on rebalancing, households move their wealthbetween funds that have performed relatively well in the past and funds thathave performed relatively poorly. Consider the ratio of the active changeover the passive change,
Wi;t =�XA
i;t
�XPi;t
; (6)
where �XPi;t and �X
Ai;t are de�ned in equations (3) and (4), respectively.
of horizon, assurance vie products are somewhere in between (their average duration isapproximately 10 years).
16
A positive ratio indicates that an investor is chasing trends in the sense ofinvesting a larger fraction of his wealth in funds that have performed betterin the past. When Wi;t 2 [�1; 0); instead, the investor is rebalancing hisportfolio to compensate for the uctuations in the risky share induced bymarket trends. We say that such an investor acts as a rebalancer.
The rebalancing behavior a�ects how the risky share Xi;t evolves overtime. In the limit, when Wi;t = �1; the household would display a constantrisky share. In Figure 5, we plot the change in risky share �Xi;t over time(through local polynomial regressions): We divide the sample in two: Thesolid line refers to households with �nancial literacy below the median inthe sample; the dotted line refers to households with �nancial literacy belowthe median. We observe that more literate households tend to display lower uctuations in their risky share, suggesting that they may be more likely toact as rebalancers.
We investigate this further in Table 7. In column 1, the dependentvariable Rebalancer is a dummy equal to one if Wi;t 2 [�1; 0) and zero oth-erwise. Our estimates show a positive relationship between �nancial literacyand the probability of being a rebalancer. In magnitude, an additional unitof �nancial literacy increases this probability by 1% relative to an averageof 30%.
The rebalancing decision may depend on expectations about future re-turns, which may in turn be a�ected by experienced returns. For example,Hurd, Van Rooij and Winter (2011) show that recent market uptrends raiseexpectations about future market returns; Vissing-Jorgensen (2004) docu-ments how households change their expectations in response to their ownportfolio returns. As a measure of market trends, in column 2, we includeinstead of time dummies the variable Change Market Returns, as de�nedabove. As a measure of own portfolio returns, in column 3, we include Pas-sive Change, as de�ned in equation (3). Passive Change is positive whenri;t > rf ; that is, when the household has experienced positive excess returnsin its portfolio. We observe that, consistent with the literature, investorsare less likely to act as rebalancers when they experience positive excessreturns and when market trends are positive. The e�ect of �nancial literacyis, however, unchanged: More literate households are more likely to act asrebalancers.
Finally, we investigate whether, by rebalancing, more sophisticated house-holds earn higher returns. We compare the return experienced in month twith the passive returns in month t; de�ned as the return that the house-hold would have experienced had it not rebalanced its portfolio. The vari-able Higher Returns is a dummy equal to one if experienced returns exceedpassive returns and to zero if experienced returns are lower than passivereturns.
As shown in column 4, one additional unit of �nancial literacy increasesthe probability that experienced returns exceed passive returns by 1:2%,
17
relative to an average of 61%. In column 5, we consider the possibility thathigher returns are determined by an increased exposure to risk. Speci�cally,the dummy Higher Risk equals one if the risky share exceeds the passiveshare (as de�ned in (2)). Intuitively, Higher Risk is positively associatedwith Higher Returns; the e�ect of �nancial literacy is, however, unchanged.We also show, in column 6, that the results are not a�ected by excludinghouseholds with Xi;t�1 equal to 0 or 1, for which the passive change ismechanically equal to 0. These results suggest that households with higher�nancial literacy are more likely to buy assets that provide higher returnsthan the assets that they sell.
6 Conclusion
In this paper, we have exploited a unique dataset in which administrativepanel data on portfolio choices are combined with survey measures of �-nancial literacy. We have provided a new set of results on the relationshipamong �nancial literacy, portfolio choices and returns, emphasizing in par-ticular how more and less sophisticated investors display distinct portfoliodynamics.
Our analysis lacks an exogenous variation in �nancial literacy that wouldallow us to cleanly establish its causal e�ects. One may argue, for example,that individuals who are particularly lucky or unlucky in their investmentsare induced to acquire �nancial literacy, meaning that the causality would gofrom returns to literacy. We note, however, that the more literate householdsin our sample do not experience more extreme returns in the period beforeour survey (see the Online Appendix). Our data also allow us to control for�nancial wealth, which may help to reduce issues of reverse causality (Clarket al. (2015)), and more generally for a broad set of demographic charac-teristics that may be correlated with the incentives to invest in �nancialliteracy (Lusardi et al. (2017)). Our estimates are typically strengthenedby the inclusion of these controls. Finally, several studies have employedvarious instruments for �nancial literacy and shown that IV estimates con-�rm (and sometimes strengthen) the case for a causal relationship betweenliteracy and returns.18
The aim of this study has been to uncover novel mechanisms relating�nancial literacy to �nancial outcomes. In this way, we believe that ourresults can inform the substantial policy debate on the e�ects of �nancialeducation (Greenspan (2002); Bernanke (2006); Schuchardt, Hanna, Hira,Lyons, Palmer and Xiao (2009); Willis (2011)).
18See Behrman, Mitchell, Soo and Bravo (2012) and Cole, Paulson and Shastry (2014)for recent contributions and Lusardi and Mitchell (2014) for a review
18
References
Agarwal, S., Ben-David, I. and Yao, V. (2017), `Systematic mistakes inthe mortgage market and lack of �nancial sophistication', Journal ofFinancial Economics 123(1), 42{58.
Agarwal, S. and Mazumder, B. (2013), `Cognitive abilities and household�nancial decision making', American Economic Journal: Applied Eco-nomics 5(1), 193{207.
Agnew, J., Balduzzi, P. and Sunden, A. (2003), `Portfolio choice and tradingin a large 401 (k) plan', American Economic Review 93(1), 193{215.
Almenberg, J. and Dreber, A. (2015), `Gender, stock market participationand �nancial literacy', Economics Letters 137, 140{142.
Ameriks, J. and Zeldes, S. P. (2004), `How do household portfolio sharesvary with age?', working paper, Columbia University.
Arrondel, L., Borgy, V. and Savignac, F. (2012), `L'�epargnant au bord de lacrise', Revue d'�economie �nanci�ere 108(4), 69{90.
Arrondel, L., Debbich, M. and Savignac, F. (2015), `Stockholding in france:the role of �nancial literacy and information', Applied Economics Let-ters 22(16), 1315{1319.
Barber, B. and Odean, T. (2013), The behavior of individual investors, in`Handbook of the Economics of Finance', Vol. 2, Elsevier, pp. 1533{1570.
Behrman, J., Mitchell, O., Soo, C. and Bravo, D. (2012), `How �nancialliteracy a�ects household wealth accumulation', American EconomicReview 102(3), 300{304.
Bernanke, B. S. (2006), `Financial literacy', Testimony Before the Com-mittee on Banking, Housing, and Urban A�airs of the United StatesSenate, May 23, 2006.
Bianchi, M. and Tallon, J.-M. (2016), `Ambiguity preferences and portfoliochoices: Evidence from the �eld', working paper, Toulouse School ofEconomics.
Bilias, Y., Georgarakos, D. and Haliassos, M. (2010), `Portfolio inertiaand stock market uctuations', Journal of Money, Credit and Bank-ing 42(4), 715{742.
Brunnermeier, M. K. and Nagel, S. (2008), `Do wealth uctuations generatetime-varying risk aversion? micro-evidence on individuals', AmericanEconomic Review 98(3), 713{36.
19
Calvet, L. E., Campbell, J. Y. and Sodini, P. (2007), `Down or out: Assessingthe welfare costs of household investment mistakes', Journal of PoliticalEconomy 115(5), 707{747.
Calvet, L. E., Campbell, J. Y. and Sodini, P. (2009a), `Fight or ight? port-folio rebalancing by individual investors', Quarterly Journal of Eco-nomics 124(1), 301{348.
Calvet, L. E., Campbell, J. Y. and Sodini, P. (2009b), `Measuring the�nancial sophistication of households', American Economic Review99(2), 393{398.
Campbell, J. Y. (2006), `Household �nance', Journal of Finance61(4), 1553{1604.
Christelis, D., Jappelli, T. and Padula, M. (2010), `Cognitive abilities andportfolio choice', European Economic Review 54(1), 18{38.
Clark, R. L., Lusardi, A. and Mitchell, O. S. (2015), `Financial knowledgeand 401 (k) investment performance: a case study', Journal of PensionEconomics and Finance pp. 1{24.
Cole, S., Paulson, A. and Shastry, G. K. (2014), `Smart money? the ef-fect of education on �nancial outcomes', Review of Financial Studies27(7), 2022{2051.
Dorn, D. and Huberman, G. (2005), `Talk and action: What individualinvestors say and what they do', Review of Finance 9(4), 437{481.
Fonseca, R., Mullen, K. J., Zamarro, G. and Zissimopoulos, J. (2012), `Whatexplains the gender gap in �nancial literacy? the role of householddecision making', Journal of Consumer A�airs 46(1).
Gerardi, K., Goette, L. and Meier, S. (2013), `Numerical ability predictsmortgage default', Proceedings of the National Academy of Sciences110(28), 11267{11271.
Goetzmann, W. N. and Kumar, A. (2008), `Equity portfolio diversi�cation',Review of Finance 12(3), 433{463.
Graham, J. R., Harvey, C. R. and Huang, H. (2009), `Investor competence,trading frequency, and home bias', Management Science 55(7), 1094{1106.
Greenspan, A. (2002), `Financial literacy: A tool for economic progress',The Futurist 36(4).
Greenwood, R. and Nagel, S. (2009), `Inexperienced investors and bubbles',Journal of Financial Economics 93(2), 239 { 258.
20
Grinblatt, M., Keloharju, M. and Linnainmaa, J. (2011), `Iq and stock mar-ket participation', Journal of Finance 66(6), 2121{2164.
Grinblatt, M., Keloharju, M. and Linnainmaa, J. T. (2012), `Iq, trading be-havior, and performance', Journal of Financial Economics 104(2), 339{362.
Guiso, L. and Jappelli, T. (2008), `Financial literacy and portfolio diversi�-cation', CSEF Working Paper 212.
Guiso, L. and Sodini, P. (2013), Household �nance: An emerging �eld, in`Handbook of the Economics of Finance', Vol. 2, Elsevier, pp. 1397{1532.
Guiso, L. and Viviano, E. (2015), `How much can �nancial literacy help?',Review of Finance 19(4), 1347{1382.
Hastings, J. S., Madrian, B. C. and Skimmyhorn, W. L. (2013), `Financialliteracy, �nancial education, and economic outcomes', Annual Reviewof Economics 5(1), 347{373.
Hurd, M., Van Rooij, M. and Winter, J. (2011), `Stock market expectationsof dutch households', Journal of Applied Econometrics 26(3), 416{436.
Korniotis, G. M. and Kumar, A. (2013), `Do portfolio distortions re ectsuperior information or psychological biases?', Journal of Financial andQuantitative Analysis 48(01), 1{45.
Lusardi, A., Michaud, P.-C. and Mitchell, O. S. (2017), `Optimal �nan-cial knowledge and wealth inequality', Journal of Political Economy125(2), 431{477.
Lusardi, A. and Mitchell, O. S. (2008), `Planning and �nancial literacy: Howdo women fare?', American Economic Review 98(2), 413{17.
Lusardi, A. and Mitchell, O. S. (2011), `Financial literacy around the world:an overview', Journal of Pension Economics and Finance 10(04), 497{508.
Lusardi, A. and Mitchell, O. S. (2014), `The economic importance of �nan-cial literacy: Theory and evidence', Journal of Economic Literature52(1), 5{44.
Madrian, B. C. and Shea, D. F. (2001), `The power of suggestion: Inertiain 401 (k) participation and savings behavior', Quarterly Journal ofEconomics 116(4), 1149{1187.
21
Petersen, M. A. (2009), `Estimating standard errors in �nance panel datasets: Comparing approaches', Review of Financial Studies 22(1), 435{480.
Riedl, A. and Smeets, P. (2017), `Why do investors hold socially responsiblemutual funds?', Journal of Finance - forthcoming .
Schuchardt, J., Hanna, S. D., Hira, T. K., Lyons, A. C., Palmer, L. andXiao, J. J. (2009), `Financial literacy and education research priorities',Journal of Financial Counseling and Planning 20(1), 84{95.
Tang, N. (2016), `The overlooked momentum traders in 401 (k) plans', Fi-nancial Services Review 25(1), 51{73.
Van Rooij, M., Lusardi, A. and Alessie, R. (2011), `Financial liter-acy and stock market participation', Journal of Financial Economics101(2), 449{472.
Vissing-Jorgensen, A. (2004), Perspectives on behavioral �nance: Does "ir-rationality" disappear with wealth? evidence from expectations andactions, in `NBER Macroeconomics Annual 2003, Volume 18', MITPress, pp. 139{208.
Von Gaudecker, H.-M. (2015), `How does household portfolio diversi�cationvary with �nancial literacy and �nancial advice?', Journal of Finance70(2), 489{507.
Willis, L. E. (2011), `The �nancial education fallacy', American EconomicReview 101(3), pp. 429{434.
7 Appendix
7.1 Description of variables
Financial LiteracyThe variable Financial Literacy equals the number of correct answers to
the following questions:1) Suppose that you have 1000 e in a savings account that o�ers a return
of 2% per year. After �ve years, assuming that you have not touched yourinitial deposit, how much would you own? a) Less than 1100e; b)Exactly 1100e; c) More than 1100e; d) I don't know.
2) Livret A are used to �nance social housing.3) In 2008, the value of the CAC 40 Index of the largest listed companies
decreased by more than 50%.4) The value of the CAC 40 Index increased during 2009.
22

5) A share gives the right to �xed revenue.6) Assurance vie contracts bene�t from special �scal treatment.7) 40 divided by one-half, plus 10 equals 30.
For questions 2-7, the choice was among a) True; b) False; and c) I don'tknow. The correct answers were (c), (a), (b), (a), (b), (a), and (b), respec-tively. The percentages of correct answers were 53%, 57%, 62%, 63%, 89%,84%, and 38%, respectively. We refer to the Online Appendix for a discus-sion of these questions and for alternative measures of �nancial literacy.
Subjective LiteracyThe variable is based on the following question: "In terms of correct
answers, do you think that you are above or below the average of the otherrespondents?" The variable Subjective Literacy takes the value 1 if the sub-ject declared "above the average", 0 if he declared "average", and �1 if hedeclared "below the average."
Risk AversionThe variable is based on the following questions: "You have two options:
(a) win 400 euros for sure vs. (b) win 1000 euros with a 50% chance andzero otherwise. Which one would you choose?" If (a) is chosen, we o�er achoice between (c) win 300 euros for sure vs. (d) win 1000 euros with a 50%chance and zero otherwise. If (b) is chosen, we instead o�er a choice between(e) win 500 euros for sure vs. (f) win 1000 euros with a 50% chance andzero otherwise. We construct the variable Risk Aversion that takes value 4if (a) and (c) are chosen, 3 if (a) and (d) are chosen, 2 if (b) and (e) arechosen, or 1 if (b) and (f) are chosen.
Ambig AversionThe variable is based on the following questions: "You have two options:
(a) win 1000 euros with a completely unknown probability vs. (b) win 1000euros with a 50% chance and zero otherwise. Which one would you choose?"If (a) is chosen, we propose (c) win 1000 euros with a completely unknownprobability vs. (d) win 1000 euros with a 60% chance and zero otherwise.If (b) is chosen, we propose (e) win 1000 euros with a completely unknownprobability vs. (f) win 1000 euros with a 40% chance and zero otherwise.We construct the variable Ambig Aversion that takes value 1 if (a) and (c)are chosen, 2 if (a) and (d) are chosen, 3 if (b) and (e) are chosen, or 4 if(b) and (f) are chosen.
ImpatientThe variable is based on the following question: "You can choose be-
tween 1) 1000 euros now; 2) 1020 euros in a month. Which one would youchoose?" The variable Impatient is a dummy equal to 1 if 1) was chosen.
23

EducationThe variable takes value 1 if no formal education is reported, 2 refers to
vocational training, 3 refers to baccalaureat, 4 refers to a 2-year post bacdiploma, 5 refers to a 3-year post bac diploma, 6 refers to a 4-year post bacdiploma, and 7 refers to a 5-year post bac diploma or above.
AgeThe variable takes value 1 if the respondent is less than 30 years old, 2
refers to between 30 and 44 years old, 3 refers to between 45 and 64 yearsold, and 4 refers to 65 years or older.
IncomeMonthly net revenues of the household (in euros). A value of 1 corre-
sponds to less than 1000, 2 indicates between 1000 and 1499, 3 indicatesbetween 1500 and 1999, 4 indicates between 2000 and 2999, 5 indicates be-tween 3000 and 4999, 6 indicates 5000 and 6999, 7 indicates between 7000and 9999, and 8 indicates over 10,000.
WealthTotal wealth of the household (in euros). A value of 1 corresponds to less
than 8000, 2 indicates between 8000 and 14,999, 3 indicates between 15,000and 39,999, 4 indicates between 40,000 and 79,999, 5 indicates between80,000 and 149,999, 6 indicates between 150,000 and 224,999, 7 indicatesbetween 225,000 and 299,999, 8 indicates between 300,000 and 449,999, 9indicates between 450,000 and 749,999, 10 indicates between 750,000 and999,999, and 11 indicates over 1 million.
FractionValue of the portfolio held in the company as of August 2010 over the
client's total wealth, estimated as the midpoint in the reported interval,except for the highest interval for which we consider the minimum of theinterval.
Stock HoldThe variable is based on the following question: "Do you hold stocks in
your portfolio?"
Fin ProductsThe variable Fin Products is equal to the number of di�erent �nan-
cial instruments held by the household. It is based on the following ques-tion: "Which of the following �nancial products do you hold? 1) Stocks(except PEA); 2) Bonds (except PEA); 3) PEA (securities account with �s-cal bene�ts); 4) Livret A (savings products with publicly �xed returns); 5)CEL/PEL (savings accounts with preferential mortgage rates); 6) Other sav-ing accounts; 7) Retirement plans; 8) Employee savings plans; 9) Assurancevie; 10) Mutual funds (except PEA); and 11) Other placements."
24
7.2 Figures
Figure 1: Returns of UC and Euro Funds
Note: This �gure plots the average monthly returns of euro funds and uc funds in our
sample period, from September 2002 to April 2011.
25
Figure 2: Financial Literacy and Portfolio Returns
Note: This �gure plots annual returns (in %) over our 1-7 index of �nancial literacy.
The middle solid line corresponds to linear estimates, the upper and lower solid lines draw
the 95% con�dence interval. The dotted line corresponds to non-parametric estimates
through local polynomial regressions (local-mean smoothing estimated with the Epanech-
nikov kernel and the rule-of-thumb bandwidth.)
26
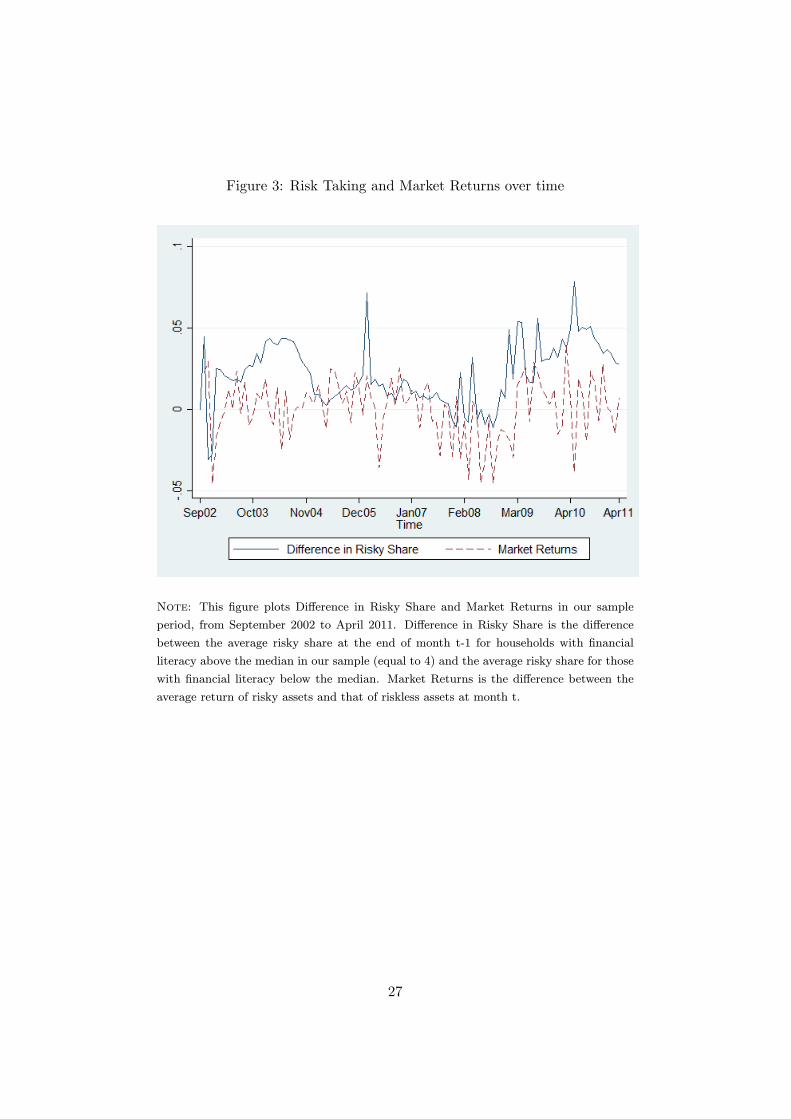
Figure 3: Risk Taking and Market Returns over time
Note: This �gure plots Di�erence in Risky Share and Market Returns in our sample
period, from September 2002 to April 2011. Di�erence in Risky Share is the di�erence
between the average risky share at the end of month t-1 for households with �nancial
literacy above the median in our sample (equal to 4) and the average risky share for those
with �nancial literacy below the median. Market Returns is the di�erence between the
average return of risky assets and that of riskless assets at month t.
27
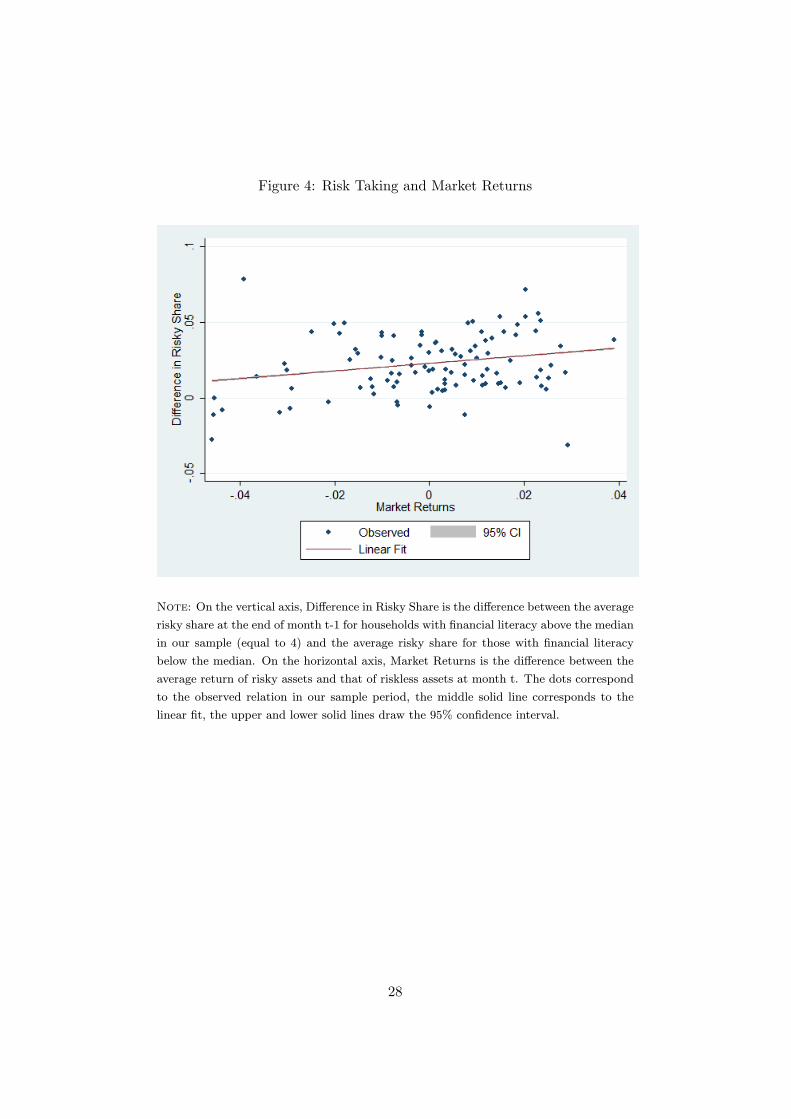
Figure 4: Risk Taking and Market Returns
Note: On the vertical axis, Di�erence in Risky Share is the di�erence between the average
risky share at the end of month t-1 for households with �nancial literacy above the median
in our sample (equal to 4) and the average risky share for those with �nancial literacy
below the median. On the horizontal axis, Market Returns is the di�erence between the
average return of risky assets and that of riskless assets at month t. The dots correspond
to the observed relation in our sample period, the middle solid line corresponds to the
linear �t, the upper and lower solid lines draw the 95% con�dence interval.
28
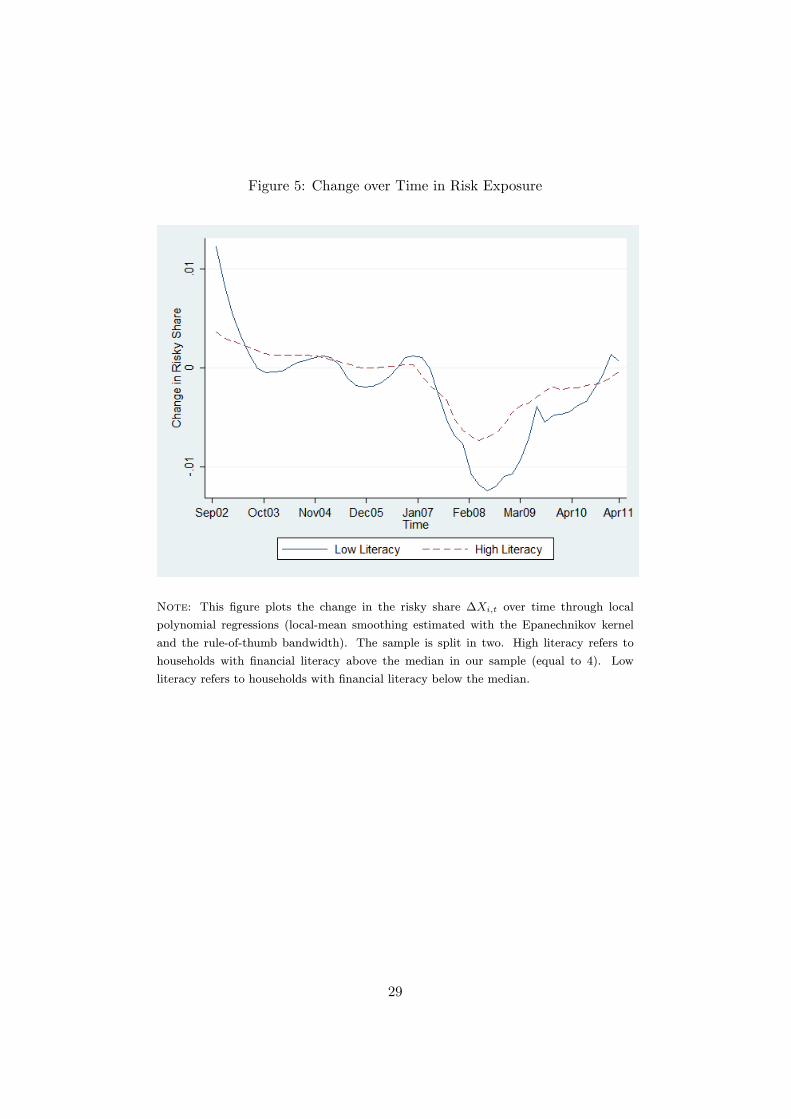
Figure 5: Change over Time in Risk Exposure
Note: This �gure plots the change in the risky share �Xi;t over time through local
polynomial regressions (local-mean smoothing estimated with the Epanechnikov kernel
and the rule-of-thumb bandwidth). The sample is split in two. High literacy refers to
households with �nancial literacy above the median in our sample (equal to 4). Low
literacy refers to households with �nancial literacy below the median.
29
7.3 Tables
Table 1: Summary Statistics
Variable Obs. Mean Std. Dev. Min Max
Financial Literacy 511 4.427 1.471 1 7Subjective Literacy 502 -0.102 0.884 -1 1Risk Averse 511 0.384 0.487 0 1Ambig Averse 511 0.389 0.488 0 1Impatient 511 0.654 0.476 0 1Education 501 4.421 1.886 1 7Married 511 0.763 0.426 0 1Age 511 2.613 0.753 1 4Female 511 0.472 0.500 0 1Income 494 4.532 1.553 1 8Wealth 469 6.885 2.467 1 11Stock Hold 511 0.348 0.477 0 1Fin Product 511 4.168 2.104 0 11Fraction 438 0.103 0.137 0.0001 0.678
Portfolio Returns (in %) 39969 4.195 4.820 -63.334 84.220Risky Share 39892 0.231 0.286 0 1Std Dev (in %) 39430 2.378 2.455 0 59.504Beta 40083 0.097 0.174 -0.126 1.180Skewness 38121 -0.070 0.686 -3.606 3.606Coskewness 37435 -0.073 0.473 -4.096 3.916Crisis 40084 0.183 0.387 0.000 1.000Delegate 40084 0.097 0.296 0 1Duration 39479 0.496 0.500 0 1Market Returns (in %) 39707 0.037 2.177 -5.179 3.996Change in Risky Share 38827 -0.002 0.077 -1 1Change in Market Returns 39707 0.001 0.029 -0.058 0.059Total Change (log) 16455 -0.011 0.547 -7.752 6.709Passive Change (log) 13957 -0.104 0.521 -7.357 6.762Passive Change (IV) 13927 -0.106 0.486 -6.051 5.225Rebalancer 21611 0.307 0.461 0 1Higher Return 20531 0.613 0.487 0 1Higher Risk 20531 0.418 0.493 0 1
Note: The table reports summary statistics for all variables used in theregressions. A de�nition of these variables can be found in the text and inAppendix 7.1.
30
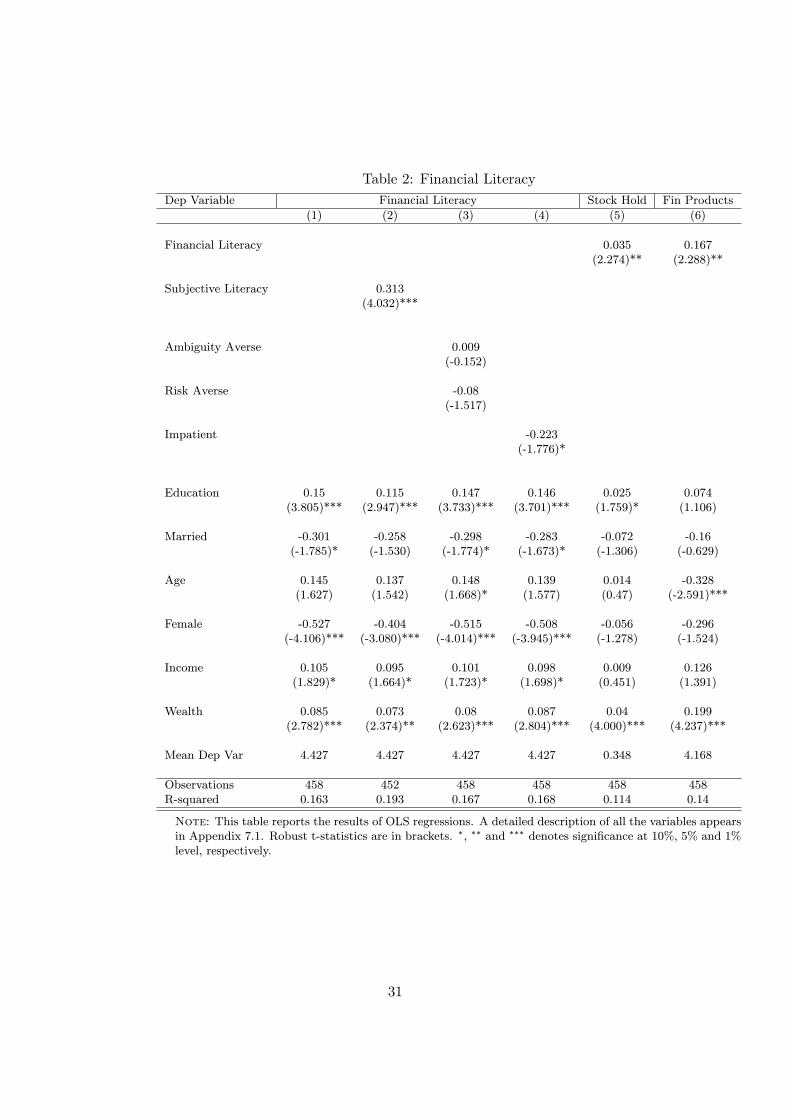
Table 2: Financial Literacy
Dep Variable Financial Literacy Stock Hold Fin Products
(1) (2) (3) (4) (5) (6)
Financial Literacy 0.035 0.167(2.274)** (2.288)**
Subjective Literacy 0.313(4.032)***
Ambiguity Averse 0.009(-0.152)
Risk Averse -0.08(-1.517)
Impatient -0.223(-1.776)*
Education 0.15 0.115 0.147 0.146 0.025 0.074(3.805)*** (2.947)*** (3.733)*** (3.701)*** (1.759)* (1.106)
Married -0.301 -0.258 -0.298 -0.283 -0.072 -0.16(-1.785)* (-1.530) (-1.774)* (-1.673)* (-1.306) (-0.629)
Age 0.145 0.137 0.148 0.139 0.014 -0.328(1.627) (1.542) (1.668)* (1.577) (0.47) (-2.591)***
Female -0.527 -0.404 -0.515 -0.508 -0.056 -0.296(-4.106)*** (-3.080)*** (-4.014)*** (-3.945)*** (-1.278) (-1.524)
Income 0.105 0.095 0.101 0.098 0.009 0.126(1.829)* (1.664)* (1.723)* (1.698)* (0.451) (1.391)
Wealth 0.085 0.073 0.08 0.087 0.04 0.199(2.782)*** (2.374)** (2.623)*** (2.804)*** (4.000)*** (4.237)***
Mean Dep Var 4.427 4.427 4.427 4.427 0.348 4.168
Observations 458 452 458 458 458 458R-squared 0.163 0.193 0.167 0.168 0.114 0.14
Note: This table reports the results of OLS regressions. A detailed description of all the variables appearsin Appendix 7.1. Robust t-statistics are in brackets. �, �� and ��� denotes signi�cance at 10%, 5% and 1%level, respectively.
31
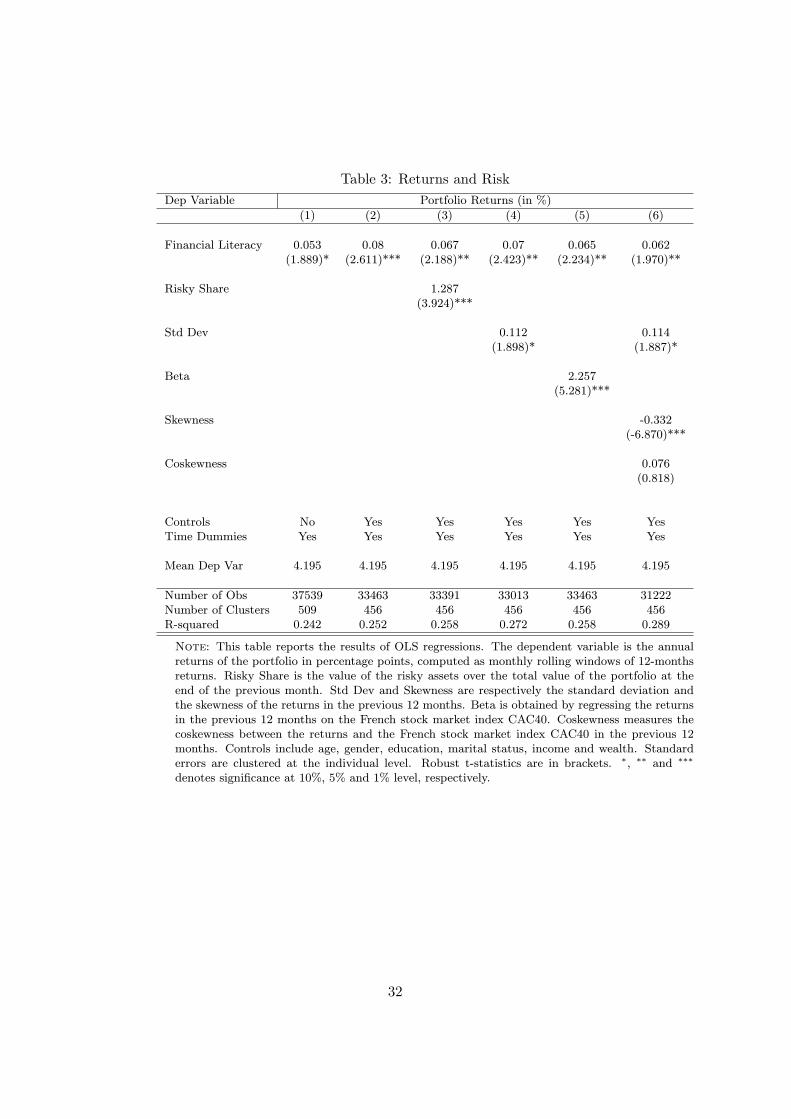
Table 3: Returns and Risk
Dep Variable Portfolio Returns (in %)
(1) (2) (3) (4) (5) (6)
Financial Literacy 0.053 0.08 0.067 0.07 0.065 0.062(1.889)* (2.611)*** (2.188)** (2.423)** (2.234)** (1.970)**
Risky Share 1.287(3.924)***
Std Dev 0.112 0.114(1.898)* (1.887)*
Beta 2.257(5.281)***
Skewness -0.332(-6.870)***
Coskewness 0.076(0.818)
Controls No Yes Yes Yes Yes YesTime Dummies Yes Yes Yes Yes Yes Yes
Mean Dep Var 4.195 4.195 4.195 4.195 4.195 4.195
Number of Obs 37539 33463 33391 33013 33463 31222Number of Clusters 509 456 456 456 456 456R-squared 0.242 0.252 0.258 0.272 0.258 0.289
Note: This table reports the results of OLS regressions. The dependent variable is the annualreturns of the portfolio in percentage points, computed as monthly rolling windows of 12-monthsreturns. Risky Share is the value of the risky assets over the total value of the portfolio at theend of the previous month. Std Dev and Skewness are respectively the standard deviation andthe skewness of the returns in the previous 12 months. Beta is obtained by regressing the returnsin the previous 12 months on the French stock market index CAC40. Coskewness measures thecoskewness between the returns and the French stock market index CAC40 in the previous 12months. Controls include age, gender, education, marital status, income and wealth. Standarderrors are clustered at the individual level. Robust t-statistics are in brackets. �, �� and ���
denotes signi�cance at 10%, 5% and 1% level, respectively.
32
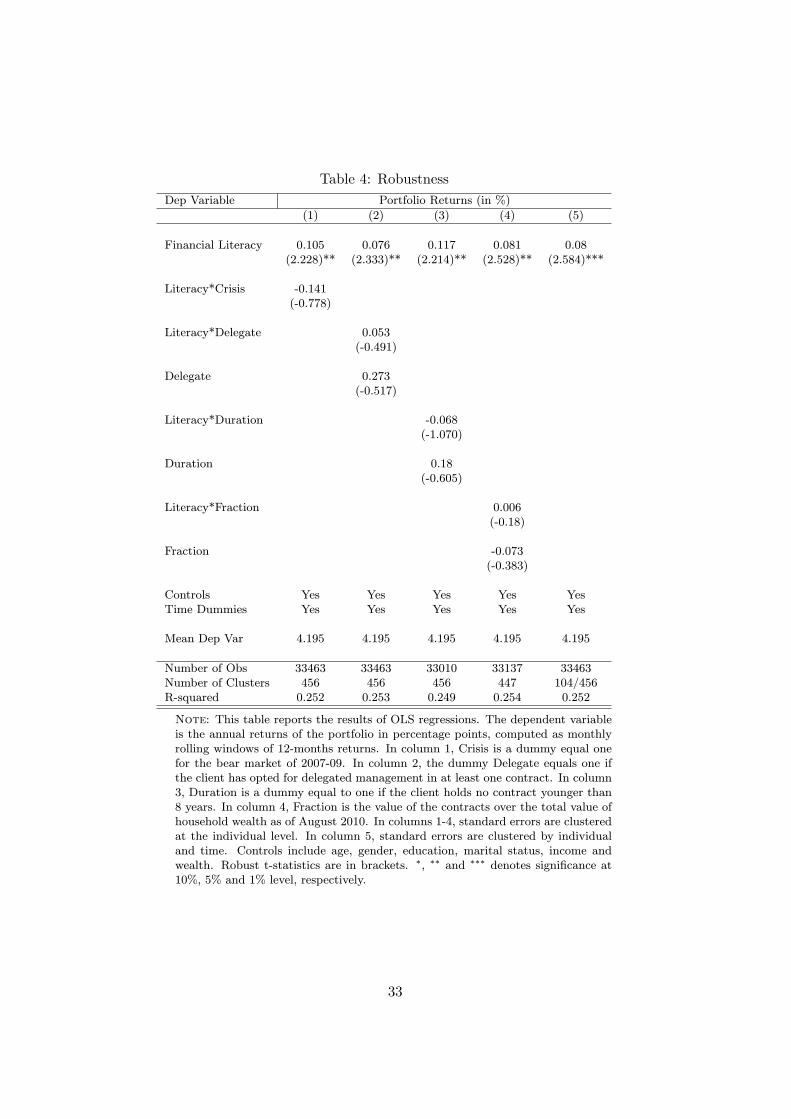
Table 4: Robustness
Dep Variable Portfolio Returns (in %)
(1) (2) (3) (4) (5)
Financial Literacy 0.105 0.076 0.117 0.081 0.08(2.228)** (2.333)** (2.214)** (2.528)** (2.584)***
Literacy*Crisis -0.141(-0.778)
Literacy*Delegate 0.053(-0.491)
Delegate 0.273(-0.517)
Literacy*Duration -0.068(-1.070)
Duration 0.18(-0.605)
Literacy*Fraction 0.006(-0.18)
Fraction -0.073(-0.383)
Controls Yes Yes Yes Yes YesTime Dummies Yes Yes Yes Yes Yes
Mean Dep Var 4.195 4.195 4.195 4.195 4.195
Number of Obs 33463 33463 33010 33137 33463Number of Clusters 456 456 456 447 104/456R-squared 0.252 0.253 0.249 0.254 0.252
Note: This table reports the results of OLS regressions. The dependent variableis the annual returns of the portfolio in percentage points, computed as monthlyrolling windows of 12-months returns. In column 1, Crisis is a dummy equal onefor the bear market of 2007-09. In column 2, the dummy Delegate equals one ifthe client has opted for delegated management in at least one contract. In column3, Duration is a dummy equal to one if the client holds no contract younger than8 years. In column 4, Fraction is the value of the contracts over the total value ofhousehold wealth as of August 2010. In columns 1-4, standard errors are clusteredat the individual level. In column 5, standard errors are clustered by individualand time. Controls include age, gender, education, marital status, income andwealth. Robust t-statistics are in brackets. �, �� and ��� denotes signi�cance at10%, 5% and 1% level, respectively.
33
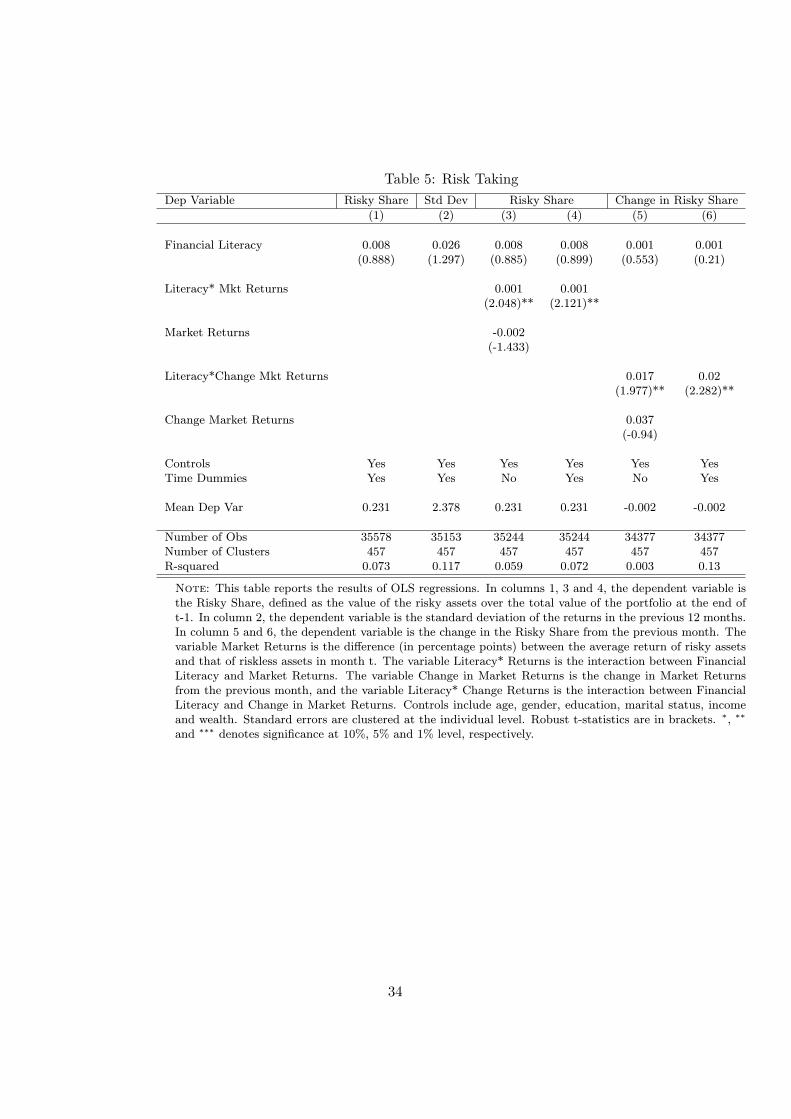
Table 5: Risk Taking
Dep Variable Risky Share Std Dev Risky Share Change in Risky Share
(1) (2) (3) (4) (5) (6)
Financial Literacy 0.008 0.026 0.008 0.008 0.001 0.001(0.888) (1.297) (0.885) (0.899) (0.553) (0.21)
Literacy* Mkt Returns 0.001 0.001(2.048)** (2.121)**
Market Returns -0.002(-1.433)
Literacy*Change Mkt Returns 0.017 0.02(1.977)** (2.282)**
Change Market Returns 0.037(-0.94)
Controls Yes Yes Yes Yes Yes YesTime Dummies Yes Yes No Yes No Yes
Mean Dep Var 0.231 2.378 0.231 0.231 -0.002 -0.002
Number of Obs 35578 35153 35244 35244 34377 34377Number of Clusters 457 457 457 457 457 457R-squared 0.073 0.117 0.059 0.072 0.003 0.13
Note: This table reports the results of OLS regressions. In columns 1, 3 and 4, the dependent variable isthe Risky Share, de�ned as the value of the risky assets over the total value of the portfolio at the end oft-1. In column 2, the dependent variable is the standard deviation of the returns in the previous 12 months.In column 5 and 6, the dependent variable is the change in the Risky Share from the previous month. Thevariable Market Returns is the di�erence (in percentage points) between the average return of risky assetsand that of riskless assets in month t. The variable Literacy* Returns is the interaction between FinancialLiteracy and Market Returns. The variable Change in Market Returns is the change in Market Returnsfrom the previous month, and the variable Literacy* Change Returns is the interaction between FinancialLiteracy and Change in Market Returns. Controls include age, gender, education, marital status, incomeand wealth. Standard errors are clustered at the individual level. Robust t-statistics are in brackets. �, ��
and ��� denotes signi�cance at 10%, 5% and 1% level, respectively.
34
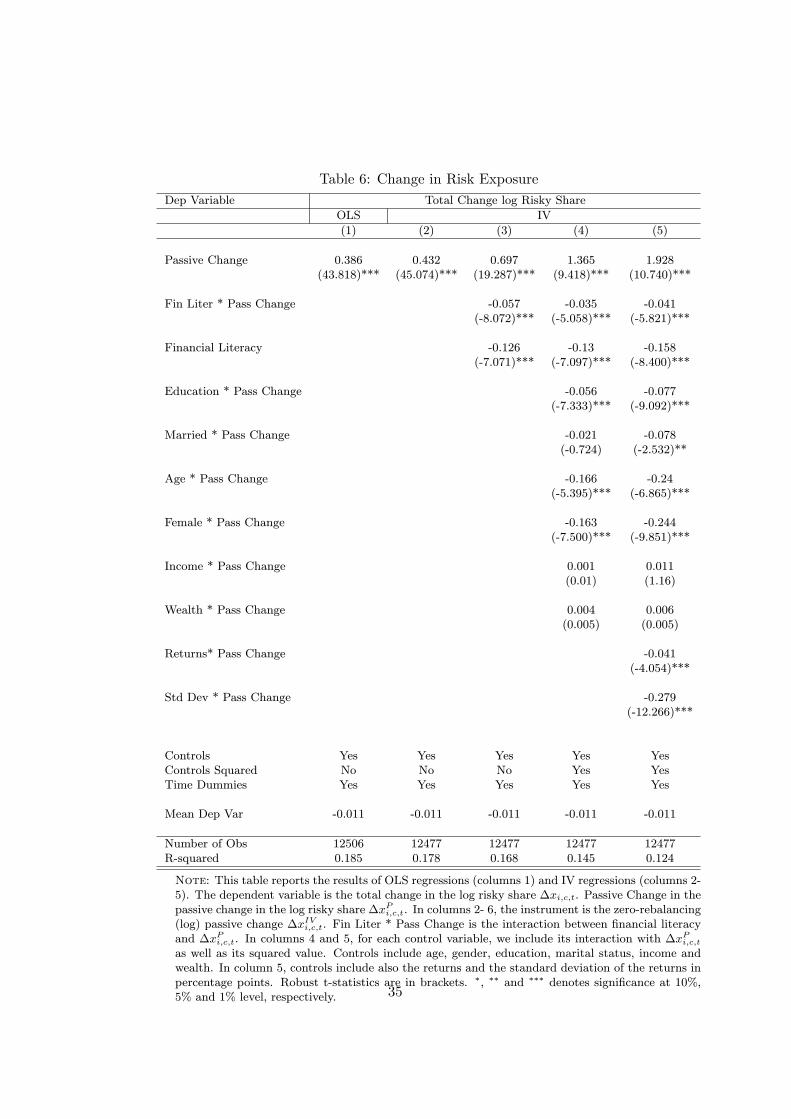
Table 6: Change in Risk Exposure
Dep Variable Total Change log Risky Share
OLS IV
(1) (2) (3) (4) (5)
Passive Change 0.386 0.432 0.697 1.365 1.928(43.818)*** (45.074)*** (19.287)*** (9.418)*** (10.740)***
Fin Liter * Pass Change -0.057 -0.035 -0.041(-8.072)*** (-5.058)*** (-5.821)***
Financial Literacy -0.126 -0.13 -0.158(-7.071)*** (-7.097)*** (-8.400)***
Education * Pass Change -0.056 -0.077(-7.333)*** (-9.092)***
Married * Pass Change -0.021 -0.078(-0.724) (-2.532)**
Age * Pass Change -0.166 -0.24(-5.395)*** (-6.865)***
Female * Pass Change -0.163 -0.244(-7.500)*** (-9.851)***
Income * Pass Change 0.001 0.011(0.01) (1.16)
Wealth * Pass Change 0.004 0.006(0.005) (0.005)
Returns* Pass Change -0.041(-4.054)***
Std Dev * Pass Change -0.279(-12.266)***
Controls Yes Yes Yes Yes YesControls Squared No No No Yes YesTime Dummies Yes Yes Yes Yes Yes
Mean Dep Var -0.011 -0.011 -0.011 -0.011 -0.011
Number of Obs 12506 12477 12477 12477 12477R-squared 0.185 0.178 0.168 0.145 0.124
Note: This table reports the results of OLS regressions (columns 1) and IV regressions (columns 2-5). The dependent variable is the total change in the log risky share �xi;c;t. Passive Change in thepassive change in the log risky share �xPi;c;t. In columns 2- 6, the instrument is the zero-rebalancing(log) passive change �xIVi;c;t. Fin Liter * Pass Change is the interaction between �nancial literacyand �xPi;c;t. In columns 4 and 5, for each control variable, we include its interaction with �x
Pi;c;t
as well as its squared value. Controls include age, gender, education, marital status, income andwealth. In column 5, controls include also the returns and the standard deviation of the returns inpercentage points. Robust t-statistics are in brackets. �, �� and ��� denotes signi�cance at 10%,5% and 1% level, respectively. 35
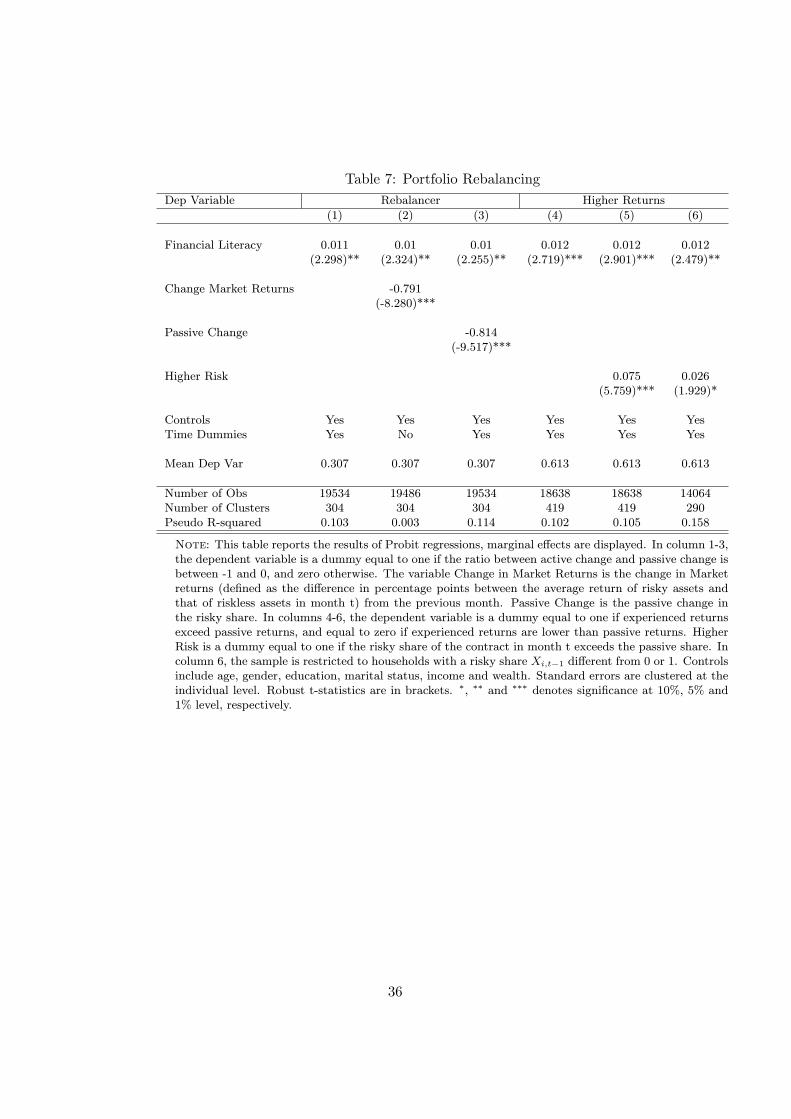
Table 7: Portfolio Rebalancing
Dep Variable Rebalancer Higher Returns
(1) (2) (3) (4) (5) (6)
Financial Literacy 0.011 0.01 0.01 0.012 0.012 0.012(2.298)** (2.324)** (2.255)** (2.719)*** (2.901)*** (2.479)**
Change Market Returns -0.791(-8.280)***
Passive Change -0.814(-9.517)***
Higher Risk 0.075 0.026(5.759)*** (1.929)*
Controls Yes Yes Yes Yes Yes YesTime Dummies Yes No Yes Yes Yes Yes
Mean Dep Var 0.307 0.307 0.307 0.613 0.613 0.613
Number of Obs 19534 19486 19534 18638 18638 14064Number of Clusters 304 304 304 419 419 290Pseudo R-squared 0.103 0.003 0.114 0.102 0.105 0.158
Note: This table reports the results of Probit regressions, marginal e�ects are displayed. In column 1-3,the dependent variable is a dummy equal to one if the ratio between active change and passive change isbetween -1 and 0, and zero otherwise. The variable Change in Market Returns is the change in Marketreturns (de�ned as the di�erence in percentage points between the average return of risky assets andthat of riskless assets in month t) from the previous month. Passive Change is the passive change inthe risky share. In columns 4-6, the dependent variable is a dummy equal to one if experienced returnsexceed passive returns, and equal to zero if experienced returns are lower than passive returns. HigherRisk is a dummy equal to one if the risky share of the contract in month t exceeds the passive share. Incolumn 6, the sample is restricted to households with a risky share Xi;t�1 di�erent from 0 or 1. Controlsinclude age, gender, education, marital status, income and wealth. Standard errors are clustered at theindividual level. Robust t-statistics are in brackets. �, �� and ��� denotes signi�cance at 10%, 5% and1% level, respectively.
36
8 Online Appendix
8.1 Alternative Measures of Financial Literacy
Our variable Financial Literacy is based on 7 questions, some of which arecommon to the rest of the literature and some of which are speci�c to thesetting under study. Question 1 regards the ability to compute compoundinterest and is one of the \big-three" questions proposed by Lusardi andMitchell (2008). Questions 2 and 6 are about knowledge of some speci�cfeatures of livret A and assurance vie, the two most popular investmentproducts among French households. Livret A pays a �xed interest rate thatis determined by the state, it is exempt from taxes, and there is a cap onthe amount of capital that each individual can invest. Financial institutionsneed to transfer part of the money collected to the state, which uses theproceeds to build social housing (this is what Question 2 is referring to).This speci�c feature is somewhat salient in the debate on saving instruments,it dates back to Napoleon and is considered a way to promote livret A, asit translates into \socially valuable" investments. Regarding Question 6, asmentioned in the text, a speci�c feature of assurance vie products (relativeto other instruments of stock market participation) is their �scal treatmentthat reduces the taxes on capital gains realized after 8 years from the openingof the contract. Question 5 addresses a basic distinction between investingin stocks as opposed to �xed income products.
Questions 3 and 4 are about awareness of the French market. The idea isthat following (at least roughly) stock market trends provides useful infor-mation that households can use to decide whether and how to adjust theirinvestment strategies. Including these dimensions is in line with approachesto �nancial literacy as a human capital investment (Lusardi et al. (2017)),and it seems particularly important in our setting, which focuses on portfoliodynamics.
Question 7 is simple arithmetic and is motivated by previous studies onmath ability and �nancial behaviors (e.g., Gerardi et al. (2013), Agarwaland Mazumder (2013)). However, �nancial literacy is distinct from mathability (Lusardi and Mitchell (2014)). In fact, as shown below, our measureof �nancial literacy would be even stronger if we removed Question 7 (whichin our case could be viewed mostly as adding noise).
Based on these considerations, we construct several alternative measuresof �nancial literacy. Financial Literacy (2) is based on the correct answersto Questions 1-6, excluding Question 7 on math ability. Financial Literacy(3) is based on the number of correct answers to Questions 1 (on compoundinterest) and 5 (on stock investment). These questions do not depend onour speci�c context.
Alternatively, one could construct more disaggregated measures and con-sider the various dimensions of �nancial literacy in isolation. In our ques-
37
tions, we can distinguish four dimensions and construct four correspondingvariables: Compute Interest (Question 1); Know Product (Questions 2, 5 and6); Follow Market (Questions 3 and 4); Math Ability (Question 7). One canthen ask whether these dimensions are correlated and what their separatecontribution is to the e�ects highlighted in our main analysis.
We begin with some descriptive statistics. In Table 8, we observe thatCompute Interest, Know Product, and Follow Market are signi�cantly (andpositively) correlated with one another and are positively correlated witheducation and wealth. The variable Math Ability is, however, not signi�-cantly related to those demographic characteristics or to other dimensionsof �nancial literacy.
In Tables 9-14, we review our main results using each of the six variablesseparately to shed light on which dimensions of �nancial literacy are morerelevant for the main e�ects presented above. We note from Tables 9 and 10that the e�ect of �nancial literacy on portfolio returns is stronger if one con-siders the measure Financial Literacy (2), which omits math ability. Amongthe four disaggregated measures, higher experienced returns are essentiallydriven by those with greater information about market trends (Follow Mar-ket). The pattern of increased risk taking when expected returns are higheris robust across the various measures of �nancial literacy, and it is driven inparticular by investors who follow the market and can compute compoundinterest (Table 11). All dimensions of �nancial literacy are associated withlower portfolio inertia (Table 12), although the largest e�ects are for thevariables Know Product and Follow Market. The likelihood of being a re-balancer (Table 13) is positively associated with Compute Interest and KnowProduct and with the alternative measures Financial Literacy (2) and (3).In Table 14, we observe that the probability that experienced returns ex-ceed passive returns is positively associated with Compute Interest, FollowMarket, and Know Product and with the alternative measures FinancialLiteracy (2) and (3).
38
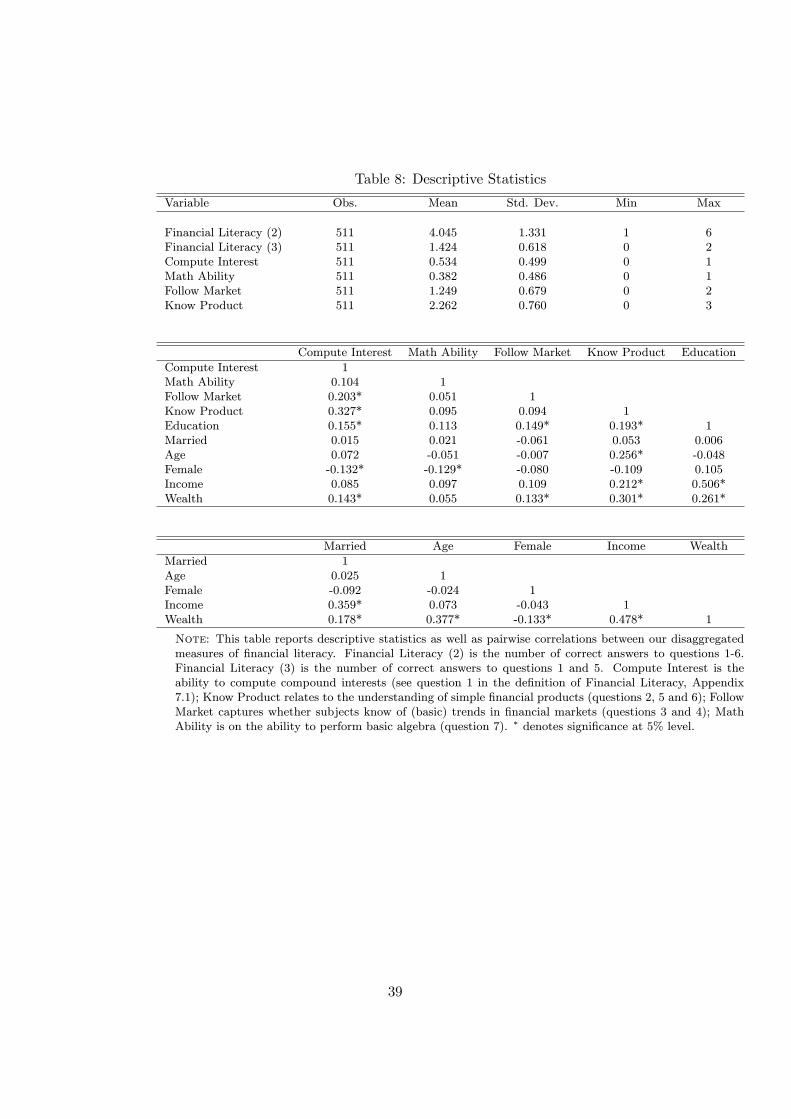
Table 8: Descriptive Statistics
Variable Obs. Mean Std. Dev. Min Max
Financial Literacy (2) 511 4.045 1.331 1 6Financial Literacy (3) 511 1.424 0.618 0 2Compute Interest 511 0.534 0.499 0 1Math Ability 511 0.382 0.486 0 1Follow Market 511 1.249 0.679 0 2Know Product 511 2.262 0.760 0 3
Compute Interest Math Ability Follow Market Know Product Education
Compute Interest 1Math Ability 0.104 1Follow Market 0.203* 0.051 1Know Product 0.327* 0.095 0.094 1Education 0.155* 0.113 0.149* 0.193* 1Married 0.015 0.021 -0.061 0.053 0.006Age 0.072 -0.051 -0.007 0.256* -0.048Female -0.132* -0.129* -0.080 -0.109 0.105Income 0.085 0.097 0.109 0.212* 0.506*Wealth 0.143* 0.055 0.133* 0.301* 0.261*
Married Age Female Income Wealth
Married 1Age 0.025 1Female -0.092 -0.024 1Income 0.359* 0.073 -0.043 1Wealth 0.178* 0.377* -0.133* 0.478* 1
Note: This table reports descriptive statistics as well as pairwise correlations between our disaggregatedmeasures of �nancial literacy. Financial Literacy (2) is the number of correct answers to questions 1-6.Financial Literacy (3) is the number of correct answers to questions 1 and 5. Compute Interest is theability to compute compound interests (see question 1 in the de�nition of Financial Literacy, Appendix7.1); Know Product relates to the understanding of simple �nancial products (questions 2, 5 and 6); FollowMarket captures whether subjects know of (basic) trends in �nancial markets (questions 3 and 4); MathAbility is on the ability to perform basic algebra (question 7). � denotes signi�cance at 5% level.
39
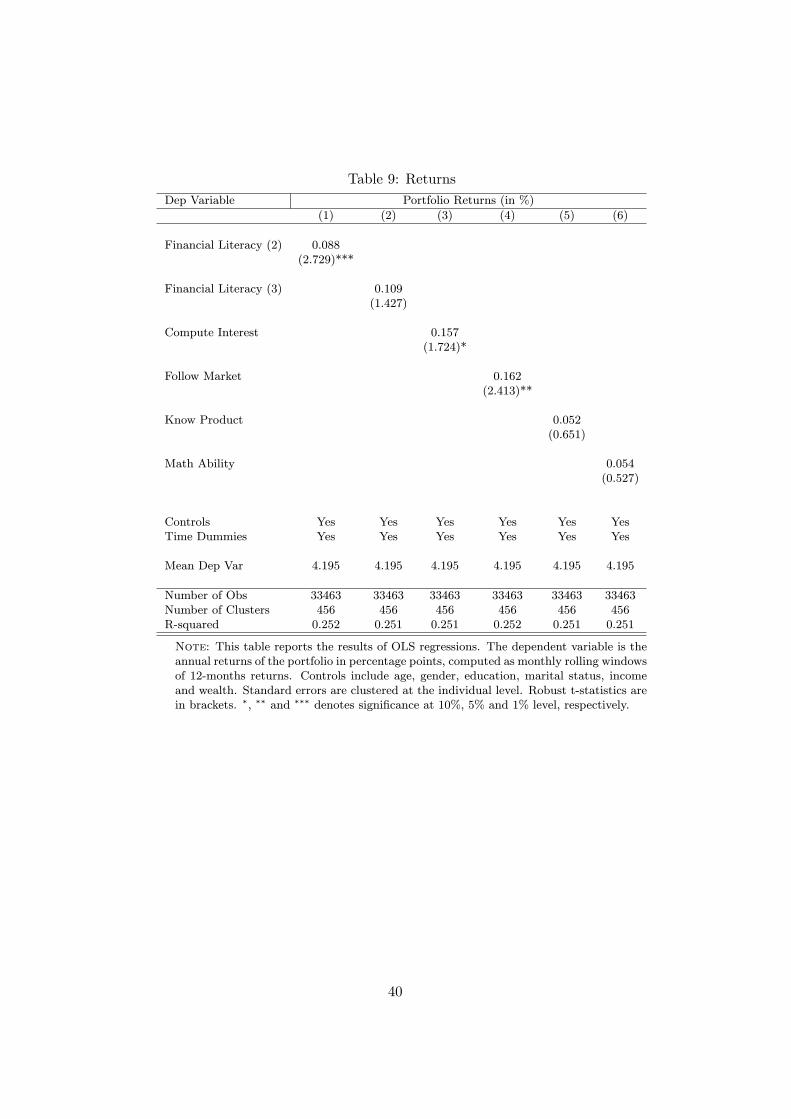
Table 9: Returns
Dep Variable Portfolio Returns (in %)
(1) (2) (3) (4) (5) (6)
Financial Literacy (2) 0.088(2.729)***
Financial Literacy (3) 0.109(1.427)
Compute Interest 0.157(1.724)*
Follow Market 0.162(2.413)**
Know Product 0.052(0.651)
Math Ability 0.054(0.527)
Controls Yes Yes Yes Yes Yes YesTime Dummies Yes Yes Yes Yes Yes Yes
Mean Dep Var 4.195 4.195 4.195 4.195 4.195 4.195
Number of Obs 33463 33463 33463 33463 33463 33463Number of Clusters 456 456 456 456 456 456R-squared 0.252 0.251 0.251 0.252 0.251 0.251
Note: This table reports the results of OLS regressions. The dependent variable is theannual returns of the portfolio in percentage points, computed as monthly rolling windowsof 12-months returns. Controls include age, gender, education, marital status, incomeand wealth. Standard errors are clustered at the individual level. Robust t-statistics arein brackets. �, �� and ��� denotes signi�cance at 10%, 5% and 1% level, respectively.
40
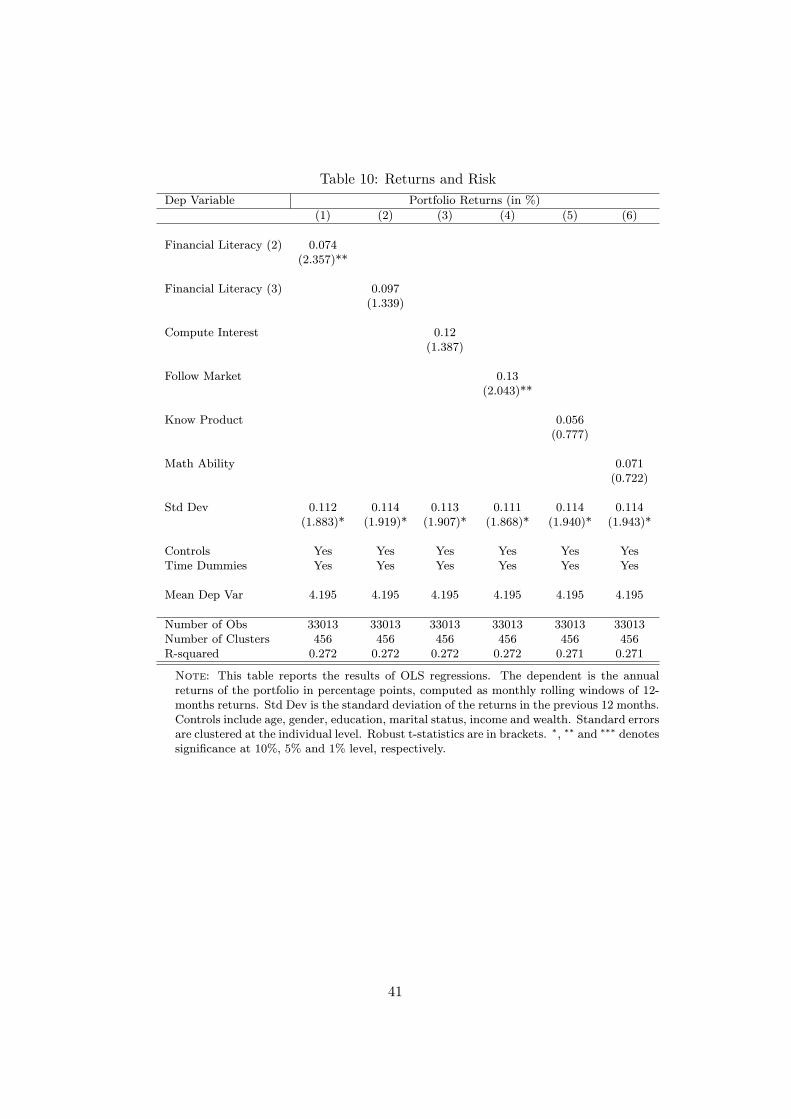
Table 10: Returns and Risk
Dep Variable Portfolio Returns (in %)
(1) (2) (3) (4) (5) (6)
Financial Literacy (2) 0.074(2.357)**
Financial Literacy (3) 0.097(1.339)
Compute Interest 0.12(1.387)
Follow Market 0.13(2.043)**
Know Product 0.056(0.777)
Math Ability 0.071(0.722)
Std Dev 0.112 0.114 0.113 0.111 0.114 0.114(1.883)* (1.919)* (1.907)* (1.868)* (1.940)* (1.943)*
Controls Yes Yes Yes Yes Yes YesTime Dummies Yes Yes Yes Yes Yes Yes
Mean Dep Var 4.195 4.195 4.195 4.195 4.195 4.195
Number of Obs 33013 33013 33013 33013 33013 33013Number of Clusters 456 456 456 456 456 456R-squared 0.272 0.272 0.272 0.272 0.271 0.271
Note: This table reports the results of OLS regressions. The dependent is the annualreturns of the portfolio in percentage points, computed as monthly rolling windows of 12-months returns. Std Dev is the standard deviation of the returns in the previous 12 months.Controls include age, gender, education, marital status, income and wealth. Standard errorsare clustered at the individual level. Robust t-statistics are in brackets. �, �� and ��� denotessigni�cance at 10%, 5% and 1% level, respectively.
41
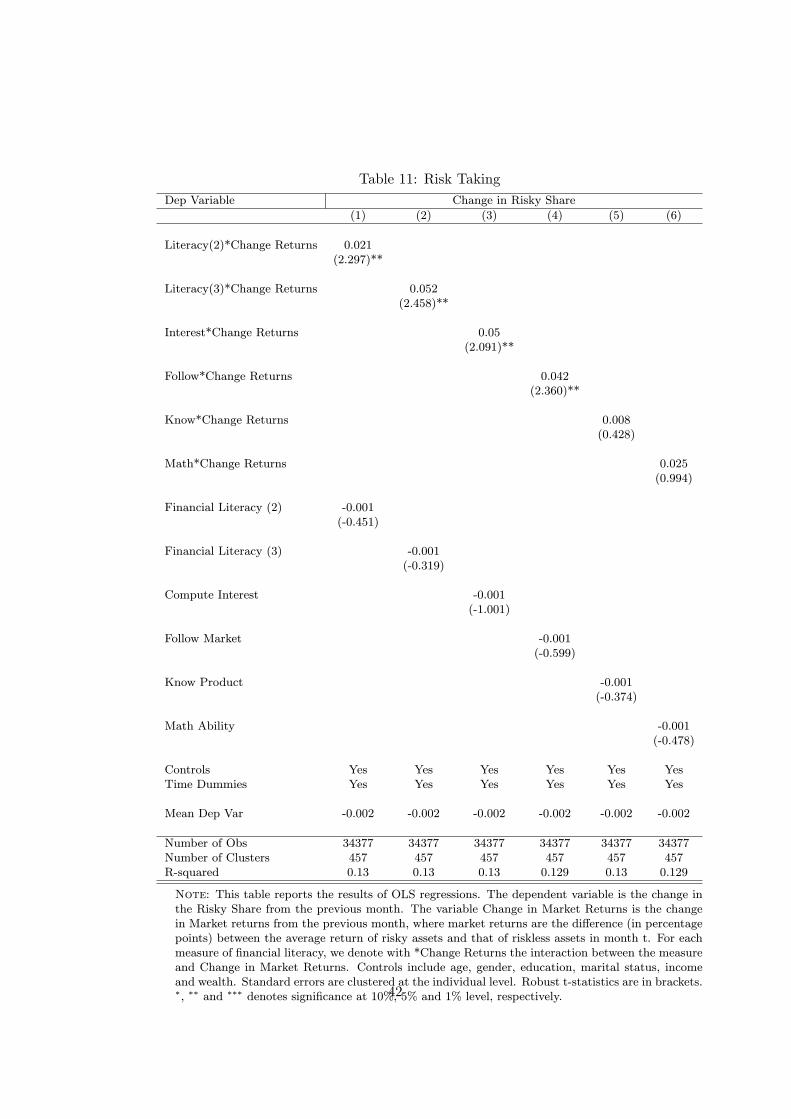
Table 11: Risk Taking
Dep Variable Change in Risky Share
(1) (2) (3) (4) (5) (6)
Literacy(2)*Change Returns 0.021(2.297)**
Literacy(3)*Change Returns 0.052(2.458)**
Interest*Change Returns 0.05(2.091)**
Follow*Change Returns 0.042(2.360)**
Know*Change Returns 0.008(0.428)
Math*Change Returns 0.025(0.994)
Financial Literacy (2) -0.001(-0.451)
Financial Literacy (3) -0.001(-0.319)
Compute Interest -0.001(-1.001)
Follow Market -0.001(-0.599)
Know Product -0.001(-0.374)
Math Ability -0.001(-0.478)
Controls Yes Yes Yes Yes Yes YesTime Dummies Yes Yes Yes Yes Yes Yes
Mean Dep Var -0.002 -0.002 -0.002 -0.002 -0.002 -0.002
Number of Obs 34377 34377 34377 34377 34377 34377Number of Clusters 457 457 457 457 457 457R-squared 0.13 0.13 0.13 0.129 0.13 0.129
Note: This table reports the results of OLS regressions. The dependent variable is the change inthe Risky Share from the previous month. The variable Change in Market Returns is the changein Market returns from the previous month, where market returns are the di�erence (in percentagepoints) between the average return of risky assets and that of riskless assets in month t. For eachmeasure of �nancial literacy, we denote with *Change Returns the interaction between the measureand Change in Market Returns. Controls include age, gender, education, marital status, incomeand wealth. Standard errors are clustered at the individual level. Robust t-statistics are in brackets.�, �� and ��� denotes signi�cance at 10%, 5% and 1% level, respectively.42
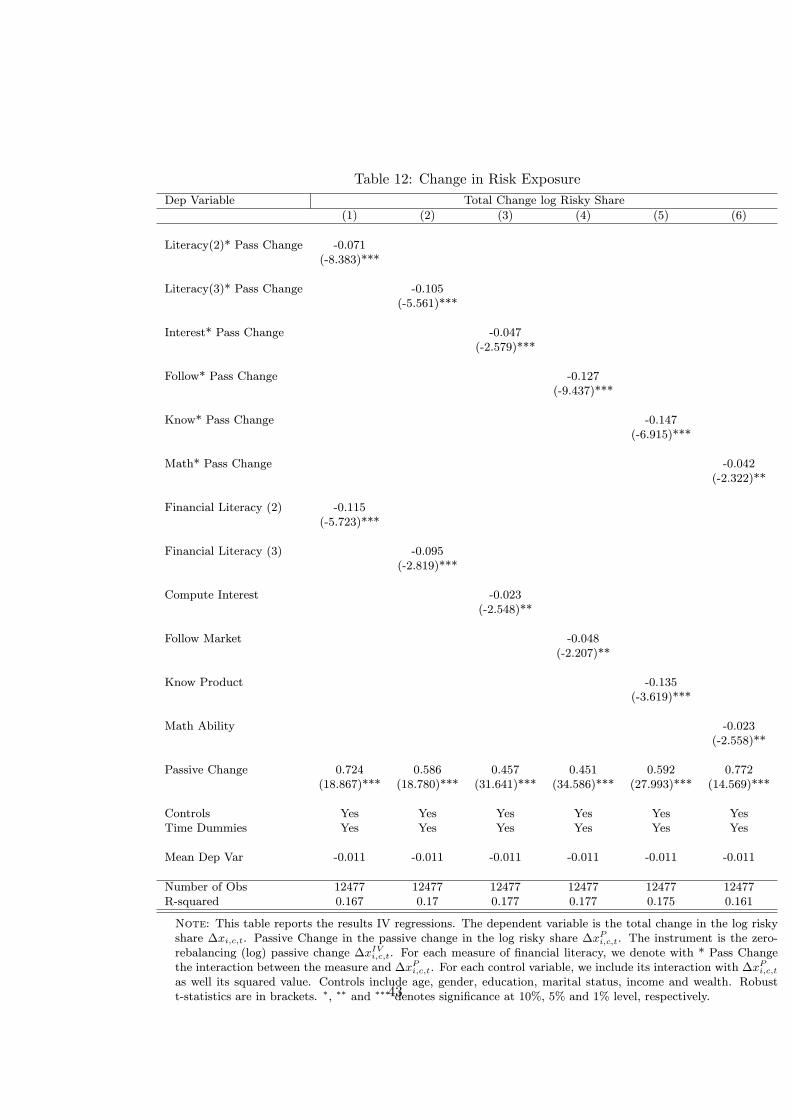
Table 12: Change in Risk Exposure
Dep Variable Total Change log Risky Share
(1) (2) (3) (4) (5) (6)
Literacy(2)* Pass Change -0.071(-8.383)***
Literacy(3)* Pass Change -0.105(-5.561)***
Interest* Pass Change -0.047(-2.579)***
Follow* Pass Change -0.127(-9.437)***
Know* Pass Change -0.147(-6.915)***
Math* Pass Change -0.042(-2.322)**
Financial Literacy (2) -0.115(-5.723)***
Financial Literacy (3) -0.095(-2.819)***
Compute Interest -0.023(-2.548)**
Follow Market -0.048(-2.207)**
Know Product -0.135(-3.619)***
Math Ability -0.023(-2.558)**
Passive Change 0.724 0.586 0.457 0.451 0.592 0.772(18.867)*** (18.780)*** (31.641)*** (34.586)*** (27.993)*** (14.569)***
Controls Yes Yes Yes Yes Yes YesTime Dummies Yes Yes Yes Yes Yes Yes
Mean Dep Var -0.011 -0.011 -0.011 -0.011 -0.011 -0.011
Number of Obs 12477 12477 12477 12477 12477 12477R-squared 0.167 0.17 0.177 0.177 0.175 0.161
Note: This table reports the results IV regressions. The dependent variable is the total change in the log riskyshare �xi;c;t. Passive Change in the passive change in the log risky share �x
Pi;c;t. The instrument is the zero-
rebalancing (log) passive change �xIVi;c;t. For each measure of �nancial literacy, we denote with * Pass Changethe interaction between the measure and �xPi;c;t. For each control variable, we include its interaction with �x
Pi;c;t
as well its squared value. Controls include age, gender, education, marital status, income and wealth. Robustt-statistics are in brackets. �, �� and ��� denotes signi�cance at 10%, 5% and 1% level, respectively.43
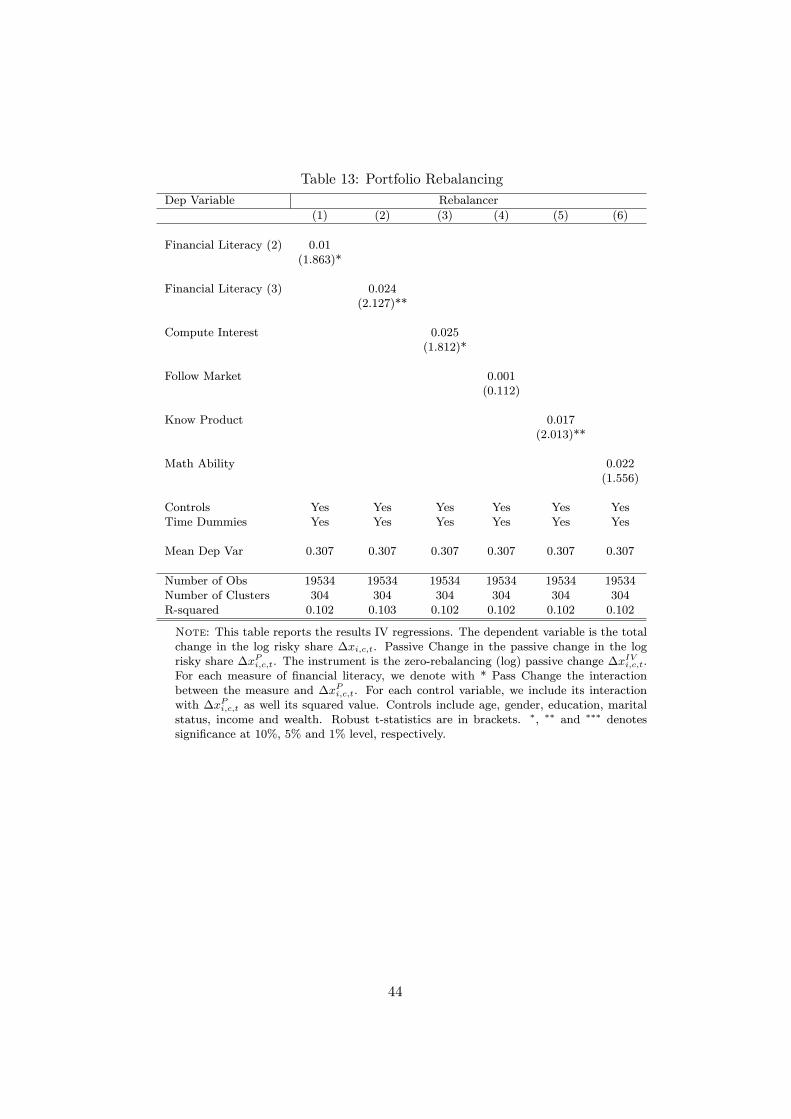
Table 13: Portfolio Rebalancing
Dep Variable Rebalancer
(1) (2) (3) (4) (5) (6)
Financial Literacy (2) 0.01(1.863)*
Financial Literacy (3) 0.024(2.127)**
Compute Interest 0.025(1.812)*
Follow Market 0.001(0.112)
Know Product 0.017(2.013)**
Math Ability 0.022(1.556)
Controls Yes Yes Yes Yes Yes YesTime Dummies Yes Yes Yes Yes Yes Yes
Mean Dep Var 0.307 0.307 0.307 0.307 0.307 0.307
Number of Obs 19534 19534 19534 19534 19534 19534Number of Clusters 304 304 304 304 304 304R-squared 0.102 0.103 0.102 0.102 0.102 0.102
Note: This table reports the results IV regressions. The dependent variable is the totalchange in the log risky share �xi;c;t. Passive Change in the passive change in the logrisky share �xPi;c;t. The instrument is the zero-rebalancing (log) passive change �x
IVi;c;t.
For each measure of �nancial literacy, we denote with * Pass Change the interactionbetween the measure and �xPi;c;t. For each control variable, we include its interactionwith �xPi;c;t as well its squared value. Controls include age, gender, education, maritalstatus, income and wealth. Robust t-statistics are in brackets. �, �� and ��� denotessigni�cance at 10%, 5% and 1% level, respectively.
44
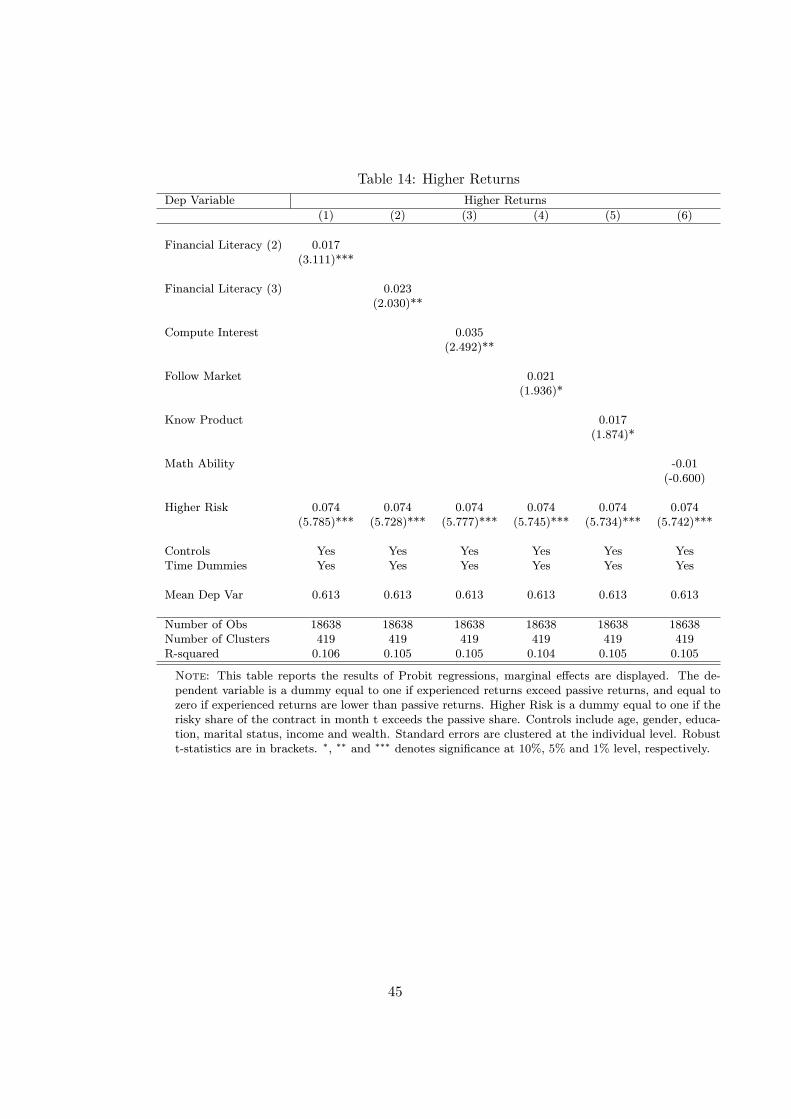
Table 14: Higher Returns
Dep Variable Higher Returns
(1) (2) (3) (4) (5) (6)
Financial Literacy (2) 0.017(3.111)***
Financial Literacy (3) 0.023(2.030)**
Compute Interest 0.035(2.492)**
Follow Market 0.021(1.936)*
Know Product 0.017(1.874)*
Math Ability -0.01(-0.600)
Higher Risk 0.074 0.074 0.074 0.074 0.074 0.074(5.785)*** (5.728)*** (5.777)*** (5.745)*** (5.734)*** (5.742)***
Controls Yes Yes Yes Yes Yes YesTime Dummies Yes Yes Yes Yes Yes Yes
Mean Dep Var 0.613 0.613 0.613 0.613 0.613 0.613
Number of Obs 18638 18638 18638 18638 18638 18638Number of Clusters 419 419 419 419 419 419R-squared 0.106 0.105 0.105 0.104 0.105 0.105
Note: This table reports the results of Probit regressions, marginal e�ects are displayed. The de-pendent variable is a dummy equal to one if experienced returns exceed passive returns, and equal tozero if experienced returns are lower than passive returns. Higher Risk is a dummy equal to one if therisky share of the contract in month t exceeds the passive share. Controls include age, gender, educa-tion, marital status, income and wealth. Standard errors are clustered at the individual level. Robustt-statistics are in brackets. �, �� and ��� denotes signi�cance at 10%, 5% and 1% level, respectively.
45
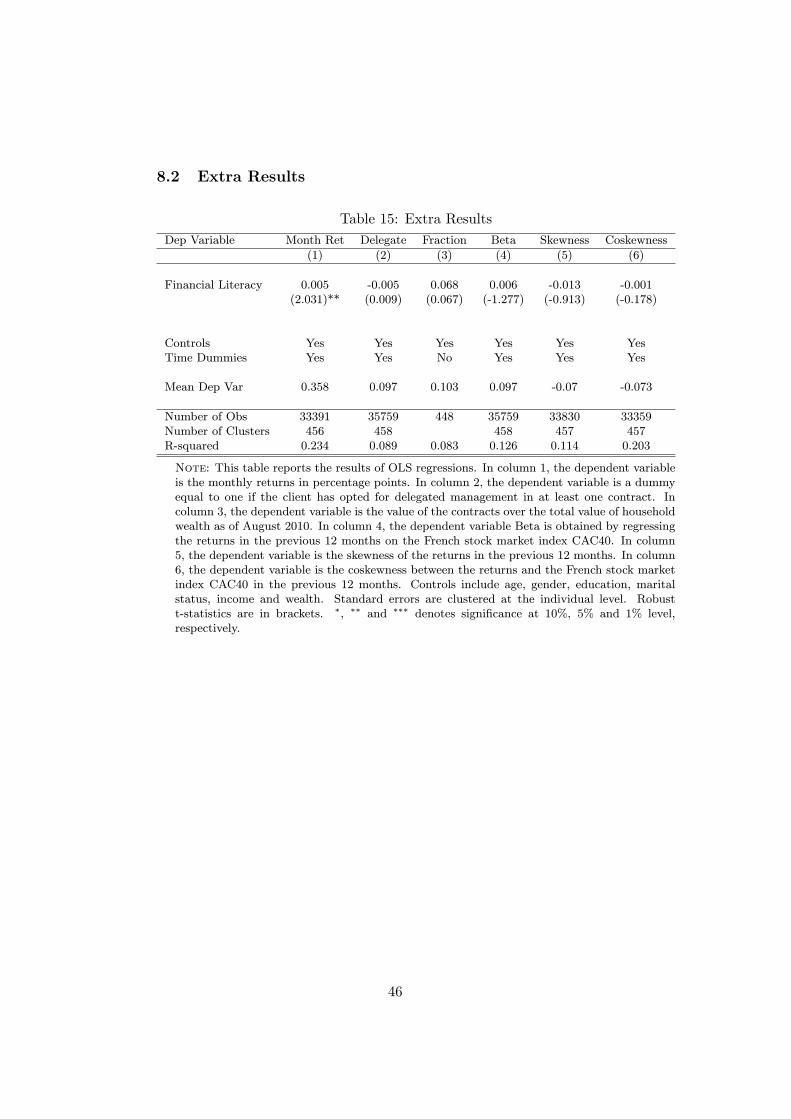
8.2 Extra Results
Table 15: Extra Results
Dep Variable Month Ret Delegate Fraction Beta Skewness Coskewness
(1) (2) (3) (4) (5) (6)
Financial Literacy 0.005 -0.005 0.068 0.006 -0.013 -0.001(2.031)** (0.009) (0.067) (-1.277) (-0.913) (-0.178)
Controls Yes Yes Yes Yes Yes YesTime Dummies Yes Yes No Yes Yes Yes
Mean Dep Var 0.358 0.097 0.103 0.097 -0.07 -0.073
Number of Obs 33391 35759 448 35759 33830 33359Number of Clusters 456 458 458 457 457R-squared 0.234 0.089 0.083 0.126 0.114 0.203
Note: This table reports the results of OLS regressions. In column 1, the dependent variableis the monthly returns in percentage points. In column 2, the dependent variable is a dummyequal to one if the client has opted for delegated management in at least one contract. Incolumn 3, the dependent variable is the value of the contracts over the total value of householdwealth as of August 2010. In column 4, the dependent variable Beta is obtained by regressingthe returns in the previous 12 months on the French stock market index CAC40. In column5, the dependent variable is the skewness of the returns in the previous 12 months. In column6, the dependent variable is the coskewness between the returns and the French stock marketindex CAC40 in the previous 12 months. Controls include age, gender, education, maritalstatus, income and wealth. Standard errors are clustered at the individual level. Robustt-statistics are in brackets. �, �� and ��� denotes signi�cance at 10%, 5% and 1% level,respectively.
46
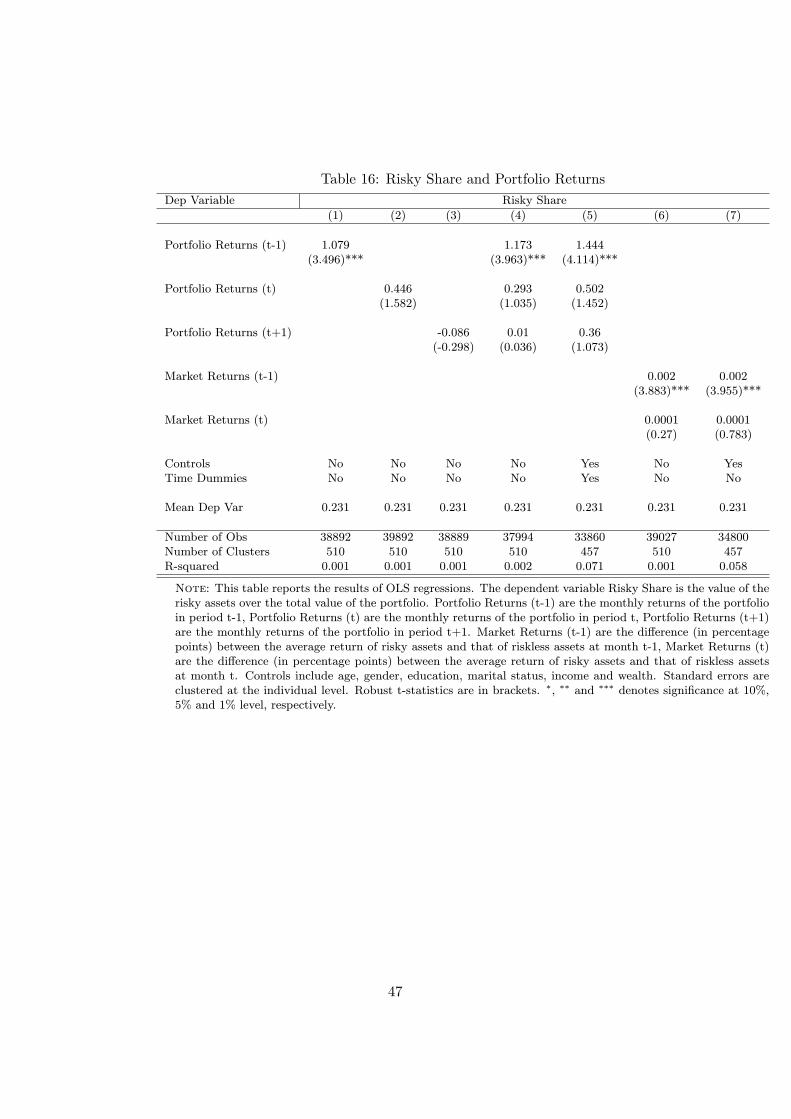
Table 16: Risky Share and Portfolio Returns
Dep Variable Risky Share
(1) (2) (3) (4) (5) (6) (7)
Portfolio Returns (t-1) 1.079 1.173 1.444(3.496)*** (3.963)*** (4.114)***
Portfolio Returns (t) 0.446 0.293 0.502(1.582) (1.035) (1.452)
Portfolio Returns (t+1) -0.086 0.01 0.36(-0.298) (0.036) (1.073)
Market Returns (t-1) 0.002 0.002(3.883)*** (3.955)***
Market Returns (t) 0.0001 0.0001(0.27) (0.783)
Controls No No No No Yes No YesTime Dummies No No No No Yes No No
Mean Dep Var 0.231 0.231 0.231 0.231 0.231 0.231 0.231
Number of Obs 38892 39892 38889 37994 33860 39027 34800Number of Clusters 510 510 510 510 457 510 457R-squared 0.001 0.001 0.001 0.002 0.071 0.001 0.058
Note: This table reports the results of OLS regressions. The dependent variable Risky Share is the value of therisky assets over the total value of the portfolio. Portfolio Returns (t-1) are the monthly returns of the portfolioin period t-1, Portfolio Returns (t) are the monthly returns of the portfolio in period t, Portfolio Returns (t+1)are the monthly returns of the portfolio in period t+1. Market Returns (t-1) are the di�erence (in percentagepoints) between the average return of risky assets and that of riskless assets at month t-1, Market Returns (t)are the di�erence (in percentage points) between the average return of risky assets and that of riskless assetsat month t. Controls include age, gender, education, marital status, income and wealth. Standard errors areclustered at the individual level. Robust t-statistics are in brackets. �, �� and ��� denotes signi�cance at 10%,5% and 1% level, respectively.
47
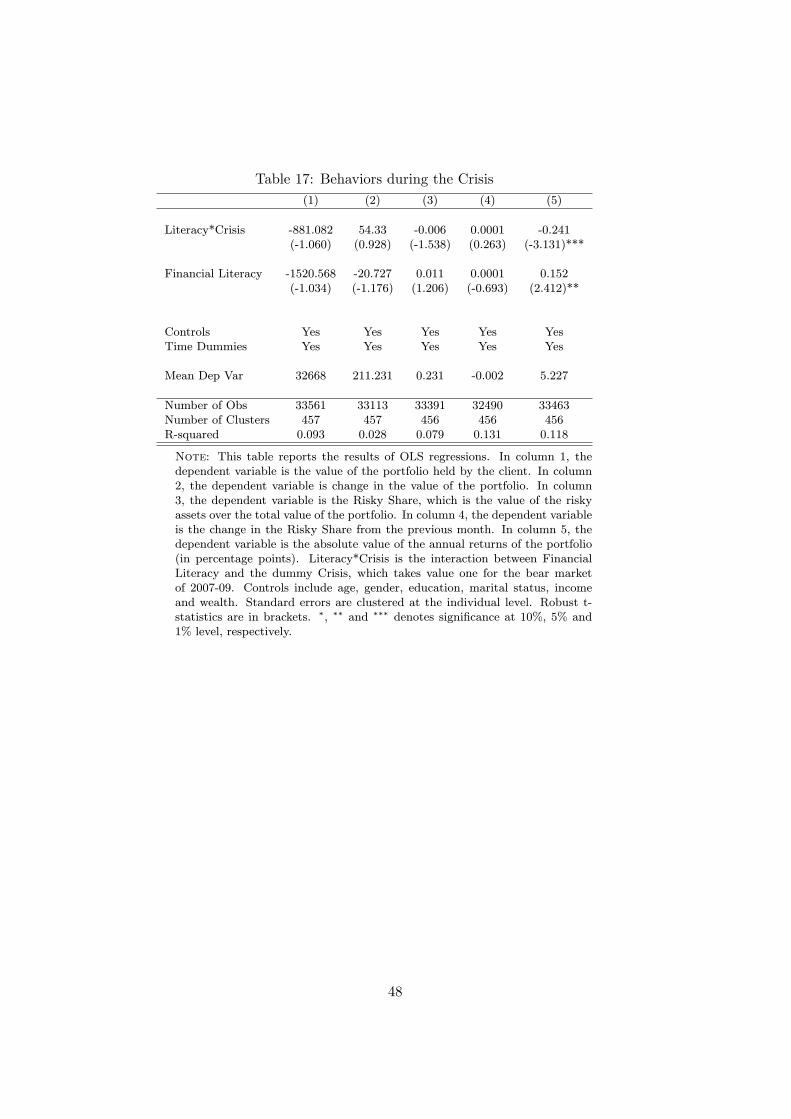
Table 17: Behaviors during the Crisis
(1) (2) (3) (4) (5)
Literacy*Crisis -881.082 54.33 -0.006 0.0001 -0.241(-1.060) (0.928) (-1.538) (0.263) (-3.131)***
Financial Literacy -1520.568 -20.727 0.011 0.0001 0.152(-1.034) (-1.176) (1.206) (-0.693) (2.412)**
Controls Yes Yes Yes Yes YesTime Dummies Yes Yes Yes Yes Yes
Mean Dep Var 32668 211.231 0.231 -0.002 5.227
Number of Obs 33561 33113 33391 32490 33463Number of Clusters 457 457 456 456 456R-squared 0.093 0.028 0.079 0.131 0.118
Note: This table reports the results of OLS regressions. In column 1, thedependent variable is the value of the portfolio held by the client. In column2, the dependent variable is change in the value of the portfolio. In column3, the dependent variable is the Risky Share, which is the value of the riskyassets over the total value of the portfolio. In column 4, the dependent variableis the change in the Risky Share from the previous month. In column 5, thedependent variable is the absolute value of the annual returns of the portfolio(in percentage points). Literacy*Crisis is the interaction between FinancialLiteracy and the dummy Crisis, which takes value one for the bear marketof 2007-09. Controls include age, gender, education, marital status, incomeand wealth. Standard errors are clustered at the individual level. Robust t-statistics are in brackets. �, �� and ��� denotes signi�cance at 10%, 5% and1% level, respectively.
48

8.3 A model of portfolio rebalancing
We reproduce the model proposed by Calvet et al. (2009a), which we use toderive equation (5) in the main text. The model is based on the followingassumptions. First, the log of the risky share xi;t is a weighted averagebetween the log of the passive share xPi;t and the log of the (unobservable)target risky share x�i;t: Denoting by �i the speed of adjustment toward thetarget share, we have
xi;t = �ix�i;t + (1� �i)xPi;t + ui;t: (7)
Second, the speed of adjustment is a linear function of a set of observablehousehold characteristics wi;t; that is,
�i = 0 + 0wi;t: (8)
Third, the change in the log target share is a linear function of these char-acteristics:
�x�i;t = �0;t + �0twi;t: (9)
An advantage of the log speci�cation is that �x�i;t can be de�ned indepen-dent of individual-speci�c time-invariant characteristics. Taking the �rstdi�erence of (7) and using �i and �x
�i;t from (8) and (9), we obtain
�xi;t = at + b0�xPi;t + b
0wi;t�x
Pi;t + c
0twi;t + w
0i;tDtwi;t +�ui;t; (10)
in which at = 0�0;t; b0 = 1 � 0; b = � ; ct = 0�t + �0;t and Dt = �0t:
This corresponds to equation (5). From (7) and (10), we can observe that�ui;t may be negatively correlated with �x
Pi;t. A positive shock to ui;t�1,
for example, would reduce �ui;t; simultaneously, it would increase xi;t�1;which in turn would increase xPi;t and thus increase �x
Pi;t:
49