Embed Size (px)
Citation preview
8/6/2019 WP London-Agreement Oct 2008
http://slidepdf.com/reader/full/wp-london-agreement-oct-2008 1/28
N0
2008/ 05
OCTOBER 2008
THE LONDON AGREEMENT AND THE COST OFPATENTING IN EUROPE
BRUNO VAN POTTELSBERGHE DE LA POTTERIE AND MALWINA MEJER
RU E G E L W O R K I N G P A
P E R
8/6/2019 WP London-Agreement Oct 2008
http://slidepdf.com/reader/full/wp-london-agreement-oct-2008 2/28
The London Agreement
1
October 2008
The London Agreement and the cost of patenting in Europe
Bruno van Pottelsberghe de la Potterieα and Malwina Mejer ∇
α Bruegel and Université Libre de Bruxelles (ULB), SBS‐EM, ECORE (ECARES), and CEPR, London. CEB and DULBEA –
[email protected] ∇ Research Assistant, Bruegel and Université Libre de Bruxelles (ULB), SBS‐EM, ECORE (ECARES) ‐
8/6/2019 WP London-Agreement Oct 2008
http://slidepdf.com/reader/full/wp-london-agreement-oct-2008 3/28
The London Agreement
2
Abstract: This paper analyses the consequences for the European Patent System (EPS) of the
recently ratified London Agreement (LA), which aims to reduce the translation requirements
for patent validation procedures in 15 out of 34 national patent offices. The simulations
suggest that the cost of patenting has been reduced by 20 to 30 percent since the
enforcement of the LA. With an average translation cost saving of €3,600 per patent, the
total savings for the business sector amount to about €220 millions. The fee elasticity of
patents being about ‐0.4, one may expect an increase in patent filings of eight to 12 percent.
Despite the translation cost savings, the relative cost of a European patent validated in six
(thirteen) countries is still at least five (seven) times higher than in the United States.
JEL: P14, P51, O34
Keywords: European patent system, London Agreement, patent fees, translation costs, fee
elasticity.
8/6/2019 WP London-Agreement Oct 2008
http://slidepdf.com/reader/full/wp-london-agreement-oct-2008 4/28
The London Agreement
3
1. Introduction
The European Patent Convention (EPC) was ratified more than 30 years ago by seven European
countries in order to exploit synergies in the search for prior art and the substantive examination
process1.
The EPC proved to be an impressive success, especially if the number of member states
(signatories) and the number of patent applications are considered success factors. The EPC now
includes 34 member states and there have been more than 200,000 applications per year since
2006. Despite this apparent success, the European patent system is heavily criticized by various
institutions, including firms, universities, national agencies and the European Commission2. There
are various reasons for these criticisms (see Guellec and van Pottelsberghe (2007) for an in‐depth
assessment), but one of the most recurrent and pressing relates to the cost and complexity of the
European patent system: its high level of fragmentation and its translation requirements make it
the most expensive, most complex patent system in the world. Indeed, despite the explicit 1978
objective of creating a Community Patent (one patent valid for all member states), the European
Patent system is still fragmented: once a patent is granted by the European Patent Office (EPO) it
must be enforced (i.e., translated, validated and renewed each year) in each desired national
jurisdiction.
An important step forward has recently been taken, however. Out of the 34 member states 15 (as
of September 2008) have ratified the so‐called “London Agreement” (LA), which drastically
reduces the translation requirements when patents are validated at national patent offices. The
objective of this paper is to analyse the consequences of this agreement on the cost of patenting
in Europe and its potential implications for the behaviour of applicants. first, the paper simulates
the cumulated fees and translation costs associated with a patent, before and after the London
Agreement. In addition to changes in costs an international comparison is then performed to
assess whether important differences still prevail. The paper then investigates to what extent the
cost reductions might affect the patenting behaviour of applicants.
The
paper
is
structured
as
follows.
The
next
section
describes
the
London
Agreement
and
the
variations that have been adopted by some member states. Section 3 presents the simulations of
the cost of patenting before and after the London Agreement. International comparisons of
relative and absolute patenting costs are performed in section 4. Section 5 is devoted to the
potential consequences on the number of patent filings and on cost savings. The last section
concludes.
The results suggest that the cost of patenting has reduced by 20 to 30 percent following the
implementation of the London Agreement. Had the London Agreement been ratified by all
member states, the cost of patenting would have been reduced by 40 to 60 percent (depending on
the number of targeted states for protection). With an average translation cost saving of €3,600
per patent, the total savings for the business sector amount to about €220 millions. The relative
cost of a European patent is however still at least five times higher than in the US. The fee
elasticity of patents being of about ‐0.4, one can expect an increase in patent filings of eight to 12
percent.
1 The seven signatory states in 1978 were Belgium, France, Germany, Luxembourg, The Netherlands, Switzerland and
The United Kingdom.
2 For instance, Single Market Commissioner Charlie McCreevy in his statement on 3
rd April 2007 said: “Patents are a
driving force for promoting innovation, growth and competitiveness but the single market for patents is still
incomplete. ... In today’s increasingly competitive global economy, Europe cannot afford to lose ground in an area as
crucial as patent policy .” www.iht.com/articles/2007/04/03/business/ip.php
8/6/2019 WP London-Agreement Oct 2008
http://slidepdf.com/reader/full/wp-london-agreement-oct-2008 5/28
The London Agreement
4
2. The complexity of the European Patent System
The Community Patent has been a bone of contention for 30 years and still remains a 'work in
progress'. The current system is based on a multilateral patent treaty – the European Patent
Convention (EPC), signed in 1977. The EPC provides a centralised application and examination
procedure for European patents (cf. Figure 1). A European patent (EP) application has to be filed in
one of the European Patent Office (EPO) official languages (English, German or French), the so
called procedural language3.
The examination process begins with a search report that identifies
the prior art relevant to the application. Once the search report is published, not later than 18
months after the priority date4,
the applicant has six months to request a substantive examination
of its patent, i.e., an analysis of whether there is an inventive step. If the invention conforms with
the requirements of the EPC (novelty, non‐prejudicial disclosures, inventive step, and industrial
applicability) the application is granted5.
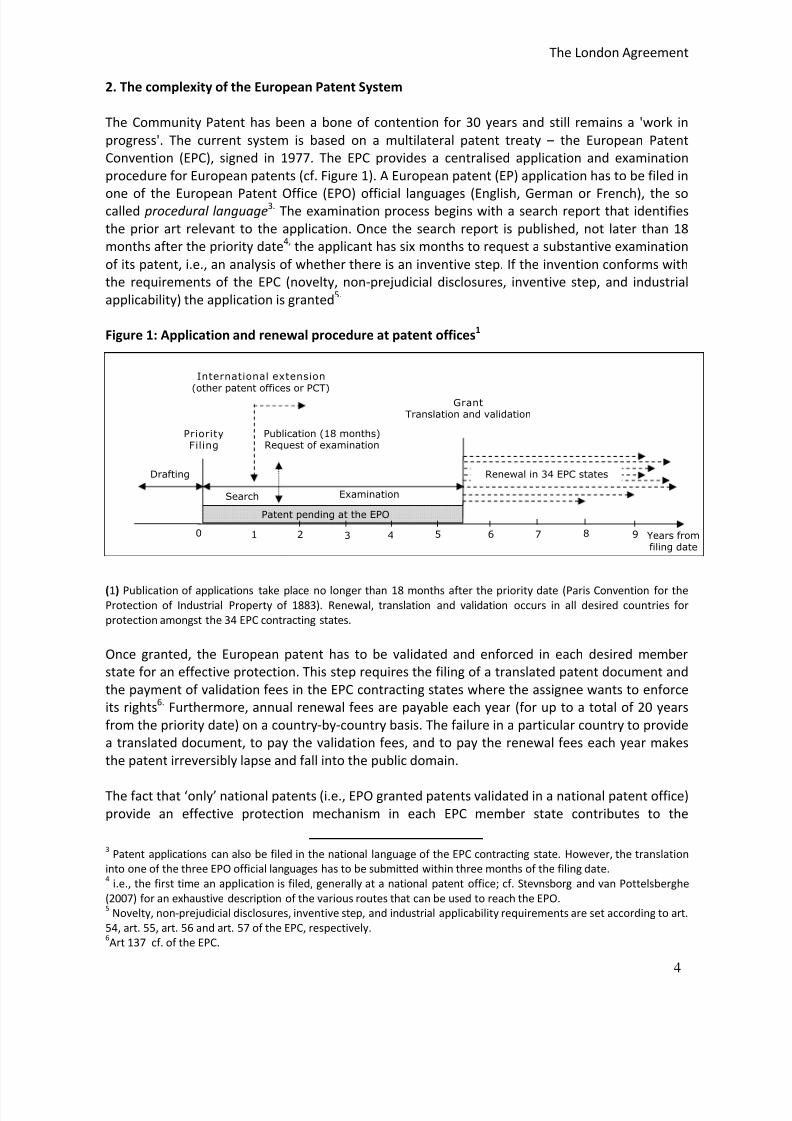
Figure 1: Application and renewal procedure at patent offices1
(1) Publication of applications take place no longer than 18 months after the priority date (Paris Convention for the
Protection of Industrial Property of 1883). Renewal, translation and validation occurs in all desired countries for
protection amongst the 34 EPC contracting states.
Once granted, the European patent has to be validated and enforced in each desired member
state for an effective protection. This step requires the filing of a translated patent document and
the payment of validation fees in the EPC contracting states where the assignee wants to enforce
its rights6.
Furthermore, annual renewal fees are payable each year (for up to a total of 20 years
from the priority date) on a country‐by‐country basis. The failure in a particular country to provide
a translated document, to pay the validation fees, and to pay the renewal fees each year makes
the patent irreversibly lapse and fall into the public domain.
The fact that ‘only’ national patents (i.e., EPO granted patents validated in a national patent office)
provide an effective protection mechanism in each EPC member state contributes to the
3 Patent applications can also be filed in the national language of the EPC contracting state. However, the translation
into one of the three EPO official languages has to be submitted within three months of the filing date.
4 i.e., the first time an application is filed, generally at a national patent office; cf. Stevnsborg and van Pottelsberghe
(2007) for an exhaustive description of the various routes that can be used to reach the EPO.
5 Novelty, non‐prejudicial disclosures, inventive step, and industrial applicability requirements are set according to art.
54, art. 55, art. 56 and art. 57 of the EPC, respectively.
6Art 137 cf. of the EPC.
ExaminationSearch
Drafting
PriorityFiling
Publication (18 months)Request of examination
GrantTranslation and validation
International extension
(other patent offices or PCT)
Patent pending at the EPO
Renewal in 34 EPC states
0 Years fromfiling date
1 2 3 4 5 6 7 8 9
8/6/2019 WP London-Agreement Oct 2008
http://slidepdf.com/reader/full/wp-london-agreement-oct-2008 6/28
The London Agreement
5
prohibitive costs of the system. Unlike with other patent offices around the world, payments of
national validation fees and annual renewal fees, the frequent translation requirements, and the
national enforcement practices (e.g., litigation processes and identification of infringers) must be
multiplied by the number of countries chosen by the applicant. In case of infringement suspicions
in several countries the enforcement mechanism reaches a high level of complexity, as the
application and interpretation of the EPC is specific to each national court (which has exclusive
rights to judge on validity and infringement cases)7.
Existing differences between jurisdictions
enhance the risk that in case of multiple litigations relating to a single patent, some national courts
may reach ‘opposite decisions’ regarding the same patent, as illustrated by Mejer and van
Pottelsberghe (2008) with several case studies on parallel litigations.
Two recent initiatives have been proposed within the EPC legal framework to simplify the existing
situation. The first one is the so‐called London Agreement (LA) and aims at reducing translation
costs. The second initiative is the European Patent Litigation Agreement (EPLA). It tackles the
problem of legal uncertainty and aims at implementing a centralised European court for patent‐
related litigation. The objective of the EPLA is to provide a more homogeneous interpretation of
the validity and of the scope of a European patent. The London Agreement and the EPLA are both
optional for each of the 34 EPC member states. Whereas the former has been ratified by 15
countries so far (with entry into force as of the 1st
of May 2008), the latter is still subject to intense
negotiations.
This paper focuses on the consequences that the London Agreement (LA) may have for the cost of
patenting in Europe and for the patenting behaviour of applicants. The simplified translation rules
set in the LA apply to patent applications published in the European Patent Bulletin after the 1st
of
May 2008. The newly reduced translation requirements only apply in the 15 following signatory
member states: Belgium (BE), Denmark (DK), France (FR), Germany (DE), Croatia (HR), Iceland (IS),
Latvia (LV), Lichtenstein (LI), Luxembourg (LU), Monaco (MC), The Netherlands (NL), Slovenia (SI),
Sweden (SE), Switzerland (CH), and the United Kingdom (UK)8.
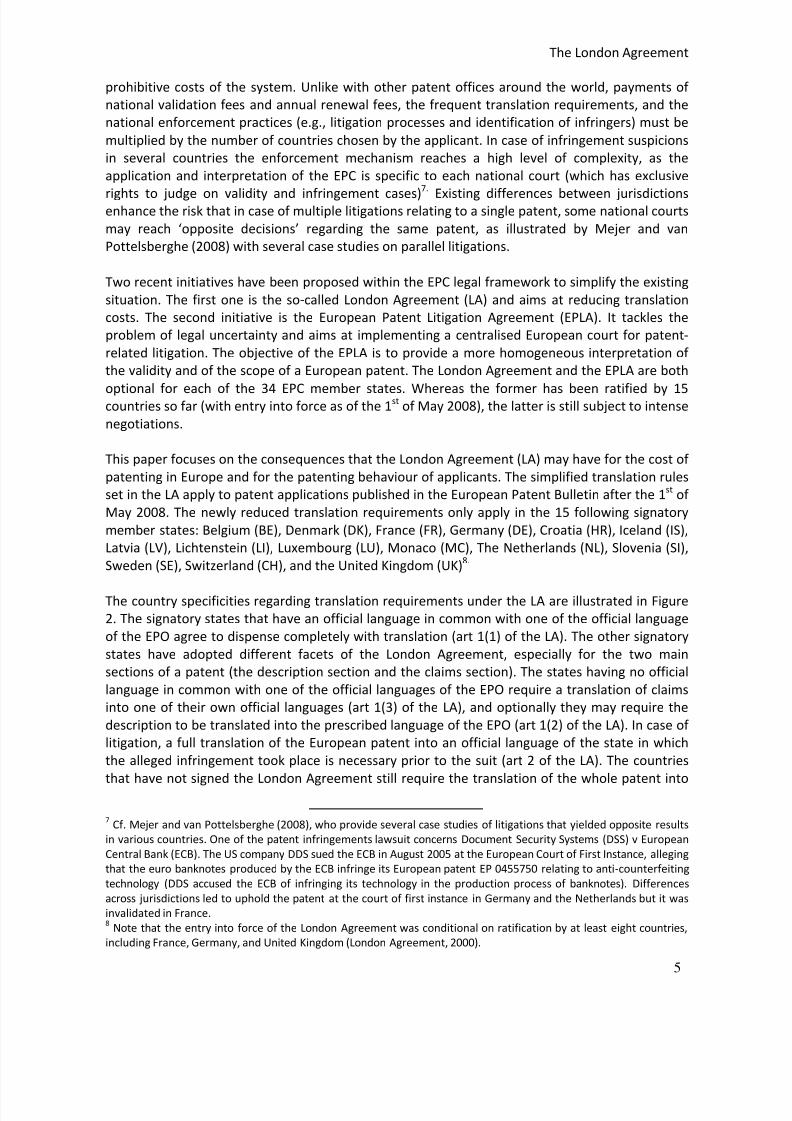
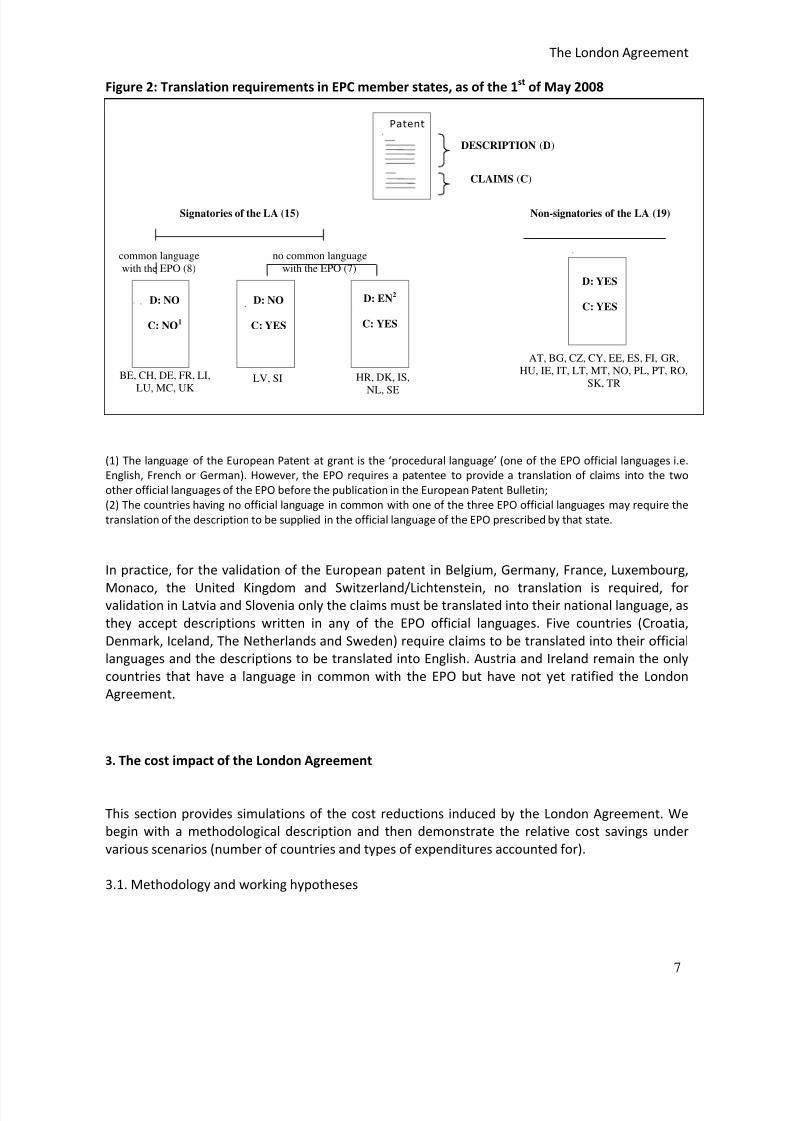
The country specificities regarding translation requirements under the LA are illustrated in Figure
2. The signatory states that have an official language in common with one of the official language
of the EPO agree to dispense completely with translation (art 1(1) of the LA). The other signatory
states have adopted different facets of the London Agreement, especially for the two main
sections of a patent (the description section and the claims section). The states having no official
language in common with one of the official languages of the EPO require a translation of claims
into one of their own official languages (art 1(3) of the LA), and optionally they may require the
description to be translated into the prescribed language of the EPO (art 1(2) of the LA). In case of
litigation, a full translation of the European patent into an official language of the state in which
the alleged infringement took place is necessary prior to the suit (art 2 of the LA). The countries
that have not signed the London Agreement still require the translation of the whole patent into
7 Cf. Mejer and van Pottelsberghe (2008), who provide several case studies of litigations that yielded opposite results
in various countries. One of the patent infringements lawsuit concerns Document Security Systems (DSS) v European
Central Bank (ECB). The US company DDS sued the ECB in August 2005 at the European Court of First Instance, alleging
that the euro banknotes produced by the ECB infringe its European patent EP 0455750 relating to anti‐counterfeiting
technology (DDS accused the ECB of infringing its technology in the production process of banknotes). Differences
across jurisdictions led to uphold the patent at the court of first instance in Germany and the Netherlands but it was
invalidated in France.
8 Note that the entry into force of the London Agreement was conditional on ratification by at least eight countries,
including France, Germany, and United Kingdom (London Agreement, 2000).

8/6/2019 WP London-Agreement Oct 2008
http://slidepdf.com/reader/full/wp-london-agreement-oct-2008 7/28
The London Agreement
6
their official language(s).
8/6/2019 WP London-Agreement Oct 2008
http://slidepdf.com/reader/full/wp-london-agreement-oct-2008 8/28
The London Agreement
7
Figure 2: Translation requirements in EPC member states, as of the 1st
of May 2008
(1) The language of the European Patent at grant is the ‘procedural language’ (one of the EPO official languages i.e.
English, French or German). However, the EPO requires a patentee to provide a translation of claims into the two
other official languages of the EPO before the publication in the European Patent Bulletin;
(2) The countries having no official language in common with one of the three EPO official languages may require the
translation of the description to be supplied in the official language of the EPO prescribed by that state.
In practice, for the validation of the European patent in Belgium, Germany, France, Luxembourg,
Monaco, the United Kingdom and Switzerland/Lichtenstein, no translation is required, for
validation in Latvia and Slovenia only the claims must be translated into their national language, as
they accept descriptions written in any of the EPO official languages. Five countries (Croatia,
Denmark, Iceland, The Netherlands and Sweden) require claims to be translated into their official
languages and the descriptions to be translated into English. Austria and Ireland remain the only
countries that have a language in common with the EPO but have not yet ratified the London
Agreement.
3. The cost impact of the London Agreement
This section provides simulations of the cost reductions induced by the London Agreement. We
begin with a methodological description and then demonstrate the relative cost savings under
various scenarios (number of countries and types of expenditures accounted for).
3.1. Methodology and working hypotheses
D: NO
C: NO1
Patent
DESCRIPTION (D)
CLAIMS (C)
BE, CH, DE, FR, LI,
LU, MC, UK
LV, SI HR, DK, IS,
NL, SE
AT, BG, CZ, CY, EE, ES, FI, GR,
HU, IE, IT, LT, MT, NO, PL, PT, RO,
SK, TR
D: NO
C: YES
D: EN2
C: YES
D: YES
C: YES
Non-signatories of the LA (19)
common language
with the EPO (8)
no common language
with the EPO (7)
Signatories of the LA (15)
8/6/2019 WP London-Agreement Oct 2008
http://slidepdf.com/reader/full/wp-london-agreement-oct-2008 9/28
The London Agreement
8
Expenses associated with the patent granting process and with patent maintenance can be
decomposed into four categories (van Pottelsberghe and François, 2006):
1. Procedural costs are composed of fees payable to the patent office up to grant, namely: filing
fees, search fees, patent publication fees, examination fees, grant fees (for issuing a patent)
and validation fees9.
In addition to those fixed fees, patent offices sometimes charge claim‐
based and page‐based fees to limit the filing of large documents. Additionally, the patent office
may charge annual fees for maintaining a patent application that is still pending in the
examination process.
2. Translation costs occur when the validation procedure requires the applicant to submit a
patent translated into the national language of the patent office (cf. Figure 2 for the
translation requirements requested by all EPC member states). The actual translation costs
incurred depend on two factors: the patent size and the number of countries that are targeted
for protection once the patent is granted by the EPO. Estimating those costs is not
straightforward as they have two components: (i) a language specific translation cost10
and (ii)
a transaction cost which frequently includes intermediation with patent attorneys.
3. Maintenance costs occur after grant and consist of the payment of renewal fees that must be
paid in each desired country for a maximum period of 20 years from the priority date. In
general, these fees increase over time. Renewal fees are due annually or periodically (North
America).
4. External expenses are composed of the service costs of legal advice starting from the very first
step of drafting a patent application, up to the representation before the patent office, until
the patent falls into public domain. While large firms usually have their own intellectual
property departments, with officially accredited attorneys, small firms must always rely on
external services provided by legal advisors and accredited patent attorneys.
Estimating patent costs is therefore far from straightforward, as several components are not easy
to quantify and depend on the patentee’s filing strategy (e.g. the patent size, the application
route, the quality of external services, the desired speed of examination process, and the targeted
geographical scope of protection). Patents that have a large number of claims and pages (i.e.,
biotechnology patents) generate higher costs than smaller patents (i.e. traditional technologies)11.
The complexity of the document will influence the number of interactions with the patent office
therefore increasing the level of external expenses (as illustrated in Lazaridis and van
Pottelsberghe, 2008). Furthermore, the cost of patent enforcement will depend on the desired
geographical scope and the level of renewal fees.
9 Once the European patent is granted, it must be validated in the desired member states to be effectively enforced.
Validation fees are paid to national patent offices for the publication of the translated patent.
10 Harhoff et al. (2008) classify languages according to the level of costs of translations incurred by the patent holder.
In general, translations into languages spoken in central and Southeastern Europe are less expensive than translations
into the Nordic languages. Ginsburgh (2005) and Fidrmuc and Ginsburgh (2007) provide theoretical and empirical
evidence supporting the idea that some languages are more difficult than others, implicitly inducing higher translation
costs.
11 Stevnsborg and van Pottelsberghe (2007) present a typology of filing strategies and discuss their impact on the
examination process.
8/6/2019 WP London-Agreement Oct 2008
http://slidepdf.com/reader/full/wp-london-agreement-oct-2008 10/28
The London Agreement
9
In order to approximate the cost of patenting, two methods can be applied. The first is to conduct
a survey among the patenting companies about the costs they incur during the granting process
and the costs of keeping their patents in force (this first approach has been performed by Roland
Berger (2005) for the companies that have filed at least one patent with the EPO). The advantage
of a survey is that it provides a direct evaluation of patenting expenses. However, information
obtained from the companies will also reflect their filing strategies, the results being dependent
on the sample selection (i.e. small versus large companies, different fields of technology, different
routes). In addition, there is no standard accounting approach to patenting costs, especially the
external (or internal for large firms) services. The second method involves simulating the costs
from the available (and complex) fee structures. It is more straightforward than the survey
approach, allows calculation of the costs for different scenarios regarding the geographical scope
for protection, and makes international comparisons easier.
The adopted simulation methodology is based on the one put forward by van Pottelsberghe and
François (2006). Relying on the data presented by Harhoff et al. (2008) on the share of EPO
granted patents that were validated in each EPC contracting states in 2003, we consider four
scenarios for the geographical scope of protection:
EPO‐3: Germany (DE), France (FR) and the United Kingdom (UK) – with at least 75
percent of the patents granted by the EPO being validated in each of these
counties after the grant by the EPO;
EPO‐6: includes EPO‐3 and Switzerland (CH), Italy (IT), and The Netherlands (NL) –
the three countries with more than 30 percent of the patents granted by the
EPO being enforced there;
EPO‐13: EPO‐6 and Austria (AT), Belgium (BE), Spain (ES), Denmark (DK), Finland (FI),
Ireland (IE), Sweden (SE) – with more than 12 percent of the patents granted
by the EPO being enforced there;
EPO‐34: the geographical scope includes all the 34 EPC contracting states;
Due to the existence of different filing routes and differences between patent office fee
structures, the following working hypotheses are made:
1. Filing route: direct filing at the EPO. For the sake of simplicity neither the PCT route (and
hence the fees requested by the World Intellectual Property Office) nor the national priority
filing fees (i.e., the fees paid at the national patent office for the priority filing that precedes
the EPO application) are accounted for.
2. No fees for SMEs, and no other special fees. Patent offices frequently allow reductions for
individual applicants or small and medium enterprises. In our analysis we do not account for
those discounts. All fees that are payable during the granting process are calculated for a
standard patent application. Moreover, we assume that all payments are made on time, thus
no fines are incurred because of late payment.
3. Patent size. The simulations are based on the average patent filing in terms of the numbers of
claims and pages.
4. External expenses. The cost of external services is difficult to measure as it depends on the
complexity of the application and the quality of the requested services. Depending on the
stage of the patent application, we can distinguish between three types of external expenses:
8/6/2019 WP London-Agreement Oct 2008
http://slidepdf.com/reader/full/wp-london-agreement-oct-2008 11/28
The London Agreement
1
(i) pre‐ filing expenses: cost of novelty search and of drafting patent application; (ii)
representation before the patent office: from filing the patent application up to its grant; and
(iii) post ‐grant expenses: validation and maintenance in designated states. In order to
approximate these arms’ length costs, 11 large patent attorney companies were contacted in
five countries. Their fee structures for legal advice, patent drafting and representation before
patent offices (for the methodological approach see table A.4 in the Appendix) are
summarised in Table 1.
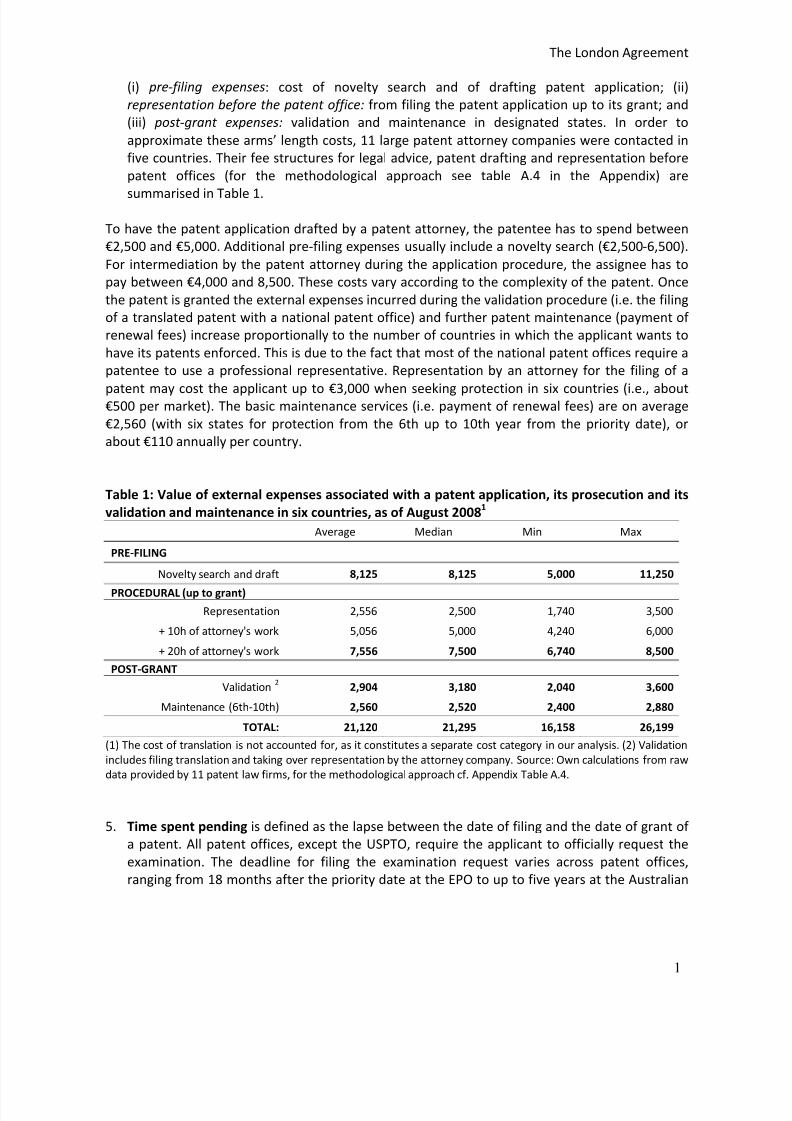
To have the patent application drafted by a patent attorney, the patentee has to spend between
€2,500 and €5,000. Additional pre‐filing expenses usually include a novelty search (€2,500‐6,500).
For intermediation by the patent attorney during the application procedure, the assignee has to
pay between €4,000 and 8,500. These costs vary according to the complexity of the patent. Once
the patent is granted the external expenses incurred during the validation procedure (i.e. the filing
of a translated patent with a national patent office) and further patent maintenance (payment of
renewal fees) increase proportionally to the number of countries in which the applicant wants to
have its patents enforced. This is due to the fact that most of the national patent offices require a
patentee to use a professional representative. Representation by an attorney for the filing of a
patent may cost the applicant up to €3,000 when seeking protection in six countries (i.e., about
€500 per market). The basic maintenance services (i.e. payment of renewal fees) are on average
€2,560 (with six states for protection from the 6th up to 10th year from the priority date), or
about €110 annually per country.
Table 1: Value of external expenses associated with a patent application, its prosecution and its
validation and maintenance in six countries, as of August 20081
Average Median Min Max
PRE‐FILING
Novelty search and draft 8,125 8,125 5,000 11,250
PROCEDURAL (up to grant)
Representation 2,556 2,500 1,740 3,500
+ 10h of attorney's work 5,056 5,000 4,240 6,000
+ 20h of attorney's work 7,556 7,500 6,740 8,500
POST‐GRANT
Validation
2
2,904 3,180 2,040 3,600
Maintenance (6th‐10th) 2,560 2,520 2,400 2,880
TOTAL: 21,120 21,295 16,158 26,199
(1) The cost of translation is not accounted for, as it constitutes a separate cost category in our analysis. (2) Validation
includes filing translation and taking over representation by the attorney company. Source: Own calculations from raw
data provided by 11 patent law firms, for the methodological approach cf. Appendix Table A.4.
5. Time spent pending is defined as the lapse between the date of filing and the date of grant of
a patent. All patent offices, except the USPTO, require the applicant to officially request the
examination. The deadline for filing the examination request varies across patent offices,
ranging from 18 months after the priority date at the EPO to up to five years at the Australian
8/6/2019 WP London-Agreement Oct 2008
http://slidepdf.com/reader/full/wp-london-agreement-oct-2008 12/28
The London Agreement
1
Patent Office (AU‐PO)12
.
We assume that there is no substantial delay due to the strategic
behaviour of applicants and that the request for substantive examination is filed once the
search report is published (generally 18 months after the priority date).
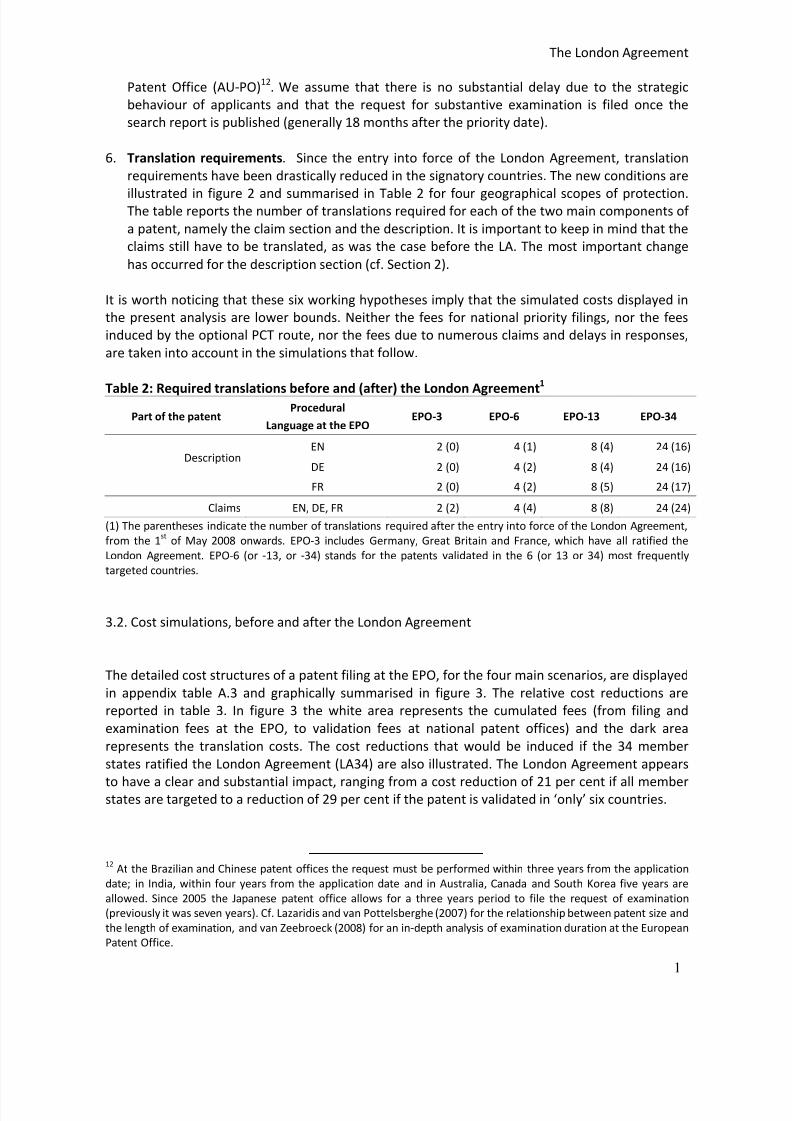
6. Translation requirements. Since the entry into force of the London Agreement, translation
requirements have been drastically reduced in the signatory countries. The new conditions are
illustrated in figure 2 and summarised in Table 2 for four geographical scopes of protection.
The table reports the number of translations required for each of the two main components of
a patent, namely the claim section and the description. It is important to keep in mind that the
claims still have to be translated, as was the case before the LA. The most important change
has occurred for the description section (cf. Section 2).
It is worth noticing that these six working hypotheses imply that the simulated costs displayed in
the present analysis are lower bounds. Neither the fees for national priority filings, nor the fees
induced by the optional PCT route, nor the fees due to numerous claims and delays in responses,
are taken into account in the simulations that follow.
Table 2: Required translations before and (after) the London Agreement
1
Part of the patent
Procedural
Language at the EPO
EPO‐3 EPO‐6 EPO‐13 EPO‐34
Description
EN 2 (0) 4 (1) 8 (4) 24 (16)
DE 2 (0) 4 (2) 8 (4) 24 (16)
FR 2 (0) 4 (2) 8 (5) 24 (17)
Claims EN, DE, FR 2 (2) 4 (4) 8 (8) 24 (24)
(1) The parentheses indicate the number of translations required after the entry into force of the London Agreement,
from the 1st
of May 2008 onwards. EPO‐3 includes Germany, Great Britain and France, which have all ratified the
London Agreement. EPO‐6 (or ‐13, or ‐34) stands for the patents validated in the 6 (or 13 or 34) most frequently
targeted countries.
3.2. Cost simulations, before and after the London Agreement
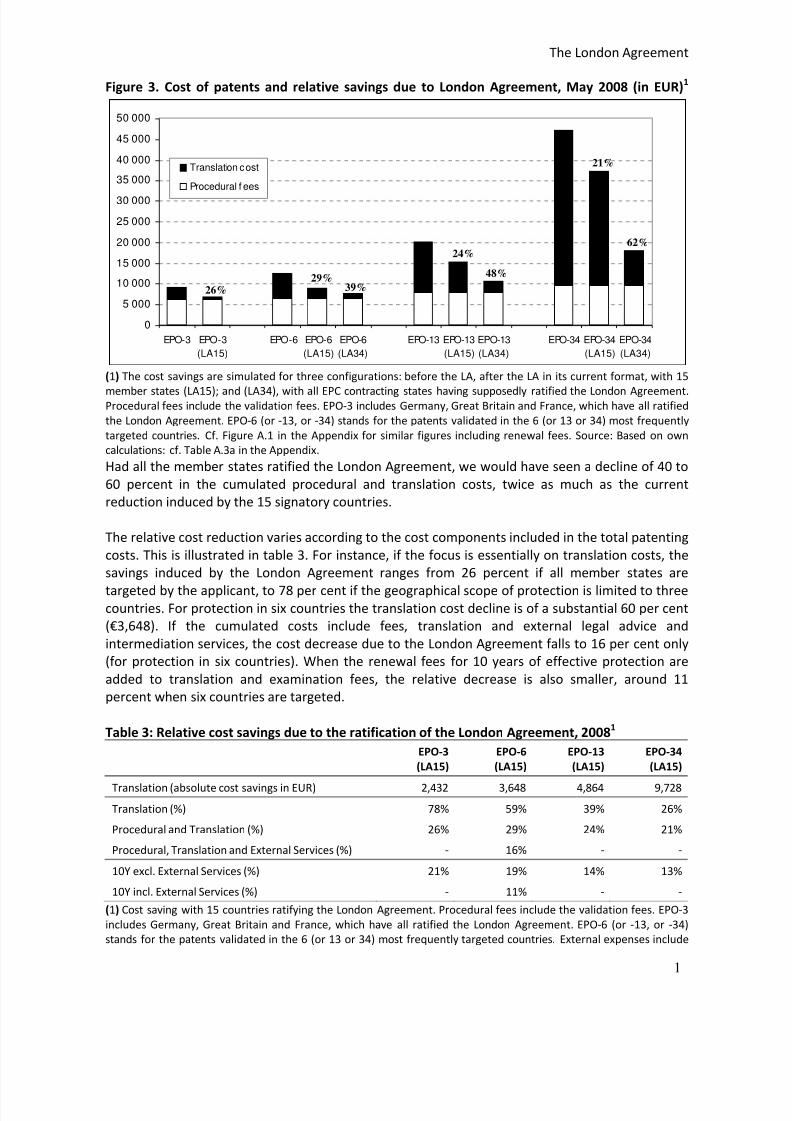
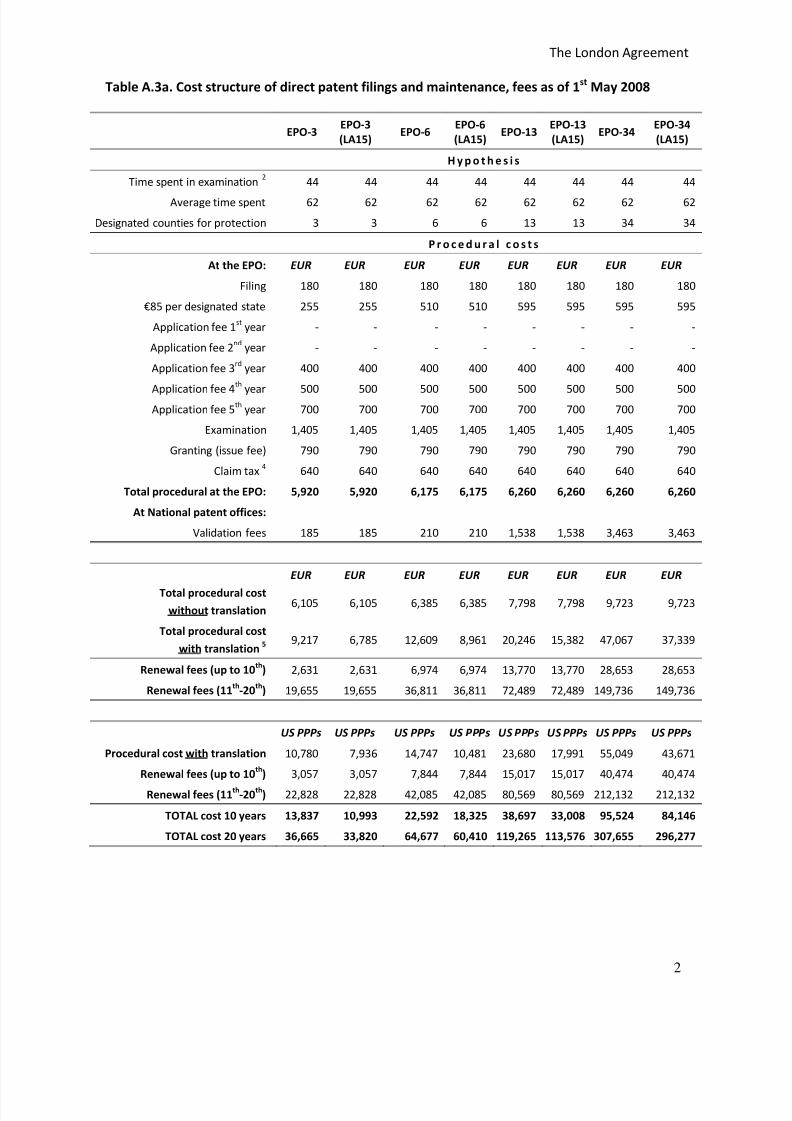
The detailed cost structures of a patent filing at the EPO, for the four main scenarios, are displayed
in appendix table A.3 and graphically summarised in figure 3. The relative cost reductions are
reported in table 3. In figure 3 the white area represents the cumulated fees (from filing and
examination fees at the EPO, to validation fees at national patent offices) and the dark area
represents the translation costs. The cost reductions that would be induced if the 34 member
states ratified the London Agreement (LA34) are also illustrated. The London Agreement appears
to have a clear and substantial impact, ranging from a cost reduction of 21 per cent if all member
states are targeted to a reduction of 29 per cent if the patent is validated in ‘only’ six countries.
12 At the Brazilian and Chinese patent offices the request must be performed within three years from the application
date; in India, within four years from the application date and in Australia, Canada and South Korea five years are
allowed. Since 2005 the Japanese patent office allows for a three years period to file the request of examination
(previously it was seven years). Cf. Lazaridis and van Pottelsberghe (2007) for the relationship between patent size and
the length of examination, and van Zeebroeck (2008) for an in‐depth analysis of examination duration at the European
Patent Office.
8/6/2019 WP London-Agreement Oct 2008
http://slidepdf.com/reader/full/wp-london-agreement-oct-2008 13/28
The London Agreement
1
Figure 3. Cost of patents and relative savings due to London Agreement, May 2008 (in EUR)1
0
5 000
10 000
15 000
20 000
25 000
30 000
35 000
40 000
45 000
50 000
EPO-3 EPO-3
(LA15)
EPO-6 EPO-6
(LA15)
EPO-6
(LA34)
EPO-13 EPO-13
(LA15)
EPO-13
(LA34)
EPO-34 EPO-34
(LA15)
EPO-34
(LA34)
Translation cost
Procedural f ees
(1)
The cost savings are simulated for three configurations: before the LA, after the LA in its current format, with 15
member states (LA15); and (LA34), with all EPC contracting states having supposedly ratified the London Agreement.
Procedural fees include the validation fees. EPO‐3 includes Germany, Great Britain and France, which have all ratified
the London Agreement. EPO‐6 (or ‐13, or ‐34) stands for the patents validated in the 6 (or 13 or 34) most frequently
targeted countries. Cf. Figure A.1 in the Appendix for similar figures including renewal fees. Source: Based on own
calculations: cf. Table A.3a in the Appendix.
Had all the member states ratified the London Agreement, we would have seen a decline of 40 to
60 percent in the cumulated procedural and translation costs, twice as much as the current
reduction induced by the 15 signatory countries.
The relative cost reduction varies according to the cost components included in the total patenting
costs. This is illustrated in table 3. For instance, if the focus is essentially on translation costs, the
savings induced by the London Agreement ranges from 26 percent if all member states are
targeted by the applicant, to 78 per cent if the geographical scope of protection is limited to three
countries. For protection in six countries the translation cost decline is of a substantial 60 per cent
(€3,648). If the cumulated costs include fees, translation and external legal advice and
intermediation services, the cost decrease due to the London Agreement falls to 16 per cent only
(for protection in six countries). When the renewal fees for 10 years of effective protection are
added to translation and examination fees, the relative decrease is also smaller, around 11
percent when six countries are targeted.
Table 3: Relative cost savings due to the ratification of the London Agreement, 20081
EPO‐3
(LA15)
EPO‐6
(LA15)
EPO‐13
(LA15)
EPO‐34
(LA15)
Translation (absolute cost savings in EUR) 2,432 3,648 4,864 9,728
Translation (%) 78% 59% 39% 26%
Procedural and Translation (%) 26% 29% 24% 21%
Procedural, Translation and External Services (%) ‐ 16% ‐ ‐
10Y excl. External Services (%) 21% 19% 14% 13%
10Y incl. External Services (%) ‐ 11% ‐ ‐
(1)
Cost saving with 15 countries ratifying the London Agreement. Procedural fees include the validation fees. EPO‐3
includes Germany, Great Britain and France, which have all ratified the London Agreement. EPO‐6 (or ‐13, or ‐34)
stands for the patents validated in the 6 (or 13 or 34) most frequently targeted countries. External expenses include
26%29%
24%
21%
62%
39%
48%
8/6/2019 WP London-Agreement Oct 2008
http://slidepdf.com/reader/full/wp-london-agreement-oct-2008 14/28
The London Agreement
1
the average cost of pre‐filing, processing an application, including 20 hours of patent attorney’s work and validation;
novelty and search cost are not taken into account (cf. Table 2). Source: Based on own calculations: cf. Table A.3a and
Table A.4 in the Appendix.
In a nutshell, the relative cost reduction varies according to the desired geographical scope of
protection and the type of cost considered. If companies continue to limit their validation
strategies to about six countries, the London Agreement leads to a drop of about 30 percent in the
cumulated cost of patenting. This is a significant drop, and will probably substantially affect the
patenting behaviour of applicants.
The level of cost reduction is quite substantial. Before the London Agreement, a firm having a
patent granted by the EPO and validated in six countries (the observed average) would bear
translation costs of about €6,300. Since the implementation of the LA, the costs are reduced to
€2,600, resulting in total “translation” savings of about €3,700 per patent. Multiplying this cost‐
cutting by the number of patents granted each year by the EPO, around 60,000, yields a total
saving for the business sector of about €220 million. Before analysing the behavioural
consequences of the London Agreement (section 5), it is worth analysing how Europe compares
with the rest of the world in terms of patenting costs.
8/6/2019 WP London-Agreement Oct 2008
http://slidepdf.com/reader/full/wp-london-agreement-oct-2008 15/28
The London Agreement
1
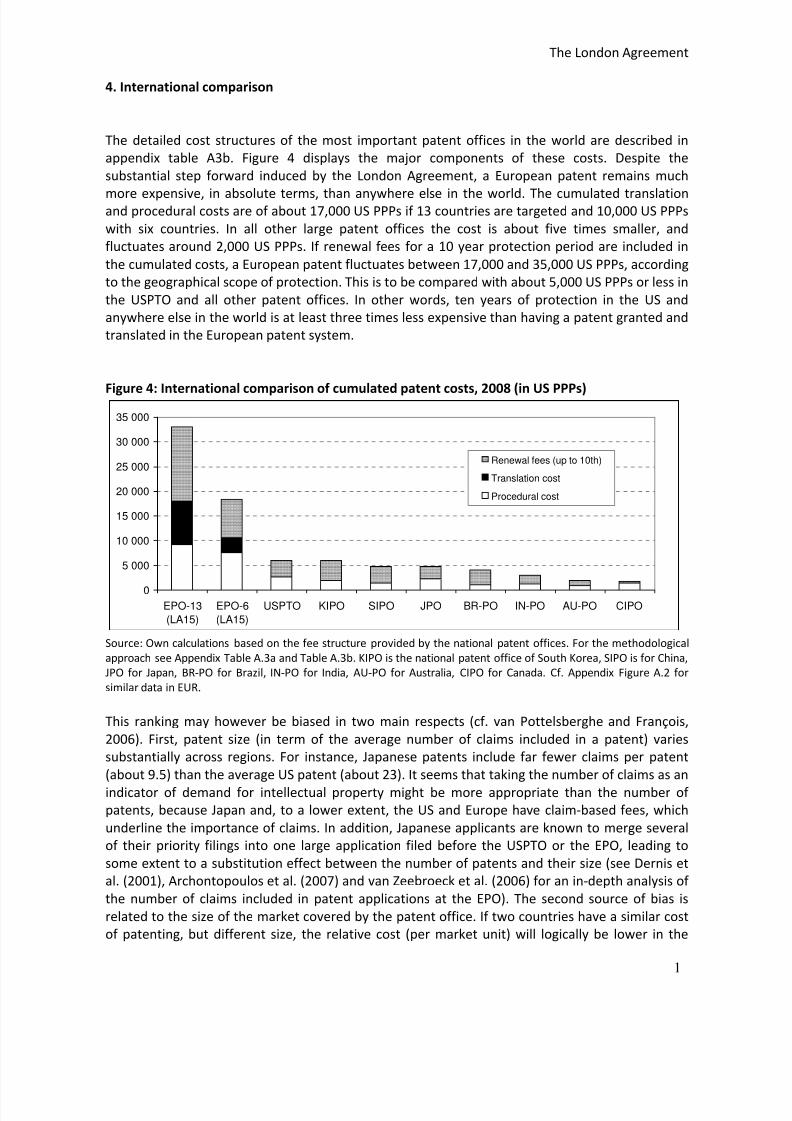
4. International comparison
The detailed cost structures of the most important patent offices in the world are described in
appendix table A3b. Figure 4 displays the major components of these costs. Despite the
substantial step forward induced by the London Agreement, a European patent remains much
more expensive, in absolute terms, than anywhere else in the world. The cumulated translation
and procedural costs are of about 17,000 US PPPs if 13 countries are targeted and 10,000 US PPPs
with six countries. In all other large patent offices the cost is about five times smaller, and
fluctuates around 2,000 US PPPs. If renewal fees for a 10 year protection period are included in
the cumulated costs, a European patent fluctuates between 17,000 and 35,000 US PPPs, according
to the geographical scope of protection. This is to be compared with about 5,000 US PPPs or less in
the USPTO and all other patent offices. In other words, ten years of protection in the US and
anywhere else in the world is at least three times less expensive than having a patent granted and
translated in the European patent system.
Figure 4: International comparison of cumulated patent costs, 2008 (in US PPPs)
0
5 000
10 000
15 000
20 000
25 000
30 000
35 000
EPO-13
(LA15)
EPO-6
(LA15)
USPTO KIPO SIPO JPO BR-PO IN-PO AU-PO CIPO
Renewal fees (up to 10th)
Translation cost
Procedural cost
Source: Own calculations based on the fee structure provided by the national patent offices. For the methodological
approach see Appendix Table A.3a and Table A.3b. KIPO is the national patent office of South Korea, SIPO is for China,
JPO for Japan, BR‐PO for Brazil, IN‐PO for India, AU‐PO for Australia, CIPO for Canada. Cf. Appendix Figure A.2 for
similar data in EUR.
This ranking may however be biased in two main respects (cf. van Pottelsberghe and François,
2006). First, patent size (in term of the average number of claims included in a patent) varies
substantially across regions. For instance, Japanese patents include far fewer claims per patent
(about 9.5) than the average US patent (about 23). It seems that taking the number of claims as an
indicator of demand for intellectual property might be more appropriate than the number of
patents, because Japan and, to a lower extent, the US and Europe have claim‐based fees, which
underline the importance of claims. In addition, Japanese applicants are known to merge several
of their priority filings into one large application filed before the USPTO or the EPO, leading to
some extent to a substitution effect between the number of patents and their size (see Dernis et
al. (2001), Archontopoulos et al. (2007) and van Zeebroeck et al. (2006) for an in‐depth analysis of
the number of claims included in patent applications at the EPO). The second source of bias is
related to the size of the market covered by the patent office. If two countries have a similar cost
of patenting, but different size, the relative cost (per market unit) will logically be lower in the
8/6/2019 WP London-Agreement Oct 2008
http://slidepdf.com/reader/full/wp-london-agreement-oct-2008 16/28
The London Agreement
1
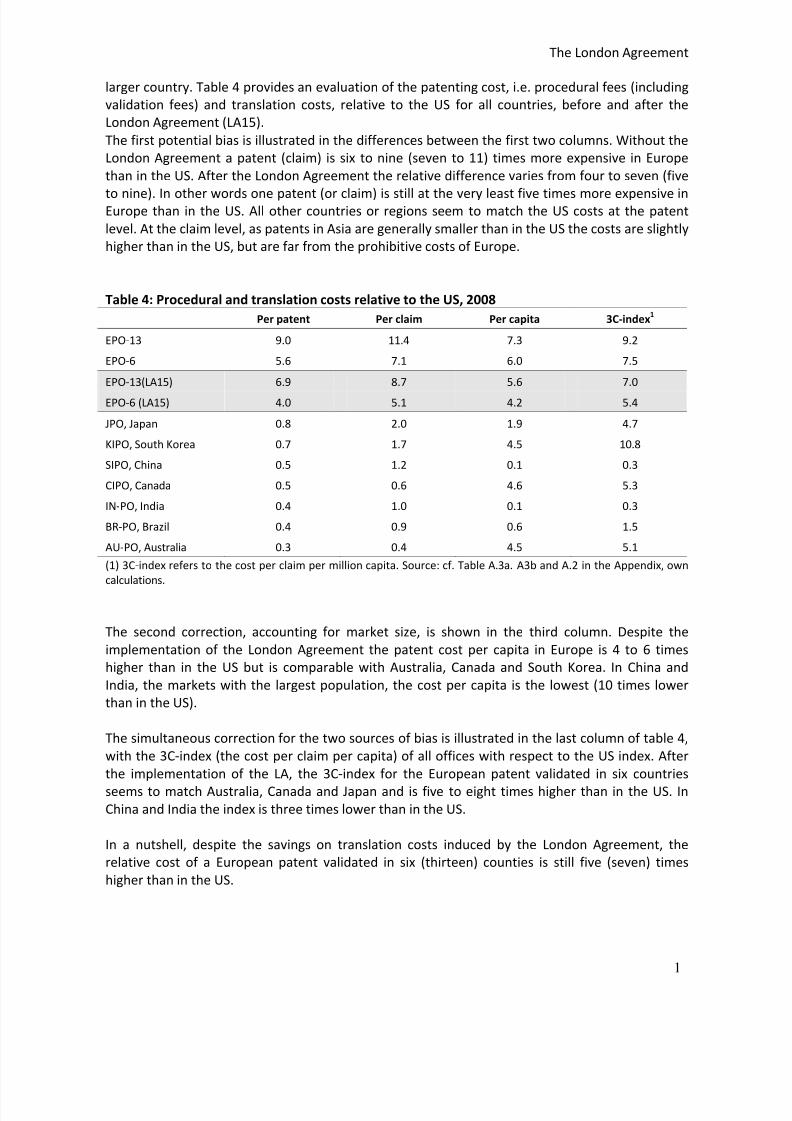
larger country. Table 4 provides an evaluation of the patenting cost, i.e. procedural fees (including
validation fees) and translation costs, relative to the US for all countries, before and after the
London Agreement (LA15).
The first potential bias is illustrated in the differences between the first two columns. Without the
London Agreement a patent (claim) is six to nine (seven to 11) times more expensive in Europe
than in the US. After the London Agreement the relative difference varies from four to seven (five
to nine). In other words one patent (or claim) is still at the very least five times more expensive in
Europe than in the US. All other countries or regions seem to match the US costs at the patent
level. At the claim level, as patents in Asia are generally smaller than in the US the costs are slightly
higher than in the US, but are far from the prohibitive costs of Europe.
Table 4: Procedural and translation costs relative to the US, 2008
Per patent Per claim Per capita 3C‐index1
EPO‐13 9.0 11.4 7.3 9.2
EPO‐6 5.6 7.1 6.0 7.5
EPO‐13(LA15) 6.9 8.7 5.6 7.0
EPO‐6 (LA15) 4.0 5.1 4.2 5.4
JPO, Japan 0.8 2.0 1.9 4.7
KIPO, South Korea 0.7 1.7 4.5 10.8
SIPO, China 0.5 1.2 0.1 0.3
CIPO, Canada 0.5 0.6 4.6 5.3
IN‐PO, India 0.4 1.0 0.1 0.3
BR‐PO, Brazil 0.4 0.9 0.6 1.5
AU‐PO, Australia 0.3 0.4 4.5 5.1
(1) 3C‐index refers to the cost per claim per million capita. Source: cf. Table A.3a. A3b and A.2 in the Appendix, own
calculations.
The second correction, accounting for market size, is shown in the third column. Despite the
implementation of the London Agreement the patent cost per capita in Europe is 4 to 6 times
higher than in the US but is comparable with Australia, Canada and South Korea. In China and
India, the markets with the largest population, the cost per capita is the lowest (10 times lower
than in the US).
The simultaneous correction for the two sources of bias is illustrated in the last column of table 4,
with the 3C‐index (the cost per claim per capita) of all offices with respect to the US index. After
the implementation of the LA, the 3C‐index for the European patent validated in six countries
seems to match Australia, Canada and Japan and is five to eight times higher than in the US. In
China and India the index is three times lower than in the US.
In a nutshell, despite the savings on translation costs induced by the London Agreement, the
relative cost of a European patent validated in six (thirteen) counties is still five (seven) times
higher than in the US.
8/6/2019 WP London-Agreement Oct 2008
http://slidepdf.com/reader/full/wp-london-agreement-oct-2008 17/28
The London Agreement
1
5. Potential impact on the demand for patents
The likely impact of the London Agreement on the patenting behaviour of applicants is twofold.
On the one hand the cost reduction of about 30 per cent may induce firms to file more
applications at the EPO, while keeping an average target for validations of about six countries on
average per patent. On the other hand, as the cost reduction concerns the translation
requirements, one may also expect companies to validate their patent in more countries. The
actual effect will likely fall between these two opposite impacts, with an increase in both the
number of patents and the number of countries of validation each year. The remainder of this
section subsequently investigates the two potential effects in the light of recent quantitative
findings.
Let us first assume that, due to the high level of renewal fees in each EPC member state,
applicants will continue to limit their geographical scope of protection to six countries on average.
In this case, the cost reduction induced by the London Agreement will essentially affect the
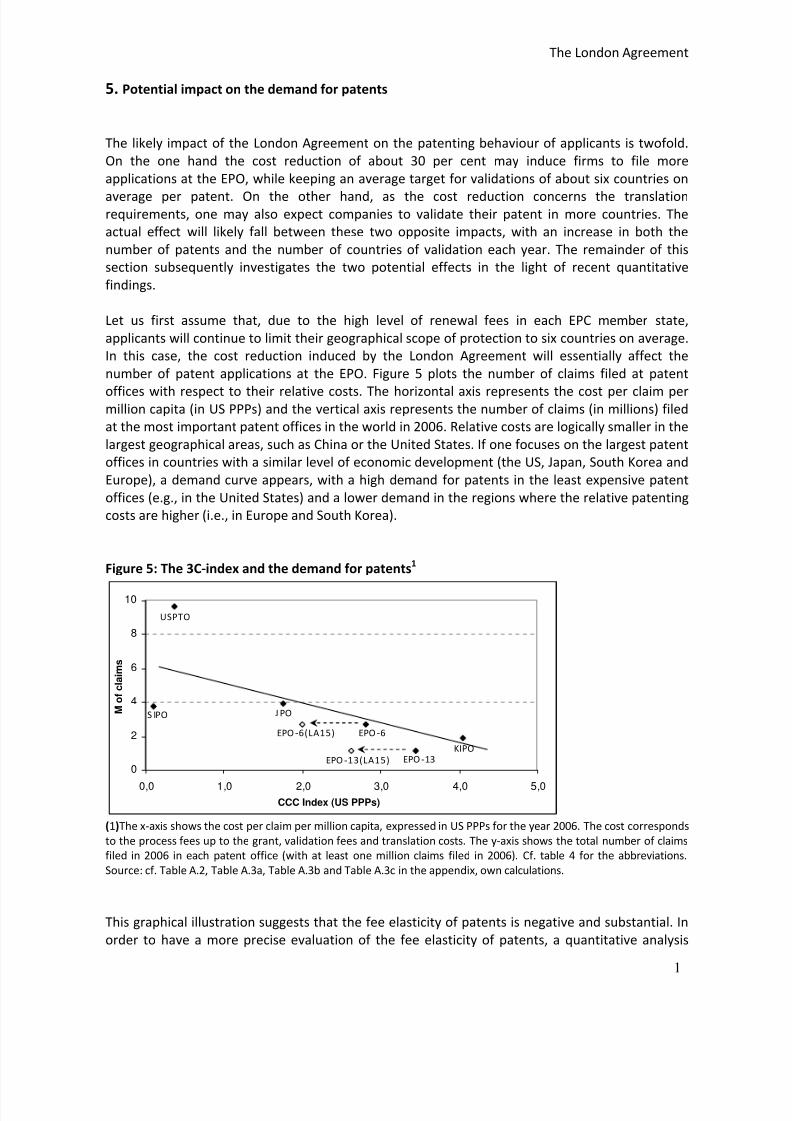
number of patent applications at the EPO. Figure 5 plots the number of claims filed at patent
offices with respect to their relative costs. The horizontal axis represents the cost per claim per
million capita (in US PPPs) and the vertical axis represents the number of claims (in millions) filed
at the most important patent offices in the world in 2006. Relative costs are logically smaller in the
largest geographical areas, such as China or the United States. If one focuses on the largest patent
offices in countries with a similar level of economic development (the US, Japan, South Korea and
Europe), a demand curve appears, with a high demand for patents in the least expensive patent
offices (e.g., in the United States) and a lower demand in the regions where the relative patenting
costs are higher (i.e., in Europe and South Korea).
Figure 5: The 3C‐index and the demand for patents1
EPO ‐6EPO ‐6(LA15)
EPO ‐13EPO ‐13(LA15)
USPTO
J POS IPO
KIPO
0
2
4
6
8
10
0,0 1,0 2,0 3,0 4,0 5,0CCC Index (US PPPs)
M o
f c l a i m s
(1)The x‐axis shows the cost per claim per million capita, expressed in US PPPs for the year 2006. The cost corresponds
to the process fees up to the grant, validation fees and translation costs. The y‐axis shows the total number of claims
filed in 2006 in each patent office (with at least one million claims filed in 2006). Cf. table 4 for the abbreviations.
Source: cf. Table A.2, Table A.3a, Table A.3b and Table A.3c in the appendix, own calculations.
This graphical illustration suggests that the fee elasticity of patents is negative and substantial. In
order to have a more precise evaluation of the fee elasticity of patents, a quantitative analysis
8/6/2019 WP London-Agreement Oct 2008
http://slidepdf.com/reader/full/wp-london-agreement-oct-2008 18/28
The London Agreement
1
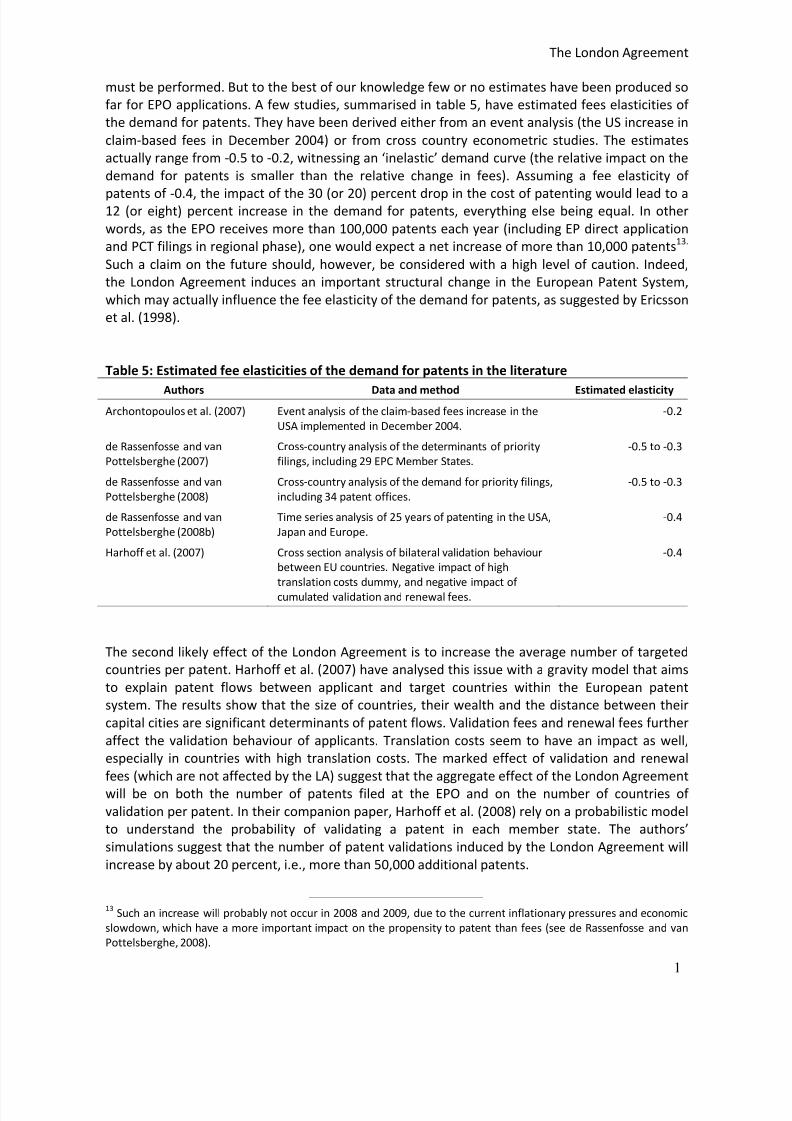
must be performed. But to the best of our knowledge few or no estimates have been produced so
far for EPO applications. A few studies, summarised in table 5, have estimated fees elasticities of
the demand for patents. They have been derived either from an event analysis (the US increase in
claim‐based fees in December 2004) or from cross country econometric studies. The estimates
actually range from ‐0.5 to ‐0.2, witnessing an ‘inelastic’ demand curve (the relative impact on the
demand for patents is smaller than the relative change in fees). Assuming a fee elasticity of
patents of ‐0.4, the impact of the 30 (or 20) percent drop in the cost of patenting would lead to a
12 (or eight) percent increase in the demand for patents, everything else being equal. In other
words, as the EPO receives more than 100,000 patents each year (including EP direct application
and PCT filings in regional phase), one would expect a net increase of more than 10,000 patents13.
Such a claim on the future should, however, be considered with a high level of caution. Indeed,
the London Agreement induces an important structural change in the European Patent System,
which may actually influence the fee elasticity of the demand for patents, as suggested by Ericsson
et al. (1998).
Table 5: Estimated fee elasticities of the demand for patents in the literature
Authors Data and method Estimated elasticity
Archontopoulos et al. (2007) Event analysis of the claim‐based fees increase in the
USA implemented in December 2004.
‐0.2
de Rassenfosse and van
Pottelsberghe (2007)
Cross‐country analysis of the determinants of priority
filings, including 29 EPC Member States.
‐0.5 to ‐0.3
de Rassenfosse and van
Pottelsberghe (2008)
Cross‐country analysis of the demand for priority filings,
including 34 patent offices.
‐0.5 to ‐0.3
de Rassenfosse and van
Pottelsberghe (2008b)
Time series analysis of 25 years of patenting in the USA,
Japan and Europe.
‐0.4
Harhoff et al. (2007) Cross section analysis of bilateral validation behaviour
between EU countries. Negative impact of high
translation costs dummy, and negative impact of
cumulated validation and renewal fees.
‐0.4
The second likely effect of the London Agreement is to increase the average number of targeted
countries per patent. Harhoff et al. (2007) have analysed this issue with a gravity model that aims
to explain patent flows between applicant and target countries within the European patent
system. The results show that the size of countries, their wealth and the distance between their
capital cities are significant determinants of patent flows. Validation fees and renewal fees further
affect the validation behaviour of applicants. Translation costs seem to have an impact as well,
especially in countries with high translation costs. The marked effect of validation and renewal
fees (which are not affected by the LA) suggest that the aggregate effect of the London Agreement
will be on both the number of patents filed at the EPO and on the number of countries of
validation per patent. In their companion paper, Harhoff et al. (2008) rely on a probabilistic model
to understand the probability of validating a patent in each member state. The authors’
simulations suggest that the number of patent validations induced by the London Agreement will
increase by about 20 percent, i.e., more than 50,000 additional patents.
13 Such an increase will probably not occur in 2008 and 2009, due to the current inflationary pressures and economic
slowdown, which have a more important impact on the propensity to patent than fees (see de Rassenfosse and van
Pottelsberghe, 2008).
8/6/2019 WP London-Agreement Oct 2008
http://slidepdf.com/reader/full/wp-london-agreement-oct-2008 19/28
The London Agreement
1
6. Concluding remarks
This paper has analysed the potential consequences of the recently ratified London Agreement,
which reduces the patent translation requirements in 15 out of 34 EPC Member States. The
simulations suggest that the cumulated costs of patenting have been reduced by 20 to 30 percent
thanks to the coming into force of the London Agreement, in May 2008. The relative drop depends
on the number of countries targeted for protection and on the type of costs considered. If external
expenses and renewal fees for protection for 10 years are considered, the drop is only about 11
percent of total costs.
In nominal terms, for the average patent which targets six countries for protection, the cost
savings are about 3,600 EUR. Given the fact that the EPO grants about 60,000 patents each year,
the total saving for the business sector is about €220 million. As well as these substantial cost
savings, one may expect an increase in the demand for patents of eight to 12 percent, everything
else being equal.
It is important to keep in mind that translation costs still have to be supported for the claims’
section of a patent, and that cumulated (over the number of countries targeted for protection)
national validation and renewal fees outperform by far the renewal fees observed elsewhere.
Despite the substantial reduction induced by the London Agreement, the relative cost of a
European patent is still at least four times higher than in the US (and any other large national
patent office). With a larger geographical scope for protection the relative cost of a patent in
Europe could increase up to ten times the cost of a US patent.
The question that directly pops up when these results are considered is whether these factors
affect the behaviour of applicants, and if yes, whether it is good or bad for patent systems. On the
first question, the evidence suggests that the propensity to patent is affected, although through an
inelastic price elasticity of ‐0.4. Is this then good for the patent system? A more expensive patent
is not particularly bad for an economy, provided it correlates with the quality of the examination
process, and provided the costs are not too prohibitive. In Europe the high costs actually
constitute a prohibitive barrier to patenting, as witnessed by the relatively small attractiveness of
the European market (which has only half the attractiveness of the US patent system in terms of
total applications, including PCT international applications). Given the current backlog issues
raised by the heads of the US, Japanese and European patent offices, one would be tempted to
conclude that it is actually good for the economy, as it limits somewhat the number of
applications. However, it must be kept in mind that the simulations presented in the present
paper all too amply demonstrate that what makes a European patent relatively expensive is to a
large extent due to the remaining translation costs and national renewal fees that must be paid in
the
countries
targeted
for
protection.
In
other
words,
the
high
cost
are
no
reflection
on
the
quality
of the patent system, but the managerial complexity and financial burden induced by a highly
fragmented patent system.
8/6/2019 WP London-Agreement Oct 2008
http://slidepdf.com/reader/full/wp-london-agreement-oct-2008 20/28
The London Agreement
1
References:
Archontopoulos E., D. Guellec, N. Stevnsborg, B. van Pottelsberghe de la Potterie, and N. van
Zeebroeck, 2007, When Small is Beautiful: Measuring the Evolution and Consequences of the
Voluminosity of Patent Applications at the EPO, Information Economics and Policy, 19(2),103‐
132.
de Rassenfosse G. and B. van Pottelsberghe de la Potterie, 2007, Per un Pugno di Dollari: A First
Look at the Price Elasticity of Patents, Oxford Review of Economic Policy, 23(4), 588‐604.
de Rassenfosse G. and B. van Pottelsberghe de la Potterie, 2008a, A Policy Insight into the R&D‐
Patent Relationship, CEPR Discussion Papers, 6716.
de Rassenfosse G. and B. van Pottelsberghe de la Potterie, 2008b, On the Price Elasticity of the
Demand for Patents, CEPR Discussion Paper, forthcoming.
Dernis, H., D. Guellec and B. van Pottelsberghe de la Potterie, 2001, Using Patent Counts for Cross‐
country Comparisons of Technology Output, STI Review, 27, OECD, Paris.
Ericsson H., D. Hendry and G. Mizon, 1998, Exogeneity, Cointegration, and Economic Policy
Analysis, Journal of Business and Economics Statistics, 16(4), 370‐387.
European Commission Communication, Enhancing the Patent System in Europe, COM(2007)165
final.
Fidrmuc J. and V. Ginsburgh, 2007, Languages in the European Union: The Quest for Equality and
its Cost, European Economic Review, 51 (6), 1351‐1369.
Ginsburgh V., 2005, Languages, Genes, and Cultures, Journal of Cultural Economics, 29 (1), 1‐17.
Guellec D. and B. van Pottelsberghe de la Potterie, 2007, The Economics of the European Patent
System, Oxford University Press, Oxford, 250 p.
Harhoff D., K. Hoisl, B. Reichl and B. van Pottelsberghe de la Potterie, 2007, Patent Validation at
the Country Level – the Role of Fees and Translation Costs, CEPR Discussion Paper No 6565.
Harhoff D., K. Hoisl and B. van Pottelsberghe de la Potterie, 2008, Languages, Fees and the
Regional Scope of Patenting in Europe, CEPR Discussion Paper, forthcoming.
Jensen P. H., A. Palangkaraya and E. Webster, 2008, Application Pendency Times and Outcomes
across Four Patent Offices, Intellectual Property Research Institute of Australia, Working Paper
No 01/08.
Lazaridis G. and B. van Pottelsberghe de la Potterie, 2007, The Rigour of EPO’s Patentability
Criteria: An Insight into the “Induced Withdrawals”, World Patent Information, 29 (4), 317‐326.
Mejer M. and B. van Pottelsberghe de la Potterie B, 2008, Economic Incongruities Induced by A
Fragmented Patent System in Europe, forthcoming.
Pakes A. and M. Schankerman, 1979, The Rate of Obsolescence of Knowledge, Research Gestation
Lags, and the Private Return to Research Resources, NBER Working Paper 0346.
8/6/2019 WP London-Agreement Oct 2008
http://slidepdf.com/reader/full/wp-london-agreement-oct-2008 21/28
The London Agreement
2
Stevnsborg N. and B. Van Pottelsberghe de la Potterie, 2007, Patenting Procedures and Filing
Strategies, in Guellec, D. and B. Van Pottelsberghe de la Potterie. The Economics of the
European Patent System, Oxford: Oxford University Press, Oxford, Chapter 6, p. 155‐183.
van Pottelsberghe de la Potterie B. and D. François, 2006, The Cost Factor in Patent Systems, CEPR
Discussion Paper 5944.
van
Pottelsberghe
de
la
Potterie
B.
and
N.
van
Zeebroeck,
2008,
A
Brief
History
of
Space
and
Time:
the Scope‐Year Index as a Patent Value Indicator Based on Families and Renewals,
Scientometrics, 75(2), 319–338.
van Zeebroeck N., B. van Pottelsberghe de la Potterie, and D. Guellec, 2006, Claiming More: The
Increased Voluminosity of Patent Applications and its Determinants, CEPR Discussion Paper,
5971.
van Zeebroeck N., 2007, Patents only live twice: a patent survival analysis in Europe, Working
Papers CEB 07‐028.RS, Université Libre de Bruxelles, Solvay Business School, CEB.
Annual Reports:
Canadian Intellectual Patent Office, Annual Report 2006‐2007 available at
www.cipo.ic.gc.ca/epic/site/cipointernet‐internetopic.nsf/en/h_wr00094e.html
European Patent Office, Annual Report 2006 available at www.epo.org/about‐us/office/annual‐
reports/2006.html
European Patent Office, Annual Report 2007 available at www.epo.org/about‐us/office/annual‐
reports/2007.html
Indian Patent Office, Annual Report 2005‐2006 available at
http://ipindia.gov.in/cgpdtm/AnnualReport_2005_2006.pdf
Japan Patent Office, Annual Report 2007 available at
www.jpo.go.jp/shiryou_e/toushin_e/kenkyukai_e/annual_report2007.htm
Korean Intellectual Property Office, Annual Report: Overview and Highlights of 2006 available at
www.kipo.go.kr/kpo2/user.tdf
State Intellectual Property Office of the Republic of China, Annual Report 2006 available at
www.sipo.gov.cn/sipo_English/laws/annualreports/ndbg2006/
Trilateral Cooperation, Trilateral Statistical Report 2006 available at
www.trilateral.net/tsr/tsr_2006/
United States Patent and Trademark Office, Performance and Accountability Report. Fiscal Year
2007 available at www.uspto.gov/web/offices/com/annual/2007/index.html
8/6/2019 WP London-Agreement Oct 2008
http://slidepdf.com/reader/full/wp-london-agreement-oct-2008 22/28
The London Agreement
2
Appendix
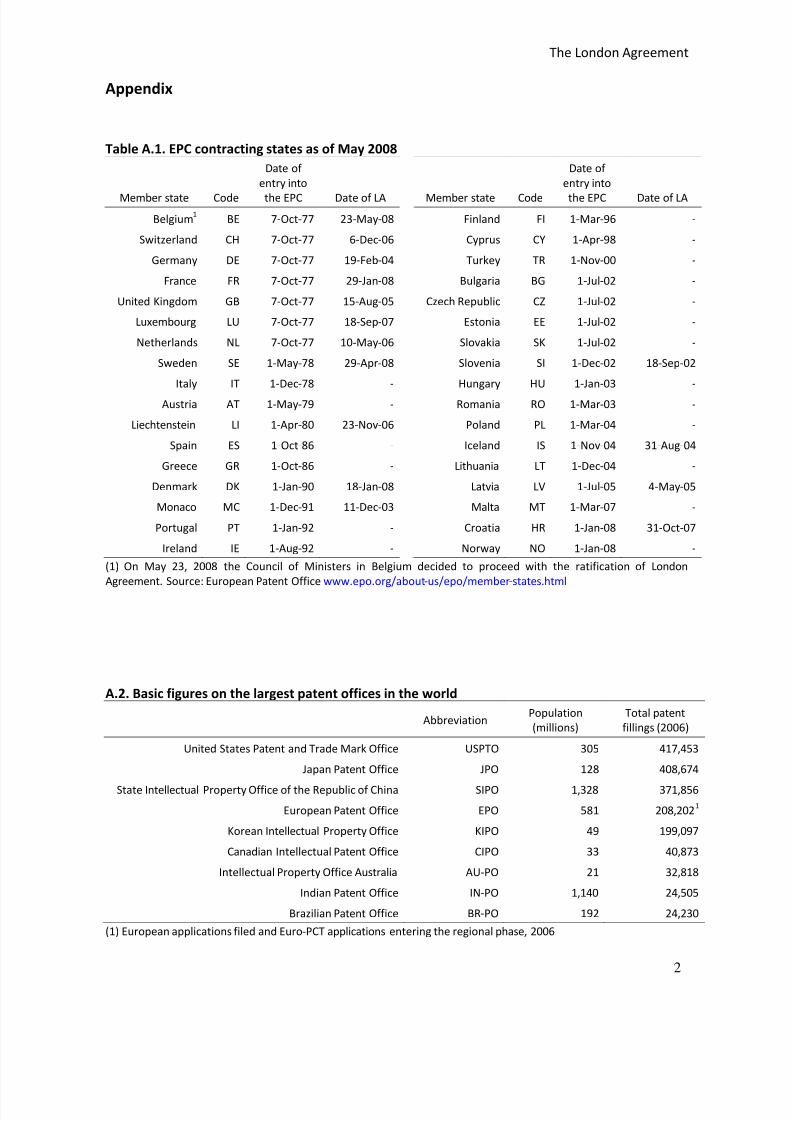
Table A.1. EPC contracting states as of May 2008
Member state Code
Date of
entry into
the EPC Date of LA Member state Code
Date of
entry into
the EPC Date of LA
Belgium1
BE 7‐Oct‐77 23‐May‐08 Finland FI 1‐Mar‐96 ‐
Switzerland CH 7‐Oct‐77 6‐Dec‐06 Cyprus CY 1‐Apr‐98 ‐
Germany DE 7‐Oct‐77 19‐Feb‐04 Turkey TR 1‐Nov‐00 ‐
France FR 7‐Oct‐77 29‐Jan‐08 Bulgaria BG 1‐Jul‐02 ‐
United Kingdom GB 7‐Oct‐77 15‐Aug‐05 Czech Republic CZ 1‐Jul‐02 ‐
Luxembourg LU 7‐Oct‐77 18‐Sep‐07 Estonia EE 1‐Jul‐02 ‐
Netherlands NL 7‐Oct‐77 10‐May‐06 Slovakia SK 1‐Jul‐02 ‐
Sweden SE 1‐May‐78 29‐Apr‐08 Slovenia SI 1‐Dec‐02 18‐Sep‐02
Italy IT 1‐Dec‐78 ‐ Hungary HU 1‐Jan‐03 ‐
Austria AT 1‐May‐79 ‐ Romania RO 1‐Mar‐03 ‐
Liechtenstein LI 1‐Apr‐80 23‐Nov‐06 Poland PL 1‐Mar‐04 ‐
Spain ES 1‐Oct‐86 ‐ Iceland IS 1‐Nov‐04 31‐Aug‐04
Greece GR 1‐Oct‐86 ‐ Lithuania LT 1‐Dec‐04 ‐
Denmark DK 1‐Jan‐90 18‐Jan‐08 Latvia LV 1‐Jul‐05 4‐May‐05
Monaco MC 1‐Dec‐91 11‐Dec‐03 Malta MT 1‐Mar‐07 ‐
Portugal PT 1‐Jan‐92 ‐ Croatia HR 1‐Jan‐08 31‐Oct‐07
Ireland IE 1‐Aug‐92 ‐ Norway NO 1‐Jan‐08 ‐
(1)
On May 23, 2008 the Council of Ministers in Belgium decided to proceed with the ratification of London
Agreement. Source: European Patent Office www.epo.org/about‐us/epo/member‐states.html
A.2. Basic figures on the largest patent offices in the world
Abbreviation
Population
(millions)
Total patent
fillings (2006)
United States Patent and Trade Mark Office USPTO 305 417,453
Japan Patent Office JPO 128 408,674
State Intellectual Property Office of the Republic of China SIPO 1,328 371,856
European Patent Office EPO 581 208,2021
Korean Intellectual Property Office KIPO 49 199,097
Canadian Intellectual Patent Office CIPO 33 40,873
Intellectual Property Office Australia AU‐PO 21 32,818
Indian Patent Office IN‐PO 1,140 24,505
Brazilian Patent Office BR‐PO 192 24,230
(1) European applications filed and Euro‐PCT applications entering the regional phase, 2006

8/6/2019 WP London-Agreement Oct 2008
http://slidepdf.com/reader/full/wp-london-agreement-oct-2008 23/28
The London Agreement
2
Source: 2006 Annual Reports; for AU‐PO and BR‐PO data are taken from WIPO Statistics on Patents
www.wipo.int/ipstats/en/statistics/patents/ ; IMF World Economic Outlook (April, 2008);
8/6/2019 WP London-Agreement Oct 2008
http://slidepdf.com/reader/full/wp-london-agreement-oct-2008 24/28
The London Agreement
2
Table A.3a. Cost structure of direct patent filings and maintenance, fees as of 1st
May 2008
EPO‐3
EPO‐3
(LA15)
EPO‐6
EPO‐6
(LA15)
EPO‐13
EPO‐13
(LA15)
EPO‐34
EPO‐34
(LA15)
H y p o t h e s i s
Time spent in examination
2
44 44 44 44 44 44 44 44
Average time spent 62 62 62 62 62 62 62 62
Designated counties for protection 3 3 6 6 13 13 34 34
P r o c e d u r a l c o s t s
At the EPO: EUR EUR EUR EUR EUR EUR EUR EUR Filing 180 180 180 180 180 180 180 180
€85 per designated state 255 255 510 510 595 595 595 595
Application fee 1st
year ‐ ‐ ‐ ‐ ‐ ‐ ‐ ‐
Application fee 2nd
year ‐ ‐ ‐ ‐ ‐ ‐ ‐ ‐
Application fee 3rd
year 400 400 400 400 400 400 400 400
Application
fee
4
th
year
500
500
500
500
500
500
500
500
Application fee 5th
year 700 700 700 700 700 700 700 700
Examination 1,405 1,405 1,405 1,405 1,405 1,405 1,405 1,405
Granting (issue fee) 790 790 790 790 790 790 790 790
Claim tax
4
640 640 640 640 640 640 640 640
Total procedural at the EPO: 5,920 5,920 6,175 6,175 6,260 6,260 6,260 6,260
At National patent offices:
Validation fees 185 185 210 210 1,538 1,538 3,463 3,463
EUR EUR EUR EUR EUR EUR EUR EUR Total procedural cost
without translation
6,105 6,105 6,385 6,385 7,798 7,798 9,723 9,723
Total procedural cost
with translation
5 9,217 6,785 12,609 8,961 20,246 15,382 47,067 37,339
Renewal fees (up to 10th
) 2,631 2,631 6,974 6,974 13,770 13,770 28,653 28,653
Renewal fees (11th
‐20th
) 19,655 19,655 36,811 36,811 72,489 72,489 149,736 149,736
US PPPs US PPPs US PPPs US PPPs US PPPs US PPPs US PPPs US PPPs Procedural cost with translation 10,780 7,936 14,747 10,481 23,680 17,991 55,049 43,671
Renewal fees (up to 10th
) 3,057 3,057 7,844 7,844 15,017 15,017 40,474 40,474
Renewal fees (11th
‐20th
) 22,828 22,828 42,085 42,085 80,569 80,569 212,132 212,132
TOTAL cost 10 years 13,837 10,993 22,592 18,325 38,697 33,008 95,524 84,146
TOTAL cost 20 years 36,665 33,820 64,677 60,410 119,265 113,576 307,655 296,277
8/6/2019 WP London-Agreement Oct 2008
http://slidepdf.com/reader/full/wp-london-agreement-oct-2008 25/28
The London Agreement
2
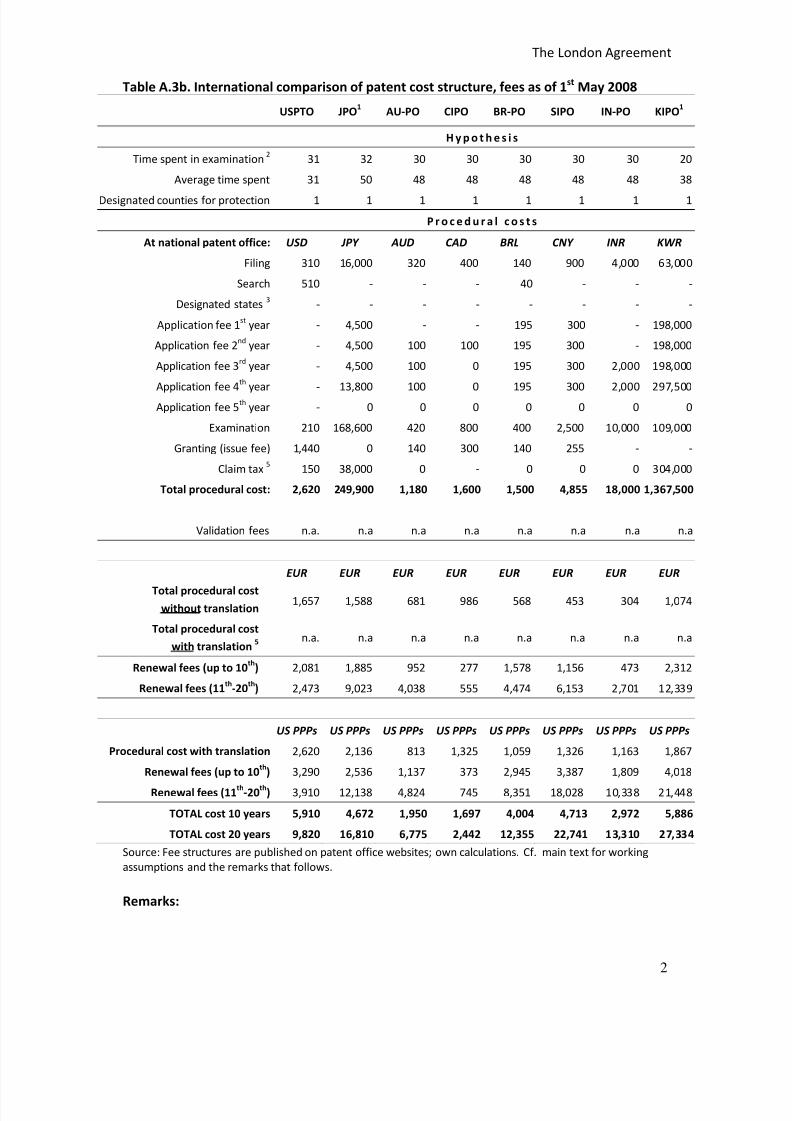
Table A.3b. International comparison of patent cost structure, fees as of 1st
May 2008
USPTO JPO1
AU‐PO CIPO BR‐PO SIPO IN‐PO KIPO1
H y p o t h e s i s
Time spent in examination
231 32 30 30 30 30 30 20
Average time spent 31 50 48 48 48 48 48 38
Designated counties for protection 1 1 1 1 1 1 1 1
P r o c e d u r a l c o s t s
At national patent office: USD JPY AUD CAD BRL CNY INR KWR Filing 310 16,000 320 400 140 900 4,000 63,000
Search 510 ‐ ‐ ‐ 40 ‐ ‐ ‐
Designated states
3‐ ‐ ‐ ‐ ‐ ‐ ‐ ‐
Application fee 1st
year ‐ 4,500 ‐ ‐ 195 300 ‐ 198,000
Application fee 2nd
year ‐ 4,500 100 100 195 300 ‐ 198,000
Application fee 3rd
year ‐ 4,500 100 0 195 300 2,000 198,000
Application fee 4th
year ‐ 13,800 100 0 195 300 2,000 297,500
Application fee 5th
year ‐ 0 0 0 0 0 0 0
Examination 210 168,600 420 800 400 2,500 10,000 109,000
Granting (issue fee) 1,440 0 140 300 140 255 ‐ ‐
Claim tax
5150 38,000 0 ‐ 0 0 0 304,000
Total procedural cost: 2,620 249,900 1,180 1,600 1,500 4,855 18,000 1,367,500
Validation fees n.a. n.a n.a n.a n.a n.a n.a n.a
EUR EUR EUR EUR EUR EUR EUR EUR Total procedural cost
without translation
1,657 1,588 681 986 568 453 304 1,074
Total procedural cost
with translation
5 n.a. n.a n.a n.a n.a n.a n.a n.a
Renewal fees (up to 10th
) 2,081 1,885 952 277 1,578 1,156 473 2,312
Renewal fees (11th
‐20th
) 2,473 9,023 4,038 555 4,474 6,153 2,701 12,339
US PPPs US PPPs US PPPs US PPPs US PPPs US PPPs US PPPs US PPPs Procedural cost with translation 2,620 2,136 813 1,325 1,059 1,326 1,163 1,867
Renewal fees (up to 10th
) 3,290 2,536 1,137 373 2,945 3,387 1,809 4,018
Renewal fees (11th‐20th) 3,910 12,138 4,824 745 8,351 18,028 10,338 21,448
TOTAL cost 10 years 5,910 4,672 1,950 1,697 4,004 4,713 2,972 5,886
TOTAL cost 20 years 9,820 16,810 6,775 2,442 12,355 22,741 13,310 27,334
Source: Fee structures are published on patent office websites; own calculations. Cf. main text for working
assumptions and the remarks that follows.
Remarks:

8/6/2019 WP London-Agreement Oct 2008
http://slidepdf.com/reader/full/wp-london-agreement-oct-2008 26/28
The London Agreement
2
(1) At JPO and KIPO the annual fees for the first three years must be paid all together at the
grant of a patent as a lump sum constituting the registration fee. At KIPO registration fees
are due within three months of the date of receipt of grant notice. At JPO for all patents
granted according to the new Japanese patent law (from the 1st
of January 1996 onwards),
the due date for annual fees is the date of grant (registration). Apart from the fixed filing fee
of 38,000 KWN when applying to the KIPO an applicant has to pay a surcharge of KWN 1000
for each page of description, drawing and abstract. To approximate the value of application
fee we apply estimations on the average size of the Korean patent submitted to the EPO
Archontopoulos et al., 2007) to be 25 pages: 15 pages of description and 7 pages of drawings
and 3 pages of claims.
(2) For the EPO, JPO and USPTO, data on time spent in examination comes from the Annual
Report of the Trilateral Cooperation (2007), for the KIPO from KIPO Annual Report (2007).
Due to the lack of data for other patent offices we assume the average patent time spent in
examination of 30 months.
(3) The average number of claims in the Japanese office was 9.5; 18.2 at the EPO and 23 at
the USPTO. To the best of our knowledge the data for remaining patent offices is not
available. From informal interaction with patent attorneys, it is fair to assume the following
for the average number of claims in the remaining offices: 20 at AU‐PO and CIPO, and 10
claims on average at BR‐PO, SIPO, IN‐PO. As presented in the table, those values correspond
to the maximum number of claims that are tax‐free. Due to the similarities between KIPO
and JPO we assume an average number of 9.5 claims for KIPO (cf. Table A.3c)
(4) Following the European Commission Communication COM (2007) 165 final, we assume
translation costs of €76 per page of description and €85 per page of claims. We calculate the
cost of translation for the ‘average’ European patent of 25 pages: 15 pages of description, 4
pages of claims and 6 pages of drawings (for comparison see: Archontopoulos et al., 2007
and Roland Berger, 2005). The number of translations required before and after London
Agreement is provided in the Table 2.
Table A.3c. Average number of claims and value of claim based taxes, May 2008
Currency
Cost per claim
above (x) claims
Average no of
claims
Working
hypothesis
AU‐PO AUD 100(20) n.a. 20
BR‐PO BRL 19 (10) n.a. 10
CIPO CAD not applicable n.a. 20
EPO EUR 200 (15) 18.2 18.2
IN‐PO INR 400(10) n.a. 10
JPO JPY 4000 (per claim) 9.5 9.5
KIPO KWR 32000 (per claim) n.a. 9.5
SIPO CNY 150(10) n.a. 10
USPTO USD 50(20) 23 23
Source: Fee structure provided by the patent offices; Average number of claims adopted from: JPO Annual
Report (2007).
8/6/2019 WP London-Agreement Oct 2008
http://slidepdf.com/reader/full/wp-london-agreement-oct-2008 27/28
The London Agreement
2
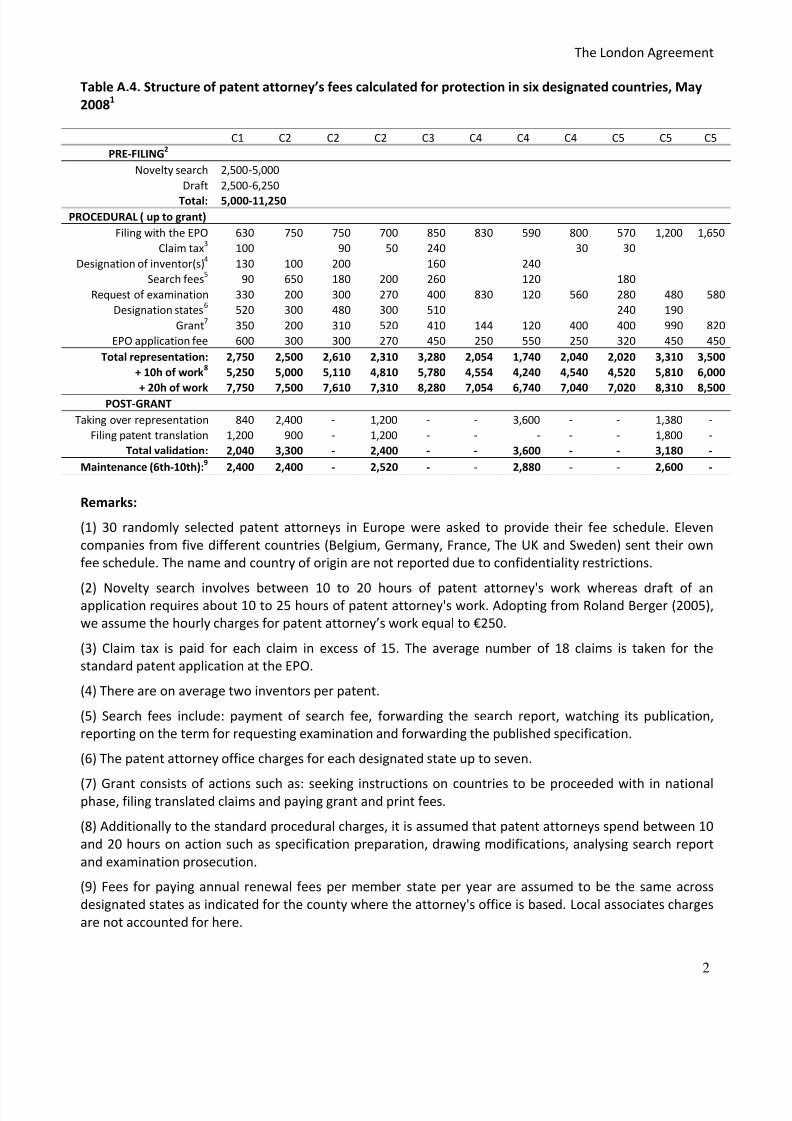
Table A.4. Structure of patent attorney’s fees calculated for protection in six designated countries, May
20081
C1 C2 C2 C2 C3 C4 C4 C4 C5 C5 C5
PRE‐FILING2
Novelty search 2,500‐5,000
Draft 2,500‐6,250
Total: 5,000‐11,250
PROCEDURAL ( up to grant)
Filing with the EPO 630 750 750 700 850 830 590 800 570 1,200 1,650
Claim tax3
100 90 50 240 30 30
Designation of inventor(s)4
130 100 200 160 240
Search fees5
90 650 180 200 260 120 180
Request of examination 330 200 300 270 400 830 120 560 280 480 580
Designation states6
520 300 480 300 510 240 190
Grant7
350 200 310 520 410 144 120 400 400 990 820
EPO application fee 600 300 300 270 450 250 550 250 320 450 450
Total representation: 2,750 2,500 2,610 2,310 3,280 2,054 1,740 2,040 2,020 3,310 3,500
+ 10h of work8
5,250 5,000 5,110 4,810 5,780 4,554 4,240 4,540 4,520 5,810 6,000
+
20h
of
work
7,750
7,500
7,610
7,310
8,280
7,054
6,740
7,040
7,020
8,310
8,500
POST‐GRANT
Taking over representation 840 2,400 ‐ 1,200 ‐ ‐ 3,600 ‐ ‐ 1,380 ‐
Filing patent translation 1,200 900 ‐ 1,200 ‐ ‐ ‐ ‐ ‐ 1,800 ‐
Total validation: 2,040 3,300 ‐ 2,400 ‐ ‐ 3,600 ‐ ‐ 3,180 ‐
Maintenance (6th‐10th):9
2,400 2,400 ‐ 2,520 ‐ ‐ 2,880 ‐ ‐ 2,600 ‐
Remarks:
(1) 30 randomly selected patent attorneys in Europe were asked to provide their fee schedule. Eleven
companies from five different countries (Belgium, Germany, France, The UK and Sweden) sent their own
fee schedule. The name and country of origin are not reported due to confidentiality restrictions.
(2) Novelty search involves between 10 to 20 hours of patent attorney's work whereas draft of an
application requires about 10 to 25 hours of patent attorney's work. Adopting from Roland Berger (2005),
we assume the hourly charges for patent attorney’s work equal to €250.
(3) Claim tax is paid for each claim in excess of 15. The average number of 18 claims is taken for the
standard patent application at the EPO.
(4) There are on average two inventors per patent.
(5) Search fees include: payment of search fee, forwarding the search report, watching its publication,
reporting on the term for requesting examination and forwarding the published specification.
(6) The patent attorney office charges for each designated state up to seven.
(7) Grant consists of actions such as: seeking instructions on countries to be proceeded with in national
phase, filing translated claims and paying grant and print fees.
(8) Additionally to the standard procedural charges, it is assumed that patent attorneys spend between 10
and 20 hours on action such as specification preparation, drawing modifications, analysing search report
and examination prosecution.
(9) Fees for paying annual renewal fees per member state per year are assumed to be the same across
designated states as indicated for the county where the attorney's office is based. Local associates charges
are not accounted for here.
8/6/2019 WP London-Agreement Oct 2008
http://slidepdf.com/reader/full/wp-london-agreement-oct-2008 28/28
The London Agreement
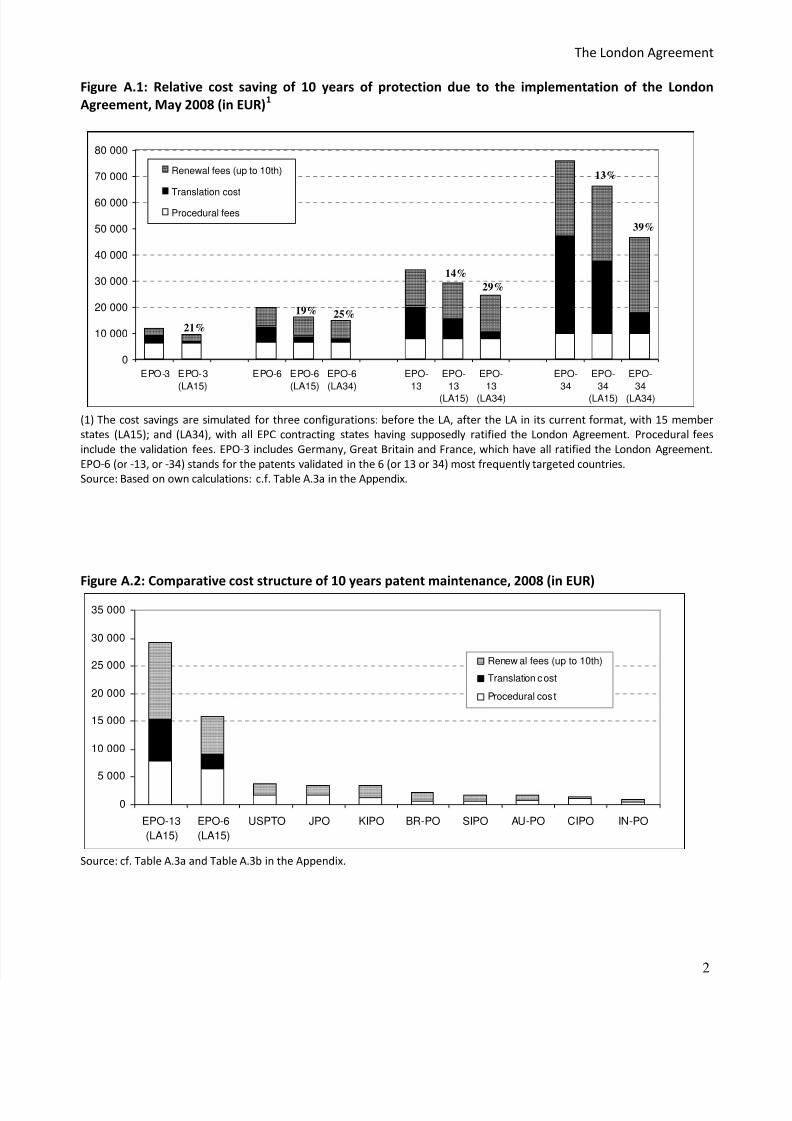
Figure A.1: Relative cost saving of 10 years of protection due to the implementation of the London
Agreement, May 2008 (in EUR)1
0
10 000
20 000
30 000
40 000
50 000
60 000
70 000
80 000
EPO-3 EPO-3
(LA15)
EPO-6 EPO-6
(LA15)
EPO-6
(LA34)
EPO-
13
EPO-
13
(LA15)
EPO-
13
(LA34)
EPO-
34
EPO-
34
(LA15)
EPO-
34
(LA34)
Renewal fees (up to 10th)
Translation cost
Procedural fees
(1)
The cost savings are simulated for three configurations: before the LA, after the LA in its current format, with 15 member
states (LA15); and (LA34), with all EPC contracting states having supposedly ratified the London Agreement. Procedural fees
include the validation fees. EPO‐3 includes Germany, Great Britain and France, which have all ratified the London Agreement.
EPO‐6 (or ‐13, or ‐34) stands for the patents validated in the 6 (or 13 or 34) most frequently targeted countries.
Source: Based on own calculations: c.f. Table A.3a in the Appendix.
Figure A.2: Comparative cost structure of 10 years patent maintenance, 2008 (in EUR)
0
5 000
10 000
15 000
20 000
25 000
30 000
35 000
EPO-13
(LA15)
EPO-6
(LA15)
USPTO JPO KIPO BR-PO SIPO AU-PO CIPO IN-PO
Renew al fees (up to 10th)
Translation cost
Procedural cost
Source: cf. Table A.3a and Table A.3b in the Appendix.
21%
19% 25%
14%
29%
13%
39%