Embed Size (px)
Citation preview

WP 5.4.:
Sustainability analysis of nanotechnology
With support of:
Project Organext (EMR. Int4-1.2.-2009/04/054)
Selected in the frame of the Operational Program Interreg
IV-A Euregio Meuse-Rhine
With Financial support from the European Union (European
Regional Development Fund - ERDF)
“European Union Investment in your Future!”
With cofinancing of:
(Belgium)
Flemish Community
Walloon region
Province Limburg
Province Flemish-Brabant
(The Netherlands)
Ministery of economic affairs
Province Limburg
Province North-Brabant
(Germany)
North Rhine Westphalia

Project ORGANEXT, WP5.4 (EMR. INT4-1.2.-2009-04/054)
S. Lizin, Uhasselt, CMK research institute, Environmental Economics research group Page 2
Table of contents
1. INTRODUCTION AND SCOPE 4
2. LITERATURE REVIEW 4
2.1. AVAILABLE METHODOLOGIES ................................................................................................................ 4
2.2. LCA STUDIES ......................................................................................................................................... 6
2.2.1. Ex-ante environmental and economic evaluation of polymer photovoltaics ................................. 8
2.2.2. Life cycle analysis of organic photovoltaic technologies .............................................................. 7
2.2.3. Life cycle analysis of polymer solar cell modules prepared using roll-to-roll (R2R) methods
under ambient conditions ............................................................................................................................... 8
2.2.4. Life cycle analysis of product-integrated polymer solar cells .................................................... 10
2.2.5. Life cycle assessment of ITO-free flexible polymer solar cells prepared by roll-to-roll coating
and printing .................................................................................................................................................... 9
2.2.6. Environmental and economic assessment of ITO-free electrodes for organic photovoltaic solar
cells .................................................................................................................................................... 11
2.2.7. Cumulative energy demands for small molecule and polymer photovoltaics ............................. 12
2.2.8. Solar cells with one-day energy payback for the factories of the future ..................................... 13
2.2.9. Deciphering the uncertainties in life cycle energy and environmental analysis of organic
photovoltaics ................................................................................................................................................ 14
3. CONCLUSIONS 15
4. REFERENCES 17
5. APPENDICES 19
6. CONTACT 33

Project ORGANEXT, WP5.4 (EMR. INT4-1.2.-2009-04/054)
S. Lizin, Uhasselt, CMK research institute, Environmental Economics research group Page 3
Figure Captions
FIGURE 1: PRODUCT LIFE CYCLE STAGES ............................................................................................................................ 4
FIGURE 2: POSSIBLE EXPOSURE ROUTES FOR NANOPARTICLES BASED ON CURRENT AND POTENTIAL FUTURE APPLICATIONS [10] ......... 5
FIGURE 3: TYPICAL CONSTITUTION OF A BULK-HETEROJUNCTION ORGANIC SOLAR CELL [8] .......................................................... 6
FIGURE 4: KEY ASPECTS THAT DETERMINE THE IMPACT OF NANOCOMPONENTS [15] ................................................................. 7
FIGURE 5: CUMULATIVE ENERGY DEMAND FOR 26 TYPES OF ORGANIC PHOTOVOLTAICS [26]. ................................................... 13

Project ORGANEXT, WP5.4 (EMR. INT4-1.2.-2009-04/054)
S. Lizin, Uhasselt, CMK research institute, Environmental Economics research group Page 4
1. Introduction and scope
Work package (WP) 5.4 deals with a sustainability analysis of nanotechnology used for the
development of organic semiconductors. The focus of this report is on the atmospherical
environmental impact (climate change) and energy use resulting from the development of organic
photovoltaics (OPV). Organic solar cells are nano-enabled photovoltaic cells which contain at least
one organic semiconducting molecule within the photoactive layer [1, 2]. Light will specifically be
shed on the all-organic solid-state solar cells, i.e. polymer and molecular OPV. Their potential
economic and social impact has already been discussed in WPs 5.2 and 5.3, respectively. Other
organic electronic technologies, such as organic light-emitting diodes (OLEDs) or organic field-effect
transistors (OFETs), are not considered. Furthermore, we explicitly focus on the material acquisition
and manufacturing stages of the OPV life cycle. Intact solar cells are not considered to be
problematic during their use phase. Figure 1 displays the notion of a product’s life cycle stages.
Figure 1: Product life cycle stages
Solar energy systems should provide significant environmental benefits in comparison to conventional
energy sources, thus contributing to the sustainable development of human activities [3]. However, the
wide scale deployment of OPV may imply unforeseen negative environmental impacts if not properly
assessed over their full life cycle [4]. This report aims at partially alleviating this concern. To this
extent, a literature study is performed and conclusions regarding OPV sustainability are presented.
2. Literature review
2.1. Available methodologies
To sketch the available methodologies for sustainability assessment we build on the framework as
provided by Ness et al. (2007) [5]. A similar effort was presented more recently by Gasparatos and
Scolobig (2012) [6]. Ness et al. divide methodologies into three categories, being (1) indices, (2)
product-related assessment methods, and (3) integrated assessment methods based on (a) temporal
characteristics, (b) coverage area, and (c) the degree to which it fuses social, environmental and
economic aspects. To achieve our goal, as introduced above, product-related assessment
methodologies are highly suitable as they allow evaluating resource use and environmental impacts
through the life cycle of a product. Methods adhering to this branch of methodologies are life cycle

Project ORGANEXT, WP5.4 (EMR. INT4-1.2.-2009-04/054)
S. Lizin, Uhasselt, CMK research institute, Environmental Economics research group Page 5
analysis (LCA), life cycle costing (LCC), product material flow analysis (PMFA), and product energy
analysis (PEA). Research may also target integrated assessment methodologies, such as multi-criteria
analysis (MCA), cost-benefit analysis (CBA), risk assessment (RA), and impact assessment (IA).
Combining several methods from the latter two categories is often referred to as (integrated)
technology assessment (TA) [7]. In our case, (extended) LCA studies seem most appropriate.
Health and ecotoxicity effects (which are assessed in risk and impact assessments) will not be
covered in detail in this report. In view of its importance, Figure 2 provides an overview of possible
exposure routes to man and nature during a nano-enabled product’s full life cycle. A recent review by
Zimmermann et al. (2012) [8] compiles available information about the fate and effect of the
components of a general OPV solar cell stack based on the workhorse P3HT and PCBM materials (see
Figure 3). It depicts the constitution of a bulk heterojunction (BHJ), making abstraction of the
interpenetrating network, organic solar cell having a polymer-fullerene light-absorbing layer (LAL).
They conclude that there is a general lack of information about fate, behavior as well as potential
ecotoxicity of most of the main OPV components and their degradation/transformation products.
Exceptions are the ecotoxicity of the oxide interlayer and/or electrode materials (ITO, ZnO, and TiO2)
and fullerenes (PCBM). Based on the available information they find no evidence for a worrying
threat coming from OPV, but further laboratory fate studies are advisable. Additionally, they warn for
improper disposal upon end-of-life when applied on a large scale, a concern already considered for
photovoltaic devices by Strange et al. (2008) [9].
Figure 2: Possible exposure routes for nanomaterials based on current and potential future applications [10]

Project ORGANEXT, WP5.4 (EMR. INT4-1.2.-2009-04/054)
S. Lizin, Uhasselt, CMK research institute, Environmental Economics research group Page 6
Figure 3: Typical constitution of a bulk heterojunction organic solar cell [8]
2.2. LCA studies
Typically, the steps involved in an LCA are: (1) defining the goals and scope, (2) creating the life
cycle inventory (LCI) which quantifies the material and energy inputs, as well as the environmental
releases for each unit process, (3) performing a life cycle impact assessment, and (4) interpreting the
results [11]. Two types of methods for LCA are distinguished: (1) attributional and (2) consequential
LCA. Attributional LCA is defined by its focus on describing the environmentally relevant physical
flows to and from a life cycle and its subsystems. Consequential LCA is defined by its aim to describe
how environmentally relevant flows will change in response to possible decisions [12]. Studies we
will report on belong to the first category. Results’ interpretation is most meaningful for OPV when
comparing its impact to that of other energy resources. The life cycle stages that can be considered are:
(1) acquisition of materials, (2) manufacturing, (3) use, (4) transportation, and (5) end-of-life
(recycling/disposal). For organic nanomaterials the task of conducting an LCA requires enormous
efforts given the lack of available inventory data in the commonly used LCA databases, while little
generality may be gained as processing techniques and manufacturing methods are not yet
standardized [4].
Nanomaterials are man-made. Sengül et al. (2008) [13] and Kim and Fthenakis (2012) [14] provide a
thorough overview of why the manufacturing of nanocomponents is generally energy-intensive and
has low material efficiency. Some nuance may, nevertheless, be advisory as many decisions have an
influence. To this end, Figure 4 represents the key aspects that determine the potential impact of
nanocomponents. Material selection determines the full life cycle impact of a given component in
three main ways: (1) the material’s physico-chemical properties influence its toxicological impact, (2)
extraction of raw material may require large amounts of energy, deplete natural resources, generate
waste(s) that have to be treated, and result in significant land use, and (3) the material determines

Project ORGANEXT, WP5.4 (EMR. INT4-1.2.-2009-04/054)
S. Lizin, Uhasselt, CMK research institute, Environmental Economics research group Page 7
which synthesis or manufacturing techniques are suitable. Manufacturing techniques can be divided
into two groups, being bottom-up and top-down methods. The former create nanoscale dimensions
from matter at the atomic level, whereas the latter achieve such dimensions by carving or grinding
methods using bulk materials. Each technique has its respective impact. Finally, the material form
during the application or use phase is the most decisive factor for the environmental impact. If the
material is immobilized, no harm should occur, unless breakdown of the composite matrix occurs. The
same cannot be said if greater mobility is allowed. Not much is known yet about the recyclability of
nanomaterials, although it is considered the ideal solution to avoid problems such as bio-accumulation
[15]. Having provided this general framework, it may help to understand why the energy demand per
functional unit of material for carbon-based nanomaterials varies between 1 and 900 GJ/kg [14].
So why continue using organic nanomaterials? The results above are situated at the material level,
whereas the impact on device level matters more. Most reviewed studies ascertain that at the device
level the energy demand and impact on global warming is lower than that of conventional
technologies because the organic nanomaterials are used in small amounts and increase the energy-
efficient operation of the device [14]. Therefore, a chronological overview of journal-published LCA
studies focusing mostly on climate change and energy use from organic photovoltaic devices is
provided below.
Figure 4: Key aspects that determine the impact of nanocomponents [15]

Project ORGANEXT, WP5.4 (EMR. INT4-1.2.-2009-04/054)
S. Lizin, Uhasselt, CMK research institute, Environmental Economics research group Page 8
2.2.1. Ex-ante environmental and economic evaluation of polymer photovoltaics
The oldest study available on this topic was performed by Roes et al. (2009) [11]. They were the first
to compile a LCI and LCC for polymer photovoltaics (200 cm²/Wp) based on literature and own
estimations. It considers impacts resulting from materials acquisition and manufacturing of
P3HT/PCBM organic solar cells on glass and PET substrates. The respective process chains and
solar cell build-ups can be found in the appendix (see section 5.1. and 5.2.). From the process chains it
can be deduced that the flexible modules are assumed not to be used in grid-connected operation. No
balance of system (BOS) is included in their chain, whereas this is the case for the rigid modules on
glass. Furthermore, cleaning and annealing are not applied in case of the flexible PV production. The
final difference between both processes is that only the flexible module was produced on a continuous
roll-to-roll (R2R) basis using gravure printing for the light absorbing layer (LAL). The glass-based
module is fabricated using a batch-process using inkjet printing for the LAL. The impact of LiF was
considered negligible. They found that the environmental impacts per Wp of output power
compared to comparable multicrystalline silicon (mc-Si) systems are 20–60% lower for polymer
PV systems with glass substrates and 80–95% lower for polymer PV systems with PET substrates.
The latter results may, however, be underestimations due to oversimplification of the process chain.
However, if one considers a functional unit of 25 years of electricity production it should be noted that
if the efficiency of polymer PV cells remains at its current value of about 5%, the lifetime of polymer
modules should increase substantially to realize such environmental benefits. The impacts
considered for OPV are non-renewable energy use (NREU), contribution to climate change over 100
years, abiotic depletion, ozone layer depletion, photochemical oxidant formation, acidification, and
eutrophication. The most and least environmentally burdensome relative to mc-Si are acidification (g
SO2 eq) and ozone layer depletion (g CFC-11 eq) for both glass- and PET-based PV systems. Steps
contributing most to NREU and climate change are solar glass production, lamination, framing, and
BOS for glass-based systems and sputtering and lamination for PET-based systems. The costs per
watt-peak of polymer PV modules with glass substrates are approximately 20% higher compared to
mc-Si photovoltaics (4.18 €/Wp vs. 3.43€/ Wp). However, taking into account uncertainties, this
might be an overestimation. If the (cell) efficiency reaches 11%, costs of glass-based polymer PV
could drop to nearly half of the costs of 2009 mc-Si PV (keeping other things constant). No cost
data were available for flexible modules at that time.
2.2.2. Life cycle analysis of organic photovoltaic technologies
A second study by García-Valverde et al. (2010) [16] presents an LCA, targeting energy payback
times and CO2 emission, of the laboratory production of a typical P3HT/PCBM bulk
heterojunction organic solar cell (1 cm²). Subsequently, from these data the impact of large scale

Project ORGANEXT, WP5.4 (EMR. INT4-1.2.-2009-04/054)
S. Lizin, Uhasselt, CMK research institute, Environmental Economics research group Page 9
manufacturing processes for grid-connected modules (1 m²) are extrapolated to be compared with
those obtained for the industrial production of other PV technologies. A representation of the
laboratory process used can be found in the appendix (see section 5.3.). Energy and material inputs for
the ITO patterning step are disregarded. The representation omits an annealing step at 70 °C in
nitrogen atmosphere. Deposition of PEDOT:PSS and the LAL are done by spin-coating with a
material usage efficiency of only 30%. Energy and nitrogen consumption from the glove box are also
taken into account. Their work adds to literature by estimating the embodied primary energy and
raw materials for 1 kg of regioregular P3HT using the Grignard metathesis (GRIM) method, 1 kg of
PCBM using a method proposed by Hummelen et al.(1995) [17], 1 kg of PEDOT:PSS following
recommendations of Zhan et al. (2008) [18], and 1 m² of ITO-coated glass. Solvents and reagents
were disregarded in the analysis. Nevertheless, most of such chemicals used nowadays are hazardous
air pollutants such as volatile organic compounds (e.g. chlorobenzene, toluene, xylene used as
solvents) and acids (e.g. hydrochloric acid used in wet processes). Ideally, these should be avoided
[19]. Results show that OPV modules compare favorably with mc-Si, similarly with thin film and
slightly worse than dye sensitized solar cells (DSSC) regarding the embedded energy (MJ/m²) using
a far from optimum process. The fabrication of electrodes is the most energy-costly step. The ITO-
electrode is the most energy-costly of both electrodes. Further increase of efficiency is needed to
decrease the energy payback time (years) and CO2 emission factor (g CO2 eq/kWh) if it is to
outperform CdTe and DSSC technologies.
2.2.3. Life cycle analysis of polymer solar cell modules prepared using roll-to-roll
(R2R) methods under ambient conditions
A third study by Espinosa et al. (2011) [20] presents an LCA on a full R2R-coating procedure used
for the manufacturing of flexible polymer solar cell modules. The functional unit is 1 m² of
processed surface with 67% of active area. The manufacturing process, whose steps and substeps can
be found in the appendix (see section 5.4.), is known as ProcessOne. All operations except the
application of ITO are carried out under ambient conditions. The LCA delivered a material
inventory including solvents and materials that are not present in the final module, and an
accountability of the energy embedded both in the input materials and in the production processes
using the energy mix for Denmark, which is very clean (420.88 g CO2 eq/kWh). The decommissioning
phase has not been taken into account, except for the recycling of some materials (especially solvents).
Also BOS was outside the scope. Upon assumption of power conversion efficiencies (PCEs) and
lifetime for the modules, calculation and comparison of energy payback times (EPBT) is possible.
The results showed that an EPBT of 2.02 years can be achieved for an organic solar module of 2%
efficiency, which can be reduced to 1.35 years if the efficiency is 3%. Consequently, OPV might

Project ORGANEXT, WP5.4 (EMR. INT4-1.2.-2009-04/054)
S. Lizin, Uhasselt, CMK research institute, Environmental Economics research group Page 10
outperform CdTe which has the lowest EPBT of all non-organic PV technologies. The study also
emphasizes that replacement of ITO is necessary both from an energetic as economic point of view.
2.2.4. Life-cycle analysis of product-integrated polymer solar cells
A fourth study by Espinosa et al (2011) [21] presents an LCA on a product-integrated polymer solar
module. The product under revision is a solar-powered portable lighting system. The lamp’s cross-
section can be found in the appendix (see section 5.5.). It sought to provide low-cost reading light and
simple rechargeable lighting in developing countries without an electricity grid. The organic solar
module used to power the lamp was produced using the ProcessOne manufacturing process. The only
changes (compared to the previous study) are the size of the modules and the use of different screens
for printing the back contacts. The LCA quantifies the energy use (9.55 MJ) and greenhouse gas
(GHG) emissions from electricity use during manufacturing. The LCA boundaries - additionally to
previous studies - include transport and the end-of-life (land filling). Transport was found to be
contributing most to the greenhouse gas emissions for the OPV module (compared to other building
blocks), whereas the manufacturing of OPV raw materials accounts for 77% of GHG emissions in the
OPV. The portable lighting system’s impact was also compared with other lighting solutions, namely a
kerosene lamp, a silicon PV based lamp, a torch with non-rechargeable lead-acid battery and a battery
charging station. The analysis reveals that the OPV lamp has a significant advantage, i.e. it has the
lowest embodied energy of all options. Provided that challenges facing this novel technology are
efficiently met, the current EPBT of around 10 years can be reduced and the device can enter the
market of portable lighting devices. Furthermore, it was found to provide ancillary health benefits
over kerosene lighting, with as little as just 1.5 days for earn-back of the emissions generated during
the manufacturing.
2.2.5. Life cycle assessment of ITO-free flexible polymer solar cells prepared by
roll-to-roll coating and printing
A fifth study by Espinosa et al. (2012) [22] presents an LCA, targeting energy efficiency and GHG
emissions, of a new process that is fully R2R compatible, named Hiflex. The manufacturing process
steps and materials inventory are given in the appendix (see section 5.6.). It allows for the manufacture
of flexible OPV modules where the ITO electrode has been replaced in an inverted device
architecture with front illumination. In order to avoid ITO, a flexible Kapton substrate, which has been
sputtered with one layer of aluminum and a subsequent layer of chromium, is used as initial input in
the main process. Masking the foil, the stripes have been directly patterned. Then, on the patterned
cathode, the process follows as in ProcessOne. An improvement in performance was achieved
compared to prior similar reports. The study’s main aim is to compare the environmental impact of
avoiding ITO which has been proven by previous studies to be contributing most to EPBT. Moreover,

Project ORGANEXT, WP5.4 (EMR. INT4-1.2.-2009-04/054)
S. Lizin, Uhasselt, CMK research institute, Environmental Economics research group Page 11
a recent report by the EU identifies indium as one of the 14 most critical mineral raw materials [23].
The LCA system boundaries include raw materials production and extraction, module processing,
and module use. The functional unit is 1 m² of processed surface area of which 54% is covered by PV
modules. The energy mix for Denmark was used for the emissions inventory. For the calculation of the
EPBT the assumptions are a constant OPV module efficiency in the range of 1–5%, an insolation level
of 1700 kWh/m²/yr and a service lifetime of 15 years. The environmental analysis reveals an EPBT
of about 10 years due to the high-energy consumption of Al/Cr R2R sputtering and to the relatively
low efficiency of the Hiflex OPV modules (1%). An optimization of the active area fraction could
easily reduce the EPBT to 5 years. A further enhancement of the efficiency to 5% would give rise to a
promising EPBT of only 1 year.
The major conclusion that one can draw from this and previous work and analysis, is that OPV
seemingly is a promising technology that however will require significant re-development before it
can be viewed as a technology that solves more problems than it creates. Future developments should
therefore seek methods that do not involve silver, indium, vacuum, or complex processes and
should maximize the usage of the processed area.
2.2.6. Environmental and economic assessment of ITO-free electrodes for organic
photovoltaic solar cells
A sixth study by Emmott et al. (2012) [24] discusses some of the alternative materials for ITO,
being slot-die coated high-conductivity PEDOT:PSS, a screen-printed silver grid embedded in
PEDOT:PSS, slot-die coated silver nanowires, and spray-coated single walled carbon nanotubes.
These materials were chosen due to their potential for low cost and low energy manufacture, as well as
the availability of detailed information on their manufacture. Graphene films, which are mostly
deposited using chemical vapor deposition, are disregarded as they do not solve the problem of high
embedded energy. The study adds robustness under flexing to the previously mentioned reasons for
replacing ITO. It presents a life cycle and cost analysis of OPV devices manufactured using
ProcessOne but with ITO-free electrodes, making use of data gathered during previous studies [20,
25]. The LCA system boundaries include embedded energy in all raw materials used in the
fabrication of the electrode as well as the energy requirements for manufacture. Energy demands
associated with the manufacture of the required equipment as well as transport of the raw materials
and the final product are not included in this analysis. An EPBT and cost per Watt for OPV
modules for each alternative is calculated. The breakdown of the maximum embedded energy and
minimum cost per m² for all alternative modules can be found in the appendix (see section 5.7.). It
shows that PEDOT:PSS is the least energy-consuming option. Additionally, it was also identified as
the cheapest (€/m²) transparent conductor. On a cost per Watt basis and for the EBPT

Project ORGANEXT, WP5.4 (EMR. INT4-1.2.-2009-04/054)
S. Lizin, Uhasselt, CMK research institute, Environmental Economics research group Page 12
PEDOT:PSS competes with silver nanowires for the top position. The EPBT calculation is based on
a cell efficiency of 3%, a performance ratio (PR) of 75% to account for system losses, a
photovoltaically active area of the module of 67%, and an annual insolation of 1700 kWh/m². The
results show that there is great potential for reducing both the energy payback time and the cost
of OPV modules by replacing ITO with an alternative transparent conductor.
2.2.7. Cumulative energy demands for small molecule and polymer photovoltaics
A seventh study by Anctil et al. (2012) [26] assesses the cumulative energy demand (CED) of 26
different types of OPV that have been developed over the past 5 years, which include alternative
material and structure combinations with efficiencies higher than 3% for small molecules and 4.5% for
polymer devices to determine how the environmental impact of OPV has changed as a function of
technological progress. Such action is necessary as: (1) the typical BHJ using P3HT-PCBM is not
longer a representative of the newer generation OPV devices, and (2) previous reports underestimated
the fullerene contribution to environmental impact [27]. The embodied energy is calculated using the
most recent or efficient synthesis methods to establish the reactant inputs and product yields. With
the use of new inventory data, the life cycle energy impact associated with production of both single
junction and multi-junction architectures has been calculated including BHJ polymer, planar (P)
small molecule, and planar-mixed (PM) small molecule devices. The study’s system boundaries
include all processes from raw material extraction and material manufacturing through fabrication of
the complete solar cell (‘cradle-to-gate’). The functional unit is a 1 Wp solar panel. The process flow
for the production of organic photovoltaics and active layer morphologies for polymer and small
molecule photovoltaics are given in the appendix (see section 5.8.). The CED for the 26 different types
of OPV is shown below in Figure 5.
The CED per WP required to fabricate small molecule and polymer photovoltaics is shown to be
similar, from 2.9 to 5.7 MJ/Wp. The CED/Wp of small molecule devices is on average slightly higher
than for polymer devices, but this is largely because of the lower device efficiencies reported. The
CED is on average of 50% less than for conventional inorganic photovoltaics, motivating the
continued development of both technologies. Multi-junctions have a negative effect on polymer solar
cells CED, but a positive effect on small molecules. The use of fullerenes was shown to have a
dramatic impact on polymer solar cells, comprising 18–30% of the CED, despite only being present in
small quantities. ICBA was evaluated as being less energy-intensive. Increases in device efficiency are
shown to only marginally reduce CED for both small molecule and polymer designs. The results in
Figure 5 make it clear that other components in the device are major contributors, in particular the
ITO sputtering, which alone accounts for more than 35% of the total CED. Although increasing

Project ORGANEXT, WP5.4 (EMR. INT4-1.2.-2009-04/054)
S. Lizin, Uhasselt, CMK research institute, Environmental Economics research group Page 13
device efficiency reduces the contribution from the rest of the device, further reduction in embodied
energy will require reduction of the other components beyond the active materials.
Figure 5: Cumulative energy demand for 26 types of organic photovoltaics [26]
2.2.8. Solar cells with one-day energy payback for the factories of the future
Critical for the success of renewable energy technologies is the time it takes for a given technology to
earn back the energy invested in its making and constitution. For the most successful and mature
renewable energy sources such as wind and hydro power the EPBT is in the range of 3–6 months.
The EPBT has been thoroughly investigated for all PV technologies already on the market, and ranges
between 4.12 and 0.73 years. In a study by Espinosa et al. (2012) [28] the LCA methodology is used
to direct research and develop a polymer solar cell with exceptionally low EPBT. The LCA system
boundaries include direct energy to the manufacturing process, direct energy to produce materials
(primary and ancillary), and decommissioning. Transport has been neglected. The functional unit is 1
m² of processed area with 45% of active area. The structure of the modules can be found in the
appendix (see section 5.9.). ProcessOne serves as the reference route. The energy needed for
manufacturing the materials was computed for Processes A to K, and for Process Two and can be
found in the appendix (see section 5.10.). The energy needed for the manufacturing steps can also be

Project ORGANEXT, WP5.4 (EMR. INT4-1.2.-2009-04/054)
S. Lizin, Uhasselt, CMK research institute, Environmental Economics research group Page 14
found in the appendix (see section 5.11.). ProcessOne is not displayed because it is out of scale. The
graphs show that an enormous decrease in energy is possible. Process H is found to be the least
energy-consuming (44.82 MJEPE) by about a factor ten relative to ProcessOne. Subsequently, when
comparing process H with ProcessOne and ProcessTwo a trend of generally diminishing
environmental impacts (carcinogens, respiratory inorganics, climate change, ecotoxicity,
acidification/eutrophication, land use, minerals, and fossil fuels). Nevertheless PET’s environmental
impact was identified as being particularly high for process H, especially in the fossil fuels category.
Further improvements are identified (e.g. using renewable power instead of the mix, decreasing
barrier thickness, increasing substrate width, increasing geometric fill factor, increasing efficiency,
increasing lifetime, increasing recyclability and biodegradability, …) and their reduction on EPBT
assessed. It was found that very short EPBT in the order of one day are possible, thus potentially
presenting a solution to the current energy gap of >14 TW by year 2050. The use of renewable
energy is decisive in this context, as it is not possible for all other PV technologies. However, even
when using the most energy-consuming ProcessOne, a 10% module efficiency puts OPV in the
same range as wind and hydro power.
2.2.9. Deciphering the uncertainties in life cycle energy and environmental analysis
of organic photovoltaics
In a ninth study by Yue et al. (2012) [29] the life cycle GHG emissions and EPBT of a scalable OPV
module in the three cities Chicago, New York and San Francisco, for the current, near-term future (1-2
years) and long-term future (~5years) scenario has been analyzed. Instead of using the deterministic or
‘single point estimate’ method, a probabilistic approach by applying an uncertainty analysis to each
of these scenarios using the Monte Carlo simulation method was used with 1 million trials, thereby
quantifying the uncertainty and risk associated with each scenario. The solar insolation, power
conversion efficiency, transport distance, performance ratio, system degradation rate and
lifetime are considered the uncertain parameters. The assumed input values/distributions can be found
in the appendix (see section 5.12.). The percentage active area is fixed but different in each scenario
(45%, 67%, 85%). The LCA system boundaries include the energy embedded in materials, direct
process energy and energy for transport till the vendors’ gate (but transport for raw materials is
omitted). The functional unit is defined as 1 m² OPV modules. The finished modules are transported
from Phoenix to the three cities mentioned above by truck. The data for the LCI originate from
Espinosa et al. (2012) [28]. From the resulting probability distributions for the EPBT it is observed
that an increase in power conversion efficiency and percentage active area would largely reduce
the EPBT and its standard deviation. A sensitivity analysis showed that the performance ratio, the
efficiency, and the insolation influence the EPBT variance most for the near-term future scenario.
From the probability distributions for the GHG emission factor similar conclusions can be drawn.

Project ORGANEXT, WP5.4 (EMR. INT4-1.2.-2009-04/054)
S. Lizin, Uhasselt, CMK research institute, Environmental Economics research group Page 15
By comparing the proposed OPV technology with four typical silicon-based and thin-film
photovoltaics in the aspects of EPBT and greenhouse gas (GHG) emissions, they demonstrate the
great potential of OPV in environmental sustainability. Furthermore, the probabilistic approach
displayed a wide distribution for the EPBT and CO2 emission factor values, rather than squeezing
around a single value. This demonstrated the insufficiency of deterministic analysis, which would
give a false impression of certainty in the outcomes.
3. Conclusions
This report has covered the available literature on the environmental impact, mostly energy payback
times (EPBT) and the associated greenhouse gas (GHG) emissions (factor), resulting from at least the
materials acquisition and manufacturing stage of polymer and molecular organic photovoltaics (OPV)
devices. It is concluded that most literature performing LCAs so far has focused on the impact of the
typical bulk heterojunction organic solar cell using P3HT-PCBM as the light absorbing layer
deposited on a flexible PET substrate. This does not mean that the obtained results are directly
comparable for a number of reasons, being for instance a different system level envisaged (active
layer, cell, module, PV system), different input materials used, different synthesis/manufacturing
techniques used, different types of production environment studied, different LCA boundaries used,
different assumptions on uncertain parameters, and the availability of (correct) inventory data.
Nevertheless, the set of results shapes the environmental profile of polymer-based OPV. Viewing this
bigger picture, great potential regarding environmental sustainability has been identified (see Table 1).
At the same time the LCA methodology has allowed the identification of the technology’s (future)
bottlenecks.
Environmental sustainability metric OPV
Overall environmental impact
(on a Wp basis compared to mc-Si PV systems)
[2009]
is 20-60% lower using glass substrates, 80-95%
lower using PET substrates
Embedded energy
(on a MJ/Wp basis for modules)
[2010]
compares favorably with mc-Si, similarly with
thin film and slightly worse than DSSC
Energy payback time
(conditional upon various assumptions for cells)
[2012]
in the order of 1 day is possible
Depletion of rare metals
(conditional upon information available)
[2012]
ITO should be replaced from both cost and
energetic point of view
Critical for the success of renewable energy technologies is the time it takes for a given technology to
earn back the energy invested in its making and constitution. To be sustainable this time must be

Project ORGANEXT, WP5.4 (EMR. INT4-1.2.-2009-04/054)
S. Lizin, Uhasselt, CMK research institute, Environmental Economics research group Page 16
shorter than the lifetime of the device. For the most successful and mature renewable energy sources
such as wind and hydro power the EPBT is in the range of 3–6 months. The EPBT has been
thoroughly investigated for all PV technologies already on the market, and ranges between 4.12 and
0.73 years. For polymer-based OPV it was found that very short EPBT in the order of one day are
possible assuming most technological challenges are successfully met and renewable energy was used
to power the entire manufacturing process. However, at least as important is that ProcessOne, which is
the most cited and closest to an industrial process available in literature, performs equally well as wind
and hydro power assuming a module efficiency of 10%, while it still leaves plenty of room for
energetical optimization. Environmental impacts (carcinogens, respiratory inorganics, climate change,
ecotoxicity, acidification/eutrophication, land use, minerals, and fossil fuels) are shown to exhibit a
diminishing trend if energetic optimization is performed.
Nevertheless, the extended LCA results do not state the technology to be sustainable at this moment.
They also identify processes that should be avoided (ITO sputtering, vacuum steps, use of certain
hazardous solvents and chemicals), processes that should be optimized (usage of the processed area),
and potential material constraints (silver, indium). Future developments to and analysis of the
technology are therefore needed in our aim for a sustainable energy production.

Project ORGANEXT, WP5.4 (EMR. INT4-1.2.-2009-04/054)
S. Lizin, Uhasselt, CMK research institute, Environmental Economics research group Page 17
4. References
1. Kippelen, B. and J.-L. Bredas, Organic photovoltaics. Energy & Environmental Science,
2009. 2(3): p. 251-261.
2. Brabec, C.J., et al., Polymer–Fullerene Bulk-Heterojunction Solar Cells. Advanced Materials,
2010. 22(34): p. 3839-3856.
3. Tsoutsos, T., N. Frantzeskaki, and V. Gekas, Environmental impacts from the solar energy
technologies. Energy Policy, 2005. 33(3): p. 289-296.
4. Dhingra, R., et al., Sustainable Nanotechnology: Through Green Methods and Life-Cycle
Thinking. Sustainability, 2010. 2(10): p. 3323-3338.
5. Ness, B., et al., Categorising tools for sustainability assessment. Ecological Economics, 2007.
60(3): p. 498-508.
6. Gasparatos, A. and A. Scolobig, Choosing the most appropriate sustainability assessment
tool. Ecological Economics, 2012. 80(0): p. 1-7.
7. von Gleich, A., M. Steinfeldt, and U. Petschow, A suggested three-tiered approach to
assessing the implications of nanotechnology and influencing its development. Journal of
Cleaner Production, 2008. 16(8–9): p. 899-909.
8. Zimmermann, Y.-S., et al., Organic photovoltaics: Potential fate and effects in the
environment. Environment International, 2012. 49(0): p. 128-140.
9. Strange, M., et al., Biodegradable polymer solar cells. Solar Energy Materials and Solar Cells,
2008. 92(7): p. 805-813.
10. The Royal Society & Royal Academy of Engineering, Nanoscience and nanotechnologies:
opportunities and uncertainties. 2004, The Royal Society: London. p. 111.
11. Roes, A.L., et al., Ex-ante environmental and economic evaluation of polymer photovoltaics.
Progress in Photovoltaics: Research and Applications, 2009. 17(6): p. 372-393.
12. Finnveden, G., et al., Recent developments in Life Cycle Assessment. Journal of Environmental
Management, 2009. 91(1): p. 1-21.
13. Şengül, H., T.L. Theis, and S. Ghosh, Toward Sustainable Nanoproducts. Journal of Industrial
Ecology, 2008. 12(3): p. 329-359.
14. Kim, H.C. and V. Fthenakis, Life Cycle Energy and Climate Change Implications of
Nanotechnologies. Journal of Industrial Ecology, 2012: p. no-no.
15. Meyer, D.E., M.A. Curran, and M.A. Gonzalez, An Examination of Existing Data for the
Industrial Manufacture and Use of Nanocomponents and Their Role in the Life Cycle Impact
of Nanoproducts. Environmental Science & Technology, 2009. 43(5): p. 1256-1263.

Project ORGANEXT, WP5.4 (EMR. INT4-1.2.-2009-04/054)
S. Lizin, Uhasselt, CMK research institute, Environmental Economics research group Page 18
16. García-Valverde, R., J.A. Cherni, and A. Urbina, Life cycle analysis of organic photovoltaic
technologies. Progress in Photovoltaics: Research and Applications, 2010. 18(7): p. 535-558.
17. Hummelen, J.C., et al., Preparation and Characterization of Fulleroid and Methanofullerene
Derivatives. The Journal of Organic Chemistry, 1995. 60(3): p. 532-538.
18. Zhan, L., et al., PEDOT: Cathode active material with high specific capacity in novel
electrolyte system. Electrochimica Acta, 2008. 53(28): p. 8319-8323.
19. Krebs, F.C., Fabrication and processing of polymer solar cells: A review of printing and
coating techniques. Solar Energy Materials and Solar Cells, 2009. 93(4): p. 394-412.
20. Espinosa, N., et al., A life cycle analysis of polymer solar cell modules prepared using roll-to-
roll methods under ambient conditions. Solar Energy Materials and Solar Cells, 2011. 95(5):
p. 1293-1302.
21. Espinosa, N., R. Garcia-Valverde, and F.C. Krebs, Life-cycle analysis of product integrated
polymer solar cells. Energy & Environmental Science, 2011. 4(5): p. 1547-1557.
22. Espinosa, N., et al., Life cycle assessment of ITO-free flexible polymer solar cells prepared by
roll-to-roll coating and printing. Solar Energy Materials and Solar Cells, 2012. 97(0): p. 3-13.
23. European Commission, Critical raw materials for the EU: Report of the ad-hoc working
group on defining critical raw materials. 2010: Brussels. p. 84.
24. Emmott, C.J.M., A. Urbina, and J. Nelson, Environmental and economic assessment of ITO-
free electrodes for organic solar cells. Solar Energy Materials and Solar Cells, 2012. 97(0): p.
14-21.
25. Azzopardi, B., et al., Economic assessment of solar electricity production from organic-based
photovoltaic modules in a domestic environment. Energy & Environmental Science, 2011.
4(10): p. 3741-3753.
26. Anctil, A., et al., Cumulative energy demand for small molecule and polymer photovoltaics.
Progress in Photovoltaics: Research and Applications, 2012: p. n/a-n/a.
27. Anctil, A., et al., Material and Energy Intensity of Fullerene Production. Environmental
Science & Technology, 2011. 45(6): p. 2353-2359.
28. Espinosa, N., et al., Solar cells with one-day energy payback for the factories of the future.
Energy & Environmental Science, 2012. 5(1): p. 5117-5132.
29. Yue, D., et al., Deciphering the uncertainties in life cycle energy and environmental analysis
of organic photovoltaics. Energy & Environmental Science, 2012. 5(11): p. 9163-9172.

Project ORGANEXT, WP5.4 (EMR. INT4-1.2.-2009-04/054)
S. Lizin, Uhasselt, CMK research institute, Environmental Economics research group Page 19
5. Appendices

Project ORGANEXT, WP5.4 (EMR. INT4-1.2.-2009-04/054)
S. Lizin, Uhasselt, CMK research institute, Environmental Economics research group Page 20
5.1. Process chains and solar cell build-ups for polymer PV systems on a glass substrate [11]

Project ORGANEXT, WP5.4 (EMR. INT4-1.2.-2009-04/054)
S. Lizin, Uhasselt, CMK research institute, Environmental Economics research group Page 21
5.2. Process chains and solar cell build-ups for polymer PV systems on a PET substrate [11]

Project ORGANEXT, WP5.4 (EMR. INT4-1.2.-2009-04/054)
S. Lizin, Uhasselt, CMK research institute, Environmental Economics research group Page 22
5.3. Scheme for the laboratory processing of polymer-fullerene organic solar cells [16]

Project ORGANEXT, WP5.4 (EMR. INT4-1.2.-2009-04/054)
S. Lizin, Uhasselt, CMK research institute, Environmental Economics research group Page 23
5.4. Steps and substeps during the ProcessOne manufacturing of OPV modules [20]

Project ORGANEXT, WP5.4 (EMR. INT4-1.2.-2009-04/054)
S. Lizin, Uhasselt, CMK research institute, Environmental Economics research group Page 24
5.5. Cross-section of an organic photovoltaic solar module powered lamp [21]
Project ORGANEXT, WP5.4 (EMR. INT4-1.2.-2009-04/054)
S. Lizin, Uhasselt, CMK research institute, Environmental Economics research group Page 25
5.6. Hiflex manufacturing process steps and material inventory for 1 m² of processed substrate [22]

Project ORGANEXT, WP5.4 (EMR. INT4-1.2.-2009-04/054)
S. Lizin, Uhasselt, CMK research institute, Environmental Economics research group Page 26
5.7. Breakdown of the maximum embedded energy (T) and minimum cost per m² (B) in organic photovoltaic modules
using various electrodes [24]
Project ORGANEXT, WP5.4 (EMR. INT4-1.2.-2009-04/054)
S. Lizin, Uhasselt, CMK research institute, Environmental Economics research group Page 27
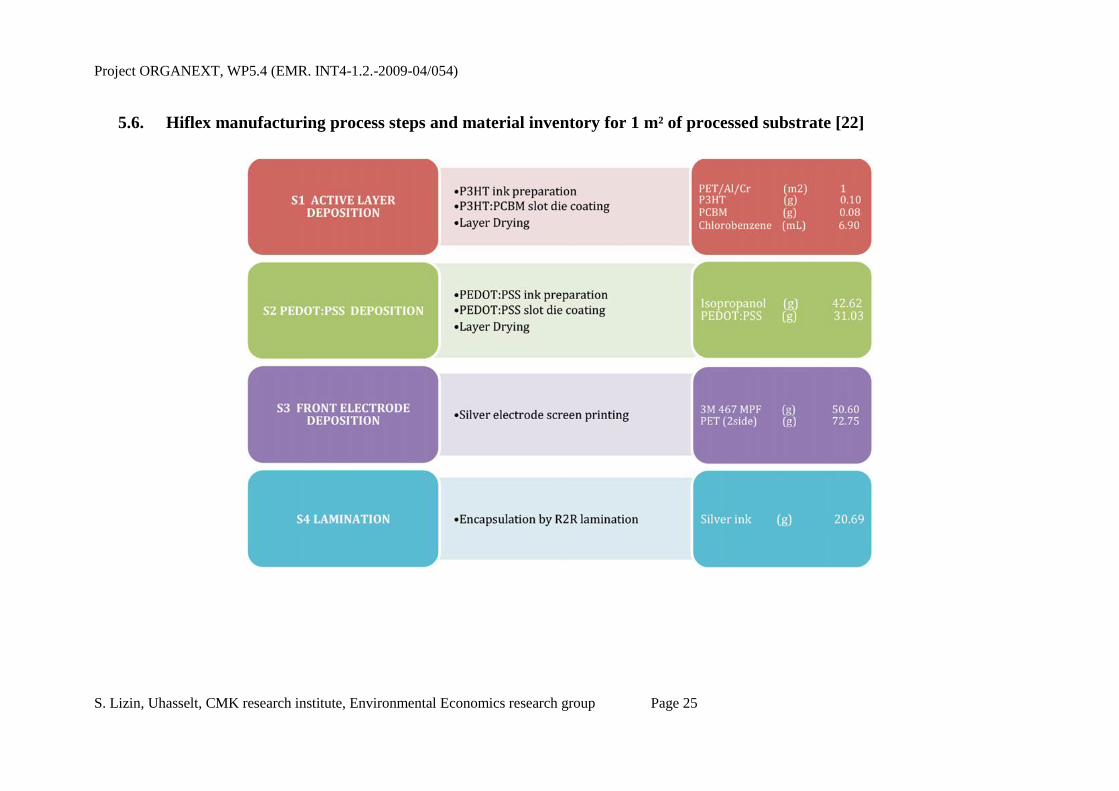
5.8. Process flow for the production of organic photovoltaics and active layer morphologies for polymer and small
molecule photovoltaics [26]

Project ORGANEXT, WP5.4 (EMR. INT4-1.2.-2009-04/054)
S. Lizin, Uhasselt, CMK research institute, Environmental Economics research group Page 28
5.9. Layers of the manufacturing routes for producing ITO-free solar cells and the reference route ProcessOne [28]
SD stands for Slot Die coating, RSP for Rotary Screen Printing and SP for Screen Printing.

Project ORGANEXT, WP5.4 (EMR. INT4-1.2.-2009-04/054)
S. Lizin, Uhasselt, CMK research institute, Environmental Economics research group Page 29
5.10. Embodied energy in the materials per functional unit (m²) in processes from A to J (MJEPE) [28]

Project ORGANEXT, WP5.4 (EMR. INT4-1.2.-2009-04/054)
S. Lizin, Uhasselt, CMK research institute, Environmental Economics research group Page 30
5.11. Direct process energy (MJEPE) employed for different steps in the manufacturing of OPV modules [28]

Project ORGANEXT, WP5.4 (EMR. INT4-1.2.-2009-04/054)
S. Lizin, Uhasselt, CMK research institute, Environmental Economics research group Page 31
5.12. Monte Carlo input assumptions for the calculation of the EPBT and GHG distribution of the current, near-term
future and future scenario [29]

Project ORGANEXT, WP5.4 (EMR. INT4-1.2.-2009-04/054)
S. Lizin, Uhasselt, CMK research institute, Environmental Economics research group Page 32

Project ORGANEXT, WP5.4 (EMR. INT4-1.2.-2009-04/054)
S. Lizin, Uhasselt, CMK research institute, Environmental Economics research group Page 33
6. Contact
The author of this report is Sebastien Lizin. He is a third year doctoral student at the University of
Hasselt, faculty of applied economics, research institute the Centre for Environmental Sciences
(CMK), research group of Environmental Economics. His PhD is about assessing the future
market opportunities for organic photovoltaic solar cells by means of integrated technology
assessment. To this end, his main focus has been on a stated preference valuation method called
discrete choice experiments. Contact details can be found below.
Contact details:
E-mail address: [email protected]
Postal address: Agoralaan, Building D, 3590 Diepenbeek, Belgium
Telephone number: +32 11 26 86 96


![Opv[1][1] qxd](https://img.pdfslide.us/doc/110x75/568c55e41a28ab4916c48b24/opv11-qxd.jpg)