Embed Size (px)
DESCRIPTION
dfdsfd
Citation preview

working papers
17 | 2012
October 2012
The analyses, opinions and fi ndings of these papers represent the views of the authors, they are not necessarily
those of the Banco de Portugal or the Eurosystem
COMPETITION IN THE PORTUGUESE ECONOMY:INSIGHTS FROM A PROFIT ELASTICITY APPROACH
João Amador
Ana Cristina Soares
Please address correspondence toJoão Amador
Banco de Portugal, Economics and Research Department Av. Almirante Reis 71, 1150-012 Lisboa, Portugal;
Tel.: 351 21 313 0708, email: [email protected]

BANCO DE PORTUGAL
Av. Almirante Reis, 71
1150-012 Lisboa
www.bportugal.pt
Edition
Economics and Research Department
Pre-press and Distribution
Administrative Services Department
Documentation, Editing and Museum Division
Editing and Publishing Unit
Printing
Administrative Services Department
Logistics Division
Lisbon, October 2012
Number of copies
85
ISBN 978-989-678-144-6
ISSN 0870-0117 (print)
ISSN 2182-0422 (online)
Legal Deposit no. 3664/83

Competition in the Portuguese Economy:
Insights from a profit elasticity approach∗
Joao Amador
Banco de Portugal
Nova School of Business and Economics
Ana Cristina Soares
Banco de Portugal
October 2012
Abstract
This article takes the set of Portuguese markets and computes a new competition measuresuggested by Boone (2008), which draws on the concept of profit elasticity to marginal costsin a given market. The article concludes that the majority of markets presented a reductionin competition in the period 2000-2009, though there is substantial heterogeneity. In addition,markets that faced competition reductions represent the large majority of sales, gross value addedand employment in the Portuguese economy. The non-tradable sector presents lower competitionintensity than the tradable sector. Moreover, reductions in competition are relatively widespreadacross markets in both sectors, but in terms of sales, gross value added and employment thesereductions are more substantial in the non-tradable. In the majority of markets the assessmenton the evolution of competition using profit elasticities is similar to that obtained with classicalcompetition indicators.
Keywords: Market competition, Portuguese economy
JEL Codes: L10, L60, O50
∗The opinions expressed in this paper are those of the authors and do not necessarily coincide with those of Bancode Portugal or the Eurosystem. The usual disclaimers apply. Address: Banco de Portugal, Research Department, R.Francisco Ribeiro 2, 1150-165 Lisboa - Portugal. E-mail: [email protected]; [email protected]
1

1 Introduction
Economic growth is driven by the adoption of new technologies and the emergence of
new products, which replace old ones. In the Schumpeterian terminology this dynamics
is designated as creative destruction. Competition plays an extremely relevant role in
this dynamics. Nevertheless, the paradigm of perfect competition, with prices equalling
marginal costs and zero economic profits in the long-run, is almost non-observable in
reality. Instead, firms tend to have some degree of market power, i.e., they are able
to set and sustain positive mark-ups. Therefore, in this complex setting, competition
measures are important policy indicators. The new competition measure suggested by
Boone (2008) is particularly suited to assess competition in a context of reallocation
of resources in the economy.
This article computes profit elasticities to marginal costs in the Portuguese markets,
based on firm level data from Central de Balancos for 2000-2004 and Informacao
Empresarial Simplificada for 2005-2009. The article reports profit elasticity levels and
trends for the different markets. This analysis complements and assesses the robustness
of the results included in Amador and Soares (2012), which computes on the set of
classical competition indicators for the Portuguese markets.
The analysis carried out is fundamentally distinct from the one conducted by competi-
tion authorities, aiming to set an overall scenario for competition developments and not
to draw conclusions for individual markets. As in Amador and Soares (2012), the dis-
tinction between tradable and non-tradable and manufacturing and non-manufacturing
sectors is highlighted. In fact, it is important to assess whether there is margin for an
increase in competition in the Portuguese economy, particularly in the non-tradable
sector. In this case, an increase in competition would contribute to a more efficient
allocation of resources, favouring the correction of existing macroeconomic imbalances.
The article concludes that the majority of markets presented a reduction in competition
in the period 2000-2009, though there is substantial heterogeneity. In addition, markets
that faced reductions in competition account for the large majority of sales, gross value
added (GVA) and employment in the Portuguese economy. The non-tradable sector
presents lower levels of competition than the tradable sector. Moreover, reductions
in competition are widespread across markets in both sectors but, in terms of sales,
GVA or employment, competition reductions are more substantial in the non-tradable
sector.
From a competition policy point of view, it is important to select indicators that can un-
equivocally identify markets where practices followed by firms reduce aggregate welfare.
Finding robust indicators to measure competition is an enormous challenge. Compe-
2

tition authorities often rely on traditional measures of competition based on market
profitability and concentration such as, for instance, the price-cost margin (PCM) and
the Herfindahl-Hirschman index (HHI). Nevertheless, traditional indicators are not
monotonic in competition, i.e., an increase (reduction) in the PCM does not always
translate a reduction (increase) in the intensity of competition in the market, thus
potentially leading to inaccurate assessments. For example, an increase in firms’ ag-
gressiveness is likely to lead to a redistribution of market shares amongst incumbents,
benefiting more efficient firms (reallocation effect) and potentially forcing inefficient
ones to exit the market (selection effect). In this scenario, there may be an increase in
market’s PCM, wrongly suggesting a reduction in competition. Similarly, competition
analysis based on the HHI may also lead to inaccurate conclusions due to the pres-
ence of reallocation and selection effects. In fact, if efficient firms put more pressure
on competitors and the least efficient ones exit, there may be an increase in market
concentration, suggesting a fall in competition when the opposite actually occurred.
The non-monotonicity of traditional competition indicators is a highly undesirable
feature from a policy perspective. Furthermore, Griffith et al. (2005) argue that tradi-
tional measures are poor indicators of competition in markets where firms have different
marginal costs and goods are symmetrically differentiated. In addition, Boone et al.
(2007) argue that competition analysis based on PCMs tends to fail in more important
markets, i.e., when there is a small number of firms, which are more likely to present
anti-competitive practices.
Given these problems, the elasticity of profits to marginal costs was proposed by Boone
(2008) as a measure of competition. The author noticed that increases in competition
associated, for instance, to a fall in entry costs or to an increase in pressure posed upon
competitors, are always associated a transfer of profits from relatively less efficient
firms towards relatively more efficient ones. Based on this fact, the author presented
an alternative competition indicator with several theoretical and empirical advantages
relatively to the traditional competition setup. Firstly, the Boone (2008) indicator
is monotonic in competition under the assumptions of product homogeneity, firms’
symmetry (except on marginal costs), constant marginal costs and simultaneous and
independent choice of the strategic variable. Nevertheless, under predatory prices,
collusion and first mover’s advantage, this result does not necessarily hold. Secondly,
the indicator does not require that the universe of firms is observed, i.e., the estimated
profit transfer among a subset of firms conveys information for the market. Thirdly,
empirical studies find that it tends to be less sensitive to the business cycle than the
PCM. In fact, Boone (2008) regressed PCMs on sector and year dummies and found
the latter significant and positively correlated with the business cycle. In addition,
3
Griffith et al. (2005) compared the performance of different competition measures and
refer that profit elasticity estimates are significantly less affected by cyclical downturns
than the PCM.
The main empirical limitations of the Boone (2008) indicator are its need for a mea-
sure of efficiency (marginal costs) that is unobservable in the data, its dependence on
a definition of the relevant market, its sensitiveness to the sample of firms and esti-
mation methodologies used and the non-existence of an upper bound. Only these last
two caveats are not extensive to the classical competition indicators. The empirical
literature on Boone (2008) based measures is growing and recent contributions include
Maliranta et al. (2007), Braila et al. (2010) and Devine et al. (2011).
The article is organized as follows. Section 2 discusses the details of the empirical
methodology, including a description of the profit elasticity indicator and the different
estimation approaches, as well as a description of the database. Section 3 presents the
results obtained for Portuguese markets and compares them with those obtained using
classical competition indicators. Section 4 offers some concluding remarks.
2 Methodology and data
2.1 The profit elasticity indicator
The conceptual idea behind the profit elasticity indicator suggested by Boone (2008)
is that competition leads to a transfer of profits towards relatively more efficient firms
(those with lower marginal costs) at the expense of less efficient ones. In this con-
text, the higher the intensity of market competition, the harsher is the punishment
of relatively less efficient firms and the bigger the reward of relatively more efficient
ones. It should be noted that relatively efficient firms may see their profits decrease
as a result of an increase in competition, but in this case the reduction in profits is
more severe for less efficient firms. In other words, a larger cost differential maps into
a larger profit differential. In graphical terms, the empirical relation between profits
and marginal costs is negative and its slope translates the concept of profit elastic-
ity, reflecting the intensity of competition in the market and offering the basis for an
empirical competition measure. Figure 1 illustrates this relation in a scenario of an
increase in market competition. Relatively more efficient firms (type B) are rewarded
with relatively higher profits and relatively inefficient firms (type A) face relatively
lower profits. If the redistribution of profits across firms is strong enough, i.e., if type
A profits turn negative, these firms are forced to exit the market (selection effect).
Note that the figure illustrates a linear relation but this may not be necessarily the
case for all the markets.
4

Figure 1: An increase in market competition
Marginalcost
Profit
Mg costfirm B
Mg costfirm A
Profit B�Profit B�Profit A�Profit A�Profit A�
Similarly to traditional competition indicators, Boone (2008) requires the definition of
the relevant market. An accurate definition of the relevant market takes into account
the degree of product substitution, transportation costs and the geographic location
of producers and consumers. However, in this type of studies the aim is to set an
overall competition assessment, thus it is assumed that markets can be correctly iden-
tified through an economic activity classification such as NACE. Nevertheless, this
assumption can imply a substantial bias, for example, in the case of multi-product
firms that sell goods that are not close substitutes. An analysis based on a high sec-
toral disaggregation may mitigate such criticism. In addition, as previously mentioned,
the measurement of firm’s efficiency is particularly difficult as it is directly related to
marginal costs, which are unobservable in the data. In fact, the use of average variable
costs as a proxy for marginal costs is a problem in the presence of non-constant returns
to scale and other factors such as brand loyalty, firm reputation and product quality.
Nevertheless, if returns to scale, product quality and other factors related to reputation
and brand are constant over time, changes in the profit elasticity can still be correctly
interpreted as changes in market competition.
2.2 Estimation
The empirical implementation of Boone (2008) involves estimating the slope of the rela-
tion between profits and a measure of efficiency for firms in each market and each year.
Two methodologies can be adopted. The first methodology is non-parametric and con-
5

sists in computing the frontier between profits and efficiency using Data Envelopment
Analysis (DEA).1 The second methodology is parametric and relies on regressions to
estimate the relation between profits and efficiency. The non-parametric approach may
be a better choice in markets with a reduced number of players, where regression-based
methods may turn out to be relatively weak due to the reduced number of degrees of
freedom. Conversely, non-parametric methods face convergence problems for several
markets and years, hindering their practical usefulness. For this reason the article
adopts the regression-based methodology.
2.2.1 Cross-section regressions
In theory, relatively efficient firms are rewarded more significantly in markets that
exhibit more intense competition. Therefore, profit elasticities are expected to be
negative and lower for markets facing more intense competition (or higher in absolute
terms). An empirical test of the theory can be implemented through the estimation of
cross section regressions as follows:
ln(Πj
it) = αj + βln(Cj
it), for each j (market) and t (period) (1)
where Πj
it stands for profits and Cj
it stands for a proxy of marginal costs of firm i,
operating in market j in period t. One of the specifications widely used in the literature
is the log-log, which takes into account the skewness in the distribution of profits and
variable costs.
The absence of a control variable for firm size may yield non-negative or non-significant
profit elasticities. Therefore, Peroni and Ferreira (2011) and CPB (2000) introduce an
explicit control for firm size based on the number of employees and logarithm of sales,
respectively.2 To some extent, the introduction of sales or number of workers as regres-
sors also allows to control for unobserved heterogeneity associated, for instance, to firm
reputation, brand loyalty or product quality. Therefore, an alternative specification is:
ln(Πit)j = αj + βln(Cit)
j + γln(Sit)j, for each j (market) and t (period) (2)
where Sj
it stands for sales of firm i, operating in market j in period t.
Another aspect is that the coefficient associated to profit elasticity in regression 2 refers
to intensity of competition, whereas the main issue of interest is changes in competition1References to the DEA approach in the context of competition analysis are Simar and Wilson (2005) and
Schiersch and Schmidt-Ehmcke (2010).2Boone (2000) suggests the use the least and most competitive firms for efficiency as an additional control. Although
relevant in theoretical terms, the control for the least and most competitive firms is typically disregarded in the empiricalliterature as these firms may be outliers (CPB (2000)). Note that adding the logarithm of sales as a size control mayalso enhance the endogeneity problem, which relates to the fact that sales and variable costs are in both sides of theregression.
6

through time. One way to address this issue is suggested by Maliranta et al. (2007),
consisting on the estimation of the regressions for each t and j and, in a second step,
fitting a linear trend to yearly profit elasticity estimates.
2.2.2 Panel data regressions
Panel data models, such as two-way fixed effect models, are a widely used approach to
measure competition intensity in different markets. For example, Braila et al. (2010),
Polder et al. (2009), Boone (2000) and Boone et al. (2007) introduce firm and time
fixed effects to assess competition developments for Belgian and Dutch firms, respec-
tively. This specification has two advantages compared to a cross sectional approach.
First, it captures unobserved heterogeneity by using firm fixed effects. In the presence
of unobserved firm-level heterogeneity that is correlated with a measure of efficiency,
the exclusion of firm fixed effects generates inconsistent estimates. Second, year fixed
affects adjust for the impact of sectoral shocks and control for the business cycle.
Therefore, the proposed formulation is:
ln(Πj
it) = αj
i + djt + βjln(Cj
it), for each j (market) (3)
where αj
i and djt stand for firm and time dummies, respectively.
Note that equation 3 does not include a control for size like the logarithm of sales.
However, the unobserved heterogeneity is captured by firm’s fixed effects and the non-
inclusion of the logarithm of sales reduces the potential for endogeneity problems. The
estimation of an explicit trend coefficient for competition requires a formulation such
as:
ln(Πj
it) = αj
i + djt + (βj + γjt)ln(Cj
it), for each j (market) (4)
where a positive (negative) trend coefficient (γj) implies a competition reduction (in-
crease) in the market.
2.2.3 Robustness
One criticism raised about the profit elasticity indicator as a competition measure is
its sensitivity to econometric specifications, estimation methodologies, the set of firms
considered and potential non-linearities. Moreover, this measure may be affected by
endogeneity and selection problems. In order to address these issues, a large battery
of robustness tests was performed.
Regarding econometric specifications, we have considered both log-log and semi-log
approaches. Both approaches are valid under the proposed setup and results should be
7
robust. Hence, results using the two approaches are presented in this paper. Consid-
ering estimation methodologies, we used not only panel data methods but also cross
section regressions. Moreover, within a panel data model we have also run regressions
with firm random effects. The Hausman (1978) and Hausman robust (Wooldridge
(2002)) tests were used to compare fixed versus random effects, under the hypothesis
that the individual effects are uncorrelated with the other regressors in the model.
CPB (2000) also tests fixed versus random effects, when estimating profit elasticities,
but only in the pharmaceutical sector.
The use of average costs as a proxy for marginal costs creates an endogeneity problem
in all regressions (Leuvensteijn et al. (2008)). Since average costs are used to compute
profits, they are present in both sides of the regression, potentially misleading com-
petition assessment. However, it is possible to estimate firms’ yearly efficiency with
a two-step approach. Initially, a stochastic production frontier approach can be used
to estimate a production function for each market, with output being proxied by sales
and inputs by capital stock, wage bill and cost of materials. Next, firms’ distance to
the market’s stochastic production frontier is taken as the efficiency measure.3 Nev-
ertheless, it is difficult to estimate stochastic production frontiers at a high level of
disaggregation because of the reduced number of observations and convergence issues.
Altomonte et al. (2010) estimate production frontiers for some markets at a 2 digit level
of NACE and use them to compute firm-level efficiency at a 3 digit level. Alternative
solutions to the endogeneity problem consist in using instrumental variables or alterna-
tive proxies for firm-level efficiency, such as labour productivity or sales per employee.
The referred solutions for the endogeneity problem were tested in this article, though
results were invariably weak as profit elasticities turned positive or non-significant for
several markets.
Moreover, it must be recalled that the profit elasticity methodology imposes the exclu-
sion of firms with non-positive profits creating a sample bias. The selection bias may
be particularly important in Portugal as the proportion of firms with negative profits
is not negligible. In approximately 90 per cent of markets, at least 20 per cent of firms
exhibit negative operational profits.4 In order to test and correct for the potential
sample selection, the two-step Heckman (1979) procedure was used. The exclusion re-
strictions used were firm’s age and total assets (tangible and intangible, in logarithm).
The logarithm of sales was introduced both in the participation and outcome equations
to capture unobserved heterogeneity. It should also be noted that the implementation
of the Heckman (1979) procedure requires the reintroduction in the database of firms
3This approach assumes that firms’ efficiency is independent and identically distributed and product is homogeneous.4In this context, Leuvensteijn et al. (2008) studies competition in the Dutch insurance industry and considers market
shares instead of profits, thus allowing for the inclusion of firms with non-positive profits.
8

with negative operational profits, representing around 30 per cent of observations in
the dataset.5 Moreover, it was only possible to estimate the procedure for firms with
positive total assets and information regarding firms’ age. In the same vein, in order
to test the sensitivity of results to the set of firms considered, a two-year balanced
panel was also considered. This requirement implies a severe reduction in the number
of observations.
The relation between profits and marginal costs was assumed to be linear, which is not
necessarily always the case. Boone et al. (2007) fits a quadratic relation between the
logarithm of profits and the logarithm of average variable costs, though in this case
there is not a unique coefficient in the regression to correctly identify market profit
elasticity. Instead, profit elasticities vary according to firms’ level of efficiency. In this
case, obtaining profit elasticity levels or trends would require establishing a benchmark
for firm efficiency and results could be substantially different depending on that choice.
Moreover, the significance of the quadratic term may derive from a misspecification and
not from the existence of a non-linear relation. Therefore, a linear relation between
the logarithm of profits and the logarithm of average variable costs was assumed.
2.3 Database
The data used in this article draws on information about the annual accounts of Por-
tuguese corporations reported under Central de Balancos (CB) for 2000-2004 and In-
formacao Empresarial Simplificada (IES) for 2005-2009.6 Both databases, whose main
difference is firm-level coverage, offer extensive information on items of firms’ balance
sheets and income statements. The latter database includes virtually the universe of
non-financial firms, while CB comprises mainly larger firms, still representing more
than 65 per cent of GVA in the years considered. The raw dataset coincides with the
one used in Amador and Soares (2012), which computes a set of classical competition
indicators for the Portuguese economy.
Competition analysis is always conditional on a market definition. The article defines
markets at a 3-digit NACE classification, which seems a reasonable compromise be-
tween the consideration of products that are close substitutes and the existence of a
reasonable number of firms in each market. This option is broadly in line with simi-
lar empirical studies conducted for other countries. Nevertheless, not all sectors were
considered. Apart from “Financial activities” and “Public administration, defence and
compulsory social security”, which are not covered in the database, “Agriculture, hunt-
5The lowest 1 per cent observations in the pooled distribution of the price-cost margin was eliminated, consisting ofunreasonably negative values.
6Although IES formally began in 2006, it included a report for 2005. For this reason, for the purpose of this article,IES is considered from 2005 onwards.
9

ing and forestry” along with “Mining and quarrying” were excluded due to their specific
nature and small contribution to total GVA. In addition, “Education”, “Health and
social work” and “Other community, social and personal service activities” were not
included given the high weight of the public sector in these markets.
Some observations were eliminated from the database. Firstly, observations associated
to null sales or null variable costs were removed. Secondly, in order to obtain mean-
ingful regressions, only markets with at least 5 firms per year in the entire time span
are included (minimum of 50 observations). Thirdly, as previously mentioned, obser-
vations with non-positive profits must be excluded.7 Fourthly, the existence of two
versions of NACE in the sample period implied a harmonization procedure, which led
to the reclassification of some firms.8 The final dataset includes 937,206 observations
from 2000 to 2009. It comprises 285,236 different firms and each firm has an average
of 3.3 observations. There is a total of 132 markets, 90 of which are considered as
tradable and 42 as non-tradable. The latter sector represents 62 per cent of GVA, 66
per cent of sales and 54 per cent of total employment in the period 2005-2009. As
argued in Amador and Soares (2012), the set of tradable markets corresponds to all
manufacturing markets plus those markets with a ratio of exports to sales above 15
per cent.9
Concerning the definition of variables, profits are computed as sales of products and
services deducted from variable costs, which comprise costs with employees, costs of
goods sold and external supplies. Under the current methodological approach, capital
is assumed to be a fixed input, thus its cost is not included in variable costs. Therefore,
rents should be excluded from variable costs, though this was not the case in this article.
The reason is that the response rate for this variable is reduced, thus its exclusion from
total costs of services could introduce another type of bias in the results.
3 Results
This section presents a competition assessment for the Portuguese markets, based on
profit elasticity levels and trends. The baseline specification for the estimation of profit
elasticity levels is the two-way fixed effects model (equation 3) for the period 2005-
2009. The baseline estimation of trend profit elasticities is the two-way fixed effects
model with an explicit trend coefficient for the period 2000-2009 (equation 4). Profit
7Firms with negative operational profits have been excluded, though some of the remaining may be operating at aloss.
8Data from 2006 onwards correspond to NACE Rev. 2 and was adjusted to NACE Rev. 1.1 to be compatible withthe remaining information.
9The list of tradable and non-tradable markets is available in the Appendix. Note that the set of markets consideredin the article does not fully coincide with the one in Amador and Soares (2012), as those with less than 5 firms in eachyear were excluded from this analysis.
10

Figure 2: Profit elasticity and semi-elasticity levels per market (2005-2009)
(a) Elasticites (b) Semi-elasticities
Note: Elasticities and semi-elasticities were estimated by two-way fixed effects regressions. Black bars correspond tonon-tradable markets, as defined in Amador and Soares (2012).
elasticity levels and trends could be estimated together in equation 4. However, the
break in the database implies the inclusion in equation 4 of an interaction step-dummy
for the period after 2005, implying different elasticity levels for the two sub-periods.
Nevertheless, estimated elasticity levels for the period 2005-2009 under equations 1
and 2 are not very different. The two following subsections present profit elasticity
levels and trends, respectively, departing from individual markets and highlighting the
distinction between those that have a tradable and non-tradable nature. Next, some
sectoral aggregations are presented.
3.1 Profit elasticity and semi-elasticity levels
Comparisons of profit elasticity levels across markets must be cautious as they reflect
not only competition intensity but also features such as returns to scale, product qual-
ity, brand loyalty and firm reputation. Thus, conclusions are more robust if based on
the ranking of market profit elasticities rather than on actual levels. In addition, the
comparison of markets or aggregates across countries with similar institutional setups
is also relatively robust.
The estimated profit elasticity and semi-elasticity levels are negative, as predicted
by the theory, and significant for virtually all markets considered (figure 2). Time
dummies were generally found non-significant, indicating that profit elasticities and
semi-elasticities present low sensitivity to the business cycle.
11

Firstly, there is a significant dispersion across market profit elasticities and semi-
elasticities. Profit elasticity estimates range from 0 to 13 per cent and semi-elasticities
range between 3 and 15 per cent, in absolute value, i.e., the intensity of competition
varies considerably across markets.10 In addition, within the set of markets with high-
est competition intensity (below the first quartile of the distribution of profit elasticity
levels), 88 per cent refer to manufacturing markets and the remaining to “Trade”.
Secondly, average absolute profit elasticity in tradable and non-tradable sectors is 3.1
and 1.9 per cent, respectively, suggesting a lower intensity of competition in the latter
sector. In addition, several non-tradable markets stand amongst those with lowest com-
petition. Around 48 per cent of the markets with lowest competition intensity (above
the fourth quartile) correspond to non-tradable markets and only one-third correspond
to manufacturing markets.
The average profit elasticity for the Portuguese economy in 2005-2009 was 2.7 per
cent, in absolute value, which is similar to figures found for Luxembourg (2.8 per
cent) by Peroni and Ferreira (2011). Profit elasticities obtained for the Portuguese
manufacturing and non-manufacturing sectors are, in absolute value, 3.3 and 1.8 per
cent, respectively. Braila et al. (2010) report absolute profit elasticities in these sectors
in the period 1997-2004 of 2.0 and 1.1 per cent for Belgium and 2.3 and 1.3 per cent
for EU-6, respectively.11
Table 1 details the information on profit elasticity and semi-elasticity levels, aggregating
markets by sectors and weighting according to their share on markets, sales, GVA
and employment. Results qualitatively hold when different aggregation variables are
used, though there are generally lower profit elasticities in absolute value. This result
implies that larger markets within each sector tend to show lower competition intensity.
This is especially noticeable in “Electricity and water supply” and “Construction”.
When the main non-manufacturing sectors are detailed, “Electricity and water supply”
and “Other services” stand out as those potentially least competitive, with absolute
elasticities of 1.2 per cent in the period 2005-2009. The lower panel of table 1 replicates
the decomposition and weighting options for the semi-log specification and the set of
conclusions stays mostly unaltered.
10Estimates for the profit elasticity in each individual market are presented in the Appendix.11Contrary to this paper, the non-manufacturing sector in Braila et al. (2010) includes the financial sector.
12

Table 1: Profit elasticities and semi-elasticities per sector (2005-2009) (percentage)
SectorsNb.
markets
Non-
weighted
averageWeighted average
Var.
coef.
Std.
dev.Min Max
Sales GVAEmploy-
ment
Specification: Log-Log
Overall Economy 132 -2,7 -2,0 -1,9 -2,2 -0,7 2,0 -13,1 -0,1
Tradable 90 -3,1 -2,6 -2,6 -2,9 -0,7 2,2 -13,1 -0,1Non-tradable 42 -1,9 -1,6 -1,5 -1,7 -0,6 1,1 -5,3 -0,5
Manufacturing 80 -3,3 -3,2 -3,2 -3,2 -0,7 2,2 -13,1 -0,1Non-manufacturing 52 -1,8 -1,6 -1,5 -1,7 -0,6 1,0 -5,3 -0,5
Electricity & water supply 3 -1,2 -0,8 -0,7 -0,9 -0,7 0,9 -2,1 -0,5Construction 4 -2,0 -1,2 -1,2 -1,3 -0,4 0,7 -2,5 -0,9Trade 23 -2,2 -1,8 -1,9 -2,1 -0,6 1,3 -5,3 -0,8Transports & communications 8 -1,8 -2,1 -2,1 -2,3 -0,3 0,5 -2,5 -1,1Other services 14 -1,2 -1,0 -1,0 -1,4 -0,3 0,4 -1,8 -0,6
Specification: Semi-log
Overall Economy 132 -6,7 -6,3 -6,0 -6,3 -0,3 1,9 -14,7 -2,9
Tradable 90 -6,9 -6,6 -6,5 -6,8 -0,3 1,9 -14,7 -4,0Non-tradable 42 -6,1 -6,1 -5,7 -5,9 -0,3 1,9 -10,2 -2,9
Manufacturing 80 -7,1 -7,3 -7,3 -7,2 -0,3 1,9 -14,7 -4,0Non-manufacturing 52 -5,9 -6,0 -5,5 -5,8 -0,3 1,8 -10,2 -2,9
Electricity & water supply 3 -4,2 -3,8 -3,8 -4,3 -0,1 0,6 -4,8 -3,6Construction 4 -5,8 -4,9 -4,9 -5,0 -0,2 1,0 -6,7 -4,5Trade 23 -7,3 -7,1 -7,2 -7,3 -0,2 1,7 -10,2 -4,5Transports & communications 8 -5,2 -5,4 -5,3 -5,5 -0,1 0,5 -5,7 -4,5Other services 14 -4,5 -4,3 -4,3 -5,1 -0,2 1,0 -6,6 -2,9
As previously referred, the computation of robustness tests is extremely relevant in
this type of analysis. Figure 3 overlaps the estimated profit elasticities (panel a) and
semi-elasticities (panel b) under several econometric approaches, sorting according to
the two-way fixed effects competition levels. The alternative approaches considered
are cross section regressions, firm random effects and two-step Heckman (1979). The
cross section approach consists in the estimation of regressions of profits on average
variable costs, in logarithms, for each year and market, using the logarithm of sales
as a control for firm size.12 The values for profit elasticities result from the average of
the coefficients associated to average variable costs between 2005 and 2009.13 Results
obtained under the cross section approach, also yield negative and significant elasticities
in their large majority. This result holds for the remaining approaches. At a 5 per cent
level, profit elasticities were significant in around 89, 86 and 99 per cent of markets for
two-way fixed effects, firm random effects and two-step Heckman (1979), respectively.
Therefore, taking into account the sample selection bias improves the significance of
profit elasticities.
The ranking of estimated elasticities under fixed and firm random effects is very similar,
12Without the control for firm size, profit elasticities are not always negative and significant.13In order to control for potential problems of heterocedasticity the White (1980) procedure was used.
13

Figure 3: Profit elasticities and semi-elasticities under different estimation approaches (2005-2009)
(a) Elasticites (b) Semi-elasticities
Note: Elasticities and semi-elasticities are ranked according to two-way fixed effects estimates.
except in some of the markets with higher competition. The ranking of elasticities using
firm random effects is close to the one obtained under the benchmark specification
though, the classical Hausman (1978) test does not strongly support that option. At
a 5 per cent level, random effects are rejected in 80 per cent of markets, while 87
per cent are rejected using the Hausman robust test (Wooldridge (2002)). Results
obtained through cross section regressions are somewhat different from the benchmark
formulation. One of the reasons for this fact is that, at odds with the alternative
econometric approaches, the cross section approach does not take into account the
effect of the business cycle. The two-step Heckman (1979) procedure does not reject
the existence of a selection bias in around 60 per cent of the markets. Nevertheless,
the significance of the exclusion restrictions is somewhat limited as age and total assets
(in logarithm) are significant in only 64 and 55 per cent of markets, respectively. The
resulting corrected profit elasticity estimates are typically not far from those obtained
under fixed effects and its ranking across markets is not substantially changed.
The results reported in this subsection are based on the 2005-2009 period, for which
the database covers the universe of firms. Nevertheless, estimates using fixed effects
and alternative econometric approaches for the period 2000-2009 yield extremely close
results.
3.2 Profit elasticity and semi-elasticity trends
Profit elasticity and semi-elasticity trends are more robust indicators of market compe-
tition developments than their levels, particularly if different estimation methodologies
14
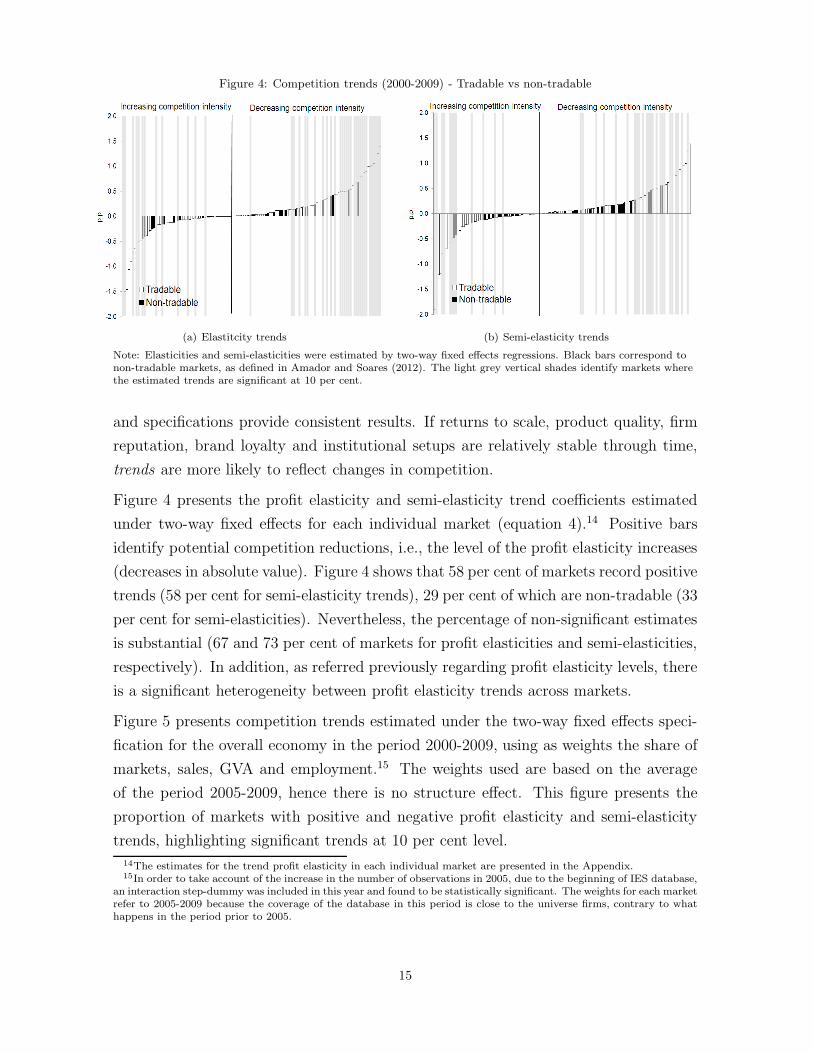
Figure 4: Competition trends (2000-2009) - Tradable vs non-tradable
(a) Elastitcity trends (b) Semi-elasticity trends
Note: Elasticities and semi-elasticities were estimated by two-way fixed effects regressions. Black bars correspond tonon-tradable markets, as defined in Amador and Soares (2012). The light grey vertical shades identify markets wherethe estimated trends are significant at 10 per cent.
and specifications provide consistent results. If returns to scale, product quality, firm
reputation, brand loyalty and institutional setups are relatively stable through time,
trends are more likely to reflect changes in competition.
Figure 4 presents the profit elasticity and semi-elasticity trend coefficients estimated
under two-way fixed effects for each individual market (equation 4).14 Positive bars
identify potential competition reductions, i.e., the level of the profit elasticity increases
(decreases in absolute value). Figure 4 shows that 58 per cent of markets record positive
trends (58 per cent for semi-elasticity trends), 29 per cent of which are non-tradable (33
per cent for semi-elasticities). Nevertheless, the percentage of non-significant estimates
is substantial (67 and 73 per cent of markets for profit elasticities and semi-elasticities,
respectively). In addition, as referred previously regarding profit elasticity levels, there
is a significant heterogeneity between profit elasticity trends across markets.
Figure 5 presents competition trends estimated under the two-way fixed effects speci-
fication for the overall economy in the period 2000-2009, using as weights the share of
markets, sales, GVA and employment.15 The weights used are based on the average
of the period 2005-2009, hence there is no structure effect. This figure presents the
proportion of markets with positive and negative profit elasticity and semi-elasticity
trends, highlighting significant trends at 10 per cent level.
14The estimates for the trend profit elasticity in each individual market are presented in the Appendix.15In order to take account of the increase in the number of observations in 2005, due to the beginning of IES database,
an interaction step-dummy was included in this year and found to be statistically significant. The weights for each marketrefer to 2005-2009 because the coverage of the database in this period is close to the universe firms, contrary to whathappens in the period prior to 2005.
15

Figure 5: Competition trends in 2000-2009 - Overall economy
Note: Significant estimates are identified according the 10 per cent threshold. The “not applicable” categorycorresponds to markets where trends cannot be computed because the underlying elasticity levels are not significant.
The majority of Portuguese markets presented a reduction in the degree of competi-
tion in the 2000-2009 period. Moreover, if these markets are weighted according to
sales, GVA and employment, competition reductions become more substantial, reach-
ing three-quarters in the latter option. This result implies that markets that faced
competition reductions account for the large majority of sales, GVA and employment
in the Portuguese economy. If only significant estimates are considered, competition
reductions become less relevant in quantitative terms, though they are still consider-
ably more important than increases in competition. Taking significant estimates, 40
per cent of total employment in the economy is allocated to markets that reported
reductions in the degree of competition. Overall, reductions in competition are gener-
alized across markets and relevant in terms of sales, GVA and employment. The results
qualitatively hold when the semi-log specification is considered.
Consistently with results for the overall economy, the majority of markets in the trad-
able and non-tradable sectors presented a reduction in the degree of competition (table
2). In addition, the non-tradable sector exhibits a lower incidence of competition re-
ductions compared to the tradable sector in terms of percentage of markets but not
if these reductions are weighted using sales, GVA and employment shares. More than
70 per cent of GVA and employment of the non-tradable sector refers to markets that
faced competition reductions. Thus, competition reductions are more substantial in
terms of resources in the non-tradable sector, though less generalized across markets.
16

Table 2: Trend profit elasticities and semi-elasticities per sector (2000-2009) (percentage)
Panel data Cross section
Log-log Semi-log Log-log Semi-log
Sector Markt. Sales GVAEm-ploy-ment
Markt. Sales GVAEm-ploy-ment
Markt. Sales GVAEm-ploy-ment
Markt. Sales GVAEm-ploy-ment
Tradable | non-trad.Competition reductions
TotalNT 52 69 74 84 57 80 76 83 64 72 75 78 64 68 72 78T 60 54 54 61 59 61 59 64 52 51 49 53 51 46 46 51
Signif. 10%NT 21 32 41 43 17 22 32 41 12 20 30 36 19 31 37 40T 23 19 20 33 19 21 21 31 10 14 19 14 11 16 21 20
Competition increases
Signif. 10%NT 14 10 13 3 12 10 13 6 10 2 3 2 2 0 0 0T 8 13 14 7 8 10 11 5 8 12 14 19 6 8 9 12
Manuf. | non-manuf.
Competition reductions
TotalM 60 58 59 70 58 65 64 72 53 54 52 60 53 53 51 59NM 54 66 69 76 60 76 71 75 62 68 69 71 60 63 66 69
Signif. 10%M 25 27 30 42 24 26 29 38 9 12 12 13 10 15 15 20NM 19 28 34 37 19 28 34 37 13 20 30 33 19 30 36 36
Competition increases
Signif. 10%M 8 8 7 4 9 8 9 8 8 10 11 19 5 3 3 2NM 13 12 15 5 19 28 15 5 10 5 6 9 4 3 4 7
Results become weaker if only significant trends are considered, yet the percentage of
non-tradable markets with reductions in competition is above 40 per cent of GVA and
employment in the sector. Furthermore, results are qualitatively unchanged using the
manufacturing versus non-manufacturing distinction and they are robust across the
estimation approaches considered. At sectoral level, the most striking result lays in
the “Construction” sector, where virtually all markets show decreases in competition
using as weights either sales, GVA or employment.
Results obtained using alternative econometric approaches, considered as robustness
tests, are presented in figure 6. The conclusions based on these estimations are qual-
itatively similar to those obtained with the fixed effects formulation and the ranking
of markets is broadly unchanged. The results obtained with the cross section specifi-
cation are also presented in figure 5 and in the right panel of table 2.16 These results
are qualitatively similar to those obtained with the benchmark formulation, though
the ranking of estimated profit elasticity trends is somewhat different (figure 6). As
previously mentioned, one of the reasons for this fact is that the cross section approach
16The cross-section specification is implemented in two-steps. Firstly, regressions of profits on average variable costs,with a control for size (the logarithm of sales) using the White (1980) procedure to correct for heteroscedasticity, areestimated. Secondly, a time trend is fitted on profit elasticities obtained in the first step using Newey-West procedureto control for autocorrelation of first order. Linear trends are only fitted if coefficients were found significant at a 5 percent level for all years. In addition, the estimation of the linear trends includes a step-dummy to take account of theincrease in the number of observations in 2005. It should be noted that the number of markets for which profit elasticitytrends are estimated significantly through cross section regressions is smaller than through panel data regressions, partlybecause trends are estimated on a time span of only 10 years, implying reduced degrees of freedom.
17

Figure 6: Profit elasticity and semi-elasticity trends (2000-2009)
(a) Elasticites (b) Semi-elasticities
Note: Elasticity and semi-elasticity trends are sorted according to two-way fixed effect estimates.
does not take into account the effect of the business cycle and there is a potential
mismeasurement of unobserved heterogeneity.
The results obtained through the two-step Heckman (1979) procedure show an increase
in the percentage of significant trends and the percentage of tradable and non-tradable
markets with reductions in competition is more balanced, though clearly above 50 per
cent in both sectors for the different weighting options.17 Random effects regressions
were also run as robustness tests. Nevertheless, using the Hausman (1978) and the
Hausman robust (Wooldridge (2002)) tests, this specification is widely rejected. More-
over, the estimated parameters are close to those obtained under the benchmark fixed
effects. Finally, trends obtained using a two-year balanced panel yield results similar
to those obtained under the benchmark specification.
Another dimension in the analysis consists in verifying the evolution of markets that
stand in the tails of the distribution of profit elasticity levels, i.e., those potentially least
and most competitive. The idea is to check whether the least competitive markets are
also the ones that have become less competitive, i.e., reported a positive trend for the
profit elasticity. Such a scenario entails a more negative assessment of competition.
Figure 7 presents profit elasticity trends sorted according to the levels obtained under
the two-way fixed effects model for the period 2005-2009. The conclusion is that the
majority of markets with lowest competition intensity (above the fourth quartile of the
profit elasticity distribution) present positive profit elasticity trends, i.e., they did not
improve their degree of competition (52 per cent in the two-way fixed effects model
and 58 per cent using two-step Heckman(1979)). The figures for the semi-log approach
are 61 and 73 per cent, respectively.
17The trend is estimated by pooled OLS in a panel data setup with trend and step interaction dummies by market.
18

Figure 7: Profit elasticity and semi-elasticity levels vs trends (2000-2009)
(a) Elasticites (b) Semi-elasticities
Note: Elasticity and semi-elasticity trends are sorted according to two-way fixed effects estimates.
3.3 Comparison with classical competition indicators
The robustness of the assessment on market competition is an important issue, espe-
cially when different databases are pooled and the nature of the exercise potentially
leads to policy guidelines. As initially mentioned, the aim of the article is to map com-
petition developments across markets in the Portuguese economy, implicitly selecting
those where deeper competition analysis could take place. Therefore, this subsection
compares results obtained through the profit elasticity measure with those of classical
competition indicators, as published in Amador and Soares (2012).
Panels a) and b) of figure 8 plot the results obtained for the trend in the HHI in
each market with the corresponding estimated trends of profit elasticity, taking the
two-way fixed effects approach under log-log and semi-log specifications for the 2000-
2009 period. The percentage of markets that stand in the first and third quadrants is
54 and 59 per cent in the log-log and semi-log specifications, respectively. Therefore,
in more than half of the markets there is a similar competition assessment in the
two indicators. Panels c) and d) offer a similar comparison but taking trend PCMs
by market, considering only the set of firms with non-negative profits. In this case
the percentage of markets in the first and third quadrants is 61 and 66 per cent in
the log-log and semi-log specifications, respectively.18 Overall, in nearly two thirds
18When the exercise is made using the unconditional PCM trends, i.e., considering also firms with negative profits,the percentages drop to 46 and 47 per cent, respectively. As referred, this is not the set of firms considered in thecalculation of Boone (2008) measure.
19
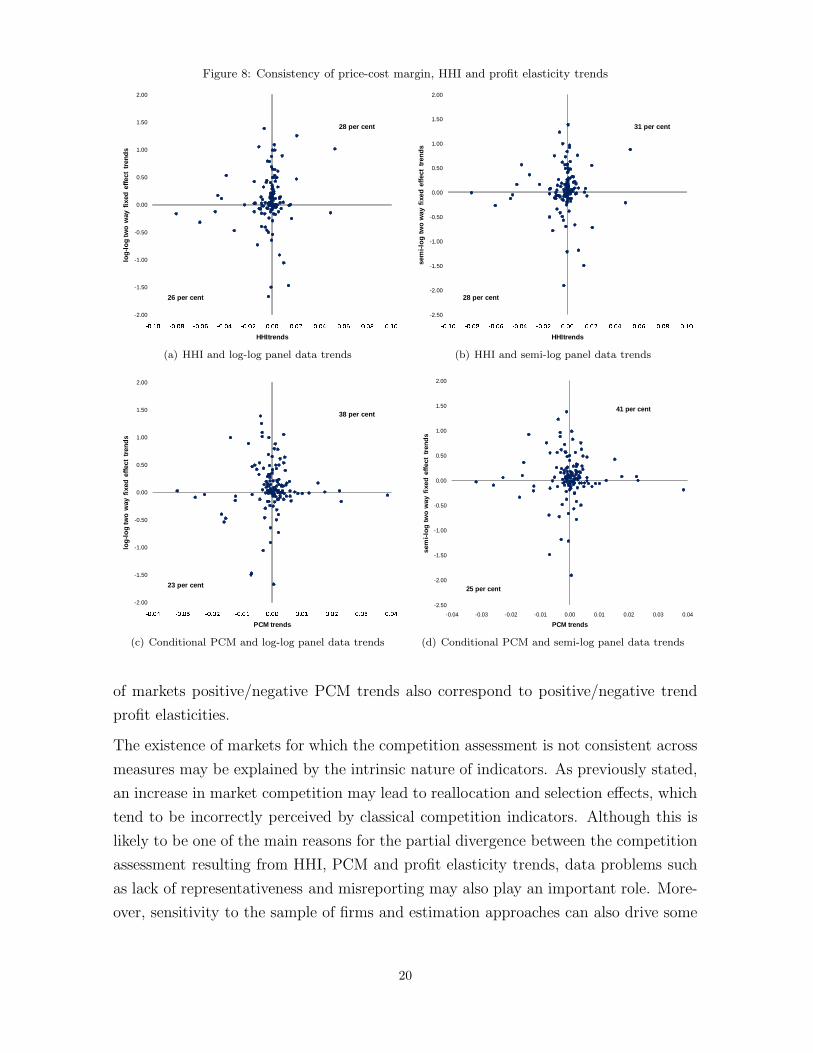
Figure 8: Consistency of price-cost margin, HHI and profit elasticity trends
-2.00
-1.50
-1.00
-0.50
0.00
0.50
1.00
1.50
2.00
����� ����� ����� ���� ���� ���� ��� ��� ���� ���� ����log
-lo
g tw
o w
ay f
ixed
eff
ect
tren
ds
HHItrends
28 per cent
26 per cent
(a) HHI and log-log panel data trends
-2.50
-2.00
-1.50
-1.00
-0.50
0.00
0.50
1.00
1.50
2.00
�� �� �� �� �� �� �� �� �� �� � �� � �� � �� � �� � �� � ��sem
i-lo
g t
wo
way
fix
ed e
ffec
t tr
end
s
HHItrends
31 per cent
28 per cent
(b) HHI and semi-log panel data trends
-2.00
-1.50
-1.00
-0.50
0.00
0.50
1.00
1.50
2.00
����� ����� ����� ����� ���� ���� ���� ���� ����log
-lo
g tw
o w
ay f
ixed
eff
ect
tren
ds
PCM trends
38 per cent
23 per cent
(c) Conditional PCM and log-log panel data trends
-2.50
-2.00
-1.50
-1.00
-0.50
0.00
0.50
1.00
1.50
2.00
-0.04 -0.03 -0.02 -0.01 0.00 0.01 0.02 0.03 0.04
sem
i-lo
g t
wo
way
fix
ed e
ffec
t tr
end
s
PCM trends
41 per cent
25 per cent
(d) Conditional PCM and semi-log panel data trends
of markets positive/negative PCM trends also correspond to positive/negative trend
profit elasticities.
The existence of markets for which the competition assessment is not consistent across
measures may be explained by the intrinsic nature of indicators. As previously stated,
an increase in market competition may lead to reallocation and selection effects, which
tend to be incorrectly perceived by classical competition indicators. Although this is
likely to be one of the main reasons for the partial divergence between the competition
assessment resulting from HHI, PCM and profit elasticity trends, data problems such
as lack of representativeness and misreporting may also play an important role. More-
over, sensitivity to the sample of firms and estimation approaches can also drive some
20

differences.
Authors like Griffith et al. (2005) and Peroni and Ferreira (2011) present correlations
between estimated profit elasticity levels and PCMs. However, these results are not
comparable to those presented above because they focus on profit elasticity levels and
not on competition trends.
4 Concluding remarks
The assessment of competition developments in an economy is an important element
for applied policy-analysis. This article uses firm-level data from 2000-2009 to assess
competition in the Portuguese markets using the measure of profit elasticity to marginal
costs, suggested by Boone (2008). The article reports profit elasticity levels and trends
for the different markets, focusing mainly on the distinction between tradable and
non-tradable sectors.
The article concludes that there is a significant dispersion of profit elasticity levels
across markets. In the benchmark econometric specification, the average absolute
profit elasticity in the Portuguese economy is 2.7 per cent in the period 2005-2009, a
magnitude similar to the ones presented in studies for other EU countries. Moreover,
average absolute profit elasticity in tradable and non-tradable sectors is 3.1 and 1.9
per cent, respectively, suggesting a lower intensity of competition in the latter sector.
When individual markets are aggregated using as weights their shares in total sales,
GVA and employment, the non-tradable sector remains the less competitive.
Since profit elasticity levels are not directly comparable across markets, trends are
generally considered a more robust indicator of competition developments. In this con-
text, one conclusion of the article is that the majority of markets presented reductions
in competition in the 2000-2009 period, though there is substantial heterogeneity. In
addition, markets that faced reductions in competition represent the large majority of
sales, GVA and employment in the Portuguese economy. Moreover, the non-tradable
sector presents a lower incidence of competition reductions compared with the tradable
sector in terms of percentage of markets, but not in terms of their share in sales, GVA
and employment. Finally, the majority of markets with lowest levels of competition
did not exhibit an increase in competition.
One criticism pointed to the profit elasticity indicator is its sensitivity to econometric
specifications, the set of firms considered or the time period chosen for analysis. For
this reason a large battery of robustness tests is presented in the article. Reassuringly,
the different robustness tests sustain the main conclusions presented. Finally, in more
21
than half of the markets there is an agreement between the competition assessment
based on the trend profit elasticity indicator and the trends of the classical HHI and
PCM competition measures.
Overall, it seems that there is substantial room to improve competition in the Por-
tuguese economy, especially in the non-tradable sector. Such improvement would
prompt a more efficient allocation of resources in the economy, thus contributing to
the correction of existing macroeconomic imbalances. In fact, entry and exit of firms
across markets and the reallocation of resources towards the most efficient firms in each
market are key elements to increase total productivity. Future research should explore
the economic determinants of these effects.
References
Altomonte, C., Nicolini, M., Ogliari, L. and Rung, A. (2010), Assessing the competitive
behaviour of firms in the single market: A micro based approach, Economic Papers
409, European Commission.
Amador, J. and Soares, A. (2012), Competition in the Portuguese economy: An
overview of classical indicators, Working Paper 8, Banco de Portugal.
Boone, J. (2000), Competition, Technical Report 104, CPB Discussion Paper.
Boone, J. (2008), ‘A new way to measure competition’, The Economic Journal 111(Au-
gust), 1245–1261.
Boone, J., van Ours, J. and van der Wiel, H. (2007), How (not) to measure competition,
Technical Report 91, CPB Discussion Paper.
Braila, C., Rayp, G. and Sanyal, S. (2010), Competition and regulation, Belgium, 1997
to 2004, Working Papers 3-2010, Federal Planning Bureau.
CPB (2000), Measuring competition: How are cost differentials mapped into profit dif-
ferentials?, Working Papers 131, Netherlands Bureau for Economic Policy Analysis.
Devine, H., Doan, T., Iyer, K., Mok, P. and Stevens, P. (2011), Competition in New
Zealand industries: Measurement and evidence, Technical report, Ministry of Eco-
nomic Development.
Griffith, R., Boone, J. and Harrison, R. (2005), Measuring competition, Research Work-
ing Paper Series 022-August-2005, Advanced Institute of Management Research.
Hausman, J. (1978), ‘Specification tests in econometrics’, Econometrica 46, 1251–1271.
22

Heckman, J. (1979), ‘Sample selection bias as a specification error’, Econometrica
47(1), 153–161.
Leuvensteijn, M., Sørensen, C., Bikker, J. and Rixtel, A. (2008), Impact of bank com-
petition in interest rate pass-through in the euro area, DNB Working Paper 171, De
Nederlandsche Bank.
Maliranta, M., Pajarinen, M., Rouvinen, P. and Yla-Anttila, P. (2007), Competition
in Finland: Trends across business sectors in 1994-2004, Technical Report 13-2007,
Ministry of Trade and Industry.
Peroni, C. and Ferreira, I. (2011), Competition and innovaton in Luxemburg, Economie
et Statistiques Working paper 52, STATEC.
Polder, M., Veldhuizen, E., Bergen, D. and Pijll, E. (2009), Micro and macro indicators
of competition: Comparison and relation with productivity change, Discussion paper
09024, Statistics Netherlands.
Schiersch, A. and Schmidt-Ehmcke, J. (2010), Empiricism meets theory - is the boone-
indicator applicable?, Technical Report 1030, DIW Discussion Papers.
Simar, L. and Wilson, P. (2005), Statistical inference in nonparametric frontier models:
Re-cent developments and perspectives, in H. Fried, C. Lovell and S. Schmidt, eds,
‘The Measurement of Productive Efficiency Techniques and Application 2nd Edition’,
Oxford University Press, pp. 1–125.
Wooldridge, J. M. (2002), Econometric Analysis of Cross Section and Panel Data, MIT
Press.
23

Table 3: Level and trend profit elasticities for different markets
CAE2.1 MarketProfit
Elast.Nb.ob. Two-way fixed effects Cross-section
2005-09 2000-09 log-log semi-log log-log semi-log
151Prod., processing and preserving of meat andmeat products
-2.0 1,998 -0.06 0.11 0.70 0.70
152Processing and preserving of fish and fish prod-ucts
-3.8 637 0.28 0.57 -0.97 -0.87
153 Processing and preserving of fruit and vegetables -4.7 601 -0.07 -0.14 0.32 0.38154 Manuf. of vegetable and animal oils and fats -1.6 1,066 0.04 0.09 0.07 0.10155 Manuf. of dairy products -3.9 972 0.11 0.09 -0.39 -0.29
156Manuf. of grain mill products, starches andstarch products
-0.8 492 -0.17 -0.38 0.04 0.27
157 Manuf. of prepared animal feeds -0.1 692 0.03 0.73** 1.9*** 1.72***158 Manuf. of other food products -3.4 13,791 -0.05 -0.16 0.10 0.17159 Manuf. of beverages -2.0 2,421 0.00 0.01 -0.16 -0.03171 Preparation and spinning of textile fibres -5.6 530 0.87** 0.83** 0.58 0.56172 Textile weaving -1.7 932 -0.29 0.03 0.41 0.55*173 Finishing of textiles -5.0 1,289 0.16 -0.03 0.17 0.11174 Manuf. of textile articles, except apparel -3.3 2,181 -0.01 -0.05 -0.19 -0.16175 Manuf. of other textiles -4.0 2,920 0.00 -0.01 0.07 -0.03176 Manuf. of knitted and crocheted fabrics -1.6 1,000 0.20 -0.03 0.50 0.34177 Manuf. of knitted and crocheted articles -3.5 1,659 0.35* 0.4* -0.77 -0.57182 Manuf. of other wearing apparel and accessories -3.8 15,722 0.65*** 0.5*** 0.30 0.28**191 Tanning and dressing of leather -3.0 412 0.40 0.49 0.39 0.34
192Manuf. of luggage, handbags and the like, sad-dlery and harness
-2.9 418 0.33 0.07 0.28 0.13
193 Manuf. of footwear -3.9 6,772 -0.01 0.05 0.41* 0.27
201Sawmilling and planing of wood; impregnationof wood
-1.5 2,128 0.78*** 0.57* -0.25 -0.22
202Manuf. of sheets, plywood, laminboard, particleboard and fibre board
-8.1 167 -1.06 -1.18 0.45 0.63
203 Manuf. of builders carpentry and joinery -3.6 4,864 0.49** 0.33** 0.08 0.03204 Manuf. of wooden containers -3.4 350 0.17 -0.05 1.15*** 0.91**
205Manuf. of other wood products, cork articles,straw and plaiting materials
-1.3 3,521 0.53*** 0.63*** 1.37* 0.92*
211 Manuf. of pulp, paper and paperboard -3.9 198 -0.54*** 0.10 -0.36 -0.28212 Manuf. of articles of paper and paperboard -2.4 6,594 0.49** -0.01 -0.33 -0.31221 Publishing -1.7 3,558 0.14* 0.23** -0.30 -0.25222 Printing and service activities related to printing -1.7 3,656 0.04 -0.03 -0.15 -0.16241 Manuf. of basic chemicals -1.9 739 -0.17 -0.09 0.41 0.44
243Manuf. of paints, varnishes and similar coatings,printing ink and mastics
-4.5 658 -1.5** -0.70 -0.98** -0.67**
244Manuf. of pharmaceuticals, medicinal chemicalsand botanical products
-1.9 581 -0.09 0.05 0.52*** 0.43***
245Manuf. of soap and detergents and cleaningpreparations
-7.3 649 -0.5** -0.57** -0.26 -0.29
246 Manuf. of other chemical products -1.7 479 1.26*** -0.72* 0.36 0.10251 Manuf. of rubber products -7.8 543 -0.13 -0.13 -0.10 -0.16252 Manuf. of plastic products -1.3 3,374 0.13 0.04 -0.18 -0.12261 Manuf. of glass and glass products -5.8 1,381 0.13 0.22 0.75*** 0.67***262 Manuf. of ceramic products -1.0 1,345 0.12 0.24 0.30 0.21263 Manuf. of ceramic tiles and flags -3.5 266 1.09** 0.96 -0.40 -0.24
264Manuf. of bricks, tiles and construction prod-ucts, in baked clay
-0.2 461 -0.04 0.06 -0.63** -0.5**
265 Manuf. of cement, lime and plaster -4.6 139 -0.39 -0.34 -0.05 -0.09
266Manuf. of articles of concrete, plaster and ce-ment
-1.8 1,862 0.19 -0.26 0.34 0.33
267Cutting, shaping and finishing of ornamentaland building stone
-2.5 4,879 -0.03 -0.19 -0.82 -0.61
268 Manuf. of other non-metallic mineral products -9.6 297 0.02 -0.08 0.38 0.33273 Other first processing of iron and steel -1.1 177 -0.65 -1.21 -1.14 -0.99274 Manuf. of basic precious and non-ferrous metals -4.0 321 1.38*** 1.23*** -0.89 -0.65275 Casting of metals -0.4 519 1*** 0.92** 0.35 0.21281 Manuf. of structural metal products -3.6 11,620 0.64*** 0.29** -0.41** -0.20
282Manuf. of tanks, reservoirs, metal containers,central heating radiators and boilers
-7.3 392 -0.07 -0.16 -0.41 -0.41
284Forging, pressing, stamping and roll forming ofmetal; powder metallurgy
-1.7 1,118 0.89*** 0.76* 0.19 -0.03
285Treatment and coating of metals; general me-chanical engineering
-3.2 7,693 -0.13 -0.05 -0.13*** -0.10
286 Manuf. of cutlery, tools and general hardware -1.6 1,623 0.32 0.18 -0.06 0.16287 Manuf. of other fabricated metal products -2.7 4,024 0.43** 0.02 -0.03 -0.27
291Manuf. of machinery for the prod. and use ofmechanical power
-2.8 645 0.47 0.55 0.90 0.96
292 Manuf. of other general purpose machinery -2.5 2,306 -0.18* -0.03 -0.49* -0.53*293 Manuf. of agricultural and forestry machinery -5.2 377 -1.67* -1.91* 0.33 0.20294 Manuf. of machinetools -3.2 463 -0.07 -0.11 -0.23 -0.27295 Manuf. of other special purpose machinery -2.5 4,415 0.21 0.01 0.46 0.06297 Manuf. of domestic appliances n.e.c. -4.8 333 0.44 0.61 0.73 0.89
311Manuf. of electric motors, generators and trans-formers
-3.9 306 0.11 0.16 -0.35 -0.45
312Manuf. of electricity distribution and control ap-paratus
-6.1 469 0.27 0.13 0.12 -0.16
313 Manuf. of insulated wire and cable -13.1 108 -0.91 -0.66 0.29 0.37315 Manuf. of lighting equipment and electric lamps -3.9 690 0.61 0.32 0.40 0.43316 Manuf. of electrical equipment n.e.c. -3.1 1,085 -0.74** -0.79** -0.29 -0.25
321Manuf. of electronic valves and tubes and otherelectronic components
-5.1 290 -0.15 -0.21 -0.33 -0.11
Note: nt identifies non-tradable sectors. ***,** and * stand for significance levels of 1, 5 and 10 per cent, respectively.Trends are expressed in p.p. Due to confidentiality reasons, some results are not reported.
24
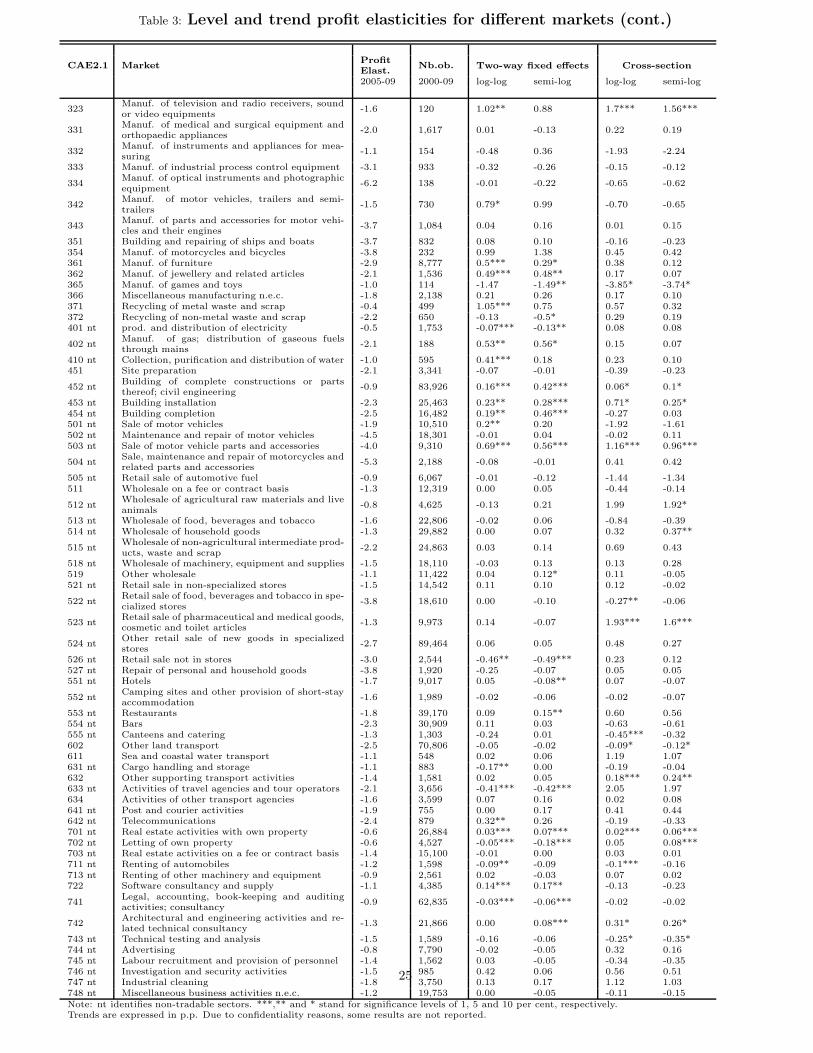
Table 3: Level and trend profit elasticities for different markets (cont.)
CAE2.1 MarketProfit
Elast.Nb.ob. Two-way fixed effects Cross-section
2005-09 2000-09 log-log semi-log log-log semi-log
323Manuf. of television and radio receivers, soundor video equipments
-1.6 120 1.02** 0.88 1.7*** 1.56***
331Manuf. of medical and surgical equipment andorthopaedic appliances
-2.0 1,617 0.01 -0.13 0.22 0.19
332Manuf. of instruments and appliances for mea-suring
-1.1 154 -0.48 0.36 -1.93 -2.24
333 Manuf. of industrial process control equipment -3.1 933 -0.32 -0.26 -0.15 -0.12
334Manuf. of optical instruments and photographicequipment
-6.2 138 -0.01 -0.22 -0.65 -0.62
342Manuf. of motor vehicles, trailers and semi-trailers
-1.5 730 0.79* 0.99 -0.70 -0.65
343Manuf. of parts and accessories for motor vehi-cles and their engines
-3.7 1,084 0.04 0.16 0.01 0.15
351 Building and repairing of ships and boats -3.7 832 0.08 0.10 -0.16 -0.23354 Manuf. of motorcycles and bicycles -3.8 232 0.99 1.38 0.45 0.42361 Manuf. of furniture -2.9 8,777 0.5*** 0.29* 0.38 0.12362 Manuf. of jewellery and related articles -2.1 1,536 0.49*** 0.48** 0.17 0.07365 Manuf. of games and toys -1.0 114 -1.47 -1.49** -3.85* -3.74*366 Miscellaneous manufacturing n.e.c. -1.8 2,138 0.21 0.26 0.17 0.10371 Recycling of metal waste and scrap -0.4 499 1.05*** 0.75 0.57 0.32372 Recycling of non-metal waste and scrap -2.2 650 -0.13 -0.5* 0.29 0.19401 nt prod. and distribution of electricity -0.5 1,753 -0.07*** -0.13** 0.08 0.08
402 ntManuf. of gas; distribution of gaseous fuelsthrough mains
-2.1 188 0.53** 0.56* 0.15 0.07
410 nt Collection, purification and distribution of water -1.0 595 0.41*** 0.18 0.23 0.10451 Site preparation -2.1 3,341 -0.07 -0.01 -0.39 -0.23
452 ntBuilding of complete constructions or partsthereof; civil engineering
-0.9 83,926 0.16*** 0.42*** 0.06* 0.1*
453 nt Building installation -2.3 25,463 0.23** 0.28*** 0.71* 0.25*454 nt Building completion -2.5 16,482 0.19** 0.46*** -0.27 0.03501 nt Sale of motor vehicles -1.9 10,510 0.2** 0.20 -1.92 -1.61502 nt Maintenance and repair of motor vehicles -4.5 18,301 -0.01 0.04 -0.02 0.11503 nt Sale of motor vehicle parts and accessories -4.0 9,310 0.69*** 0.56*** 1.16*** 0.96***
504 ntSale, maintenance and repair of motorcycles andrelated parts and accessories
-5.3 2,188 -0.08 -0.01 0.41 0.42
505 nt Retail sale of automotive fuel -0.9 6,067 -0.01 -0.12 -1.44 -1.34511 Wholesale on a fee or contract basis -1.3 12,319 0.00 0.05 -0.44 -0.14
512 ntWholesale of agricultural raw materials and liveanimals
-0.8 4,625 -0.13 0.21 1.99 1.92*
513 nt Wholesale of food, beverages and tobacco -1.6 22,806 -0.02 0.06 -0.84 -0.39514 nt Wholesale of household goods -1.3 29,882 0.00 0.07 0.32 0.37**
515 ntWholesale of non-agricultural intermediate prod-ucts, waste and scrap
-2.2 24,863 0.03 0.14 0.69 0.43
518 nt Wholesale of machinery, equipment and supplies -1.5 18,110 -0.03 0.13 0.13 0.28519 Other wholesale -1.1 11,422 0.04 0.12* 0.11 -0.05521 nt Retail sale in non-specialized stores -1.5 14,542 0.11 0.10 0.12 -0.02
522 ntRetail sale of food, beverages and tobacco in spe-cialized stores
-3.8 18,610 0.00 -0.10 -0.27** -0.06
523 ntRetail sale of pharmaceutical and medical goods,cosmetic and toilet articles
-1.3 9,973 0.14 -0.07 1.93*** 1.6***
524 ntOther retail sale of new goods in specializedstores
-2.7 89,464 0.06 0.05 0.48 0.27
526 nt Retail sale not in stores -3.0 2,544 -0.46** -0.49*** 0.23 0.12527 nt Repair of personal and household goods -3.8 1,920 -0.25 -0.07 0.05 0.05551 nt Hotels -1.7 9,017 0.05 -0.08** 0.07 -0.07
552 ntCamping sites and other provision of short-stayaccommodation
-1.6 1,989 -0.02 -0.06 -0.02 -0.07
553 nt Restaurants -1.8 39,170 0.09 0.15** 0.60 0.56554 nt Bars -2.3 30,909 0.11 0.03 -0.63 -0.61555 nt Canteens and catering -1.3 1,303 -0.24 0.01 -0.45*** -0.32602 Other land transport -2.5 70,806 -0.05 -0.02 -0.09* -0.12*611 Sea and coastal water transport -1.1 548 0.02 0.06 1.19 1.07631 nt Cargo handling and storage -1.1 883 -0.17** 0.00 -0.19 -0.04632 Other supporting transport activities -1.4 1,581 0.02 0.05 0.18*** 0.24**633 nt Activities of travel agencies and tour operators -2.1 3,656 -0.41*** -0.42*** 2.05 1.97634 Activities of other transport agencies -1.6 3,599 0.07 0.16 0.02 0.08641 nt Post and courier activities -1.9 755 0.00 0.17 0.41 0.44642 nt Telecommunications -2.4 879 0.32** 0.26 -0.19 -0.33701 nt Real estate activities with own property -0.6 26,884 0.03*** 0.07*** 0.02*** 0.06***702 nt Letting of own property -0.6 4,527 -0.05*** -0.18*** 0.05 0.08***703 nt Real estate activities on a fee or contract basis -1.4 15,100 -0.01 0.00 0.03 0.01711 nt Renting of automobiles -1.2 1,598 -0.09** -0.09 -0.1*** -0.16713 nt Renting of other machinery and equipment -0.9 2,561 0.02 -0.03 0.07 0.02722 Software consultancy and supply -1.1 4,385 0.14*** 0.17** -0.13 -0.23
741Legal, accounting, book-keeping and auditingactivities; consultancy
-0.9 62,835 -0.03*** -0.06*** -0.02 -0.02
742Architectural and engineering activities and re-lated technical consultancy
-1.3 21,866 0.00 0.08*** 0.31* 0.26*
743 nt Technical testing and analysis -1.5 1,589 -0.16 -0.06 -0.25* -0.35*744 nt Advertising -0.8 7,790 -0.02 -0.05 0.32 0.16745 nt Labour recruitment and provision of personnel -1.4 1,562 0.03 -0.05 -0.34 -0.35746 nt Investigation and security activities -1.5 985 0.42 0.06 0.56 0.51747 nt Industrial cleaning -1.8 3,750 0.13 0.17 1.12 1.03748 nt Miscellaneous business activities n.e.c. -1.2 19,753 0.00 -0.05 -0.11 -0.15
Note: nt identifies non-tradable sectors. ***,** and * stand for significance levels of 1, 5 and 10 per cent, respectively.Trends are expressed in p.p. Due to confidentiality reasons, some results are not reported.
25


Banco de Portugal | Working Papers i
WORKING PAPERS
2010
1/10 MEASURING COMOVEMENT IN THE TIME-FREQUENCY SPACE — António Rua
2/10 EXPORTS, IMPORTS AND WAGES: EVIDENCE FROM MATCHED FIRM-WORKER-PRODUCT PANELS — Pedro S. Martins, Luca David Opromolla
3/10 NONSTATIONARY EXTREMES AND THE US BUSINESS CYCLE — Miguel de Carvalho, K. Feridun Turkman, António Rua
4/10 EXPECTATIONS-DRIVEN CYCLES IN THE HOUSING MARKET — Luisa Lambertini, Caterina Mendicino, Maria Teresa Punzi
5/10 COUNTERFACTUAL ANALYSIS OF BANK MERGERS — Pedro P. Barros, Diana Bonfi m, Moshe Kim, Nuno C. Martins
6/10 THE EAGLE. A MODEL FOR POLICY ANALYSIS OF MACROECONOMIC INTERDEPENDENCE IN THE EURO AREA — S. Gomes, P. Jacquinot, M. Pisani
7/10 A WAVELET APPROACH FOR FACTOR-AUGMENTED FORECASTING — António Rua
8/10 EXTREMAL DEPENDENCE IN INTERNATIONAL OUTPUT GROWTH: TALES FROM THE TAILS — Miguel de Carvalho, António Rua
9/10 TRACKING THE US BUSINESS CYCLE WITH A SINGULAR SPECTRUM ANALYSIS — Miguel de Carvalho, Paulo C. Rodrigues, António Rua
10/10 A MULTIPLE CRITERIA FRAMEWORK TO EVALUATE BANK BRANCH POTENTIAL ATTRACTIVENESS — Fernando A. F. Ferreira, Ronald W. Spahr, Sérgio P. Santos, Paulo M. M. Rodrigues
11/10 THE EFFECTS OF ADDITIVE OUTLIERS AND MEASUREMENT ERRORS WHEN TESTING FOR STRUCTURAL BREAKS IN VARIANCE
— Paulo M. M. Rodrigues, Antonio Rubia
12/10 CALENDAR EFFECTS IN DAILY ATM WITHDRAWALS — Paulo Soares Esteves, Paulo M. M. Rodrigues
13/10 MARGINAL DISTRIBUTIONS OF RANDOM VECTORS GENERATED BY AFFINE TRANSFORMATIONS OF INDEPENDENT TWO-PIECE NORMAL VARIABLES
— Maximiano Pinheiro
14/10 MONETARY POLICY EFFECTS: EVIDENCE FROM THE PORTUGUESE FLOW OF FUNDS — Isabel Marques Gameiro, João Sousa
15/10 SHORT AND LONG INTEREST RATE TARGETS — Bernardino Adão, Isabel Correia, Pedro Teles
16/10 FISCAL STIMULUS IN A SMALL EURO AREA ECONOMY — Vanda Almeida, Gabriela Castro, Ricardo Mourinho Félix, José Francisco Maria
17/10 FISCAL INSTITUTIONS AND PUBLIC SPENDING VOLATILITY IN EUROPE — Bruno Albuquerque

Banco de Portugal | Working Papers ii
18/10 GLOBAL POLICY AT THE ZERO LOWER BOUND IN A LARGE-SCALE DSGE MODEL — S. Gomes, P. Jacquinot, R. Mestre, J. Sousa
19/10 LABOR IMMOBILITY AND THE TRANSMISSION MECHANISM OF MONETARY POLICY IN A MONETARY UNION — Bernardino Adão, Isabel Correia
20/10 TAXATION AND GLOBALIZATION — Isabel Correia
21/10 TIME-VARYING FISCAL POLICY IN THE U.S. — Manuel Coutinho Pereira, Artur Silva Lopes
22/10 DETERMINANTS OF SOVEREIGN BOND YIELD SPREADS IN THE EURO AREA IN THE CONTEXT OF THE ECONOMIC AND FINANCIAL CRISIS
— Luciana Barbosa, Sónia Costa
23/10 FISCAL STIMULUS AND EXIT STRATEGIES IN A SMALL EURO AREA ECONOMY — Vanda Almeida, Gabriela Castro, Ricardo Mourinho Félix, José Francisco Maria
24/10 FORECASTING INFLATION (AND THE BUSINESS CYCLE?) WITH MONETARY AGGREGATES — João Valle e Azevedo, Ana Pereira
25/10 THE SOURCES OF WAGE VARIATION: AN ANALYSIS USING MATCHED EMPLOYER-EMPLOYEE DATA — Sónia Torres,Pedro Portugal, John T.Addison, Paulo Guimarães
26/10 THE RESERVATION WAGE UNEMPLOYMENT DURATION NEXUS — John T. Addison, José A. F. Machado, Pedro Portugal
27/10 BORROWING PATTERNS, BANKRUPTCY AND VOLUNTARY LIQUIDATION — José Mata, António Antunes, Pedro Portugal
28/10 THE INSTABILITY OF JOINT VENTURES: LEARNING FROM OTHERS OR LEARNING TO WORK WITH OTHERS — José Mata, Pedro Portugal
29/10 THE HIDDEN SIDE OF TEMPORARY EMPLOYMENT: FIXED-TERM CONTRACTS AS A SCREENING DEVICE — Pedro Portugal, José Varejão
30/10 TESTING FOR PERSISTENCE CHANGE IN FRACTIONALLY INTEGRATED MODELS: AN APPLICATION TO WORLD INFLATION RATES
— Luis F. Martins, Paulo M. M. Rodrigues
31/10 EMPLOYMENT AND WAGES OF IMMIGRANTS IN PORTUGAL — Sónia Cabral, Cláudia Duarte
32/10 EVALUATING THE STRENGTH OF IDENTIFICATION IN DSGE MODELS. AN A PRIORI APPROACH — Nikolay Iskrev
33/10 JOBLESSNESS — José A. F. Machado, Pedro Portugal, Pedro S. Raposo
2011
1/11 WHAT HAPPENS AFTER DEFAULT? STYLIZED FACTS ON ACCESS TO CREDIT — Diana Bonfi m, Daniel A. Dias, Christine Richmond
2/11 IS THE WORLD SPINNING FASTER? ASSESSING THE DYNAMICS OF EXPORT SPECIALIZATION — João Amador
Banco de Portugal | Working Papers iii
3/11 UNCONVENTIONAL FISCAL POLICY AT THE ZERO BOUND — Isabel Correia, Emmanuel Farhi, Juan Pablo Nicolini, Pedro Teles
4/11 MANAGERS’ MOBILITY, TRADE STATUS, AND WAGES — Giordano Mion, Luca David Opromolla
5/11 FISCAL CONSOLIDATION IN A SMALL EURO AREA ECONOMY — Vanda Almeida, Gabriela Castro, Ricardo Mourinho Félix, José Francisco Maria
6/11 CHOOSING BETWEEN TIME AND STATE DEPENDENCE: MICRO EVIDENCE ON FIRMS’ PRICE-REVIEWING STRATEGIES
— Daniel A. Dias, Carlos Robalo Marques, Fernando Martins
7/11 WHY ARE SOME PRICES STICKIER THAN OTHERS? FIRM-DATA EVIDENCE ON PRICE ADJUSTMENT LAGS — Daniel A. Dias, Carlos Robalo Marques, Fernando Martins, J. M. C. Santos Silva
8/11 LEANING AGAINST BOOM-BUST CYCLES IN CREDIT AND HOUSING PRICES — Luisa Lambertini, Caterina Mendicino, Maria Teresa Punzi
9/11 PRICE AND WAGE SETTING IN PORTUGAL LEARNING BY ASKING — Fernando Martins
10/11 ENERGY CONTENT IN MANUFACTURING EXPORTS: A CROSS-COUNTRY ANALYSIS — João Amador
11/11 ASSESSING MONETARY POLICY IN THE EURO AREA: A FACTOR-AUGMENTED VAR APPROACH — Rita Soares
12/11 DETERMINANTS OF THE EONIA SPREAD AND THE FINANCIAL CRISIS — Carla Soares, Paulo M. M. Rodrigues
13/11 STRUCTURAL REFORMS AND MACROECONOMIC PERFORMANCE IN THE EURO AREA COUNTRIES: A MODEL-BASED ASSESSMENT
— S. Gomes, P. Jacquinot, M. Mohr, M. Pisani
14/11 RATIONAL VS. PROFESSIONAL FORECASTS — João Valle e Azevedo, João Tovar Jalles
15/11 ON THE AMPLIFICATION ROLE OF COLLATERAL CONSTRAINTS — Caterina Mendicino
16/11 MOMENT CONDITIONS MODEL AVERAGING WITH AN APPLICATION TO A FORWARD-LOOKING MONETARY POLICY REACTION FUNCTION
— Luis F. Martins
17/11 BANKS’ CORPORATE CONTROL AND RELATIONSHIP LENDING: EVIDENCE FROM RETAIL LOANS — Paula Antão, Miguel A. Ferreira, Ana Lacerda
18/11 MONEY IS AN EXPERIENCE GOOD: COMPETITION AND TRUST IN THE PRIVATE PROVISION OF MONEY — Ramon Marimon, Juan Pablo Nicolini, Pedro Teles
19/11 ASSET RETURNS UNDER MODEL UNCERTAINTY: EVIDENCE FROM THE EURO AREA, THE U.K. AND THE U.S. — João Sousa, Ricardo M. Sousa
20/11 INTERNATIONAL ORGANISATIONS’ VS. PRIVATE ANALYSTS’ FORECASTS: AN EVALUATION — Ildeberta Abreu
21/11 HOUSING MARKET DYNAMICS: ANY NEWS? — Sandra Gomes, Caterina Mendicino
Banco de Portugal | Working Papers iv
22/11 MONEY GROWTH AND INFLATION IN THE EURO AREA: A TIME-FREQUENCY VIEW — António Rua
23/11 WHY EX(IM)PORTERS PAY MORE: EVIDENCE FROM MATCHED FIRM-WORKER PANELS — Pedro S. Martins, Luca David Opromolla
24/11 THE IMPACT OF PERSISTENT CYCLES ON ZERO FREQUENCY UNIT ROOT TESTS — Tomás del Barrio Castro, Paulo M.M. Rodrigues, A.M. Robert Taylor
25/11 THE TIP OF THE ICEBERG: A QUANTITATIVE FRAMEWORK FOR ESTIMATING TRADE COSTS — Alfonso Irarrazabal, Andreas Moxnes, Luca David Opromolla
26/11 A CLASS OF ROBUST TESTS IN AUGMENTED PREDICTIVE REGRESSIONS — Paulo M.M. Rodrigues, Antonio Rubia
27/11 THE PRICE ELASTICITY OF EXTERNAL DEMAND: HOW DOES PORTUGAL COMPARE WITH OTHER EURO AREA COUNTRIES?
— Sónia Cabral, Cristina Manteu
28/11 MODELING AND FORECASTING INTERVAL TIME SERIES WITH THRESHOLD MODELS: AN APPLICATION TO S&P500 INDEX RETURNS
— Paulo M. M. Rodrigues, Nazarii Salish
29/11 DIRECT VS BOTTOM-UP APPROACH WHEN FORECASTING GDP: RECONCILING LITERATURE RESULTS WITH INSTITUTIONAL PRACTICE
— Paulo Soares Esteves
30/11 A MARKET-BASED APPROACH TO SECTOR RISK DETERMINANTS AND TRANSMISSION IN THE EURO AREA — Martín Saldías
31/11 EVALUATING RETAIL BANKING QUALITY SERVICE AND CONVENIENCE WITH MCDA TECHNIQUES: A CASE STUDY AT THE BANK BRANCH LEVEL
— Fernando A. F. Ferreira, Sérgio P. Santos, Paulo M. M. Rodrigues, Ronald W. Spahr
2012
1/12 PUBLIC-PRIVATE WAGE GAPS IN THE PERIOD PRIOR TO THE ADOPTION OF THE EURO: AN APPLICATION BASED ON LONGITUDINAL DATA
— Maria Manuel Campos, Mário Centeno
2/12 ASSET PRICING WITH A BANK RISK FACTOR — João Pedro Pereira, António Rua
3/12 A WAVELET-BASED ASSESSMENT OF MARKET RISK: THE EMERGING MARKETS CASE — António Rua, Luis C. Nunes
4/12 COHESION WITHIN THE EURO AREA AND THE U. S.: A WAVELET-BASED VIEW — António Rua, Artur Silva Lopes
5/12 EXCESS WORKER TURNOVER AND FIXED-TERM CONTRACTS: CAUSAL EVIDENCE IN A TWO-TIER SYSTEM — Mário Centeno, Álvaro A. Novo
6/12 THE DYNAMICS OF CAPITAL STRUCTURE DECISIONS — Paula Antão, Diana Bonfi m
7/12 QUANTILE REGRESSION FOR LONG MEMORY TESTING: A CASE OF REALIZED VOLATILITY — Uwe Hassler, Paulo M. M. Rodrigues, Antonio Rubia

Banco de Portugal | Working Papers v
8/12 COMPETITION IN THE PORTUGUESE ECONOMY: AN OVERVIEW OF CLASSICAL INDICATORS — João Amador, Ana Cristina Soares
9/12 MARKET PERCEPTION OF FISCAL SUSTAINABILITY: AN APPLICATION TO THE LARGEST EURO AREA ECONOMIES — Maximiano Pinheiro
10/12 THE EFFECTS OF PUBLIC SPENDING EXTERNALITIES — Valerio Ercolani, João Valle e Azevedo
11/12 COLLATERAL REQUIREMENTS: MACROECONOMIC FLUCTUATIONS AND MACRO-PRUDENTIAL POLICY — Caterina Mendicino
12/12 WAGE RIGIDITY AND EMPLOYMENT ADJUSTMENT AT THE FIRM LEVEL: EVIDENCE FROM SURVEY DATA — Daniel A. Dias, Carlos Robalo Marques, Fernando Martins
13/12 HOW TO CREATE INDICES FOR BANK BRANCH FINANCIAL PERFORMANCE MEASUREMENT USING MCDA TECHNIQUES: AN ILLUSTRATIVE EXAMPLE
— Fernando A. F. Ferreira, Paulo M. M. Rodrigues, Sérgio P. Santos, Ronald W. Spahr
14/12 ON INTERNATIONAL POLICY COORDINATION AND THE CORRECTION OF GLOBAL IMBALANCES — Bruno Albuquerque, Cristina Manteu
15/12 IDENTIFYING THE DETERMINANTS OF DOWNWARD WAGE RIGIDITY: SOME METHODOLOGICAL CONSIDERATIONS AND NEW EMPIRICAL EVIDENCE
— Daniel A. Dias, Carlos Robalo Marques, Fernando Martins
16/12 SYSTEMIC RISK ANALYSIS USING FORWARD-LOOKING DISTANCE-TO-DEFAULT SERIES — Martín Saldías
17/12 COMPETITION IN THE PORTUGUESE ECONOMY: INSIGHTS FROM A PROFIT ELASTICITY APPROACH — João Amador, Ana Cristina Soares