Embed Size (px)
Citation preview
www.iwmi.org
Water for a food-secure world
TURNING TRAGEDY INTO AN OPPORTUNITY: WATER MANAGEMENT SOLUTIONS FOR
FLOOD-RECESSION AND DRY-SEASON AGRICULTURE IN NIGERIA
WP 1: FLOOD RISKS ASSESSMENT AND
FORECASTING TOOLS
GIRIRAJ AMARNATH
Contributors: Rajesh Kumar, Alemseged Haile, Niranga Alahacoon,
Ameer Rajah, Salman Siddiqui, Vladimir Smakhtin
International Water Management Institute (IWMI)
Project Inception Workshop. 9 July 2014, Abuja - Nigeria
www.iwmi.org
Water for a food-secure world
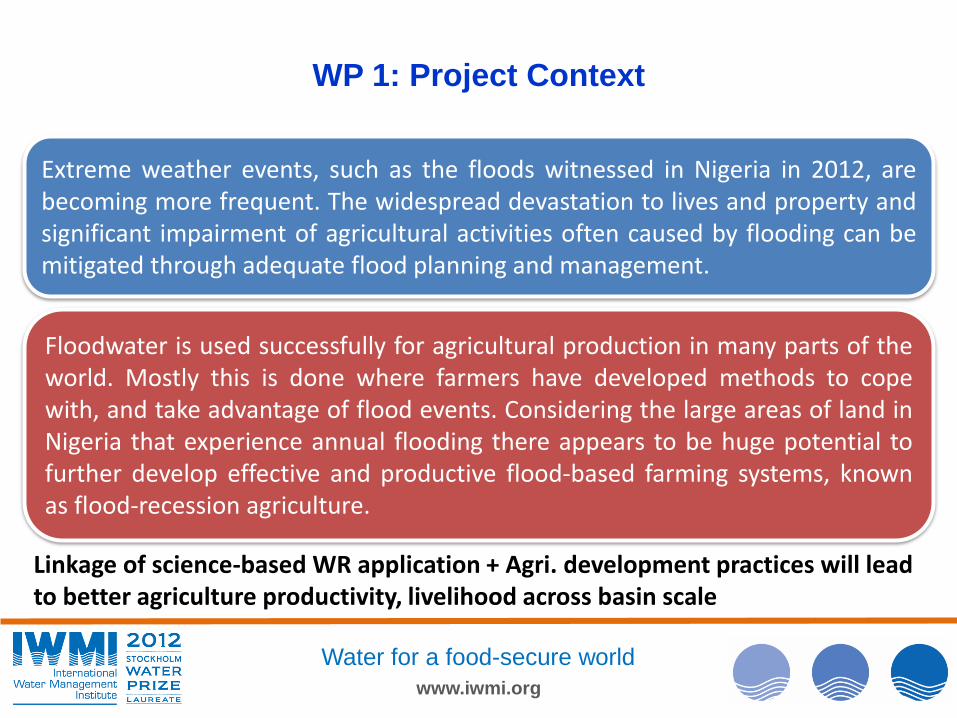
WP 1: Project Context
Extreme weather events, such as the floods witnessed in Nigeria in 2012, arebecoming more frequent. The widespread devastation to lives and property andsignificant impairment of agricultural activities often caused by flooding can bemitigated through adequate flood planning and management.
Floodwater is used successfully for agricultural production in many parts of theworld. Mostly this is done where farmers have developed methods to copewith, and take advantage of flood events. Considering the large areas of land inNigeria that experience annual flooding there appears to be huge potential tofurther develop effective and productive flood-based farming systems, knownas flood-recession agriculture.
Linkage of science-based WR application + Agri. development practices will lead to better agriculture productivity, livelihood across basin scale
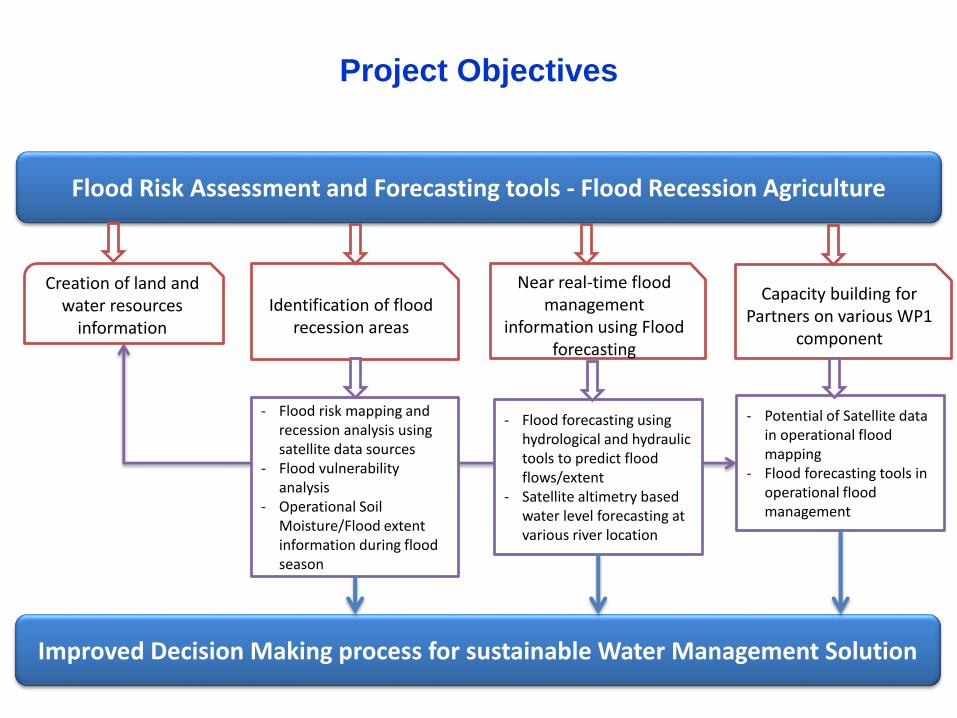
Project Objectives
Flood Risk Assessment and Forecasting tools - Flood Recession Agriculture
Creation of land and water resources
informationIdentification of flood
recession areas
Near real-time flood management
information using Flood forecasting
Capacity building for Partners on various WP1
component
- Flood risk mapping and recession analysis using satellite data sources
- Flood vulnerability analysis
- Operational Soil Moisture/Flood extent information during flood season
- Flood forecasting using hydrological and hydraulic tools to predict flood flows/extent
- Satellite altimetry based water level forecasting at various river location
- Potential of Satellite data in operational flood mapping
- Flood forecasting tools in operational flood management
Improved Decision Making process for sustainable Water Management Solution
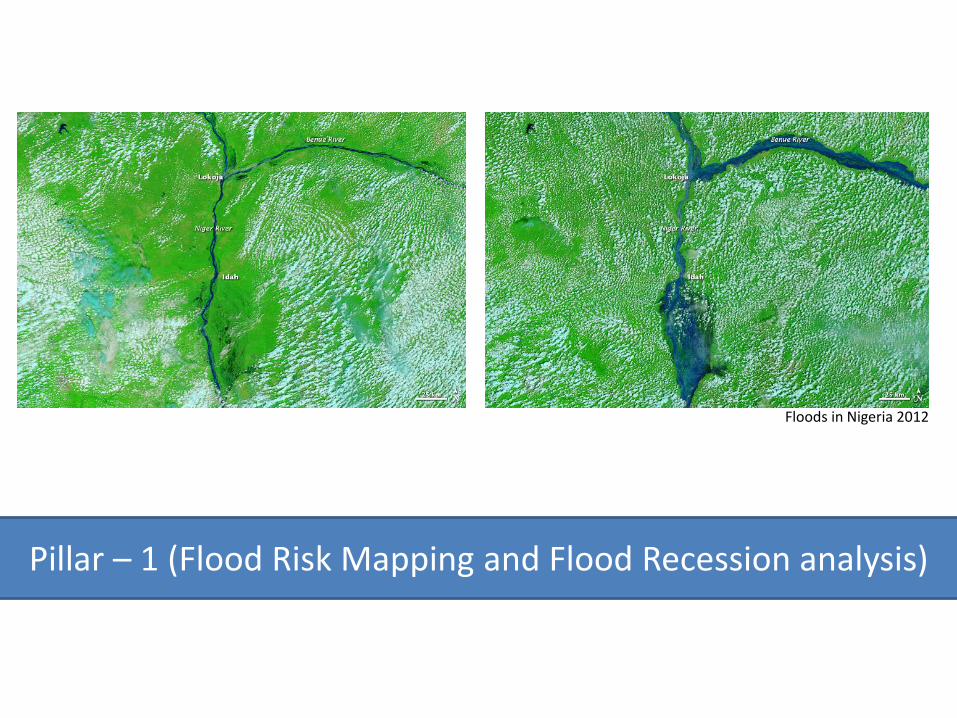
Pillar – 1 (Flood Risk Mapping and Flood Recession analysis)
Floods in Nigeria 2012
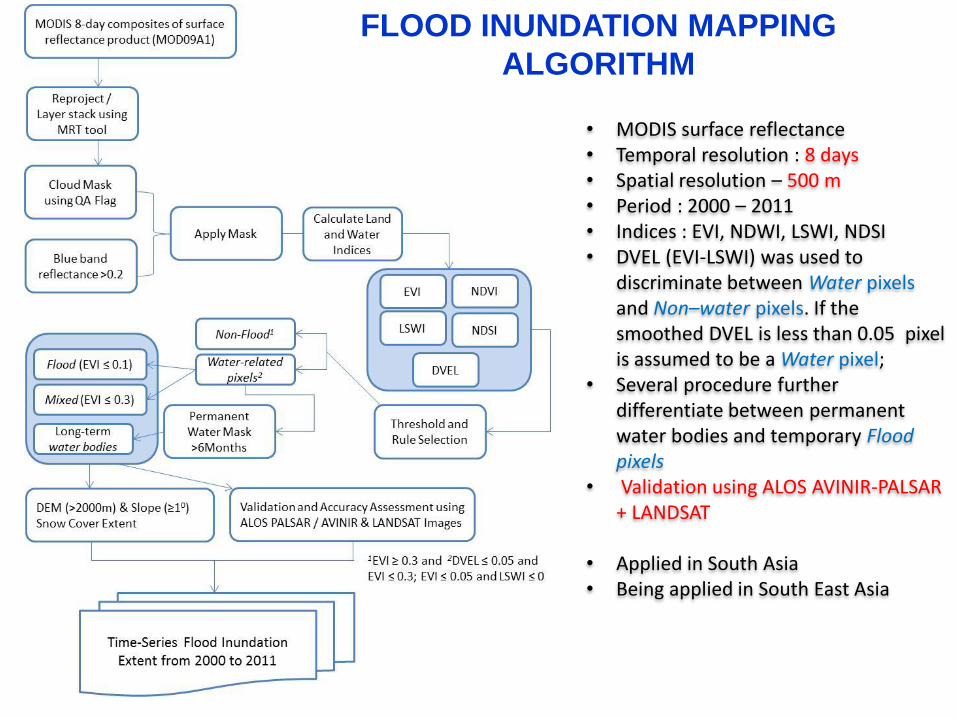
FLOOD INUNDATION MAPPING
ALGORITHM
• MODIS surface reflectance• Temporal resolution : 8 days• Spatial resolution – 500 m• Period : 2000 – 2011• Indices : EVI, NDWI, LSWI, NDSI• DVEL (EVI-LSWI) was used to
discriminate between Water pixels and Non–water pixels. If the smoothed DVEL is less than 0.05 pixel is assumed to be a Water pixel;
• Several procedure further differentiate between permanent water bodies and temporary Flood pixels
• Validation using ALOS AVINIR-PALSAR + LANDSAT
• Applied in South Asia • Being applied in South East Asia
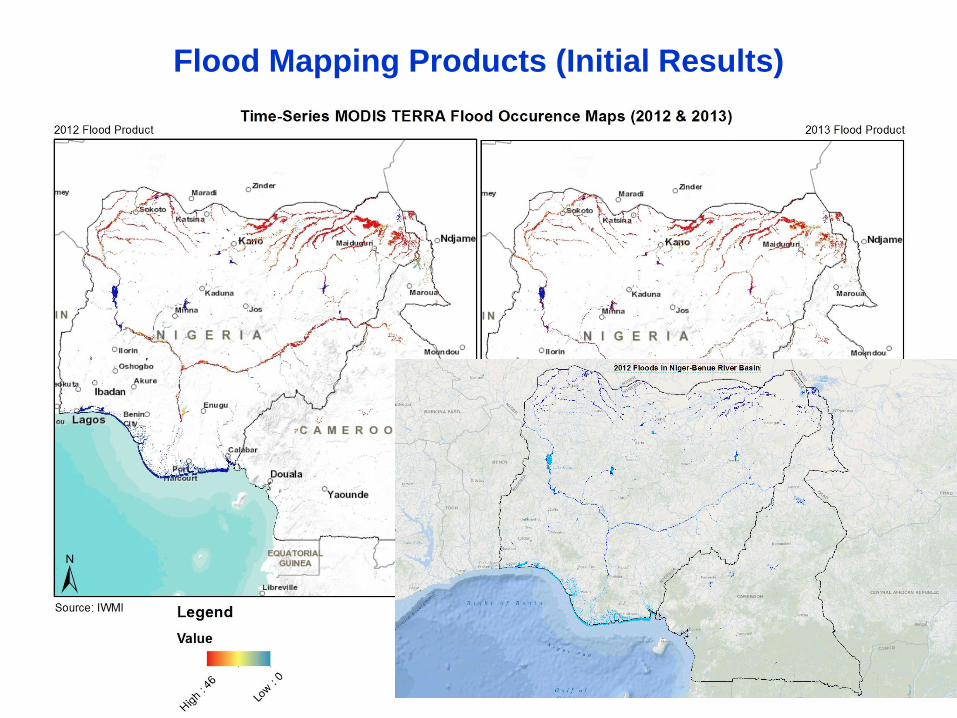
Flood Mapping Products (Initial Results)
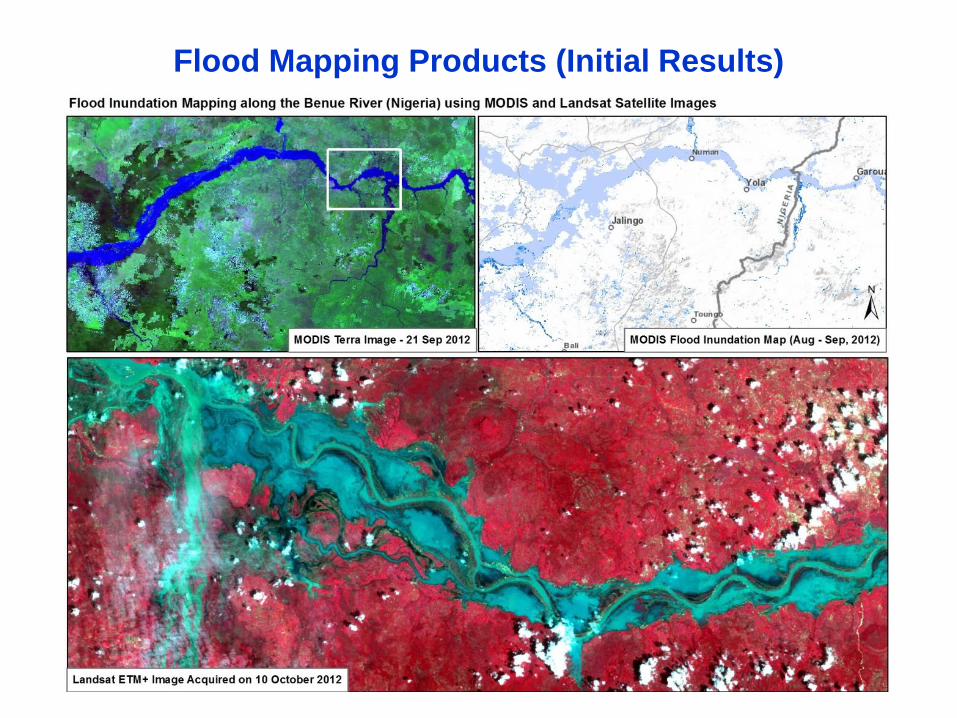
Flood Mapping Products (Initial Results)
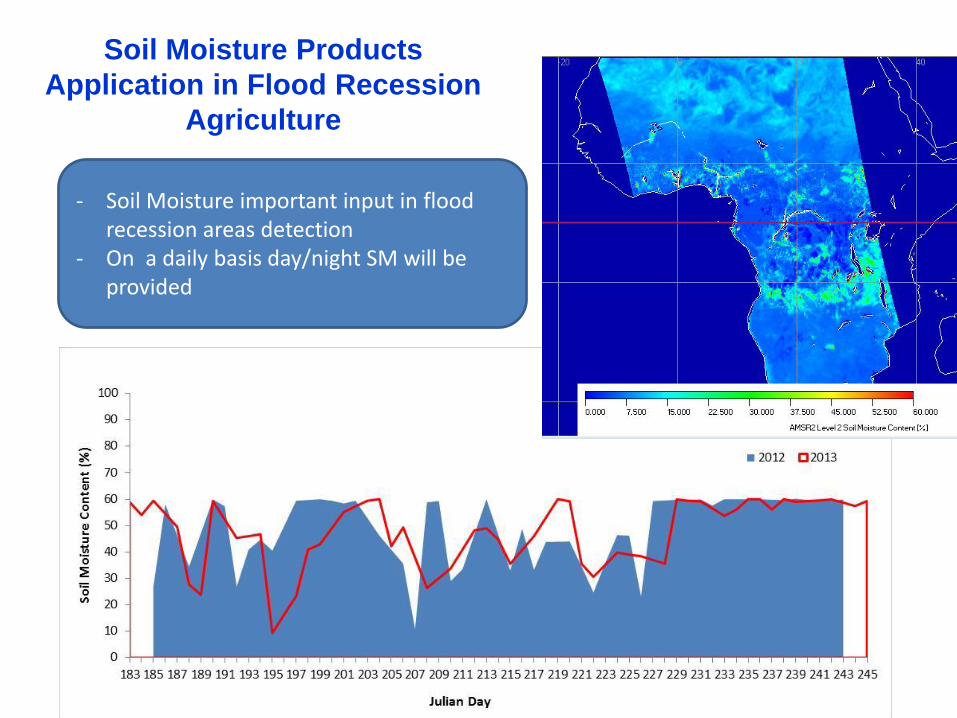
Soil Moisture Products
Application in Flood Recession
Agriculture
- Soil Moisture important input in flood recession areas detection
- On a daily basis day/night SM will be provided
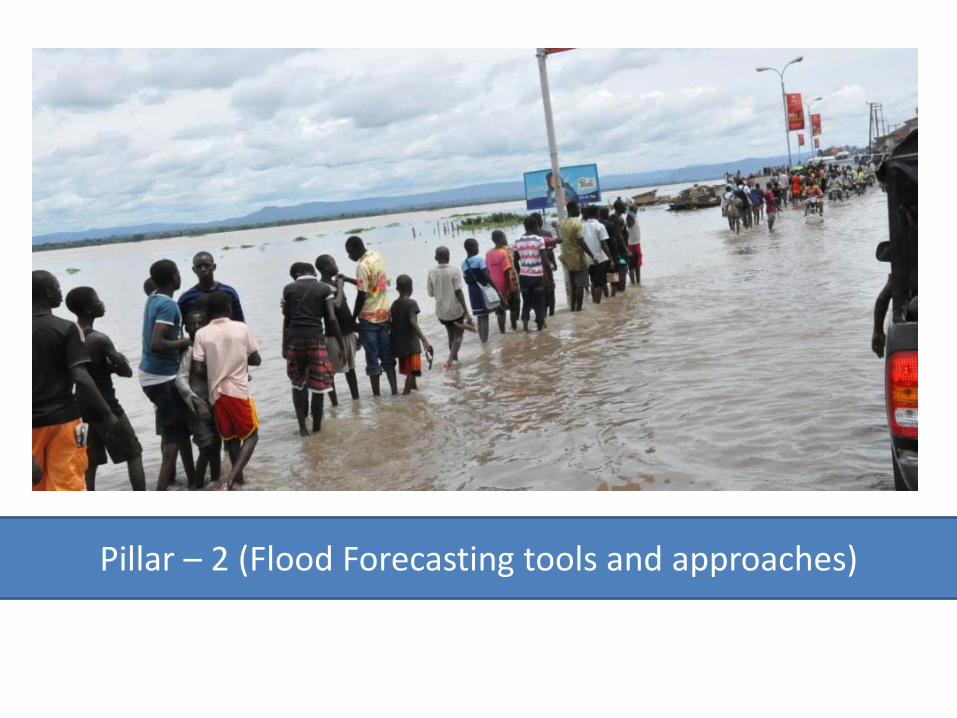
Pillar – 2 (Flood Forecasting tools and approaches)
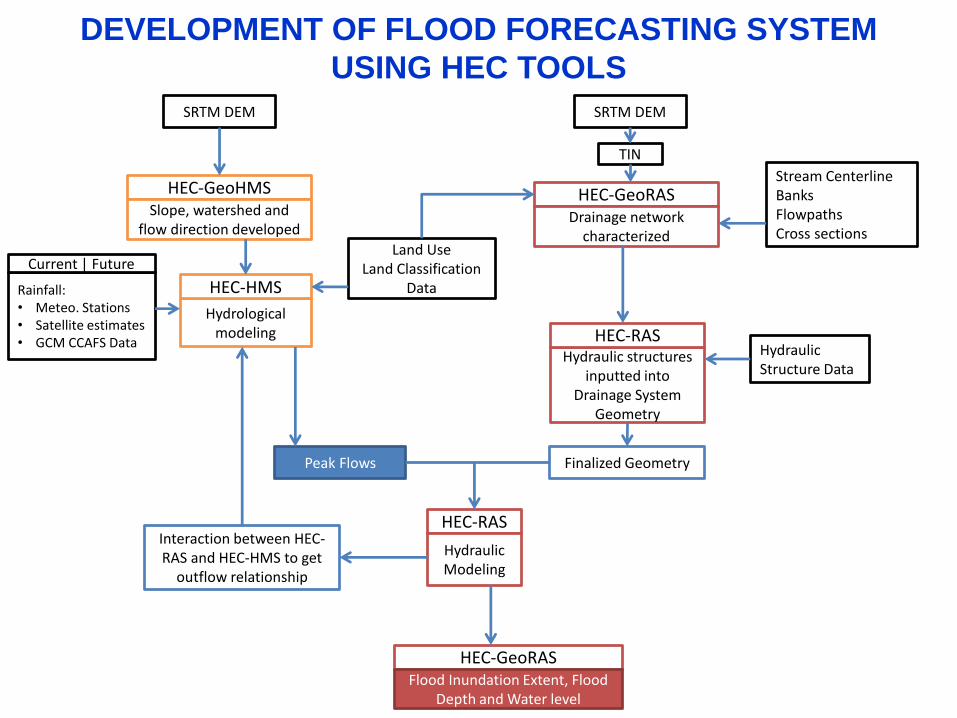
SRTM DEM
HEC-GeoHMSSlope, watershed and
flow direction developed
Hydrological modeling
HEC-HMSRainfall:• Meteo. Stations• Satellite estimates• GCM CCAFS Data
Interaction between HEC-RAS and HEC-HMS to get
outflow relationship
Peak Flows
Land UseLand Classification
Data
Hydraulic structures inputted into
Drainage System Geometry
HEC-RAS
HEC-GeoRASDrainage network
characterized
SRTM DEM
TIN
Finalized Geometry
HEC-RAS
HydraulicModeling
HEC-GeoRASFlood Inundation Extent, Flood
Depth and Water level
Stream CenterlineBanksFlowpathsCross sections
Hydraulic Structure Data
Current | Future
DEVELOPMENT OF FLOOD FORECASTING SYSTEM
USING HEC TOOLS
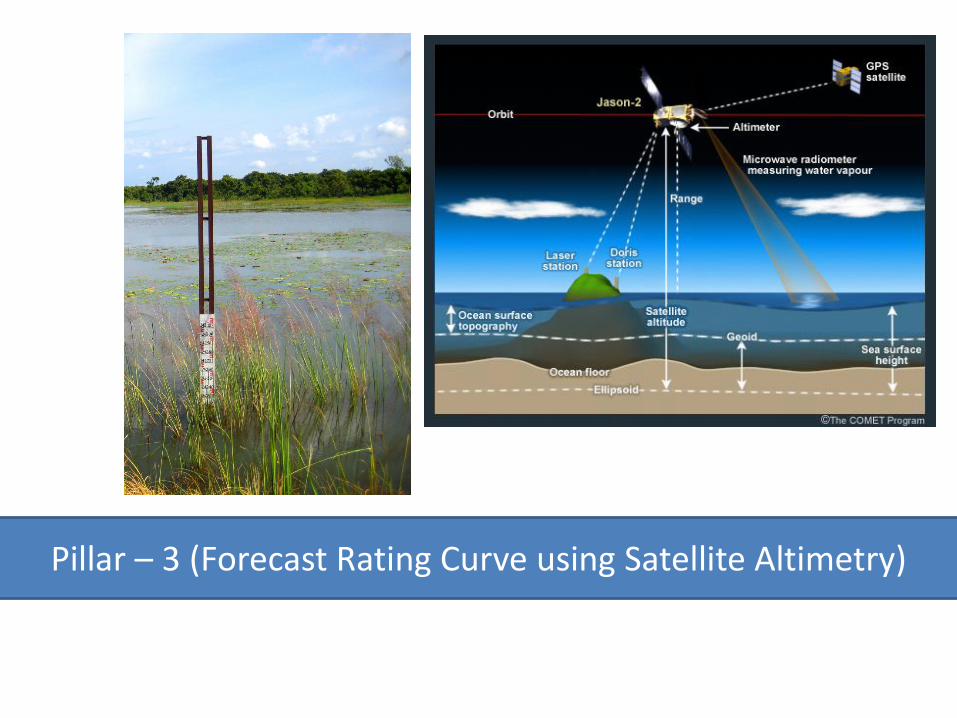
Pillar – 3 (Forecast Rating Curve using Satellite Altimetry)
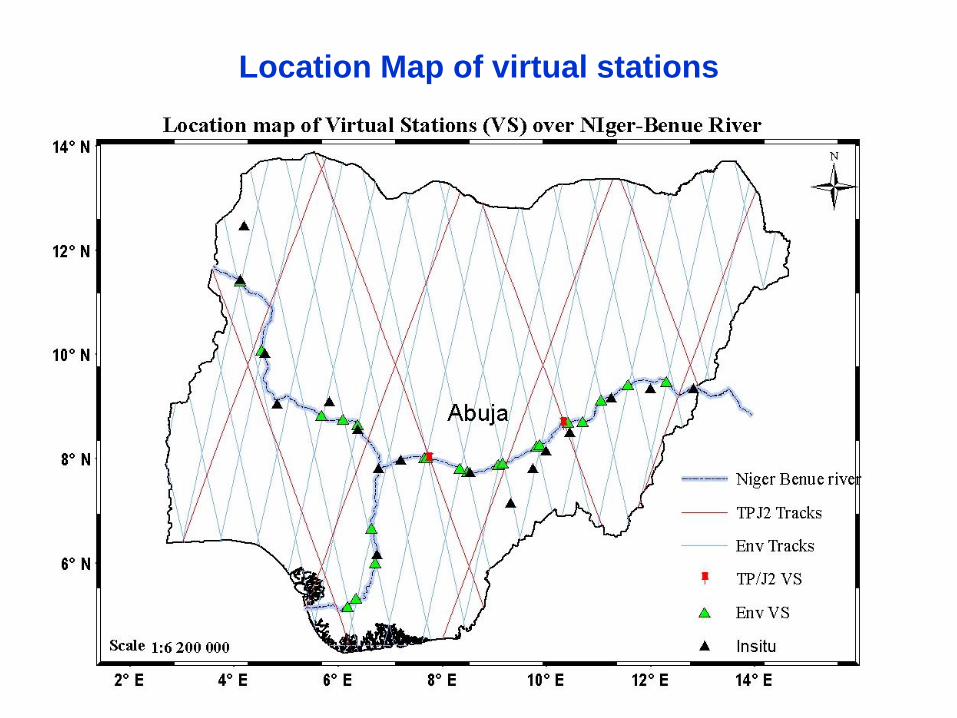
Location Map of virtual stations
www.iwmi.org
Water for a food-secure world
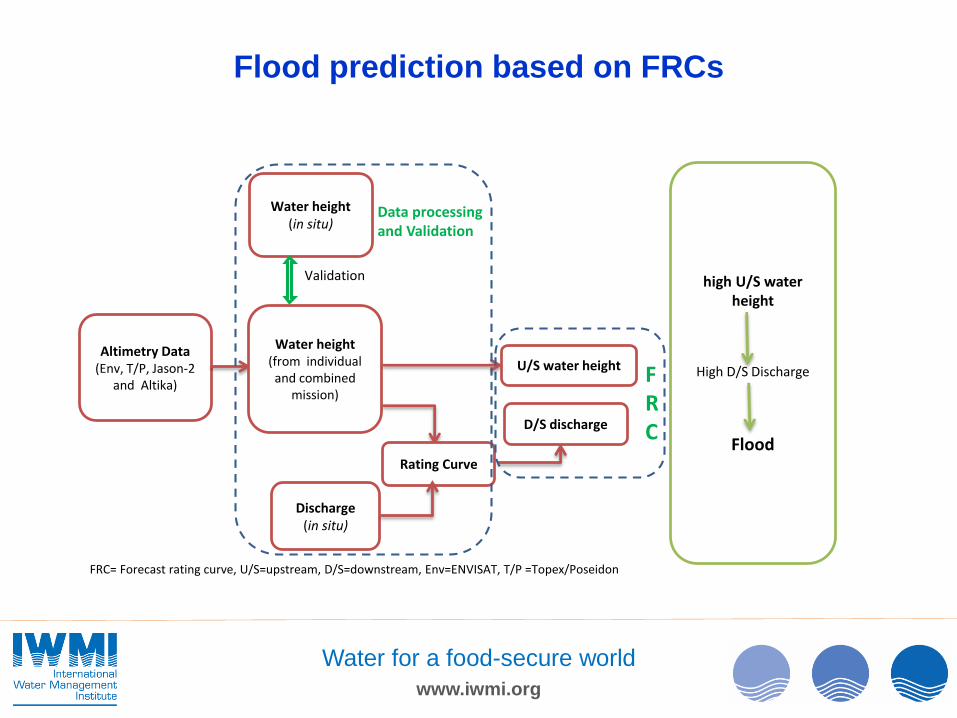
Flood prediction based on FRCs
Data processing and Validation
Altimetry Data (Env, T/P, Jason-2
and Altika)
Water height (from individual and combined
mission)
Water height (in situ)
Discharge(in situ)
Rating Curve
Validation
D/S discharge
U/S water height
FRC= Forecast rating curve, U/S=upstream, D/S=downstream, Env=ENVISAT, T/P =Topex/Poseidon
high U/S water height
High D/S Discharge
Flood
FRC
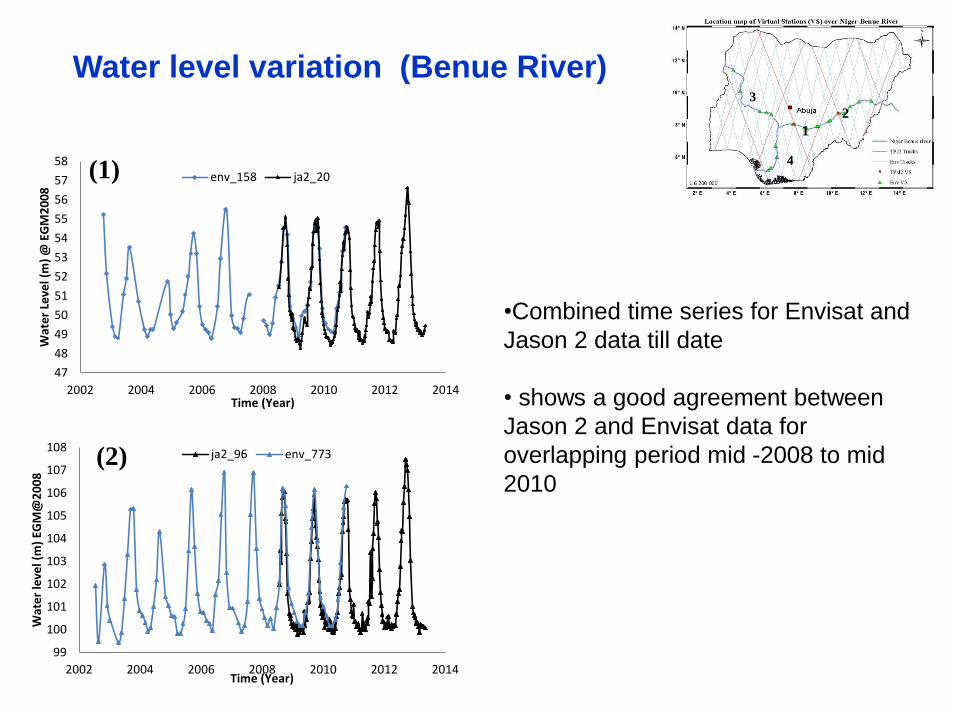
Water level variation (Benue River)
1
2
3
4
47
48
49
50
51
52
53
54
55
56
57
58
2002 2004 2006 2008 2010 2012 2014
Wat
er
Leve
l (m
) @
EG
M2
00
8
Time (Year)
env_158 ja2_20(1)
99
100
101
102
103
104
105
106
107
108
2002 2004 2006 2008 2010 2012 2014
Wat
er
leve
l (m
) EG
M@
20
08
Time (Year)
ja2_96 env_773(2)
•Combined time series for Envisat and
Jason 2 data till date
• shows a good agreement between
Jason 2 and Envisat data for
overlapping period mid -2008 to mid
2010
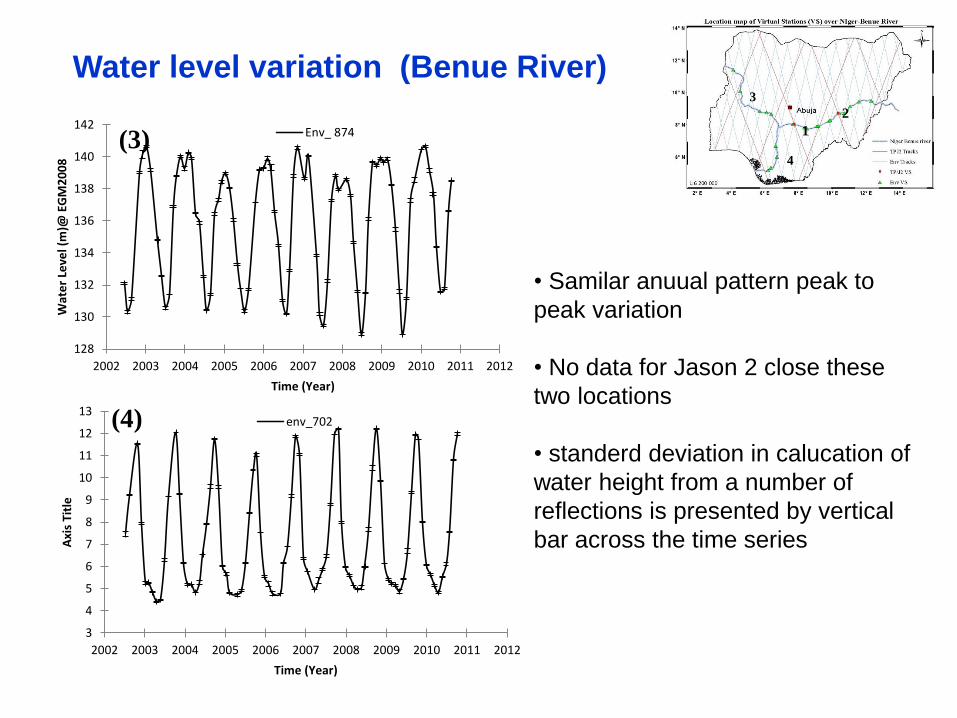
Water level variation (Benue River)
1
2
3
4
3
4
5
6
7
8
9
10
11
12
13
2002 2003 2004 2005 2006 2007 2008 2009 2010 2011 2012
Axi
s Ti
tle
Time (Year)
env_702(4)
128
130
132
134
136
138
140
142
2002 2003 2004 2005 2006 2007 2008 2009 2010 2011 2012
Wat
er
Leve
l (m
)@ E
GM
20
08
Time (Year)
Env_ 874(3)
• Samilar anuual pattern peak to
peak variation
• No data for Jason 2 close these
two locations
• standerd deviation in calucation of
water height from a number of
reflections is presented by vertical
bar across the time series
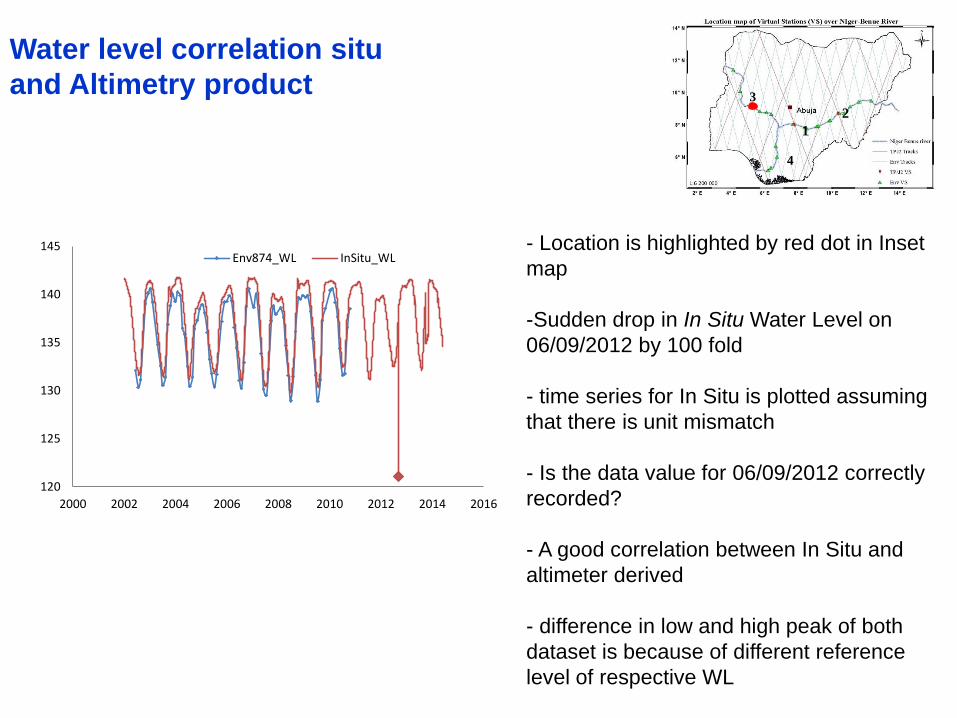
Water level correlation situ
and Altimetry product
1
2
3
4
120
125
130
135
140
145
2000 2002 2004 2006 2008 2010 2012 2014 2016
Env874_WL InSitu_WL- Location is highlighted by red dot in Inset
map
-Sudden drop in In Situ Water Level on
06/09/2012 by 100 fold
- time series for In Situ is plotted assuming
that there is unit mismatch
- Is the data value for 06/09/2012 correctly
recorded?
- A good correlation between In Situ and
altimeter derived
- difference in low and high peak of both
dataset is because of different reference
level of respective WL
www.iwmi.org
Water for a food-secure world
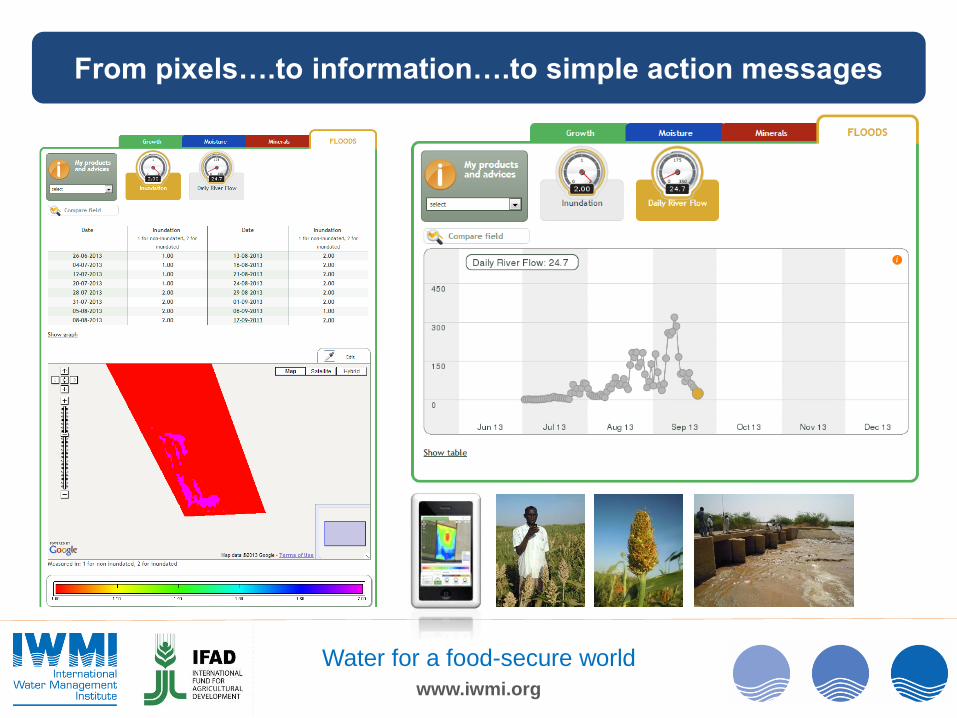
From pixels….to information….to simple action messages
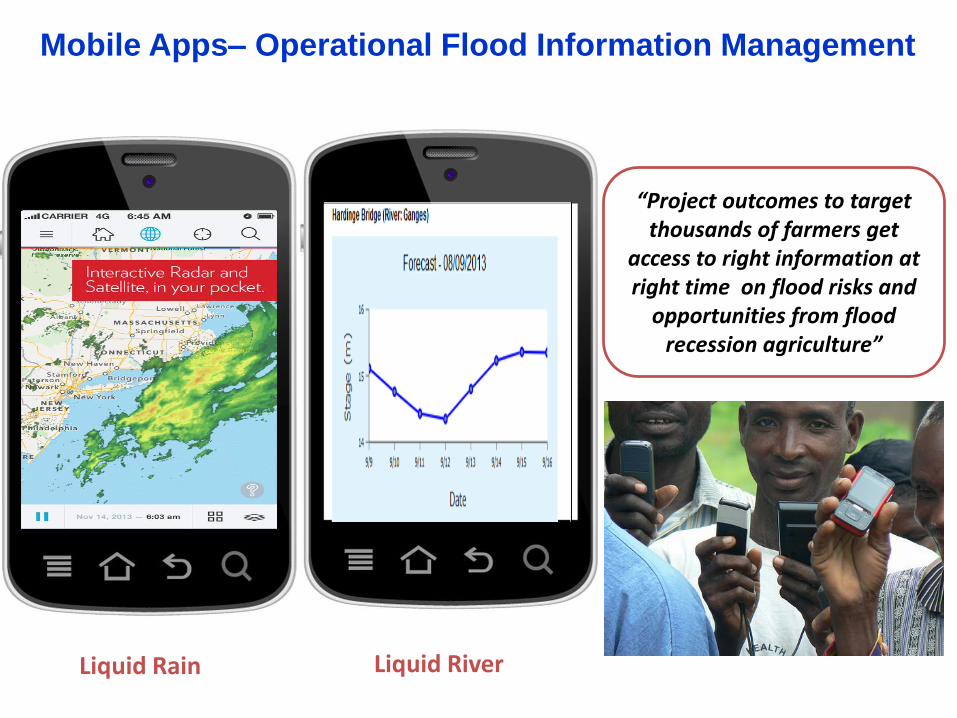
Mobile Apps– Operational Flood Information Management
Liquid Rain Liquid River
“Project outcomes to target thousands of farmers get
access to right information at right time on flood risks and
opportunities from flood recession agriculture”