Embed Size (px)
Citation preview

“Worth the Wait?”
Measuring the Impact of Extending Unemployment Benefits on Unemployment Duration during
the Great Recession
MPP Professional Paper
In Partial Fulfillment of the Master of Public Policy Degree Requirements
The Hubert H. Humphrey School of Public Affairs
The University of Minnesota
Alex Hevern
April 14, 2014
Signature below of Paper Supervisor certifies successful completion of oral presentation and
completion of final written version:
_______________________________ ____________________ ___________________
Deborah Levison, Professor Date, oral presentation Date, paper completion
Paper Supervisor
________________________________________ ___________________
Maria Hanratty, Professor Date

2
Executive Summary
During the Great Recession, millions of Americans found themselves out of work. The federal
government’s response to the large increase in unemployment was to extend the number of
weeks of unemployment insurance an individual may collect while unemployed. It was during
this time that the nation also saw a dramatic rise in average unemployment duration to record
levels. This paper seeks to determine whether the federal benefit increase was a contributing
factor to the sharp rise in unemployment duration. The analysis found that extending
unemployment benefits increased unemployment duration spells. When examining all duration
spells, each additional week of unemployment benefits resulted in a 0.08 week increase in
unemployment duration. There was evidence of a larger impact on the long-term unemployed.
For every additional week of unemployment benefits, unemployment duration increased by 0.16
weeks for those individuals who had been unemployed at least 26 weeks.

3
1 Introduction
The average unemployment duration in the United States rose dramatically during the Great
Recession, and remained at high levels after the recession had ended. The federal government
responded to this crisis by extending the number of weeks of unemployment insurance benefits
an unemployed individual is able to receive up to 99 weeks (Center on Budget and Policy
Priorities, 2013). In 2006 the average maximum weeks of UI benefits available was about 26
weeks, and highest average maximum was just over 91 weeks in 2011. The benefit extension
lasted throughout the Great Recession and just recently expired in December of 2013. This paper
investigates whether the federal benefit increase was a contributing factor to the rise in
unemployment duration. The maximum number of weeks of unemployment insurance an
individual is eligible to receive can affect how long that person stays unemployed. If they were
eligible for 99 weeks of benefits, they may have stayed unemployed longer than if they were
eligible for only 26 weeks of benefits. This is an argument of moral hazard which says that
having access to additional weeks of benefits can reduce the incentive to find work after
becoming unemployed. If moral hazard is a problem, individuals are choosing to stay
unemployed rather than return to work. The moral hazard argument will be explored in more
detail later in the paper.
This paper will examine recent levels of unemployment duration and estimate the impacts
different factors had on the increase in duration spells. The analysis relies on state differences in
unemployment benefit eligibility to determine the impact of additional weeks of benefits on
duration spells. The analysis found that extending unemployment benefits increased
unemployment duration spells. When examining all duration spells, each additional week of
4
unemployment benefits resulted in a 0.08 week increase in unemployment duration. There was
evidence of a larger impact on the long-term unemployed. For every additional week of
unemployment benefits, unemployment duration increased by 0.16 weeks for those individuals
who have been unemployed at least 26 weeks. Based on the increase in the average maximum
weeks of UI benefits (about 65 weeks) as a result of the benefit extension, duration spells
increased by about 5.26 weeks and increased duration spells for the long-term unemployed by
about 10.52 weeks.1
2 Background: Unemployment Insurance
Unemployment Insurance (UI) is a social insurance program that provides a safety net for
regularly employed workers who become unemployed through no fault of their own, and meet
certain eligibility requirements (DOL, 2013). Each state operates its own unemployment
insurance program and sets eligibility requirements, within federal guidelines. Unemployment
benefits are calculated based on a formula that factors in an individual’s wages from the previous
four quarters, up to a certain level. Standard benefits provide a maximum 26 weeks of benefits to
an eligible unemployed worker. To remain eligible for the program an individual must
demonstrate he or she is continuing to actively seek new employment.
2.1 Funding
The benefits individuals receive from the UI program are directly funded through state payroll
taxes paid by employers on behalf of their employees. Not all wages are taxed; the federal
government requires that all states tax at least the first $7,000 each employee earns annually.
Most states have a larger taxable wage base, ranging from the minimum $7,000 up to the high of
$41,300 in Washington (American Payroll Association, 2014). Even though employers directly
1 Prior to the Great Recession the average maximum amount of UI available was just under 26 weeks. The average
maximum peaked in 2011 at just over 91 weeks. Taking the difference resulted in an increase of about 65 weeks in
the maximum weeks of UI benefits.

5
pay the tax, economists generally assume that it is the employees who bear a greater burden of
the tax (CBO, 2012, p. 23). The idea is that the dollars spent on the tax would otherwise have
been used for employee wages. In effect, the cost of the UI program is passed on to currently
employed workers.
In addition to the state payroll tax, the federal government also levies a tax on employers to
support state UI programs through the Federal Unemployment Tax Act (FUTA) (Whittaker &
Isaacs, 2014). The tax is 0.6 percent on the first $7,000 each employee earns annually (Stone &
Chen, 2013). As a part of the Social Security Act of 1935, the federal government agreed to take
on a role to support UI. The act states that the federal government will appropriate monies:
“For the purpose of assisting the States in the administration of their unemployment
compensation laws…” (The Social Security Act of 1935)
Regarding payments made by the federal government to the states:
“The Board shall from time to time certify to the Secretary of the Treasury for payment to
each State which has an unemployment compensation law approved by the Board under
Title IX, such amounts as the Board determines to be necessary for the proper
administration of such law during the fiscal year in which such payment is to be made.”
(The Social Security Act of 1935)
The FUTA tax funds the administration of the state programs as well as the extended benefit
programs and provides a fund from which states can borrow in order to pay regular UI benefits if
necessary.
2.2 Positive outcomes

6
Unemployment Insurance is a very beneficial public program not only for unemployed
individuals but it also has positive effects for the larger economy as well (Elmendorf, 2011). For
individuals, UI reduces the stress of losing a job by providing financial support for an
unemployed worker and his or her family. There are many workers and their families who would
fall into poverty without benefits from UI. In 2010 alone 3.2 million people were kept out of
poverty by receiving unemployment benefits (Council of Economic Advisers, 2011). Losing a
job can take a large negative toll on a person’s life, beyond the financial impacts; there are
negative psychological effects as well as negative outcomes to a person’s health and well-being
(American Psychological Association, 2014). UI cannot solve all of these problems but it eases
the burden by providing financial assistance.
In addition to the individual level benefits, UI acts as an economic stabilizer during recessionary
times by providing money to unemployed individuals who have lost their primary source of
income. Most out of work individuals would normally make large cuts in their spending habits.
Receiving UI mitigates those cut backs and helps smooth consumer consumption during a period
of financial uncertainty. Gruber (1994) estimates that the average fall in consumption would be
three times higher without a UI program than the fall in consumption with UI present. Moody’s
Analytics found that every dollar provided in unemployment benefits resulted in $1.55 spent in
the economy, creating a multiplier effect (Green, 2013). The boost provided by the influx of
cash into the economy through UI benefits helps to increase consumer demand and UI has
consistently been one of the most effective policies at generating economic growth by providing
a boost to demand (Elmendorf, 2011).
2.3 Extending Benefits

7
During economic downturns, unemployment benefits can be extended through two different
programs, both of which generally only occur during times of high unemployment. Both
programs only extend the number of weeks of benefits. Neither program has any effect on the
dollar value of benefits an individual receives.
Extended Benefits (EB) is a joint federal-state program that started in 1970. State participation in
the program is voluntary and eligibility is determined by state level unemployment rates. Two
different scenarios trigger a state to provide EB. The first is if a state’s unemployment rate
reaches 6%, and the second is if the state’s unemployment rate both reaches 5% and is at least
20% higher than the state’s unemployment rate at any time during the last three years. If either
occurs, then UI benefits are extended to a maximum of either 13 or 20 weeks, depending on state
preferences and economic conditions (see Table 1). The Federal government covers half the cost
of the additional benefits provided through the FUTA tax, although during the Great Recession
the federal government covered all costs of EB. An eligible unemployed worker must first
exhaust the standard 26 weeks of benefits before he or she can receive extended benefits. Once
the unemployment rate falls below the trigger levels, benefits return to the standard 26 weeks
(Council of Economic Advisers, 2011).
UI benefits can also be extended during recessionary times through temporary, federally
administered programs. The most recent was the Emergency Unemployment Compensation
(EUC), passed on June 30, 2008 in response to the Great Recession. EUC does not have an
automatic trigger like the EB program does. Rather the federal government determines how the
EUC will be implemented. EUC is funded by the federal government’s payroll tax levy on

8
employers. EUC is comprised of separate tiers, each of which provides additional weeks of UI
based on state unemployment levels (see Tables 1 and 2). Individuals in states where EUC
benefits are in effect must first exhaust all regular and any extended state-sponsored benefits
before collecting benefits from EUC. Each tier of benefits within EUC must also be exhausted
before moving onto the next tier.
2.4 Current debate
When EUC expired in December 2013, about 1.3 million unemployed Americans saw their
benefits end and about 4.9 million unemployed individuals received fewer weeks of benefits.
Currently the federal government must decide whether to refund EUC and restore the extended
UI benefits. Refunding EUC has become a highly debated issue.
Supporters of refunding EUC want to first and foremost continue to provide financial support to
unemployed workers. They believe it is important to provide financial support to a vulnerable
population. If benefits were not extended and unemployed workers became discouraged and
dropped out of the labor force, the unemployment rate would decrease but it would be a false
indication of improvement in the labor market. Continuing EUC would provide additional
benefits to these discouraged workers and keep them from dropping out of the labor force. A
final argument for continuing the EUC program is the weak job market. With very few available
jobs, removing UI benefits would put many families in a very desperate financial position.
Those against further extending benefits point to the high costs of the program and the financial
pressure it will place on those still employed as well as employers if UI payroll taxes are raised.
With such a large number of individuals still unemployed (and not paying the UI payroll tax)
9
there are fewer workers bearing a greater share of the tax burden in order to fund the program.
States who need to borrow from the federal government in order to pay UI benefits are required
to repay the loan in two years. The federal government, in order to recoup loans, raised federal
UI payroll tax rates on states unable to repay in time, 18 states as of 2012 (Stone & Chen, 2013;
ADP, 2012). Californian employers have seen their federal payroll taxes increase as the state’s
UI trust fund has a deficit of $9 billion (State of California, 2013).
Another argument against EUC is that unemployment insurance, especially extending benefits,
can result in higher unemployment and longer unemployment duration. The following section
will expand on this argument as well as explore some other theories that have led to the dramatic
rise in unemployment duration.
3 Theory
Unemployment duration in the United States has been on the rise. As Figure 1 shows, since 1967
there has been a steady upward trend. That trend was broken during the Great Recession when
both mean and median duration levels spiked to their highest levels in the post-WWII era
(Valletta & Kuang, 2012).
Long-term unemployment, defined by the Bureau of Labor Statistics (BLS) as being unemployed
for more than 26 weeks, became a serious problem during the Great Recession and is still a
problem today. Figure 2 shows that the number of individuals who have been unemployed for
more than 26 weeks has become a greater portion of the total unemployed population and those
proportions have held steady post-recession. As of February 2014, nearly 3.9 million Americans
have been unemployed for more than 26 weeks, representing 37 percent of the total number of

10
unemployed individuals (BLS, 2014a). For more recent data on unemployment duration from the
BLS see Tables 3 and 4.
The negative ramifications of unemployment are only exacerbated as unemployment duration
increases. Although there are many causes of unemployment duration, the weak/inefficient labor
market, costs to employers, the income effect and moral hazard will be discussed here, with the
latter being the main focus of the paper.
3.1 Moral Hazard
Insurance, of any kind, changes the probability or size of perceived loss. Moral hazard is the idea
that individuals will take on greater risk when the cost of that risk is either reduced or borne
entirely by a separate party, often insurance providers. Otherwise, individuals would not engage
in “risky” behavior if they did not have access to insurance because the personal costs would be
too large. A key to moral hazard is that providers of insurance do not have perfect information on
individuals and cannot directly observe the effort the recipient expends to minimize his or her
own risk.
When an individual loses his or her job, in the absence of UI, the primary source of income for
that individual is gone. This increases financial risk, and if that individual does not receive UI, he
or she bears the entire cost of the risk. In this case, the unemployed individual will try to return
to work as quickly as he or she can in order to begin generating income again and lower his or
her financial risk.

11
The scenario changes for unemployed workers who receive UI. Unemployment benefits lower
the cost of losing a job, as the cost of the financial risk of becoming unemployed is no longer
solely paid by the unemployed individual. There is now less risk to becoming unemployed since
part of the cost of becoming unemployed is now paid by another party: an incentive is created for
unemployed workers to delay returning to work.
Moral hazard is often thought of as “taking advantage of the system” by collecting benefits when
a person could return to work. Therefore, it could be viewed by some individuals as getting paid
not to work. However, these views are not shared by all UI recipients. For many, UI is a safety
net that provides the time and security to search for the “right” job. Yet, they are not cognizant of
the possibility that by taking the time to find the “right” job they are possibly 'taking advantage'
of extended unemployment benefits.
In addition to reducing job search effort, the extension of UI can also provide an incentive to
continue searching for employment for individuals whose benefits were close to expiration.
Those individual, instead of running out of benefits and being forced to either return to work or
leave the labor force, can now continue to receive UI benefits and search for jobs. (Rothstein,
2011). However, Rothstein (2011) also points out that extending UI can also have the negative
effect of increasing unemployment by encouraging discouraged workers to re-enter the labor
force (and be counted among the unemployed) to collect benefits.
If the potential for moral hazard is inherent to any insurance program, then extending that
program can increase the potential for greater moral hazard. Moral hazard can become a

12
significant problem for social programs by making them inefficient through increased
participation by individuals who do not necessarily need the support. In the case of UI, moral
hazard not only raises the costs of the program through increasing benefits, but it can also create
an incentive for people to not work.
3.2 The Income Effect
While moral hazard from increases in UI benefits has traditionally been accepted by many
researchers as a cause for unemployment duration increases, it is not the only explanation. Chetty
(2005) argues that increases in unemployment duration are the result of both an income effect
and a substitution effect (moral hazard). Chetty presents his interpretation of the moral hazard
effect as follows: providing UI benefits lowers the price of leisure relative to the price of
working, which will result in an individual “consuming” more leisure time, because leisure is
now cheaper. The cost of not working (lost wages) is not as high because of the UI benefits, and
will result in individuals working less. Unemployed individuals are substituting work for more
leisure, resulting in moral hazard and increased unemployment duration.
Chetty argues that unemployment duration is impacted by an income effect, stemming from
consumer liquidity levels, in addition to a substitution effect (moral hazard). The impact of the
income effect, according to Chetty, can be much larger than the effect of moral hazard. In order
to consume goods individuals need to have cash on hand; if they are unemployed they have less
income and less liquidity. UI benefits provide unemployed individuals with income which allows
them to continue to raise their consumption while not working. Receiving UI benefits reduces
the urgency for unemployed individuals to find work because they are not facing a financial
crisis. When unemployed individuals are not motivated to quickly find work their unemployment

13
duration will increase. The effect of receiving income from UI, compared to not receiving it,
results in an increase of unemployment duration. Details on Chetty’s findings will be discussed
in section 4.
3.3 Weak Job Market
The largest cause of increases in unemployment duration is a weak job market (Valletta &
Kuang, 2012). During recessionary times, as the economy contracts, companies will hire fewer
workers due to slowdowns in consumer consumption which result in lower levels of production.
With fewer goods and services to produce, firms will reduce staff to save costs. Until
consumption starts to increase, firms have no reason to hire back workers. As the demand for
labor continues to remain low, there will be many individuals chasing few jobs. Low numbers of
job openings will result in unemployed workers remaining unemployed longer because there are
not enough available jobs. A weak job market differs from moral hazard because individuals do
not have a choice of whether to continue to collect UI or return to work. When there are no job
openings, people cannot get a job whether they are susceptible to moral hazard or not.
A contributing factor to both unemployment duration and the weaker job market is firms
increasing their production efficiency. Due to the length and severity of the recession firms
realized they couldn’t just “make do” like in previous recessions; structural changes were needed
in order to meet demand with reduced staff. As a result firms found ways to become more
efficient and produce more output with fewer resources, specifically labor (Thurm, 2012). Firm
efficiency improved so much that when the economy improved and consumer consumption rose,
firms found that, because of their improved efficiency, they did not need to hire back as many
workers. With firms hiring back fewer workers, many individuals remained unemployed.

14
3.4 Skills Mismatch/Inefficient Labor Market
During the Great Recession many individuals were competing for a small number of jobs. Many
of those out of work found themselves not only competing with each other but against the rising
qualification standards of employers. While unemployed, many individuals lost some of their job
skills (through lack of use) or their skills became obsolete as technology passed them by. The
longer individuals are unemployed the greater the problem of lost/obsolete skills becomes. There
were numerous accounts of firms that could not find qualified workers to meet their needs,
especially at positions that require higher skill levels (Sullivan, 2013).
During an economic boom there is low unemployment and a high number of job openings, while
during a recession there is high unemployment and few job openings. The Beveridge curve
depicts this relationship between the unemployment rate and the job vacancy rate. Typically,
when the labor market is operating normally, the relationship between unemployment and job
openings is stable and follows a specific curve (see Figure 3). During the Great Recession this
relationship began to diverge when the number of job openings began to increase much faster
than the unemployment rate decreased resulting in an outward shift of the Beveridge curve. The
break from the normal shape of the Beveridge curve indicates an inefficient labor market where
workers are not properly being matched up with open jobs.
The main culprit is believed to be a mismatch of skills. Hobijn and Sahin (2013) examine the
collapse of the housing market in the United States and found a disproportionately large number
of construction workers became unemployed. These construction workers may not have the job

15
skills required to get service sector jobs so they remain unemployed because there is no work for
them in the construction sector. Another study (Ghayad & Dickens, 2013) separated the
Beveridge curve into different levels of unemployment duration and found that the anomaly was
caused by individuals unemployed for 26 weeks or more. This would indicate that either the
long-term unemployed do lose skills over time or that employers might have less of a desire to
hire individuals who have been unemployed a long time due to a stigma on the long-term
unemployed.
3.5 Higher Employer Costs
Hagedorn et al (2013a) propose an alternate theory that examines unemployment duration and UI
from the perspective of the firm. The UI payroll tax is a cost to employers and any changes to UI
will affect the amount of tax employers must pay. EUC may increase labor costs, through the
payroll tax, to employers which lowers a firm’s profits. Since the payroll tax burden of the
employer is partially determined by the number of workers he or she employs, the presence of
EUC lowers the likelihood of a firm hiring additional workers as firms try to save money. As
explained above, fewer job openings results in individuals remaining unemployed longer.
There are several theories behind the rise in unemployment duration. In this paper I hope to
provide a formal argument that moral hazard, resulting from extending UI benefits, increases
unemployment duration. The issue of moral hazard is not only important in the case of UI, but a
potential issue for any public social program (and even some private insurance programs). If this
research finds a significant moral hazard problem in UI then all other public social programs
could potentially be at risk as well. Section 9 will provide some discussion on how policy makers
might view the issue of moral hazard as it relates to UI based on the findings of the paper.

16
4 Literature Review
There is a large body of literature that has examined changes in unemployment levels, duration
of unemployment, and the impacts of UI benefits. These studies try to explain changes in
unemployment and duration, and any role UI has had in those changes. Primarily the findings
have shown that UI increases both the level and duration of unemployment. This section will
examine some of the literature that has sought to further explain some of the nuances between
the interaction of UI and unemployment duration.
4.1 Increases in Job-Search Time
The main body of literature on unemployment duration has been driven by the early work of
Katz and Meyer (1990) and Card and Levine (2000). These authors used hazard models to
estimate the impact of UI benefit extensions on individuals’ job search time. A hazard model
uses a vector of factors to estimate how long an individual will remain in the UI program. The
theory states that individuals will delay their job search or extend their search if they are
receiving UI or UI benefits are extended.
The studies found that extending UI benefits resulted in longer job search times. They found that
UI creates a disincentive for individuals to look for a job until their benefits were about to be
exhausted and extending benefits only exacerbated this effect. The increase in job search time
results in an increase in unemployment duration as individuals are not quickly returning to work
because they are taking more time to find a job.

17
Although job search time was found to increase as UI benefits were extended, the authors found
the effect to be modest. Estimated duration increases ranged from about 1 to 2.5 weeks based on
a 13 week benefit increase. It should be noted that Katz and Meyer (1990) examined data from
recessionary times, as is the case with most of the literature, while Card and Levine (2000) were
able to take advantage of a natural experiment which was the result of a policy tradeoff in New
Jersey during the mid-1990s. A period of economic growth meant they did not have to control
for the effects of a weak labor market.2 Card and Levine found slightly smaller increases in
unemployment duration from UI benefit extensions compared with studies during recessionary
times. This could mean that despite previous authors’ best attempts to control for labor market
conditions, some of the effects of the recession might have spilled over into the effect of
extending UI, biasing the impact upwards.
These seminal papers used state administrative data to estimate their results. Administrative data
provides detailed information about all individuals who received UI. An important aspect of the
data is that the authors were able to track individuals over time, through receipt of UI payments,
so they knew when individuals left the program. This gave authors the complete duration spell of
an individual. A limitation of state administrative data is a smaller sample size. Also, only those
unemployed individuals in the UI program were examined; the studies could say nothing about
the unemployment duration of those who did not receive UI. To overcome this deficiency,
Rothstein (2011) used data from the CPS3 to estimate his job search hazard model. Rothstein
found that job search effort increased near the point of benefit exhaustion, so extending benefits
2 Separating out the effect of a poor labor market conditions is a common difficulty in the literature. 3 The CPS provides a larger sample as well as unemployed individuals who receive UI and those who do not.

18
would delay the increase in job search effort. Like previous studies, the effect of extending
benefits on unemployment duration was small.
4.2 Increased Unemployment Levels
While the impacts of UI are often examined on a ‘micro’ level by looking at individual
unemployment durations, some research has been done to examine the effects of UI on a ‘macro’
level by looking the national unemployment rate. Hagedorn et al (2013a), using equilibrium job
search models, estimated that extending UI benefits has a large, significant effect on the number
of people unemployed and that EUC accounted for the majority of the sustained high
unemployment during the Great Recession. The authors estimated that a 1% increase in the
length of UI benefits for one quarter increased the unemployment rate by 0.06 log points. The
average amount of UI available was 82.5 weeks for a period of 16 consecutive quarters in the
Great Recession. The authors’ estimates predict that during those 16 quarters the unemployment
rate rose from 5% to 8.6% because of the UI extension.
Farber and Valletta (2013), in addition to looking at impacts on duration4, estimate that the UI
benefit extension during the Great Recession resulted in the unemployment rate increasing by
about 0.4 percentage points. This is a small effect, relative to the high unemployment rate during
the Great Recession and relative to the estimate5 by Hagedorn et al (2013a).
Absar et al (2013) examined the impact of extending UI benefits during the Great Recession on
state unemployment rates. The authors estimated that for every additional week of extended UI
4 Farber and Valletta (2013) estimated a 7% increase in expected unemployment duration resulting from the UI
benefit extensions from 2009-2011. 5 The large difference in estimates could be due to the use of different datasets. Farber and Valletta (2013) used CPS
data while Hagedorn et al (2013a) used JOLTS and Local Area Unemployment Statistics (LAUS) from the BLS.

19
benefits in the prior quarter the state unemployment rate increased by about 0.025 percentage
points.
4.3 Differences across Demographics
Another question that has been asked by several researchers is whether UI benefit increases
affect different groups differently. Winter-Ebmer (2001) and Schmieder et al (2012) examined
the impacts of extending UI on different age groups in Europe. In Austria, a policy change
resulted in select areas of the country receiving UI benefit extensions. Using a difference-in-
difference technique, Winter-Ebmer (2001) found that extending benefits not only increased
unemployment duration but resulted in an increase in entry to unemployment as well. Older
workers were found to have especially high rates of entry into unemployment resulting from the
benefit extension. Unemployment rates rose high enough that the law increasing benefits was
abolished.
In Germany, unemployed persons are eligible for different lengths of UI benefits depending on
their age, with older workers being eligible for longer benefits compared with younger workers.
Schmieder et al (2012) used regression discontinuity to find that after individuals reach the
eligible age the benefit increase creates a small disincentive to work.
Aaronson et al (2010) used a Blinder-Oaxaca Decomposition to examine how much of the
increases in unemployment duration resulted from changing labor force demographics in the
United States. The authors found that demographic factors account for a significant portion of
the increase in unemployment duration over time, however those factors only account for a
portion of the dramatic increases seen in the most recent recession. The demographic factors

20
examined by Aaronson et al were age, gender, marital status, race, education, industry and
occupation. Although the authors found that most of the individual changes in these factors had
little effect, age was a notable exception. Younger workers (less than 24 years old) tend to have
shorter duration spells than older workers because they frequently enter and exit the labor force.
Over time there has been a large decrease in the young workers’ share of the labor force, and
with fewer shorter duration spells the average duration level will rise. Another notable cause of
increased unemployment duration is the rise of women’s duration spells, which account for
nearly all of the increase in duration from the mid-1980s to the mid-2000s. This is due to greater
numbers of women entering the labor force over that period.
4.4 Differences in Income
Following Chetty’s (2005) income effect theory, described in section 3.2, he compares duration
spells of groups with different incomes. He found that constrained households or those with low
liquid wealth are affected by increases in UI benefits more than unconstrained households or
those with higher liquid wealth. Using hazard models, Chetty’s estimates revealed two key
findings. First, that UI benefits cause large increases in unemployment duration for constrained
households or those with low liquidity. Second that UI benefits cause small substitution effects
(moral hazard) on unconstrained households or those with higher levels of liquidity. To separate
out the income and substitution effects Chetty took advantage of lump sum severance payments
to unemployed individuals. There were large impacts on duration from the severance payments
on the constrained households and no impact on unconstrained households. With severance
payments being a one-time event there is little opportunity to substitute one activity for another
but there is opportunity to change spending behavior; this represents the income effect. An
individual from a low-liquidity household can take a lump sum payment and spend it on basic

21
goods, which can lengthen unemployment duration because that individual’s basic needs are met
for a period of time. Chetty assumes that if the substitution effect or moral hazard for both
groups is of similar size then the income effect on constrained households is very large. This is a
major assumption that Chetty acknowledges needs further examination.
Exploring the same issue, Corsini (2013) provides evidence on the impact of extending UI
benefits on unemployment duration from Italy. Corsini also uses hazard models to find that
unemployment benefits do not increase the duration spells of wealthier households. Duration was
shown to largely decrease when the lost job was a major source of income to the household, but
providing UI benefits to offset the loss of that income will increase duration spells. Corsini
argues that this finding indicates that the amount of lost household consumption is a very
important factor in determining an unemployed individual’s search effort for work, and thus his
or her duration spell. Both Chetty and Corsini argue that constraints of liquidity have a major
effect on unemployment duration. Those who benefit the most from receiving UI are the ones
who are most impacted by it.
4.5 North Carolina Policy Experiment
An interesting policy development is taking place in North Carolina, where UI benefits were
reduced. Starting in July of last year a law was passed that made North Carolina residents
ineligible for federal UI benefit extensions, leaving unemployed individuals only able to receive
the standard benefits. Hagedorn et al (2013b) have examined preliminary employment data from
North Carolina since the policy change and found that unemployment has fallen and employment
levels have risen. The authors examined three different data sets and found similar results across
all three. They also compared the data of nearby states and found that employment growth in

22
North Carolina is increasing faster than neighboring states. Hagedorn et al (2013b) state that
these are only preliminary findings from a single state and readers should exercise caution when
drawing conclusions about the results of the initial data. As more data comes in it will be
interesting to see if the positive employment shifts continue and what effects this may have on
future unemployment policy.
The objective of this paper is to further expand on the literature by including data from after the
Great Recession up to 2013. The study will make use of the variation in EUC eligibility across
states. This paper takes into account the changes in EUC, both extension lengths and eligibility
changes, over the entire period the program was active (see Table 2).
5 Methodology
This section discusses the methods used to answer two questions about how much of the
dramatic increase in unemployment duration can be attributed to the extension of UI benefits
during the Great Recession. The first question examined is how much of the increase in
unemployment duration can be attributed to the extension of UI benefits? I hypothesize that a
small but statistically significant portion of the increase in unemployment duration can be
attributed to the extension of UI benefits.
The ideal method of finding the true impact that extending benefits had on unemployment
duration is to take the difference of an individual’s actual outcome from the individual’s
counterfactual outcome. An unemployed individual’s actual outcome is the duration spell he or
she experienced while receiving extended UI. The counterfactual outcome is that same
individual’s duration spell if he or she had not received extended UI. This ideal scenario is not

23
possible because a person cannot be observed as being in two different states of the world at
once (cannot both receive extended UI and not receive extended UI over the same time period).
Instead it would be necessary to find a “comparison” group of unemployed individuals who
receive only regular UI benefits (26 weeks) whose unemployment durations can be compared to
the durations of the “treatment” group of unemployed individuals who receive the extended UI
benefits over the same period. The difference in unemployment durations of the two groups is
the impact of extending UI benefits.
Unfortunately, the benefit extension was a nation-wide program that affected all unemployed
individuals so data for the above “comparison” group does not exist. Instead the analysis will
take advantage of the different eligibility requirements across the separate tiers of EUC that
create variation across states in the maximum number of weeks of UI individuals can receive
(see Table 2). Eligibility for certain tiers of EUC is dependent on a state reaching certain
unemployment thresholds (see Table 1). Because of the variation across individual state
unemployment rates (see Figure 4); individuals from one state could be eligible for more weeks
of UI than individuals from another state. Differences in state economies result in large
variations in unemployment rates between states that would affect the level of EUC benefits
residents are eligible for. Residents in states with higher, sustained unemployment rates when
EUC was in effect would have been eligible for more weeks of UI for a longer period of time
compared with states with lower unemployment rates over that same time period. This variation
across states in the maximum number of weeks of UI allows for the estimation of the impact of
UI benefit extension on unemployment duration (see Table 1).

24
5.1 OLS Regression
To determine how much of the increase in unemployment duration can be attributed to the UI
benefit extension the analysis will begin with a basic OLS regression model. Panel CPS data6
will be used to examine how individual unemployment durations vary with the weeks of UI
eligibility between states going back to 2003.7 To estimate the difference, a standard OLS
regression model will regress the maximum number of weeks of UI an individual is eligible for
on unemployment duration, controlling for individual characteristics as well as labor market
conditions. The model will be specified as follows:
(1)
where UD is the unemployment duration, measured in number of weeks, and X is a vector of
individual characteristics such as age, gender and education (see Table 5 for full list of controls).
MaxUI is the maximum number of weeks of UI an individual is eligible to receive, and L
represents economic factors that would influence unemployment duration including
unemployment rates.
The key variable of interest, MaxUI, estimates how much an individual’s unemployment
duration is impacted by the maximum weeks of UI that person is eligible to receive. The
coefficient of MaxUI can be interpreted as the 'the effect each additional week of maximum UI
duration on unemployment duration' while holding the effects of other factors constant. As the
maximum duration of UI increases it is expected that unemployment duration will increase as
6 The CPS is not a true panel dataset; see section 7 for further discussion. 7 Data on EUC and EB active triggers for states could only be collected going back to 2003. As a result the
regression results will only have observations from 2003-2013.

25
well. The addition of other economic and individual characteristics in the model helps control for
the impact of the recession to isolate the effect of MaxUI.
The impacts of the controls such as age, gender, race, education and income, on duration spells
could also be of interest. Aaronson et al (2010) estimated that demographics account for a large
portion of unemployment duration; however only a portion of the recent increase in duration can
be attributed to changing demographic factors. Adding these controls is important to avoid
omitted variable bias since previous research has shown that demographics of the workforce play
a big role in determining unemployment duration.
Controlling for the labor market (through national and state unemployment rates as well as the
number of national job openings) is critical as previous research has shown that labor market
conditions are one of the major factors that determine unemployment and duration levels.
Valletta and Kuang (2012) estimated that for a 12 month period ending in August 2011 nearly
half (about 7.5 weeks) of the 15 week increase in unemployment duration during that time is the
result of the persistence of employment losses from the recession.
One limitation of using a basic OLS model is the inability to control for potential underlying
trends affecting the data. These trends could be either occurring over time (a systemic or cyclical
change in the labor market) or resulting from differences across states outside of the differences
in UI eligibility. By not properly accounting for these trends the results could be biased from
omitting important and relevant variables. Adding fixed effects for state and year to the model
will help to control for those trends.
26
5.2 Fixed Effects
The effect of the benefit extension would not have the same impact over time or across different
states. So it does not make sense to estimate a single, one time national impact of the benefit
increase. Using both state and year fixed effects will control for these trends and strengthen the
explanatory power of equation (1). The inclusion of the fixed effects also removes omitted
variable bias from the estimates.
Important factors to consider are variables that do not change over time. This is best seen in
differences across states. State economies can vary widely; a dominant sector in one may have
little influence in another, leading to differences in workforces and unemployment patterns.
There are differences in UI eligibility requirements between states that might not be completely
controlled for by the MaxUI variable. There are also differences in other social programs that can
have an effect on how long individuals remain unemployed, or if they participate in UI. States
can vary greatly so it will be important to account for those differences by adding state fixed
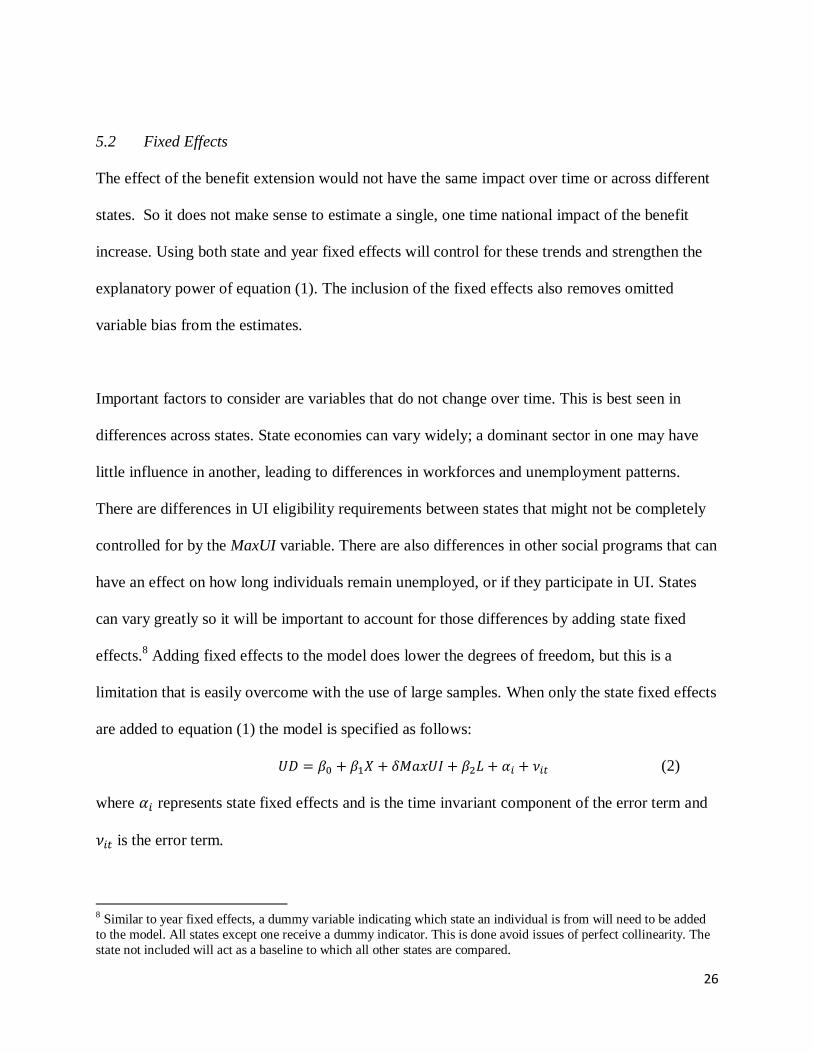
effects.8 Adding fixed effects to the model does lower the degrees of freedom, but this is a
limitation that is easily overcome with the use of large samples. When only the state fixed effects
are added to equation (1) the model is specified as follows:
(2)
where represents state fixed effects and is the time invariant component of the error term and
is the error term.
8 Similar to year fixed effects, a dummy variable indicating which state an individual is from will need to be added
to the model. All states except one receive a dummy indicator. This is done avoid issues of perfect collinearity. The
state not included will act as a baseline to which all other states are compared.

27
Unemployment duration might follow a particular pattern over time or a specific year(s) might
have an effect on unemployment duration relative to other years. Year fixed effects will capture
the variation in unemployment duration year over year.9 It would be important to control for
individual years because there might be events happening across multiple states in particular
years that are not being picked up by either the controls or state fixed effects. When year fixed
effects are added to equation (2) the model is specified as follows:
(3)
where represents the year fixed effects and is the common observed time trend and is the
error term containing time varying unobserved characteristics.
MaxUI is the key variable of interest and will estimate how much an individual’s unemployment
duration is impacted by the number of weeks of UI that person is eligible to receive. As the
maximum number of weeks of UI increases it is expected that unemployment duration will
increase as well. The addition of other economic and individual characteristics will help control
for the impact of the recession as well as any individual level variation, in order to isolate the
effect of MaxUI.
Fixed effects also allow for comparisons between different states or across different years. The
EUC benefit extension might have affected the unemployment duration differently depending on
the state; one state might have seen a greater rise in unemployment duration resulting from the
benefit increase compared to another state. Impacts could also be compared across years to see if
9 To add year fixed effects a dummy variable which stands for an indicator for each year (except one) can be added
to the model. One year (generally the first in the sample) is not added to avoid perfect collinearity in the model and
act as the baseline to which all other years are compared.

28
the impact of the benefit increase on unemployment duration was greater in one particular year
over another.
The second question asks whether extensions in UI benefits have a larger impact on the long-
term unemployed. I hypothesize that the impact of extending benefits has a significant impact on
the long-term unemployed and that the effect would be greater compared to the entire
unemployed population.
To answer this question the analysis will employ the same models described above but instead of
using the duration spells of all unemployed individuals the sample will be restricted to only those
who have durations greater than 26 weeks. The controls in the models remain the same but the
dependent variable now becomes long-term unemployment duration which is measured in weeks
like the previous models but has a smaller range (see Table 5 for summary statistics). The key
variable of interest, MaxUI, will now estimate how much the duration spell an individual who is
long-term unemployed will be impacted by extending UI benefits. It is expected that MaxUI will
be positive and larger in magnitude than the results of the previous models.
6 Data
All of the data used in this paper comes from the Bureau of Labor Statistics (BLS). A part of the
US Department of Labor, the BLS works to provide timely, accurate information on the United
States economy and labor market activity.
The primary dataset is a sample from the Current Population Survey (CPS), a monthly survey of
60,000 households (King et al, 2010). The survey provides comprehensive information on the

29
employment and unemployment experience of the United States population (BLS, 2014b). The
purpose of the CPS is to gain a sense of the nation’s working experience as well as information
about income. Demographic and economic characteristics about each individual and their
household are also collected.
The specific sample utilized for analysis from the CPS is the Annual Social and Economic
Supplement (ASEC). This supplement survey is conducted every March and expands on the
regular CPS by asking more detailed questions on social and economic characteristics and the
work experience of each individual. This version of the CPS is used because of the additional
unemployment information available including: how many continuous weeks that individual has
been unemployed. For this research, data was collected from the ASEC conducted every March
since 1977. Only individuals who are classified as either unemployed or not in the labor force
were included in the sample.
The three models described above will be each estimated twice using two different dependent
variables, both of which measure unemployment duration. The first dependent variable includes
duration spells from the entire sample and the second dependent variable includes only those
duration spells of individuals who are long-term unemployed. This is done to see if extending
benefits has an impact on the long-term unemployed that is different from the entire unemployed
population.

30
The full duration spell sample includes only individuals who are unemployed or out of the labor
force at the time of their survey response, from 2003-2013. All unemployment durations are
included in the full duration sample to capture the impact on the total unemployed population.
The long-term duration sample also includes only individuals who are unemployed or out of the
labor force and have duration spells are greater than 26 weeks.
To estimate the impact of UI benefit increases on duration, a variable was created that shows the
maximum number of weeks of UI benefits an individual is eligible to receive, dependent on the
unemployment rate of that individual’s state. This variable, MaxUI, includes all possible benefits
from each program: standard UI benefits (26 weeks), EB (max of 20 weeks), and EUC (max 53
weeks).
MaxUI accounts for the changes in EUC (see Table 2) as well as the changing state eligibility for
either program based on unemployment rates (see Figure 4). Information on when EB and EUC
were triggered for each state going back to 2003 was collected from the BLS (see Table 1). The
variation in MaxUI across states can be seen in Figure 5.
In order to accurately analyze the effect of moral hazard on unemployment duration other factors
that have an impact on duration will have to be controlled for. The following are several
variables that were collected to control for other impacts. These controls are macro variables,
rather than at the individual micro level of the CPS, and are matched to individual records in the
CPS data by year and state.

31
The strength or weakness of the labor market is one of the biggest factors in determining
unemployment duration (Aaronson et al 2010; Valletta and Kuang 2012). In order to isolate the
impact of extending UI benefits on duration spells, this paper will utilize three measures to
control for the condition of the nation’s labor market. The first will be the national
unemployment rate, which is estimated on a monthly basis by the BLS.
Individual state unemployment rates are collected as a part of Local Area Unemployment
Statistics (LAUS), a joint effort by states and the federal government to estimate employment
levels for each state as well as metropolitan areas, counties and cities with populations larger
than 25,000. Monthly unemployment rates were collected for each state (and the District of
Columbia) going back to 1977. Economies can vary widely from state to state, so having
individual state unemployment information will provide a much clearer picture of the condition
of the labor market than just national level data.
In 2000, the Job Openings and Labor Turnover Survey (JOLTS) was created by the BLS to
measure national labor demand. Approximately 16,000 businesses, across all nonagricultural
industries and in both the private and public sectors, are surveyed and data is released each
month. The data collected from the JOLTS survey can be a good measure of the tightness of the
national labor market, and it provides a more accurate picture of the national labor landscape
from the demand (employer’s) side. Multiple measures are calculated from the JOLTS data (see
Table 6) but this analysis will use the number of job openings in the nation. Unfortunately
JOLTS is not separated out by state, so this variable can only proxy as a control for the national
labor market and will not be able to pick up any variation between states. The job openings value

32
can be used alongside the unemployment rate, to provide a more complete picture of the supply
side of the nation’s labor market.
7 Limitations
One major limitation of using the CPS dataset is the inability to track the same individuals over
time because of partial participant turnover each month (Census Bureau, 2013). Since
individuals cannot be tracked the full length of an individuals’ unemployment duration spell
cannot be measured, since the survey only captures the length of the spell at one point in time.
The CPS will only provide data on unemployment duration if the individual is in the midst of a
spell; there is no information on when the spell ended or how long it continued after the survey.
Not knowing the full length of the spell will result in some downward bias in the measurement of
unemployment duration, although the size of the bias is unclear. The full duration models assume
that extending benefits might influence the length of an unemployment spell for all durations.
The model would capture the impact of extending benefits along the entire distribution of spells,
but with incomplete duration data the estimated impact would not be accurate.
There is further bias introduced to unemployment duration because the survey is skewed toward
longer spells of duration; this effect was examined for poverty spells by Bane and Ellwood
(1983). For a survey taken at a particular point in time individuals who have longer spells of
unemployment duration are more likely to appear in the survey compared with individuals with
shorter spells. This results in some upward bias, although the size of the bias is also unclear. The
models with long-term duration as the dependent variable would avoid some of this bias because
the sample examined only includes those with longer spells. Upward bias would not be as large
for the long-term duration models because there are fewer shorter spells being estimated.

33
Another limitation is the lack of data on participation history in the UI program, whether the
respondent is currently receiving benefits or if they have previously exhausted all benefits
available to them. To account for this an indicator if an individual has reported receiving income
from UI in the last year will be used as a proxy for participation in the UI program.
A final limitation comes with the difficulty in separating out the effect of the Great Recession
from the effect of the benefit increase, especially since the downturn in the economy resulted in
the EUC extension. Instead of simply using an indicator that was equal to one when the benefit
increase occurred, which would too closely align with the recession, this analysis takes
advantage of the variation across states in how many weeks of the extension were available to
the unemployed. Unfortunately the variation across states is partially due to changes in the
economy, so there will be some influence from the poor labor market within MaxUI. The effect
of the Great Recession could not be fully controlled for so the following results may not reveal
the true impact of the benefit increase.
8 Results
This section reports the results of the models discussed above. The models using full duration
spells are presented in Table 7 and the results of the long-term unemployed models are presented
in Table 8.
8.1 OLS Model Results for All Duration Spells
The results in column one of Table 7 show that MaxUI is statistically significant and positive;
indicating that as the maximum UI eligibility duration goes up, on average a person’s spell of
unemployment duration also increases, holding all other factors constant. On average, for each

34
additional week of extended UI benefits, an individual’s unemployment duration increased by
0.16 weeks, holding all other factors constant. Based on the increase in the average maximum
weeks of UI benefits (about 65 weeks) as a result of the benefit extension, duration spells
increased by about 10.52 weeks.
Both the state and national unemployment rates have significant impacts on duration of
unemployment spells, which was expected with these variables acting as a proxy for the
condition of the labor market. One of the largest impacts on unemployment duration was race.
The race indicators were all statistically significant and had relatively large impacts compared to
MaxUI10
. On average a black individual’s unemployment duration is 5.5 weeks longer compared
to the unemployment duration of a white individual, holding all other factors constant; this was
the largest effect from a particular race on duration spells. Females, on average, had shorter
unemployment durations than men by about 1.5 weeks, a statistically significant difference.
Total family income had a negative impact on duration spells, although it is a small impact. For
every one thousand dollars a family earns, the unemployed family member’s duration spell
decreases by 0.05 weeks, holding other factors constant. The direction of this effect makes sense:
as family members earn more income they would be able to provide for an unemployed family
member such that he or she would not need to receive UI.
8.11 OLS Model Results for Long-term Unemployed
The results in column one of Table 8 reveal a positive, significant estimate for MaxUI on the
long-term unemployed, indicating that as the maximum UI eligibility duration goes up, a long-
term unemployed person’s spell of unemployment duration also increases. On average, for each
additional week of extended UI benefits, a long-term unemployed individual’s duration spell
10
White is the reference category for race.
35
increased by 0.17 weeks, holding all other factors constant. Based on the increase in the average
maximum weeks of UI benefits (about 65 weeks) as a result of the benefit extension, duration
spells of the long-term unemployed increased by about 11.17 weeks. As expected the impact of
MaxUI on the long-term unemployed is slightly greater than the impact on all duration spells
from the OLS model in column one of Table 7.
When examining the controls for the long-term unemployed model, there are some notable
differences from the results of the full duration model. The impact of state unemployment rates
on long-term duration spells decreased by more than half while the effect of the national
unemployment rate became insignificant. The effect of being black compared to white decreased
notably while remaining significant. Hawaiian/Pacific Islander was the only race indicator that
was insignificant. Both indicators for education, having at least a high school diploma and
having at least a Bachelor’s degree as well as the indicator for being married were insignificant
while they were significant in the full duration model. These factors might be insignificant now
because they might not be as predictive of duration spells for the long-term unemployed, who are
a more disadvantaged group. T here might be alternative factors that determine the duration of
the long-term unemployed that are not controlled for in the model, such as lost skills, mental
illness, functional impairments, etc.
8.2 State Fixed Effects Model Results for All Duration Spells
After adding state fixed effects, the results in column two of Table 7 show that MaxUI is
statistically significant and positive. On average, for each additional week of extended UI
benefits, an individual’s unemployment duration increases by 0.17 weeks, holding all other
factors constant. Based on the increase in the average maximum weeks of UI benefits (about 65

36
weeks) as a result of the benefit extension, duration spells increased by about 11.17 weeks. This
effect is slightly larger than the OLS result.
The results from adding state fixed effects are similar to the OLS model results for all duration
spells. One difference was national unemployment rate, which became insignificant when state
fixed effects were added. The insignificant effect could be the result of national job openings
capturing the effect of the national labor market or state level labor markets have more influence
on duration spells compared to the national level. Another difference was the drop in magnitude
of the effect of living in a metro area. In the OLS model, residing in a metro area increased
duration spells by 1.36 weeks over residing in a rural area, but when state fixed effects were
added that impact fell to 0.65 weeks. This effect could be the result of industries that were hit
especially hard during the recession being primarily located in metropolitan areas. The indicator
for being married slightly decreased from the OLS full duration model. The duration spell of an
individual who is married is, on average, 1.4 weeks fewer than the duration spell of a single
individual, holding other factors constant. Unemployed individuals with spouses, who
presumably are employed, could be supported by their spouse.
8.21 State Fixed Effects Model Results for Long-term Unemployed
After adding state fixed effects, the results in column two of Table 8 reveal a positive, significant
estimate for MaxUI on the long-term unemployed. On average, for each additional week of
extended UI benefits, a long-term unemployed individual’s duration spell increases by 0.18
weeks, holding all other factors constant. Based on the increase in the average maximum weeks
of UI benefits (about 65 weeks) as a result of the benefit extension, duration spells of the long-
37
term unemployed increased by about 11.83 weeks. As expected the impact on the long-term
unemployed is greater than, but only slightly, the impact on all durations from the OLS model in
column two of Table 7.
The state fixed effects long-term duration model produced very similar results for the controls at
the OLS long-term duration model. The effect of age, which decreased only slightly, was
positive and significant. Age’s impact on duration spells is larger than the impact of the benefit
increase. For each additional year of age, there is an increase in unemployment duration of .25
weeks, holding other factors constant. This result supports previous findings that older
individuals have longer unemployment duration spells compared to younger workers (Aaronson
et al, 2010).
8.3 State and Year Fixed Effects Model Results for All Duration Spells
When including both state and year fixed effects, the results in column three of Table 7 reveal
that MaxUI is statistically significant and positive. On average, for each additional week of
extended UI benefits, an individual’s unemployment duration increases by 0.08 weeks, holding
all other factors constant. Based on the increase in the average maximum weeks of UI benefits
(about 65 weeks) as a result of the benefit extension, duration spells increased by about 5.26
weeks. This effect is much smaller than the OLS and state fixed effects models, less than half of
the other estimates impacts. A smaller effect after controlling for variation across years could
indicate the benefit extension had greater impact in some years more than others. Those
differences are no longer being captured in MaxUI, rather being captured by the year fixed
effects. Year fixed effects can also account for some of the variation in MaxUI over time.

38
For the most part the impacts of the controls after adding both state and year fixed effects are
smaller compared to the model with only state fixed effects, when examining full duration spells.
One relatively sizeable increase was on state unemployment rates. For every percentage point
increase in a state’s unemployment rate there is an increase of 1.3 weeks in an individual’s
unemployment duration, holding other factors constant. The effect of living in a metro area also
increased, while the effect of being female became a larger negative impact, meaning that
women have shorter duration spells compared to men.
8.31 State and Year Fixed Effects Model Results for Long-term Unemployed
The results in column three of Table 8, after adding both state and year fixed effects, reveal a
positive, significant estimate for MaxUI on the long-term unemployed. On average, for each
additional week of extended UI benefits, a long-term unemployed individual’s duration spell
increases by 0.16 weeks, holding all other factors constant. Based on the increase in the average
maximum weeks of UI benefits (about 65 weeks) as a result of the benefit extension, duration
spells of the long-term unemployed increased by about 10.52 weeks. This result is noticeably
larger than the estimate for all durations of 0.08, when state and year fixed effects are added
which was expected. The result was hypothesized to be larger for the long-term unemployed
because the long-term unemployed are more susceptible to changes in UI benefits compared to
the entire unemployed population.
The impacts of the controls for the state and year fixed effects long-term duration model are very
similar to the estimates from the state fixed effects long-term model. National job openings, total
family income, age, race and gender remain significant indicators of unemployment duration.
The only race indicator that is not significant is Hawaiian/Pacific Islander. It is interesting to note
that while black had the largest impact in all of the full duration models; it had one of the smaller

39
impacts among the race indicators for the long-term unemployed. Instead, American Indian had
the largest effect on the duration spells of the long-term unemployed with spells lasting about 3.3
weeks longer compared to white long-term unemployed individuals.
The fixed effects model takes a more rigorous approach than the basic OLS model by separating
out the effects of the UI benefit extension across years and states. The estimates of the fixed
effects model are preferred because of the ability to control for variation across years and states.
9 Conclusion
The analysis estimated a statistically significant impact of extending UI benefits on
unemployment duration. This finding indicates that at least a portion of the dramatic increase in
unemployment duration around the time of the Great Recession can be attributed to the federal
extension of unemployment insurance benefits during that period. If the maximum duration of UI
benefits increased by one week, an average individual’s unemployment duration increased by
0.08 weeks, holding all other factors constant. Based on the increase in the average maximum
weeks of UI benefits (about 65 weeks) as a result of the benefit extension, duration spells
increased by about 5.26 weeks. In addition, the analysis also found that extending UI benefits has
a greater impact on the long-term unemployed relative to the entire unemployed population. If
the maximum duration of UI benefits increased by one week an average, long-term unemployed
individual’s duration spell increased by 0.16 weeks, holding all other factors constant. Based on
the increase in the average maximum weeks of UI benefits (about 65 weeks) as a result of the
benefit extension, duration spells of the long-term unemployed increased by about 10.52 weeks.

40
A significant finding indicates that extending UI benefits might result in a moral hazard effect
and lead to increased unemployment duration spells. Policy makers need to take care when
addressing issues of moral hazard in unemployment insurance because there can be positive
outcomes to longer duration spells as well as negative outcomes discussed earlier. Individuals
can take advantage of extended UI benefits to take additional time to find a good, higher-paying
job. This not only benefits the individual but having more people in stable, well-compensated
occupations has benefits for the economy.
The much larger impact on the long-term unemployed, twice as large as the impact on the entire
unemployed population, raises concerns. For those already with long spells of unemployment,
extending UI benefits increases unemployment duration at a greater rate relative to the entire
unemployed population. This suggests a more targeted approach is needed to assist the long-term
unemployed in returning to work.
There are some limitations in this research that could be influencing the findings of the analysis.
One is an issue of selection with the long-term unemployed as they are more likely to “select” to
remain unemployed when there are extended UI benefits available compared to short-term
unemployed. The issue of selection is troublesome because the individuals who select to remain
long-term unemployed might have some fundamental differences from those who choose to drop
out of the labor force or who end up finding a job. The potential selection issue is not examined
in this paper and those potential differences between groups are not explored. The data issues
discussed earlier are another limitation that affects the estimates. The structure and format of the
CPS and the lack of complete data on the same individuals over time lower the ability to estimate

41
the true impact of extending benefits on unemployment duration. Another issue is the heavy
reliance on state variation in EUC to estimate the impact of benefit extensions on duration. The
variation is the result of differences in state economic conditions the effects of which might not
be completely captured by the MaxUI variable. Additionally, the effect of the Great Recession
could not be completely controlled for because MaxUI incorporates differences in state economic
conditions.
9.1 Policy Implications
Since EUC’s expiration, policy makers have been debating whether to refund the program.
Recently the U.S. Senate passed a bill that would renew EUC through May of this year and
provide retroactive payments to individuals whose benefits expired at the end of last year (Kane,
2014). The bill would require greater job training for the long-term unemployed in order to
continue to receive benefits and prevent unemployed individuals whose income in the previous
year was greater than $1 million from receiving UI benefits. The critics of extending benefits,
which would affect millions of Americans, call attention not only to the high cost of the program,
expected to be about $10 billion (Kane, 2014), but cite previous literature that found extending
benefits created disincentives to work and increased unemployment duration.
The findings of this paper indicate that at least a portion of the dramatic increase in
unemployment duration around the time of the Great Recession can be attributed to the federal
extension of unemployment insurance benefits during that time. The significant findings indicate
a moral hazard problem and extending benefits creates disincentives to work. These findings
could result in policy makers altering the unemployment insurance program, like the proposed
changes above, in order to guard against moral hazard and prevent abuses of the program.

42
Despite the significant effect of extending UI benefits, the increase in unemployment duration is
not necessarily all due to moral hazard. Some of the Great Recession’s impact is still present in
the MaxUI variable, possibly inflating the size of the extension’s effect. Even with the
uncertainty of the true size of the moral hazard effects, there is still a large problem with high
unemployment duration levels (see Figure 2). Finding ways to aid unemployed individuals in
returning to work will help to make the labor market more efficient and reduce the stigma against
the long-term unemployed (Ghayad & Dickens, 2013).
Lawrence Katz, cited earlier for finding that extending UI benefits creates disincentives to work,
now believes that extending UI benefits is the right policy because the current labor market is
very different from when he conducted his research in the 1970s and 1980s (Jacobson, 2009).
Katz pointed to the high number of job seekers per job opening and that disincentives to work in
the 70s and 80s were an issue because jobs were less scarce. Today disincentives to work are not
a problem when many individuals simply cannot find work. UI provides a valuable safety net
and reducing benefits or enacting more stringent eligibility requirements would likely have far
worse consequences than moral hazard.
Additional research is needed to more accurately estimate the impact of extending
unemployment insurance. The variable MaxUI captures some differences in economic conditions
between states which biases the impact of the benefit extension. Models that better control for
the poor economic conditions during the Great Recession would better estimate the impact of
extending UI benefits on unemployment duration. Future research on this topic should combine

43
past approaches and use both administrative UI data as well as data from the CPS to overcome
the data issues of the CPS. Further examination of the effects of UI on the long-term unemployed
should also be conducted to determine the full extent of the disparate impacts of UI on the
unemployed population. Looking into the possible issue of long-term selection would provide
more insight into why the long-term unemployed are remaining out of work for such long
stretches.

44
Bibliography
Aaronson, D., Mazumder, B., & Schechter, S. (2010). What is Behind the Rise in Long-Term
Unemployment? FRB Chicago Economic Perspectives , 28-51.
ADP. (2012). Federal Unemployment Tax Act (FUTA) Increases for 2012 and 2013. Automatic
Data Processing, Inc.
American Payroll Association. (2014). State Unemployment Insurance Taxable Wage Bases
2011-2014. Retrieved from American Payroll Association:
http://www.americanpayroll.org/members/stateui/state-ui-2/
American Psychological Association. (2014). Psychological Effects of Unemployment and
Underemployment. Retrieved 1 31, 2014, from American Psychological Association:
https://www.apa.org/about/gr/issues/socioeconomic/unemployment.aspx
Bachmann, R., & Sinning, M. (2012). Decomposing the Ins and Outs of Cyclical
Unemployment. IZA Discussion Paper No. 6362 .
Bane, M. J., & Ellwood, D. T. (1983). Slipping Into And Out Of Poverty: The Dynamics Of
Spells. National Bureau of Economic Reserach Working Paper No. 1199 .
BLS. (2014a). Employment Situation Summary. Economic News Release. Bureau of Labor
Statistics.
BLS. (2014b, February 25). Labor Force Statistics from the Current Population Survey.
Retrieved from Bureau of Labor Statistics: http://www.bls.gov/cps/cps_over.htm
BLS. (2014c, January 14). Long-term unemployed account for 37.7 percent of all unemployed
persons in December 2013. Retrieved from The Editor's Desk:
http://www.bls.gov/opub/ted/2014/ted_20140114.htm
Card, D., & Levine, P. B. (2000). Extended benefits and the duration of UI spells: Evidence from
the New Jersey extended benefits program. Journal of Public Economics .
CBO. (2012). The Distribution of Household Income and Federal Taxes, 2008 and 2009.
Congressional Budget Office.
Census Bureau, U. S. (2013, April 22). Current Population Survey (CPS) Methodology.
Retrieved from United States Census Bureau: https://www.census.gov/cps/methodology/
Center on Budget and Policy Priorities. (2013, December 16). Policy Basics: How Many Weeks
of Unemployment Compensation Are Available? Retrieved from Center on Budget and Policy
Priorities: http://www.cbpp.org/cms/?fa=view&id=3164

45
Changes to data collected on unemployment duration. (2011, July 8). Retrieved from Bureau of
Labor Statistics: http://www.bls.gov/cps/duration.htm
Chetty, R. (2005). Why Do Unemployment Benefits Raise Unemployment Durations? Moral
Hazard vs. Liquidity. NBER working paper .
Corsini, L. (2013). How unemployment benefits affect individuals of different wealth classes:
Some evidence from Italy. International Journal of Manpower , 693-711.
Council of Economic Advisers. (2011). Unemployment Insurance Extensions and Reforms in the
American Jobs Act.
DOL. (2013, May 23). State Unemployment Insurance Benefits. Retrieved from United States
Department of Labor DOL: http://workforcesecurity.doleta.gov/unemploy/uifactsheet.asp
Elmendorf, D. (2011). Policies for Increasing Economic Growth and Employment in 2012 and
2013. testimony before the Senate Budget Committee, Congressional Budget Office.
Farber, H. S., & Valletta, R. G. (2013). Do Extended Unemployment Benefits Lenghten
Unemployment Spells? Evidence From Recent Cycles In The US Labor Market. National
Bureau of Economic Research Working Paper No. 19048 .
Federal Reserve Bank of St. Louis. (2014). Employment Situation. Retrieved from Economic
Reserach Federal Reserve Bank of St. Louis: http://research.stlouisfed.org/fred2/release?rid=50
Ghayad, R., & Dickens, W. (2013, January 5). It's not a skill mismatch: Disaggregate evidence
on the US unemployment-vacany relationship. Retrieved from VOXEU:
http://www.voxeu.org/article/it-s-not-skill-mismatch-disaggregate-evidence-us-unemployment-
vacancy-relationship
Green, J. (2013, December 12). Congress's Big, Stingy Christmas Mistake. Retrieved 2 1, 2014,
from Bloomberg Businessweek: http://www.businessweek.com/articles/2013-12-12/if-congress-
lets-unemployment-benefits-end-economy-may-suffer
Gruber, J. (1994). The Consumption Smooting Benefits of Unemployment Insurance. National
Bureau of Economic Research Working Paper Series .
Hagedorn, M., Karahan, F., Manovskii, I., & Mitman, K. (2013a). Unemployment Benefits and
Unemployment in the Great Recession: The Role of Macro Effects. National Bueau of Economic
Research Working Paper No. 19499 .
Hagedorn, M., Karahan, F., Manovskii, I., & Mitman, K. (2013b, January 15). Case Study of
Unemployment Insurance Reform in North Carolina.

46
Hobijn, B., & Sahin, A. (2013). Beveridge Curve Shifts across Countries Since the Great
Recession. Working Paper Federal Reserve Bank of San Francisco .
Jacobson, L. (2009, August 2). Michelle Malkin says former Clinton offcial says extending
unemployment benefits is counterproductive. Retrieved from Tampa Bay Times Politifact:
http://www.politifact.com/truth-o-meter/statements/2009/aug/04/michelle-malkin/michelle-
malkin-says-former-clinton-official-says-/
Kane, P. (2014, March 13). Senate reaches bipartisan deal on unemployment benefits extension.
Retrieved from Washington Post: http://www.washingtonpost.com/politics/senate-reaches-
bipartisan-deal-on-unemployment-benefits-extension/2014/03/13/38833c1e-aad7-11e3-af5f-
4c56b834c4bf_story.html
Katz, L. F., & Meyer, B. D. (1990). The Impact of the potential duration of unemployment
benefits on the duration of unemployment". Journal of Public Economics .
King, M., Ruggles, S., Alexander, J. T., Flood, S., Schroeder, M., Schroeder, M. B., et al. (2010).
Integrated Public Use Microdata Series, Current Population Survey: Version 3.0 [Machine-
readable database]. (Universiy of Minnesota.) Minneapolis, Minnesota.
Rothstein, J. (2011). Unemployment Insurance and Job Search in the Great Recession. National
Bureau of Economic Research Working Paper Series .
Schmieder, J. F., von Wachter, T. M., & Bender, S. (2012). The Long-Term Effects of
Unemployment Insurance Extensions on Employment. National Bureau of Economic Research
Working Paper No. 17814 .
Stone, C., & Chen, W. (2013, February 6). Introduction to Unemployment Insurance. Retrieved
January 28, 2014, from Center on Budget and Policy Priorities:
http://www.cbpp.org/cms/index.cfm?fa=view&id=1466
Sullivan, A. (2013, August 19). Why Jobs Go Unfilled Even in Times of High Unemployment.
Retrieved from The Atlantic: http://www.theatlantic.com/business/archive/2013/08/why-jobs-go-
unfilled-even-in-times-of-high-unemployment/278801/
The Social Security Act of 1935. (n.d.). Retrieved from Social Security Administration:
http://www.ssa.gov/history/35act.html#TITLE III
Thurm, S. (2012, April 9). For Big Companies, Life is Good. Retrieved from The Wall Street
Journal:
http://online.wsj.com/news/articles/SB10001424052702303815404577331660464739018
Valletta, R., & Kuang, K. (2012, January 30). Why Is Unemployment Duration So Long?
Federal Reserve Bank of San Francisco Economic Letter .

47
Whittaker, J. M., & Isaacs, K. P. (2014). Unemployment Insurance: Programs and Benefits.
Congressional Reserach Service. http://www.fas.org/sgp/crs/misc/RL33362.pdf.
Winter-Ebmer, R. (2001). Benefit duration and unemployment entry: A quasi-experiment in
Austria. European Economic Review .
Data Sources
CPS Data from IPUMS:
https://cps.ipums.org/cps/
CPS description:
http://www.bls.gov/cps/
Annual Social and Economic (ASEC) Supplement survey description:
http://www.icpsr.umich.edu/icpsrweb/RCMD/series/24/studies/29652?paging.startRow=1&rece
ncy=YEAR
National Unemployment Rate data:
http://data.bls.gov/pdq/SurveyOutputServlet
State Unemployment Rates data – Local Area Unemployment Statistics (LAUS):
http://www.bls.gov/lau/
Job Openings and Labor Turnover Survey (JOLTS) data:
http://www.bls.gov/jlt/
United States Department of Labor; UI Weekly Claims Data (EB and EUC triggers)
http://www.oui.doleta.gov/unemploy/claims_arch.asp
National Unemployment Duration Data http://research.stlouisfed.org/fred2/release?rid=50

Table 1: Number of States (and District of Columbia) Eligible for EB and EUC
Program 2003 2004 2005 2006 2007 2008 2009 2010 2011 2012 2013
EB-13 weeks 3 1 1 0 0 0 15 7 5 7 1
EB-20 weeks 0 0 0 0 0 0 3 31 31 24 0
EB- Total 3 1 1 0 0 0 18 38 36 31 1
EUC
Tier 1 - - - - - - 51 51 51 51 51
Tier 2 - - - - - - 35 51 51 51 39
Tier 3 - - - - - - - 48 46 44 27
Tier 4 - - - - - - - 29 29 23 8 Numbers taken from March of each year
Table 2: Weeks of Eligibility over EUC’s Lifetime
July 6, 2008-
Nov. 23, 2008
Nov. 24, 2008-
Nov. 7, 2009
Nov. 8, 2009-
Feb. 18, 2012
Feb. 19, 2012-
May 26, 2012
May 27, 2012-
Sep. 1, 2012
Sep. 2, 2012-
Dec. 28, 2013
13 weeks
-all states
Tier I: 20 weeks
-all states
Tier II: 13 weeks
-if state TUR>6%
Tier I: 20 weeks
-all states
Tier II: 14 weeks
-all states
Tier III: 13 weeks
-if state TUR>=6%
Tier IV: 6 weeks
-if state TUR>=8.5%
Tier I: 20 weeks
-all states
Tier II: 14 weeks
-all states
Tier III: 13 weeks
-if state TUR>=6%
Tier IV: 6 weeks
-if state TUR>=8.5%*
Tier I: 20 weeks
-all states
Tier II: 14 weeks
-if state TUR>=6%
Tier III: 13 weeks
-if state TUR>=7%
Tier IV: 6 weeks
-if state TUR>=9%
Tier I: 14 weeks
-all states
Tier II: 14 weeks
-if state TUR>=6%
Tier III: 9 weeks
-if state TUR>=7%
Tier IV: 10 weeks
-if state TUR>=9% *16 weeks if no active EB and TUR >=8.5% (Whittaker & Isaacs, 2014)

Table 3: Unemployed persons by duration of unemployment
Not seasonally adjusted
Feb
2013
Jan
2014
Feb
2014 NUMBER OF UNEMPLOYED
Less than 5 weeks 2440 2876 2145
5 to 14 weeks 3366 2587 3091
15 weeks and over 6694 5392 5657
15 to 26 weeks 1903 1702 1771
27 weeks and over 4791 3690 3886
Average (mean) duration, in weeks 36 33.3 36.3
Median duration, in weeks 17.1 14.3 16
PERCENT DISTRIBUTION
Less than 5 weeks 19.5 26.5 19.7
5 to 14 weeks 26.9 23.8 28.4
15 weeks and over 53.6 49.7 51.9
15 to 26 weeks 15.2 15.7 16.3
27 weeks and over 38.3 34 35.7
Updated population controls are introduced annually with the release of January data. Taken from BLS

50
Table 4: Unemployed persons by duration of unemployment
Seasonally adjusted
Feb
2013
Oct.
2013
Nov
2013
Dec
2013
Jan
2014
Feb
2014 NUMBER OF UNEMPLOYED
Less than 5 weeks 2677 2794 2439 2255 2434 2373
5 to 14 weeks 2788 2636 2585 2506 2429 2568
15 weeks and over 6485 5824 5786 5530 5336 5464
15 to 26 weeks 1735 1777 1742 1651 1689 1615
27 weeks and over 4750 4047 4044 3878 3646 3849
Average (mean) duration, in weeks 36.9 36 37.1 37.1 35.4 37.1
Median duration, in weeks 17.7 16.5 17 17.1 16 16.4
PERCENT DISTRIBUTION
Less than 5 weeks 22.4 24.8 22.6 21.9 23.9 22.8
5 to 14 weeks 23.3 23.4 23.9 24.4 23.8 24.7
15 weeks and over 54.3 51.7 53.5 53.7 52.3 52.5
15 to 26 weeks 14.5 15.8 16.1 16 16.6 15.5
27 weeks and over 39.7 36 37.4 37.7 35.8 37
Updated population controls are introduced annually with the release of January data.
Taken from BLS

51
Table 5: Summary Statistics 2003-2013 CPS
Variable
Mean
Standard Deviation
N
Dependent Variables
Unemployment Duration 24.46 27.130 77,229
Long-term Duration 60.40 24.740 22,196
Individual
Age 45.69 23.829 592,459
Gender (Female = 1) 0.60 0.490 592,459
At Least HS Degree 0.65 0.478 592,459
At Least Bachelor’s Degree 0.15 0.361 592,459
Marital Status (Married = 1) 0.43 0.495 592,459
Max Weeks of UI (MaxUI) 50.27 29.249 592,459
Race
White (Reference) 0.78 0.416 592,459
Black 0.13 0.333 592,459
Asian 0.05 0.224 592,459
American Indian 0.02 0.124 592,459
Hawaiian/Pacific Islander 0.004 0.066 592,459
Other (2+ races) 0.02 0.147 592,459
Household
Total Family Income 57,239 69,439 592,459
Living in Metro area (Yes = 1) 0.78 0.412 564,776
Labor Market
State Unemployment Rates 6.63 2.315 592,459
National Unemployment Rate 6.85 1.863 592,459
Job Openings (000s) 3,571 675.646 592,459
Table 6: JOLTS Data Definitions
JOLTS DATA Calculation
Job Openings Level Total number of openings (presented in thousands)
Job Openings Rate Number of openings divided by (employment plus job openings)
Hiring Rate Number of hires as a percent of total employment
Turnover (Separations) Rate Number of total separations as a percent of total employment
Quits Rate Number of quits as a percent of total employment
Layoffs & Discharge Rate Number of Layoffs & Discharges as a percent of total employment National level data

52
Table 7: Full Unemployment Duration Results using 2003-2013 CPS
Variable
OLS
State Fixed
Effects
State and
Year Fixed
Effects
MaxUI 0.162***
(0.012)
0.170***
(0.013)
0.077***
(0.019)
Age 0.320***
(0.008)
0.315***
(0.008)
0.315***
(0.008)
Gender (female=1) -1.545***
(0.198)
-1.509***
(0.198)
-1.608***
(0.197)
At Least HS Graduate 1.540***
(0.239)
1.456***
(0.239)
1.402***
(0.238)
At Least Bachelor’s Degree 1.963***
(0.294)
1.822***
(0.295)
1.724***
(0.293)
Marital Status (married=1) -1.458***
(0.230)
-1.392***
(0.230)
-1.386***
(0.229)
Black 5.535***
(0.252)
5.258***
(0.263)
5.204***
(0.262)
Asian 4.219***
(0.532)
4.176***
(0.537)
4.066***
(0.535)
American Indian 2.658***
(0.867)
3.177***
(0.882)
3.117***
(0.878)
Hawaiian/Pacific Islander 4.071**
(1.639)
3.987**
(1.665)
3.827**
(1.659)
Other races (2+) 2.769***
(0.664)
2.877***
(0.669)
2.884***
(0.666)
Total family income (000s) -0.050***
(0.002)
-0.052***
(0.002)
-0.051***
(0.002)
Living in a metro area 1.358***
(0.270)
0.650**
(0.295)
0.741**
(0.294)
State unemployment rate 1.101***
(0.077)
1.113***
(0.131)
1.293***
(0.137)
National unemployment rate 0.511**
(0.245)
0.330
(0.282)
0.530
(0.360)
National job openings (000s) 0.004***
(0.0003)
0.004***
(0.0004)
0.001**
(0.001)
Constant -22.681*** -22.331*** -10.748
R^2 .1122 .1160 .1232
N 73,489 73,489 73,489 Standard errors in parentheses Legend: * p<.1; ** p<.05; *** p<.01

53
Table 8: Long-Term Duration Results using 2003-2013 CPS
Variable
OLS
State Fixed
Effects
State and
Year Fixed
Effects
MaxUI 0.167***
(0.019)
0.175***
(0.021)
0.155***
(0.032)
Age 0.248***
(0.013)
0.245***
(0.013)
0.243***
(0.013)
Gender (female=1) -1.456***
(0.335)
-1.433***
(0.336)
-1.575***
(0.335)
At Least HS Graduate -0.046
(0.427)
-0.059
(0.428)
-0.137
(0.427)
At Least Bachelor’s Degree 0.119
(0.467)
0.103
(0.469)
-0.023
(0.467)
Married -0.439
(0.383)
-0.402
(0.384)
-0.410
(0.383)
Black 1.945***
(0.401)
2.049***
(0.422)
2.071***
(0.421)
Asian 2.516***
(0.823)
2.368***
(0.835)
2.369***
(0.832)
American Indian 3.322**
(1.503)
3.339**
(1.540)
3.3482*
(1.536)
Hawaiian/Pacific Islander 1.448
(2.574)
1.034
(2.641)
0.754
(2.633)
Other races (2+) 2.608**
(1.115)
2.611**
(1.124)
2.592**
(1.120)
Total family income (000s) -0.040***
(0.003)
-0.041***
(0.003)
-0.041***
(0.003)
Living in a metro 0.844*
(0.483)
0.399
(0.531)
0.356
(0.529)
State unemployment rate 0.500***
(0.124)
0.052
(0.231)
0.011
(0.238)
National unemployment rate -0.470
(0.411)
-0.186
(0.500)
0.827
(0.720)
National job openings (000s) 0.006***
(0.001)
0.006***
(0.001)
0.003***
(0.001)
Constant 20.171*** 20.097** 26.122**
R^2 .0686 .0712 .0776
N 21,377 21,377 21,377 Standard errors in parentheses Legend: * p<.1; ** p<.05; *** p<.01

54
Unemployment Duration Measurement Changes
In 2011 the Consumer Population Survey (CPS) made a slight change in how it top-coded the
maximum number of weeks of unemployment duration. The previous maximum was 99 weeks,
meaning that if an individual had been unemployed for 110 weeks it would be recorded as 99
weeks. A change was made during the recession to increase the maximum weeks of
unemployment duration from 99 to 117 weeks, and then in 2011 up to 260 weeks where it
currently stands. The BLS reports that only the average was affected by this change, while the
median and distribution of unemployment by weeks unemployed were not affected (2011). The
national average unemployment duration increased by about three weeks as a result of this
measurement change, which is relatively small change compared to the amount duration
increased during that period (Valletta & Kuang, 2012).

55
Figure 1: US Unemployment Duration 1967-2013
(Federal Reserve Bank of St. Louis, 2014)
0.0
5.0
10.0
15.0
20.0
25.0
30.0
35.0
40.0
45.0
1967 1972 1977 1982 1987 1992 1997 2002 2007 2012
Wee
ks
Median
Mean

56
Figure 2: Number of unemployed persons by duration of unemployment, US 2007-2013
Numbers are seasonally adjusted (BLS, 2014c)
0
2,000,000
4,000,000
6,000,000
8,000,000
10,000,000
12,000,000
14,000,000
16,000,000
18,000,000
2007 2008 2009 2010 2011 2012 2013
27 weeks and over
15 to 26 weeks
5 to 14 weeks
Less than 5 weeks

57
Figure 3: U.S. Beveridge Curve: Dec. 2000 – June 2012

58
Figure 4: Variation in State Unemployment Rates compared to US Unemployment Rate (BLS)
Black line = national unemployment rate, gray lines represent the 50 states (and District of Columbia)
0%
2%
4%
6%
8%
10%
12%
14%
16%
18%
20%
1976 1981 1986 1991 1996 2001 2006 2011

Figure 5: Variation in MaxUI across States, 2003-2013
Black line = National Sample Average, gray lines represent the 50 states (and District of Columbia)
10
20
30
40
50
60
70
80
90
100
2003 2004 2005 2006 2007 2008 2009 2010 2011 2012 2013
Wee
ks