Embed Size (px)
Citation preview

0
Worldwide short selling: Regulations, activity, and implications*
Archana Jain
Doctoral student The University of Memphis
Memphis, TN 38152, USA Voice: 901-652-9340 [email protected]
Pankaj Jain
Suzanne Downs Palmer Professor of Finance The University of Memphis Memphis, TN 38152, USA
Voice: 901- 678-3810 Fax: 901-678-0839
Thomas H. McInish
Professor and Wunderlich Chair of Finance The University of Memphis Memphis, TN38152, USA
Voice: 901-277-9202 Fax: 901-678-3006
Michael McKenzie Professor and Chair of Discipline
The University of Sydney NSW 2006 Australia
April 2011
JFL classification: G15 Keywords: Short selling, ADRs, Regulatory Reach, Regulatory Arbitrage, Enforcement * The authors thank Michael Aitken, Frederick Harris, Robert Van Ness, James Upson, Veljko Fotak, Christian Farruggio, Mahmod Qadan, and Michael Goldstein for helpful comments. We have also benefited from discussion at the Financial Management Association annual conference in July 2010 in Singapore, Financial Management Association annual conference in October 2010 in New York, the Capital Markets Cooperative Research Centre, Sydney, in December 2010, Midwest Finance Association conference in March 2011 in Chicago, and Eastern Finance Association conference in April 2011 in Savannah. We thank the Center of International Business Education and Research for financial support.
1
Worldwide short selling: Regulations, activity, and implications
Abstract
We characterize the legality, feasibility and incidence of short selling in a worldwide,
multimarket framework. Some countries have no restrictions on short selling while others
partially or completely ban short selling. We examine how these restrictions affect short selling
of both domestic stocks in each country and of ADRs in the U.S. We use data from a variety of
sources including Data Explorer, Reg SHO, FINRA, Shortsqueeze, and DataStream. We find
that home country short selling restrictions curtail home market stock borrowing and have
international regulatory reach, curtailing short selling volume and short interest of the country’s
ADRs in the U.S. markets. Our evidence rules out any large scale regulatory arbitrage by short
sellers migrating their trading to less restrictive regimes. We also find evidence of reverse reach,
which reduces the home-country underlying stock borrowing of ADR issuers when U.S.
restrictions are stricter than home country restrictions. These effects survive in a multivariate
analysis that controls for past returns, firm size, dividend yield, and standard deviation of return.
As an implication of regulatory reach, we find that the portfolio of ADRs from restrictive
countries underperforms the portfolio of ADRs from unrestrictive countries.
2
Worldwide short selling: Regulations activity, and implications
1. Introduction
Short selling is an integral part of the current trading environment.1 Yet, the role of short
selling is highly controversial. Proponents argue that short selling is an essential part of the price
discovery mechanism (Boehmer, Jones and Zhang (2009) and Kolasinksi, Reed and Thornock
(2009)) whereas opponents express concern about price manipulation (Shkilko, Van Ness and
Van Ness (2008)). The frequency of regulatory interventions and restrictions underscores the
lack of clarity or consensus when and whether short selling if beneficial or harmful. There is a
rich cross-country and time-series variation in the home-country legality and feasibility of short
selling (Beber and Pagano (2010), Bris, Goetzmann and Zhu (2007), and Charoenrook and
Daouk (2008)). We find that national regulators able to effectively enforce short selling
restrictions in their home markets. To investigate how home market restrictions affect short
selling in a global multimarket setting, we introduce and test the regulatory reach hypothesis,
which states that home country restrictions on short selling curtail worldwide short selling
activity in cross-listed stocks such as ADRs from that country. The alternative hypothesis is the
regulatory arbitrage hypothesis, which states that short selling moves to foreign locations when
the home market restricts short selling.
Regulatory reach can decrease the short selling of a country’s ADRs in the U.S. both
directly and indirectly. The direct channels affecting regulatory reach are reduced production of
negative information and reduced availability of shares for borrowing. First, negative
information can be produced by both local and foreign researchers. Restrictions on short selling
in home markets curtail local researchers’ incentives to produce negative information about
1 Diether, Lee and Werner (2009) find that short selling volume is 24% of NYSE and 31% of NASDAQ trading volume.
3
firms. Thus, the aggregate global frequency and quantity of short selling is lower with home
market restrictions. Ceterus paribus, traders are more to short ADRs aggressively for which
negative information can be produced in both the local and foreign markets relative to ADRs for
which local researchers are inactive. Second, legal restrictions in the home market limit the
institutional share lending markets. Thus, fewer shares are available worldwide for short sellers
to borrow, which again results in short sellers being less aggressive.
The indirect channels affecting regulatory reach are the enforcement actions of home
country governments. Enforcement agencies often cooperate with their counterparts in other
countries (Block (2007)). Hamilton (2008) reports that “following the lead of the SEC and the
U.K. Financial Services Authority, and in an effort to prevent regulatory arbitrage, securities
regulators around the world have acted to ban different forms of short selling as the crisis in the
financial markets spreads globally.” Regulators in the home country may target institutions that
attempt to circumvent local short selling bans. Also, in many countries governments have
ownership stakes in local institutions through which they can influence behavior. Countries may
specify a worldwide jurisdiction for their restrictions, at least for the activities of their citizens.
Lau and McInish (2002) report that the Malaysian government was able to issue regulations that
prevented the trading of Malaysian equities in Singapore despite opposition from both the
Singapore government and Singapore investors. This evidence is an example of our regulatory
reach hypothesis in the context of regular trading. We are not aware of any prior academic test of
this hypothesis in the context of short selling despite the spate of regulatory activity taking place
in this area.
The alternate regulatory arbitrage hypothesis asserts that investors short sell in another
country when short selling is prohibited in the home country (Kim, Szakmary, and Mathur

4
(2000) and Nilsson (2008)). Regulatory arbitrage increases ADR short volume if traders opt to
trade in unrestricted regimes. However, the complexity of international arbitrage is increased by
taxes or fees on foreign transactions, capital controls, inconvertibility of currencies, and market
segmentation (Foerster and Karolyi (1999)). On balance, the regulatory reach hypothesis is more
plausible than the regulatory arbitrage hypothesis.
We test these competing views using several unique datasets, we provide the first detailed
characterization of the world market for stock borrowing, short selling, and the regulations
governing these activities in 82 countries. Stocks originating from a given country are borrowed
both in the home markets and in foreign markets. We find that home market restrictions
effectively reduce short selling in ADR markets consistent with regulatory reach.
Next, we examine the factors that exacerbate or mitigate regulatory reach. We find that
good enforcement of short selling regulations in the home country and a country’s geographic
distance from the U.S. decreases short selling in the U.S. and strengthens regulatory reach. In
contrast, factors that increase the incentives and profitability of short trades are expected to
weaken regulatory reach and increase the observed amount of ADR short selling. We identify
firm size, level of ADR, standard deviation of return, and language similarity as such factors.
Our study contributes to the literature in several ways. We present the first test of
effectiveness of regulatory enforcement of short selling restrictions in 82 countries. Although,
there is a rich literature on the potential valuations consequences of short selling, a global
analysis of the actual short selling activity is largely missing. We use the Data Explorer dataset,
which has comprehensive information regarding short selling related stock borrowing
worldwide. We find that short selling related stock borrowing is significantly lower in countries
that impose restrictions than in countries that do not.
5
Second, we identify regulatory reach as a new determinant of short selling in the
international context by combining several virgin datasets. Apart from Data Explorer, we use
shortsqueeze.com, which provides short interest information concerning U.S. equities including
ADRs. We also download data from the FINRA web sites made available as a result of the
SEC’s Regulation SHO. These rich datasets enable us to take a first look at worldwide stock
borrowing activity and depict a complete picture of various facets of the short selling process,
especially in the context of multi-market trading. Univariate comparison, matched control
sample experiments, multivariate regressions, all consistently point to regulatory reach. Our
findings remain strongly significant after controlling for firm specific characteristics, stock
borrowing costs, industrial sectors, trading volume, dispersion of opinion, and outstanding short
interest.
Third, we create a short selling regulation enforcement index. This index is a function of
short selling related stock borrowing scaled by market capitalization of the country and legality
of short selling in the home country. Unlike the dummy variable used in prior work
(Charoenrook and Daouk (2008) and Beber and Pagano (2010)), our continuous index of actual
borrowing information, from the Data Explorer dataset, is a better proxy for the effectiveness of
regulatory enforcement in a country. In testing the reach of home country restrictions in
curtailing ADR short selling controlling for this enforcement variable, we find results consistent
with regulatory reach. We also provide much more detailed descriptions about the exact nature
of short selling legality and restrictions by examining the specific trading mechanism (up-tick
rule), pre-borrowing requirements (ban on naked short selling), and ban on shorting selected
stock (mainly financial stocks). Interesting examples are from (1) the U.S. where short selling is
allowed on upticks, but restricted on downticks, (2) Mexico where covered short selling is legal,
6
but naked short selling is illegal, (3) the U. K. where market makers were exempted from the
recent short selling ban, and (4) Poland, Turkey, the U.S. and several other countries where
specific lists are created for stock that can or cannot be shorted. We have rich cross-sectional as
well as time-series variation in the legality and feasibility of short selling.
Fourth, we look at the regulatory reach in the reverse direction as well. We test the effect
of short selling restrictions in the U.S. on short selling related borrowing of underlying stocks in
the home country. We employ a research design commonly used in the hard sciences literature
with a treatment group and a control sample by matching each ADR issuing firm with a non-
ADR issuing home country firm based on key firm characteristics. This approach enables us to
tightly control cross country differences that often are an issue with international studies. We
form an index of relative strictness defined as the difference between US restrictions and home
country restrictions. This index negatively affects the short selling volume of ADR issuing
underlying stocks vis-à-vis non issuers.
Fifth, we study the implications of regulatory reach in the context of a constraints
hypothesis. According to this hypothesis, when short selling is constrained, stocks become
artificially overvalued and suffer from poor stock return performance in the long run (Diamond
and Verrechia (1987), Miller (1977), Bris, Goetzmann and Zhu (2007), and Prado Brounen, and
Verbeek (2009)). The valuation effects are expected to be particularly high when short sell
constraints are binding, i.e., when the inherent shorting demand is high (Boehmer, Jones and
Zhang (2008)). Using the double sorting methodology of Asquith, Pathak and Ritter (2005), We
we compare the performance of: a) portfolios of ADRs from countries where it is legal to short
sell against the portfolio of ADRs from the countries where it is illegal to short sell, and b)
portfolios of ADRs with high short interest against the portfolio of ADRs low short interest using
7
the double sorting methodology of Asquith, Pathak and Ritter (2005). Using a Fama-French four
factor regression model, we find that portfolios of ADRs from the countries where it is illegal to
short sell underperform portfolios of ADRs from the countries where it is legal to short sell.
2. Data sources and descriptive statistics
We form our research dataset by combing information from various sources described in
the data appendix. Our sample firms include ADR-issuing firms from 82 countries and a
matched sample of non-issuers from the same set of home countries. This approach lets us
examine the behavior of short sellers in the context of worldwide multi-market trading. We
analyze short selling related borrowing, total short interest, short trading volume, and return in
both the U.S. and the underlying markets. These variables are obtained from Data Explorer,
shortsqueeze.com, FINRA, and Datastream.
Data Explorer is based in New York and London and according to its web site is the
world’s most comprehensive resource for data on short-selling related borrowing. Data Explorer
covers thousands of equities worldwide and receives information on more than 3 million
transactions daily from over 100 top securities lending firms for commercial dissemination. Data
Explorer estimates that its institutional clients account for 70% of the worldwide borrowing
market. For each security, these data include information on the value and quantity of stock
borrowing, cost of borrowing (VSA), number of brokers and agents, and other variables. The
location of the borrowing is also provided so that it is possible to tell whether the shares are
being borrowed in the home country or elsewhere. Although, this dataset has been used by
Faulkner (2008) to assess the impact of securities lending on the corporate governance landscape

8
and by Flatley (2009) to understand trends and changes in market micro-structure, we are the
first one to characterize short selling itself and its determinants in the multi-market context.
Our data comprise daily stock borrowing activity for the period from July 2006 through
Jan 2010. We clean the Data Explorer data in several ways. We eliminate exact duplicates. Data
Explorer provides values in one of four currencies—USD, EUR, JPY, AUD—depending on
where the data are collected. We convert all monetary values into USD based on daily exchange
rates obtained from DataStream. Data Explorer includes a variable called dividend requirement
that allow us to make sure that our results are not affected by dividend capture.
Shortsqueeze.com provides fortnightly short interest data for over 16,000 stocks that
trade on NYSE, NASDAQ, AMEX, OTC/BB and Pink Sheets. Short interest is defined as total
number of outstanding shorted shares for each security. In addition to the number of shares
short, additional supporting data such as days to cover, number of shares outstanding, and
institutional ownership are combined to provide a deeper gauge of market opportunity, stock
selection and timing. This is the most comprehensive dataset of domestic U.S. short selling
information. We access these data for the period from November 2007 to October 2009.
The short volume dataset is based on reporting requirements of Regulation SHO, which
was implemented in January 2005 to reduce abusive naked short selling practices. Since August
2009, Regulation SHO data are publicly accessible from the Financial Industry Regulatory
Authority (FINRA) website. We downloaded the daily short sale volume files from the website
for the period from August 2009 through January 2010, which is the latest period for which we
have Data Explorer dataset. We use this data to perform the robustness test of regulatory reach.
This dataset allows us to use actual short volume instead of short interest. Also, this dataset
9
excludes the crisis period. We find evidence of regulatory reach in both daily and fortnightly
data.
Our merged dataset enables us to depict a complete picture of various facets of the short
selling process from stock borrowing to trade initiation to management of open short interest in
the light of the ever changing regulatory environment.
2. 1. Short selling regulations and feasibility around the world
We obtain detailed information on legality and feasibility of short selling in each country.
We begin with a survey of academic articles (Bris, Goetzmann and Zhu (2007), Charoenrook and
Daouk (2008) and Beber and Pagano (2010)) and practitioners’ reports and briefings (Chance
(2009) report, released by well-known law firm Linex Legal). We verify and supplement these
data with direct correspondence with stock exchanges and financial market regulators in each
country in our sample. Initially, we follow the approach used in the papers cited above and
define an indicator variable illegal, which equals 1 if short selling is prohibited in the home
market and 0 otherwise. Subsequently, we extend the literature by going beyond the indicator
variable approach and examining in more details the countries where short selling is permitted in
restricted forms.
We form a restrictions variable that equals 0 when there are no restrictions on short
selling in the home country and 3 when there is a total ban. The index equals 1 if there is either
an uptick rule or a ban on naked short selling and 2 if both of these restrictions are present. We
create this variable separately for financial and non-financial stocks. At a country level this
variable can range from 0 to 5, because we use complete ban on short selling of financial stock
or naked ban on short selling of financial stocks as two additional restrictions categories. The

10
restrictions variable has a value of 1 for Brazil because it prohibits naked short selling, but all
other forms of short selling are allowed. Similarly, the index is 1 for Russia because it has an up-
tick rule, but all other forms of short selling are allowed. The index has value of 2 for Mexico
and Taiwan, both of which have a ban on naked short selling as well as an up-tick rule in place.
Both illegal and restrictions variables vary over time for countries that introduced change
in short selling restriction during our sample period. For example, in the U.S, for many decades
short selling was allowed on upticks, but not on downticks. The uptick rule was repealed in
2007, but shortly thereafter a similar restriction, Rule 201, was enacted. Restrictions may also
vary from firm to firm within a country.16 countries imposed temporary restrictions on short
selling of financial, banking or insurance stocks in the 2008 financial crisis. Thus, we consider
all types of restriction and bans separately rather than just the overall legality of short selling in
each country.
One of the novelties of our paper is a feasibility index that is calculated as the aggregate
short selling related borrowing volume in the home country divided by the market capitalization
of the country. We obtain market capitalization from the World Bank website and borrowing
data from Data Explorer. If a country is not in Data Explorer, we assign a value of 0 to this
index. For some countries we also obtain this information through direct correspondence with
stock exchange officials or the country’s regulators. We use this information on home country
activity to calculate an enforcement index defined as the product of feasibility index, the illegal
dummy and minus one. A higher number for the enforcement index indicates good enforcement
of short selling regulation in the home country. We use this enforcement index as a control
variable in our test of regulatory reach when assessing short selling of ADRs in the U.S.
markets.
11
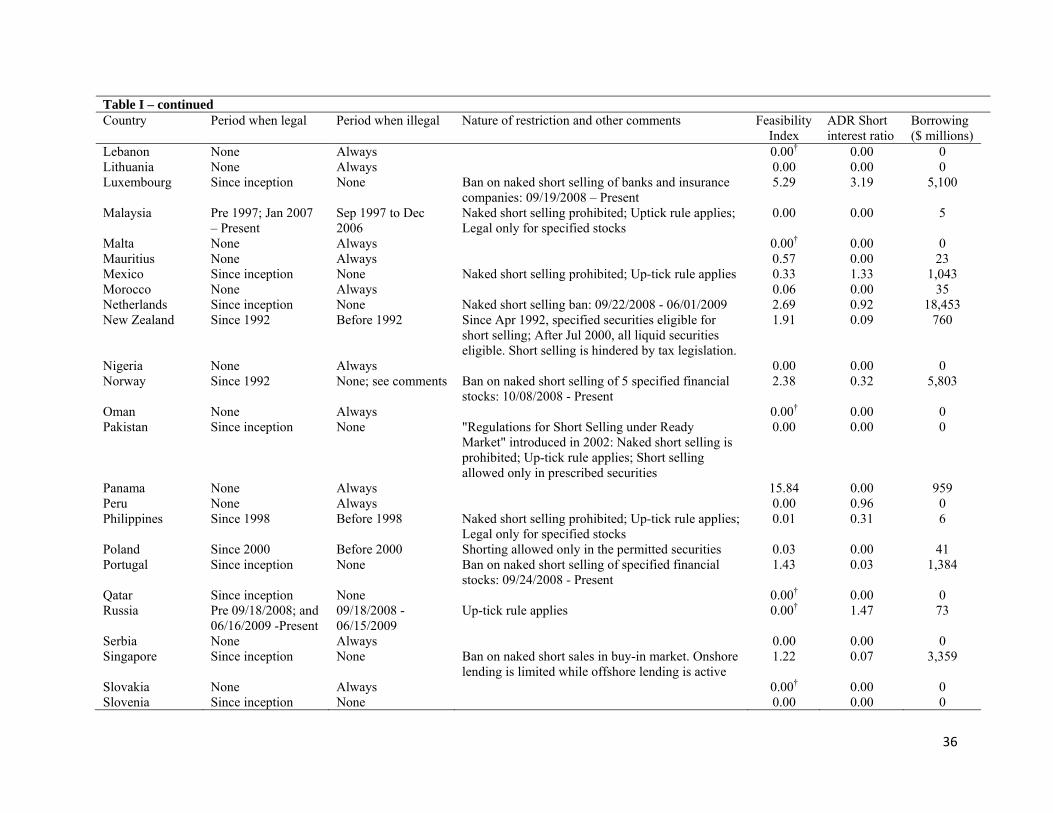
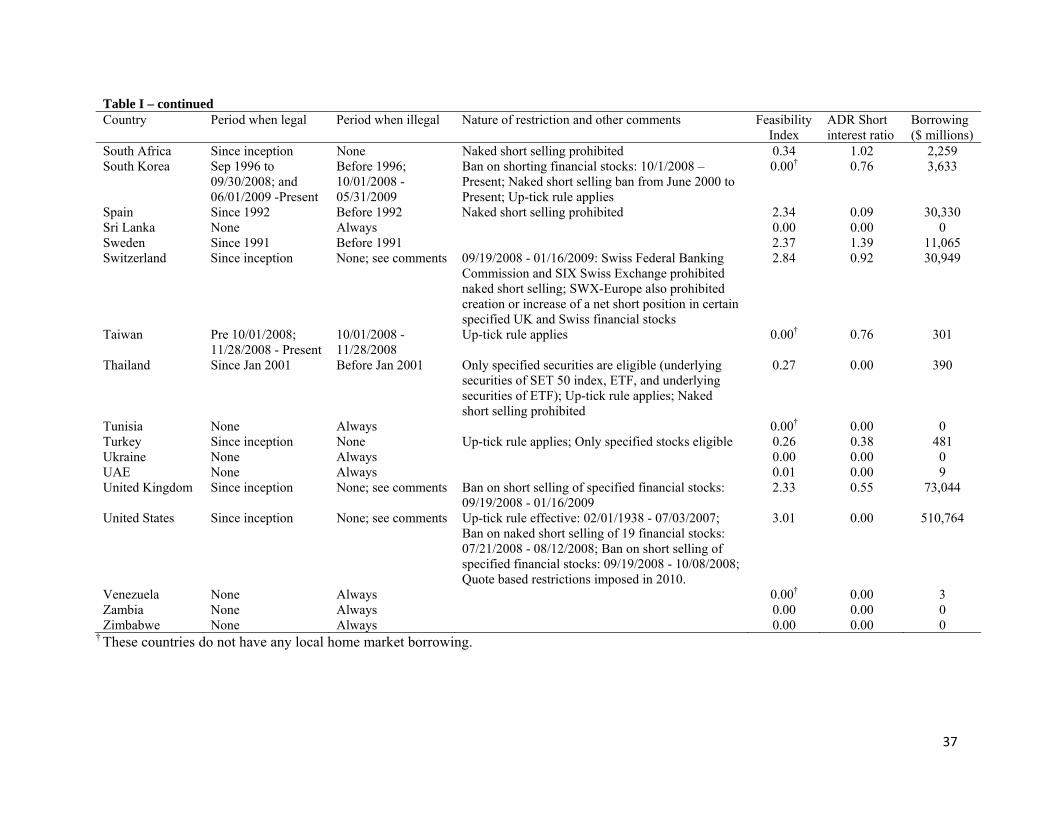
In Table I, we show the legality status with the specific period when short selling was
legal or illegal, the nature of restrictions, and the feasibility index for each country in column 2 to
5. We report the average short interest ratio for all ADRs from each country in column 6, which
is calculated as short interest divided by shares float, from shortsqueeze.com data. We report the
global feasibility index in the table and identify the countries where there is no home country
borrowing. Aggregate short selling related borrowing of all stocks from each country is reported
in the last column. This statistic is available at daily frequency and we have averaged it for all
days in our sample period. Overall, we observe rich cross sectional as well as time series
variation in the regulatory restrictions, which we take into account in our multivariate analysis.
This time series variation is important in the light of the perennial controversy surrounding the
role of short selling and the vacillating regulators’ stands on short selling.2 One of our
contributions is to simultaneously study the effect of changing regulations in a given country on
stocks that are cross listed as ADRs on multiple exchanges with different short selling regimes.
[Insert Table I here]
2. 2. Main sample – American Depository Receipts
We focus on firms that are cross listed in multiple markets as ADRs because they provide
an ideal setting for testing our research questions. The fact that their underlying shares originate
from 82 countries with diverse short selling laws enable a direct test of our two hypotheses--
regulatory reach versus regulatory arbitrage. Next, our focus on ADRs allows us to test the
regulatory reach of the U.S. restrictions in the reverse direction. Finally, Errunza and Miller
2 Removal of the uptick rule in the U.S. shortly followed by its reinstatement in the form of Rule 201, bans on short selling of financial stocks, bans on naked short selling in the recent financial crisis by most countries, and a pilot test by allowing short selling of 11 brokerage firms by China during the same period is evidence of the fact that there is still disagreement about the role of short selling in financial markets.
12
(2000) show that ADR listing helps the underlying firm reduce its cost of capital. However,
regulatory restrictions may reduce some of these benefits. We test the valuation implication of
regulatory reach by looking at the return performance of ADRs from countries that impose short
selling restrictions versus those that do not.
To begin constructing our main sample of U.S. ADRs, we obtain lists of ADRs from the
Bank of New York Mellon and J. P. Morgan web sites in November 2009. Both of these firms
provide comprehensive datasets that have a wide variety of information on ADRs, including type
or level, the number of shares underlying each ADR, ADR’s ISIN code, and the underlying
stock’s ticker symbol.3 We identify each firm’s home country using the first two digits of the
International Securities Identification Number (ISIN), which represents the originating country’s
ISO codes.
To be useful for research, additional data for these ADRs must be available from other
datasets. A triangular intersection of the initial ADR list, shortsqueeze.com data, and Datastream
international data yields a shortsqueeze sample of 1,307 ADRs with fortnightly short interest
data. Similarly, the intersection of the initial ADR list, FINRA data, and Datastream international
yields a FINRA sample of 918 ADRs with daily short volume. We use these shortsqueeze and
FINRA samples to test the regulatory reach hypothesis.
3 Unlike ADRs, 179 cross listed securities from Toronto Stock Exchange are fully fungible with the same shares traded in the U.S. However, we refer to these Canadian stocks as ADRs too, sacrificing some linguistic accuracy for expositional convenience. In addition to ADRs that are freely traded, there are two types of restricted ADRs that we exclude from our sample: a) SEC Rule 144(a) ADRs are private placements that do not trade on an established exchange and can be purchased only by a Qualified Institutional Buyer b) Regulation S ADRs can also be used to raise capital. These Regulation S ADRs are not registered in the U.S. and can only be traded outside the U.S. by non-U.S. persons.
13
2. 3 Matched control sample
Now we begin forming a matched control sample of home country non-issuer stocks that
have firm characteristics similar to the ADR issuers from that country. We use country, industry,
price to book value ratio (PTBV) and market capitalization from DataStream to develop this
control sample.
For each ADR issuing firm, we calculate the difference between the PTBV of that firm
and the PTBV of all the non-ADR issuing firms in our data within the same country and
industry. We match the ADR issuing firm with a non-ADR issuing firm for which the difference
in the PTBVs is at a minimum. If the PTBV difference of one ADR issuing firm is the same for
more than one non-ADR issuing firm, then we match the firms based on the minimum difference
in market capitalization. For the firms where we do not have the PTBV information, we find
matches based on the market capitalization differences only. We form these control samples with
replacement to ensure that matched firms resemble the main sample firms very closely.
We match 1,406 ADR issuing firms with 1,120 unique non-ADR issuing firms. We
provide the descriptive statistic of our main sample and control sample in Table II. We use this
sample to analyze regulatory reach in the reverse direction. Our results, not reported here, are
robust to matching without replacement, where we match 1,406 ADR issuing firms with 1,406
unique non-ADR issuing firms.
[Insert Table II here]
2.4. Control variables:
Prior literature points us to various additional determinants of short selling. Diether, Lee
and Werner (2009), find that short sellers increase short selling activity after positive stock
14
returns whereas Blau, Van Ness, Van Ness and Wood (2010) find that short selling increases
after extremely negative market returns. Thus, we include past return as a control variable.
Chang, Cheng and Yu (2007) find that a short sale constraint causes overvaluations of
stocks and that the overvaluation effect is higher for individual stocks with higher dispersion of
opinion. Therefore, we also control for dispersion of opinion in our regression models using the
standard deviation of return as a proxy.
Jones and Lamont (2002) find that stocks that are expensive to short or that enter the
borrowing market have high valuations and low subsequent returns, consistent with the
overpricing hypothesis. D’Avolio (2002) describes the market for lending and borrowing U.S.
equities and finds that the probability of being on special (high lending fee) decreases with size
and institutional ownership. Thus, we include the stock borrowing fee as a control variable.
Because of its limited availability worldwide, we use institutional ownership data only in a
robustness test and we expect a positive relationship between institutional ownership and the
amount of short selling.
Evans, Geczy, Musto and Reed (2009) state that, unlike traders in general, a market
maker can short sell without having to locate shares to borrow as a part of a bona fide hedging
transaction. These authors find that market makers then choose not to borrow and instead fail to
deliver stock to buyers when failing is cheaper than borrowing the stock. In the spirit of market
intermediation, we include the number of active agents and the cost of stock borrowing as
control variables. A higher number of active agents indicate more competition in the market.
Therefore, we expect a positive relation between the extent of short selling and the number of
active agents, because it will be cheaper for short sellers to trade in stocks with high competition.
15
Grinblatt and Keloharju (2001) argue that investors are more likely to hold, buy and sell
stocks of firms that are located close to the investor and that communicate in the investor’s
native tongue. Therefore, in our test of regulatory reach, we also control for language and
distance from the U.S. We expect higher short selling of firms from the countries where English
in one of the official languages. We expect a negative relationship between short selling and
distance from the U.S. We obtain data on Language and distance from CEPII research center.
We calculate the distance in miles from the U.S. using the formula from Meridian World Data
website.4
Other control variables related to short selling include dividend yield, firm size (Diether,
Lee and Werner (2009)), level of ADRs and days to cover. Because these control variables are
not the focus of our study, we do not have hypotheses about their relation to the extent of short
selling. The Appendix shows the data sources and variable definition for each of our control
variables.
3. Results
We begin by plotting the short selling activity for lenient and strict regulatory regimes in
Figure I. The gray bar represents the average outstanding borrowing volume per stock in million
USDs in countries where short selling is legal and unrestricted. The black bar represents the
average stock borrowing in countries where short selling is illegal or restricted. This figure
indicates that short selling restrictions appear to be effective in curtailing home market stock
borrowing because the avearge shares borrowed is 63.25 million USD (28.99 million USD) for
stocks from the countries where short selling is legal or unrestricted (illegal or restricted). Now
we turn our attention to what happens outside the home markets to assess the external reach of 4 http://www.meridianworlddata.com/Distance-Calculation.asp
16
regulations. The next two bars provide the analogous comparison of monthly short volume and
the last two bars compare short interest of ADRs from unrestritive and restrictive countries. The
avearge monthly short volume is 53.73 million USD (18.46 million USD) for ADRs from the
countries where short selling is legal or unrestricted (illegal or restricted). Similarly, the avearge
short interest is 19.79 million USD (15.21 million USD) for ADRs from the countries where
short selling is legal or unrestricted (illegal or restricted). These results support our regulatory
reach hypothesis which states that there is less cross-border short selling in the U.S. of ADRs
from the coutries where it is illegal to short sell. In the following section we perform multivariate
regressions to confirm these findings.
[Insert Figure I here]
3. 1. Effectiveness of short selling restriction in curtailing home market stock borrowing
In this section we test the effectiveness of home country restrictions using Data Explorer
data for short selling related borrowing. If the regulations are effectively enforced then we will
observe a lower amount of stock borrowing in countries with restrictions. Thus, we expect a
statistically significant negative coefficient for the restriction variable in the regression with
stock borrowing as a dependent variable. We estimate all or a subset of the following equation:
Shares borrowed = α0 + α1 restriction + α2 return + α3 market capitalization
+ α4 dividend yield + α5 standard deviation of return + α6 VSA
+ α7-10 industrial sector fixed effects + ε (1)
where α0 –α10 are parameters to be estimated and ε is a random error term. Model 1a in Table III
is estimated at the country level, whereas Model 1b and 1c are estimated at the firm level. The
dependent variable is shares borrowed, which is the aggregate home market borrowing for all

17
the stocks from a given country on day t for country level regression. For firm level regressions
shares borrowed is the home market borrowing of a firm on day t. Please see the appendix for
other variable definitions and data sources.
[Insert Table III here]
Hereafter in this paper, we present standardized coefficient estimates to allow comparison
of the relative impact and importance of each determinant of short selling.5 The coefficient of
restriction is negative and significant in all three models, indicating that a higher level of
restriction is associated with a lower level of stock borrowing in the home country. These results
point to the effectiveness of short selling restrictions in curtailing borrowing activity in the home
country.
3. 2. Effect of home country short selling restrictions on short selling activity of ADRs in the
U.S.
In this section we test the regulatory reach hypothesis versus the regulatory arbitrage
hypothesis. We also test whether additional firm-specific fundamentals or country characteristics
weaken or strengthen regulatory reach. We estimate regressions based on all or a subset of the
following equation using short interest data from shortsqueeze.com:
5 We obtain these coefficients using the stb function of SAS. These coefficients are estimates when all variables in the model are standardized to zero mean and unit variance prior to performing the regression computations. Of course, the standardized intercept is 0.0000. The t-statistics for the standardized and unstandardized coefficients are the same.

18
short interest = α0 + α1 illegal/restriction + α2 enforcement index + α3 return
+ α4 market capitalization + α5 dividend yield + α6 level of ADR
+ α7 standard deviation of return + α8 lagged days to cover + α9 language
+ α10 distance from the U.S. + α11-14 industrial sector fixed effects + ε (2)
where α0 –α14 are parameters to be estimated and ε is a random error term. Please see the
appendix for variable definitions and data sources.
In Table IV, we present the results. The coefficient for illegal is significant and negative
in both Models 2a and 2b. If it is illegal to short sell the stock in the home country, short selling
activity is also reduced for that country’s ADRs in the U.S. These results support our regulatory
reach hypothesis. In the alternative specifications of Models 2c and 2d, the main explanatory
variable is restriction, which is a finer measure of illegality of short selling. The coefficient of
restriction is negative and significant in Model 2c and negative in Model 2d. The more
restrictions that a home country adds to the short selling, the less is the short selling of that
country’s ADRs in U.S.
[Insert Table IV here]
We control for the home country enforcement index. The enforcement index is
constructed based on the notion of an inverse relationship between enforcement and activity, i.e.,
the stricter the enforcement of restrictions the lower the observed short selling in the home
market. Technically, the index is defined as the yearly average of total short selling related
borrowing in the home country (in USD) scaled by total market capitalization of that country
during the previous year, multiplied by -1 to capture the inverse relationship. Furthermore, the
index is set to 0 for countries where it is legal to short sell because there is nothing to enforce in
those countries. The coefficient on the enforcement variable is negative and statistically
19
significant in Model 2a and 2b. This coefficient indicates that when there is stricter enforcement
of restrictions in the home country there is less shorting of the ADRs in the U.S. as well.
The coefficient of Return is not significant in all four Models. The positive and
significant coefficient of market capitalization in all four specifications indicates that total short
interest is higher for larger firms. The negative and significant coefficient for dividend yield
indicates that short sellers do not maintain high open interest in high dividend paying firms,
although they actively trade and borrow those stocks for trading. This implies that the likelihood
of short covering is higher for high dividend payers than for low dividend payers or non-payers.
We also include level of ADR as a control variable to see if short sellers are trading one level
more than another. We find the coefficient to be positive and significant, indicating more short
selling for higher level of ADRs. This increased trading interest may be due to the fact that
higher level ADRs implies increased compliance with the stricter U.S. listing standards.6 The
positive and significant coefficient of standard deviation of return indicates higher short-selling
for firms with higher dispersion of opinion. The positive and significant coefficient of lagged
days to cover indicates that traders are not anxious about the length of time that it might take to
cover the aggregate short positions outstanding. Instead, our findings demonstrate that traders
apply momentum strategies and short previously shorted stocks even more. The positive and
significant coefficient of language in Model 2a and 2c indicates higher short selling of ADRs
from countries where English is one the official languages. The negative and significant
coefficient of Distance from the U.S. in Model 2b and 2d indicates lower selling of ADRs from
6 J. P. Morgan dataset indicates whether the ADR is Level I, II, or III. To qualify for having a sponsored Level I ADR, a company’s shares must be traded on at least one foreign exchange and the firm must post an annual report in English on its web site, but the company is not required to meet U.S. accounting standards. To qualify for a Level II sponsored ADR, a firm must register with the SEC and comply with U.S. accounting standards. Firms meeting Level II standards can have their ADRs traded on a U.S. stock exchange. Firms wishing to raise capital in the U.S. from investors can do so through a Level III ADR program by meeting standards similar to those for U.S. companies.

20
countries that are farther from the U.S. These findings on language and distance from the U.S.
are consistent with Grinblatt and Keloharju (2001) and home bias literature.
All our regression results are robust to sector classification effects because we include
sector dummies obtained from DataStream. We also estimate these 4 regressions using daily
short volume data from FINRA for the period August 2009 to January 2010. Our results using
both fortnightly short interest and daily short volume data are qualitatively similar, which is not
surprising given the statistically significant positive correlation of 0.66 between these two
alternative dependent variables. We do not report the results of the short volume regression in the
tabular format for brevity. The coefficients for illegal/restriction with daily short volume as a
dependent variables are -0.0262, -0.0368, -0.0675 and -0.0057, for Models 2a to 2d, respectively.
The first three of these coefficients are significant at the 1% level. These results strongly support
the regulatory reach hypothesis.7 The short volume regressions with the after crisis period data
also support our argument that our results are not driven by the crisis period of 2008.
The negative coefficients on the illegal/restriction variables are robust to alternative
model specifications and sub-samples. We do not tabulate those results for brevity, but
summarize our findings in this paragraph. In this discussion of robustness tests, the benchmark
value for the coefficient of illegal is -0.0415 from Model 2a of Table IV. First, we use trading
volume instead of market capitalization to capture the size effects on the right hand side and
coefficient of illegal becomes -0.0121. Second, we estimate the regression using a smaller
sample of only level III ADRs, which have most stringent disclosure requirements, and the
coefficient of illegal becomes -0.0328. Fourth, we control for institutional ownership. After
adding institutional ownership in Model 2a the coefficient of illegal becomes -0. 0137, however,
7 Although, examination of Miller’s divergence of opinion hypothesis is beyond our scope, our results suggest that the issuance of ADRs in the U.S. is not sufficient to allow home countries to overcome the deleterious effects of short selling restrictions.
21
it is not statistically significant. We do not include this variable in our main regression because
we do not have observations for all the ADRs. All these coefficients are significant at the 1%
level unless otherwise stated. Thus, our results on regulatory reach are robust for different
specifications and sub-samples.
3. 3. Bi-directional regulatory reach in globally integrated markets
So far, we have focused on the effects and reach of home market restrictions. However,
the short selling regime in the U.S. itself has varied including (1) restrictions on downticks for
several decades, (2) unrestricted short selling allowed in 2007, (3) a complete ban on short
selling financial stocks in 2008, and (4) recent restrictions based on NBBO quotes. These
restrictions might well affect the short selling activity of underlying stocks that are also cross-
listed as ADRs. In this section, we test whether there is regulatory reach in this reverse direction,
i.e., we investigate the effects of short selling restriction in the U.S. on short selling and
borrowing activity in the home market. In this context, what matters is the relative strictness of
short selling regulations in the U.S. vis-à-vis the home country. Therefore, we create a dummy
variable high that equals to 1 if the restrictions on short selling are higher in the U.S. than those
in the home country. As an alternative, we form a detailed index of relative strictness defined as
the difference between U.S. restriction index and the home country restriction index. We also
create a dummy variable cross which equals to 1 for ADR issuing firms and 0 for the non issuing
firms. We estimate all or a subset of following regressions equation using the stock borrowing
Data Explorer data for sample of ADR issuing firm and non- issuing firm:
22
shares borrowed = α0 +α1 high *cross + α2 high * non cross
+α3 (US - home country) restriction *cross
+ α4 (US - home country) restriction * non cross +α5 return + α6 market capitalization
+ α7 dividend yield + α8 standard deviation of return + α9 VSA + α10 active agents
+ α11 language + α12 distance from the U.S. + α13-16 industrial sector fixed effects + ε
(3)
where α0–α16 are parameters to be estimated and ε is a random error term. Shares borrowed is the
total quantity of borrowed/loaned securities net of double counting from the Data Explorer
dataset. We take shares borrowed as our left hand side variable because it is a proxy for short
selling. Please see the appendix for definitions and data sources of other variables.
In Table V, we present our results, which are based on equation 3. In Models 3a and 3b,
our main independent variables are high*cross and high * non cross. We use these interactive
dummy variables to separate the effect of higher short selling restriction in the U.S. on the ADR
issuing firms and on matched similar firms. The coefficient of high * cross is negative and
significant in both specifications. This implies that when short selling restrictions in the U.S. are
higher than those in the home country, stock borrowing of ADR issuing firms declines in the
home country as well, consistent with our reverse reach hypothesis. The conduit for reverse
reach of U.S. regulations in reducing home market borrowing is the ADR listing in the U.S.
market. Thus, only the cross-listed stocks have a negative coefficient for the high restriction
variable. Stocks that are not cross-listed do not suffer from the negative consequences of high
U.S. restrictions and the coefficient for such stocks is positive. In Model 3c and 3d, we use
alternative interactive variables (US - home country) restriction *cross and (US - home country)
restriction * non cross. Our results are similar to Model 3a and 3b. Hence, U.S. short selling

23
restrictions have a reach in the home markets. Our results of regulatory reach in this section are
robust to including other control variables.
[Insert Table V here]
3. 4. Implication of regulatory reach
In this section, we test the effects of home country restrictions on the returns of ADR
portfolios. First, we divide our ADRs into two portfolios based on the legality of short selling in
the home country. Second, we use a double sort approach where after dividing the ADRs into
legality portfolios we further divide them into the short interest groups. This methodology is
based on Asquith, Pathak and Ritter (2005) who create portfolios based on short interest and
institutional ownership. We use an alternative measure of short selling constraint--restriction on
short selling in the home country. The strongest relation between short interest and abnormal
returns should exist for stocks that have large short positions combined with home country
restrictions on short selling. These are the stocks that are most likely to be short-sale constrained.
Asquith, Pathak and Ritter (2005) assume that short interest is a proxy for short sale demand and
that institutional ownership is a proxy for the supply of shares available to be shorted. The first
assumption is consistent with the finding in the literature that high short interest precedes
abnormal returns (see Asquith and Meulbroek, 1995; and Desai, Ramesh, Thiagarajan and
Balachandran, 2002). The second assumption is consistent with the assumption in the literature
that high institutional ownership prevents short-sale constraints, i.e., stocks with high
institutional ownership are readily available to borrow, and, hence, the stocks do not become
overpriced (see Chen, Hong and Stein, 2002; Nagel, 2005). We use legality as an alternative
measure of the short sell constraint and conjecture that it is a proxy for supply of shared available
24
to be shorted. Our prediction is that portfolios of ADRs with high short interest and from
countries with short selling restrictions, which are the most constrained, have the lowest
subsequent returns. The portfolio of ADRs with high short interest and no home-country
restrictions on short selling should be less constrained and should have normal or less negative
subsequent returns.
We estimate regressions using portfolios of 1,350 ADRs divided in three groups: illegal,
legal (with or without restrictions), and no restrictions. Legal (illegal) is the portfolio of ADRs
that are from the countries where it is legal (illegal) to short sell at time t. No restriction portfolio
is a subset of legal portfolio. This alternative specification excludes ADRs from countries that
impose partial restrictions on short selling. Thus, no restriction is portfolio of ADRs that are
from the countries where it is not only legal to short sell, but also there are no other restriction on
short selling such as a ban on naked short sell or an up-tick rule. We revise these classifications
at the end of each month to form rebalancing portfolios and look at their performance over the
next one month.
We follow Asquith, Pathak and Ritter (2005), and estimate the time series regressions
using the Fama-French four factor model for the period from 1980 -2010, at monthly frequency,
as follows:
rpt - rft = α + βm Mkt-RFt + βs SMBt + βh HMLt + βo MOMt + εpt (4)
where α0–α10 are parameters to be estimated and ε is a random error term. rpt-rft is the monthly
percentage returns calculated as the excess return over the risk-free rate on an equally weighted
portfolio. Our independent variables are Mkt-RF, SMB, HML, and MOM based on the U.S.
market. Mkt-RF is the realization of the market risk premium in the period. SMB is the return on
a portfolio of small stocks minus the return on a portfolio of big stocks. HML is the return on a
25
portfolio of high book-to-market (value) minus low book-to-market (growth) stocks. MOM is the
return on a portfolio of prior winners minus the return on a portfolio of prior losers. We obtain
monthly factor return realizations and risk free return from Kenneth French’s website.
[Insert Table VI here]
In Table VI we report the results from estimating equation 4. These results indicate that
as a result of regulatory reach constrained stocks underperform unconstrained stocks even
though the constraints may be imposed by the home market and ADRs may trade in the U.S.
market. Similar to Asquith, Pathak and Ritter (2005) we use the intercept as the measure of
portfolio monthly abnormal performance. We find that the intercept of illegal portfolios is more
negative compared to the intercept of legal and that of no restriction portfolio. These results
indicate that the portfolio of ADRs from the countries where it is illegal to short sell
underperforming portfolios of ADRs from the countries where it is legal to short sell.
Next, we contemplate the possibility that both short selling demand and short selling
restrictions may affect the price efficiency of stocks. To consider the demand side of short
selling, we double sort our data based on the short interest ratio and legality status. From the
shortsqueeze.com data for the period from November 2007 to October 2009, we calculate the
average short interest ratio of each ADR for each month. We merge this with the return data
from Datastream. Then we divide the ADRs into three groups: low, medium and high short
interest ratio. We revise this classification at the end of each month to form rebalancing
portfolios. We focus on the two extreme groups of low and high short interest. We then sub-
divide these short interest portfolios based on their legality status similar to that in Table VII, i.e.
legal, and illegal, and no restriction. We report the results of these double sort rebalanced
portfolios in Table VII.
26
[Insert Table VII here]
We find that the intercept, which is a measure of abnormal return, is most negative for the
portfolio where short interest is high and it is illegal to short sell in the home country. This
portfolio is the portfolio of ADRs that are most constrained. Within the short interest groups, our
results are similar to those reported in Table VI. Thus, the effects of short selling restrictions
reach far beyond the local jurisdictions as we show in the context of ADR’s mispricing. Such is
the power of regulatory reach.
4. Summary and conclusions
We provide the first comprehensive characterization of the world market for short selling
and stock borrowing using several datasets that capture short selling regulations, actual short
selling activity, and outstanding short interest in stocks from 82 countries.
The theme of our paper is the effectiveness and reach of short selling regulation in a
multimarket environment. We address three related research questions:
First, are restrictions on short selling in a given country effective in reducing short selling
related borrowing? Many previous papers have looked at the effect of short selling restrictions on
the market quality, but none examine whether the restrictions are actually effective in curtailing
short selling. We perform the first test of the efficacy of these regulations using both country
level and stock level data and find that short selling regulations are actually effective in reducing
short selling related borrowing in the home country.
Second, we examine whether home country restrictions on short selling reduce ADR’s
short selling in the U.S., which we call the regulatory reach hypothesis. Alternatively, the
competing hypothesis of regulatory arbitrage takes the view that if short selling is illegal in a
27
country that is home to ADRs underlying shares there is greater short selling of the ADRs in the
U.S. due to efforts to circumvent the home country regulations. Using two years of fortnightly
short interest data for 1,307 ADRs, we find support for the regulatory reach hypothesis in both
cross-sectional and panel-data tests. Thus, government power outweighs the ability or
willingness of global traders to benefit from regulatory arbitrage. Our results of regulatory
reach are robust to the inclusion of a home country enforcement index as a control variable.
This finding leads us to an examination of factors that strengthen or weaken regulatory
reach. We find that good enforcement of short selling regulations in the home country and a
country’s distance from the U.S. decreases short selling in the U.S. and strengthen regulatory
reach. In contrast, factors that increase the incentives and profitability of short trades weaken
regulatory reach and increase the ADR short selling. We indentify, firm size, ADR level,
standard deviation of return, language similarity, and higher institutional ownership as such
factors.
Third, do short selling restrictions in the U.S. affect short selling related borrowing in the
home country of a stock? We test this aspect of regulatory reach using home market daily stock
borrowing data of ADR issuers and a matched sample of non- issuers. In this matched control
sample experiment, we find that when short selling restrictions in the U.S. are higher than those
in the home country, stock borrowing in the home country declines. These results are consistent
with bi-directional regulatory reach. Univariate comparison, a matched control sample
experiment, multivariate regressions, and an event study, all consistently point to both regulatory
reach and ADR listing effects. Our results are robust to differences in firm specific
characteristics, such as past returns, firm size, dividend yield, standard deviation of return,
28
borrowing costs, and industrial sectors and to differences in home country characteristics such as
languages and distance from the U.S.
Finally, we look at the implications of regulatory reach in terms of the returns of ADRs
under a constrained and non-constrained short selling environment in the home country. We use
the Fama-French four factor regression model. We find that portfolios of ADRs that are from
countries where it is illegal to short sell underperform the portfolio of ADRs from the countries
where it is legal to short sell or where there are no restrictions on short selling. Using a double
sort based on short interest and legality status, we find similar results overall and within the short
interest groups. The portfolio of ADRs that have higher short interest and that are from the
countries where it is illegal to short sell underperform the most. These results extend the results
of the existing literature by showing that short-selling-constrained stocks underperform non-
constrained stocks even though the restrictions may be imposed in home country and stocks trade
in both the home country and an external market in the form of ADRs. Thus, regulatory reach
has important valuation implications.
In summary, our paper contributes to the short selling and cross listing literature with
four main findings. First, restrictions on short selling in a given country are effective in reducing
short selling related borrowing in that country. Second, from investors’ point of view, cross
listing in the U.S. is not a vehicle for circumventing the regulatory control on short selling in the
home country. Regulatory controls in the home country also stifle short selling in ADRs. Third,
reach also works in the reverse direction, i.e., short selling restrictions in the U.S. reduce short
selling related borrowing in the home country. Finally, the valuation implication of regulatory
reach is that short selling constrained portfolios of ADRs underperform the short selling
unconstrained portfolio of ADRs.

29
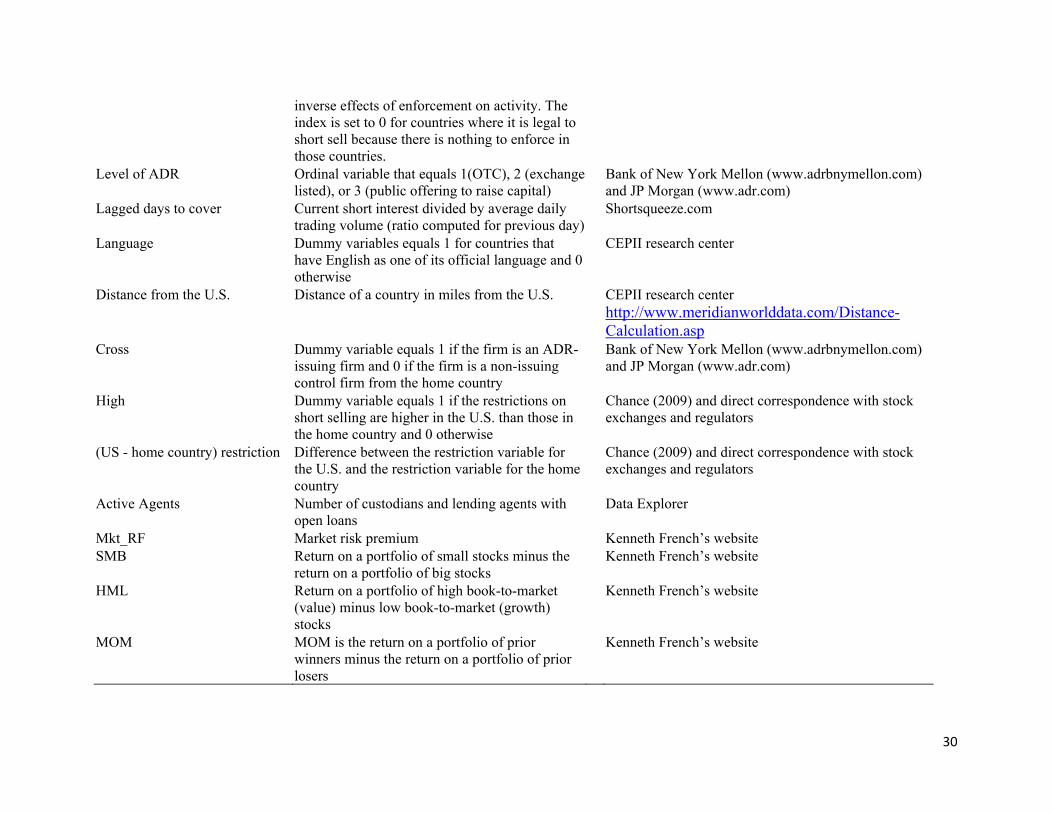
Appendix Variables definitions and data sources
In this table, we provide the definition and data sources for all the variables that are used in this paper. Variable Definition Source Shares borrowed Total quantity of borrowed/loaned securities net
of double counting Data Explorer
Total short interest Total number of outstanding shorted shares for each ADR for each fortnight
Shortsqueeze.com
Short volume Aggregate number of shares sold short each day Reg SHO data from FINRA Return Log (Return indext)-log(Return indext-1) Datastream International Illegal Indicator variable that has value of 0 when short
selling is banned in the home country and 1 when short selling is allowed
Bris, Goetzmann and Zhu (2007), Charoenrook and Daouk (2008), Chance (2009), and for time series Beber and Pagano (2010) and direct correspondence with stock exchanges and regulators
Restriction Ranges from 0 to 3 where a higher number means more restrictions on short selling in a country, such as prohibition on naked short selling, an up-tick rule, or a total ban on short selling.
Chance (2009) and direct correspondence with stock exchanges and regulators
Market capitalization A firm’s share price multiplied by the number of ordinary shares outstanding in millions of USD
Datastream International
Dividend yield Dividend per share as a percentage of the firm’s share price
Datastream International
Standard deviation of return Standard deviation of daily returns during the previous month.
Datastream International
VSA Value weighted average fee for all open loans expressed in undisclosed fee buckets 0-5 ( 0 indicates the cheapest to borrow)
Data Explorer
Sector Dummy variables for Industrial, Utility, Transportation, Financial and Insurance industrial sectors
Datastream International
Enforcement index Yearly average of total short selling related borrowing in a country (in USD) scaled by total market capitalization of that country during the previous year multiplied by -1to capture the
Borrowing from Data Explorer and market capitalization from World Bank website
30
inverse effects of enforcement on activity. The index is set to 0 for countries where it is legal to short sell because there is nothing to enforce in those countries.
Level of ADR Ordinal variable that equals 1(OTC), 2 (exchange listed), or 3 (public offering to raise capital)
Bank of New York Mellon (www.adrbnymellon.com) and JP Morgan (www.adr.com)
Lagged days to cover Current short interest divided by average daily trading volume (ratio computed for previous day)
Shortsqueeze.com
Language Dummy variables equals 1 for countries that have English as one of its official language and 0 otherwise
CEPII research center
Distance from the U.S. Distance of a country in miles from the U.S. CEPII research center http://www.meridianworlddata.com/Distance-Calculation.asp
Cross Dummy variable equals 1 if the firm is an ADR-issuing firm and 0 if the firm is a non-issuing control firm from the home country
Bank of New York Mellon (www.adrbnymellon.com) and JP Morgan (www.adr.com)
High Dummy variable equals 1 if the restrictions on short selling are higher in the U.S. than those in the home country and 0 otherwise
Chance (2009) and direct correspondence with stock exchanges and regulators
(US - home country) restriction Difference between the restriction variable for the U.S. and the restriction variable for the home country
Chance (2009) and direct correspondence with stock exchanges and regulators
Active Agents Number of custodians and lending agents with open loans
Data Explorer
Mkt_RF Market risk premium Kenneth French’s website SMB Return on a portfolio of small stocks minus the
return on a portfolio of big stocks Kenneth French’s website
HML Return on a portfolio of high book-to-market (value) minus low book-to-market (growth) stocks
Kenneth French’s website
MOM MOM is the return on a portfolio of prior winners minus the return on a portfolio of prior losers
Kenneth French’s website
31
References Asquith, Paul, Meulbroek, Lisa, 1995. An empirical investigation of short interest. Working
paper, M.I.T. Asquith, Paul, Pathak, Parag, A., Ritter, Jay, R., 2005. Short interest, institutional ownership,
and stock returns. Journal of Financial Economics 78, 243-276. Beber, Alessandro, Pagano Marco, 2010. Short selling bans around the world: evidence from
2007-2009 crisis. Working paper, Centre for Studies in Economics and Finance. Biais, Bruno, 1993, Price formation and equilibrium liquidity in fragmented and centralized
markets, Journal of Finance 48, 157–185. Blau, Benjamin. M., Van Ness, Bonnie F., Van Ness, Robert A., Wood, Robert A., 2010. Short
selling during extreme market movements. Journal of Trading 54, 14-27. Block, Ludo, 2007. International Policing in Russia: Police Cooperation between the European
Union Member States and the Russian Federation. Policing and Society 17. Boehmer, Ekkehart, Jones, Charles M., Zhang, Xiaoyan, 2008. Which shorts are informed?
Journal of Finance63, 491-527. Boehmer, Ekkehart, Jones, Charles M., Zhang, Xiaoyan, 2009. Shackling the Short Sellers: The
2008 Shorting Ban. Working Paper, Cornell University, Ithaca, New York. Bris, Arturo, Goetzmann, William N., Zhu, Ning, 2007. Efficiency and the bear: short sales and
markets around the world. Journal of Finance 62, 1029-1079. Chang, Eric C., Cheng, Joseph W., Yu, Yinghui, 2007. Short-sales constraints and price
discovery: evidence from the Hong Kong market. Journal of Finance 62, 2097-2121. Charoenrook, Anchanda, Daouk, Hazem, 2008. A study of market wide short selling restrictions.
Working Paper, Vanderbilt University and Cornell University. Chen, Joseph, Hong, Harrison, Stein, Jeremy C., 2002. Breadth of ownership and stock returns.
Journal of Financial Economics 66, 171–205. Clifford Chance LLP, 2009. Short selling rules: the global picture. http://ca.
linexlegal.com/transit.php?content_id=94994 D’Avolio, Gene, 2002. The market for borrowing stock. Journal of Financial Economics 66,
271-306.
32
Desai, Hemang, Ramesh, K., Thiagarajan, Ramu S., Balachandran, Bala V., 2002. An investigation of the informational role of short interest in the Nasdaq market. Journal of Finance 57, 2263–2287.
Diether, Karl B., Lee, Kuan-Hui, Werner, Ingrid M., 2009. Short sale strategies and return
predictability. Review of Financial Studies 22, 575-607. Edwards, Amy K., Hanley, Kathleen Weiss, 2010. Short selling in initial public offerings,
Journal of Financial Economics, forthcoming. Errunza, Vihang R., Miller, Darius P., 2000. Market segmentation and the cost of capital in
international equity markets. Journal of Financial and Quantitative Analysis35, 577-600. Evans, Richard C., Geczy, Christopher C., Musto, David K., Reed, Adam V., 2009. Failure is an
option: Impediments to short selling and Options Prices. Review of Financial Studies, 22, 1955-1980.
Faulkner, Mark C., 2008. Assessing the real impact of securities lending on the corporate
governance landscape. Journal of Securities Operations & Custody, 1, 233-249. Flatley, Robert, 2009. The impact of the ban on short-selling. Journal of Trading, 4, 24-32. Foerster, Stephen R., Karolyi, George A., 1999. The effects of market segmentation and investor
recognition on asset prices: Evidence from foreign stocks listing in the United States. Journal of Finance, 54, 981-1013.
Grinblatt, Mark, Keloharju, Matti, 2001. How distance, language and culture influences
stockholdings and trades. Journal of Finance, 56, 1053-1073. Hamilton, James, 2008. Market Crisis Focus on Short Selling: SEC Adopts Rules to Curb
Abusive Practices. Woltesr Kluwer Law &Business, White paper, http://www. cch.com/Press/news/CCHWhitePaper_MarketCrisis.pdf
Jones, Charles M., Lamont, Owen A., 2002. Short sale constraints and stock returns. Journal of Financial Economies 66, 207-239.
Kim, Minho, Szakmary, Andrew C., Mathur, Ike, 2000. Price transmission dynamics between
ADRs and their underlying foreign securities. Journal of Banking & Finance, 24, 1359-1382. Kolasinksi, Adam C., Reed, Adam V., Thornock, Jacob R., 2009. Prohibitions versus
Constraints: The 2008 Short Sales Regulations. Working Paper, University of Washington, Seattle, Washington and University of North Carolina, Chapel Hill, North Carolina.
Lau, Sie Ting, McInish, Thomas H., 2002. Cross-listing and home market Trading Volume; the
case of Malaysia and Singapore. Journal of Financial Research, 25, 477-484. Madhavan, A., 1995, Consolidation, fragmentation, and the disclosure of trading information,
Review of Financial Studies 8, 579–603.

33
Miller, Edward M., 1977. Risk, uncertainty, and divergence of opinion. Journal of Finance 32,
1151-1168. Nagel, Stefan, 2005. Short sales, institutional investors, and the cross-section of stock returns.
Journal of Financial Economics 78, 277-309. Nilsson, Roland, 2008. The value of shorting. Journal of Banking and Finance, 32, 880-891. Prado, Melissa Porras, Brounen, Dirk, Verbeek, Marno, 2009. Short Sales, short sale constraints
and fundamental value. Working paper, RSM Erasmus University. Shkilko, Andriy V., Van Ness, Bonnie F., Van Ness, Robert A., 2008. Aggressive Short Selling
and Price Reversals. Working paper, Wilfrid Laurier University, University of Mississippi. Presented at AFA 2008.
Yin, Xiaoke, 2005. A comparison of centralized and fragmented markets with costly search.
Journal of Finance 60, 1567- 1590.

34
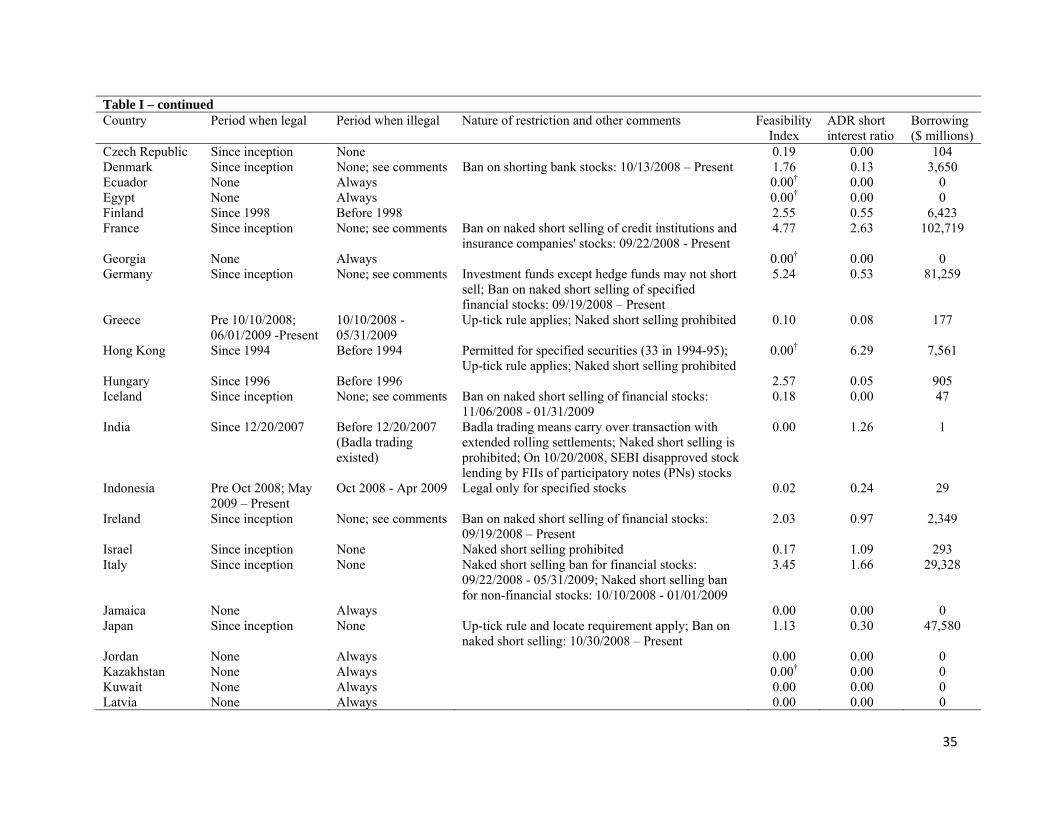
Table I Global shifts in short selling regulations, feasibility, and activity
We provide a history of the legality of short selling around the world, including the dates of bans implemented during the recent financial crisis. We also provide details both of borrowing in the home country and short selling of ADRs in the United States. In columns 2 and 3, we report the periods when short selling was legal or illegal in a particular country. For these two columns, we classify the period as illegal based on a total ban. None, always, and since inception in these two columns refer to periods within our sample period. In column 4, we report other restrictions on short selling when it is not completely banned. In column 5, we present a feasibility index, which is calculated as the total borrowing volume for all of the stocks in a country (in USD) during our sample period (July 2006 to January 2010) divided by the country’s average market capitalization (for the years 2005 to year 2009). In column 6, the ADR short interest ratio is calculated as short interest divided by share float. In column 7, we report average outstanding shares borrowed.
Country Period when legal Period when illegal Nature of restriction and other comments Global Feasibility
Index
ADR Short interest ratio
Borrowing ($ millions)
Argentina Since 1999 Before 1999 Up-tick rule applies; Naked short selling prohibited 0.00 0.86 0 Australia Pre 09/22/2008;
11/20/2008 - Present 09/22/2008 - 11/19/2008
Naked short selling prohibited since 2001 Ban on shorting financial stock: 09/22/2008 - 05/25/2009
3.04 0.35 30,258
Austria Since inception None Ban on naked short selling of financial stocks: 10/27/2008 - 11/30/2010
2.43 0.00 3,777
Bahrain None Always 0.00 0.00 0 Bangladesh None Always 0.00† 0.00 0 Barbados None Always 0.00 0.00 0 Belgium Since inception None Ban on naked short selling of financial stocks:
9/22/2008 - 9/21/2009 2.17 0.52 6,720
Bermuda None Always NA 0.00 8,985 Brazil Since inception None Naked short selling prohibited 0.00 10.03 22 Bulgaria None Always 0.00 0.00 0 Canada Since inception None; see comments Ban on shorting financial stocks (including inter-
listed in U.S): 09/19/2008 - 10/08/2008; Up-tick rule applies
3.63 0.00 58,183
Cayman Islands Since inception None Very little trading occurs on the stock exchange NA 6.71 4,395 Chile Since 1999 Before 1999 Up-tick rule applies; Naked short selling prohibited 0.00 0.36 0 China None Always; see
comments In Sep2008, China allowed short selling of 11 brokerage firms on a pilot basis
0.28 0.87 9,440
Colombia None Always 0.00 0.74 0 Croatia None Always 0.00 0.00 0 Cyprus None Always 1.09 0.00 173
35
Table I – continued Country Period when legal Period when illegal Nature of restriction and other comments Feasibility
Index ADR short interest ratio
Borrowing ($ millions)
Czech Republic Since inception None 0.19 0.00 104 Denmark Since inception None; see comments Ban on shorting bank stocks: 10/13/2008 – Present 1.76 0.13 3,650 Ecuador None Always 0.00† 0.00 0 Egypt None Always 0.00† 0.00 0 Finland Since 1998 Before 1998 2.55 0.55 6,423 France Since inception None; see comments Ban on naked short selling of credit institutions and
insurance companies' stocks: 09/22/2008 - Present 4.77 2.63 102,719
Georgia None Always 0.00† 0.00 0 Germany Since inception None; see comments Investment funds except hedge funds may not short
sell; Ban on naked short selling of specified financial stocks: 09/19/2008 – Present
5.24 0.53 81,259
Greece Pre 10/10/2008; 06/01/2009 -Present
10/10/2008 - 05/31/2009
Up-tick rule applies; Naked short selling prohibited 0.10 0.08 177
Hong Kong Since 1994 Before 1994 Permitted for specified securities (33 in 1994-95); Up-tick rule applies; Naked short selling prohibited
0.00† 6.29 7,561
Hungary Since 1996 Before 1996 2.57 0.05 905 Iceland Since inception None; see comments Ban on naked short selling of financial stocks:
11/06/2008 - 01/31/2009 0.18 0.00 47
India Since 12/20/2007 Before 12/20/2007 (Badla trading existed)
Badla trading means carry over transaction with extended rolling settlements; Naked short selling is prohibited; On 10/20/2008, SEBI disapproved stock lending by FIIs of participatory notes (PNs) stocks
0.00 1.26 1
Indonesia Pre Oct 2008; May 2009 – Present
Oct 2008 - Apr 2009 Legal only for specified stocks 0.02 0.24 29
Ireland Since inception None; see comments Ban on naked short selling of financial stocks: 09/19/2008 – Present
2.03 0.97 2,349
Israel Since inception None Naked short selling prohibited 0.17 1.09 293 Italy Since inception None Naked short selling ban for financial stocks:
09/22/2008 - 05/31/2009; Naked short selling ban for non-financial stocks: 10/10/2008 - 01/01/2009
3.45 1.66 29,328
Jamaica None Always 0.00 0.00 0 Japan Since inception None Up-tick rule and locate requirement apply; Ban on
naked short selling: 10/30/2008 – Present 1.13 0.30 47,580
Jordan None Always 0.00 0.00 0 Kazakhstan None Always 0.00† 0.00 0 Kuwait None Always 0.00 0.00 0 Latvia None Always 0.00 0.00 0
36
Table I – continued Country Period when legal Period when illegal Nature of restriction and other comments Feasibility
Index ADR Short interest ratio
Borrowing ($ millions)
Lebanon None Always 0.00† 0.00 0 Lithuania None Always 0.00 0.00 0 Luxembourg Since inception None Ban on naked short selling of banks and insurance
companies: 09/19/2008 – Present 5.29 3.19 5,100
Malaysia Pre 1997; Jan 2007 – Present
Sep 1997 to Dec 2006
Naked short selling prohibited; Uptick rule applies; Legal only for specified stocks
0.00 0.00 5
Malta None Always 0.00† 0.00 0 Mauritius None Always 0.57 0.00 23 Mexico Since inception None Naked short selling prohibited; Up-tick rule applies 0.33 1.33 1,043 Morocco None Always 0.06 0.00 35 Netherlands Since inception None Naked short selling ban: 09/22/2008 - 06/01/2009 2.69 0.92 18,453 New Zealand Since 1992 Before 1992 Since Apr 1992, specified securities eligible for
short selling; After Jul 2000, all liquid securities eligible. Short selling is hindered by tax legislation.
1.91 0.09 760
Nigeria None Always 0.00 0.00 0 Norway Since 1992 None; see comments Ban on naked short selling of 5 specified financial
stocks: 10/08/2008 - Present 2.38 0.32 5,803
Oman None Always 0.00† 0.00 0 Pakistan Since inception None "Regulations for Short Selling under Ready
Market" introduced in 2002: Naked short selling is prohibited; Up-tick rule applies; Short selling allowed only in prescribed securities
0.00 0.00 0
Panama None Always 15.84 0.00 959 Peru None Always 0.00 0.96 0 Philippines Since 1998 Before 1998 Naked short selling prohibited; Up-tick rule applies;
Legal only for specified stocks 0.01 0.31 6
Poland Since 2000 Before 2000 Shorting allowed only in the permitted securities 0.03 0.00 41 Portugal Since inception None Ban on naked short selling of specified financial
stocks: 09/24/2008 - Present 1.43 0.03 1,384
Qatar Since inception None 0.00† 0.00 0 Russia Pre 09/18/2008; and
06/16/2009 -Present 09/18/2008 - 06/15/2009
Up-tick rule applies 0.00† 1.47 73
Serbia None Always 0.00 0.00 0 Singapore Since inception None Ban on naked short sales in buy-in market. Onshore
lending is limited while offshore lending is active 1.22 0.07 3,359
Slovakia None Always 0.00† 0.00 0 Slovenia Since inception None 0.00 0.00 0
37
Table I – continued Country Period when legal Period when illegal Nature of restriction and other comments Feasibility
Index ADR Short interest ratio
Borrowing ($ millions)
South Africa Since inception None Naked short selling prohibited 0.34 1.02 2,259 South Korea Sep 1996 to
09/30/2008; and 06/01/2009 -Present
Before 1996; 10/01/2008 - 05/31/2009
Ban on shorting financial stocks: 10/1/2008 – Present; Naked short selling ban from June 2000 to Present; Up-tick rule applies
0.00† 0.76 3,633
Spain Since 1992 Before 1992 Naked short selling prohibited 2.34 0.09 30,330 Sri Lanka None Always 0.00 0.00 0 Sweden Since 1991 Before 1991 2.37 1.39 11,065 Switzerland Since inception None; see comments 09/19/2008 - 01/16/2009: Swiss Federal Banking
Commission and SIX Swiss Exchange prohibited naked short selling; SWX-Europe also prohibited creation or increase of a net short position in certain specified UK and Swiss financial stocks
2.84 0.92 30,949
Taiwan Pre 10/01/2008; 11/28/2008 - Present
10/01/2008 - 11/28/2008
Up-tick rule applies 0.00† 0.76 301
Thailand Since Jan 2001 Before Jan 2001 Only specified securities are eligible (underlying securities of SET 50 index, ETF, and underlying securities of ETF); Up-tick rule applies; Naked short selling prohibited
0.27 0.00 390
Tunisia None Always 0.00† 0.00 0 Turkey Since inception None Up-tick rule applies; Only specified stocks eligible 0.26 0.38 481 Ukraine None Always 0.00 0.00 0 UAE None Always 0.01 0.00 9 United Kingdom Since inception None; see comments Ban on short selling of specified financial stocks:
09/19/2008 - 01/16/2009 2.33 0.55 73,044
United States Since inception None; see comments Up-tick rule effective: 02/01/1938 - 07/03/2007; Ban on naked short selling of 19 financial stocks: 07/21/2008 - 08/12/2008; Ban on short selling of specified financial stocks: 09/19/2008 - 10/08/2008; Quote based restrictions imposed in 2010.
3.01 0.00 510,764
Venezuela None Always 0.00† 0.00 3 Zambia None Always 0.00 0.00 0 Zimbabwe None Always 0.00 0.00 0
† These countries do not have any local home market borrowing.
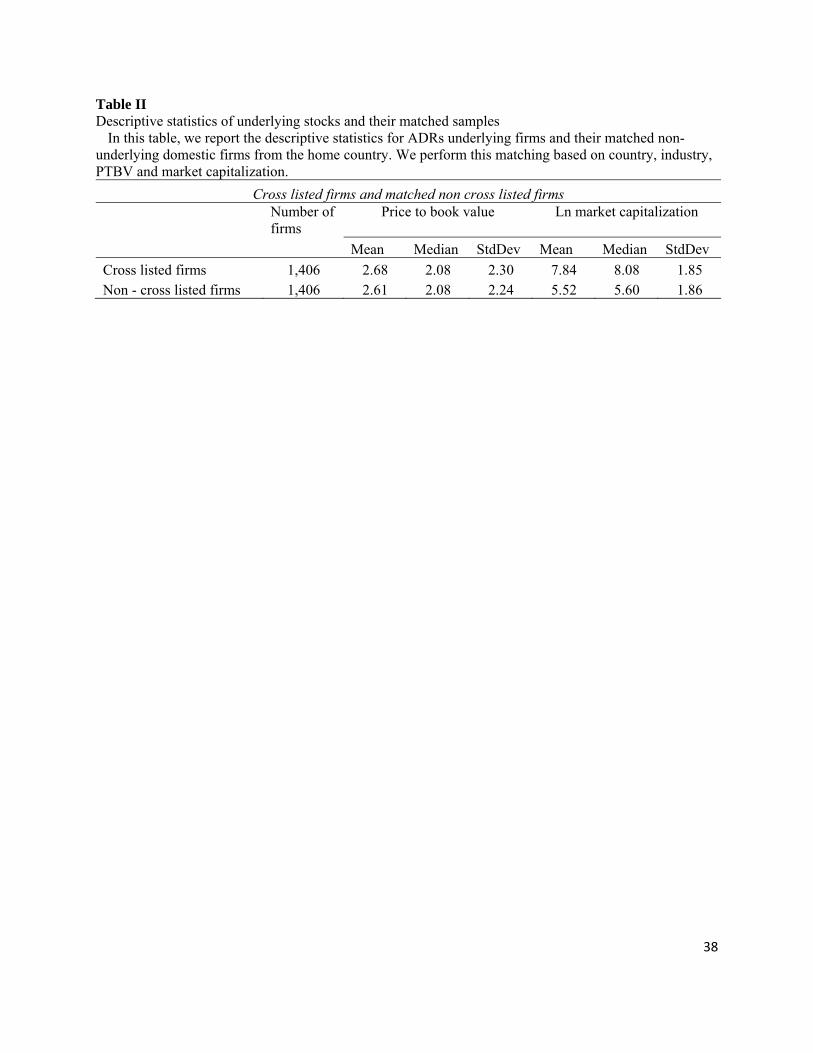
38
Table II Descriptive statistics of underlying stocks and their matched samples
In this table, we report the descriptive statistics for ADRs underlying firms and their matched non-underlying domestic firms from the home country. We perform this matching based on country, industry, PTBV and market capitalization.
Cross listed firms and matched non cross listed firms Number of firms
Price to book value Ln market capitalization
Mean Median StdDev Mean Median StdDev Cross listed firms 1,406 2.68 2.08 2.30 7.84 8.08 1.85 Non - cross listed firms 1,406 2.61 2.08 2.24 5.52 5.60 1.86
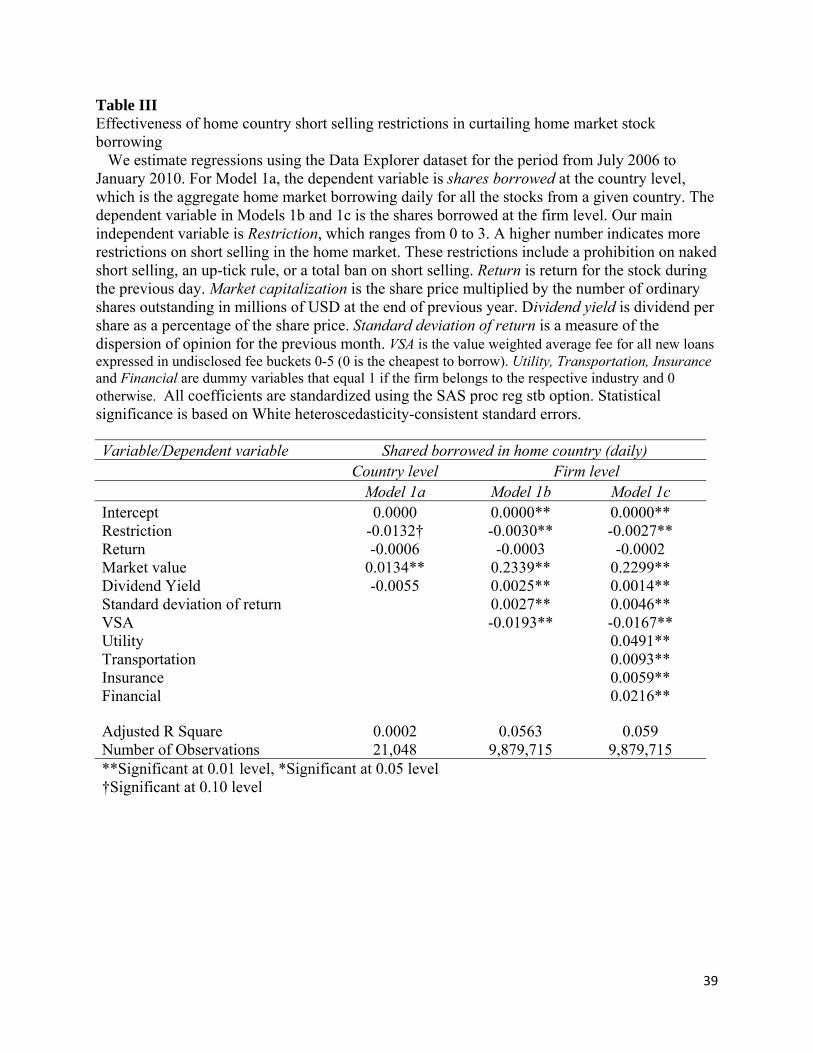
39
Table III Effectiveness of home country short selling restrictions in curtailing home market stock borrowing
We estimate regressions using the Data Explorer dataset for the period from July 2006 to January 2010. For Model 1a, the dependent variable is shares borrowed at the country level, which is the aggregate home market borrowing daily for all the stocks from a given country. The dependent variable in Models 1b and 1c is the shares borrowed at the firm level. Our main independent variable is Restriction, which ranges from 0 to 3. A higher number indicates more restrictions on short selling in the home market. These restrictions include a prohibition on naked short selling, an up-tick rule, or a total ban on short selling. Return is return for the stock during the previous day. Market capitalization is the share price multiplied by the number of ordinary shares outstanding in millions of USD at the end of previous year. Dividend yield is dividend per share as a percentage of the share price. Standard deviation of return is a measure of the dispersion of opinion for the previous month. VSA is the value weighted average fee for all new loans expressed in undisclosed fee buckets 0-5 (0 is the cheapest to borrow). Utility, Transportation, Insurance and Financial are dummy variables that equal 1 if the firm belongs to the respective industry and 0 otherwise. All coefficients are standardized using the SAS proc reg stb option. Statistical significance is based on White heteroscedasticity-consistent standard errors. Variable/Dependent variable Shared borrowed in home country (daily) Country level Firm level
Model 1a Model 1b Model 1c Intercept 0.0000 0.0000** 0.0000** Restriction -0.0132† -0.0030** -0.0027** Return -0.0006 -0.0003 -0.0002 Market value 0.0134** 0.2339** 0.2299** Dividend Yield -0.0055 0.0025** 0.0014** Standard deviation of return 0.0027** 0.0046** VSA -0.0193** -0.0167** Utility 0.0491** Transportation 0.0093** Insurance 0.0059** Financial 0.0216**
Adjusted R Square 0.0002 0.0563 0.059 Number of Observations 21,048 9,879,715 9,879,715 **Significant at 0.01 level, *Significant at 0.05 level †Significant at 0.10 level
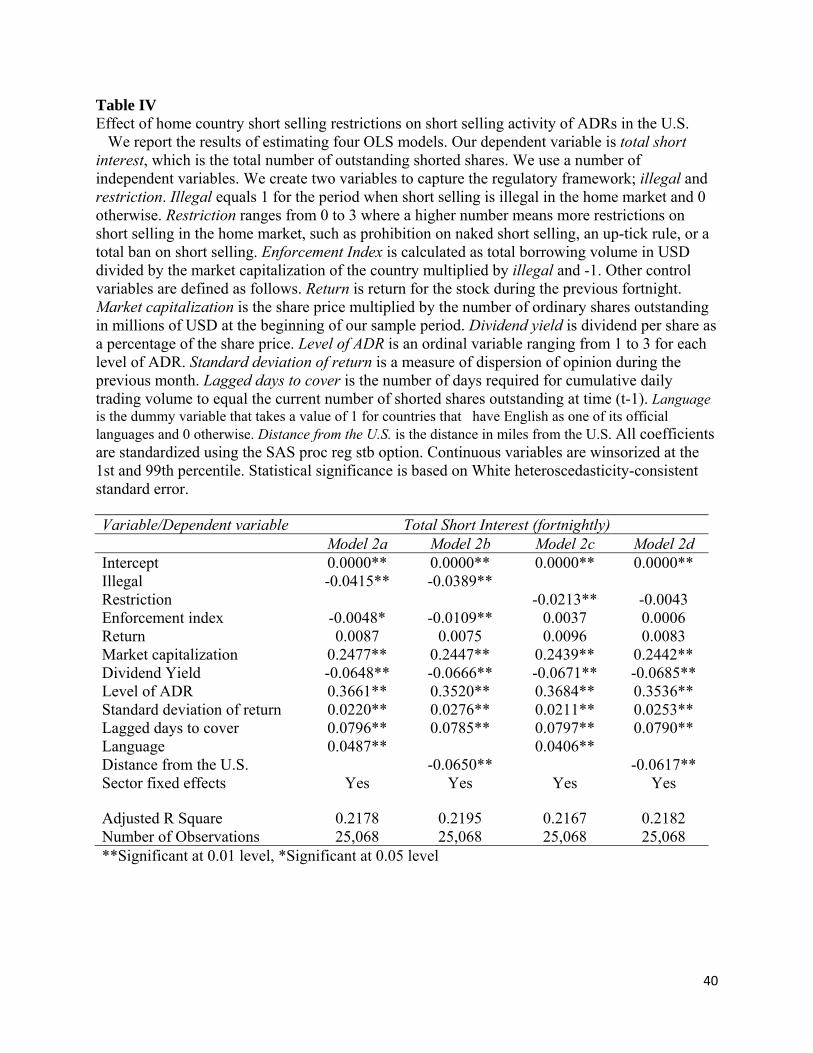
40
Table IV Effect of home country short selling restrictions on short selling activity of ADRs in the U.S.
We report the results of estimating four OLS models. Our dependent variable is total short interest, which is the total number of outstanding shorted shares. We use a number of independent variables. We create two variables to capture the regulatory framework; illegal and restriction. Illegal equals 1 for the period when short selling is illegal in the home market and 0 otherwise. Restriction ranges from 0 to 3 where a higher number means more restrictions on short selling in the home market, such as prohibition on naked short selling, an up-tick rule, or a total ban on short selling. Enforcement Index is calculated as total borrowing volume in USD divided by the market capitalization of the country multiplied by illegal and -1. Other control variables are defined as follows. Return is return for the stock during the previous fortnight. Market capitalization is the share price multiplied by the number of ordinary shares outstanding in millions of USD at the beginning of our sample period. Dividend yield is dividend per share as a percentage of the share price. Level of ADR is an ordinal variable ranging from 1 to 3 for each level of ADR. Standard deviation of return is a measure of dispersion of opinion during the previous month. Lagged days to cover is the number of days required for cumulative daily trading volume to equal the current number of shorted shares outstanding at time (t-1). Language is the dummy variable that takes a value of 1 for countries that have English as one of its official languages and 0 otherwise. Distance from the U.S. is the distance in miles from the U.S. All coefficients are standardized using the SAS proc reg stb option. Continuous variables are winsorized at the 1st and 99th percentile. Statistical significance is based on White heteroscedasticity-consistent standard error. Variable/Dependent variable Total Short Interest (fortnightly) Model 2a Model 2b Model 2c Model 2d Intercept 0.0000** 0.0000** 0.0000** 0.0000** Illegal -0.0415** -0.0389** Restriction -0.0213** -0.0043 Enforcement index -0.0048* -0.0109** 0.0037 0.0006 Return 0.0087 0.0075 0.0096 0.0083 Market capitalization 0.2477** 0.2447** 0.2439** 0.2442** Dividend Yield -0.0648** -0.0666** -0.0671** -0.0685** Level of ADR 0.3661** 0.3520** 0.3684** 0.3536** Standard deviation of return 0.0220** 0.0276** 0.0211** 0.0253** Lagged days to cover 0.0796** 0.0785** 0.0797** 0.0790** Language 0.0487** 0.0406** Distance from the U.S. -0.0650** -0.0617** Sector fixed effects Yes Yes Yes Yes
Adjusted R Square 0.2178 0.2195 0.2167 0.2182 Number of Observations 25,068 25,068 25,068 25,068 **Significant at 0.01 level, *Significant at 0.05 level
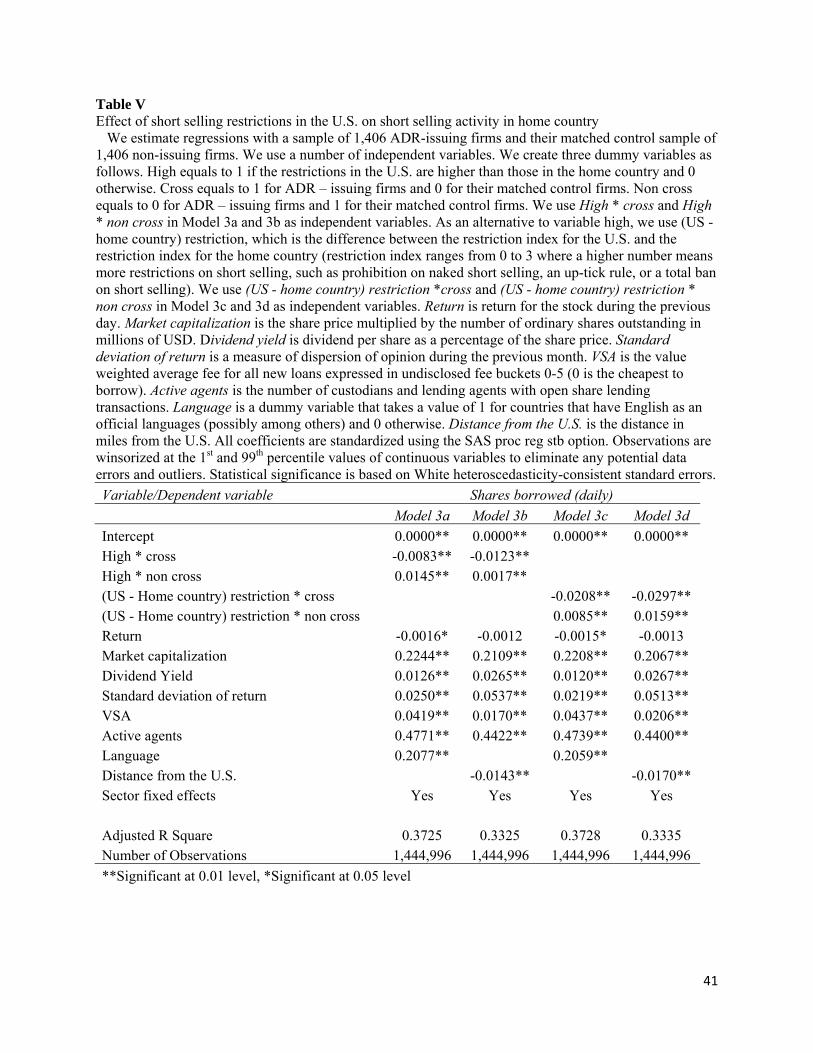
41
Table V Effect of short selling restrictions in the U.S. on short selling activity in home country We estimate regressions with a sample of 1,406 ADR-issuing firms and their matched control sample of 1,406 non-issuing firms. We use a number of independent variables. We create three dummy variables as follows. High equals to 1 if the restrictions in the U.S. are higher than those in the home country and 0 otherwise. Cross equals to 1 for ADR – issuing firms and 0 for their matched control firms. Non cross equals to 0 for ADR – issuing firms and 1 for their matched control firms. We use High * cross and High * non cross in Model 3a and 3b as independent variables. As an alternative to variable high, we use (US - home country) restriction, which is the difference between the restriction index for the U.S. and the restriction index for the home country (restriction index ranges from 0 to 3 where a higher number means more restrictions on short selling, such as prohibition on naked short selling, an up-tick rule, or a total ban on short selling). We use (US - home country) restriction *cross and (US - home country) restriction * non cross in Model 3c and 3d as independent variables. Return is return for the stock during the previous day. Market capitalization is the share price multiplied by the number of ordinary shares outstanding in millions of USD. Dividend yield is dividend per share as a percentage of the share price. Standard deviation of return is a measure of dispersion of opinion during the previous month. VSA is the value weighted average fee for all new loans expressed in undisclosed fee buckets 0-5 (0 is the cheapest to borrow). Active agents is the number of custodians and lending agents with open share lending transactions. Language is a dummy variable that takes a value of 1 for countries that have English as an official languages (possibly among others) and 0 otherwise. Distance from the U.S. is the distance in miles from the U.S. All coefficients are standardized using the SAS proc reg stb option. Observations are winsorized at the 1st and 99th percentile values of continuous variables to eliminate any potential data errors and outliers. Statistical significance is based on White heteroscedasticity-consistent standard errors. Variable/Dependent variable Shares borrowed (daily) Model 3a Model 3b Model 3c Model 3d Intercept 0.0000** 0.0000** 0.0000** 0.0000** High * cross -0.0083** -0.0123** High * non cross 0.0145** 0.0017** (US - Home country) restriction * cross -0.0208** -0.0297** (US - Home country) restriction * non cross 0.0085** 0.0159** Return -0.0016* -0.0012 -0.0015* -0.0013 Market capitalization 0.2244** 0.2109** 0.2208** 0.2067** Dividend Yield 0.0126** 0.0265** 0.0120** 0.0267** Standard deviation of return 0.0250** 0.0537** 0.0219** 0.0513** VSA 0.0419** 0.0170** 0.0437** 0.0206** Active agents 0.4771** 0.4422** 0.4739** 0.4400** Language 0.2077** 0.2059** Distance from the U.S. -0.0143** -0.0170** Sector fixed effects Yes Yes Yes Yes
Adjusted R Square 0.3725 0.3325 0.3728 0.3335 Number of Observations 1,444,996 1,444,996 1,444,996 1,444,996 **Significant at 0.01 level, *Significant at 0.05 level
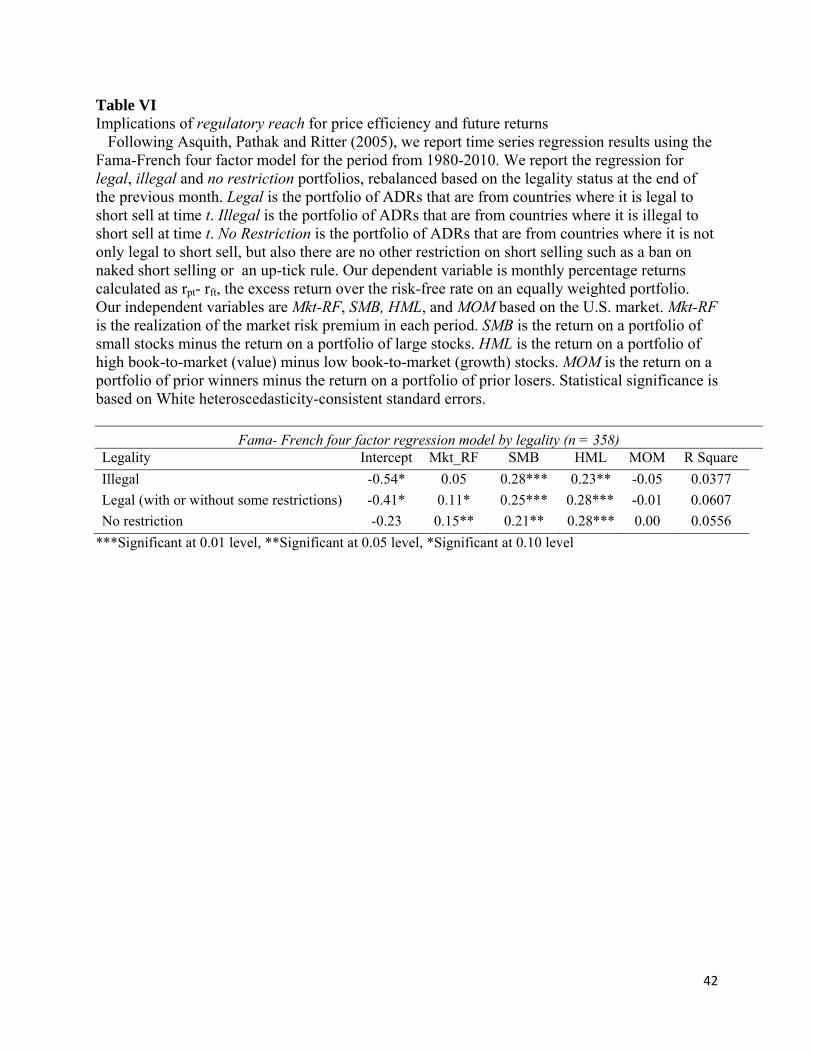
42
Table VI Implications of regulatory reach for price efficiency and future returns
Following Asquith, Pathak and Ritter (2005), we report time series regression results using the Fama-French four factor model for the period from 1980-2010. We report the regression for legal, illegal and no restriction portfolios, rebalanced based on the legality status at the end of the previous month. Legal is the portfolio of ADRs that are from countries where it is legal to short sell at time t. Illegal is the portfolio of ADRs that are from countries where it is illegal to short sell at time t. No Restriction is the portfolio of ADRs that are from countries where it is not only legal to short sell, but also there are no other restriction on short selling such as a ban on naked short selling or an up-tick rule. Our dependent variable is monthly percentage returns calculated as rpt- rft, the excess return over the risk-free rate on an equally weighted portfolio. Our independent variables are Mkt-RF, SMB, HML, and MOM based on the U.S. market. Mkt-RF is the realization of the market risk premium in each period. SMB is the return on a portfolio of small stocks minus the return on a portfolio of large stocks. HML is the return on a portfolio of high book-to-market (value) minus low book-to-market (growth) stocks. MOM is the return on a portfolio of prior winners minus the return on a portfolio of prior losers. Statistical significance is based on White heteroscedasticity-consistent standard errors.
Fama- French four factor regression model by legality (n = 358) Legality Intercept Mkt_RF SMB HML MOM R Square Illegal -0.54* 0.05 0.28*** 0.23** -0.05 0.0377 Legal (with or without some restrictions) -0.41* 0.11* 0.25*** 0.28*** -0.01 0.0607 No restriction -0.23 0.15** 0.21** 0.28*** 0.00 0.0556
***Significant at 0.01 level, **Significant at 0.05 level, *Significant at 0.10 level
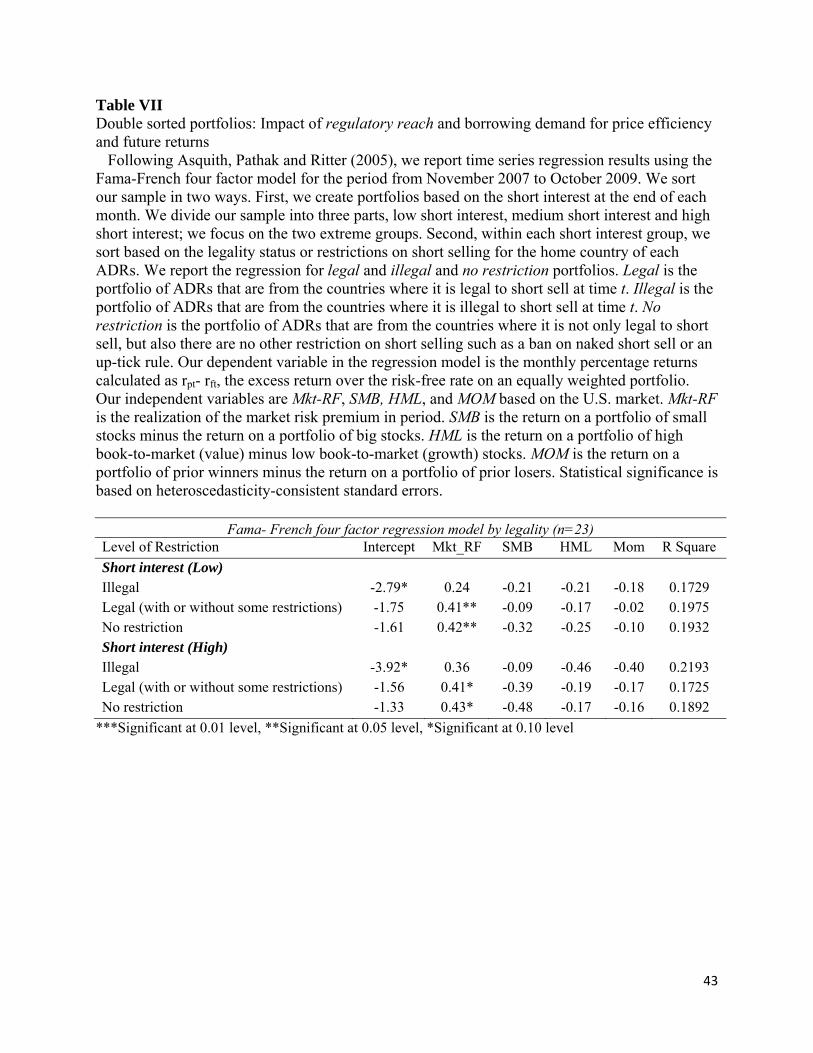
43
Table VII Double sorted portfolios: Impact of regulatory reach and borrowing demand for price efficiency and future returns
Following Asquith, Pathak and Ritter (2005), we report time series regression results using the Fama-French four factor model for the period from November 2007 to October 2009. We sort our sample in two ways. First, we create portfolios based on the short interest at the end of each month. We divide our sample into three parts, low short interest, medium short interest and high short interest; we focus on the two extreme groups. Second, within each short interest group, we sort based on the legality status or restrictions on short selling for the home country of each ADRs. We report the regression for legal and illegal and no restriction portfolios. Legal is the portfolio of ADRs that are from the countries where it is legal to short sell at time t. Illegal is the portfolio of ADRs that are from the countries where it is illegal to short sell at time t. No restriction is the portfolio of ADRs that are from the countries where it is not only legal to short sell, but also there are no other restriction on short selling such as a ban on naked short sell or an up-tick rule. Our dependent variable in the regression model is the monthly percentage returns calculated as rpt- rft, the excess return over the risk-free rate on an equally weighted portfolio. Our independent variables are Mkt-RF, SMB, HML, and MOM based on the U.S. market. Mkt-RF is the realization of the market risk premium in period. SMB is the return on a portfolio of small stocks minus the return on a portfolio of big stocks. HML is the return on a portfolio of high book-to-market (value) minus low book-to-market (growth) stocks. MOM is the return on a portfolio of prior winners minus the return on a portfolio of prior losers. Statistical significance is based on heteroscedasticity-consistent standard errors.
Fama- French four factor regression model by legality (n=23) Level of Restriction Intercept Mkt_RF SMB HML Mom R Square Short interest (Low) Illegal -2.79* 0.24 -0.21 -0.21 -0.18 0.1729 Legal (with or without some restrictions) -1.75 0.41** -0.09 -0.17 -0.02 0.1975 No restriction -1.61 0.42** -0.32 -0.25 -0.10 0.1932 Short interest (High) Illegal -3.92* 0.36 -0.09 -0.46 -0.40 0.2193 Legal (with or without some restrictions) -1.56 0.41* -0.39 -0.19 -0.17 0.1725 No restriction -1.33 0.43* -0.48 -0.17 -0.16 0.1892
***Significant at 0.01 level, **Significant at 0.05 level, *Significant at 0.10 level
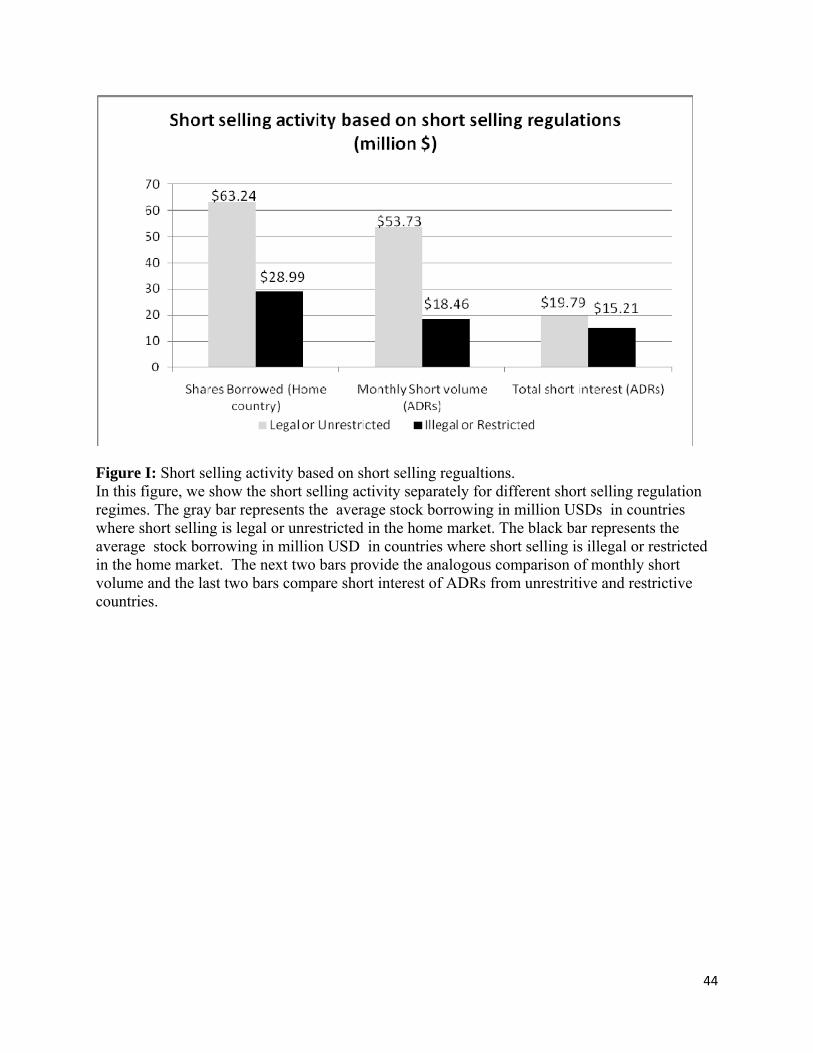
44
Figure I: Short selling activity based on short selling regualtions. In this figure, we show the short selling activity separately for different short selling regulation regimes. The gray bar represents the average stock borrowing in million USDs in countries where short selling is legal or unrestricted in the home market. The black bar represents the average stock borrowing in million USD in countries where short selling is illegal or restricted in the home market. The next two bars provide the analogous comparison of monthly short volume and the last two bars compare short interest of ADRs from unrestritive and restrictive countries.