Embed Size (px)
Citation preview

Worldwide Prospects for Renewable Energy
Towards 2050 and Beyond
Trial Lecture
Georgi H. Yordanov
17 December 2012

2
OUTLINE
• Why the World needs renewable energy (RE)
• Q1: How much RE by 2050?
• Q2: What relative shares of the different RES?
• Scenarios for the energy portfolio until 2050
• Overview of the most promising RE technologies

• Atmospheric GHG must be kept within 450 ppm
CO2 eq. in order to avoid Climate Catastrophe
• Nuclear power generation is associated with
unacceptably high risks for human health and
the environment. Examples: Chernobyl, Fukushima,
3-Mile Island… Radioactive waste!!!
•Earth’s population has surpassed 7 BN and is
depleting its resources at unprecedented rates!
Peak Oil, Peak Gas, etc. Most RE is extrinsic (the
sun; Availability ~ 109 yr). Long-term sustainability!
3
WHY WE NEED RE

4
ENERGY PATHS
Source: IPCC Special Report on RE Sources, 2012

5
ENERGY BY PRESENT
Source: BP Statistical Review of World Energy, 2012
33 % Oil; 30 % Coal; 24 % Gas; 8 % RE (6.5 % Hydro)

6
DISTRIBUTION
Source: IPCC Special Report on RE Sources, 2012

7
RE 2008
Source: IPCC Special Report on RE Sources, 2012

Source: Shell Energy Scenarios to 2050 8
RISING POPULATION

Source: UN 9
RISING POPULATION

10
QUO VADIS, MANKIND?!

11
POSSIBLE FUTURES
Source: IPCC Climate Change Report, 2007

12
ΔT ≤ +2°C by 2100!!!

13
• A great challenge: keep the increase in the mean
global T below 2°C by 2100!!!
• ΔT > 2°C dangerous disruption to the climate
numerous and significant risks to mankind
• UN Climate Change Conf. (Copenhagen, Dec 2009):
no binding time-table, global coordination, viable
monitoring system nor scope to impose sanctions
• The EU: a greater sense of urgency is needed!!!
THE FUTURE WE WANT

14
DECARBONIZATION
Source: IEA Energy Technology Perspectives, 2012
RE use is a key part of the actions needed to reduce
the man-made GHG emissions (CO2 in particular)

15
A MANY PARTS SOLUTION
RE use alone may not be enough! Need efficiency, CCS, etc.

16
WHAT IF CCS FAILS?
IEA: Lack of progress in carbon capture and storage (CCS)!!!
We may need more RE than we think or want!!!

Where Are We Now?
17
• IEA: Only a portfolio of more mature RE technologies –
hydro, biomass, onshore wind and solar photovoltaic
(PV) – are making sufficient progress.
• Fossil fuels still dominant; demand growth continues,
locking in high-carbon infrastructure. The investments
made today will determine the energy system that is in
place in 2050.
• IEA, EU concerned about “the lack of (sufficient)
progress in clean energy”

18
UPSURGE OF COAL
•According to BP, the key determinants for the
future of the GHG emissions are China and India
•“GDP of China and India ~2x by 2020” (Dieter Helm
Professor, Uni. Oxford – “The Carbon Crunch”)
•400–600 GW new coal-fired power plants if the 12th
5-year plan is implemented in China (Ibid.)
•New coal-fired PPs to replace nuclear in Germany!
•Solution: coalgas + CO2 cons. tax + MUCH RE!!!

19
PRESENT MEASURES
German Advisory Council on Global Change (WBGU):
judging from the current pledges, a global mean T
increase of ≥ 3ºC can be expected by 2100
Energy system transformation is inevitable anyway!
Proposed: Climate Policy Contagion led by the EU!
100 % RE in EU by 2050 (!!!) + energy efficiency!!!
EU-wide FIT for RE to ensure financial support

20
DOHA CC CONFERENCE
• 27 Nov – 8 Dec, 2012, Doha, Qatar
• Russia, Japan and Canada withdrew from Kyoto!!!
• Expiry of the Kyoto protocol (end of 2012) would leave the world with no legally binding deal to confront global warming!
Source: UN Framework Convention on Climate Change

21
EU ROADMAP 2050
•High RE scenario: 75 % RE if CCS fails!!! Grid costs
€ 55×109/year; STORAGE!!! No. 1 - wind
•Current policies (post-Fukushima): ≥ 55 % RE
•Electricity share ~2x (36-39 % in 2050)
•Discussion on binding RE target will begin soon
•The 20 % efficiency improvement by 2020 is failing!
High efficiency scenario: energy demand ‒45 %.

22
IPCC: RE 2050
• The IPCC believes 77 % RE possible by 2050
1/3 less GHG emissions than business-as-usual
Atmospheric GHG kept within 450 ppm CO2 eq.
Global mean T increase ≤ 2°C (equilibrium value)
• Requires consistent climate and energy policy!!!
• 164 scenarios; solar ≤ 40 %; wind > 20 %

23
IPCC SCENARIOS
Source: IPCC Special Report on RE Sources, 2012
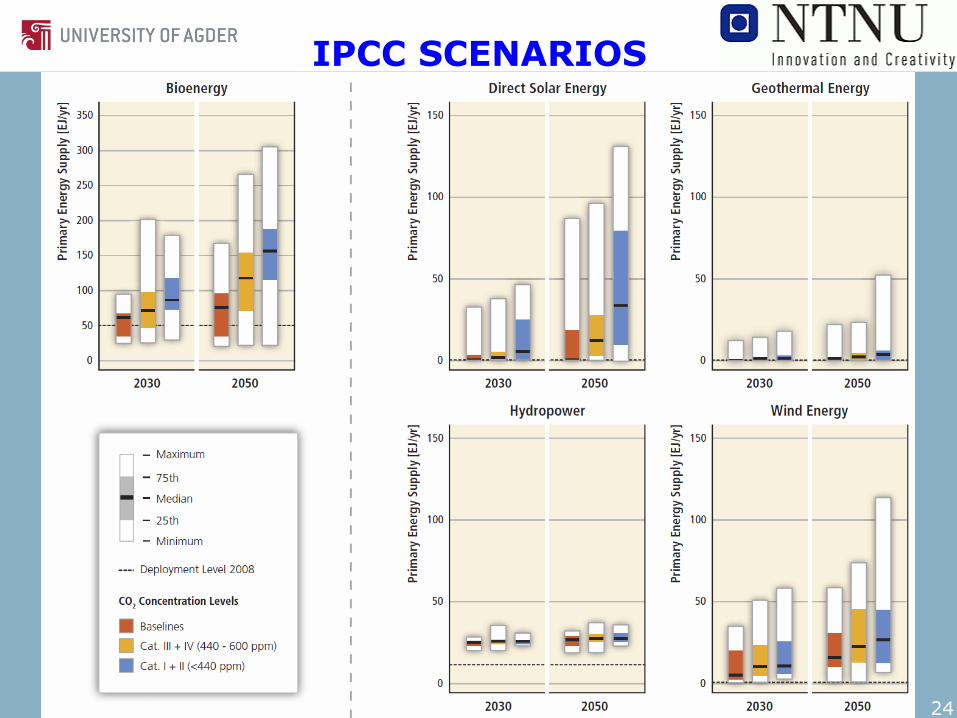
24
IPCC SCENARIOS

25
SHELL’S “SCRAMBLE”
• The worse of 2 scenarios (2 imperfect futures)
• Primary energy in 2050: ~ 850 EJ/yr; RE: > 300 EJ/yr (35 %)
Source: Shell Energy Scenarios to 2050

EU Energy targets 20-20-20 by 2020:
Solar, wind and biomass are the technologies progressing most
rapidly. Solar and wind develop for electricity generation while
biomass remains dominant for the heating sector.
Source: EU Commission 26
THE EARLY STAGE

27
POTENTIALS
Source: IPCC Special Report on RE Sources, 2012

28
BIOMASS Low-efficiency bioenergy
plays a critical role in the
lives of billions in the
developing countries.
High-efficiency modern
bioenergy uses more
convenient solids,
liquids and gases as
secondary energy carriers
to generate heat,
electricity, CHP, and
transport fuels.
~ 60 EJ/yr at present

29
BIOENERGY IN 2050
•Estimated potential in 2050: 100-300 EJ/yr
•Achieving 300 EJ/yr would require major policy
efforts, especially targeting improvements and
efficiency increases in the agricultural sector and
good governance of land use (e.g., zoning).
•ΔT ≤ 2°C would require on the average 160 EJ/yr
(i.e., a compound annual growth rate of 3 %/yr).
Possible?? GDP grew ~3.3 %/yr (1970-2010) but
with low-cost transport & energy; Unemployment:
China 4.1 %, EU 10.7 %, US 7.7 %

30
ENABLERS VS. RISKS
Source: IPCC Special Report on RE Sources, 2012

31
PHOTOSYNTHETIC UPTAKE IS IMPORTANT!

32
BIOENERGY ROUTES
Source: IPCC Special Report on RE Sources, 2012

DIRECT SOLAR • 4 main technologies: thermal, PV, CSP & fuels production
• Most pessimistic technical potential: ~1,600 EJ/yr (2008: 492 EJ)
• Current use of primary solar energy: ~0.7 EJ/yr
• 2050: 15-80 EJ/yr (avg. ~35 EJ/yr); Avg. growth rate 11 %/yr
33

34
PV & CSP
Source: IPCC Special Report on RE Sources, 2012
• PV is the fastest growing solar technology thanks to subsidies (FIT)
• The compound growth rate over the past decade was ~50 %/yr!!!
• HCPV is much less competitive than PV (requires sun tracking)
• Unlike CSP, residential PV & thermal ratings start from a few kWP!

35
GEOTHERMAL
Source: IPCC Special Report on RE Sources, 2012
• Peak fluxes concentrated at active tectonic regions;
• Presently < 0.5 EJ/yr
• Projections for 2050 average at ~4 EJ/yr (requires growth 6 %/yr)

36
HYDROPOWER Present PE use: 13 EJ/yr; 2050: ~ 20 EJ/yr (max. 52 EJ/yr)

WIND ENERGY
• 3 % of the worldwide electricity demand in 2012
• Could grow to > 20 % by 2050 in ambitious scenarios
• Onshore wind is being deployed rapidly in many countries
• Already competitive in areas with good wind resources
37

WIND ENERGY 2050
• Present primary wind energy use: 1.8 EJ/yr
• Median projection for 2050: 27 EJ/yr (required growth: 7.4 %/yr)
• 14 % of global electricity supply
38

39
OCEAN ENERGY • 6 types of energy; most technologies in early development stage
• Until about 2008, ocean energy was not considered in any of the
major global energy scenario modeling activities.
• Pessimistic projections for 2050: < 1 EJ/yr
Source: IPCC Special Report on RE Sources, 2012
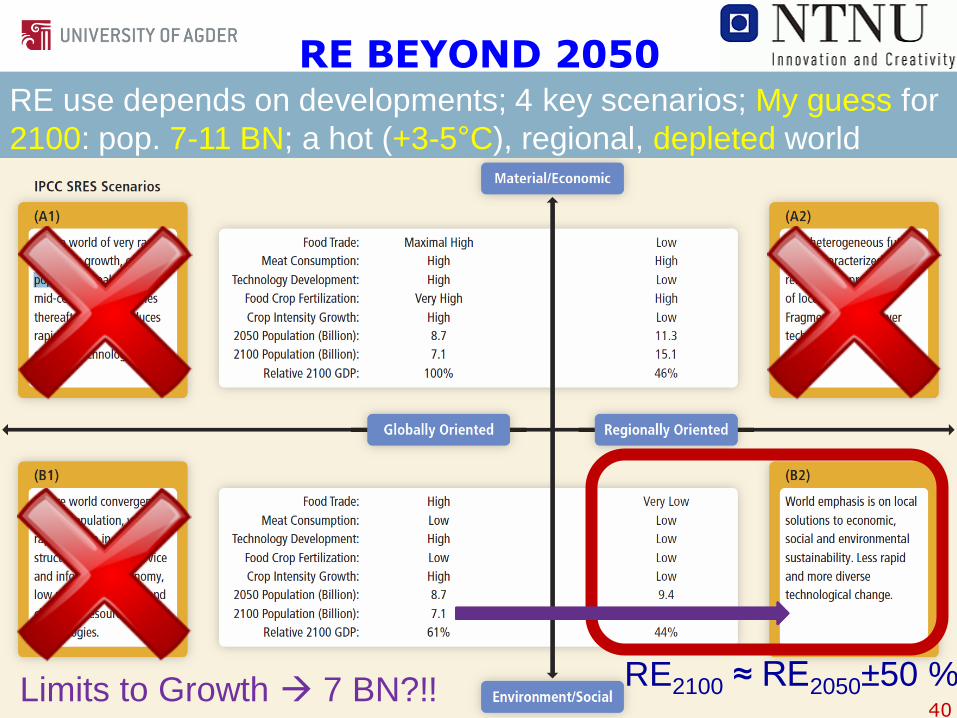
RE BEYOND 2050
40
RE use depends on developments; 4 key scenarios; My guess for
2100: pop. 7-11 BN; a hot (+3-5°C), regional, depleted world
RE2100 ≈ RE2050±50 % Limits to Growth 7 BN?!!