Embed Size (px)
Citation preview
United Nations Conference on Trade and Development
WorldInvestmentReport
United NationsNew York and Geneva, 2003
2003 FDI Policies for Development:National and InternationalPerspectives
Introduction
CHAPTER II
UNEVEN PERFORMANCE ACROSS REGIONS
To sum up chapter I, FDI in 2002 was downagain for both developed and developing countries.Flows to the United States, the top host countryfrom 1978 to 2001, plunged to a 10-year low in2002. But fairly robust FDI outflows from theUnited States helped sustain global FDI flows,though at levels well below their 2000 peak. FDIinflows to all three host developing regions—Africa, Asia and the Pacific and Latin America andthe Caribbean—fell. Only CEE received higherinflows than in 2001.
Subregions and countries also showedconsiderable diversity in their vulnerability to thedownturn, as did sectors and industries. Threethings made a difference. How much countriessustained their economic performance and growthdespite recession in major developed countries.How much they attracted resource-seeking andespecially efficiency-seeking FDI. And how muchnational and international policy init iativesstrengthened their positions as host countries.
In an FDI downturn policy changesfavourable to FDI and agreements that address FDIissues assume greater importance. Combined withother determinants of FDI, they may help countriessustain or increase the level of FDI. National policy
changes were overwhelmingly in the direction ofliberalization (table I .8). Internationally,agreements on FDI proliferated. Where they createbigger markets, in particular, they can be good forFDI.1
For 2003 the prospects are stagnation at bestfor developed countries, Asia and the Pacific andLatin America and the Caribbean—but reasonablygood for Africa and CEE. In 2004 and beyond, theprospects are promising for all regions.
This chapter discusses recent FDI trends anddevelopments in the various regions. It alsodiscusses international investment agreements(IIAs) involving countries in the different regions,exploring how they have influenced FDI flows.IIAs can influence TNC decision-making dependingon their impact on factors determining the locationof FDI (WIR98). Relevant is the emergence ofregulatory frameworks for FDI that are morepredictable, stable, transparent and secure.Particularly relevant is whether market size isincreased or market access is improved, creatingopportunities to tap larger markets and resourcesin the region and to specialize within corporatenetworks.
A. Developing countries
All developing regions—Africa, Asia and thePacific, Latin America and the Caribbean—hadlower FDI inflows.
The least developed countries (LDCs), aspecial group of 49 economies,2 were not anexception with inflows declining by 7% to $5.2bill ion in 2002 (annex table B.1). Inflows toAfrican LDCs fell by 3% in 2002, and those toLDCs in Asia and the Pacific declined by half, to$0.3 bill ion in 2002. The only LDC in LatinAmerica—Haiti—had higher inflows, particularlyfor textiles, due in part to its entry into CARICOM.The share of LDCs in global FDI flows remainsless than 1% of the world total and 3.2% of thedeveloping country total.
FDI flows to the largest LDC recipients—most of them oil-exporting countries, including
Angola, Equatorial Guinea and Sudan—alsodeclined. Chad is an exceptional case with inflowsgrowing from almost nothing in 2001 to $0.9 billionin 2002 by attracting oil-related FDI. This countrybecame the second largest recipient after Angolaamong LDCs. With more investment in petroleum,FDI flows to LDCs as a group are expected to risein 2003.
1. Africa
Africa’s FDI inflows declined to $11 billionin 2002 after a surge to $19 billion in 2001, mainlyfrom two cross-border M&As. As a result, theregion’s share in global FDI inflows fell from 2.3%in 2001 to 1.7% in 2002, highlighting the smallvolume of FDI flows to the region. Many African
World Investment Report 2003 FDI Policies for Development: National and International Perspectives34
countries marginally sustained or increased theirFDI inflows in 2002. Inflows to the regionremained highly concentrated, with Algeria,Angola, Chad, Nigeria and Tunisia accounting forhalf of the total inflows. The distribution acrosssectors and industries remained largely unchanged.
The downturn in FDI flows could be short-lived, especially with stronger national efforts topromote FDI and ongoing trade and investmentinitiatives by the United States, the EU and Japan.In addition, some TNCs began new activities,notably in petroleum exploration and extraction.Much will depend, however, on the vigour ofAfrican countries in pursuing policies that stimulatedomestic economic growth and encouragesustainable inflows of FDI.
a. FDI down by two-fifths
The most striking feature of the FDIdownturn in Africa in 2002 is its size (41%), a goodpart of which was linked to the absence of largeM&As comparable to those that took place in 2001.Cross-border M&As amounted to less than $2billion, compared with $16 billion in 2001 (annextable B.7). If the large cross-border M&A dealsin Morocco and South Africa in 2001 are excludedfrom FDI figures for that year, FDI inflows in 2002actually increased by 8%. Unevenly distributedacross the continent, FDI inflows amounted to only
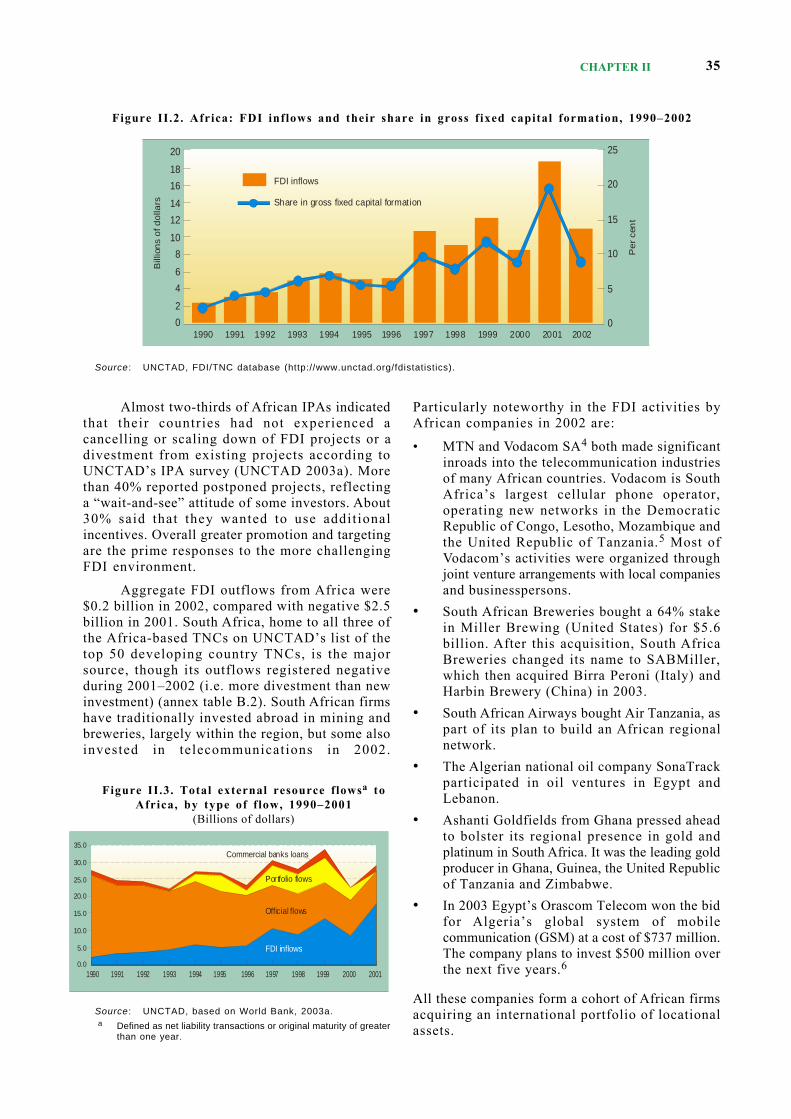
8.9% of gross fixed capital formation (figure II.2),compared to 19.4% in 2001.
The downturn also reflects drops in outflowsfrom the major home countries of FDI to Africa—the United States, France and the United Kingdom.United States imports from sub-Saharan Africadeclined by more than 16% in 2002,3 reducing theinterest of TNCs in Africa.
Until 2001, FDI was gaining in importanceas a source of Africa’s external developmentfinance, reaching nearly two-thirds of total netresource flows in 2001, compared with 34%through official flows (figure II.3). Average FDIflows to the region in 1997–2001 were higher thaneither total official flows or the total of portfolioand commercial bank loans. Seen from thisperspective, the downturn in FDI in 2002 was amajor setback, even if short-lived.
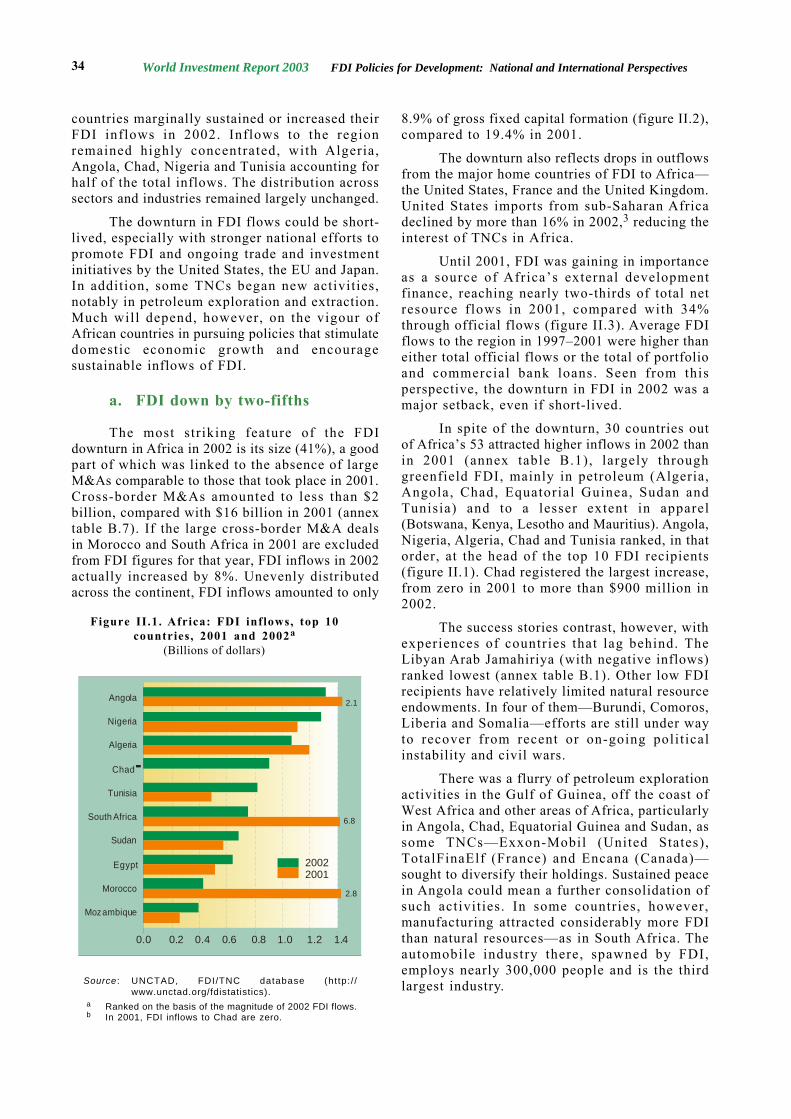
In spite of the downturn, 30 countries outof Africa’s 53 attracted higher inflows in 2002 thanin 2001 (annex table B.1), largely throughgreenfield FDI, mainly in petroleum (Algeria,Angola, Chad, Equatorial Guinea, Sudan andTunisia) and to a lesser extent in apparel(Botswana, Kenya, Lesotho and Mauritius). Angola,Nigeria, Algeria, Chad and Tunisia ranked, in thatorder, at the head of the top 10 FDI recipients(figure II.1). Chad registered the largest increase,from zero in 2001 to more than $900 million in2002.
The success stories contrast, however, withexperiences of countries that lag behind. TheLibyan Arab Jamahiriya (with negative inflows)ranked lowest (annex table B.1). Other low FDIrecipients have relatively limited natural resourceendowments. In four of them—Burundi, Comoros,Liberia and Somalia—efforts are still under wayto recover from recent or on-going polit icalinstability and civil wars.
There was a flurry of petroleum explorationactivities in the Gulf of Guinea, off the coast ofWest Africa and other areas of Africa, particularlyin Angola, Chad, Equatorial Guinea and Sudan, assome TNCs—Exxon-Mobil (United States),TotalFinaElf (France) and Encana (Canada)—sought to diversify their holdings. Sustained peacein Angola could mean a further consolidation ofsuch activities. In some countries, however,manufacturing attracted considerably more FDIthan natural resources—as in South Africa. Theautomobile industry there, spawned by FDI,employs nearly 300,000 people and is the thirdlargest industry.
Figure II.1. Africa: FDI inflows, top 10countries, 2001 and 2002a
(Billions of dollars)
Source : UNCTAD, FDI/TNC database (ht tp: / /www.unctad.org/fdistatistics).
a Ranked on the basis of the magnitude of 2002 FDI flows.b In 2001, FDI inflows to Chad are zero.
Angola
Nigeria
Algeria
Chad
Tunisia
South Africa
Sudan
Egypt
Morocco
Mozambique
2.1
6.8
2.8
20022001
0.0 0.2 0.4 0.6 0.8 1.0 1.2 1.4
CHAPTER II 35
Almost two-thirds of African IPAs indicatedthat their countries had not experienced acancelling or scaling down of FDI projects or adivestment from existing projects according toUNCTAD’s IPA survey (UNCTAD 2003a). Morethan 40% reported postponed projects, reflectinga “wait-and-see” attitude of some investors. About30% said that they wanted to use addit ionalincentives. Overall greater promotion and targetingare the prime responses to the more challengingFDI environment.
Aggregate FDI outflows from Africa were$0.2 billion in 2002, compared with negative $2.5billion in 2001. South Africa, home to all three ofthe Africa-based TNCs on UNCTAD’s list of thetop 50 developing country TNCs, is the majorsource, though its outflows registered negativeduring 2001–2002 (i.e. more divestment than newinvestment) (annex table B.2). South African firmshave traditionally invested abroad in mining andbreweries, largely within the region, but some alsoinvested in telecommunications in 2002.
Particularly noteworthy in the FDI activities byAfrican companies in 2002 are:
• MTN and Vodacom SA4 both made significantinroads into the telecommunication industriesof many African countries. Vodacom is SouthAfrica’s largest cellular phone operator,operating new networks in the DemocraticRepublic of Congo, Lesotho, Mozambique andthe United Republic of Tanzania.5 Most ofVodacom’s activities were organized throughjoint venture arrangements with local companiesand businesspersons.
• South African Breweries bought a 64% stakein Miller Brewing (United States) for $5.6billion. After this acquisition, South AfricaBreweries changed its name to SABMiller,which then acquired Birra Peroni (Italy) andHarbin Brewery (China) in 2003.
• South African Airways bought Air Tanzania, aspart of its plan to build an African regionalnetwork.
• The Algerian national oil company SonaTrackparticipated in oil ventures in Egypt andLebanon.
• Ashanti Goldfields from Ghana pressed aheadto bolster its regional presence in gold andplatinum in South Africa. It was the leading goldproducer in Ghana, Guinea, the United Republicof Tanzania and Zimbabwe.
• In 2003 Egypt’s Orascom Telecom won the bidfor Algeria’s global system of mobilecommunication (GSM) at a cost of $737 million.The company plans to invest $500 million overthe next five years.6
All these companies form a cohort of African firmsacquiring an international portfolio of locationalassets.
Figure II.3. Total external resource flowsa toAfrica, by type of f low, 1990–2001
(Billions of dollars)
Source : UNCTAD, based on World Bank, 2003a.a Defined as net liability transactions or original maturity of greater
than one year.
Source : UNCTAD, FDI/TNC database (http://www.unctad.org/fdistatistics).
Figure II.2. Africa: FDI inflows and their share in gross fixed capital formation, 1990–2002
20
18
16
14
12
10
8
6
4
2
01990 1991 1992 1993 1994 1995 1996 1997 1998 1999 2000 2001 2002
25
20
15
10
5
0
Bill
ion
s o
f do
llars
Pe
r ce
nt
FDI inflows
Share in gross fixed capital formation
35.0
30.0
25.0
20.0
15.0
10.0
5.0
0.01990 1991 1992 1993 1994 1995 1996 1997 1998 1999 2000 2001
FDI inflows
Official flows
Portfolio flows
Commercial banks loans
World Investment Report 2003 FDI Policies for Development: National and International Perspectives36
b. Policy developments—improvingthe investment climate
African countries have liberalized regulatoryregimes for FDI, addressing investors’ concerns,privatizing public enterprises and activelypromoting investment (box II.1). In 2002 alone,10 countries introduced 20 changes in theirinvestment regimes, overwhelmingly in thedirection of a more favourable investment climate.7Many countries had previously abolished, orsignificantly reduced requirements for governmentparticipation in business ventures. Nigeria hasmoved away from mandatory joint ventures inpetroleum and minerals. Ghana expanded the scopefor FDI by reducing the number of industries closedto foreign investors. And some countries recentlyexpedited investment approval procedures bydeveloping one-stop investment centres (Egypt,
Kenya). Investment-related issues, such astechnology transfer, are now subject to lessrestrictive compliance criteria, and the protectionof intellectual property rights has improved in somecountries.
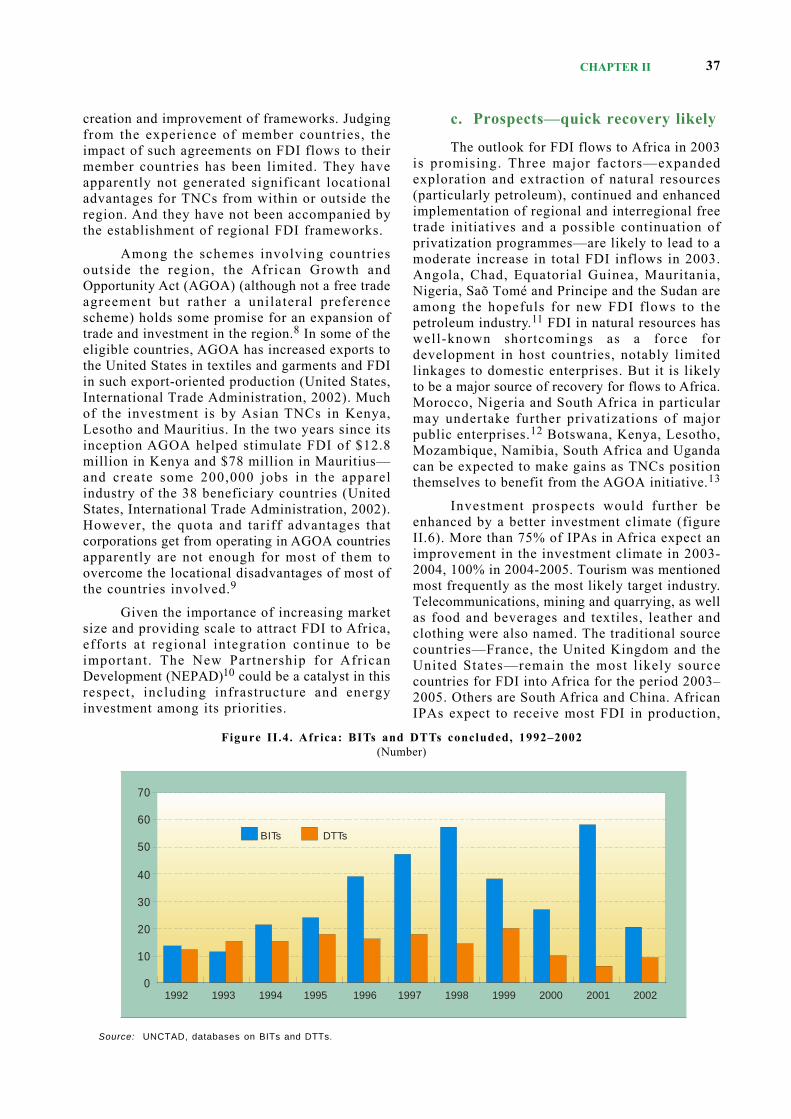
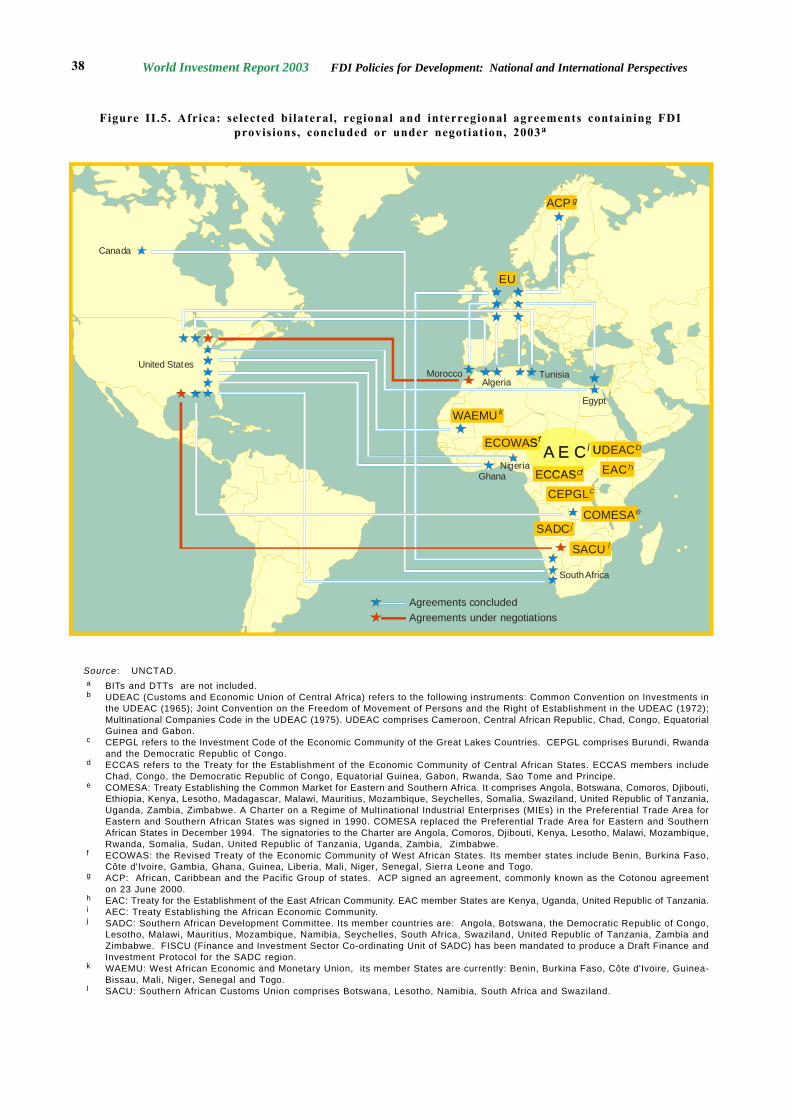
African countries, while liberalizing theirFDI policies, had also concluded 533 BITs (anaverage of 10 per country) and 365 DTTs (about7 per country) by the end of 2002. The total numberof BITs and DTTs is more than that in LatinAmerica and the Caribbean, but fewer than thatin Asia and CEE. During 2001 and 2002, 78 BITsand 15 DTTs were concluded (figure II.4). Progresstowards creating free trade and investment areasis slow, although several agreements, mostlysubregional, have been concluded (figure II.5). Amajority of bilateral and regional agreementsemphasize investment promotion through the
Recently completed Investment PolicyReviews for African countries by UNCTAD showinteresting developments in the regulation andpromotion of FDI.a
Standards of treatment and protection offoreign investors are no longer contentious issues.Good practice is the norm, even in countrieswithout FDI laws. Indeed two countries haverecently decided to formalize their commitment togood standards of treatment and protection byintroducing FDI legislation for the first t ime.Moreover, interest is strong in expanding thenetwork of BITs, including to Asian homecountries. Some country groups are comfortableinjecting common investment standards into theirsubregional agreements.
Countries continue to be reasonably open toFDI entry, with the authorities paying moreattention to facilitating investment startup – “fromred tape to red carpet” as one IPA describes it.Privatization with the participation of foreign firmsis an important practical manifestation of openness.But such opening is slower than in other parts of theworld, certainly in utilities and strategic industries.
One higher income country sought to tightenits FDI regime to fast-track local entrepreneurship.This highlights the growing concern about theimpact of FDI on development on the one hand andthe recognition of the need for active policy onfostering positive linkages between foreignaffiliates and national entrepreneurs on the other.
All the countries, including the LDCs, arekeen to attract FDI in manufacturing. The more
ambitious ones are also targeting FDI in serviceexports, including financial, business andprofessional services for their regions andinternational information and telecom opportunities.
While FDI-specific standards are nowgenerally sound, there is still a highly patchy recordin general regulatory and fiscal measures forbusiness. Recent efforts to attract FDI in labour-intensive manufacturing for export and newopportunities for FDI in services have highlightedthe following:
• First , typical fiscal regimes are notinternationally competitive when countriesseek FDI in export-oriented business. Mostcountries respond with piecemeal incentivesin a process that can be prolonged to a pointof becoming discriminatory and arbitrary.
• Second, good labour regulation, especiallyan effective industrial dispute resolutionmachinery, is lacking in many countries.Progress in this area is important inpresenting an attractive profile for FDI inlabour-intensive export manufacturing.Experience in meeting this challenge varieswidely.
• Third, many countries still have outdatedwork and residence permit systems. Theprocess of obtaining entry and work permitsfor expatriates is lengthy, cumbersome andnon-transparent. This discourages FDI intonew industries in export manufacturing andservices which tend to depend heavily at theoutset on expatriates in management andtechnical positions.
Box II.1. What Investment Policy Reviews show
Source : UNCTAD.a Investment Policy Reviews have been completed for Botswana, Egypt, Ethiopia, Ghana, Lesotho, Mauritius, the United Republic
of Tanzania and Uganda and are under way for Algeria, Benin and Zambia.
CHAPTER II 37
creation and improvement of frameworks. Judgingfrom the experience of member countries, theimpact of such agreements on FDI flows to theirmember countries has been limited. They haveapparently not generated significant locationaladvantages for TNCs from within or outside theregion. And they have not been accompanied bythe establishment of regional FDI frameworks.
Among the schemes involving countriesoutside the region, the African Growth andOpportunity Act (AGOA) (although not a free tradeagreement but rather a unilateral preferencescheme) holds some promise for an expansion oftrade and investment in the region.8 In some of theeligible countries, AGOA has increased exports tothe United States in textiles and garments and FDIin such export-oriented production (United States,International Trade Administration, 2002). Muchof the investment is by Asian TNCs in Kenya,Lesotho and Mauritius. In the two years since itsinception AGOA helped stimulate FDI of $12.8million in Kenya and $78 million in Mauritius—and create some 200,000 jobs in the apparelindustry of the 38 beneficiary countries (UnitedStates, International Trade Administration, 2002).However, the quota and tariff advantages thatcorporations get from operating in AGOA countriesapparently are not enough for most of them toovercome the locational disadvantages of most ofthe countries involved.9
Given the importance of increasing marketsize and providing scale to attract FDI to Africa,efforts at regional integration continue to beimportant. The New Partnership for AfricanDevelopment (NEPAD)10 could be a catalyst in thisrespect, including infrastructure and energyinvestment among its priorities.
c. Prospects—quick recovery likely
The outlook for FDI flows to Africa in 2003is promising. Three major factors—expandedexploration and extraction of natural resources(particularly petroleum), continued and enhancedimplementation of regional and interregional freetrade initiatives and a possible continuation ofprivatization programmes—are likely to lead to amoderate increase in total FDI inflows in 2003.Angola, Chad, Equatorial Guinea, Mauritania,Nigeria, Saõ Tomé and Principe and the Sudan areamong the hopefuls for new FDI flows to thepetroleum industry.11 FDI in natural resources haswell-known shortcomings as a force fordevelopment in host countries, notably limitedlinkages to domestic enterprises. But it is likelyto be a major source of recovery for flows to Africa.Morocco, Nigeria and South Africa in particularmay undertake further privatizations of majorpublic enterprises.12 Botswana, Kenya, Lesotho,Mozambique, Namibia, South Africa and Ugandacan be expected to make gains as TNCs positionthemselves to benefit from the AGOA initiative.13
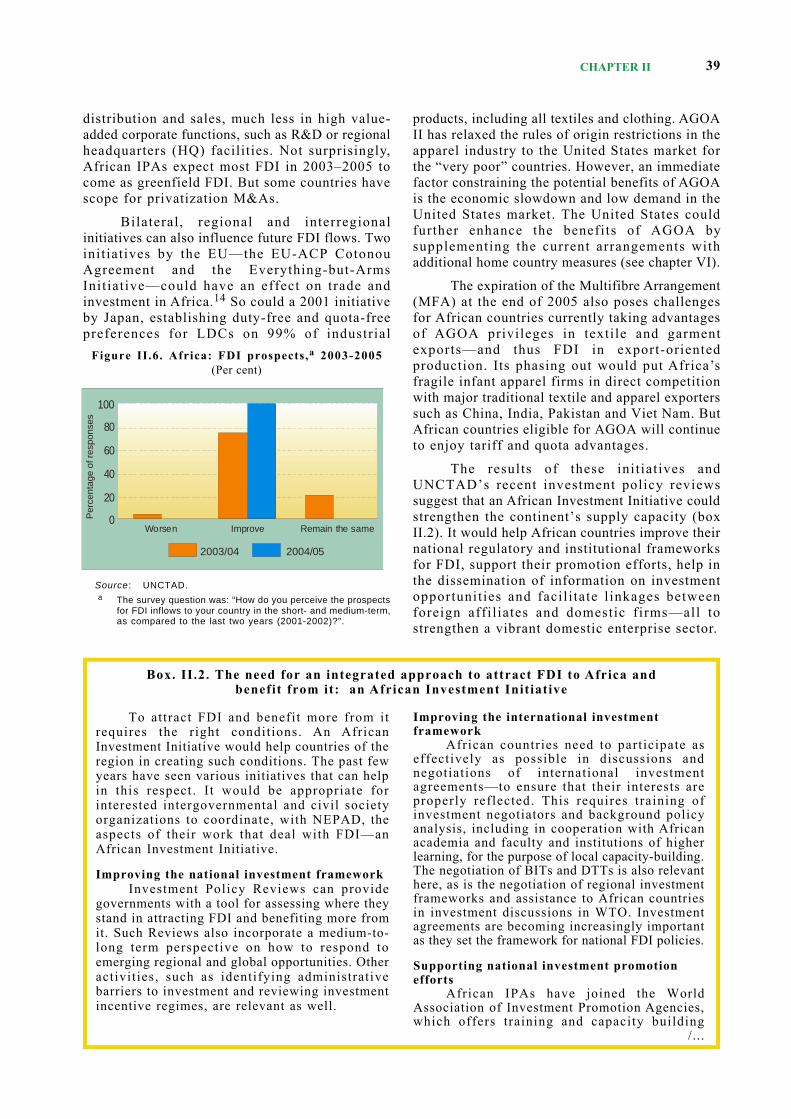
Investment prospects would further beenhanced by a better investment climate (figureII.6). More than 75% of IPAs in Africa expect animprovement in the investment climate in 2003-2004, 100% in 2004-2005. Tourism was mentionedmost frequently as the most likely target industry.Telecommunications, mining and quarrying, as wellas food and beverages and textiles, leather andclothing were also named. The traditional sourcecountries—France, the United Kingdom and theUnited States—remain the most l ikely sourcecountries for FDI into Africa for the period 2003–2005. Others are South Africa and China. AfricanIPAs expect to receive most FDI in production,
Figure II.4. Africa: BITs and DTTs concluded, 1992–2002(Number)
Source: UNCTAD, databases on BITs and DTTs.
70
60
50
40
30
20
10
01992 1993 1994 1995 1996 1997 1998 1999 2000 2001 2002
BITs DTTs
World Investment Report 2003 FDI Policies for Development: National and International Perspectives38
Figure II.5. Africa: selected bilateral, regional and interregional agreements containing FDIprovisions, concluded or under negotiation, 2003a
Source : UNCTAD.a BITs and DTTs are not included.b UDEAC (Customs and Economic Union of Central Africa) refers to the following instruments: Common Convention on Investments in
the UDEAC (1965); Joint Convention on the Freedom of Movement of Persons and the Right of Establishment in the UDEAC (1972);Multinational Companies Code in the UDEAC (1975). UDEAC comprises Cameroon, Central African Republic, Chad, Congo, EquatorialGuinea and Gabon.
c CEPGL refers to the Investment Code of the Economic Community of the Great Lakes Countries. CEPGL comprises Burundi, Rwandaand the Democratic Republic of Congo.
d ECCAS refers to the Treaty for the Establishment of the Economic Community of Central African States. ECCAS members includeChad, Congo, the Democratic Republic of Congo, Equatorial Guinea, Gabon, Rwanda, Sao Tome and Principe.
e COMESA: Treaty Establishing the Common Market for Eastern and Southern Africa. It comprises Angola, Botswana, Comoros, Djibouti,Ethiopia, Kenya, Lesotho, Madagascar, Malawi, Mauritius, Mozambique, Seychelles, Somalia, Swaziland, United Republic of Tanzania,Uganda, Zambia, Zimbabwe. A Charter on a Regime of Multinational Industrial Enterprises (MIEs) in the Preferential Trade Area forEastern and Southern African States was signed in 1990. COMESA replaced the Preferential Trade Area for Eastern and SouthernAfrican States in December 1994. The signatories to the Charter are Angola, Comoros, Djibouti, Kenya, Lesotho, Malawi, Mozambique,Rwanda, Somalia, Sudan, United Republic of Tanzania, Uganda, Zambia, Zimbabwe.
f ECOWAS: the Revised Treaty of the Economic Community of West African States. Its member states include Benin, Burkina Faso,Côte d'Ivoire, Gambia, Ghana, Guinea, Liberia, Mali, Niger, Senegal, Sierra Leone and Togo.
g ACP: African, Caribbean and the Pacific Group of states. ACP signed an agreement, commonly known as the Cotonou agreementon 23 June 2000.
h EAC: Treaty for the Establishment of the East African Community. EAC member States are Kenya, Uganda, United Republic of Tanzania.i AEC: Treaty Establishing the African Economic Community.j SADC: Southern African Development Committee. Its member countries are: Angola, Botswana, the Democratic Republic of Congo,
Lesotho, Malawi, Mauritius, Mozambique, Namibia, Seychelles, South Africa, Swaziland, United Republic of Tanzania, Zambia andZimbabwe. FISCU (Finance and Investment Sector Co-ordinating Unit of SADC) has been mandated to produce a Draft Finance andInvestment Protocol for the SADC region.
k WAEMU: West African Economic and Monetary Union, its member States are currently: Benin, Burkina Faso, Côte d'Ivoire, Guinea-Bissau, Mali, Niger, Senegal and Togo.
l SACU: Southern African Customs Union comprises Botswana, Lesotho, Namibia, South Africa and Swaziland.
Tunisia
Egypt
South Africa
United States
Canada
Algeria
GhanaNigeria
Morocco
EU
WAEMUk
COMESAe
EACh
CEPGLc
SADC j
SACU l
A E C iECOWASfUDEAC
ECCASd
A E C iECOWASfUDEACb
ECCASd
Agreements concludedAgreements under negotiations
ACP g
CHAPTER II 39
distribution and sales, much less in high value-added corporate functions, such as R&D or regionalheadquarters (HQ) facilities. Not surprisingly,African IPAs expect most FDI in 2003–2005 tocome as greenfield FDI. But some countries havescope for privatization M&As.
Bilateral, regional and interregionalinitiatives can also influence future FDI flows. Twoinitiatives by the EU—the EU-ACP CotonouAgreement and the Everything-but-ArmsInitiative—could have an effect on trade andinvestment in Africa.14 So could a 2001 initiativeby Japan, establishing duty-free and quota-freepreferences for LDCs on 99% of industrial
products, including all textiles and clothing. AGOAII has relaxed the rules of origin restrictions in theapparel industry to the United States market forthe “very poor” countries. However, an immediatefactor constraining the potential benefits of AGOAis the economic slowdown and low demand in theUnited States market. The United States couldfurther enhance the benefits of AGOA bysupplementing the current arrangements withadditional home country measures (see chapter VI).
The expiration of the Multifibre Arrangement(MFA) at the end of 2005 also poses challengesfor African countries currently taking advantagesof AGOA privileges in textile and garmentexports—and thus FDI in export-orientedproduction. Its phasing out would put Africa’sfragile infant apparel firms in direct competitionwith major traditional textile and apparel exporterssuch as China, India, Pakistan and Viet Nam. ButAfrican countries eligible for AGOA will continueto enjoy tariff and quota advantages.
The results of these init iatives andUNCTAD’s recent investment policy reviewssuggest that an African Investment Initiative couldstrengthen the continent’s supply capacity (boxII.2). It would help African countries improve theirnational regulatory and institutional frameworksfor FDI, support their promotion efforts, help inthe dissemination of information on investmentopportunities and facil i tate l inkages betweenforeign affil iates and domestic firms—all tostrengthen a vibrant domestic enterprise sector.
Figure II.6. Africa: FDI prospects,a 2003-2005(Per cent)
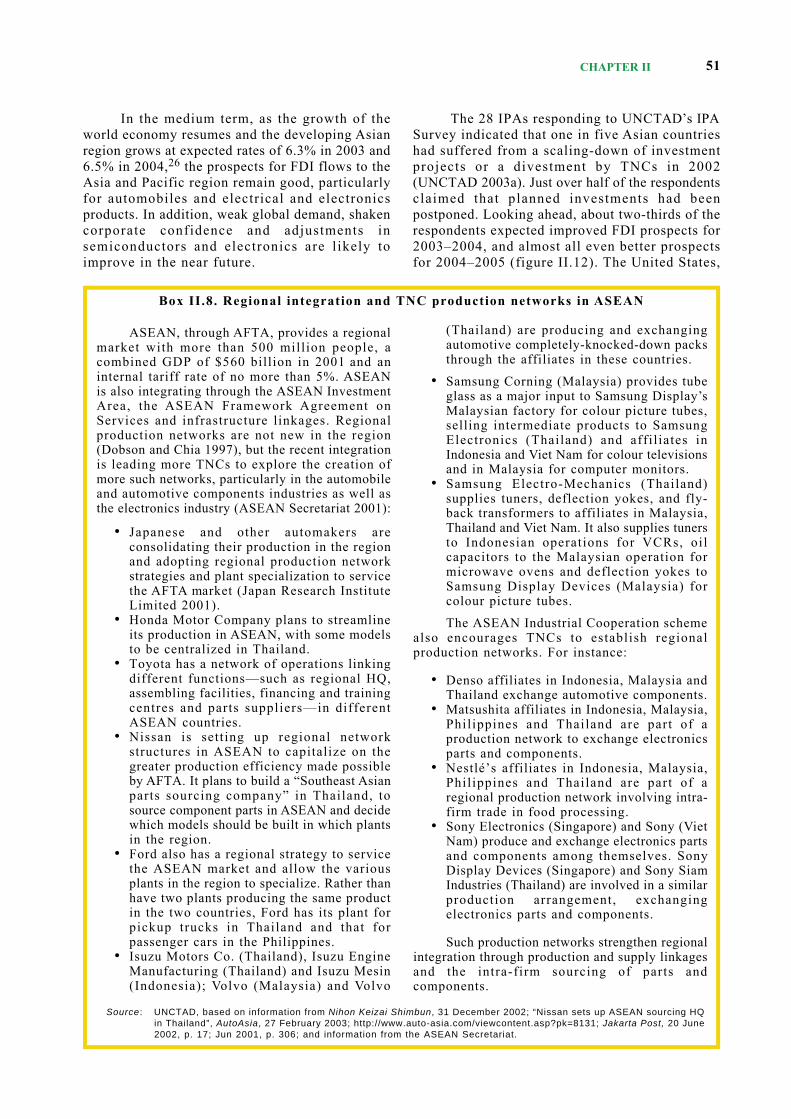
Source : UNCTAD.a The survey question was: “How do you perceive the prospects
for FDI inflows to your country in the short- and medium-term,as compared to the last two years (2001-2002)?”.
To attract FDI and benefit more from itrequires the right conditions. An AfricanInvestment Initiative would help countries of theregion in creating such conditions. The past fewyears have seen various initiatives that can helpin this respect. I t would be appropriate forinterested intergovernmental and civil societyorganizations to coordinate, with NEPAD, theaspects of their work that deal with FDI—anAfrican Investment Initiative.
Improving the national investment frameworkInvestment Policy Reviews can provide
governments with a tool for assessing where theystand in attracting FDI and benefiting more fromit. Such Reviews also incorporate a medium-to-long term perspective on how to respond toemerging regional and global opportunities. Otheractivities, such as identifying administrativebarriers to investment and reviewing investmentincentive regimes, are relevant as well.
Box. II.2. The need for an integrated approach to attract FDI to Africa andbenefit from it: an African Investment Initiative
Improving the international investmentframework
African countries need to participate aseffectively as possible in discussions andnegotiations of international investmentagreements—to ensure that their interests areproperly reflected. This requires training ofinvestment negotiators and background policyanalysis, including in cooperation with Africanacademia and faculty and institutions of higherlearning, for the purpose of local capacity-building.The negotiation of BITs and DTTs is also relevanthere, as is the negotiation of regional investmentframeworks and assistance to African countriesin investment discussions in WTO. Investmentagreements are becoming increasingly importantas they set the framework for national FDI policies.
Supporting national investment promotionefforts
African IPAs have joined the WorldAssociation of Investment Promotion Agencies,which offers training and capacity building
/...
100
80
60
40
20
0Per
cent
age
of re
spon
ses
2003/04 2004/05
Worsen Improve Remain the same
World Investment Report 2003 FDI Policies for Development: National and International Perspectives40
2. Asia and the Pacific
Like the other developing regions, Asia andthe Pacific was not spared by the downturn. Theregion, however, weathered the downturn betterthan most other regions, with only an 11% FDIdecline. The decline was uneven by subregion,country and industry. Asia is one of the mostrapidly liberalizing host regions for FDI, makingmore national policy changes in a directionfavourable to investors in 2002 than any otherregion. Bilateral and regional arrangementsinvolving countries in the region also proliferated.While the long-term prospects for an increase inFDI flows to the region remain promising, theshort-term scenario continues to be uncertain.
a. FDI down again, but severalcountries receiving significantlyhigher flows
For the region as a whole, FDI flowsdeclined for the second year in a row, down from$107 billion in 2001 to $95 billion in 2002. Thedecline affected all subregions, except for CentralAsia and South Asia. Still 26 out of the region’s57 economies saw higher FDI inflows.
Despite the downturn, however, the share ofAsia and the Pacific—the world’s largestdeveloping region in terms of population and
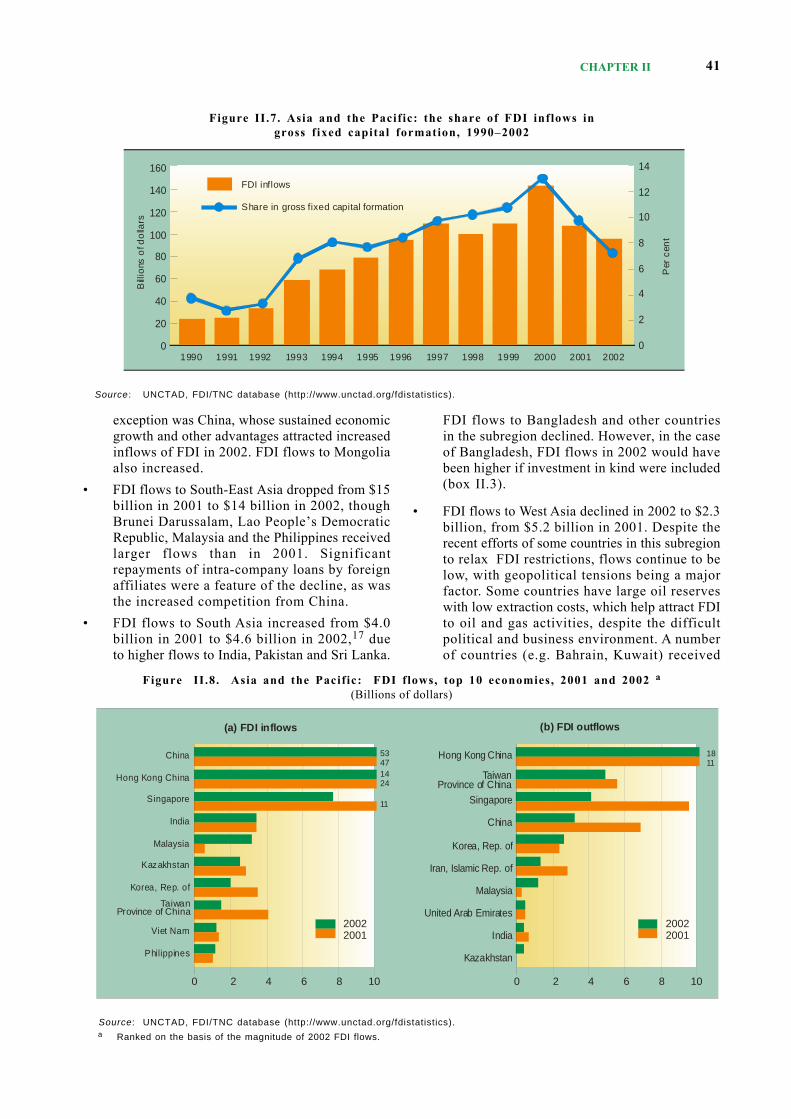
GDP—in global FDI flows rose to 14% in 2001–2002, compared with 10% during the FDI boomyears of 1999–2000. The region’s share of FDIflows to developing countries in 2002 also rose,to 59%, from 51% in 2001. The ratio of FDI flowsin gross fixed capital formation declined from 10%in 2001 to 7% in 2002 (figure II.7), suggesting amore severe impact of the global economicslowdown on FDI than on domestic investment.
FDI flows continue to be concentrated inChina, Hong Kong (China) and Singapore. The top10 host economies took 93% of the region’s totalinflows in 2002 (figure II .8). The electronicsindustry was most affected by the downturn dueto continued rationalization of production activitiesin the region and adjustments to weak globaldemand. Repayments of intra-company loans byforeign affiliates remained high in some countries.However, reinvested earnings rose,15 an importantsource of financing FDI during the downturn.
Some highlights for the subregions:
• FDI flows to North-East Asia16 dropped from$78 billion in 2001 to $70 billion in 2002. FDIflows to Hong Kong (China) fell by 42%, toTaiwan Province of China by 65% and to theRepublic of Korea by 44%, partly because TNCproduction activities were relocated to lowercost locations, primarily China. The decline inFDI flows was also partly due to slow economicgrowth of these economies. The notable
opportunities to more than 160 IPAs, includingthrough exposure to successful IPAs worldwide.This helps them develop their strategy andpromotion plans, establish information systems andproduce marketing materials. Other activitiesinclude project portfolio preparation and retentionand expansion programmes.
Promoting information dissemination andpublic-private sector dialogue
Lack of information about investmentopportunities in Africa is one factor that holds backthe flow of FDI to the continent. Providinginvestment information is therefore crucial. Actionscould include the preparation and disseminationof investment guides and the creation of web-basedpromotion materials. Also important is promotinga public-private sector dialogue, nationally andinternationally, to draw directly on the expertiseof corporate decision makers in interaction withsenior government officials. For this purposeUNCTAD and the ICC jointly established an
Box. II.2. The need for an integrated approach to attract FDI to Africa andbenefit from it: an African Investment Initiative (concluded)
Source : UNCTAD.
Investment Advisory Council, while Ethiopia,Ghana, Senegal and the United Republic ofTanzania have established such councils at thenational level.
Facilitating business linkagesLinkages between foreign affiliates and
domestic firms are the main avenues to disseminatethe benefits of FDI to the domestic economy andhelp create a vibrant enterprise sector. Many TNCshave built up complex supply chains, involvingcompetitive local SMEs. This has opened up newopportunities for many SMEs. But the vastmajority of them, particularly in African LDCs,remain delinked from TNCs, missing out onpotential gains of technological spillovers andaccess to markets, information and finance. Adviceon the most appropriate policy framework forlinkages, identifying opportunities available tolocal SMEs and foreign affil iates to increasebusiness linkages and deepen them can increasethe contribution of FDI to development.
CHAPTER II 41
exception was China, whose sustained economicgrowth and other advantages attracted increasedinflows of FDI in 2002. FDI flows to Mongoliaalso increased.
• FDI flows to South-East Asia dropped from $15billion in 2001 to $14 billion in 2002, thoughBrunei Darussalam, Lao People’s DemocraticRepublic, Malaysia and the Philippines receivedlarger flows than in 2001. Significantrepayments of intra-company loans by foreignaffiliates were a feature of the decline, as wasthe increased competition from China.
• FDI flows to South Asia increased from $4.0billion in 2001 to $4.6 billion in 2002,17 dueto higher flows to India, Pakistan and Sri Lanka.
FDI flows to Bangladesh and other countriesin the subregion declined. However, in the caseof Bangladesh, FDI flows in 2002 would havebeen higher if investment in kind were included(box II.3).
• FDI flows to West Asia declined in 2002 to $2.3billion, from $5.2 billion in 2001. Despite therecent efforts of some countries in this subregionto relax FDI restrictions, flows continue to below, with geopolitical tensions being a majorfactor. Some countries have large oil reserveswith low extraction costs, which help attract FDIto oil and gas activities, despite the difficultpolitical and business environment. A numberof countries (e.g. Bahrain, Kuwait) received
Figure II.7. Asia and the Pacific: the share of FDI inflows ingross fixed capital formation, 1990–2002
Source : UNCTAD, FDI/TNC database (http://www.unctad.org/fdistatistics).
Figure II.8. Asia and the Pacific: FDI flows, top 10 economies, 2001 and 2002 a
(Billions of dollars)
Source: UNCTAD, FDI/TNC database (http://www.unctad.org/fdistatistics).a Ranked on the basis of the magnitude of 2002 FDI flows.
160
140
120
100
80
60
40
20
01990 1991 1992 1993 1994 1995 1996 1997 1998 1999 2000 2001 2002
14
12
10
8
6
4
2
0
Bill
ions
of d
olla
rs
Per
cen
t
FDI inflows
Share in gross fixed capital formation
0 2 4 6 8 10 0 2 4 6 8 10
China
Hong Kong China
Singapore
India
Malaysia
Kazakhstan
Korea, Rep. of
Viet Nam
Philippines
Hong Kong China
Singapore
China
Korea, Rep. of
Iran, Islamic Rep. of
Malaysia
United Arab Emirates
India
Kazakhstan
5347
1811
1424
11
20022001
20022001
Taiwan Province of China
Taiwan Province of China
(a) FDI inflows (b) FDI outflows
World Investment Report 2003 FDI Policies for Development: National and International Perspectives42
higher flows. Turkey, however, remained themain recipient.
• FDI flows to Central Asia rose in 2002 dueto significant increases in FDI flows toAzerbaijan, from $227 million in 2001 to $1billion. Kazakhstan received 9% less FDI in2002 but remained the main recipient, withmost going to oil and gas. FDI flows toArmenia and Georgia increased by more than25%.
• The downturn also affected the Pacific islandseconomies, with FDI down from $159 millionin 2001 to $140 million in 2002. They aredisadvantaged by their size and distance frommajor markets. Fiji and Papua New Guinearemained the principal recipients.
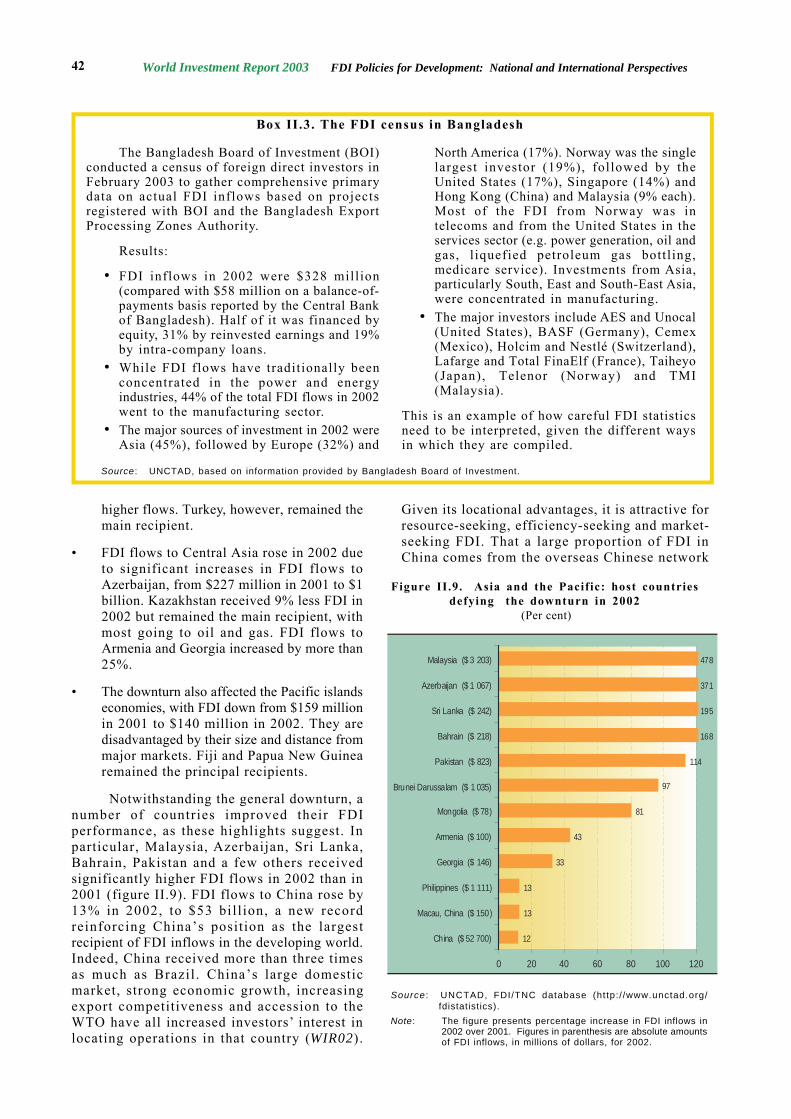
Notwithstanding the general downturn, anumber of countries improved their FDIperformance, as these highlights suggest. Inparticular, Malaysia, Azerbaijan, Sri Lanka,Bahrain, Pakistan and a few others receivedsignificantly higher FDI flows in 2002 than in2001 (figure II.9). FDI flows to China rose by13% in 2002, to $53 bil l ion, a new recordreinforcing China’s position as the largestrecipient of FDI inflows in the developing world.Indeed, China received more than three timesas much as Brazil . China’s large domesticmarket, strong economic growth, increasingexport competitiveness and accession to theWTO have all increased investors’ interest inlocating operations in that country (WIR02).
Given its locational advantages, it is attractive forresource-seeking, efficiency-seeking and market-seeking FDI. That a large proportion of FDI inChina comes from the overseas Chinese network
The Bangladesh Board of Investment (BOI)conducted a census of foreign direct investors inFebruary 2003 to gather comprehensive primarydata on actual FDI inflows based on projectsregistered with BOI and the Bangladesh ExportProcessing Zones Authority.
Results:
• FDI inflows in 2002 were $328 million(compared with $58 million on a balance-of-payments basis reported by the Central Bankof Bangladesh). Half of it was financed byequity, 31% by reinvested earnings and 19%by intra-company loans.
• While FDI flows have traditionally beenconcentrated in the power and energyindustries, 44% of the total FDI flows in 2002went to the manufacturing sector.
• The major sources of investment in 2002 wereAsia (45%), followed by Europe (32%) and
North America (17%). Norway was the singlelargest investor (19%), followed by theUnited States (17%), Singapore (14%) andHong Kong (China) and Malaysia (9% each).Most of the FDI from Norway was intelecoms and from the United States in theservices sector (e.g. power generation, oil andgas, l iquefied petroleum gas bottl ing,medicare service). Investments from Asia,particularly South, East and South-East Asia,were concentrated in manufacturing.
• The major investors include AES and Unocal(United States), BASF (Germany), Cemex(Mexico), Holcim and Nestlé (Switzerland),Lafarge and Total FinaElf (France), Taiheyo(Japan), Telenor (Norway) and TMI(Malaysia).
This is an example of how careful FDI statisticsneed to be interpreted, given the different waysin which they are compiled.
Box II.3. The FDI census in Bangladesh
Source : UNCTAD, based on information provided by Bangladesh Board of Investment.
Figure II.9. Asia and the Pacific: host countriesdefying the downturn in 2002
(Per cent)
Source : UNCTAD, FDI/TNC database (http:/ /www.unctad.org/fdistatistics).
Note: The figure presents percentage increase in FDI inflows in2002 over 2001. Figures in parenthesis are absolute amountsof FDI inflows, in millions of dollars, for 2002.
12
13
13
33
43
81
97
114
168
195
371
478
0 20 40 60 80 100 120
China ($ 52 700)
Macau, China ($ 150)
Philippines ($ 1 111)
Georgia ($ 146)
Armenia ($ 100)
Mongolia ($ 78)
Brunei Darussalam ($ 1 035)
Pakistan ($ 823)
Bahrain ($ 218)
Sri Lanka ($ 242)
Azerbaijan ($ 1 067)
Malaysia ($ 3 203)
CHAPTER II 43
and other TNCs less affected by the globaleconomic slowdown, contributed to the increasein FDI flows to China.18
FDI flows to India rose to $3.4 bill ion,sustaining it as the largest recipient in South Asia.The country’s market potential, improved economicperformance, growing competit iveness ofinformation technology industries and impetus ofrecent liberalization are factors attracting more FDIinto the country. Although India and China bothreceived increased FDI flows, their performancehas been strikingly different (box II.4).
Oil and mining do better than manufacturingand services. The primary sector—especially oiland mining—weathered the 2001–2002 downturnbetter than manufacturing and services did, despitegeopolitical tensions and volatile oil prices. In themore developed economies—also more service-oriented—the share of FDI in services rose. In 2002the share of the tertiary sector in total FDI inflowsto the Republic of Korea increased by 13percentage points and to Singapore by 0.8
percentage points. The share of tertiary sector FDIto Hong Kong (China) is expected to remain highin 2002.19 In other countries FDI in manufacturingfell but the sector gained in terms of share. In Chinamanufacturing’s share, already high, rose from 66%in 2001 to 70% in 2002. In the ASEAN subregion,it rose from 23% in 1999 to 45% in 2000 and 49%in 2001. FDI in the other subregions was dominatedby investment in resource-based or oil and gasindustries.
Intra-company loans down sharply. In termsof financial components of FDI, intra-companyloans dropped sharply. For instance, intra-companyloans in Hong Kong (China), the Republic of Koreaand Thailand declined significantly in 2002 (annextable A.II.1). And foreign affiliates in Indonesia,Malaysia, Philippines and Singapore have beenmaking significant repayments.20
Large repayments of intra-company loanshave been noticeable since 1999, particularly incountries affected by the 1997–1998 financialcrisis. One reason might be exchange rate
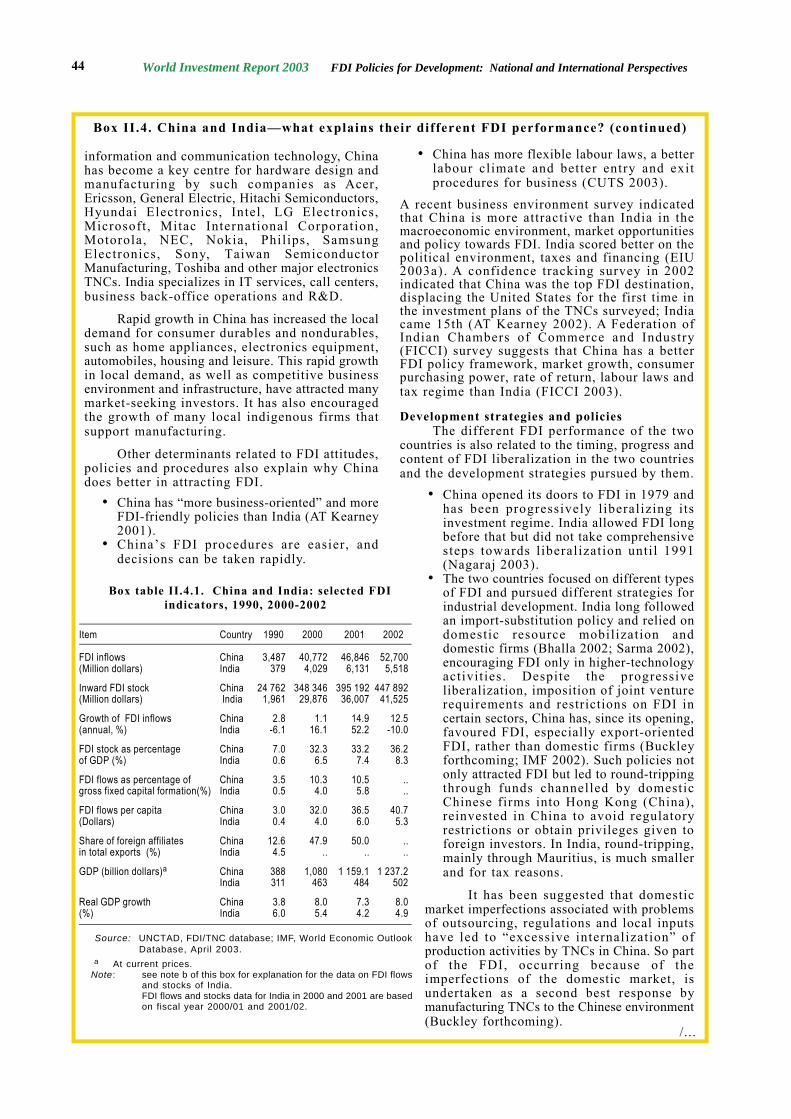
China and India are the giants of thedeveloping world. Both enjoy healthy rates ofeconomic growth. But there are significantdifferences in their FDI performance. FDI flowsto China grew from $3.5 billion in 1990 to $52.7billion in 2002; if round-tripping is taken intoaccount, China’s FDI inflows could fall to, say,$40 billion.a Those to India rose from $0.4 billionto $5.5 billion during the same time period (boxtable II.4.1).b
Even with these adjustments, China attractedseven times more FDI than India in 2002, 3.2% ofits GDP compared with 1.1% for India.c InUNCTAD’s FDI Performance Index, China ranked54th and India 122nd in 1999–2001.
FDI has contributed to the rapid growth ofChina’s merchandise exports, at an annual rate of15% between 1989 and 2001. In 1989 foreignaffil iates accounted for less than 9% of totalChinese exports; by 2002 they provided half. Insome high-tech industries in 2000 the share offoreign affiliates in total exports was as high as91% in electronics circuits and 96% in mobilephones (WIR02, pp. 162-163). About two-thirdsof FDI flows to China in 2000–2001 went tomanufacturing.
In India, by contrast, FDI has been much lessimportant in driving India’s export growth, exceptin information technology. FDI in Indianmanufacturing has been and remains domesticmarket-seeking. FDI accounted for only 3% ofIndia’s exports in the early 1990s (WIR02, pp. 154-
Box II.4. China and India—what explains their different FDI performance?
163). Even today, FDI is estimated to account forless than 10% of India’s manufacturing exports(UNCTAD forthcoming a).
For China the lion’s share of FDI inflows in2000–2001 went to a broad range of manufacturingindustries. For India most went to services,electronics and electrical equipment andengineering and computer industries.
What explains the differences? Basicdeterminants, development strategies and policiesand overseas networks.
Basic determinantsOn the basic economic determinants of
inward FDI, China does better than India. China’stotal and per capita GDP are higher (box tableII.4.1), making it more attractive for market-seeking FDI. Its higher literacy and education ratessuggest that its labour is more skilled, making itmore attractive to efficiency-seeking investors(World Bank 2003c, p. 234; UNDP 2002). Chinaalso has large natural resource endowments. Inaddition, China’s physical infrastructure is morecompetitive, particularly in the coastal areas (CUTS2003, Marubeni Corporation Economic ResearchInstitute 2002). But, India may have an advantagein technical manpower, particularly in informationtechnology. It also has better English languageskills.
Some of the differences in competitiveadvantages of the two countries are illustrated bythe composition of their inward FDI flows. In
/...
World Investment Report 2003 FDI Policies for Development: National and International Perspectives44
/...
information and communication technology, Chinahas become a key centre for hardware design andmanufacturing by such companies as Acer,Ericsson, General Electric, Hitachi Semiconductors,Hyundai Electronics, Intel , LG Electronics,Microsoft , Mitac International Corporation,Motorola, NEC, Nokia, Philips, SamsungElectronics, Sony, Taiwan SemiconductorManufacturing, Toshiba and other major electronicsTNCs. India specializes in IT services, call centers,business back-office operations and R&D.
Rapid growth in China has increased the localdemand for consumer durables and nondurables,such as home appliances, electronics equipment,automobiles, housing and leisure. This rapid growthin local demand, as well as competitive businessenvironment and infrastructure, have attracted manymarket-seeking investors. It has also encouragedthe growth of many local indigenous firms thatsupport manufacturing.
Other determinants related to FDI attitudes,policies and procedures also explain why Chinadoes better in attracting FDI.
• China has “more business-oriented” and moreFDI-friendly policies than India (AT Kearney2001).
• China’s FDI procedures are easier, anddecisions can be taken rapidly.
Box II.4. China and India—what explains their different FDI performance? (continued)
• China has more flexible labour laws, a betterlabour climate and better entry and exitprocedures for business (CUTS 2003).
A recent business environment survey indicatedthat China is more attractive than India in themacroeconomic environment, market opportunitiesand policy towards FDI. India scored better on thepolitical environment, taxes and financing (EIU2003a). A confidence tracking survey in 2002indicated that China was the top FDI destination,displacing the United States for the first time inthe investment plans of the TNCs surveyed; Indiacame 15th (AT Kearney 2002). A Federation ofIndian Chambers of Commerce and Industry(FICCI) survey suggests that China has a betterFDI policy framework, market growth, consumerpurchasing power, rate of return, labour laws andtax regime than India (FICCI 2003).
Development strategies and policiesThe different FDI performance of the two
countries is also related to the timing, progress andcontent of FDI liberalization in the two countriesand the development strategies pursued by them.
• China opened its doors to FDI in 1979 andhas been progressively l iberalizing itsinvestment regime. India allowed FDI longbefore that but did not take comprehensivesteps towards l iberalization until 1991(Nagaraj 2003).
• The two countries focused on different typesof FDI and pursued different strategies forindustrial development. India long followedan import-substitution policy and relied ondomestic resource mobilization anddomestic firms (Bhalla 2002; Sarma 2002),encouraging FDI only in higher-technologyactivit ies. Despite the progressiveliberalization, imposition of joint venturerequirements and restrictions on FDI incertain sectors, China has, since its opening,favoured FDI, especially export-orientedFDI, rather than domestic firms (Buckleyforthcoming; IMF 2002). Such policies notonly attracted FDI but led to round-trippingthrough funds channelled by domesticChinese firms into Hong Kong (China),reinvested in China to avoid regulatoryrestrictions or obtain privileges given toforeign investors. In India, round-tripping,mainly through Mauritius, is much smallerand for tax reasons.
It has been suggested that domesticmarket imperfections associated with problemsof outsourcing, regulations and local inputshave led to “excessive internalization” ofproduction activities by TNCs in China. So partof the FDI, occurring because of theimperfections of the domestic market, isundertaken as a second best response bymanufacturing TNCs to the Chinese environment(Buckley forthcoming).
Box table II.4.1. China and India: selected FDIindicators, 1990, 2000-2002
Item Country 1990 2000 2001 2002
FDI inflows China 3,487 40,772 46,846 52,700(Million dollars) India 379 4,029 6,131 5,518
Inward FDI stock China 24 762 348 346 395 192 447 892(Million dollars) India 1,961 29,876 36,007 41,525
Growth of FDI inflows China 2.8 1.1 14.9 12.5(annual, %) India -6.1 16.1 52.2 -10.0
FDI stock as percentage China 7.0 32.3 33.2 36.2of GDP (%) India 0.6 6.5 7.4 8.3
FDI flows as percentage of China 3.5 10.3 10.5 ..gross fixed capital formation(%) India 0.5 4.0 5.8 ..
FDI flows per capita China 3.0 32.0 36.5 40.7(Dollars) India 0.4 4.0 6.0 5.3
Share of foreign affiliates China 12.6 47.9 50.0 ..in total exports (%) India 4.5 .. .. ..
GDP (billion dollars)a China 388 1,080 1 159.1 1 237.2India 311 463 484 502
Real GDP growth China 3.8 8.0 7.3 8.0(%) India 6.0 5.4 4.2 4.9
Source: UNCTAD, FDI/TNC database; IMF, World Economic OutlookDatabase, April 2003.
a At current prices.Note: see note b of this box for explanation for the data on FDI flows
and stocks of India.FDI flows and stocks data for India in 2000 and 2001 are basedon fiscal year 2000/01 and 2001/02.
CHAPTER II 45
Box II.4. China and India—what explains their different FDI performance? (concluded)
For India the situation is somewhat different.A tradition of entrepreneurship has spawned a broadbased domestic enterprise sector (Huang and Khanna2003). This combines with the necessary legal andinstitutional infrastructure and a restrictive FDIpolicies followed until the 1990s. As a result, TNCparticipation in production has often takenexternalized forms (such as licensing and othercontractual arrangements). Even after a significantliberalization of FDI policies, internalization is notnecessarily dominant. Consider informationtechnology, industries where outsourcing to privateIndian firms is efficient and there are quali tydomestic subcontractors.
China’s accession to the WTO in 2001 has ledto the introduction of more favourable FDImeasures. With further liberalization in the servicessector, China’s investment environment may befurther enhanced. For instance, China will allow100% foreign equity ownership in such industriesas leasing, storage and warehousing and wholesaleand retail trade by 2004, advertising and multimodaltransport services by 2005, insurance brokerage by2006 and transportation of goods (railroad) by 2007.In retail trade, China has already opened andattracted FDI from nearly all the big-namedepartment stores and supermarkets such as Auchan,Carrefour, Diary Farm, Ito Yokado, Jusco, Makro,Metro, Pricesmart, 7-Eleven and Wal-Mart(PriceWaterhouseCoopers 2002).
In India the Government is planning to opensome more industries for FDI and further relax theforeign equity ownership ceiling (EIU 2003a). Toidentify approaches to increase FDI flows, thePlanning Commission established a steeringcommittee on FDI in August 2001. Following theChinese model, India recently took steps to establishspecial economic zones. China’s special economiczones have been more successful than Indian exportprocessing zones in promoting trade and attractingFDI (Bhalla 2002).
Overseas networksIn addition to economic and policy-related
factors, an important explanation for China’s largerFDI flows lies in its position as the destination ofchoice for FDI by Chinese businesses andindividuals overseas, especially in Asia. The roleof the Chinese business networks abroad and theirsignificant investment in mainland China contrastswith the much smaller Indian overseas networks and
investment in India (Bhalla 2002). Why? OverseasChinese are more in number, tend to be moreentrepreneurial, enjoy family connections (guanxi)in China and have the interest and financialcapability to invest in China—and when they do,they receive red-carpet treatment. Overseas Indiansare fewer, more of a professional group and, unlikethe Chinese, often lack the family networkconnections and financial resources to invest inIndia.
***Both China and India are good candidates for
the relocation of labour-intensive activities byTNCs, a major factor in the growth of Chineseexports. In India, however, this has been primarilyin services, notably information and communicationtechnology. Indeed, almost all major United Statesand European information technology firms are inIndia, mostly in Bangalore. Companies such asAmerican Express, British Airways, Conseco, DellComputer and GE Capital have their back-officeoperations in India. Other companies—such asAmazon.com and Citigroup—outsource services tolocal or foreign companies already established inthe country (AT Kearney 2003). Foreign companiesdominate India’s call centre industry, with a 60%share of the annual $1.5 billion turnover.
Investor sentiment on China as a location forinvestment is improving (MIGA 2002; AT Kearney2002; American Chamber of Commerce in China2002). Nearly 80% of all Fortune 500 companiesare in China (WIR01, p. 26), while 37% of theFortune 500 outsource from India (NASSCOM2001). Despite the improvement in India’s policyenvironment, TNC investment interest remainslukewarm, with some exceptions, such as ininformation and communication technology (ATKearney 2001).
The prospects for FDI flows to China andIndia are promising, assuming that both countrieswant to accord FDI a role in their developmentprocess — a sovereign decision. The large marketsize and potential, the skilled labour force and thelow wage cost will remain key attractions. Chinawill continue to be a magnet of FDI flows andIndia’s biggest competitor. But, FDI flows to Indiaare set to rise — helped by a vibrant domesticenterprise sector and if policy reforms continue andthe Government is committed to the objective ofattracting FDI flows to the country.
Source : UNCTAD.a FDI flows to China are generally considered to be over-reported due to the inclusion of round tripping (investment from locations
abroad by investors from China) in China’s FDI data, while those to India were under-reported due to the non-inclusion of reinvestedearnings and intra-company loans in that country’s data. Zhan (1995, pp. 91-92) estimated that round-tripping to China was lessthan 25%, the prevailing estimate at the time (Harrold and Lall 1993). However, with China’s accession to the WTO in December2001 and the removal of preferential treatment to foreign investors over domestic investors, round-tripping of Chinese FDI islikely to fall (World Bank 2003a, p. 102). The Bank of China Group indicated in an article that “… the market’s general assessmentis that the ratio (round-tripping to China) has declined from 30% to around 10–20% in recent years.” (“Foreign direct investmentin China”, Hong Kong Trade and Development Cooperation, 1 January 2003 (http://www.tdctrade.com/econforum/boc/boc030101.htm).
b Based on the revised FDI data methodology, which includes the three components of FDI, India reported that FDI flows to thecountry increased from $4.1 billion in fiscal year 2000/01 to $6.1 billion in fiscal year 2001/02. This means that actual inflowswere about 60% higher than those reported earlier. This ratio is applied to arrive at the 1990 and the 2002 data for India. (Thedata in the annex to this report are still old ones, as the new ones arrived after closure of the statistical work).
c The figure for China after taking into account round-tripping (25% of FDI flows). The figure for India is based on the methodologymentioned in note b.
World Investment Report 2003 FDI Policies for Development: National and International Perspectives46
instability, inducing foreign affiliates to make earlyloan repayments to hedge against exchange raterisks. Other reasons relate to the improved financialposition of Asian affiliates in the post-financialcrisis situation and the fact that a great part of intra-company loans provided by parent companies tothe Asian affiliates to overcome the 1997–1998financial crisis are probably due for repayment.In addition, the declining profitability and tightfinancial conditions faced by parent companies andthe need to strengthen their balance sheets couldhave led to early repayment.21
Reinvested earnings rose and remained asignificant source of finance for FDI activities inseveral economies, including China, Hong Kong(China), Malaysia, the Philippines and Singapore.22
Good returns on FDI—in most cases higher thanthe developing country average (annex tableA.II.2)—and a positive economic outlook helpedmitigating the downturn.23 Equity capital, the thirdcomponent of FDI, also declined in most countries,particularly for the newly industrial economies andsome ASEAN countries.
Outward FDI flows from Asia and the Pacificfell in 2002, by marginally more than inflows(annex table B.2). The Asian newly industrialeconomies, China and a few other ASEANcountries are notable sources,24 concentrated onmanufacturing and natural resources. Of the top50 TNCs from developing countries in 2001, rankedby foreign assets, 33 of them were from Asia(annex table A.I.2).
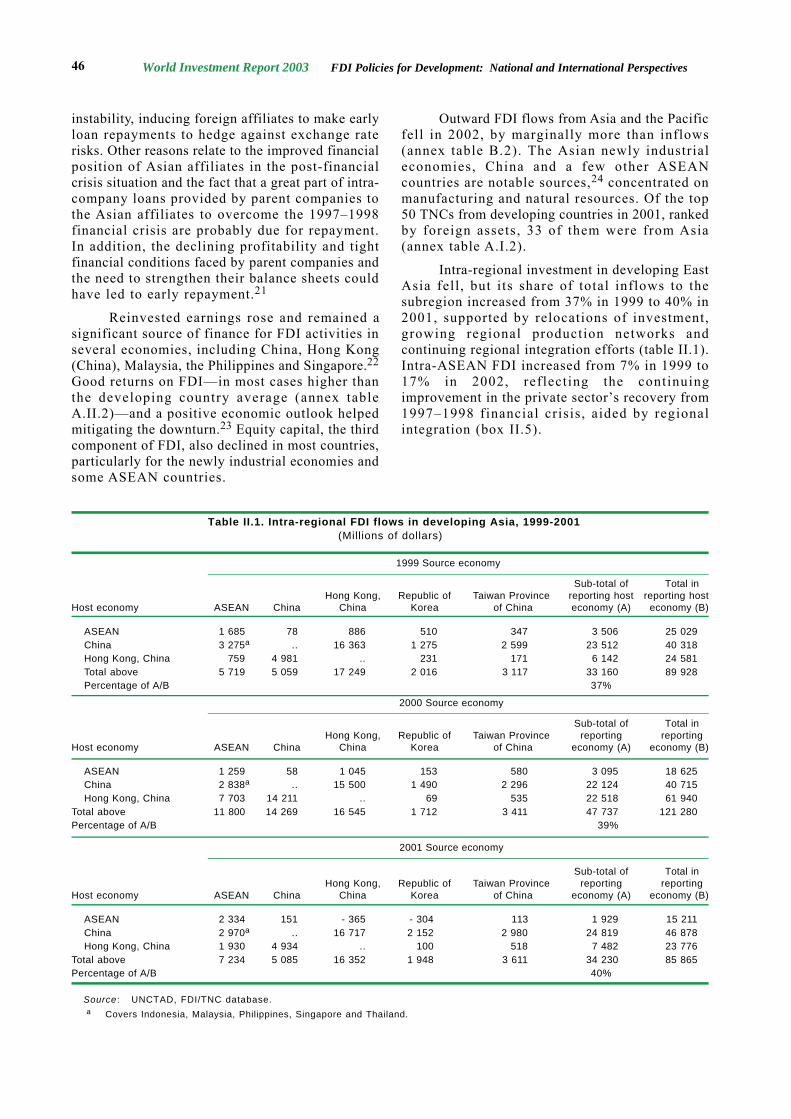
Intra-regional investment in developing EastAsia fell , but its share of total inflows to thesubregion increased from 37% in 1999 to 40% in2001, supported by relocations of investment,growing regional production networks andcontinuing regional integration efforts (table II.1).Intra-ASEAN FDI increased from 7% in 1999 to17% in 2002, reflecting the continuingimprovement in the private sector’s recovery from1997–1998 financial crisis, aided by regionalintegration (box II.5).
Table II.1. Intra-regional FDI flows in developing Asia, 1999-2001(Millions of dollars)
1999 Source economy
Sub-total of Total inHong Kong, Republic of Taiwan Province reporting host reporting host
Host economy ASEAN China China Korea of China economy (A) economy (B)
ASEAN 1 685 78 886 510 347 3 506 25 029China 3 275a .. 16 363 1 275 2 599 23 512 40 318Hong Kong, China 759 4 981 .. 231 171 6 142 24 581Total above 5 719 5 059 17 249 2 016 3 117 33 160 89 928Percentage of A/B 37%
2000 Source economy
Sub-total of Total inHong Kong, Republic of Taiwan Province reporting reporting
Host economy ASEAN China China Korea of China economy (A) economy (B)
ASEAN 1 259 58 1 045 153 580 3 095 18 625China 2 838a .. 15 500 1 490 2 296 22 124 40 715Hong Kong, China 7 703 14 211 .. 69 535 22 518 61 940
Total above 11 800 14 269 16 545 1 712 3 411 47 737 121 280Percentage of A/B 39%
2001 Source economy
Sub-total of Total inHong Kong, Republic of Taiwan Province reporting reporting
Host economy ASEAN China China Korea of China economy (A) economy (B)
ASEAN 2 334 151 - 365 - 304 113 1 929 15 211China 2 970a .. 16 717 2 152 2 980 24 819 46 878Hong Kong, China 1 930 4 934 .. 100 518 7 482 23 776
Total above 7 234 5 085 16 352 1 948 3 611 34 230 85 865Percentage of A/B 40%
Source : UNCTAD, FDI/TNC database.a Covers Indonesia, Malaysia, Philippines, Singapore and Thailand.
CHAPTER II 47
Several studies at the firm level suggest thatthe ASEAN Free Trade Agreement (AFTA) hasinfluenced TNCs’ decisions to invest in the region,especially in the automotive and electronicsindustries (Baldwin 1997; Dobson and China 1997;Japan Research Institute Limited 2001). But itappears that some rationalization in the automotiveindustry has occurred as well, with implications forthe distribution of flows (Farrell and Findlay 2001).
A cross-sectional regression analysis of UnitedStates outward FDI suggested that the major ASEANhost countries (Malaysia, the Philippines, Singaporeand Thailand) received more FDI than the analysispredicted for 1994 (Lipsey 1999). This could implypositive effects of AFTA on FDI flows from theUnited States.
In another econometric study of United StatesFDI flows to the ASEAN-5 and 26 other countries,market size (GDP) was found to be positivelyrelated to FDI flows. And some evidence of anegative relationship between FDI and tariff rateswas found over the entire 31-country sample(Parsons and Heinrich 2003). While the “AFTAeffect” was ambiguous in this study, a moreintegrated market and lower duties on vital importedintermediate goods may have encouraged moremarket-seeking and efficiency-seeking FDI to theregion.
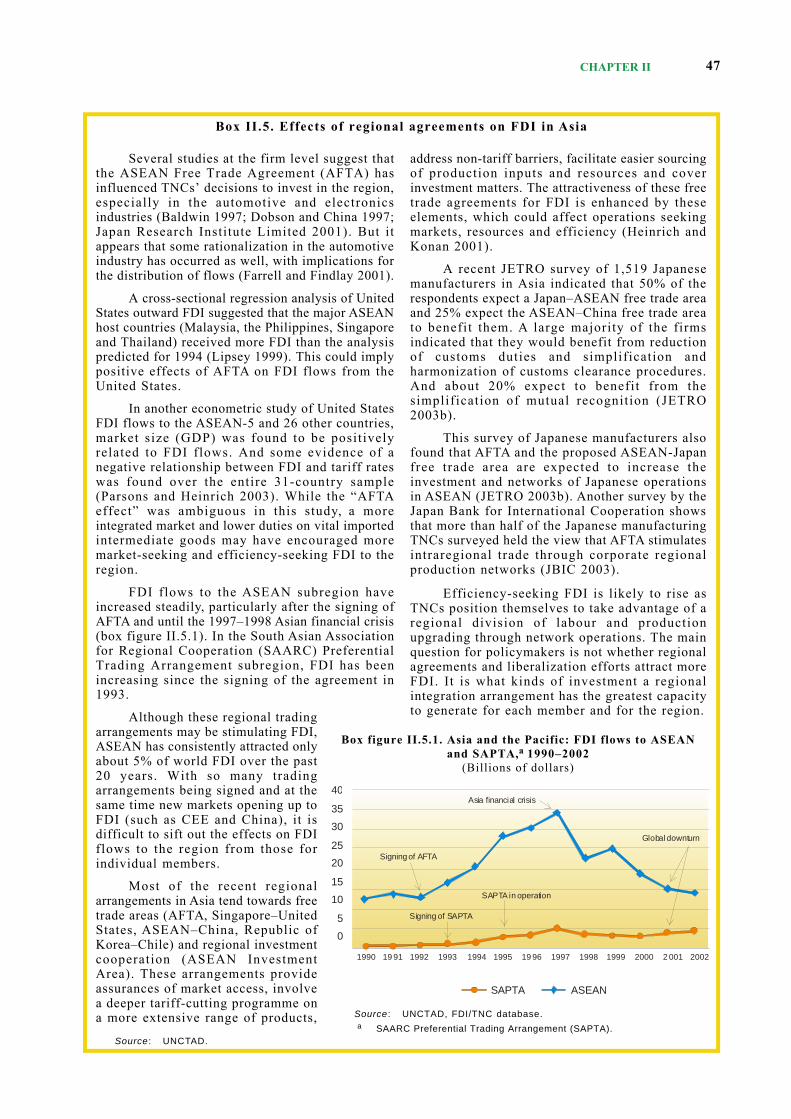
FDI flows to the ASEAN subregion haveincreased steadily, particularly after the signing ofAFTA and until the 1997–1998 Asian financial crisis(box figure II.5.1). In the South Asian Associationfor Regional Cooperation (SAARC) PreferentialTrading Arrangement subregion, FDI has beenincreasing since the signing of the agreement in1993.
Although these regional tradingarrangements may be stimulating FDI,ASEAN has consistently attracted onlyabout 5% of world FDI over the past20 years. With so many tradingarrangements being signed and at thesame time new markets opening up toFDI (such as CEE and China), it isdifficult to sift out the effects on FDIflows to the region from those forindividual members.
Most of the recent regionalarrangements in Asia tend towards freetrade areas (AFTA, Singapore–UnitedStates, ASEAN–China, Republic ofKorea–Chile) and regional investmentcooperation (ASEAN InvestmentArea). These arrangements provideassurances of market access, involvea deeper tariff-cutting programme ona more extensive range of products,
address non-tariff barriers, facilitate easier sourcingof production inputs and resources and coverinvestment matters. The attractiveness of these freetrade agreements for FDI is enhanced by theseelements, which could affect operations seekingmarkets, resources and efficiency (Heinrich andKonan 2001).
A recent JETRO survey of 1,519 Japanesemanufacturers in Asia indicated that 50% of therespondents expect a Japan–ASEAN free trade areaand 25% expect the ASEAN–China free trade areato benefit them. A large majority of the firmsindicated that they would benefit from reductionof customs duties and simplification andharmonization of customs clearance procedures.And about 20% expect to benefit from thesimplification of mutual recognition (JETRO2003b).
This survey of Japanese manufacturers alsofound that AFTA and the proposed ASEAN-Japanfree trade area are expected to increase theinvestment and networks of Japanese operationsin ASEAN (JETRO 2003b). Another survey by theJapan Bank for International Cooperation showsthat more than half of the Japanese manufacturingTNCs surveyed held the view that AFTA stimulatesintraregional trade through corporate regionalproduction networks (JBIC 2003).
Efficiency-seeking FDI is likely to rise asTNCs position themselves to take advantage of aregional division of labour and productionupgrading through network operations. The mainquestion for policymakers is not whether regionalagreements and liberalization efforts attract moreFDI. It is what kinds of investment a regionalintegration arrangement has the greatest capacityto generate for each member and for the region.
Box II.5. Effects of regional agreements on FDI in Asia
Source : UNCTAD.
Box figure II.5.1. Asia and the Pacific: FDI flows to ASEANand SAPTA,a 1990–2002
(Billions of dollars)
Source : UNCTAD, FDI/TNC database.a SAARC Preferential Trading Arrangement (SAPTA).
1990 19 91 1992 1993 1994 1995 19 96 1997 1998 1999 2000 2 001 2002
40
35
30
25
20
15
10
5
0
SAPTA ASEAN
Signing of AFTA
Signing of SAPTA
SAPTA in operation
Asia financial crisis
Global downturn
World Investment Report 2003 FDI Policies for Development: National and International Perspectives48
b. Policy developments—moreunilateral measures to improvethe investment environment
Many countries introduced unilateral policymeasures to further liberalize their FDI regimes.They relaxed limitations on foreign equityownership, l iberalized sectoral restrictions,streamlined approval procedures, grantedincentives, relaxed foreign exchange controls andoffered investment guarantees. For instance, Chinarelaxed foreign shareholding limitations in thedomestic airlines industry from 35% to 49%; theShenzhen Municipal Government in Chinaestablished a centre to handle and coordinateforeign investors’ complaints; India announced in2002 a plan to allow foreign companies to own upto 74% equity in print media business; the Republicof Korea offered new tax incentive to attract FDI;Lao People’s Democratic Republic streamlined itsinvestment application procedures; Malaysiaannounced incentives for operational headquartersand R&D centers; Thailand relaxed the conditionsgoverning the location of promoted projects in thecountry; and Viet Nam further relaxed conditions
regarding foreign equity ownership in local privatecompanies. ASEAN members are taking steps topromote FDI jointly to the region by holdinginvestment fairs together and organising an ASEANBusiness and Investment Summit in October 2003.Under the ASEAN Investment Area Agreement, theASEAN countries have phased in the TemporaryExclusion List of manufacturing sectors on 1January 2003, opening more industries and grantingnational treatment to ASEAN investors. Indonesiadeclared 2003 as the “Indonesia Investment Year”,with a number of favourable policy changes to beintroduced (box II.6). And investment promotionis receiving more attention: 64% of the Asian andPacific IPAs surveyed indicated that they haveintensified their promotion efforts in 2002 inresponse to the downturn (UNCTAD 2003a). Halfthe countries made more use of investmenttargeting, 25% reported additional incentives and36% further liberalization.
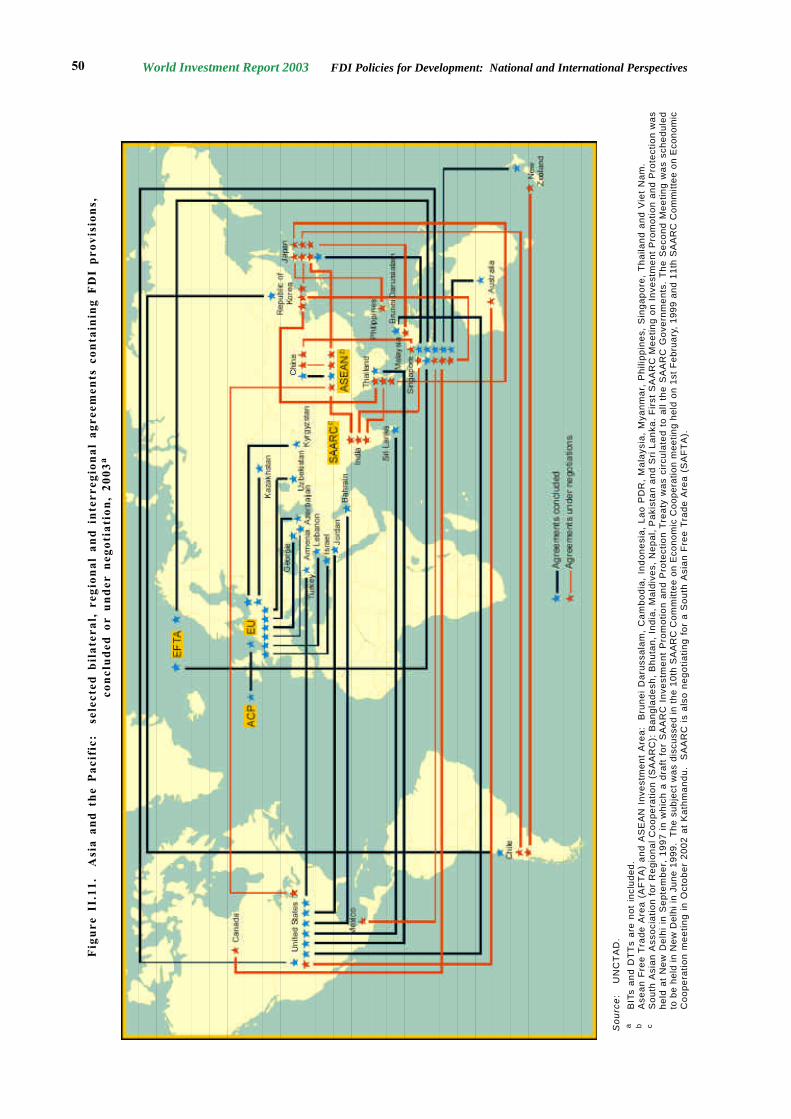
Bilateral treaties have further strengthenedthe region’s policy framework. By the end of 2002,countries in the Asia and Pacific region were partyto 1,003 BITs (an average of 18 BITs per countryfor 57 economies) and 842 DTTs (an average of15 DTTs per country)—more than any otherdeveloping region (figure II.10). Bilateral free tradeagreements have also been increasing, withSingapore as the main hub and the EU and theUnited States as the main partner (figure II.11).They contain (at times substantial) investmentprovisions, underlining that investment has becomea key consideration in economic cooperation.
For example, the Republic of Korea–Chileand the Singapore–United States free tradeagreements contain a range of investmentprovisions. And the ASEAN–China arrangementcontains provisions on investment liberalization,transparency and facilitation. In many negotiationsASEAN is taking the lead. By 2005 the Asia andPacific region is likely to have a dense web ofbilateral and regional free trade agreements—mostof them likely to include investment provisions,a trend that differs conspicuously from earlierregional and bilateral arrangements.
Thus, countries in the region are takingsteps—unilaterally, bilaterally and collectively—to enhance their investment policy frameworks andsupport their regional integration process. Theyare forging closer economic cooperation in anuncertain multi lateral environment. They arepromoting FDI flows to countries in the regiongenerally, especially in the light of China’s success.And they are strengthening trade and productionlinkages to enhance access to complementaryresources and strengthen competitiveness.
Box II.6. Indonesia’s Investment Year 2003
To promote FDI and increase investorconfidence, the President of the Republic ofIndonesia declared the “Indonesia Investment Year2003”. The new National Investment Team,chaired by the President, includes key cabinetministers. An Investment Working Group, chairedby the Chairperson of the Investment CoordinatingBoard, provides technical support to the NationalInvestment Team.
A “one roof service”, supervised by theInvestment Coordinating Board, will expediteinvestment approvals for all investors, existingand new, foreign and domestic. It will simplifyprocedures and improve the coordination ofvarious agencies, including regional governments.In parallel, the Board will improve its pre- andpost-investment services at the national andregional levels.
The Board has a detailed action plan tosupport Investment Year activities. Its objectivesare to support institutional and legal changes forinvestment, improve investor relations andcommunications and promote foreign investment.Noting the importance of investment advocacyand the involvement of the general public insupporting investment efforts, the Governmentwill improve communication and collaborationwith investors, parliament and regionalgovernments.
Source: UNCTAD.
CHAPTER II 49
Some countries that so far have largelyremained outside the proliferating treaty networkare beginning to join in. For example, Japanrecently concluded a treaty with Singapore (boxIII.2) and is negotiating other bilateral agreements.And India is negotiating a free trade agreement withASEAN. It is important to emphasize that bilateraland regional arrangements (with one exception, theASEAN Investment Area) were not established forthe primary purpose of attracting FDI. Theirobjective is broader: to increase trade flows,enhance regional economic integration, facilitatea division of labour and increase competitiveness—also improving the locational attractiveness of themembers. Perhaps because of their broader focus,regional arrangements can be more effectiveinstruments for attracting FDI than BITs and DTTs.
How do these arrangements influence FDIflows to the region? How do they strengthen thelocational advantages of the region and itsmembers? And how will TNCs adjust theirinvestment strategies? Because most of theagreements are recent, it is difficult to assess theireffects on FDI flows (box II.5, annex table A.II.3).One thing is clear, though: to the extent that theyliberalize trade (and regardless of whether theyaddress FDI or not), they encourage FDI (box II.7)and they facilitate the emergence of a regionaldivision of labour and production in the frameworkof corporate regional production networks (boxII.8).
c. Long-term prospects promisingbut short-term outlookuncertain
Prospects for a rise in FDI inflows in 2003are slim, and the short term continues to beuncertain. Developments in West Asia and the
economic impact of the severe acute respiratorysyndrome (SARS) add to this uncertainty.25 Despitethese factors and a possible increase in competition,the Asia and Pacific region will continue to be thelargest FDI recipient among developing regionsin 2003. This view is supported by studies by theWorld Bank (2003a, p.102) and the Institute ofInternational Finance (2003).
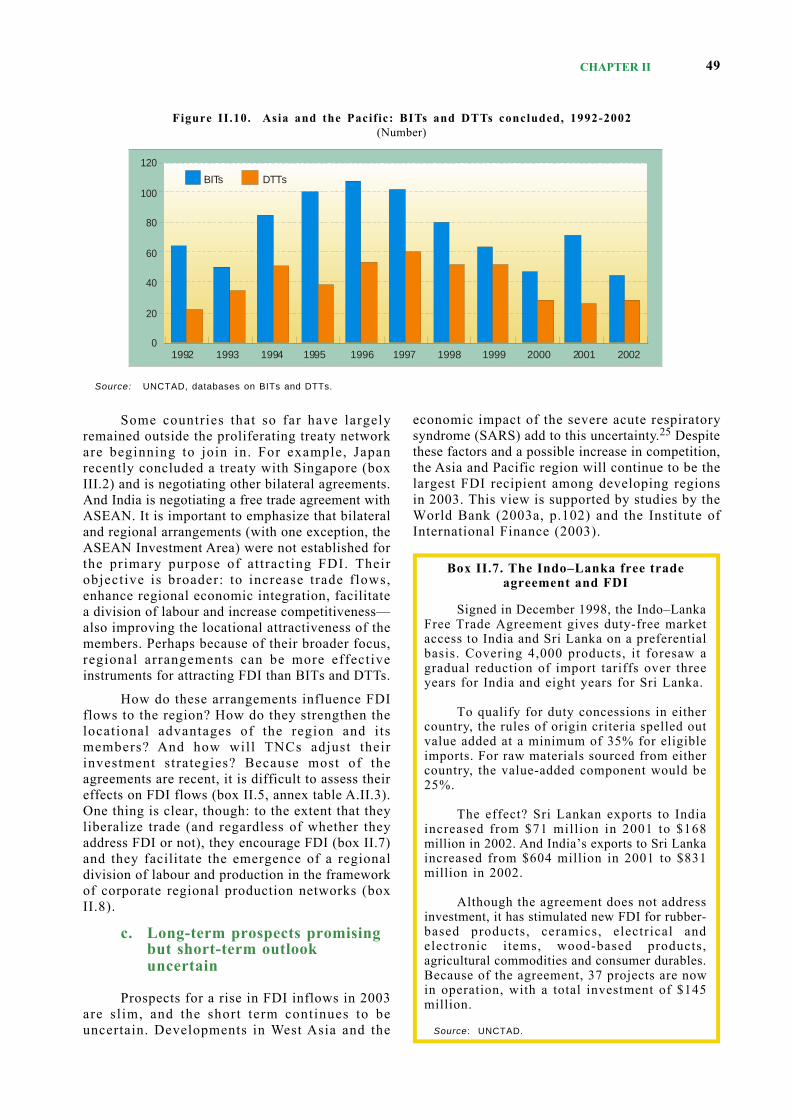
Figure II.10. Asia and the Pacific: BITs and DTTs concluded, 1992-2002(Number)
Source: UNCTAD, databases on BITs and DTTs.
Box II.7. The Indo–Lanka free tradeagreement and FDI
Signed in December 1998, the Indo–LankaFree Trade Agreement gives duty-free marketaccess to India and Sri Lanka on a preferentialbasis. Covering 4,000 products, it foresaw agradual reduction of import tariffs over threeyears for India and eight years for Sri Lanka.
To qualify for duty concessions in eithercountry, the rules of origin criteria spelled outvalue added at a minimum of 35% for eligibleimports. For raw materials sourced from eithercountry, the value-added component would be25%.
The effect? Sri Lankan exports to Indiaincreased from $71 million in 2001 to $168million in 2002. And India’s exports to Sri Lankaincreased from $604 million in 2001 to $831million in 2002.
Although the agreement does not addressinvestment, it has stimulated new FDI for rubber-based products, ceramics, electrical andelectronic i tems, wood-based products,agricultural commodities and consumer durables.Because of the agreement, 37 projects are nowin operation, with a total investment of $145million.
Source: UNCTAD.
120
100
80
60
40
20
01992 1993 1994 1995 1996 1997 1998 1999 2000 2001 2002
BITs DTTs
World Investment Report 2003 FDI Policies for Development: National and International Perspectives50
Fig
ure
II.1
1.
Asi
a an
d th
e P
acif
ic:
sel
ecte
d bi
late
ral,
reg
iona
l an
d in
terr
egio
nal
agre
emen
ts c
onta
inin
g F
DI
prov
isio
ns,
conc
lude
d or
und
er n
egot
iati
on,
2003
a
So
urc
e:
UN
CT
AD
.a
BIT
s a
nd
DT
Ts
are
not
incl
uded
.b
Ase
an
Fre
e T
rad
e A
rea
(A
FT
A)
an
d A
SE
AN
In
vest
me
nt
Are
a:
Bru
ne
i D
aru
ssa
lam
, C
am
bo
dia
, In
do
ne
sia
, L
ao
PD
R,
Ma
lays
ia,
Mya
nm
ar,
Ph
ilip
pin
es,
Sin
ga
po
re,
Th
aila
nd
an
d V
iet
Na
m.
cS
ou
th A
sia
n A
sso
cia
tion
fo
r R
eg
ion
al C
oo
pe
ratio
n (
SA
AR
C):
Ba
ng
lad
esh
, B
hu
tan
, In
dia
, M
ald
ive
s, N
ep
al,
Pa
kist
an
an
d S
ri L
an
ka.
Fir
st S
AA
RC
Me
etin
g o
n I
nve
stm
en
t P
rom
otio
n a
nd
Pro
tect
ion
wa
sh
eld
at
Ne
w D
elh
i in
Se
pte
mb
er,
19
97
in
wh
ich
a d
raft
fo
r S
AA
RC
In
vest
me
nt
Pro
mo
tion
an
d P
rote
ctio
n T
rea
ty w
as
circ
ula
ted
to
all
the
SA
AR
C G
ove
rnm
en
ts.
Th
e S
eco
nd
Me
etin
g w
as
sch
ed
ule
dto
be
held
in N
ew D
elhi
in J
une
1999
. T
he s
ubje
ct w
as d
iscu
ssed
in t
he 1
0th
SA
AR
C C
omm
ittee
on
Eco
nom
ic C
oope
ratio
n m
eetin
g he
ld o
n 1s
t F
ebru
ary,
199
9 an
d 11
th S
AA
RC
Com
mitt
ee o
n E
cono
mic
Co
op
era
tion
me
etin
g i
n O
cto
be
r 2
00
2 a
t K
ath
ma
nd
u.
SA
AR
C i
s a
lso
ne
go
tiatin
g f
or
a S
ou
th A
sia
n F
ree
Tra
de
Are
a (
SA
FT
A).
CHAPTER II 51
In the medium term, as the growth of theworld economy resumes and the developing Asianregion grows at expected rates of 6.3% in 2003 and6.5% in 2004,26 the prospects for FDI flows to theAsia and Pacific region remain good, particularlyfor automobiles and electrical and electronicsproducts. In addition, weak global demand, shakencorporate confidence and adjustments insemiconductors and electronics are l ikely toimprove in the near future.
The 28 IPAs responding to UNCTAD’s IPASurvey indicated that one in five Asian countrieshad suffered from a scaling-down of investmentprojects or a divestment by TNCs in 2002(UNCTAD 2003a). Just over half of the respondentsclaimed that planned investments had beenpostponed. Looking ahead, about two-thirds of therespondents expected improved FDI prospects for2003–2004, and almost all even better prospectsfor 2004–2005 (figure II.12). The United States,
ASEAN, through AFTA, provides a regionalmarket with more than 500 million people, acombined GDP of $560 billion in 2001 and aninternal tariff rate of no more than 5%. ASEANis also integrating through the ASEAN InvestmentArea, the ASEAN Framework Agreement onServices and infrastructure linkages. Regionalproduction networks are not new in the region(Dobson and Chia 1997), but the recent integrationis leading more TNCs to explore the creation ofmore such networks, particularly in the automobileand automotive components industries as well asthe electronics industry (ASEAN Secretariat 2001):
• Japanese and other automakers areconsolidating their production in the regionand adopting regional production networkstrategies and plant specialization to servicethe AFTA market (Japan Research InstituteLimited 2001).
• Honda Motor Company plans to streamlineits production in ASEAN, with some modelsto be centralized in Thailand.
• Toyota has a network of operations linkingdifferent functions—such as regional HQ,assembling facilities, financing and trainingcentres and parts suppliers—in differentASEAN countries.
• Nissan is setting up regional networkstructures in ASEAN to capitalize on thegreater production efficiency made possibleby AFTA. It plans to build a “Southeast Asianparts sourcing company” in Thailand, tosource component parts in ASEAN and decidewhich models should be built in which plantsin the region.
• Ford also has a regional strategy to servicethe ASEAN market and allow the variousplants in the region to specialize. Rather thanhave two plants producing the same productin the two countries, Ford has its plant forpickup trucks in Thailand and that forpassenger cars in the Philippines.
• Isuzu Motors Co. (Thailand), Isuzu EngineManufacturing (Thailand) and Isuzu Mesin(Indonesia); Volvo (Malaysia) and Volvo
(Thailand) are producing and exchangingautomotive completely-knocked-down packsthrough the affiliates in these countries.
• Samsung Corning (Malaysia) provides tubeglass as a major input to Samsung Display’sMalaysian factory for colour picture tubes,selling intermediate products to SamsungElectronics (Thailand) and affil iates inIndonesia and Viet Nam for colour televisionsand in Malaysia for computer monitors.
• Samsung Electro-Mechanics (Thailand)supplies tuners, deflection yokes, and fly-back transformers to affiliates in Malaysia,Thailand and Viet Nam. It also supplies tunersto Indonesian operations for VCRs, oilcapacitors to the Malaysian operation formicrowave ovens and deflection yokes toSamsung Display Devices (Malaysia) forcolour picture tubes.
The ASEAN Industrial Cooperation schemealso encourages TNCs to establish regionalproduction networks. For instance:
• Denso affiliates in Indonesia, Malaysia andThailand exchange automotive components.
• Matsushita affiliates in Indonesia, Malaysia,Philippines and Thailand are part of aproduction network to exchange electronicsparts and components.
• Nestlé’s affiliates in Indonesia, Malaysia,Philippines and Thailand are part of aregional production network involving intra-firm trade in food processing.
• Sony Electronics (Singapore) and Sony (VietNam) produce and exchange electronics partsand components among themselves. SonyDisplay Devices (Singapore) and Sony SiamIndustries (Thailand) are involved in a similarproduction arrangement, exchangingelectronics parts and components.
Such production networks strengthen regionalintegration through production and supply linkagesand the intra-firm sourcing of parts andcomponents.
Box II.8. Regional integration and TNC production networks in ASEAN
Source : UNCTAD, based on information from Nihon Keizai Shimbun, 31 December 2002; “Nissan sets up ASEAN sourcing HQin Thailand”, AutoAsia, 27 February 2003; http://www.auto-asia.com/viewcontent.asp?pk=8131; Jakarta Post, 20 June2002, p. 17; Jun 2001, p. 306; and information from the ASEAN Secretariat.
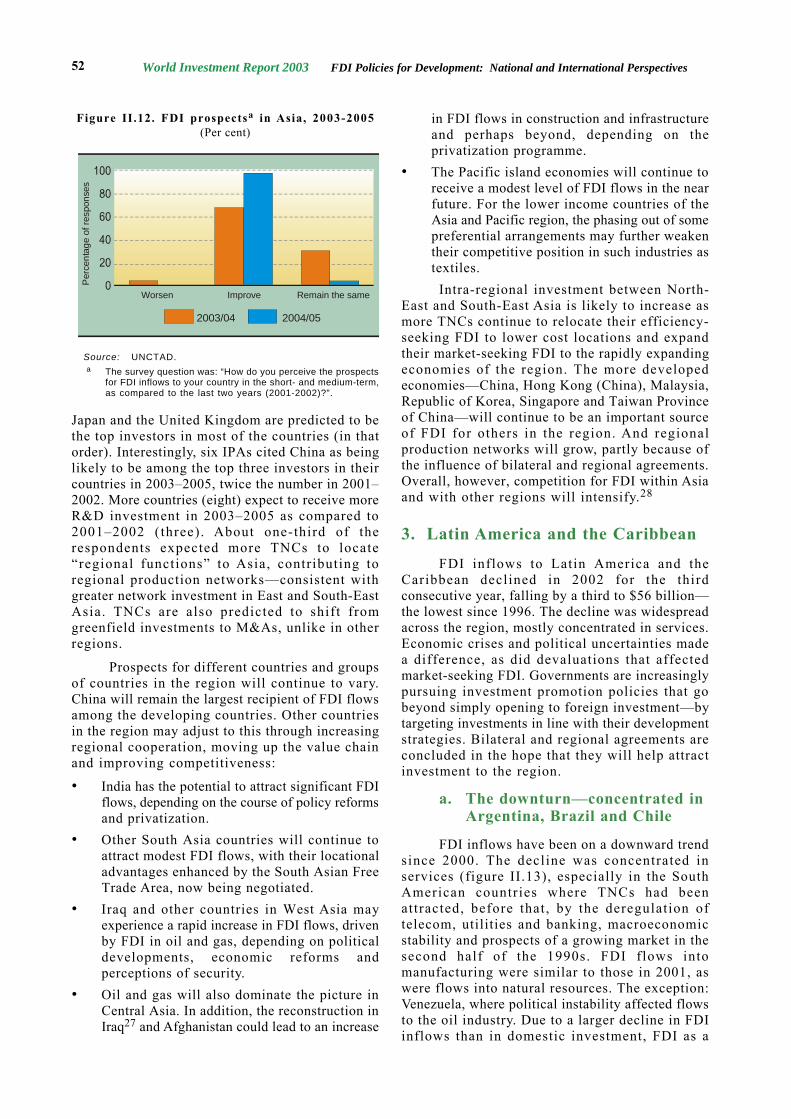
World Investment Report 2003 FDI Policies for Development: National and International Perspectives52
Japan and the United Kingdom are predicted to bethe top investors in most of the countries (in thatorder). Interestingly, six IPAs cited China as beinglikely to be among the top three investors in theircountries in 2003–2005, twice the number in 2001–2002. More countries (eight) expect to receive moreR&D investment in 2003–2005 as compared to2001–2002 (three). About one-third of therespondents expected more TNCs to locate“regional functions” to Asia, contributing toregional production networks—consistent withgreater network investment in East and South-EastAsia. TNCs are also predicted to shift fromgreenfield investments to M&As, unlike in otherregions.
Prospects for different countries and groupsof countries in the region will continue to vary.China will remain the largest recipient of FDI flowsamong the developing countries. Other countriesin the region may adjust to this through increasingregional cooperation, moving up the value chainand improving competitiveness:
• India has the potential to attract significant FDIflows, depending on the course of policy reformsand privatization.
• Other South Asia countries will continue toattract modest FDI flows, with their locationaladvantages enhanced by the South Asian FreeTrade Area, now being negotiated.
• Iraq and other countries in West Asia mayexperience a rapid increase in FDI flows, drivenby FDI in oil and gas, depending on politicaldevelopments, economic reforms andperceptions of security.
• Oil and gas will also dominate the picture inCentral Asia. In addition, the reconstruction inIraq27 and Afghanistan could lead to an increase
in FDI flows in construction and infrastructureand perhaps beyond, depending on theprivatization programme.
• The Pacific island economies will continue toreceive a modest level of FDI flows in the nearfuture. For the lower income countries of theAsia and Pacific region, the phasing out of somepreferential arrangements may further weakentheir competitive position in such industries astextiles.
Intra-regional investment between North-East and South-East Asia is likely to increase asmore TNCs continue to relocate their efficiency-seeking FDI to lower cost locations and expandtheir market-seeking FDI to the rapidly expandingeconomies of the region. The more developedeconomies—China, Hong Kong (China), Malaysia,Republic of Korea, Singapore and Taiwan Provinceof China—will continue to be an important sourceof FDI for others in the region. And regionalproduction networks will grow, partly because ofthe influence of bilateral and regional agreements.Overall, however, competition for FDI within Asiaand with other regions will intensify.28
3. Latin America and the Caribbean
FDI inflows to Latin America and theCaribbean declined in 2002 for the thirdconsecutive year, falling by a third to $56 billion—the lowest since 1996. The decline was widespreadacross the region, mostly concentrated in services.Economic crises and political uncertainties madea difference, as did devaluations that affectedmarket-seeking FDI. Governments are increasinglypursuing investment promotion policies that gobeyond simply opening to foreign investment—bytargeting investments in line with their developmentstrategies. Bilateral and regional agreements areconcluded in the hope that they will help attractinvestment to the region.
a. The downturn—concentrated inArgentina, Brazil and Chile
FDI inflows have been on a downward trendsince 2000. The decline was concentrated inservices (figure II.13), especially in the SouthAmerican countries where TNCs had beenattracted, before that, by the deregulation oftelecom, utilities and banking, macroeconomicstability and prospects of a growing market in thesecond half of the 1990s. FDI flows intomanufacturing were similar to those in 2001, aswere flows into natural resources. The exception:Venezuela, where political instability affected flowsto the oil industry. Due to a larger decline in FDIinflows than in domestic investment, FDI as a
Figure II.12. FDI prospectsa in Asia, 2003-2005(Per cent)
Source: UNCTAD.a The survey question was: “How do you perceive the prospects
for FDI inflows to your country in the short- and medium-term,as compared to the last two years (2001-2002)?”.
Per
cent
age
of r
espo
nses
2003/04 2004/05
Worsen Improve Remain the same
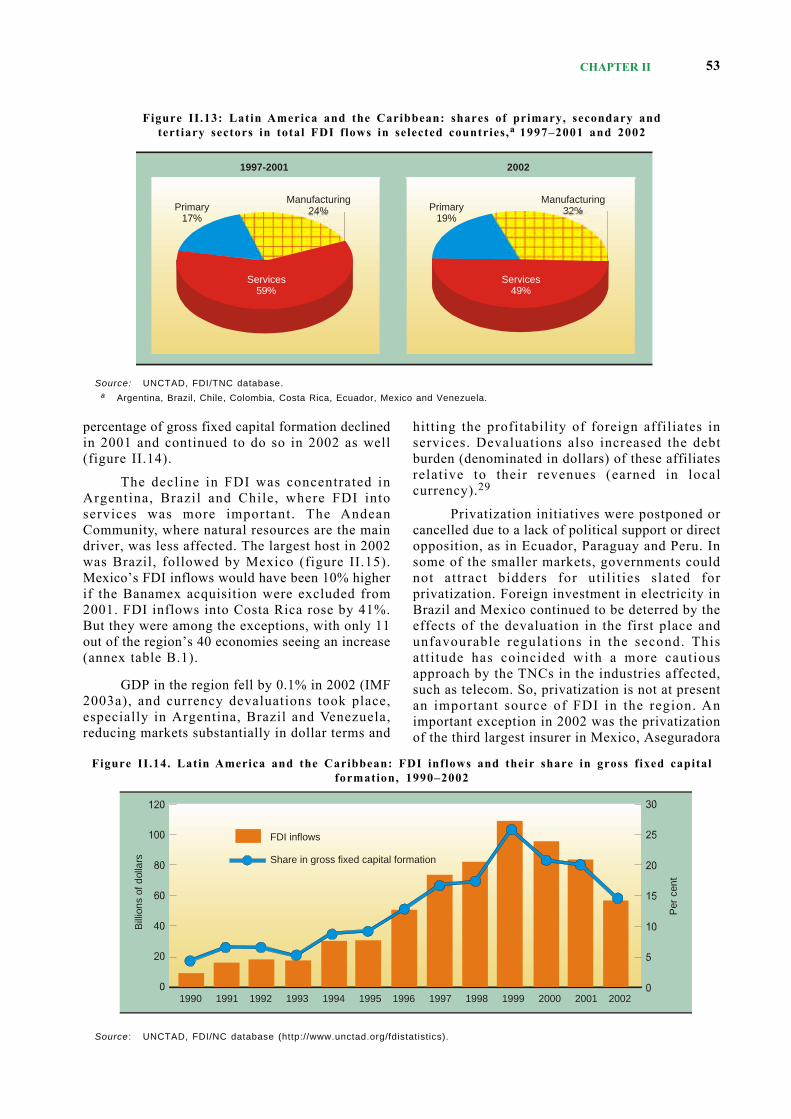
CHAPTER II 53
percentage of gross fixed capital formation declinedin 2001 and continued to do so in 2002 as well(figure II.14).
The decline in FDI was concentrated inArgentina, Brazil and Chile, where FDI intoservices was more important. The AndeanCommunity, where natural resources are the maindriver, was less affected. The largest host in 2002was Brazil, followed by Mexico (figure II.15).Mexico’s FDI inflows would have been 10% higherif the Banamex acquisition were excluded from2001. FDI inflows into Costa Rica rose by 41%.But they were among the exceptions, with only 11out of the region’s 40 economies seeing an increase(annex table B.1).
GDP in the region fell by 0.1% in 2002 (IMF2003a), and currency devaluations took place,especially in Argentina, Brazil and Venezuela,reducing markets substantially in dollar terms and
hitting the profitability of foreign affiliates inservices. Devaluations also increased the debtburden (denominated in dollars) of these affiliatesrelative to their revenues (earned in localcurrency).29
Privatization initiatives were postponed orcancelled due to a lack of political support or directopposition, as in Ecuador, Paraguay and Peru. Insome of the smaller markets, governments couldnot attract bidders for uti l i t ies slated forprivatization. Foreign investment in electricity inBrazil and Mexico continued to be deterred by theeffects of the devaluation in the first place andunfavourable regulations in the second. Thisatt i tude has coincided with a more cautiousapproach by the TNCs in the industries affected,such as telecom. So, privatization is not at presentan important source of FDI in the region. Animportant exception in 2002 was the privatizationof the third largest insurer in Mexico, Aseguradora
Figure II.14. Latin America and the Caribbean: FDI inflows and their share in gross fixed capitalformation, 1990–2002
Source : UNCTAD, FDI/NC database (http://www.unctad.org/fdistatistics).
Figure II.13: Latin America and the Caribbean: shares of primary, secondary andtertiary sectors in total FDI flows in selected countries,a 1997–2001 and 2002
Source: UNCTAD, FDI/TNC database. a Argentina, Brazil, Chile, Colombia, Costa Rica, Ecuador, Mexico and Venezuela.
1997-2001 2002
Primary17%
Primary19%
Manufacturing24%
Manufacturing32%
Services59%
Services49%
1990 1991 1992 1993 1994 1995 1996 1997 1998 1999 2000 2001 2002
Bill
ions
of d
olla
rs
Per
cen
t
FDI inflows
Share in gross fixed capital formation
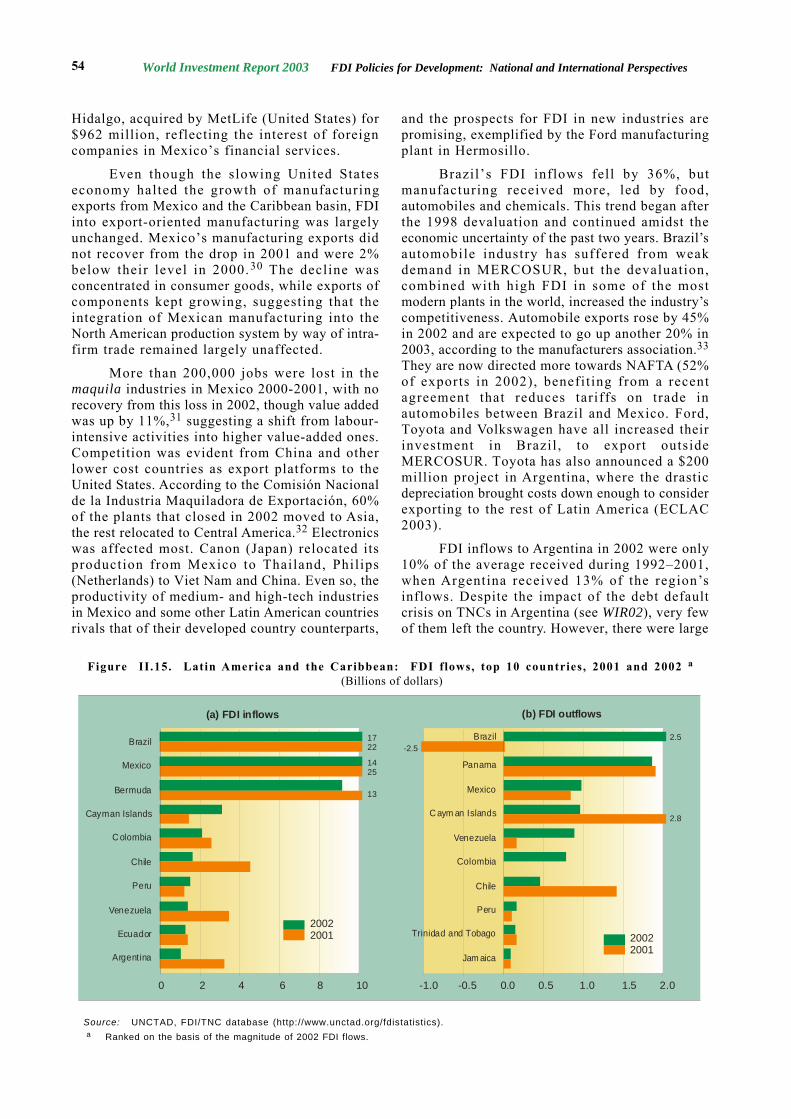
World Investment Report 2003 FDI Policies for Development: National and International Perspectives54
Hidalgo, acquired by MetLife (United States) for$962 million, reflecting the interest of foreigncompanies in Mexico’s financial services.
Even though the slowing United Stateseconomy halted the growth of manufacturingexports from Mexico and the Caribbean basin, FDIinto export-oriented manufacturing was largelyunchanged. Mexico’s manufacturing exports didnot recover from the drop in 2001 and were 2%below their level in 2000.30 The decline wasconcentrated in consumer goods, while exports ofcomponents kept growing, suggesting that theintegration of Mexican manufacturing into theNorth American production system by way of intra-firm trade remained largely unaffected.
More than 200,000 jobs were lost in themaquila industries in Mexico 2000-2001, with norecovery from this loss in 2002, though value addedwas up by 11%,31 suggesting a shift from labour-intensive activities into higher value-added ones.Competition was evident from China and otherlower cost countries as export platforms to theUnited States. According to the Comisión Nacionalde la Industria Maquiladora de Exportación, 60%of the plants that closed in 2002 moved to Asia,the rest relocated to Central America.32 Electronicswas affected most. Canon (Japan) relocated itsproduction from Mexico to Thailand, Philips(Netherlands) to Viet Nam and China. Even so, theproductivity of medium- and high-tech industriesin Mexico and some other Latin American countriesrivals that of their developed country counterparts,
and the prospects for FDI in new industries arepromising, exemplified by the Ford manufacturingplant in Hermosillo.
Brazil’s FDI inflows fell by 36%, butmanufacturing received more, led by food,automobiles and chemicals. This trend began afterthe 1998 devaluation and continued amidst theeconomic uncertainty of the past two years. Brazil’sautomobile industry has suffered from weakdemand in MERCOSUR, but the devaluation,combined with high FDI in some of the mostmodern plants in the world, increased the industry’scompetitiveness. Automobile exports rose by 45%in 2002 and are expected to go up another 20% in2003, according to the manufacturers association.33
They are now directed more towards NAFTA (52%of exports in 2002), benefit ing from a recentagreement that reduces tariffs on trade inautomobiles between Brazil and Mexico. Ford,Toyota and Volkswagen have all increased theirinvestment in Brazil , to export outsideMERCOSUR. Toyota has also announced a $200million project in Argentina, where the drasticdepreciation brought costs down enough to considerexporting to the rest of Latin America (ECLAC2003).
FDI inflows to Argentina in 2002 were only10% of the average received during 1992–2001,when Argentina received 13% of the region’sinflows. Despite the impact of the debt defaultcrisis on TNCs in Argentina (see WIR02), very fewof them left the country. However, there were large
Figure II.15. Latin America and the Caribbean: FDI flows, top 10 countries, 2001 and 2002 a
(Billions of dollars)
Source: UNCTAD, FDI/TNC database (http://www.unctad.org/fdistatistics).a Ranked on the basis of the magnitude of 2002 FDI flows.
(a) FDI inflows (b) FDI outflows
0 2 4 6 8 10 -1.0 -0.5 0.0 0.5 1.0 1.5 2.0
20022001 2002
2001
Brazil
Mexico
Bermuda
Cayman Islands
C olombia
Chile
Peru
Venezuela
Ecuador
Argentina
Brazil
Panama
Mexico
C aym an Islands
Venezuela
Colombia
Chile
Peru
Trinidad and Tobago
Jam aica
1722
1425
13
-2.52.5
2.8
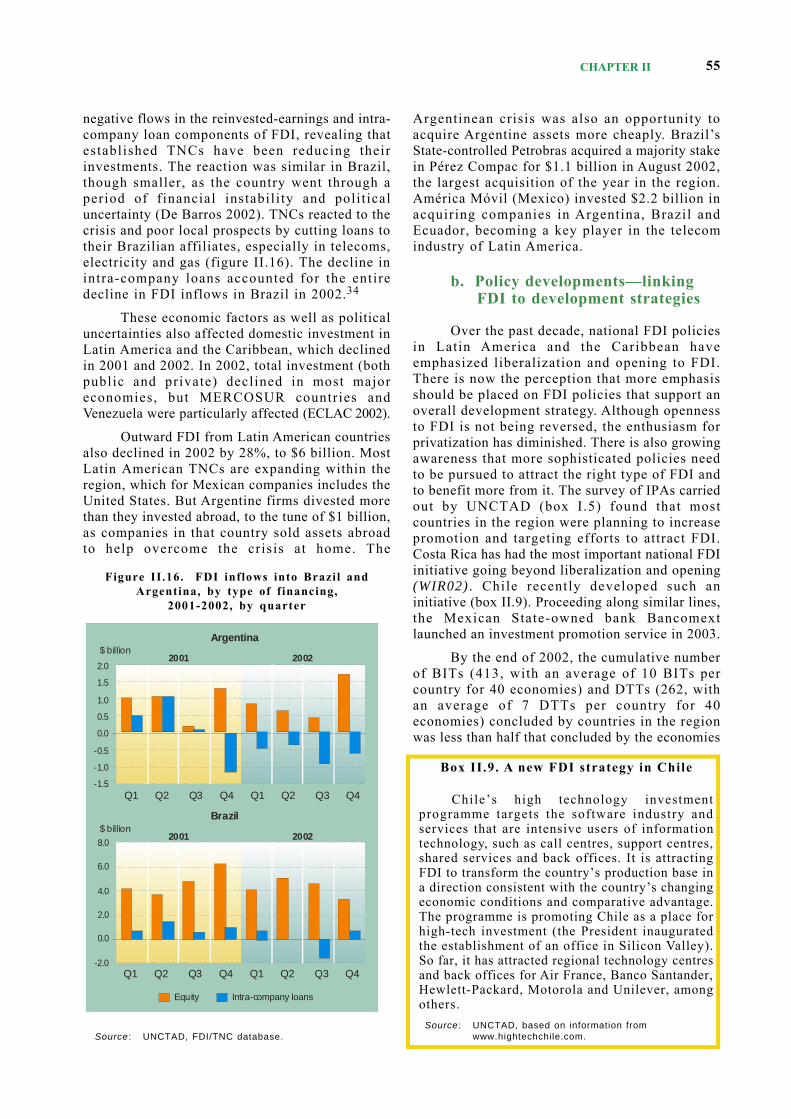
CHAPTER II 55
negative flows in the reinvested-earnings and intra-company loan components of FDI, revealing thatestablished TNCs have been reducing theirinvestments. The reaction was similar in Brazil,though smaller, as the country went through aperiod of financial instabili ty and polit icaluncertainty (De Barros 2002). TNCs reacted to thecrisis and poor local prospects by cutting loans totheir Brazilian affiliates, especially in telecoms,electricity and gas (figure II.16). The decline inintra-company loans accounted for the entiredecline in FDI inflows in Brazil in 2002.34
These economic factors as well as politicaluncertainties also affected domestic investment inLatin America and the Caribbean, which declinedin 2001 and 2002. In 2002, total investment (bothpublic and private) declined in most majoreconomies, but MERCOSUR countries andVenezuela were particularly affected (ECLAC 2002).
Outward FDI from Latin American countriesalso declined in 2002 by 28%, to $6 billion. MostLatin American TNCs are expanding within theregion, which for Mexican companies includes theUnited States. But Argentine firms divested morethan they invested abroad, to the tune of $1 billion,as companies in that country sold assets abroadto help overcome the crisis at home. The
Argentinean crisis was also an opportunity toacquire Argentine assets more cheaply. Brazil’sState-controlled Petrobras acquired a majority stakein Pérez Compac for $1.1 billion in August 2002,the largest acquisition of the year in the region.América Móvil (Mexico) invested $2.2 billion inacquiring companies in Argentina, Brazil andEcuador, becoming a key player in the telecomindustry of Latin America.
b. Policy developments—linkingFDI to development strategies
Over the past decade, national FDI policiesin Latin America and the Caribbean haveemphasized liberalization and opening to FDI.There is now the perception that more emphasisshould be placed on FDI policies that support anoverall development strategy. Although opennessto FDI is not being reversed, the enthusiasm forprivatization has diminished. There is also growingawareness that more sophisticated policies needto be pursued to attract the right type of FDI andto benefit more from it. The survey of IPAs carriedout by UNCTAD (box I.5) found that mostcountries in the region were planning to increasepromotion and targeting efforts to attract FDI.Costa Rica has had the most important national FDIinitiative going beyond liberalization and opening(WIR02) . Chile recently developed such aninitiative (box II.9). Proceeding along similar lines,the Mexican State-owned bank Bancomextlaunched an investment promotion service in 2003.
By the end of 2002, the cumulative numberof BITs (413, with an average of 10 BITs percountry for 40 economies) and DTTs (262, withan average of 7 DTTs per country for 40economies) concluded by countries in the regionwas less than half that concluded by the economies
Box II.9. A new FDI strategy in Chile
Chile’s high technology investmentprogramme targets the software industry andservices that are intensive users of informationtechnology, such as call centres, support centres,shared services and back offices. It is attractingFDI to transform the country’s production base ina direction consistent with the country’s changingeconomic conditions and comparative advantage.The programme is promoting Chile as a place forhigh-tech investment (the President inauguratedthe establishment of an office in Silicon Valley).So far, it has attracted regional technology centresand back offices for Air France, Banco Santander,Hewlett-Packard, Motorola and Unilever, amongothers.
Source : UNCTAD, based on information fromwww.hightechchile.com.
Figure II.16. FDI inflows into Brazil andArgentina, by type of financing,
2001-2002, by quarter
Source : UNCTAD, FDI/TNC database.
$ billion
$ billion
2.0
1.5
1.0
0.5
0.0
-0.5
-1.0
-1.5
8.0
6.0
4.0
2.0
0.0
-2.0
2001
2001
2002
2002
Argentina
Brazil
Q1 Q2 Q3 Q4
Q1 Q2 Q3 Q4
Q1 Q2 Q3 Q4
Q1 Q2 Q3 Q4
Equity Intra-company loans
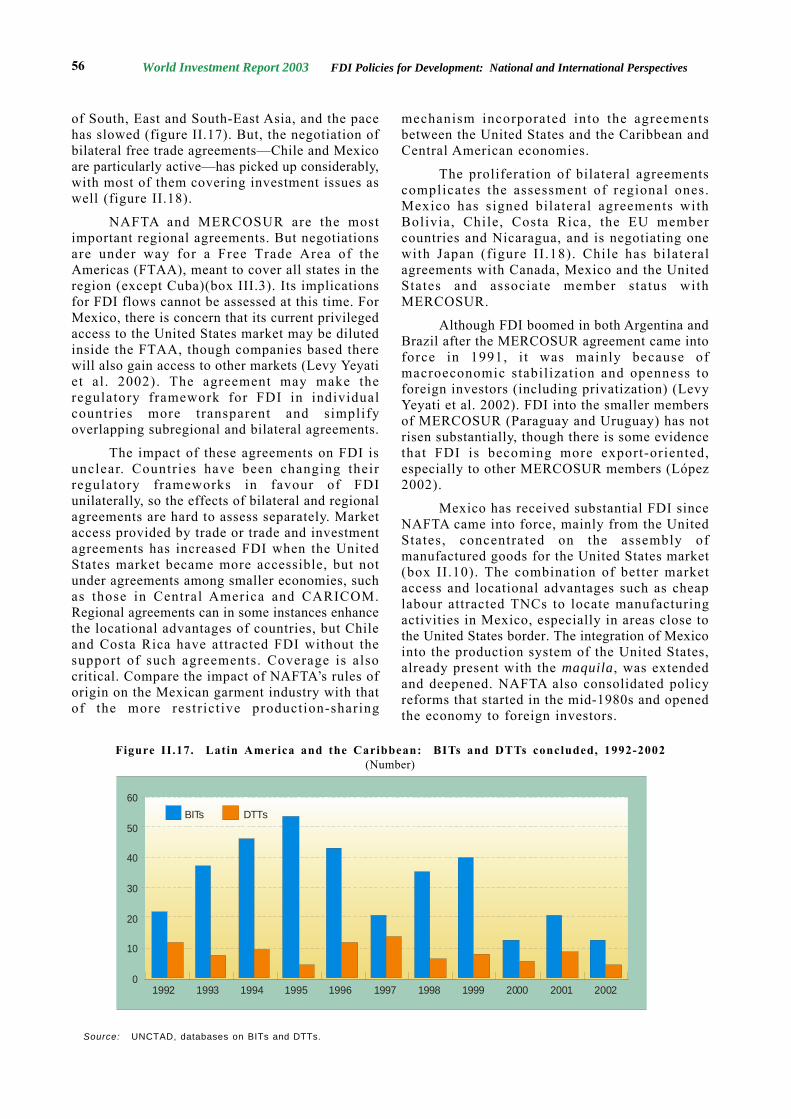
World Investment Report 2003 FDI Policies for Development: National and International Perspectives56
of South, East and South-East Asia, and the pacehas slowed (figure II.17). But, the negotiation ofbilateral free trade agreements—Chile and Mexicoare particularly active—has picked up considerably,with most of them covering investment issues aswell (figure II.18).
NAFTA and MERCOSUR are the mostimportant regional agreements. But negotiationsare under way for a Free Trade Area of theAmericas (FTAA), meant to cover all states in theregion (except Cuba)(box III.3). Its implicationsfor FDI flows cannot be assessed at this time. ForMexico, there is concern that its current privilegedaccess to the United States market may be dilutedinside the FTAA, though companies based therewill also gain access to other markets (Levy Yeyatiet al . 2002). The agreement may make theregulatory framework for FDI in individualcountries more transparent and simplifyoverlapping subregional and bilateral agreements.
The impact of these agreements on FDI isunclear. Countries have been changing theirregulatory frameworks in favour of FDIunilaterally, so the effects of bilateral and regionalagreements are hard to assess separately. Marketaccess provided by trade or trade and investmentagreements has increased FDI when the UnitedStates market became more accessible, but notunder agreements among smaller economies, suchas those in Central America and CARICOM.Regional agreements can in some instances enhancethe locational advantages of countries, but Chileand Costa Rica have attracted FDI without thesupport of such agreements. Coverage is alsocritical. Compare the impact of NAFTA’s rules oforigin on the Mexican garment industry with thatof the more restrictive production-sharing
mechanism incorporated into the agreementsbetween the United States and the Caribbean andCentral American economies.
The proliferation of bilateral agreementscomplicates the assessment of regional ones.Mexico has signed bilateral agreements withBolivia, Chile, Costa Rica, the EU membercountries and Nicaragua, and is negotiating onewith Japan (figure II .18). Chile has bilateralagreements with Canada, Mexico and the UnitedStates and associate member status withMERCOSUR.
Although FDI boomed in both Argentina andBrazil after the MERCOSUR agreement came intoforce in 1991, i t was mainly because ofmacroeconomic stabilization and openness toforeign investors (including privatization) (LevyYeyati et al. 2002). FDI into the smaller membersof MERCOSUR (Paraguay and Uruguay) has notrisen substantially, though there is some evidencethat FDI is becoming more export-oriented,especially to other MERCOSUR members (López2002).
Mexico has received substantial FDI sinceNAFTA came into force, mainly from the UnitedStates, concentrated on the assembly ofmanufactured goods for the United States market(box II.10). The combination of better marketaccess and locational advantages such as cheaplabour attracted TNCs to locate manufacturingactivities in Mexico, especially in areas close tothe United States border. The integration of Mexicointo the production system of the United States,already present with the maquila, was extendedand deepened. NAFTA also consolidated policyreforms that started in the mid-1980s and openedthe economy to foreign investors.
Figure II.17. Latin America and the Caribbean: BITs and DTTs concluded, 1992-2002(Number)
Source: UNCTAD, databases on BITs and DTTs.
60
50
40
30
20
10
01992 1993 1994 1995 1996 1997 1998 1999 2000 2001 2002
BITs DTTs
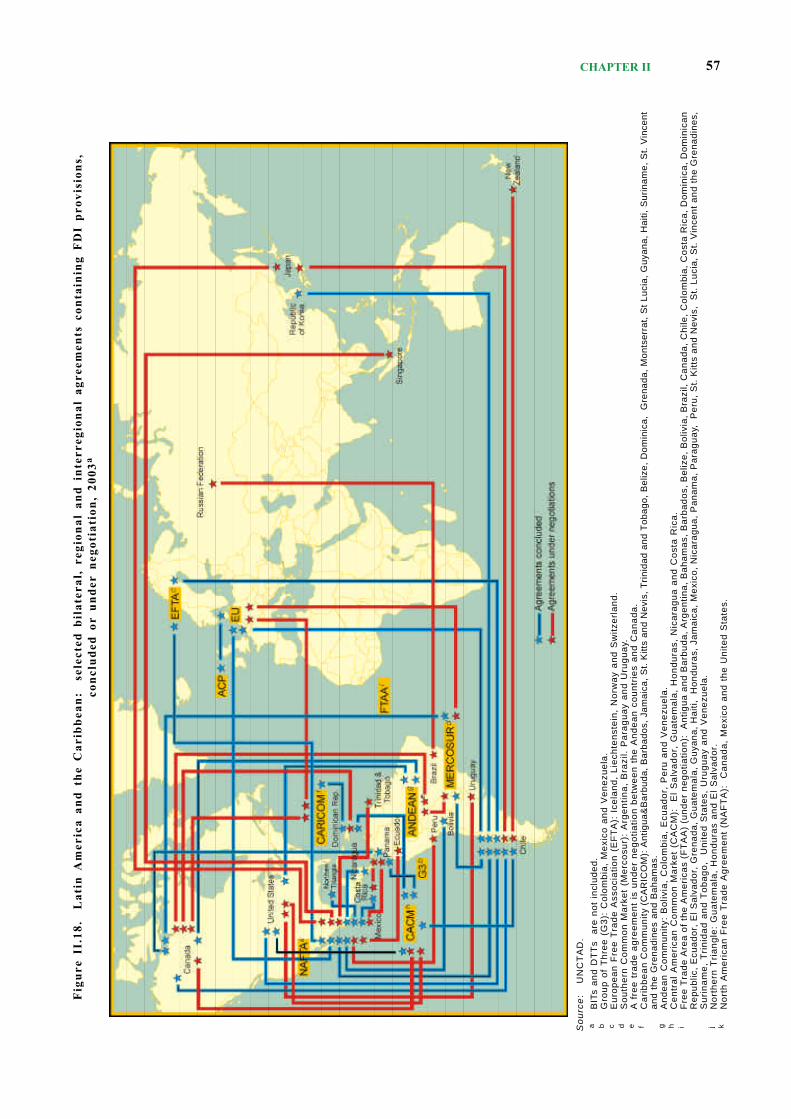
CHAPTER II 57F
igur
e II
.18.
L
atin
Am
eric
a an
d th
e C
arib
bean
: s
elec
ted
bila
tera
l, r
egio
nal
and
inte
rreg
iona
l ag
reem
ents
con
tain
ing
FD
I pr
ovis
ions
,co
nclu
ded
or u
nder
neg
otia
tion
, 20
03a
So
urc
e:
UN
CT
AD
.a
BIT
s a
nd
DT
Ts
are
not
inc
lude
d.b
Gro
up o
f T
hree
(G
3):
Col
ombi
a, M
exic
o an
d V
enez
uela
.c
Eur
opea
n F
ree
Tra
de A
ssoc
iatio
n (E
FT
A):
Ice
land
, Li
echt
enst
ein,
Nor
way
and
Sw
itzer
land
.d
So
uth
ern
Co
mm
on
Ma
rke
t (M
erc
osu
r):
Arg
en
tina
, B
razi
l. P
ara
gu
ay
an
d U
rug
ua
y.e
A f
ree
tra
de
ag
ree
me
nt
is u
nd
er
ne
go
tiatio
n b
etw
ee
n t
he
An
de
an
co
un
trie
s a
nd
Ca
na
da
.f
Ca
rib
be
an
Co
mm
un
ity (
CA
RIC
OM
): A
ntig
ua&
Bar
buda
, B
arba
dos,
Jam
aica
, S
t. K
itts
and
Nev
is,
Tri
nida
d an
d T
obag
o, B
eliz
e, D
omin
ica,
G
rena
da,
Mon
tser
rat,
St
Luci
a, G
uyan
a, H
aiti,
Sur
inam
e, S
t. V
ince
ntan
d th
e G
rena
dine
s an
d B
aham
as.
gA
nd
ea
n C
om
mu
nity
: B
oliv
ia,
Co
lom
bia
, E
cua
do
r, P
eru
an
d V
en
ezu
ela
.h
Ce
ntr
al
Am
eri
can
Co
mm
on
Ma
rke
t (C
AC
M):
E
l S
alv
ad
or,
Gu
ate
ma
la,
Ho
nd
ura
s, N
ica
rag
ua
an
d C
ost
a R
ica
.i
Fre
e T
rade
Are
a of
the
Am
eric
as (
FT
AA
) (u
nder
neg
otia
tion)
: A
ntig
ua a
nd B
arbu
da,
Arg
entin
a, B
aham
as,
Bar
bado
s, B
eliz
e, B
oliv
ia,
Bra
zil,
Can
ada,
Chi
le,
Col
ombi
a, C
osta
Ric
a, D
omin
ica,
Dom
inic
anR
epub
lic,
Ecu
ador
, E
l Sal
vado
r, G
rena
da,
Gua
tem
ala,
Guy
ana,
Hai
ti,
Hon
dura
s, J
amai
ca,
Mex
ico,
Nic
arag
ua,
Pan
ama,
Par
agua
y,
Per
u, S
t. K
itts
and
Nev
is,
St.
Luc
ia,
St.
Vin
cent
and
the
Gre
nadi
nes,
Su
rin
am
e,
Tri
nid
ad
an
d T
obag
o,
Uni
ted
Sta
tes,
Uru
guay
and
Ven
ezue
la.
jN
orth
ern
Tri
angl
e: G
uate
mal
a, H
ondu
ras
and
El
Sal
vado
r.k
Nor
th A
mer
ican
Fre
e T
rade
Agr
eem
ent
(NA
FT
A):
C
anad
a, M
exic
o an
d th
e U
nite
d S
tate
s.
World Investment Report 2003 FDI Policies for Development: National and International Perspectives58
c. Prospects—not much change
UNCTAD estimates that 2003 FDI flows tothe region are likely to remain similar to those in2002.35 Although the polit ical and economicclimate in the region is improving (except inVenezuela), the recovery is likely to be slow. Thefactors that deterred market-seeking FDI in 2002are persisting in 2003—and will recover only
slowly. But TNCs will continue to be attracted bynatural resources, especially if high oil pricespersist. And efficiency-seeking FDI in Mexico andthe Caribbean basin will likely remain at the samelevel in 2003. FDI will continue to flow into themanufacturing sector of Brazil and is likely toresume in Argentina. Only Colombia has animportant privatization plan for the year, thoughimplementation could be delayed.
Negotiated by Canada, Mexico and the UnitedStates, NAFTA came into force in January 1994,creating the first north-south regional integrationagreement in the Western hemisphere. TheAgreement opens the three economies to furthercross-border trade in goods, services andintellectual property and to investment from oneanother in almost all industries. The final roundof tariff cuts under NAFTA was on 1 January 2003,with some exceptions for agricultural products until2008.
NAFTA caused a marked jump in intra-regional trade. North American intra-regionalexports of goods and services stood at 56% of totalexports from North America in 2002, up from 49%in 1996 and 34% in 1980 (Rugman and Brain 2003,pp. 5, 16). But the impact has been strongest inCanada and Mexico. In the late 1980s three-quarters of Canadian and Mexican trade was withthe United States, and by 2002, more than 85%—with a similar pattern for Canadian and Mexicanimports from the United States. But the pattern doesnot hold for the United States, whose trade withthe two other economies over 1996–2001 wasremarkably similar to that in 1980.
An increase in FDI flows to the three membercountries has also been observed since the late1980s, but it is unclear to what extent this was dueto NAFTA. FDI flows, declining over 1988–1993,rose rapidly after 1994, peaking at $383 billionin 2000, before falling back to $64 billion in 2002.The gains appeared to come primarily from FDIinto the United States, not to Canada or Mexico,however. The United States’ share of NorthAmerican FDI rose from 71% in 1994 to a peakat 88% in 1999, before falling back to 47% in 2002.The pattern is similar for North American FDI asa percentage of gross FDI inflows for all OECDcountries—and as a percentage of worldwideinflows.
Stil l , Mexico benefited from increasedinflows (MacDermott 2002; Andresen and Pereira2002). But there is no evidence of increased intra-regional FDI intensity, particularly becauseMexico’s outward FDI flows to the United Stateswere small over 1980–1998 (Globerman 2002).
Intra-NAFTA FDI fell from 30% of theoutward FDI stock in 1986 to 18% in 1999 (Edenand Li 2003). The Canadian share of United Statesoutward stock appears to have been a key factor,down from 17% in 1989 to 10% in 2000 (Rugmanand Brain 2003). NAFTA appears to have causedUnited States TNCs to close some plants in Canadaand use United States exports to supply theCanadian market. Industries characterized by largeeconomies of scale, low transportation costs andlittle product differentiation were expected to seesuch locational shufflings once tariffs wereremoved (Eaton and others 1994).
The most important industry in NorthAmerica is automobiles and automotivecomponents, accounting for between a third anda half of intra-regional trade, depending on howbroadly the industries are defined. The Canadianand United States automobile industries had beenintegrated since the 1965 Auto Pact. NAFTA thusfurthered the integration of the Mexican automobileindustry into an already deeply integrated NorthAmerican automotive industry (Weintraub andSands 1998).
Comparing the position of the United Statesas an insider in NAFTA and an outsider toMERCOSUR, one study found a significant positiverelationship between United States FDI andNAFTA, but no relationship between United StatesFDI and MERCOSUR (Bertrand and Madariaga2002). Another study found that Central Americancountries (except Costa Rica) lagged behindMexico after 1994 (Monge-Naranjo 2002). Mostaffected were textiles and apparel, accounting formost of the FDI flows to El Salvador, Guatemalaand Honduras.
The definitive study of NAFTA’s impact onFDI has yet to be done. The presumption is thatNAFTA benefited its member economies in termsof international trade in goods and services, butless is known about its impact on FDI, for membersand non-members. Better linking of micro-levellocational strategies of individual firms to macro-level shifts in FDI flows and stocks is probablythe key to solving this puzzle.
Box II.10. NAFTA and FDI
Source : UNCTAD.
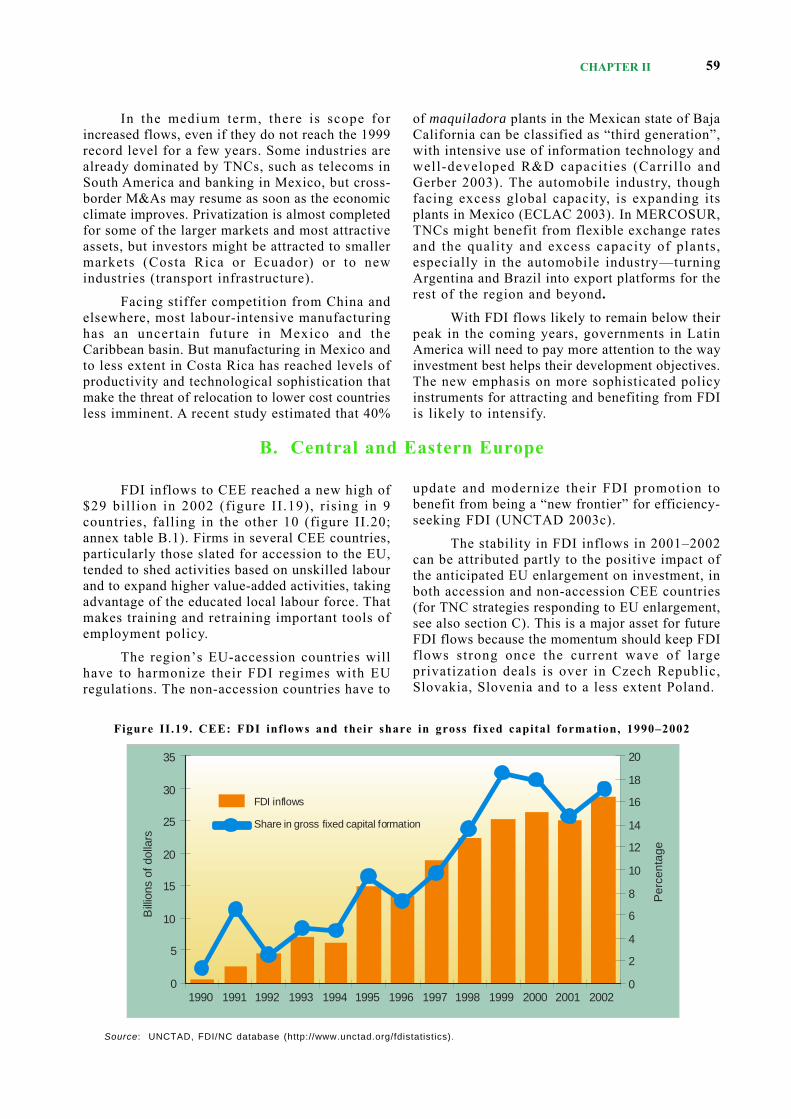
CHAPTER II 59
FDI inflows to CEE reached a new high of$29 bill ion in 2002 (figure II .19), r ising in 9countries, falling in the other 10 (figure II.20;annex table B.1). Firms in several CEE countries,particularly those slated for accession to the EU,tended to shed activities based on unskilled labourand to expand higher value-added activities, takingadvantage of the educated local labour force. Thatmakes training and retraining important tools ofemployment policy.
The region’s EU-accession countries willhave to harmonize their FDI regimes with EUregulations. The non-accession countries have to
update and modernize their FDI promotion tobenefit from being a “new frontier” for efficiency-seeking FDI (UNCTAD 2003c).
The stability in FDI inflows in 2001–2002can be attributed partly to the positive impact ofthe anticipated EU enlargement on investment, inboth accession and non-accession CEE countries(for TNC strategies responding to EU enlargement,see also section C). This is a major asset for futureFDI flows because the momentum should keep FDIflows strong once the current wave of largeprivatization deals is over in Czech Republic,Slovakia, Slovenia and to a less extent Poland.
B. Central and Eastern Europe
In the medium term, there is scope forincreased flows, even if they do not reach the 1999record level for a few years. Some industries arealready dominated by TNCs, such as telecoms inSouth America and banking in Mexico, but cross-border M&As may resume as soon as the economicclimate improves. Privatization is almost completedfor some of the larger markets and most attractiveassets, but investors might be attracted to smallermarkets (Costa Rica or Ecuador) or to newindustries (transport infrastructure).
Facing stiffer competition from China andelsewhere, most labour-intensive manufacturinghas an uncertain future in Mexico and theCaribbean basin. But manufacturing in Mexico andto less extent in Costa Rica has reached levels ofproductivity and technological sophistication thatmake the threat of relocation to lower cost countriesless imminent. A recent study estimated that 40%
of maquiladora plants in the Mexican state of BajaCalifornia can be classified as “third generation”,with intensive use of information technology andwell-developed R&D capacities (Carril lo andGerber 2003). The automobile industry, thoughfacing excess global capacity, is expanding itsplants in Mexico (ECLAC 2003). In MERCOSUR,TNCs might benefit from flexible exchange ratesand the quality and excess capacity of plants,especially in the automobile industry—turningArgentina and Brazil into export platforms for therest of the region and beyond.
With FDI flows likely to remain below theirpeak in the coming years, governments in LatinAmerica will need to pay more attention to the wayinvestment best helps their development objectives.The new emphasis on more sophisticated policyinstruments for attracting and benefiting from FDIis likely to intensify.
Figure II.19. CEE: FDI inflows and their share in gross fixed capital formation, 1990–2002
Source: UNCTAD, FDI/NC database (http://www.unctad.org/fdistatistics).
0
5
10
15
20
25
30
35
1990 1991 1992 1993 1994 1995 1996 1997 1998 1999 2000 2001 2002
Bill
ions
of d
olla
rs
0
2
4
6
8
10
12
14
16
18
20
Per
cent
age
FDI inflows
Share in gross fixed capital formation
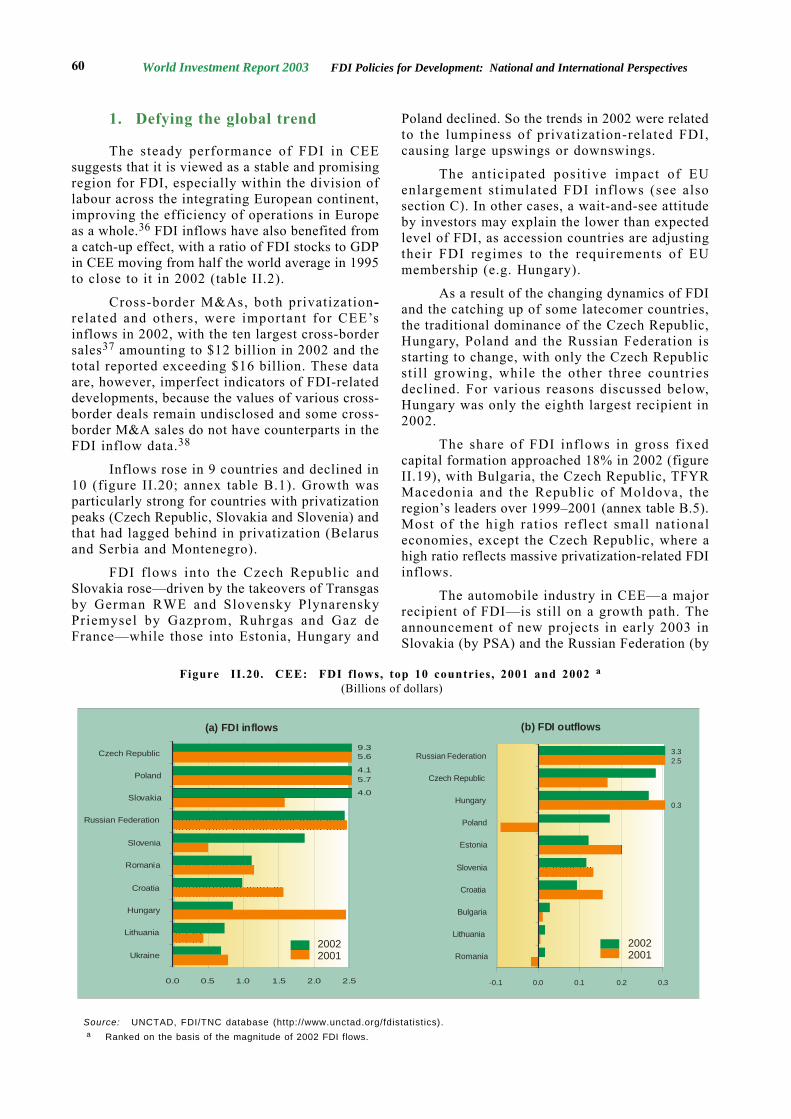
World Investment Report 2003 FDI Policies for Development: National and International Perspectives60
1. Defying the global trend
The steady performance of FDI in CEEsuggests that it is viewed as a stable and promisingregion for FDI, especially within the division oflabour across the integrating European continent,improving the efficiency of operations in Europeas a whole.36 FDI inflows have also benefited froma catch-up effect, with a ratio of FDI stocks to GDPin CEE moving from half the world average in 1995to close to it in 2002 (table II.2).
Cross-border M&As, both privatization-related and others, were important for CEE’sinflows in 2002, with the ten largest cross-bordersales37 amounting to $12 billion in 2002 and thetotal reported exceeding $16 billion. These dataare, however, imperfect indicators of FDI-relateddevelopments, because the values of various cross-border deals remain undisclosed and some cross-border M&A sales do not have counterparts in theFDI inflow data.38
Inflows rose in 9 countries and declined in10 (figure II.20; annex table B.1). Growth wasparticularly strong for countries with privatizationpeaks (Czech Republic, Slovakia and Slovenia) andthat had lagged behind in privatization (Belarusand Serbia and Montenegro).
FDI flows into the Czech Republic andSlovakia rose—driven by the takeovers of Transgasby German RWE and Slovensky PlynarenskyPriemysel by Gazprom, Ruhrgas and Gaz deFrance—while those into Estonia, Hungary and
Poland declined. So the trends in 2002 were relatedto the lumpiness of privatization-related FDI,causing large upswings or downswings.
The anticipated posit ive impact of EUenlargement stimulated FDI inflows (see alsosection C). In other cases, a wait-and-see attitudeby investors may explain the lower than expectedlevel of FDI, as accession countries are adjustingtheir FDI regimes to the requirements of EUmembership (e.g. Hungary).
As a result of the changing dynamics of FDIand the catching up of some latecomer countries,the traditional dominance of the Czech Republic,Hungary, Poland and the Russian Federation isstarting to change, with only the Czech Republicsti l l growing, while the other three countriesdeclined. For various reasons discussed below,Hungary was only the eighth largest recipient in2002.
The share of FDI inflows in gross fixedcapital formation approached 18% in 2002 (figureII.19), with Bulgaria, the Czech Republic, TFYRMacedonia and the Republic of Moldova, theregion’s leaders over 1999–2001 (annex table B.5).Most of the high ratios reflect small nationaleconomies, except the Czech Republic, where ahigh ratio reflects massive privatization-related FDIinflows.
The automobile industry in CEE—a majorrecipient of FDI—is still on a growth path. Theannouncement of new projects in early 2003 inSlovakia (by PSA) and the Russian Federation (by
Figure II.20. CEE: FDI flows, top 10 countries, 2001 and 2002 a
(Billions of dollars)
Source: UNCTAD, FDI/TNC database (http://www.unctad.org/fdistatistics).a Ranked on the basis of the magnitude of 2002 FDI flows.
(a) FDI inflows (b) FDI outflows
5.6
5.7
9.3
4.1
4.0
0.0 0.5 1.0 1.5 2.0 2.5
Ukraine
Lithuania
Hungary
Croatia
Romania
Slovenia
Russian Federation
Slovakia
Poland
Czech Republic
20022001
20022001
0.3
2.53.3
-0.1 0.0 0.1 0.2 0.3
Romania
Lithuania
Bulgaria
Croatia
Slovenia
Estonia
Poland
Hungary
Czech Republic
Russian Federation
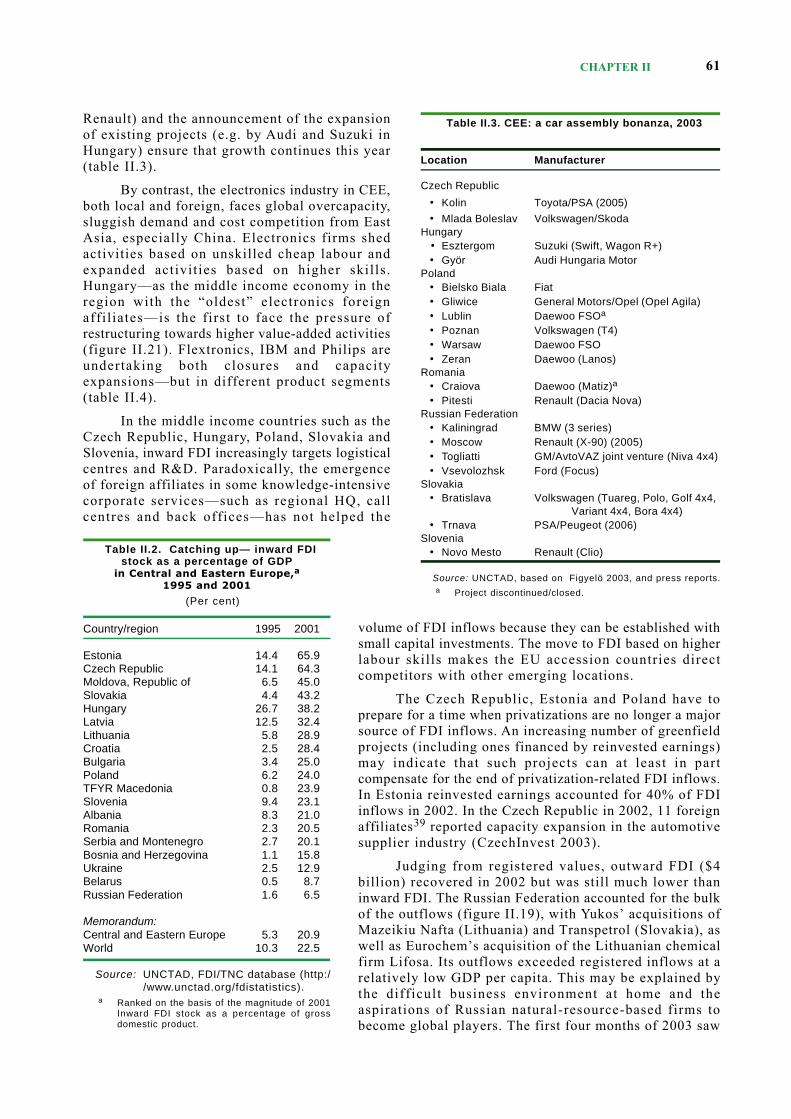
CHAPTER II 61
Renault) and the announcement of the expansionof existing projects (e.g. by Audi and Suzuki inHungary) ensure that growth continues this year(table II.3).
By contrast, the electronics industry in CEE,both local and foreign, faces global overcapacity,sluggish demand and cost competition from EastAsia, especially China. Electronics firms shedactivities based on unskilled cheap labour andexpanded activit ies based on higher skil ls .Hungary—as the middle income economy in theregion with the “oldest” electronics foreignaffil iates—is the first to face the pressure ofrestructuring towards higher value-added activities(figure II.21). Flextronics, IBM and Philips areundertaking both closures and capacityexpansions—but in different product segments(table II.4).
In the middle income countries such as theCzech Republic, Hungary, Poland, Slovakia andSlovenia, inward FDI increasingly targets logisticalcentres and R&D. Paradoxically, the emergenceof foreign affiliates in some knowledge-intensivecorporate services—such as regional HQ, callcentres and back offices—has not helped the
volume of FDI inflows because they can be established withsmall capital investments. The move to FDI based on higherlabour skills makes the EU accession countries directcompetitors with other emerging locations.
The Czech Republic, Estonia and Poland have toprepare for a time when privatizations are no longer a majorsource of FDI inflows. An increasing number of greenfieldprojects (including ones financed by reinvested earnings)may indicate that such projects can at least in partcompensate for the end of privatization-related FDI inflows.In Estonia reinvested earnings accounted for 40% of FDIinflows in 2002. In the Czech Republic in 2002, 11 foreignaffiliates39 reported capacity expansion in the automotivesupplier industry (CzechInvest 2003).
Judging from registered values, outward FDI ($4billion) recovered in 2002 but was still much lower thaninward FDI. The Russian Federation accounted for the bulkof the outflows (figure II.19), with Yukos’ acquisitions ofMazeikiu Nafta (Lithuania) and Transpetrol (Slovakia), aswell as Eurochem’s acquisition of the Lithuanian chemicalfirm Lifosa. Its outflows exceeded registered inflows at arelatively low GDP per capita. This may be explained bythe difficult business environment at home and theaspirations of Russian natural-resource-based firms tobecome global players. The first four months of 2003 saw
Table II.2. Catching up— inward FDIstock as a percentage of GDP
in Central and Eastern Europe,a
1995 and 2001
(Per cent)
Country/region 1995 2001
Estonia 14.4 65.9Czech Republic 14.1 64.3Moldova, Republic of 6.5 45.0Slovakia 4.4 43.2Hungary 26.7 38.2Latvia 12.5 32.4Lithuania 5.8 28.9Croatia 2.5 28.4Bulgaria 3.4 25.0Poland 6.2 24.0TFYR Macedonia 0.8 23.9Slovenia 9.4 23.1Albania 8.3 21.0Romania 2.3 20.5Serbia and Montenegro 2.7 20.1Bosnia and Herzegovina 1.1 15.8Ukraine 2.5 12.9Belarus 0.5 8.7Russian Federation 1.6 6.5
Memorandum:Central and Eastern Europe 5.3 20.9World 10.3 22.5
Source: UNCTAD, FDI/TNC database (http://www.unctad.org/fdistatistics).
a Ranked on the basis of the magnitude of 2001Inward FDI stock as a percentage of grossdomestic product.
Table II.3. CEE: a car assembly bonanza, 2003
Location Manufacturer
Czech Republic
• Kolin Toyota/PSA (2005)• Mlada Boleslav Volkswagen/Skoda
Hungary • Esztergom Suzuki (Swift, Wagon R+)
• Györ Audi Hungaria MotorPoland
• Bielsko Biala Fiat• Gliwice General Motors/Opel (Opel Agila)• Lublin Daewoo FSOa
• Poznan Volkswagen (T4)• Warsaw Daewoo FSO• Zeran Daewoo (Lanos)
Romania• Craiova Daewoo (Matiz)a
• Pitesti Renault (Dacia Nova)Russian Federation
• Kaliningrad BMW (3 series)• Moscow Renault (X-90) (2005)• Togliatti GM/AvtoVAZ joint venture (Niva 4x4)• Vsevolozhsk Ford (Focus)
Slovakia• Bratislava Volkswagen (Tuareg, Polo, Golf 4x4,
Variant 4x4, Bora 4x4)• Trnava PSA/Peugeot (2006)
Slovenia• Novo Mesto Renault (Clio)
Source: UNCTAD, based on Figyelö 2003, and press reports.a Project discontinued/closed.
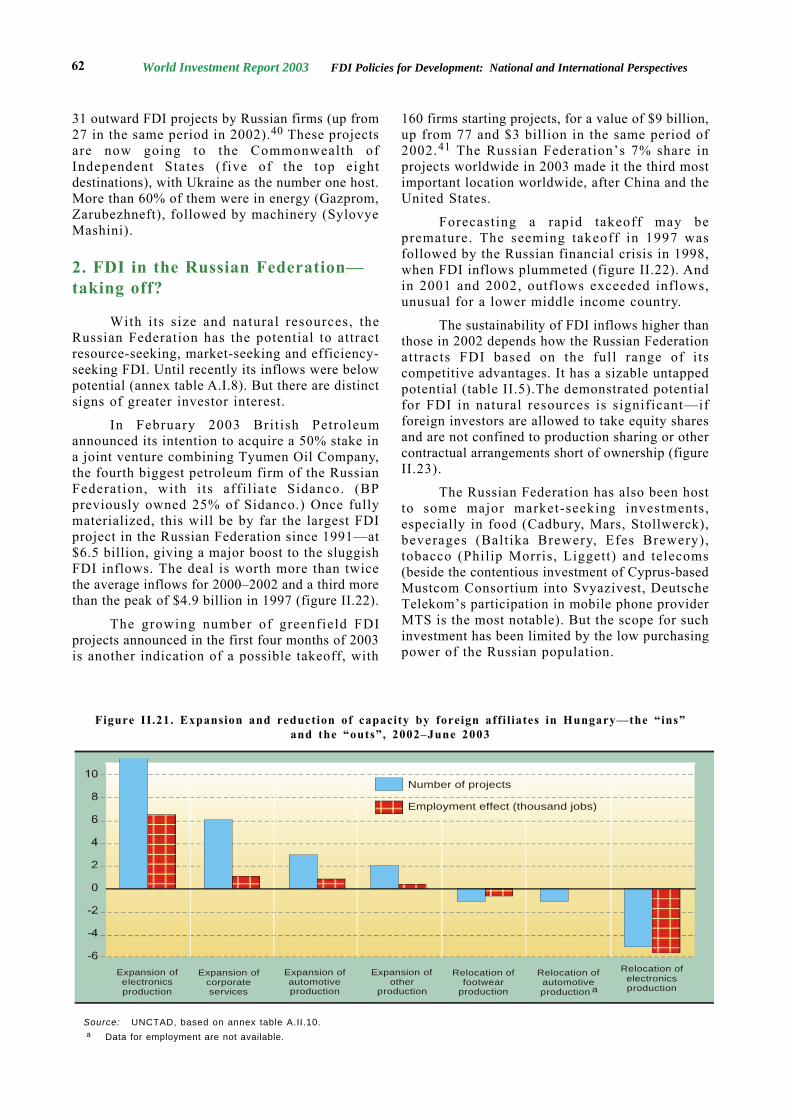
World Investment Report 2003 FDI Policies for Development: National and International Perspectives62
31 outward FDI projects by Russian firms (up from27 in the same period in 2002).40 These projectsare now going to the Commonwealth ofIndependent States (five of the top eightdestinations), with Ukraine as the number one host.More than 60% of them were in energy (Gazprom,Zarubezhneft), followed by machinery (SylovyeMashini).
2. FDI in the Russian Federation—taking off?
With its size and natural resources, theRussian Federation has the potential to attractresource-seeking, market-seeking and efficiency-seeking FDI. Until recently its inflows were belowpotential (annex table A.I.8). But there are distinctsigns of greater investor interest.
In February 2003 British Petroleumannounced its intention to acquire a 50% stake ina joint venture combining Tyumen Oil Company,the fourth biggest petroleum firm of the RussianFederation, with i ts affi l iate Sidanco. (BPpreviously owned 25% of Sidanco.) Once fullymaterialized, this will be by far the largest FDIproject in the Russian Federation since 1991—at$6.5 billion, giving a major boost to the sluggishFDI inflows. The deal is worth more than twicethe average inflows for 2000–2002 and a third morethan the peak of $4.9 billion in 1997 (figure II.22).
The growing number of greenfield FDIprojects announced in the first four months of 2003is another indication of a possible takeoff, with
160 firms starting projects, for a value of $9 billion,up from 77 and $3 billion in the same period of2002.41 The Russian Federation’s 7% share inprojects worldwide in 2003 made it the third mostimportant location worldwide, after China and theUnited States.
Forecasting a rapid takeoff may bepremature. The seeming takeoff in 1997 wasfollowed by the Russian financial crisis in 1998,when FDI inflows plummeted (figure II.22). Andin 2001 and 2002, outflows exceeded inflows,unusual for a lower middle income country.
The sustainability of FDI inflows higher thanthose in 2002 depends how the Russian Federationattracts FDI based on the full range of i tscompetitive advantages. It has a sizable untappedpotential (table II.5).The demonstrated potentialfor FDI in natural resources is significant—ifforeign investors are allowed to take equity sharesand are not confined to production sharing or othercontractual arrangements short of ownership (figureII.23).
The Russian Federation has also been hostto some major market-seeking investments,especially in food (Cadbury, Mars, Stollwerck),beverages (Baltika Brewery, Efes Brewery),tobacco (Philip Morris, Liggett) and telecoms(beside the contentious investment of Cyprus-basedMustcom Consortium into Svyazivest, DeutscheTelekom’s participation in mobile phone providerMTS is the most notable). But the scope for suchinvestment has been limited by the low purchasingpower of the Russian population.
Figure II.21. Expansion and reduction of capacity by foreign affil iates in Hungary—the “ins”and the “outs”, 2002–June 2003
Source: UNCTAD, based on annex table A.II.10.a Data for employment are not available.
Relocation ofelectronicsproduction
Expansion ofelectronicsproduction
Expansion ofcorporateservices
Expansion ofautomotiveproduction
Expansion ofother
production
Relocation offootwear
production
Relocation ofautomotiveproduction a
Number of projects
Employment effect (thousand jobs)
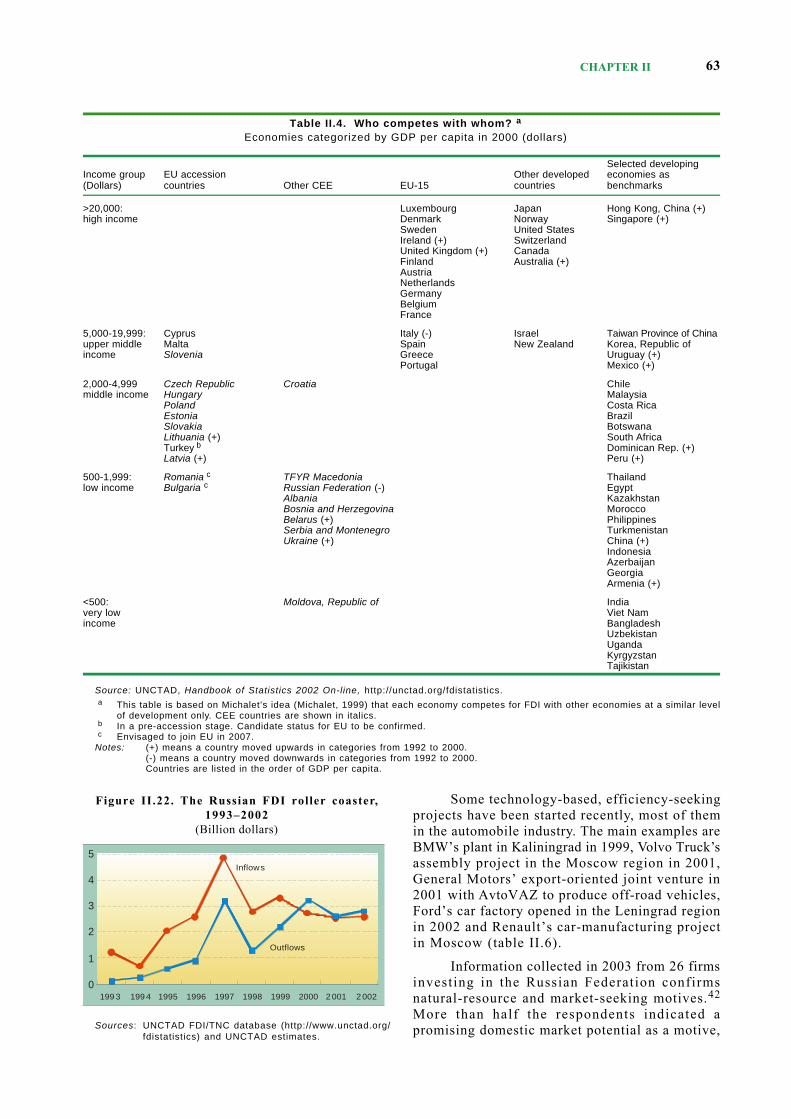
CHAPTER II 63
Some technology-based, efficiency-seekingprojects have been started recently, most of themin the automobile industry. The main examples areBMW’s plant in Kaliningrad in 1999, Volvo Truck’sassembly project in the Moscow region in 2001,General Motors’ export-oriented joint venture in2001 with AvtoVAZ to produce off-road vehicles,Ford’s car factory opened in the Leningrad regionin 2002 and Renault’s car-manufacturing projectin Moscow (table II.6).
Information collected in 2003 from 26 firmsinvesting in the Russian Federation confirmsnatural-resource and market-seeking motives.42
More than half the respondents indicated apromising domestic market potential as a motive,
Table II.4. Who competes with whom? a
Economies categorized by GDP per capita in 2000 (dollars)
Selected developingIncome group EU accession Other developed economies as(Dollars) countries Other CEE EU-15 countries benchmarks
>20,000: Luxembourg Japan Hong Kong, China (+)high income Denmark Norway Singapore (+)
Sweden United StatesIreland (+) SwitzerlandUnited Kingdom (+) CanadaFinland Australia (+)AustriaNetherlandsGermanyBelgiumFrance
5,000-19,999: Cyprus Italy (-) Israel Taiwan Province of Chinaupper middle Malta Spain New Zealand Korea, Republic ofincome Slovenia Greece Uruguay (+)
Portugal Mexico (+)
2,000-4,999 Czech Republic Croatia Chilemiddle income Hungary Malaysia
Poland Costa RicaEstonia BrazilSlovakia BotswanaLithuania (+) South AfricaTurkey b Dominican Rep. (+)Latvia (+) Peru (+)
500-1,999: Romania c TFYR Macedonia Thailandlow income Bulgaria c Russian Federation (-) Egypt
Albania KazakhstanBosnia and Herzegovina MoroccoBelarus (+) PhilippinesSerbia and Montenegro TurkmenistanUkraine (+) China (+)
IndonesiaAzerbaijanGeorgiaArmenia (+)
<500: Moldova, Republic of Indiavery low Viet Namincome Bangladesh
UzbekistanUgandaKyrgyzstanTajikistan
Source: UNCTAD, Handbook of Statistics 2002 On-line, http://unctad.org/fdistatistics.a This table is based on Michalet’s idea (Michalet, 1999) that each economy competes for FDI with other economies at a similar level
of development only. CEE countries are shown in italics.b In a pre-accession stage. Candidate status for EU to be confirmed.c Envisaged to join EU in 2007.
Notes: (+) means a country moved upwards in categories from 1992 to 2000.(-) means a country moved downwards in categories from 1992 to 2000.Countries are listed in the order of GDP per capita.
Figure II.22. The Russian FDI roller coaster,1993–2002
(Billion dollars)
Sources: UNCTAD FDI/TNC database (http://www.unctad.org/fdistatistics) and UNCTAD estimates.
199 3 199 4 19 95 19 96 1997 1998 1999
5
4
3
2
1
0199 3 199 4 1995 1996 1997 1998 1999 2000 2 001 2 002
Inflows
Outflows
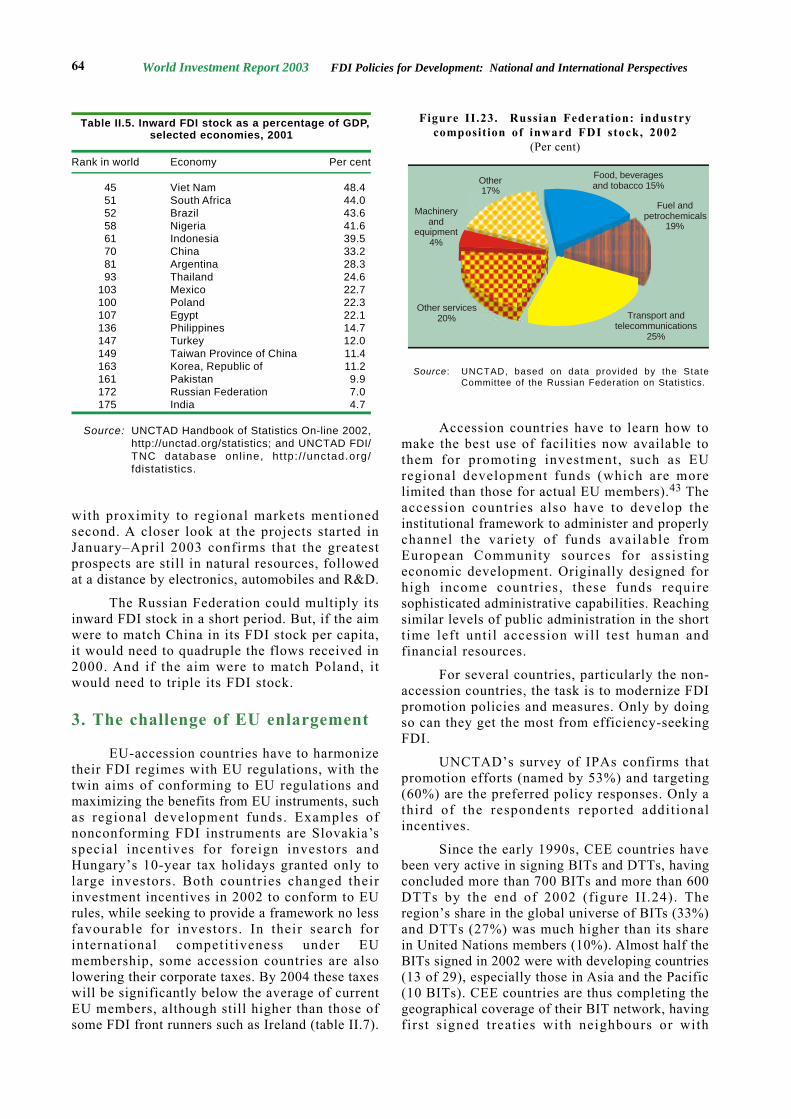
World Investment Report 2003 FDI Policies for Development: National and International Perspectives64
with proximity to regional markets mentionedsecond. A closer look at the projects started inJanuary–April 2003 confirms that the greatestprospects are still in natural resources, followedat a distance by electronics, automobiles and R&D.
The Russian Federation could multiply itsinward FDI stock in a short period. But, if the aimwere to match China in its FDI stock per capita,it would need to quadruple the flows received in2000. And if the aim were to match Poland, itwould need to triple its FDI stock.
3. The challenge of EU enlargement
EU-accession countries have to harmonizetheir FDI regimes with EU regulations, with thetwin aims of conforming to EU regulations andmaximizing the benefits from EU instruments, suchas regional development funds. Examples ofnonconforming FDI instruments are Slovakia’sspecial incentives for foreign investors andHungary’s 10-year tax holidays granted only tolarge investors. Both countries changed theirinvestment incentives in 2002 to conform to EUrules, while seeking to provide a framework no lessfavourable for investors. In their search forinternational competit iveness under EUmembership, some accession countries are alsolowering their corporate taxes. By 2004 these taxeswill be significantly below the average of currentEU members, although still higher than those ofsome FDI front runners such as Ireland (table II.7).
Accession countries have to learn how tomake the best use of facilities now available tothem for promoting investment, such as EUregional development funds (which are morelimited than those for actual EU members).43 Theaccession countries also have to develop theinstitutional framework to administer and properlychannel the variety of funds available fromEuropean Community sources for assist ingeconomic development. Originally designed forhigh income countries, these funds requiresophisticated administrative capabilities. Reachingsimilar levels of public administration in the shortt ime left until accession will test human andfinancial resources.
For several countries, particularly the non-accession countries, the task is to modernize FDIpromotion policies and measures. Only by doingso can they get the most from efficiency-seekingFDI.
UNCTAD’s survey of IPAs confirms thatpromotion efforts (named by 53%) and targeting(60%) are the preferred policy responses. Only athird of the respondents reported additionalincentives.
Since the early 1990s, CEE countries havebeen very active in signing BITs and DTTs, havingconcluded more than 700 BITs and more than 600DTTs by the end of 2002 (figure II.24). Theregion’s share in the global universe of BITs (33%)and DTTs (27%) was much higher than its sharein United Nations members (10%). Almost half theBITs signed in 2002 were with developing countries(13 of 29), especially those in Asia and the Pacific(10 BITs). CEE countries are thus completing thegeographical coverage of their BIT network, havingfirst signed treaties with neighbours or with
Table II.5. Inward FDI stock as a percentage of GDP,selected economies, 2001
Rank in world Economy Per cent
45 Viet Nam 48.451 South Africa 44.052 Brazil 43.658 Nigeria 41.661 Indonesia 39.570 China 33.281 Argentina 28.393 Thailand 24.6
103 Mexico 22.7100 Poland 22.3107 Egypt 22.1136 Philippines 14.7147 Turkey 12.0149 Taiwan Province of China 11.4163 Korea, Republic of 11.2161 Pakistan 9.9172 Russian Federation 7.0175 India 4.7
Source: UNCTAD Handbook of Statistics On-line 2002,http://unctad.org/statistics; and UNCTAD FDI/TNC database onl ine, ht tp: / /unctad.org/fdistatistics.
Figure II.23. Russian Federation: industrycomposition of inward FDI stock, 2002
(Per cent)
Source : UNCTAD, based on data provided by the StateCommittee of the Russian Federation on Statistics.
Other17%
Other services20%
Machineryand
equipment4%
Food, beveragesand tobacco 15%
Fuel andpetrochemicals
19%
Transport andtelecommunications
25%
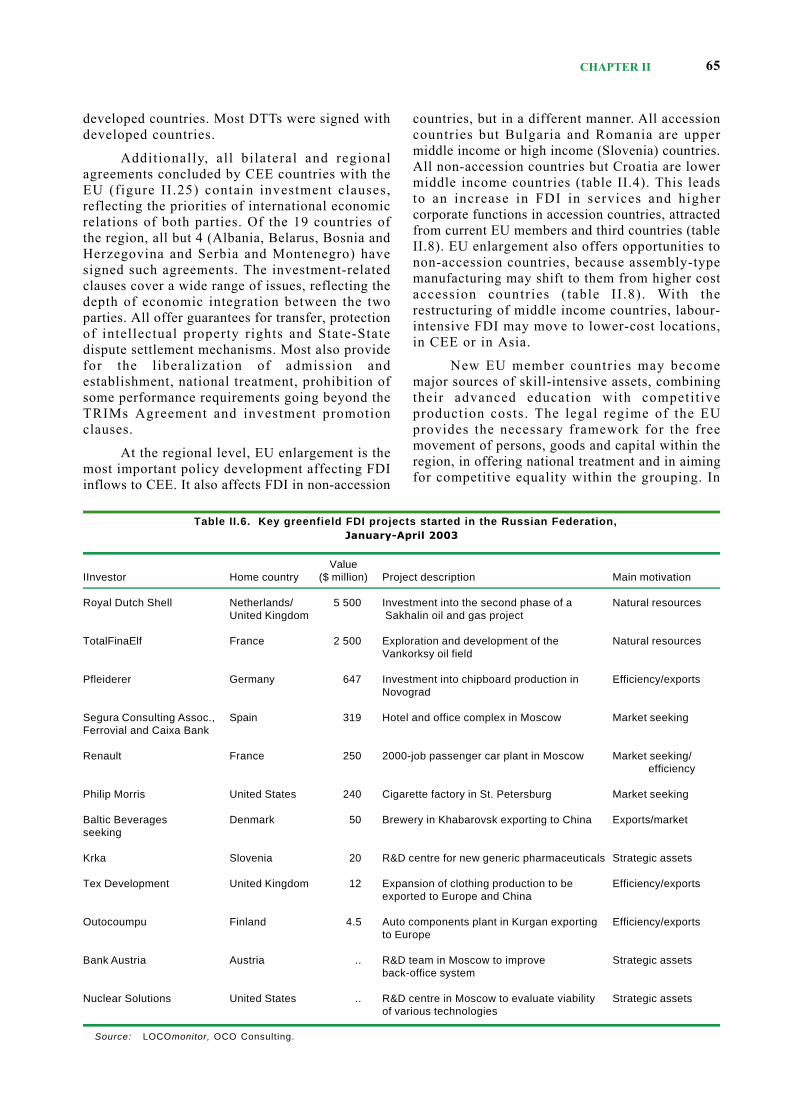
CHAPTER II 65
developed countries. Most DTTs were signed withdeveloped countries.
Additionally, all bilateral and regionalagreements concluded by CEE countries with theEU (figure II.25) contain investment clauses,reflecting the priorities of international economicrelations of both parties. Of the 19 countries ofthe region, all but 4 (Albania, Belarus, Bosnia andHerzegovina and Serbia and Montenegro) havesigned such agreements. The investment-relatedclauses cover a wide range of issues, reflecting thedepth of economic integration between the twoparties. All offer guarantees for transfer, protectionof intellectual property rights and State-Statedispute settlement mechanisms. Most also providefor the l iberalization of admission andestablishment, national treatment, prohibition ofsome performance requirements going beyond theTRIMs Agreement and investment promotionclauses.
At the regional level, EU enlargement is themost important policy development affecting FDIinflows to CEE. It also affects FDI in non-accession
countries, but in a different manner. All accessioncountries but Bulgaria and Romania are uppermiddle income or high income (Slovenia) countries.All non-accession countries but Croatia are lowermiddle income countries (table II.4). This leadsto an increase in FDI in services and highercorporate functions in accession countries, attractedfrom current EU members and third countries (tableII.8). EU enlargement also offers opportunities tonon-accession countries, because assembly-typemanufacturing may shift to them from higher costaccession countries (table II .8). With therestructuring of middle income countries, labour-intensive FDI may move to lower-cost locations,in CEE or in Asia.
New EU member countries may becomemajor sources of skill-intensive assets, combiningtheir advanced education with competit iveproduction costs. The legal regime of the EUprovides the necessary framework for the freemovement of persons, goods and capital within theregion, in offering national treatment and in aimingfor competitive equality within the grouping. In
Table II.6. Key greenfield FDI projects started in the Russian Federation,January-April 2003
ValueIInvestor Home country ($ million) Project description Main motivation
Royal Dutch Shell Netherlands/ 5 500 Investment into the second phase of a Natural resourcesUnited Kingdom Sakhalin oil and gas project
TotalFinaElf France 2 500 Exploration and development of the Natural resourcesVankorksy oil field
Pfleiderer Germany 647 Investment into chipboard production in Efficiency/exportsNovograd
Segura Consulting Assoc., Spain 319 Hotel and office complex in Moscow Market seekingFerrovial and Caixa Bank
Renault France 250 2000-job passenger car plant in Moscow Market seeking/efficiency
Philip Morris United States 240 Cigarette factory in St. Petersburg Market seeking
Baltic Beverages Denmark 50 Brewery in Khabarovsk exporting to China Exports/marketseeking
Krka Slovenia 20 R&D centre for new generic pharmaceuticals Strategic assets
Tex Development United Kingdom 12 Expansion of clothing production to be Efficiency/exportsexported to Europe and China
Outocoumpu Finland 4.5 Auto components plant in Kurgan exporting Efficiency/exportsto Europe
Bank Austria Austria .. R&D team in Moscow to improve Strategic assetsback-office system
Nuclear Solutions United States .. R&D centre in Moscow to evaluate viability Strategic assetsof various technologies
Source: LOCOmonitor, OCO Consulting.
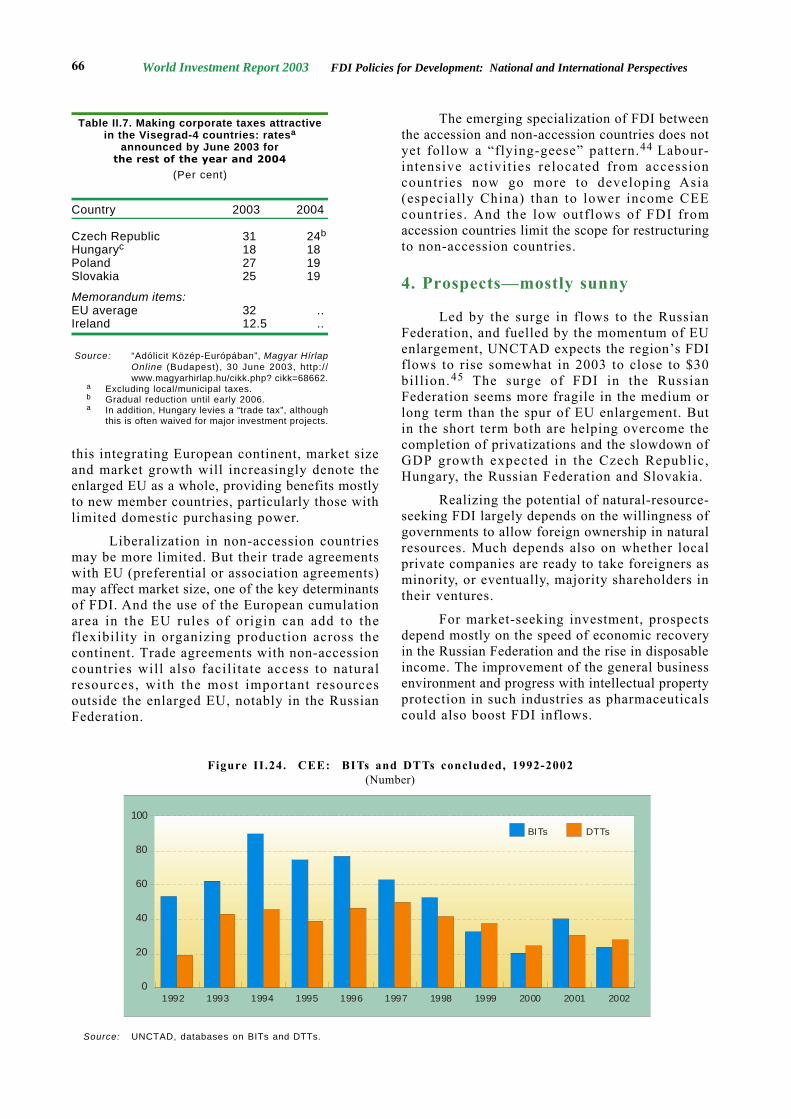
World Investment Report 2003 FDI Policies for Development: National and International Perspectives66
this integrating European continent, market sizeand market growth will increasingly denote theenlarged EU as a whole, providing benefits mostlyto new member countries, particularly those withlimited domestic purchasing power.
Liberalization in non-accession countriesmay be more limited. But their trade agreementswith EU (preferential or association agreements)may affect market size, one of the key determinantsof FDI. And the use of the European cumulationarea in the EU rules of origin can add to theflexibility in organizing production across thecontinent. Trade agreements with non-accessioncountries will also facilitate access to naturalresources, with the most important resourcesoutside the enlarged EU, notably in the RussianFederation.
The emerging specialization of FDI betweenthe accession and non-accession countries does notyet follow a “flying-geese” pattern.44 Labour-intensive activit ies relocated from accessioncountries now go more to developing Asia(especially China) than to lower income CEEcountries. And the low outflows of FDI fromaccession countries limit the scope for restructuringto non-accession countries.
4. Prospects—mostly sunny
Led by the surge in flows to the RussianFederation, and fuelled by the momentum of EUenlargement, UNCTAD expects the region’s FDIflows to rise somewhat in 2003 to close to $30bill ion.45 The surge of FDI in the RussianFederation seems more fragile in the medium orlong term than the spur of EU enlargement. Butin the short term both are helping overcome thecompletion of privatizations and the slowdown ofGDP growth expected in the Czech Republic,Hungary, the Russian Federation and Slovakia.
Realizing the potential of natural-resource-seeking FDI largely depends on the willingness ofgovernments to allow foreign ownership in naturalresources. Much depends also on whether localprivate companies are ready to take foreigners asminority, or eventually, majority shareholders intheir ventures.
For market-seeking investment, prospectsdepend mostly on the speed of economic recoveryin the Russian Federation and the rise in disposableincome. The improvement of the general businessenvironment and progress with intellectual propertyprotection in such industries as pharmaceuticalscould also boost FDI inflows.
Figure II.24. CEE: BITs and DTTs concluded, 1992-2002(Number)
Source: UNCTAD, databases on BITs and DTTs.
Table II.7. Making corporate taxes attractivein the Visegrad-4 countries: ratesa
announced by June 2003 forthe rest of the year and 2004
(Per cent)
Country 2003 2004
Czech Republic 31 24b
Hungaryc 18 18Poland 27 19Slovakia 25 19
Memorandum items:EU average 32 ..Ireland 12.5 ..
Source: “Adólicit Közép-Európában”, Magyar HírlapOnline (Budapest), 30 June 2003, http://www.magyarhirlap.hu/cikk.php? cikk=68662.
a Excluding local/municipal taxes.b Gradual reduction until early 2006.a In addition, Hungary levies a “trade tax”, although
this is often waived for major investment projects.
100
80
60
40
20
01992 1993 1994 1995 1996 1997 1998 1999 2000 2001 2002
BITs DTTs
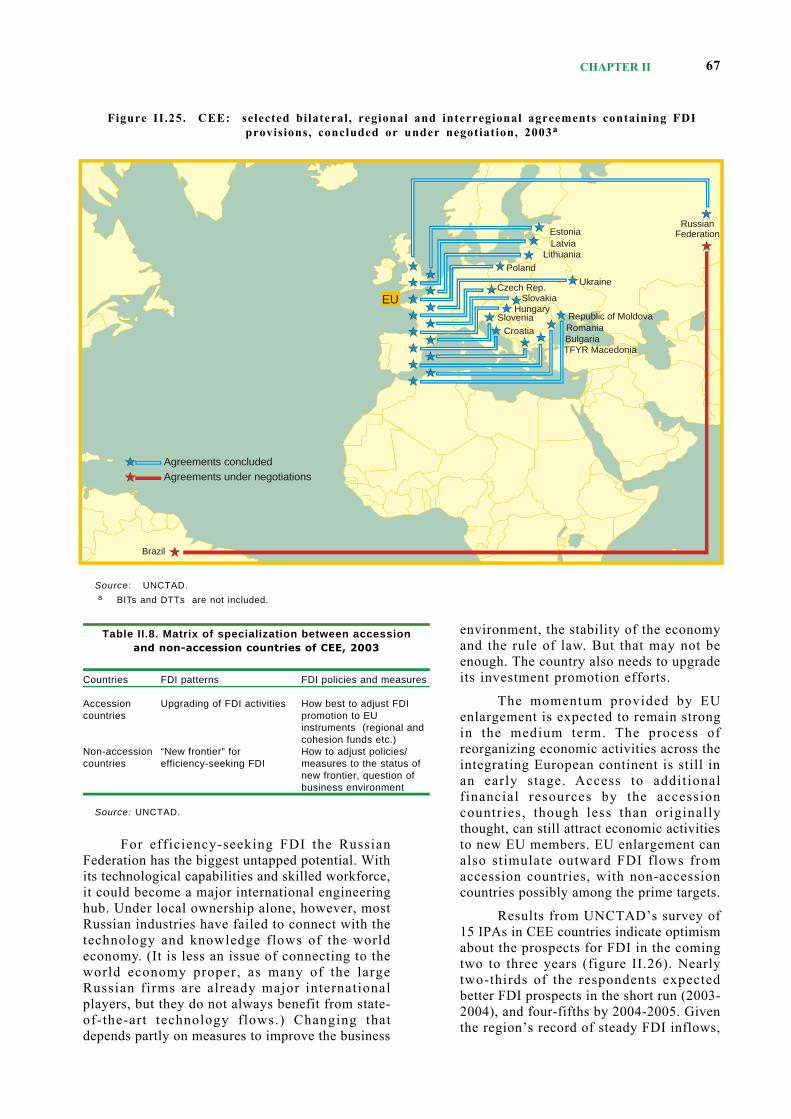
CHAPTER II 67
For efficiency-seeking FDI the RussianFederation has the biggest untapped potential. Withits technological capabilities and skilled workforce,it could become a major international engineeringhub. Under local ownership alone, however, mostRussian industries have failed to connect with thetechnology and knowledge flows of the worldeconomy. (It is less an issue of connecting to theworld economy proper, as many of the largeRussian firms are already major internationalplayers, but they do not always benefit from state-of-the-art technology flows.) Changing thatdepends partly on measures to improve the business
environment, the stability of the economyand the rule of law. But that may not beenough. The country also needs to upgradeits investment promotion efforts.
The momentum provided by EUenlargement is expected to remain strongin the medium term. The process ofreorganizing economic activities across theintegrating European continent is still inan early stage. Access to additionalfinancial resources by the accessioncountries, though less than originallythought, can still attract economic activitiesto new EU members. EU enlargement canalso stimulate outward FDI flows fromaccession countries, with non-accessioncountries possibly among the prime targets.
Results from UNCTAD’s survey of15 IPAs in CEE countries indicate optimismabout the prospects for FDI in the comingtwo to three years (figure II.26). Nearlytwo-thirds of the respondents expectedbetter FDI prospects in the short run (2003-2004), and four-fifths by 2004-2005. Giventhe region’s record of steady FDI inflows,
Figure II.25. CEE: selected bilateral, regional and interregional agreements containing FDIprovisions, concluded or under negotiation, 2003a
Source : UNCTAD.a BITs and DTTs are not included.
Table II.8. Matrix of specialization between accessionand non-accession countries of CEE, 2003
Countries FDI patterns FDI policies and measures
Accession Upgrading of FDI activities How best to adjust FDIcountries promotion to EU
instruments (regional andcohesion funds etc.)
Non-accession “New frontier” for How to adjust policies/countries efficiency-seeking FDI measures to the status of
new frontier, question ofbusiness environment
Source: UNCTAD.
EU
Brazil
RussianFederationEstonia
LatviaLithuania
UkraineCzech Rep.
Slovakia
SloveniaHungary
CroatiaBulgariaRomania
Poland
Republic of Moldova
TFYR Macedonia
Agreements concludedAgreements under negotiations
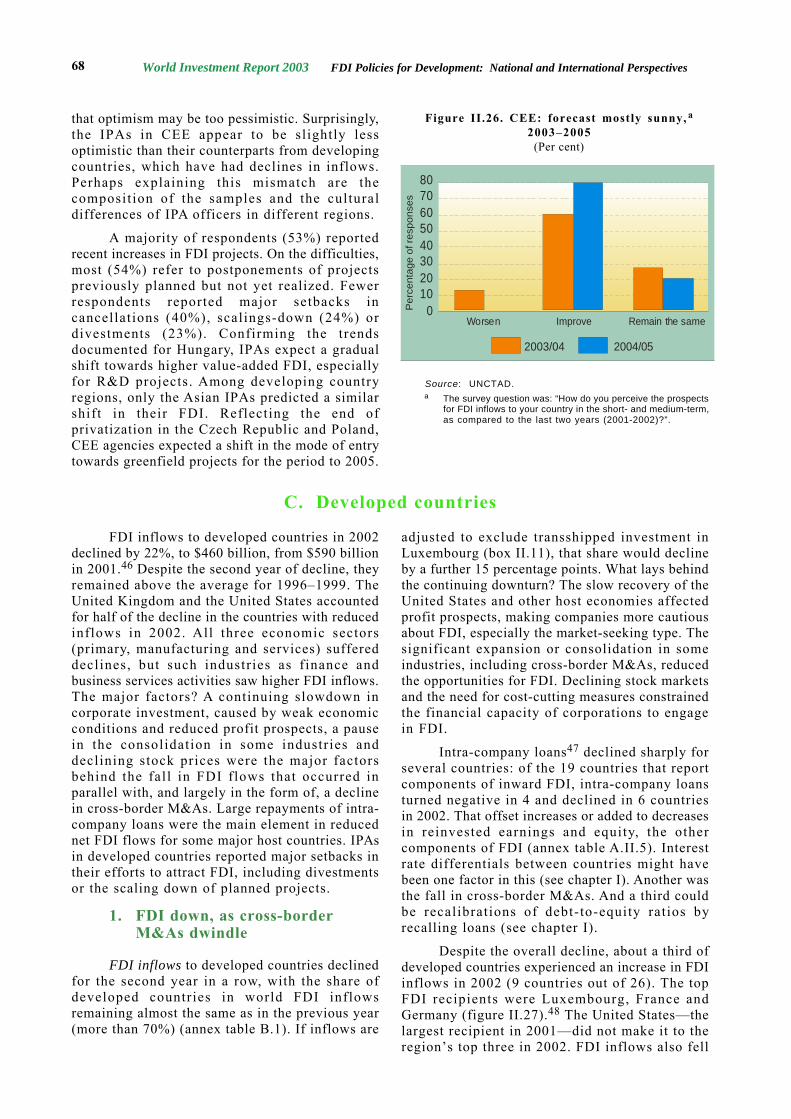
World Investment Report 2003 FDI Policies for Development: National and International Perspectives68
that optimism may be too pessimistic. Surprisingly,the IPAs in CEE appear to be slightly lessoptimistic than their counterparts from developingcountries, which have had declines in inflows.Perhaps explaining this mismatch are thecomposition of the samples and the culturaldifferences of IPA officers in different regions.
A majority of respondents (53%) reportedrecent increases in FDI projects. On the difficulties,most (54%) refer to postponements of projectspreviously planned but not yet realized. Fewerrespondents reported major setbacks incancellations (40%), scalings-down (24%) ordivestments (23%). Confirming the trendsdocumented for Hungary, IPAs expect a gradualshift towards higher value-added FDI, especiallyfor R&D projects. Among developing countryregions, only the Asian IPAs predicted a similarshift in their FDI. Reflecting the end ofprivatization in the Czech Republic and Poland,CEE agencies expected a shift in the mode of entrytowards greenfield projects for the period to 2005.
C. Developed countries
Figure II.26. CEE: forecast mostly sunny, a
2003–2005(Per cent)
Source: UNCTAD.a The survey question was: “How do you perceive the prospects
for FDI inflows to your country in the short- and medium-term,as compared to the last two years (2001-2002)?”.
FDI inflows to developed countries in 2002declined by 22%, to $460 billion, from $590 billionin 2001.46 Despite the second year of decline, theyremained above the average for 1996–1999. TheUnited Kingdom and the United States accountedfor half of the decline in the countries with reducedinflows in 2002. All three economic sectors(primary, manufacturing and services) suffereddeclines, but such industries as f inance andbusiness services activities saw higher FDI inflows.The major factors? A continuing slowdown incorporate investment, caused by weak economicconditions and reduced profit prospects, a pausein the consolidation in some industries anddeclining stock prices were the major factorsbehind the fall in FDI flows that occurred inparallel with, and largely in the form of, a declinein cross-border M&As. Large repayments of intra-company loans were the main element in reducednet FDI flows for some major host countries. IPAsin developed countries reported major setbacks intheir efforts to attract FDI, including divestmentsor the scaling down of planned projects.
1. FDI down, as cross-borderM&As dwindle
FDI inflows to developed countries declinedfor the second year in a row, with the share ofdeveloped countries in world FDI inflowsremaining almost the same as in the previous year(more than 70%) (annex table B.1). If inflows are
adjusted to exclude transshipped investment inLuxembourg (box II.11), that share would declineby a further 15 percentage points. What lays behindthe continuing downturn? The slow recovery of theUnited States and other host economies affectedprofit prospects, making companies more cautiousabout FDI, especially the market-seeking type. Thesignificant expansion or consolidation in someindustries, including cross-border M&As, reducedthe opportunities for FDI. Declining stock marketsand the need for cost-cutting measures constrainedthe financial capacity of corporations to engagein FDI.
Intra-company loans47 declined sharply forseveral countries: of the 19 countries that reportcomponents of inward FDI, intra-company loansturned negative in 4 and declined in 6 countriesin 2002. That offset increases or added to decreasesin reinvested earnings and equity, the othercomponents of FDI (annex table A.II.5). Interestrate differentials between countries might havebeen one factor in this (see chapter I). Another wasthe fall in cross-border M&As. And a third couldbe recalibrations of debt-to-equity ratios byrecalling loans (see chapter I).
Despite the overall decline, about a third ofdeveloped countries experienced an increase in FDIinflows in 2002 (9 countries out of 26). The topFDI recipients were Luxembourg, France andGermany (figure II.27).48 The United States—thelargest recipient in 2001—did not make it to theregion’s top three in 2002. FDI inflows also fell
8070605040302010
0Per
cent
age
of r
espo
nses
2003/04 2004/05
Worsen Improve Remain the same
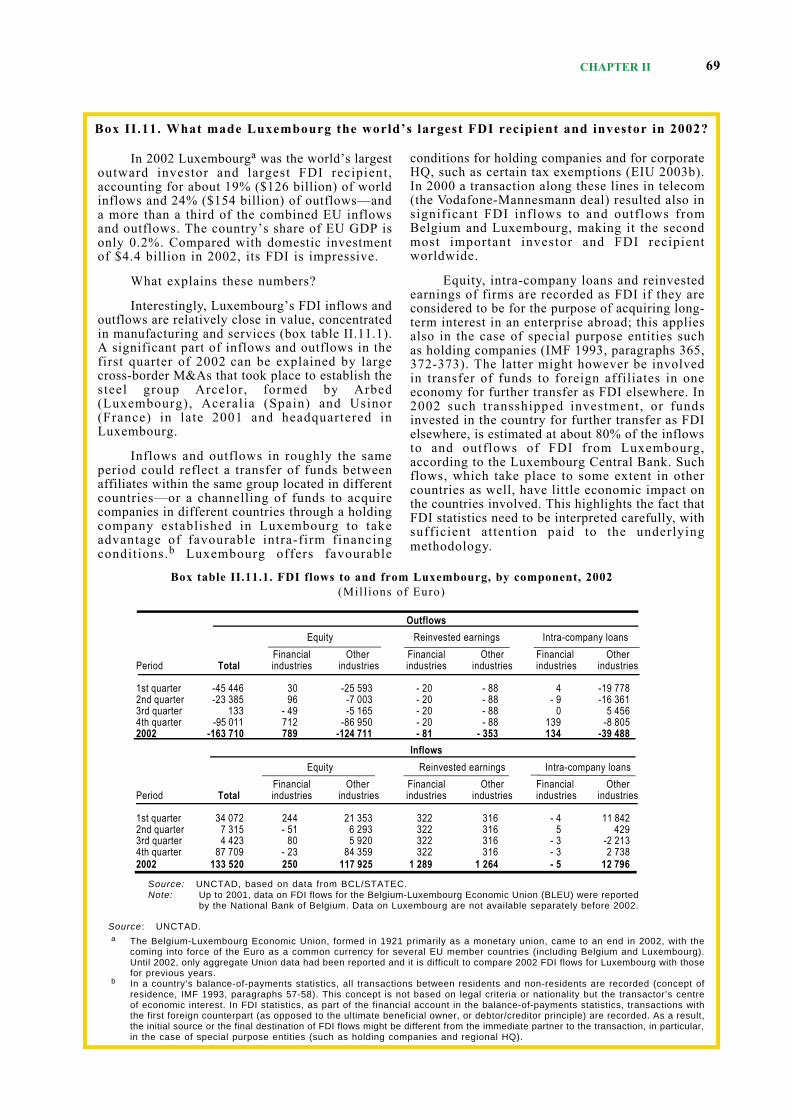
CHAPTER II 69
In 2002 Luxembourga was the world’s largestoutward investor and largest FDI recipient,accounting for about 19% ($126 billion) of worldinflows and 24% ($154 billion) of outflows—anda more than a third of the combined EU inflowsand outflows. The country’s share of EU GDP isonly 0.2%. Compared with domestic investmentof $4.4 billion in 2002, its FDI is impressive.
What explains these numbers?
Interestingly, Luxembourg’s FDI inflows andoutflows are relatively close in value, concentratedin manufacturing and services (box table II.11.1).A significant part of inflows and outflows in thefirst quarter of 2002 can be explained by largecross-border M&As that took place to establish thesteel group Arcelor, formed by Arbed(Luxembourg), Aceralia (Spain) and Usinor(France) in late 2001 and headquartered inLuxembourg.
Inflows and outflows in roughly the sameperiod could reflect a transfer of funds betweenaffiliates within the same group located in differentcountries—or a channelling of funds to acquirecompanies in different countries through a holdingcompany established in Luxembourg to takeadvantage of favourable intra-firm financingconditions.b Luxembourg offers favourable
Box II.11. What made Luxembourg the world’s largest FDI recipient and investor in 2002?
conditions for holding companies and for corporateHQ, such as certain tax exemptions (EIU 2003b).In 2000 a transaction along these lines in telecom(the Vodafone-Mannesmann deal) resulted also insignificant FDI inflows to and outflows fromBelgium and Luxembourg, making it the secondmost important investor and FDI recipientworldwide.
Equity, intra-company loans and reinvestedearnings of firms are recorded as FDI if they areconsidered to be for the purpose of acquiring long-term interest in an enterprise abroad; this appliesalso in the case of special purpose entities suchas holding companies (IMF 1993, paragraphs 365,372-373). The latter might however be involvedin transfer of funds to foreign affiliates in oneeconomy for further transfer as FDI elsewhere. In2002 such transshipped investment, or fundsinvested in the country for further transfer as FDIelsewhere, is estimated at about 80% of the inflowsto and outflows of FDI from Luxembourg,according to the Luxembourg Central Bank. Suchflows, which take place to some extent in othercountries as well, have little economic impact onthe countries involved. This highlights the fact thatFDI statistics need to be interpreted carefully, withsufficient attention paid to the underlyingmethodology.
Source : UNCTAD.a The Belgium-Luxembourg Economic Union, formed in 1921 primarily as a monetary union, came to an end in 2002, with the
coming into force of the Euro as a common currency for several EU member countries (including Belgium and Luxembourg).Until 2002, only aggregate Union data had been reported and it is difficult to compare 2002 FDI flows for Luxembourg with thosefor previous years.
b In a country’s balance-of-payments statistics, all transactions between residents and non-residents are recorded (concept ofresidence, IMF 1993, paragraphs 57-58). This concept is not based on legal criteria or nationality but the transactor’s centreof economic interest. In FDI statistics, as part of the financial account in the balance-of-payments statistics, transactions withthe first foreign counterpart (as opposed to the ultimate beneficial owner, or debtor/creditor principle) are recorded. As a result,the initial source or the final destination of FDI flows might be different from the immediate partner to the transaction, in particular,in the case of special purpose entities (such as holding companies and regional HQ).
Box table II.11.1. FDI flows to and from Luxembourg, by component, 2002(Mill ions of Euro)
Outflows
Equity Reinvested earnings Intra-company loans
Financial Other Financial Other Financial OtherPeriod Total industries industries industries industries industries industries
1st quarter -45 446 30 -25 593 - 20 - 88 4 -19 7782nd quarter -23 385 96 -7 003 - 20 - 88 - 9 -16 3613rd quarter 133 - 49 -5 165 - 20 - 88 0 5 4564th quarter -95 011 712 -86 950 - 20 - 88 139 -8 8052002 -163 710 789 -124 711 - 81 - 353 134 -39 488
Inflows
Equity Reinvested earnings Intra-company loans
Financial Other Financial Other Financial OtherPeriod Total industries industries industries industries industries industries
1st quarter 34 072 244 21 353 322 316 - 4 11 8422nd quarter 7 315 - 51 6 293 322 316 5 4293rd quarter 4 423 80 5 920 322 316 - 3 -2 2134th quarter 87 709 - 23 84 359 322 316 - 3 2 7382002 133 520 250 117 925 1 289 1 264 - 5 12 796
Source: UNCTAD, based on data from BCL/STATEC.Note: Up to 2001, data on FDI flows for the Belgium-Luxembourg Economic Union (BLEU) were reported
by the National Bank of Belgium. Data on Luxembourg are not available separately before 2002.
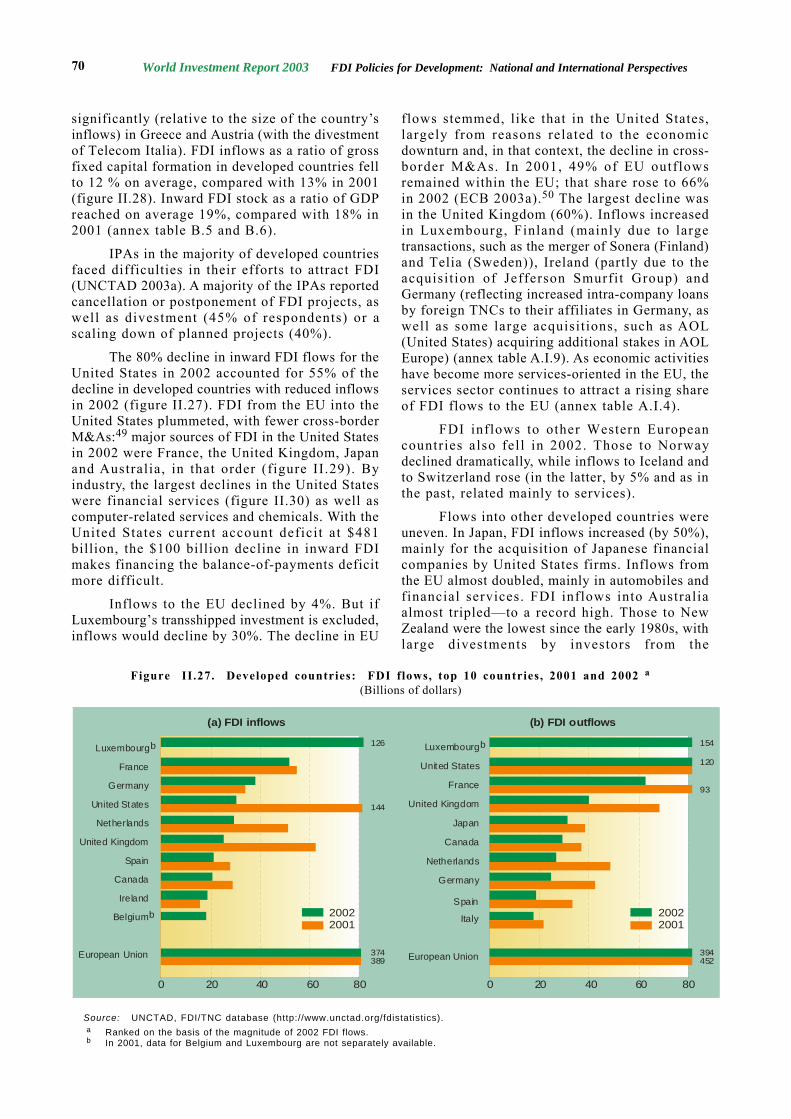
World Investment Report 2003 FDI Policies for Development: National and International Perspectives70
significantly (relative to the size of the country’sinflows) in Greece and Austria (with the divestmentof Telecom Italia). FDI inflows as a ratio of grossfixed capital formation in developed countries fellto 12 % on average, compared with 13% in 2001(figure II.28). Inward FDI stock as a ratio of GDPreached on average 19%, compared with 18% in2001 (annex table B.5 and B.6).
IPAs in the majority of developed countriesfaced difficulties in their efforts to attract FDI(UNCTAD 2003a). A majority of the IPAs reportedcancellation or postponement of FDI projects, aswell as divestment (45% of respondents) or ascaling down of planned projects (40%).
The 80% decline in inward FDI flows for theUnited States in 2002 accounted for 55% of thedecline in developed countries with reduced inflowsin 2002 (figure II.27). FDI from the EU into theUnited States plummeted, with fewer cross-borderM&As:49 major sources of FDI in the United Statesin 2002 were France, the United Kingdom, Japanand Australia, in that order (figure II.29). Byindustry, the largest declines in the United Stateswere financial services (figure II.30) as well ascomputer-related services and chemicals. With theUnited States current account deficit at $481billion, the $100 billion decline in inward FDImakes financing the balance-of-payments deficitmore difficult.
Inflows to the EU declined by 4%. But ifLuxembourg’s transshipped investment is excluded,inflows would decline by 30%. The decline in EU
flows stemmed, like that in the United States,largely from reasons related to the economicdownturn and, in that context, the decline in cross-border M&As. In 2001, 49% of EU outflowsremained within the EU; that share rose to 66%in 2002 (ECB 2003a).50 The largest decline wasin the United Kingdom (60%). Inflows increasedin Luxembourg, Finland (mainly due to largetransactions, such as the merger of Sonera (Finland)and Telia (Sweden)), Ireland (partly due to theacquisit ion of Jefferson Smurfit Group) andGermany (reflecting increased intra-company loansby foreign TNCs to their affiliates in Germany, aswell as some large acquisitions, such as AOL(United States) acquiring additional stakes in AOLEurope) (annex table A.I.9). As economic activitieshave become more services-oriented in the EU, theservices sector continues to attract a rising shareof FDI flows to the EU (annex table A.I.4).
FDI inflows to other Western Europeancountries also fell in 2002. Those to Norwaydeclined dramatically, while inflows to Iceland andto Switzerland rose (in the latter, by 5% and as inthe past, related mainly to services).
Flows into other developed countries wereuneven. In Japan, FDI inflows increased (by 50%),mainly for the acquisition of Japanese financialcompanies by United States firms. Inflows fromthe EU almost doubled, mainly in automobiles andfinancial services. FDI inflows into Australiaalmost tripled—to a record high. Those to NewZealand were the lowest since the early 1980s, withlarge divestments by investors from the
Figure II.27. Developed countries: FDI flows, top 10 countries, 2001 and 2002 a
(Billions of dollars)
Source: UNCTAD, FDI/TNC database (http://www.unctad.org/fdistatistics).a Ranked on the basis of the magnitude of 2002 FDI flows.b In 2001, data for Belgium and Luxembourg are not separately available.
(a) FDI inflows (b) FDI outflows
0 20 40 60 80 0 20 40 60 80
Luxembourgb
France
Germany
United States
Netherlands
United Kingdom
Spain
Canada
Ireland
Belgiumb
European Union
126
144
374389
20022001
20022001
154
120
93
394452
Luxembourgb
United States
France
United Kingdom
Japan
Canada
Netherlands
Germany
Spain
Italy
European Union
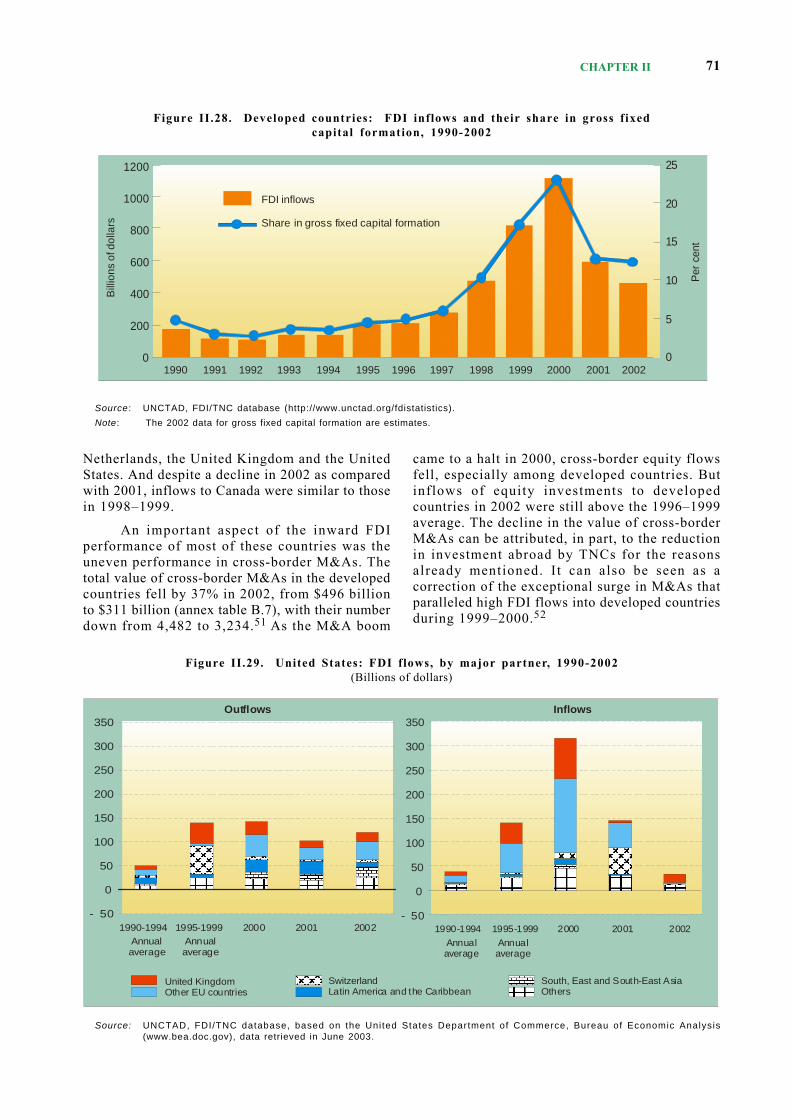
CHAPTER II 71
Netherlands, the United Kingdom and the UnitedStates. And despite a decline in 2002 as comparedwith 2001, inflows to Canada were similar to thosein 1998–1999.
An important aspect of the inward FDIperformance of most of these countries was theuneven performance in cross-border M&As. Thetotal value of cross-border M&As in the developedcountries fell by 37% in 2002, from $496 billionto $311 billion (annex table B.7), with their numberdown from 4,482 to 3,234.51 As the M&A boom
came to a halt in 2000, cross-border equity flowsfell, especially among developed countries. Butinflows of equity investments to developedcountries in 2002 were still above the 1996–1999average. The decline in the value of cross-borderM&As can be attributed, in part, to the reductionin investment abroad by TNCs for the reasonsalready mentioned. I t can also be seen as acorrection of the exceptional surge in M&As thatparalleled high FDI flows into developed countriesduring 1999–2000.52
Figure II.28. Developed countries: FDI inflows and their share in gross fixedcapital formation, 1990-2002
Source : UNCTAD, FDI/TNC database (http://www.unctad.org/fdistatistics).
Note: The 2002 data for gross fixed capital formation are estimates.
Figure II.29. United States: FDI flows, by major partner, 1990-2002(Billions of dollars)
Source: UNCTAD, FDI/TNC database, based on the United States Department of Commerce, Bureau of Economic Analysis(www.bea.doc.gov), data retrieved in June 2003.
1200
1000
800
600
400
200
01990 1991 1992 1993 1994 1995 1996 1997 1998 1999 2000 2001 2002
25
20
15
10
5
0
Bill
ions
of d
olla
rs
Per
cen
t
FDI inflows
Share in gross fixed capital formation
United KingdomOther EU countries
SwitzerlandLatin America and the Caribbean
South, East and South-East AsiaOthers
Outflows Inflows
- 50
0
50
100
150
200
250
300
350
- 50
0
50
100
150
200
250
300
350
1990-1994 1990-19941995-1999 2000 2001 2002 1995-1999 2000 2001 2002 Annualaverage
Annualaverage
Annualaverage
Annualaverage
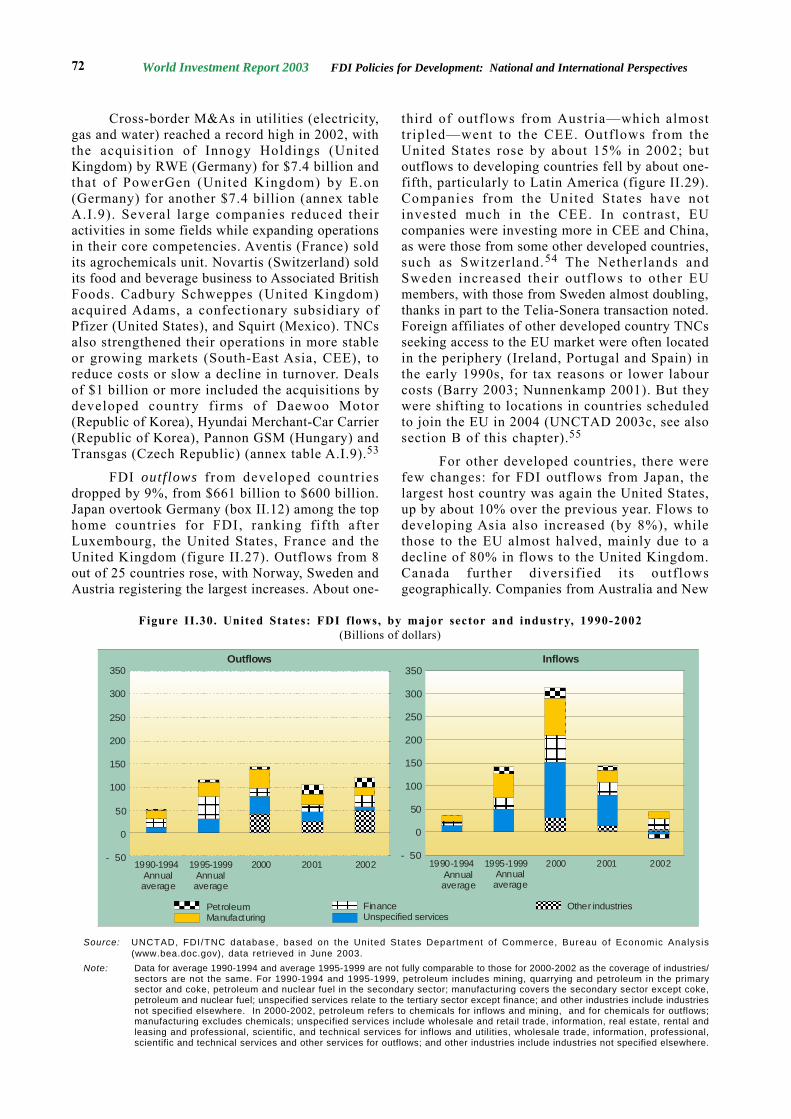
World Investment Report 2003 FDI Policies for Development: National and International Perspectives72
Cross-border M&As in utilities (electricity,gas and water) reached a record high in 2002, withthe acquisit ion of Innogy Holdings (UnitedKingdom) by RWE (Germany) for $7.4 billion andthat of PowerGen (United Kingdom) by E.on(Germany) for another $7.4 billion (annex tableA.I.9). Several large companies reduced theiractivities in some fields while expanding operationsin their core competencies. Aventis (France) soldits agrochemicals unit. Novartis (Switzerland) soldits food and beverage business to Associated BritishFoods. Cadbury Schweppes (United Kingdom)acquired Adams, a confectionary subsidiary ofPfizer (United States), and Squirt (Mexico). TNCsalso strengthened their operations in more stableor growing markets (South-East Asia, CEE), toreduce costs or slow a decline in turnover. Dealsof $1 billion or more included the acquisitions bydeveloped country firms of Daewoo Motor(Republic of Korea), Hyundai Merchant-Car Carrier(Republic of Korea), Pannon GSM (Hungary) andTransgas (Czech Republic) (annex table A.I.9).53
FDI outflows from developed countriesdropped by 9%, from $661 billion to $600 billion.Japan overtook Germany (box II.12) among the tophome countries for FDI, ranking fifth afterLuxembourg, the United States, France and theUnited Kingdom (figure II.27). Outflows from 8out of 25 countries rose, with Norway, Sweden andAustria registering the largest increases. About one-
third of outflows from Austria—which almosttripled—went to the CEE. Outflows from theUnited States rose by about 15% in 2002; butoutflows to developing countries fell by about one-fifth, particularly to Latin America (figure II.29).Companies from the United States have notinvested much in the CEE. In contrast , EUcompanies were investing more in CEE and China,as were those from some other developed countries,such as Switzerland.54 The Netherlands andSweden increased their outflows to other EUmembers, with those from Sweden almost doubling,thanks in part to the Telia-Sonera transaction noted.Foreign affiliates of other developed country TNCsseeking access to the EU market were often locatedin the periphery (Ireland, Portugal and Spain) inthe early 1990s, for tax reasons or lower labourcosts (Barry 2003; Nunnenkamp 2001). But theywere shifting to locations in countries scheduledto join the EU in 2004 (UNCTAD 2003c, see alsosection B of this chapter).55
For other developed countries, there werefew changes: for FDI outflows from Japan, thelargest host country was again the United States,up by about 10% over the previous year. Flows todeveloping Asia also increased (by 8%), whilethose to the EU almost halved, mainly due to adecline of 80% in flows to the United Kingdom.Canada further diversified i ts outflowsgeographically. Companies from Australia and New
Figure II.30. United States: FDI flows, by major sector and industry, 1990-2002(Billions of dollars)
Source: UNCTAD, FDI/TNC database, based on the United States Department of Commerce, Bureau of Economic Analysis(www.bea.doc.gov), data retrieved in June 2003.
Note: Data for average 1990-1994 and average 1995-1999 are not fully comparable to those for 2000-2002 as the coverage of industries/sectors are not the same. For 1990-1994 and 1995-1999, petroleum includes mining, quarrying and petroleum in the primarysector and coke, petroleum and nuclear fuel in the secondary sector; manufacturing covers the secondary sector except coke,petroleum and nuclear fuel; unspecified services relate to the tertiary sector except finance; and other industries include industriesnot specified elsewhere. In 2000-2002, petroleum refers to chemicals for inflows and mining, and for chemicals for outflows;manufacturing excludes chemicals; unspecified services include wholesale and retail trade, information, real estate, rental andleasing and professional, scientific, and technical services for inflows and utilities, wholesale trade, information, professional,scientific and technical services and other services for outflows; and other industries include industries not specified elsewhere.
1990-1994 1990-19941995-1999 2000 2001 2002 1995-1999 2000 2001 2002 Annualaverage
Annualaverage
Annualaverage
Annualaverage
PetroleumManufacturing
FinanceUnspecified services
Other industries
Outflows Inflows
- 50
0
50
100
150
200
250
300
350
- 50
0
50
100
150
200
250
300
350
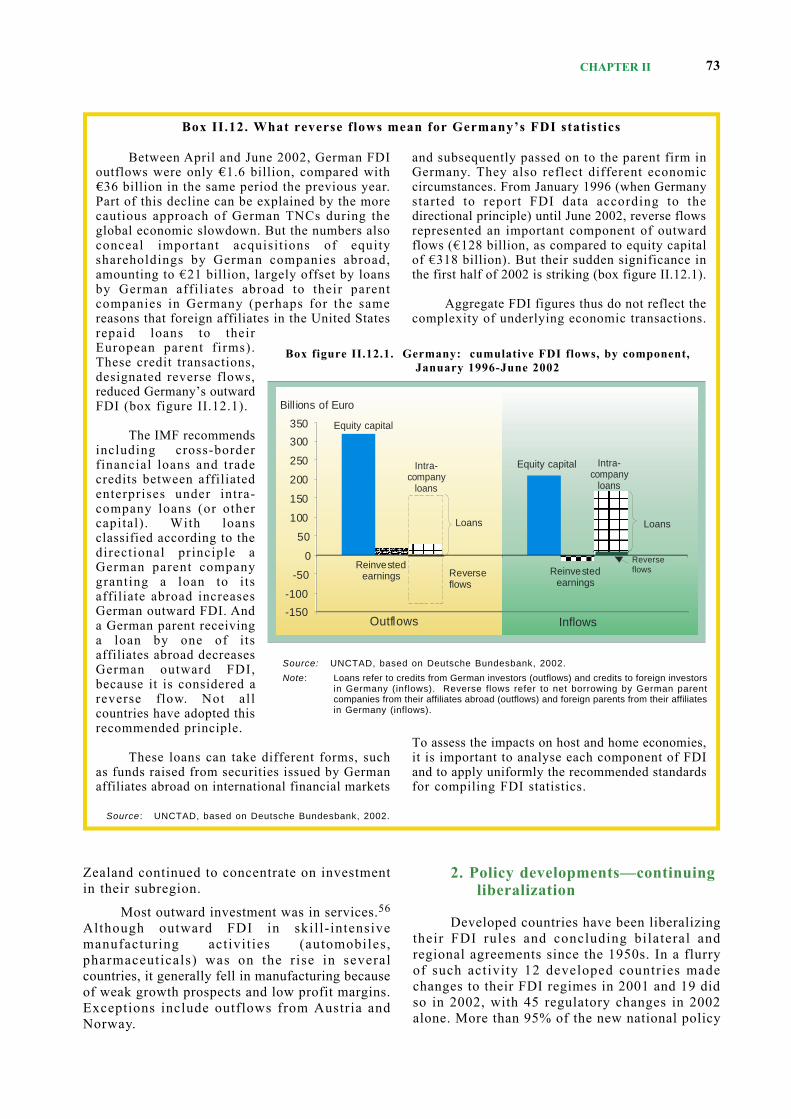
CHAPTER II 73
Zealand continued to concentrate on investmentin their subregion.
Most outward investment was in services.56
Although outward FDI in skill-intensivemanufacturing activit ies (automobiles,pharmaceuticals) was on the rise in severalcountries, it generally fell in manufacturing becauseof weak growth prospects and low profit margins.Exceptions include outflows from Austria andNorway.
2. Policy developments—continuingliberalization
Developed countries have been liberalizingtheir FDI rules and concluding bilateral andregional agreements since the 1950s. In a flurryof such activity 12 developed countries madechanges to their FDI regimes in 2001 and 19 didso in 2002, with 45 regulatory changes in 2002alone. More than 95% of the new national policy
Between April and June 2002, German FDIoutflows were only €1.6 billion, compared with€36 billion in the same period the previous year.Part of this decline can be explained by the morecautious approach of German TNCs during theglobal economic slowdown. But the numbers alsoconceal important acquisit ions of equityshareholdings by German companies abroad,amounting to €21 billion, largely offset by loansby German affil iates abroad to their parentcompanies in Germany (perhaps for the samereasons that foreign affiliates in the United Statesrepaid loans to theirEuropean parent firms).These credit transactions,designated reverse flows,reduced Germany’s outwardFDI (box figure II.12.1).
The IMF recommendsincluding cross-borderfinancial loans and tradecredits between affiliatedenterprises under intra-company loans (or othercapital). With loansclassified according to thedirectional principle aGerman parent companygranting a loan to i tsaffiliate abroad increasesGerman outward FDI. Anda German parent receivinga loan by one of i tsaffiliates abroad decreasesGerman outward FDI,because it is considered areverse flow. Not allcountries have adopted thisrecommended principle.
These loans can take different forms, suchas funds raised from securities issued by Germanaffiliates abroad on international financial markets
and subsequently passed on to the parent firm inGermany. They also reflect different economiccircumstances. From January 1996 (when Germanystarted to report FDI data according to thedirectional principle) until June 2002, reverse flowsrepresented an important component of outwardflows (€128 billion, as compared to equity capitalof €318 billion). But their sudden significance inthe first half of 2002 is striking (box figure II.12.1).
Aggregate FDI figures thus do not reflect thecomplexity of underlying economic transactions.
To assess the impacts on host and home economies,it is important to analyse each component of FDIand to apply uniformly the recommended standardsfor compiling FDI statistics.
Box II.12. What reverse flows mean for Germany’s FDI statistics
Source : UNCTAD, based on Deutsche Bundesbank, 2002.
Box figure II.12.1. Germany: cumulative FDI flows, by component,January 1996-June 2002
Source: UNCTAD, based on Deutsche Bundesbank, 2002.
Note: Loans refer to credits from German investors (outflows) and credits to foreign investorsin Germany (inflows). Reverse flows refer to net borrowing by German parentcompanies from their affiliates abroad (outflows) and foreign parents from their affiliatesin Germany (inflows).
Outflows Inflows-150
-100
-50
0
50
100
150
200
250
300
350
Bill ions of Euro
Reverseflows
Equity capital
Equity capital
Loans Loans
Reverseflows
Reinvestedearnings
Reinvestedearnings
Intra-company
loans
Intra-company
loans
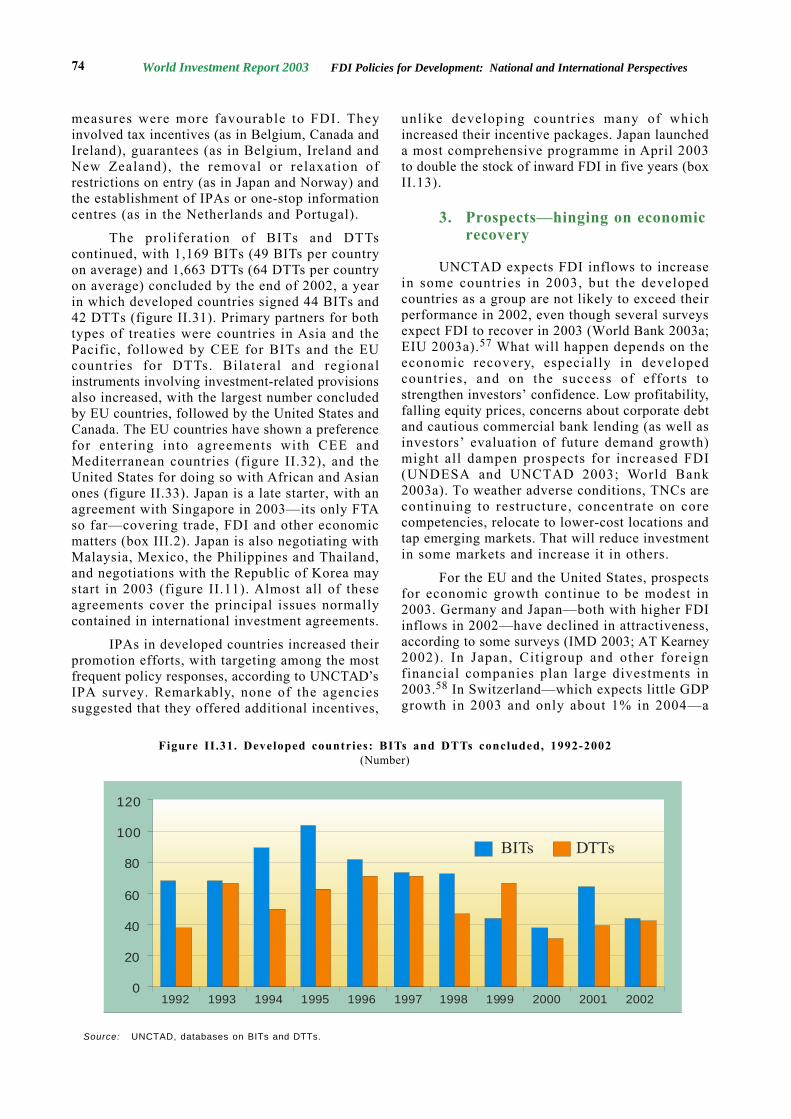
World Investment Report 2003 FDI Policies for Development: National and International Perspectives74
measures were more favourable to FDI. Theyinvolved tax incentives (as in Belgium, Canada andIreland), guarantees (as in Belgium, Ireland andNew Zealand), the removal or relaxation ofrestrictions on entry (as in Japan and Norway) andthe establishment of IPAs or one-stop informationcentres (as in the Netherlands and Portugal).
The proliferation of BITs and DTTscontinued, with 1,169 BITs (49 BITs per countryon average) and 1,663 DTTs (64 DTTs per countryon average) concluded by the end of 2002, a yearin which developed countries signed 44 BITs and42 DTTs (figure II.31). Primary partners for bothtypes of treaties were countries in Asia and thePacific, followed by CEE for BITs and the EUcountries for DTTs. Bilateral and regionalinstruments involving investment-related provisionsalso increased, with the largest number concludedby EU countries, followed by the United States andCanada. The EU countries have shown a preferencefor entering into agreements with CEE andMediterranean countries (figure II.32), and theUnited States for doing so with African and Asianones (figure II.33). Japan is a late starter, with anagreement with Singapore in 2003—its only FTAso far—covering trade, FDI and other economicmatters (box III.2). Japan is also negotiating withMalaysia, Mexico, the Philippines and Thailand,and negotiations with the Republic of Korea maystart in 2003 (figure II.11). Almost all of theseagreements cover the principal issues normallycontained in international investment agreements.
IPAs in developed countries increased theirpromotion efforts, with targeting among the mostfrequent policy responses, according to UNCTAD’sIPA survey. Remarkably, none of the agenciessuggested that they offered additional incentives,
unlike developing countries many of whichincreased their incentive packages. Japan launcheda most comprehensive programme in April 2003to double the stock of inward FDI in five years (boxII.13).
3. Prospects—hinging on economicrecovery
UNCTAD expects FDI inflows to increasein some countries in 2003, but the developedcountries as a group are not likely to exceed theirperformance in 2002, even though several surveysexpect FDI to recover in 2003 (World Bank 2003a;EIU 2003a).57 What will happen depends on theeconomic recovery, especially in developedcountries, and on the success of efforts tostrengthen investors’ confidence. Low profitability,falling equity prices, concerns about corporate debtand cautious commercial bank lending (as well asinvestors’ evaluation of future demand growth)might all dampen prospects for increased FDI(UNDESA and UNCTAD 2003; World Bank2003a). To weather adverse conditions, TNCs arecontinuing to restructure, concentrate on corecompetencies, relocate to lower-cost locations andtap emerging markets. That will reduce investmentin some markets and increase it in others.
For the EU and the United States, prospectsfor economic growth continue to be modest in2003. Germany and Japan—both with higher FDIinflows in 2002—have declined in attractiveness,according to some surveys (IMD 2003; AT Kearney2002). In Japan, Citigroup and other foreignfinancial companies plan large divestments in2003.58 In Switzerland—which expects little GDPgrowth in 2003 and only about 1% in 2004—a
Figure II.31. Developed countries: BITs and DTTs concluded, 1992-2002(Number)
Source: UNCTAD, databases on BITs and DTTs.
0
20
40
60
80
100
120
1992 1993 1994 1995 1996 1997 1998 1999 2000 2001 2002
BITs DTTs
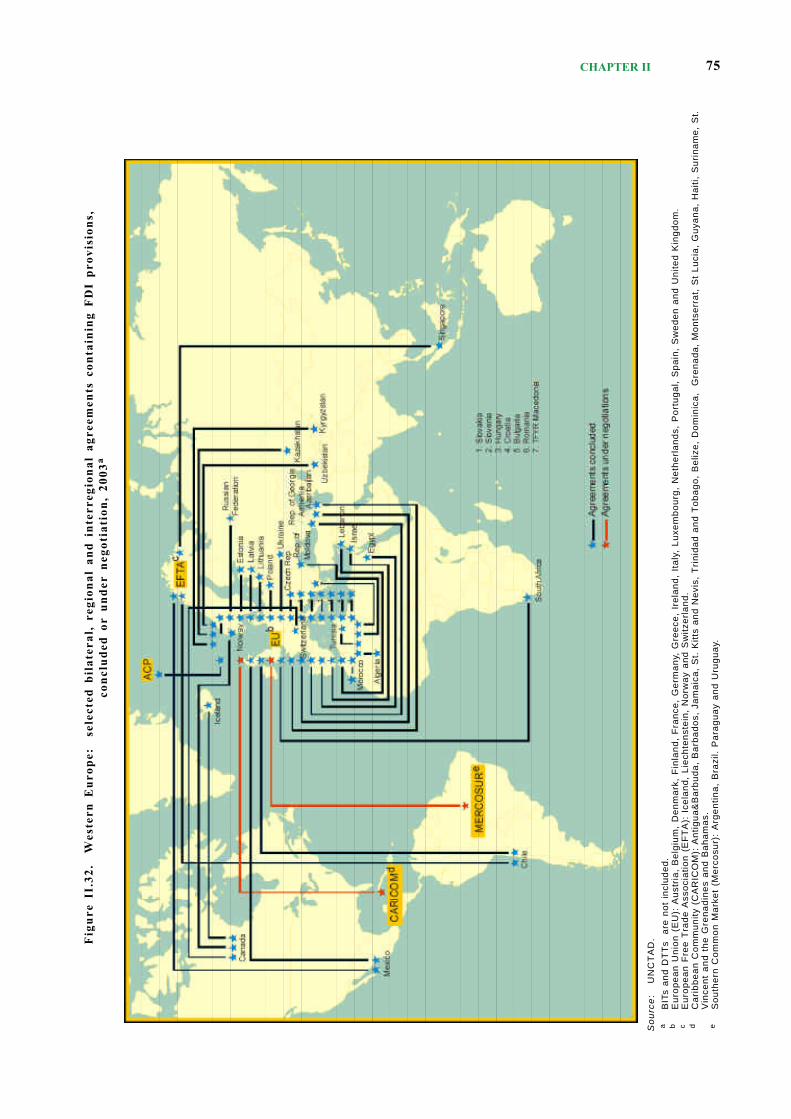
CHAPTER II 75F
igur
e II
.32.
W
este
rn E
urop
e:
sele
cted
bil
ater
al,
regi
onal
and
int
erre
gion
al a
gree
men
ts c
onta
inin
g F
DI
prov
isio
ns,
conc
lude
d or
und
er n
egot
iati
on,
2003
a
So
urc
e:
UN
CT
AD
.a
BIT
s a
nd
DT
Ts
are
not
inc
lude
d.b
Eu
rop
ea
n U
nio
n (
EU
): A
ust
ria
, B
elg
ium
, D
en
ma
rk,
Fin
lan
d,
Fra
nce
, G
erm
an
y, G
reec
e, I
rela
nd,
Ital
y, L
uxe
mb
ou
rg,
Ne
the
rla
nd
s, P
ort
ug
al,
Sp
ain
, S
we
de
n a
nd
Un
ited
Kin
gd
om
.c
Eur
opea
n F
ree
Tra
de A
ssoc
iatio
n (E
FT
A):
Ice
land
, Li
echt
enst
ein,
Nor
way
and
Sw
itzer
land
.d
Ca
rib
be
an
Co
mm
un
ity (
CA
RIC
OM
): A
ntig
ua
&B
arb
ud
a,
Ba
rba
do
s, J
am
aic
a,
St.
Kitt
s a
nd
Ne
vis,
Tri
nid
ad
an
d T
obag
o, B
eliz
e, D
omin
ica,
G
rena
da,
Mon
tser
rat,
St
Luci
a, G
uyan
a, H
aiti,
Sur
inam
e, S
t.V
ince
nt
an
d t
he
Gre
na
din
es
an
d B
ah
am
as.
eS
ou
the
rn C
om
mo
n M
ark
et
(Me
rco
sur)
: A
rge
ntin
a,
Bra
zil.
Pa
rag
ua
y a
nd
Uru
gu
ay.
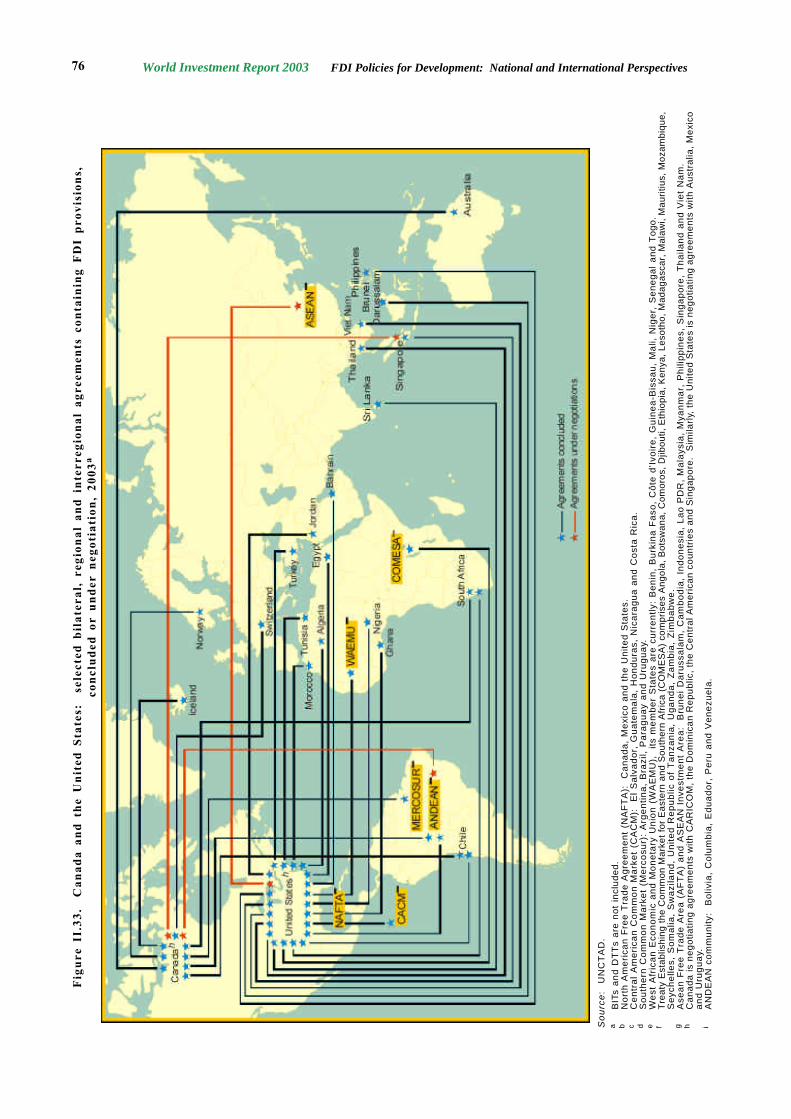
World Investment Report 2003 FDI Policies for Development: National and International Perspectives76F
igur
e II
.33.
C
anad
a an
d th
e U
nite
d St
ates
: s
elec
ted
bila
tera
l, r
egio
nal
and
inte
rreg
iona
l ag
reem
ents
con
tain
ing
FD
I pr
ovis
ions
,co
nclu
ded
or u
nder
neg
otia
tion
, 20
03a
So
urc
e:
UN
CT
AD
.a
BIT
s a
nd
DT
Ts
are
not
incl
uded
.b
Nor
th A
mer
ican
Fre
e T
rade
Agr
eem
ent
(NA
FT
A):
C
anad
a, M
exic
o an
d th
e U
nite
d S
tate
s.c
Ce
ntr
al
Am
eri
can
Co
mm
on
Ma
rke
t (C
AC
M):
E
l S
alv
ad
or,
Gu
ate
ma
la,
Ho
nd
ura
s, N
ica
rag
ua
an
d C
ost
a R
ica
.d
So
uth
ern
Co
mm
on
Ma
rke
t (M
erc
osu
r):
Arg
en
tina
, B
razi
l, P
ara
gu
ay
an
d U
rug
ua
y.e
We
st A
fric
an
Eco
no
mic
an
d M
on
eta
ry U
nio
n (
WA
EM
U),
its
me
mb
er
Sta
tes
are
cu
rre
ntly
: B
en
in,
Bu
rkin
a F
aso
, C
ôte
d’Iv
oir
e,
Gu
ine
a-B
issa
u,
Ma
li, N
ige
r, S
en
eg
al
an
d T
ogo.
fT
reat
y E
stab
lishi
ng t
he C
omm
on M
arke
t fo
r E
aste
rn a
nd S
outh
ern
Afr
ica
(CO
ME
SA
) co
mpr
ises
Ang
ola,
Bot
swan
a, C
omor
os,
Djib
outi,
Eth
iopi
a, K
enya
, Le
soth
o, M
adag
asca
r, M
alaw
i, M
auri
tius,
Moz
ambi
que,
Se
ych
elle
s, S
om
alia
, S
wa
zila
nd
, U
nite
d R
ep
ub
lic o
f T
anza
nia,
Uga
nda,
Zam
bia,
Zim
babw
e.g
Ase
an
Fre
e T
rad
e A
rea
(A
FT
A)
an
d A
SE
AN
In
vest
me
nt
Are
a:
Bru
ne
i D
aru
ssa
lam
, C
am
bo
dia
, In
do
ne
sia
, L
ao
PD
R,
Ma
lays
ia,
Mya
nm
ar,
Ph
ilip
pin
es,
Sin
ga
po
re,
Th
aila
nd
an
d V
iet
Na
m.
hC
anad
a is
neg
otia
ting
agre
emen
ts w
ith C
AR
ICO
M,
the
Dom
inic
an R
epub
lic,
the
Cen
tral
Am
eric
an c
ount
ries
and
Sin
gapo
re.
Sim
ilarl
y, t
he U
nite
d S
tate
s is
neg
otia
ting
agre
emen
ts w
ith A
ustr
alia
, M
exic
oa
nd
Uru
gu
ay.
iA
ND
EA
N c
om
mu
nity
: B
oliv
ia,
Co
lum
bia
, E
du
ad
or,
Pe
ru a
nd
Ve
ne
zue
la.
CHAPTER II 77
In his general policy speech on 31 January2003, the Prime Minister of Japana announced thecountry’s goal to increase FDI through 74 measuresin five specific areas: disseminating information,improving the business environment, reforming theadministration, improving employment and livingconditions, and upgrading national and localgovernment support systems. The measures include(Japan Investment Council 2003):
• Conducting economic research to analyze thebenefits of FDI for Japan and the perceivedobstacles to inward FDI.
• Examining the possibility of financing cross-border M&As through the exchange of stock.
• Establishing a “one-stop” information centrein JETRO to serve as the focal point forforeign companies intending to invest inJapan, providing a variety of informationrelating to FDI in Japan (e. g. about the
investment climate, laws and regulations).This initiative is based on (and reinforces)existing measures such as the portal site ofthe Investment in Japan Information Centre(IJIC)b and JIC.
• Improving the quality of technology-orienteduniversity graduate business schools andprofessional business schools—to improvemanagement, technology and language skills.
• Supporting regional activities to attract TNCsin five local areas.
National authorities implementing thesemeasures include the Office of the Prime Minister’sCabinet, JETRO, the Ministry of Economy, Tradeand Industry and the Ministry of Finance. TheExpert Committee of Japan Investment Council willmonitor the implementation, provide periodicreports and conduct further policy planning.
Box II.13. Measures to promote inward FDI in Japan
Source: UNCTAD, based on Japan, Ministry of Economy, Trade and Industry (www.meti.go.jp); JETRO (www.jetro.go.jp); JIC(www5.cao.go.jp); and Investment in Japan Information Centre (www.investment-japan.net).
a “Foreign direct investment in Japan will bring new technology and innovative management methods, and will also lead to greateremployment opportunities…We will take measures to present Japan as an attractive destination for foreign firms in the aimof doubling the cumulative amount of investment in five years”, General Policy Speech by Prime Minister Junichiro Koizumito the 156th Session of the Diet, 31 January 2003 (http://www.kantei.go.jp/foreign/koizumispeech/2003/01/31sisei_e.html).
b IJIC was established in July 2000 to provide support to potential investors, mainly through information on business opportunitiesand legal issues.
recent FDI survey expected a further slowdown ofFDI in manufacturing in 2003 and a moderateincrease in FDI in services (KOF 2003). So thelikelihood of developed countries attracting moreFDI in 2003 is low.
TNCs from the developed countries willcontinue to invest in EU-accession countries. Theymight also pay more attention to growing andlower-cost markets, such as other CEE countries,Central Asian countries and some developingeconomies, similar to the 1980s when countries atthe EU periphery joined the Common Market.Services requiring large investments (telecom,media, banking and so on) are expected to accountfor a significant share of the EU’s FDI in theseregions. Automobile manufacturing, computer-related activit ies, medical devices andbiotechnology are l ikely to remain importantrecipients.
Cross-border M&As continue to beimportant, but there are signs of a shift towardsgreenfield projects.59 The value of cross-borderM&As in the United States in the first half of 2003was slightly above that in the first half of 2002 (by3%). This suggests that TNCs continue to followmore cautious growth strategies, with decliningprofits and less financing available for additionalM&As, and expansion might remain limited. But
there are exceptions.60 In the pharmaceuticalindustry, while the value of deals is expected toremain low (risk aversion to mega deals), thenumber of transactions is expected to remain high,supported partly by pressure for consolidation inthe European biotech industry and acceleratedconsolidation in Asia (PwC 2003b). Several (mainlysmaller) deals are expected in medical devices,motivated by strategic considerations.61
Developed country IPAs see prospects intheir region as rather bright for 2003-2004, but theyare much more cautious than their counterpartsfrom developing regions. About 45% expect FDIfor their region to improve in 2003-2004 (63% indeveloping countries), while only 15% forecast adeterioration and 40% expect no change. Optimismrises for the longer term, with 58% of respondentsexpecting an improvement in 2004-2005 (93% indeveloping countries) (figure II.34).
Corroborating these findings is a survey ofGerman firms by the Deutsche Industrie- undHandelskammertag (DIHK 2003).62 About a quarterof investors from Germany plan to continueinvesting abroad in 2003–2005—while about 15%plan divestments. The survey revealed that the mainmotives for planned outward FDI in 2003–2005were high costs of skilled labour (45%) and hightaxes (37%) in Germany. Planned investments
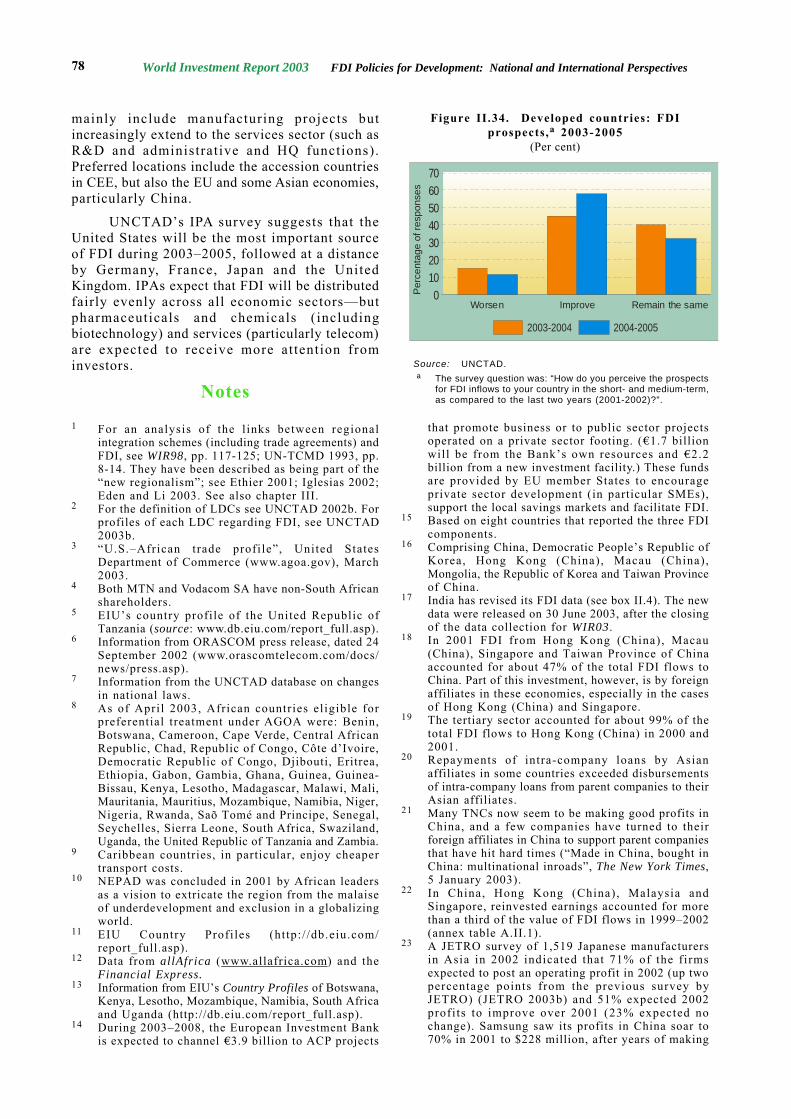
World Investment Report 2003 FDI Policies for Development: National and International Perspectives78
Figure II.34. Developed countries: FDIprospects,a 2003-2005
(Per cent)
Source: UNCTAD.a The survey question was: “How do you perceive the prospects
for FDI inflows to your country in the short- and medium-term,as compared to the last two years (2001-2002)?”.
mainly include manufacturing projects butincreasingly extend to the services sector (such asR&D and administrative and HQ functions).Preferred locations include the accession countriesin CEE, but also the EU and some Asian economies,particularly China.
UNCTAD’s IPA survey suggests that theUnited States will be the most important sourceof FDI during 2003–2005, followed at a distanceby Germany, France, Japan and the UnitedKingdom. IPAs expect that FDI will be distributedfairly evenly across all economic sectors—butpharmaceuticals and chemicals (includingbiotechnology) and services (particularly telecom)are expected to receive more attention frominvestors.
Notes
1 For an analysis of the l inks between regionalintegration schemes (including trade agreements) andFDI, see WIR98, pp. 117-125; UN-TCMD 1993, pp.8-14. They have been described as being part of the“new regionalism”; see Ethier 2001; Iglesias 2002;Eden and Li 2003. See also chapter III.
2 For the definition of LDCs see UNCTAD 2002b. Forprofiles of each LDC regarding FDI, see UNCTAD2003b.
3 “U.S.–African trade profile”, United StatesDepartment of Commerce (www.agoa.gov), March2003.
4 Both MTN and Vodacom SA have non-South Africanshareholders.
5 EIU’s country profile of the United Republic ofTanzania (source: www.db.eiu.com/report_full.asp).
6 Information from ORASCOM press release, dated 24September 2002 (www.orascomtelecom.com/docs/news/press.asp).
7 Information from the UNCTAD database on changesin national laws.
8 As of April 2003, African countries eligible forpreferential treatment under AGOA were: Benin,Botswana, Cameroon, Cape Verde, Central AfricanRepublic, Chad, Republic of Congo, Côte d’Ivoire,Democratic Republic of Congo, Djibouti, Eritrea,Ethiopia, Gabon, Gambia, Ghana, Guinea, Guinea-Bissau, Kenya, Lesotho, Madagascar, Malawi, Mali,Mauritania, Mauritius, Mozambique, Namibia, Niger,Nigeria, Rwanda, Saõ Tomé and Principe, Senegal,Seychelles, Sierra Leone, South Africa, Swaziland,Uganda, the United Republic of Tanzania and Zambia.
9 Caribbean countries, in particular, enjoy cheapertransport costs.
10 NEPAD was concluded in 2001 by African leadersas a vision to extricate the region from the malaiseof underdevelopment and exclusion in a globalizingworld.
11 EIU Country Profi les (http:/ /db.eiu.com/report_full.asp).
12 Data from allAfrica (www.allafrica.com) and theFinancial Express.
13 Information from EIU’s Country Profiles of Botswana,Kenya, Lesotho, Mozambique, Namibia, South Africaand Uganda (http://db.eiu.com/report_full.asp).
14 During 2003–2008, the European Investment Bankis expected to channel €3.9 billion to ACP projects
that promote business or to public sector projectsoperated on a private sector footing. (€1.7 billionwill be from the Bank’s own resources and €2.2billion from a new investment facility.) These fundsare provided by EU member States to encourageprivate sector development (in particular SMEs),support the local savings markets and facilitate FDI.
15 Based on eight countries that reported the three FDIcomponents.
16 Comprising China, Democratic People’s Republic ofKorea, Hong Kong (China), Macau (China),Mongolia, the Republic of Korea and Taiwan Provinceof China.
17 India has revised its FDI data (see box II.4). The newdata were released on 30 June 2003, after the closingof the data collection for WIR03.
18 In 2001 FDI from Hong Kong (China), Macau(China), Singapore and Taiwan Province of Chinaaccounted for about 47% of the total FDI flows toChina. Part of this investment, however, is by foreignaffiliates in these economies, especially in the casesof Hong Kong (China) and Singapore.
19 The tertiary sector accounted for about 99% of thetotal FDI flows to Hong Kong (China) in 2000 and2001.
20 Repayments of intra-company loans by Asianaffiliates in some countries exceeded disbursementsof intra-company loans from parent companies to theirAsian affiliates.
21 Many TNCs now seem to be making good profits inChina, and a few companies have turned to theirforeign affiliates in China to support parent companiesthat have hit hard times (“Made in China, bought inChina: multinational inroads”, The New York Times,5 January 2003).
22 In China, Hong Kong (China), Malaysia andSingapore, reinvested earnings accounted for morethan a third of the value of FDI flows in 1999–2002(annex table A.II.1).
23 A JETRO survey of 1,519 Japanese manufacturersin Asia in 2002 indicated that 71% of the firmsexpected to post an operating profit in 2002 (up twopercentage points from the previous survey byJETRO) (JETRO 2003b) and 51% expected 2002profits to improve over 2001 (23% expected nochange). Samsung saw its profits in China soar to70% in 2001 to $228 million, after years of making
706050403020100P
erce
ntag
e of
resp
onse
s
2003-2004 2004-2005
Worsen Improve Remain the same
CHAPTER II 79
losses operating there (“How Samsung plugged intoChina: it’s finally making gains by selling high-endproducts”, Business Week, 4 March 2002 (http://www.businessweek.com/magazine/content/02_09/b3772138.htm).
24 See UNCTAD press release on “China: an emerginghome country for TNCs”, 2003.
25 Economies affected by SARS (such as China andHong Kong (China)) may have declining FDI flowsin 2003—as investments are postponed—contributingto a weaker regional FDI inflows performance. TheASEAN region will also be affected, but to a lesserextent.
26 Based on real GDP growth as reported in IMF 2003a.27 See “Global firms scramble for Iraq work”, BBC
News, 12 June 2003 (http://www.bbc.co.uk/2/hi/business/2983054.stm).
28 The World Bank (2003a, p.101) forecast that FDIflows to Asia and the Pacific will increase marginallyin 2003.
29 Half the $45 bil l ion in external debt owed bycompanies in Argentina is estimated to belong toforeign affiliates (ECLAC 2003).
30 Data from INEGI (www.inegi.gob.mx).31 Data from INEGI (www.inegi.gob.mx).32 EIU, Business Latin America , 24 February 2003.33 EIU, Business Latin America , 24 March 2003.34 In fact, some foreign affiliates established to serve
local or regional markets had to start exporting toother markets to pay off their loans in Brazil .Managers at Ford, General Motors and Volkswagenexpressed this view in interviews conducted byMariano Laplane.
35 World Bank and EIU studies forecast a slight decreasein FDI flows for 2003, with a slow recoveryafterwards (World Bank 2003a; EIU 2003a).
36 For example, for Flextronics, the existence of R&Din Austria and Germany makes sense only ifcomplemented by some manufacturing operations inCEE (especially Hungary and to some degree inPoland); if production were to move to othercontinents, so would R&D (Figyelö 2002).
37 The gas utility Transgas (Czech Republic) was soldto RWE (Germany); the gas util i ty SlovenskyPlynarensky Priemysel (Slovakia) to Gazprom(Russian Federation), Ruhrgas (Germany) and Gazde France (France); KPN’s (Netherlands), Sonera’s(Finland) and Tele Danmark’s (Denmark) shares inmobile telecom provider Pannon GSM (Hungary)were taken over by Telenor (Norway); thepharmaceutical firm Lek (Slovenia) was acquired byNovartis (Switzerland); the bank Ceska Sporitelna(Czech Republic) by Erste Bank (Austria); theinformatics firm GTS Central Europe (Poland) wastaken over by KPN (Netherlands); the Kredyt Bank(Poland) was sold to KBC Bank (Netherlands);Zagrebacka Banka (Croatia) to UniCredito Italiano(Italy) and Allianz (Germany); the beer producerBravo International (Russian Federation) to Heineken(Netherlands) and the Nova Ljubljanska Banka(Slovenia) to KBC Bank (Belgium).
38 This is why the cross-border M&A sales of Hungaryin 2002 were significantly higher than FDI inflows.For a discussion of the data on cross-border M&Asand its correspondence with FDI flows, see WIR00,pp. 105-106.
39 Automotive Lightning, Federal Mogul, F.X. Meiller,HP Pelzer, Rieter, Ronal, SAI Automotive, TIAutomotive, Toyoda Gosei and VDO.
40 Data on FDI projects are from OCO Consulting.
41 According to data on FDI projects collected by OCOConsulting.
42 According to a survey carried out by OCO Consultingamong investors.
43 After accession in 2004 new EU member countrieswill be entitled to 25% of the Common AgriculturalPolicy funds and 30% of the regional developmentfunds available to current EU members. Subsequently,those shares will increase by 10% per annum till theyreach the level of 100% around 2014.
44 The basic idea of the “flying-geese” paradigm,developed for the case of TNC-led growth by K.Kojima (1973), is that, as host countries industrializeand go through industrial upgrading and learning inan open-economy context, the type of FDI flowingfrom home countries changes in character towardshigher skills; in turn, simpler activities will graduallyflow out from relatively advanced host countries tonewcomer host countries. This process reinforces thebasis for, and the benefits from, trade. For a detaileddiscussion, see WIR95, pp. 258-260.
45 This estimate is higher than that of the World Bank,which forecast FDI inflows of $30 billion for its“Europe and Central Asia” region that includes CEEand Turkey (World Bank 2003a, p. 101).
46 The decline could be as large as 39% (an estimated$230 billion) if transshipped investment to and fromLuxembourg are excluded. The term “transshippedinvestment” is used here to refer to investment inforeign affiliates in Luxembourg that subsequentlyinvest abroad. For details, see box II.11.
47 Intra-company loans are one of the three componentsof FDI, as recommended by international guidelines,consisting of short- and long-term loans and tradecredits between affiliated enterprises, as well asfinancial leasing (IMF 1993).
48 Data for Belgium and Luxembourg before 2002 arenot separately available.
49 In 2001 about 95% of FDI inflows to the UnitedStates were from the EU and Switzerland. The valueof cross-border M&As by EU companies in the UnitedStates declined by 52% in 2002 (UNCTAD, cross-border M&A database; see also chapter I).
50 However, in some countries, the share of intra-EUinflows declined: in Sweden from 80% in 2001 to66% in 2002, in Denmark from 60% to 38% and inIreland from 99% to 95%.
51 UNCTAD, cross-border M&A database.52 For conceptual issues related to cross-border M&As
and their valuation in FDI statistics, see WIR00.53 See footnote 37 for the largest M&A sales of CEE.
For motivations of M&As, see WIR00.54 For example, the acquisi t ion by Novartis
(Switzerland) of Lek (Slovenia) for $0.9 billion wasamong the largest cross-border M&As undertaken inthe CEE region in 2002.
55 Because “EU enlargement is not a zero sum game inwhich the new member states will compete againstcurrent incumbents for a fixed pool of FDI” (Barry2003, p.189), it remains to be seen how much currentEU members have to fear a deviation of FDI towardsthe accession countries.
56 More than a third of the cross-border provision ofservices is undertaken through the establishment offoreign affiliates in the host economy (mode threeof the GATS classification, accounting for a shareof about 38% of total services delivered by the fourmodes of supply described in GATS (WTO 1995;Karsenty 1999). In major host developed countries,turnover in services by foreign affiliates accounted

World Investment Report 2003 FDI Policies for Development: National and International Perspectives80
for between 9% and 30% of the national total(UNCTAD, FDI/TNC database).
57 During the first quarter, or the first four months of2003, inflows for two of the top five FDI recipients(in 2002), the Netherlands and the United States,increased by 122%, and 200%, respectively, over thesame period of 2002. On the other hand, FDI inflowsduring January-April to France declined by 26%, toGermany by 61% and to Japan by 37%.
58 Nihon Keizai Shimbun, 16 March 2003.59 Participants in UNCTAD’s IPA survey expect
greenfield investment to play an important role asa mode for FDI.
60 Announcements include, for example, the acquisitionsof Wella (Germany) by Procter & Gamble (United
States) for $6.1 billion, Sunoco’s plasticizer businessin Neville Islands (United States) by BASF (Germany)for an undisclosed amount and Alstom’s (France)industrial turbines business by Siemens (Germany)for $1.2 billion.
61 Recent examples are the offers by Zimmer (UnitedStates) and Smith & Nephew (United Kingdom) forthe Swiss medical devices company Centerpulse(formerly Sulzer Medica): both companies have madean offer in the range of $3 bil l ion (“Ein schöninszeniertes Theater”, Neue Züricher Zeitung, 25 May2003).
62 The survey, carried out in January 2003, coveredabout 10,000 German companies, mainly inmanufacturing.