Embed Size (px)
Citation preview
8/7/2019 WorldBank – Guyana Rice Supply Chain Risk Assessment – May 2010
http://slidepdf.com/reader/full/worldbank-guyana-rice-supply-chain-risk-assessment-may-2010 1/40
GUYANA RICE SUPPLY CHAIN RISK ASSESSMENT
DRAFT REPORT
May, 2010
EUROPEAN COMMISSION ACP GROUP OF STATES
ALL ACP AGRICULTURAL COMMODITIES PROGRAMME
8/7/2019 WorldBank – Guyana Rice Supply Chain Risk Assessment – May 2010
http://slidepdf.com/reader/full/worldbank-guyana-rice-supply-chain-risk-assessment-may-2010 2/40
2
Table of Content: Guyana Rice Supply Chain Risk Assessment
Executive summary ……………………………………………………………………… 3
1. Background ……………………………………………………………………….. 5
2. An overview of the rice sector in Guyana……………………………………… 6
3. Structure of the rice supply chain in Guyana………………………………………. 94. Annual volatility in rice production ….. …………………………………… 13
5. Constraints in the Guyana rice supply chain……………………………………… 15
6. Major risks and capacity to manage ………………………………………. ……. 16
6.1 Production Risks …………………………………………………………………. 17
6.1.1 Flood risk ……………………………………………………………………. 17
6.1.3 Scarcity of water for irrigation ……………………………………………….. 20
6.1.2 Excess rain at harvest …………………………………………………………. 21
6.1.4 Paddy bug……………………………………………………………………. 21
6.1.5 Significant rise of red rice infestation…………………………………………… 22
6.1.6 Blast infestation ……………………………………………………………… 22
6.2 Market Risks ……………………………………………………………………… 236.2.1 Price risk ………………………………………………………………………. 23
6.2.2 Increase in input prices ………………………….……………………….. 24
6.2.5 Delayed payments ……………………………………………………………….. 24
6.2.6 Rising transportation costs……..………………………………………………. 25
6.3 Other R isks ………………………………………………………………………. 25
6.3.1 Regulatory risk ……………………………..………………………………….. 25
6.3.2 Erosion of preferential market access (CARICOM)..…………………………… 26
6.3.3 Accessibility to dam roads……………………………………………………… 26
7. Vulnerability to risks ……………………………………………………………….. 27
8. Priority measures for risk management ……………………………………………. 29
9. Final remarks ……………………………………………………………………… 31
References …………………..……………………………………………………… 32
Annex 1. Cost benefit ratio of flood risk mitigation measures in Guyana …………… 33
Annex 2. Paddy: Annual sown area, production and average yields at regional level…… 34
Annex 3. Rice supply chain risk assessment agenda ……………………………. 38
Annex 4. Farmer‟s risk perception and prioritization…………………………. …. 40
Disclaimer:
This volume is a product of the staff of the International Bank for Reconstruction and Development / The World
Bank. The findings, interpretations, and conclusions expressed in this paper do not necessarily reflect the views of
the Executive Directors of The World Bank or the governments they represent.
The World Bank does not guarantee the accuracy of the data included in this work. The boundaries, colors,denominations, and other information shown on any map in this work do not imply any judgement on the part of The World Bank concerning the legal status of any territory or the endorsement or acceptance of such boundaries.
8/7/2019 WorldBank – Guyana Rice Supply Chain Risk Assessment – May 2010
http://slidepdf.com/reader/full/worldbank-guyana-rice-supply-chain-risk-assessment-may-2010 3/40
3
Executive summary
In 2008, the rice sector contributed 3 percent of GDP; 15 percent of total exports and earned US$114 million
in foreign exchange for Guyana. The industry made major productivity gains between 1992-1995 and since
then, it has gone through several rounds of consolidation. The rice supply chain has successfully faced
internal and external shocks and is gradually becoming more competitive. Over the past 15 years, the rice
industry has diversified from almost exclusive reliance on European Union markets to a significant expansion
into CARICOM markets. The rice industry is important to Guyana‟s economy yet, it continues to exhibit
significant levels of annual volatility in acreage, production, and exports. There are limited market and other
risks and, to a large extent, the volatility could be attributed to production risks. Some of the major risks
include:
1. Flood risk: Due to persistent flood problems, many of the rice farmers are unable to sow paddy andsignificant acreage is rendered unfit for paddy cultivation. Furthermore, vast acreage of standing crops is frequently lost and farmers also regularly suffer yield loses. Flood risk emanates from threedifferent sources :
a. Excessive rainfall: The data analyzed as well as farmers‟ perceptions (based on rice sector
respondents) shows that rainfall patterns have become more unpredictable. The rainfallperiod has shortened considerably while rainfall intensity has increased. Excessive rainfallwithin very short time periods frequently generates flooding in many rice growing areas.
b. Inadequate drainage infrastructure: Existing drainage and irrigation (D&I) infrastructurewas built more than 150 years ago and was designed to accommodate 38.1mm (1.5 inches)of rainfall over a 24 hour period. In the past and in normal conditions, these structuresfunctioned adequately; however, with increase in severe rainfall events and slight rise in thesea level, the physical infrastructure is unable to cope with the increased water drainagerequirement, resulting in more frequent and severe flooding.
c. Water management: At present, flood control is managed on an emergency basis andcontrol efforts are focused on responding to immediate needs rather than the developmentof long-term control strategies. This ad-hoc system of flood control is no longer effectiveand there are limitations on the ability to manage water levels in the coastal plain and preventflooding. Furthermore, in many areas the D&I system is poorly managed and drainagesystem is clogged, blocking the flow of water and contributing to flooding.
2. Weed, pest and disease: Guyana has a well functioning rice extension system, provided through theGuyana Rice Development Board, which has effectively managed large infestations of weed, pest anddisease in the past. However, these issues continue to persist and the country looses a sizeableamount of rice production every year due to it. In addition, it has a negative impact on the quality of rice milled and exported. The two major issues are:
a. Red rice: This is essentially a weed which causes significant yield losses and price deductionsmade by the millers for poor quality. Poor seed quality, inadequate water and drainageavailability, and on-farm management practices are the major causes for red rice.
b. Paddy Bug: This pest infests rice grains and reduces quality and yield of the paddy crop.
Pesticides are widely available, yet every year a large volume of paddy is lost.3. Scarcity of water for irrigation: There is acute water scarcity in Guyana this year (2010) due to what
many describes as the El-Nino phenomenon. This has been a recurring problem in many areas anddue to limited irrigation availability, many farmers have been unable to sow or are seeing majordeclines in paddy yield. Lack of rainfall definitely contributes to the water availability; however,suboptimal management of the irrigation system is also a major contributor of this risk.
4. Risk of delayed payment: Delayed payment to the farmers by the millers, as well as non-paymentin many cases, is another risk being confronted by the rice supply chain. Cash payment on delivery of
8/7/2019 WorldBank – Guyana Rice Supply Chain Risk Assessment – May 2010
http://slidepdf.com/reader/full/worldbank-guyana-rice-supply-chain-risk-assessment-may-2010 4/40
4
paddy is very limited and payment within 3-8 weeks after the paddy delivery is a norm in the industry.The situation has worsened in the past two-three years and this creates significant cash-flow problems for the farmers and leads to the break-down of trust between farmers and millers. Inaddition, millers also face this risk and this often limits millers‟ ability to pay farmers in a timely manner.
While risk transfer and risk coping solutions might be useful for managing some risks, risk mitigationstrategies, to reduce the likelihood of the risk occurring and reduce the value of losses from adverse events,
are more relevant and important for risk management in the country. Risk mitigation measures such as
upgrading and repair of existing D&I infrastructure, improving conservancy capacity, investment in drainage
equipments (e.g. dredging equipments & pumps), improvement in water-management systems and processes,
improvement in drainage maintenance strategy, investment in capacity building of D&I staff, and investment
in weather forecasting and dissemination mechanism might be more effective in managing flood risk.
Strengthening of the agriculture extension services, improvement in farm management practices, and access
to quality and disease tolerant seed varieties are some risk mitigation measures to manage the risks of weed,
pest, and disease.
The Government of Guyana has already implemented a number of initiatives to mitigate some of the above-mentioned risks. Many of the existing initiatives need to be strengthened, and some new activities added to
ensure the comprehensive management of all the key risks facing the rice supply chain. In-depth evaluation of
the individual solutions was beyond the scope of this exercise, however, exhaustive listing of potential risk
management solutions and an assessment of cost/benefit of different options to manage these risks needs to
be undertaken by GRDB and MoA.
8/7/2019 WorldBank – Guyana Rice Supply Chain Risk Assessment – May 2010
http://slidepdf.com/reader/full/worldbank-guyana-rice-supply-chain-risk-assessment-may-2010 5/40
5
1.0 Background
At the request of the Ministry of Agriculture (MoA), Government of Guyana (GoG) and Guyana Rice
Development Board (GRDB), the World Bank conducted a rice supply chain risk assessment in Guyana. This
report is the outcome of that assessment and is intended as an advisory note to the MoA and GRDB to
enable them to identify a strategy and potential public investments to improve current risk management
practices in the rice supply chain.
This report identifies the major risks facing the rice supply chain, ranks them in terms of their potential
impact and frequency, and offers a framework for improving current risk management practices. The
recommendations and findings will provide a basis for follow-up planning work by the GoG, the World Bank
and other development partners.
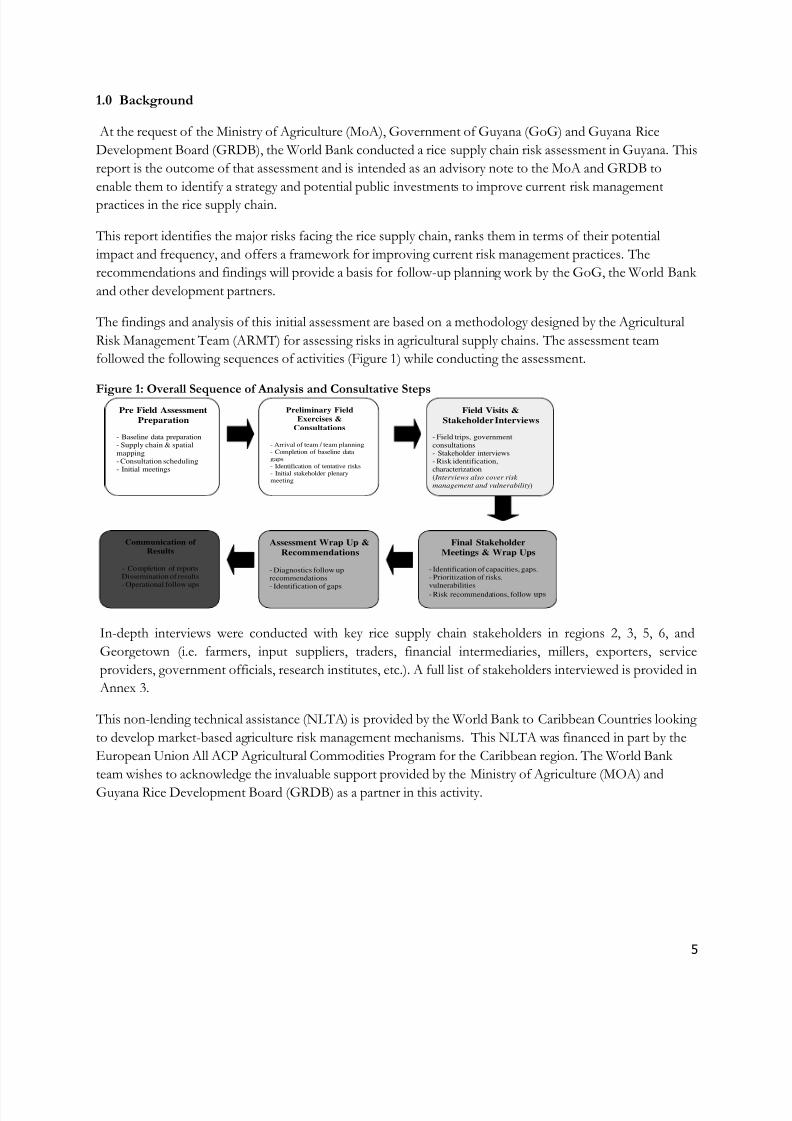
The findings and analysis of this initial assessment are based on a methodology designed by the Agricultural
Risk Management Team (ARMT) for assessing risks in agricultural supply chains. The assessment team
followed the following sequences of activities (Figure 1) while conducting the assessment.
Figure 1: Overall Sequence of Analysis and Consultative Steps
In-depth interviews were conducted with key rice supply chain stakeholders in regions 2, 3, 5, 6, and
Georgetown (i.e. farmers, input suppliers, traders, financial intermediaries, millers, exporters, service
providers, government officials, research institutes, etc.). A full list of stakeholders interviewed is provided in
Annex 3.
This non-lending technical assistance (NLTA) is provided by the World Bank to Caribbean Countries looking
to develop market-based agriculture risk management mechanisms. This NLTA was financed in part by the
European Union All ACP Agricultural Commodities Program for the Caribbean region. The World Bank
team wishes to acknowledge the invaluable support provided by the Ministry of Agriculture (MOA) and
Guyana Rice Development Board (GRDB) as a partner in this activity.
Pre Field Assessment
Preparation
- Baseline data preparation- Supply chain & spatial
mapping- Consultation scheduling- Initial meetings
Preliminary Field
Exercises &
Consultations
- Arrival of team / team planning- Completion of baseline datagaps- Identification of tentative risks- Initial stakeholder plenarymeeting
Field Visits &
Stakeholder Interviews
- Field trips, government
consultations- Stakeholder interviews- Risk identification,characterization
(Interviews also cover risk
management and vulnerability)
Final Stakeholder
Meetings & Wrap Ups
- Identification of capacities, gaps.- Prioritization of risks,vulnerabilities
- Risk recommendations, follow ups
Assessment Wrap Up &
Recommendations
- Diagnostics follow uprecommendations
- Identification of gaps
Communication of
Results
- Completion of reportsDissemination of results- Operational follow ups
8/7/2019 WorldBank – Guyana Rice Supply Chain Risk Assessment – May 2010
http://slidepdf.com/reader/full/worldbank-guyana-rice-supply-chain-risk-assessment-may-2010 6/40
6
2.0 Overview of the rice sector in Guyana
Agriculture is an important sector of Guyana‟s economy, accounting for approximately 28 percent of the totalGDP1, 40% of export earnings and 30 percent of employment in the country 2. About 400,000 acres of agricultural land is irrigated, of which about 200,000 acres is planted with rice, 130,000 acres with sugar cane,and 70,000 acres allocated to other crops and livestock 3. Sugar and rice are the most important crops in terms
of area, value of production, employment creation and contribution to export earnings. In 2008, the ricesector accounted for 12.5 percent of the agricultural GDP and 14.9 percent of national export earnings4. Riceis the major source of employment in rural areas and approximately 8,000 farmers are directly involved in ricecultivation.
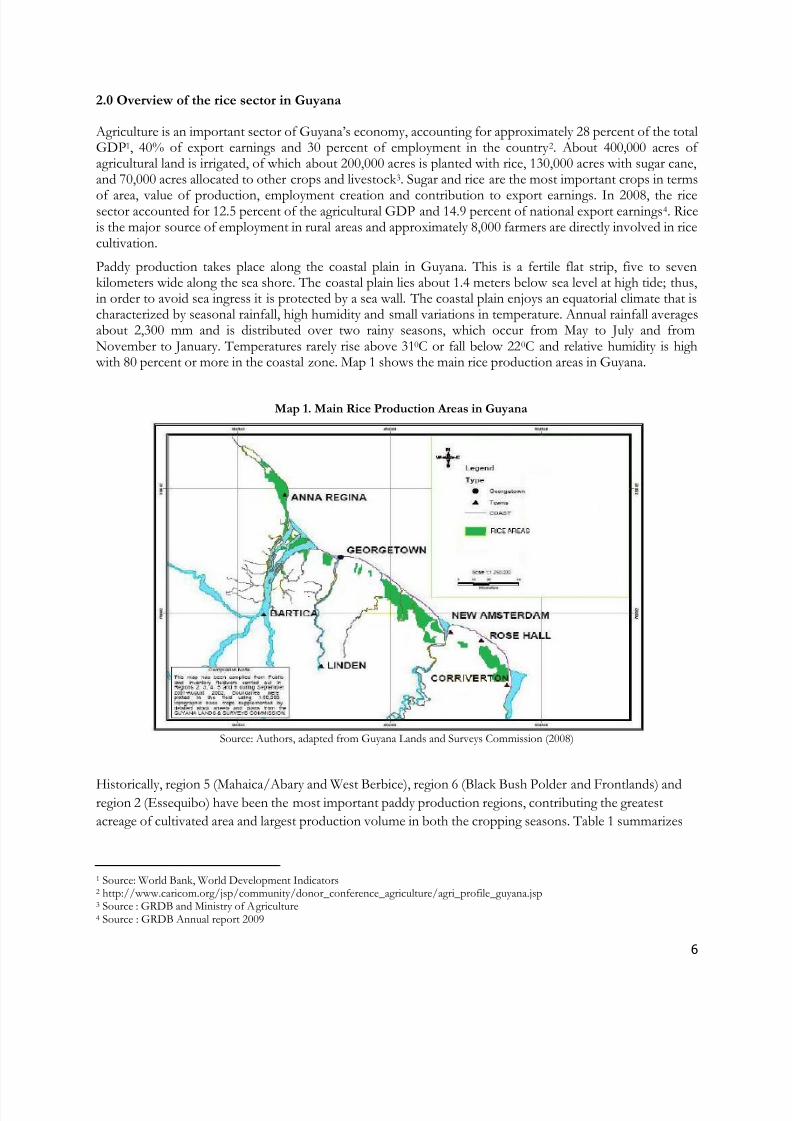
Paddy production takes place along the coastal plain in Guyana. This is a fertile flat strip, five to sevenkilometers wide along the sea shore. The coastal plain lies about 1.4 meters below sea level at high tide; thus,in order to avoid sea ingress it is protected by a sea wall. The coastal plain enjoys an equatorial climate that ischaracterized by seasonal rainfall, high humidity and small variations in temperature. Annual rainfall averagesabout 2,300 mm and is distributed over two rainy seasons, which occur from May to July and fromNovember to January. Temperatures rarely rise above 310C or fall below 220C and relative humidity is highwith 80 percent or more in the coastal zone. Map 1 shows the main rice production areas in Guyana.
Map 1. Main Rice Production Areas in Guyana
Source: Authors, adapted from Guyana Lands and Surveys Commission (2008)
Historically, region 5 (Mahaica/Abary and West Berbice), region 6 (Black Bush Polder and Frontlands) andregion 2 (Essequibo) have been the most important paddy production regions, contributing the greatest
acreage of cultivated area and largest production volume in both the cropping seasons. Table 1 summarizes
1 Source: World Bank, World Development Indicators2 http://www.caricom.org/jsp/community/donor_conference_agriculture/agri_profile_guyana.jsp3 Source : GRDB and Ministry of Agriculture4 Source : GRDB Annual report 2009
8/7/2019 WorldBank – Guyana Rice Supply Chain Risk Assessment – May 2010
http://slidepdf.com/reader/full/worldbank-guyana-rice-supply-chain-risk-assessment-may-2010 7/40
7
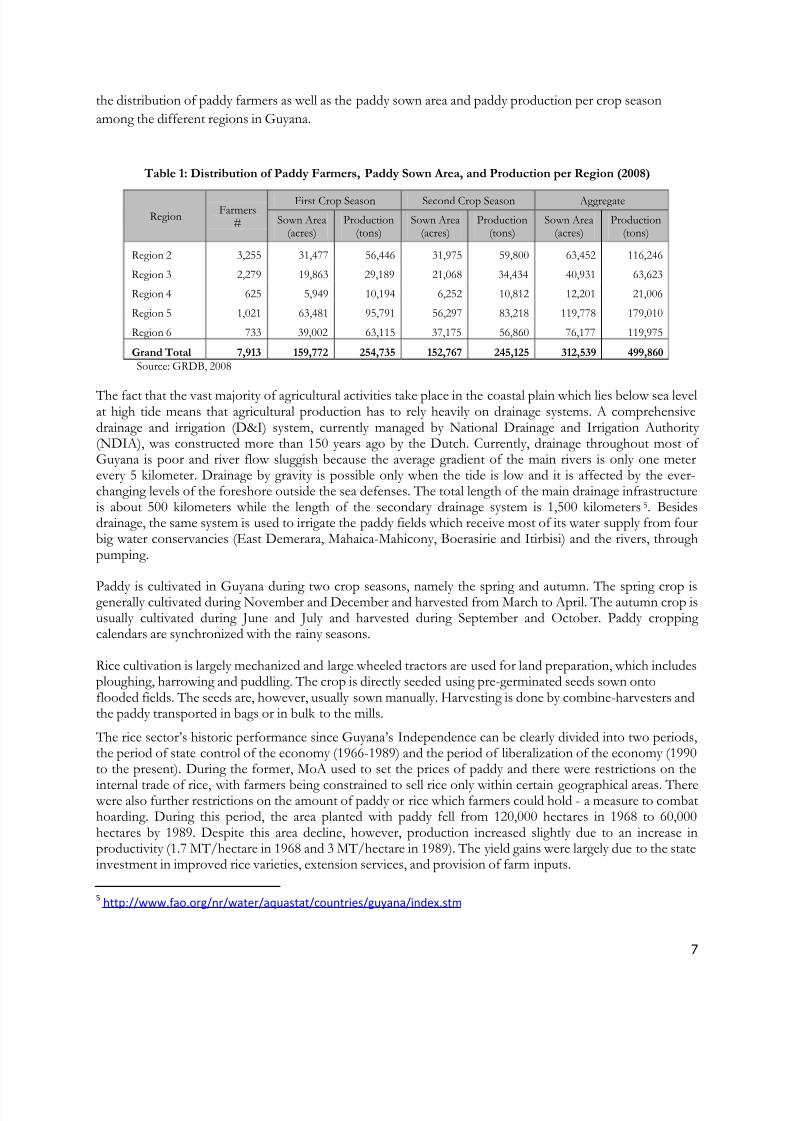
the distribution of paddy farmers as well as the paddy sown area and paddy production per crop season
among the different regions in Guyana.
Table 1: Distribution of Paddy Farmers, Paddy Sown Area, and Production per Region (2008)
RegionFarmers
#
First Crop Season Second Crop Season Aggregate
Sown Area(acres)
Production(tons)
Sown Area(acres)
Production(tons)
Sown Area(acres)
Production(tons)
Region 2 3,255 31,477 56,446 31,975 59,800 63,452 116,246
Region 3 2,279 19,863 29,189 21,068 34,434 40,931 63,623
Region 4 625 5,949 10,194 6,252 10,812 12,201 21,006
Region 5 1,021 63,481 95,791 56,297 83,218 119,778 179,010
Region 6 733 39,002 63,115 37,175 56,860 76,177 119,975
Grand Total 7,913 159,772 254,735 152,767 245,125 312,539 499,860
Source: GRDB, 2008
The fact that the vast majority of agricultural activities take place in the coastal plain which lies below sea levelat high tide means that agricultural production has to rely heavily on drainage systems. A comprehensivedrainage and irrigation (D&I) system, currently managed by National Drainage and Irrigation Authority (NDIA), was constructed more than 150 years ago by the Dutch. Currently, drainage throughout most of Guyana is poor and river flow sluggish because the average gradient of the main rivers is only one meterevery 5 kilometer. Drainage by gravity is possible only when the tide is low and it is affected by the ever-changing levels of the foreshore outside the sea defenses. The total length of the main drainage infrastructureis about 500 kilometers while the length of the secondary drainage system is 1,500 kilometers 5. Besidesdrainage, the same system is used to irrigate the paddy fields which receive most of its water supply from fourbig water conservancies (East Demerara, Mahaica-Mahicony, Boerasirie and Itirbisi) and the rivers, throughpumping.
Paddy is cultivated in Guyana during two crop seasons, namely the spring and autumn. The spring crop isgenerally cultivated during November and December and harvested from March to April. The autumn crop isusually cultivated during June and July and harvested during September and October. Paddy cropping calendars are synchronized with the rainy seasons.
Rice cultivation is largely mechanized and large wheeled tractors are used for land preparation, which includesploughing, harrowing and puddling. The crop is directly seeded using pre-germinated seeds sown ontoflooded fields. The seeds are, however, usually sown manually. Harvesting is done by combine-harvesters andthe paddy transported in bags or in bulk to the mills.
The rice sector‟s historic performance since Guyana‟s Independence can be clearly divided into two periods,the period of state control of the economy (1966-1989) and the period of liberalization of the economy (1990to the present). During the former, MoA used to set the prices of paddy and there were restrictions on the
internal trade of rice, with farmers being constrained to sell rice only within certain geographical areas. Therewere also further restrictions on the amount of paddy or rice which farmers could hold - a measure to combathoarding. During this period, the area planted with paddy fell from 120,000 hectares in 1968 to 60,000hectares by 1989. Despite this area decline, however, production increased slightly due to an increase inproductivity (1.7 MT/hectare in 1968 and 3 MT/hectare in 1989). The yield gains were largely due to the stateinvestment in improved rice varieties, extension services, and provision of farm inputs.
5 http://www.fao.org/nr/water/aquastat/countries/guyana/index.stm
8/7/2019 WorldBank – Guyana Rice Supply Chain Risk Assessment – May 2010
http://slidepdf.com/reader/full/worldbank-guyana-rice-supply-chain-risk-assessment-may-2010 8/40
8
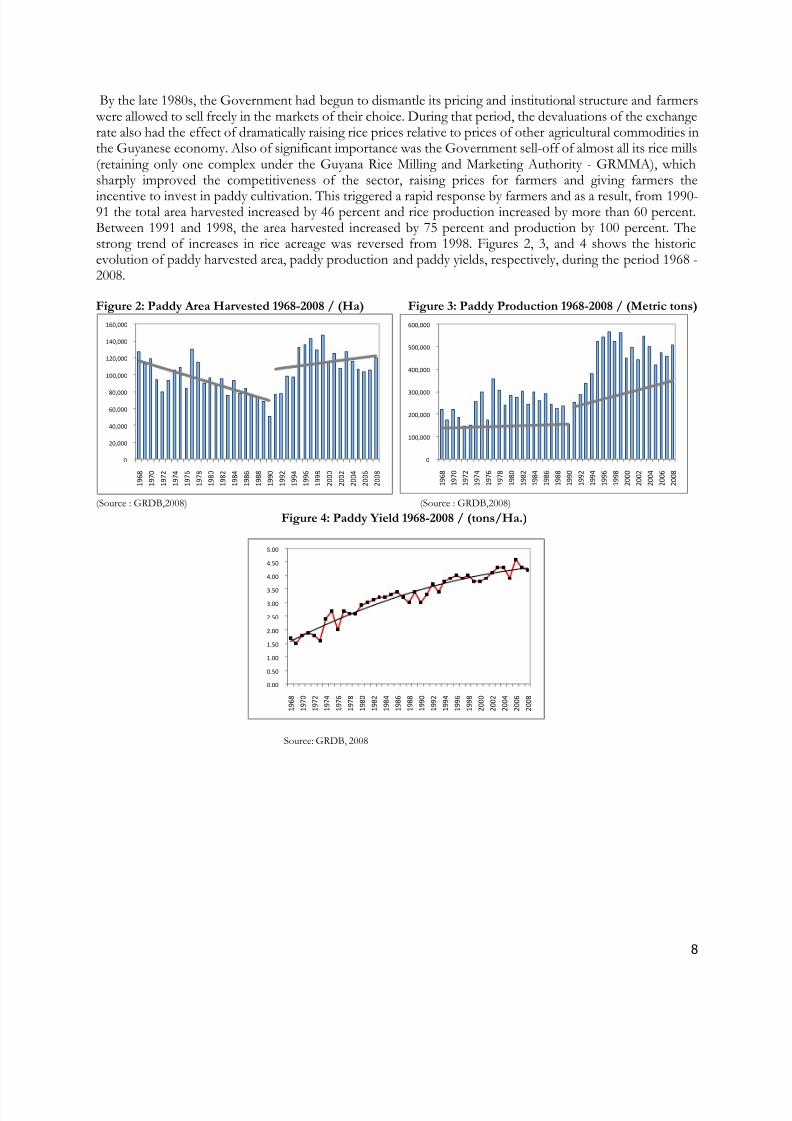
By the late 1980s, the Government had begun to dismantle its pricing and institutional structure and farmerswere allowed to sell freely in the markets of their choice. During that period, the devaluations of the exchangerate also had the effect of dramatically raising rice prices relative to prices of other agricultural commodities inthe Guyanese economy. Also of significant importance was the Government sell-off of almost all its rice mills(retaining only one complex under the Guyana Rice Milling and Marketing Authority - GRMMA), whichsharply improved the competitiveness of the sector, raising prices for farmers and giving farmers the
incentive to invest in paddy cultivation. This triggered a rapid response by farmers and as a result, from 1990-91 the total area harvested increased by 46 percent and rice production increased by more than 60 percent.Between 1991 and 1998, the area harvested increased by 75 percent and production by 100 percent. Thestrong trend of increases in rice acreage was reversed from 1998. Figures 2, 3, and 4 shows the historicevolution of paddy harvested area, paddy production and paddy yields, respectively, during the period 1968 -2008.
Figure 2: Paddy Area Harvested 1968-2008 / (Ha) Figure 3: Paddy Production 1968-2008 / (Metric tons)
(Source : GRDB,2008) (Source : GRDB,2008)
Figure 4: Paddy Yield 1968-2008 / (tons/Ha.)
Source: GRDB, 2008
0
20,000
40,000
60,000
80,000
100,000
120,000
140,000
160,000
1968
1970
1972
1974
1976
1978
1980
1982
1984
1986
1988
1990
1992
1994
1996
1998
2000
2002
2004
2006
2008
0
100,000
200,000
300,000
400,000
500,000
600,000
1968
1970
1972
1974
1976
1978
1980
1982
1984
1986
1988
1990
1992
1994
1996
1998
2000
2002
2004
2006
2008
0.00
0.50
1.00
1.50
2.00
2.50
3.00
3.50
4.00
4.50
5.00
1968
1970
1972
1974
1976
1978
1980
1982
1984
1986
1988
1990
1992
1994
1996
1998
2000
2002
2004
2006
2008
8/7/2019 WorldBank – Guyana Rice Supply Chain Risk Assessment – May 2010
http://slidepdf.com/reader/full/worldbank-guyana-rice-supply-chain-risk-assessment-may-2010 9/40
9
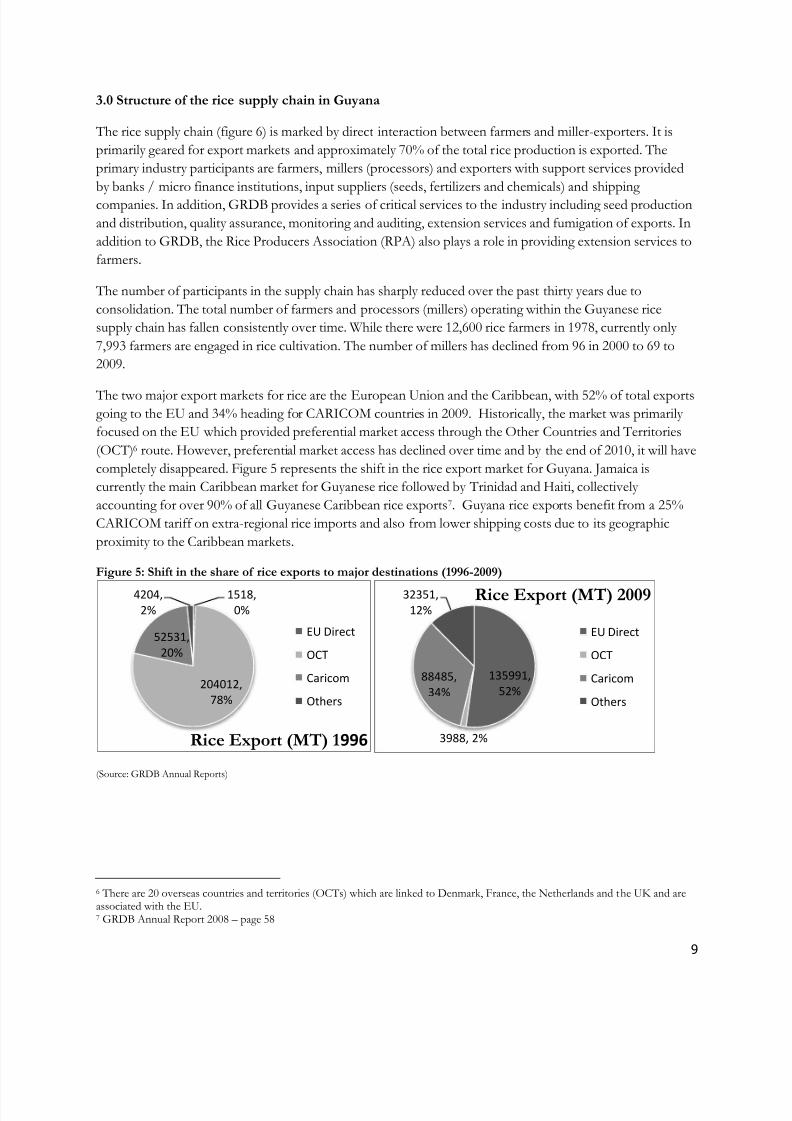
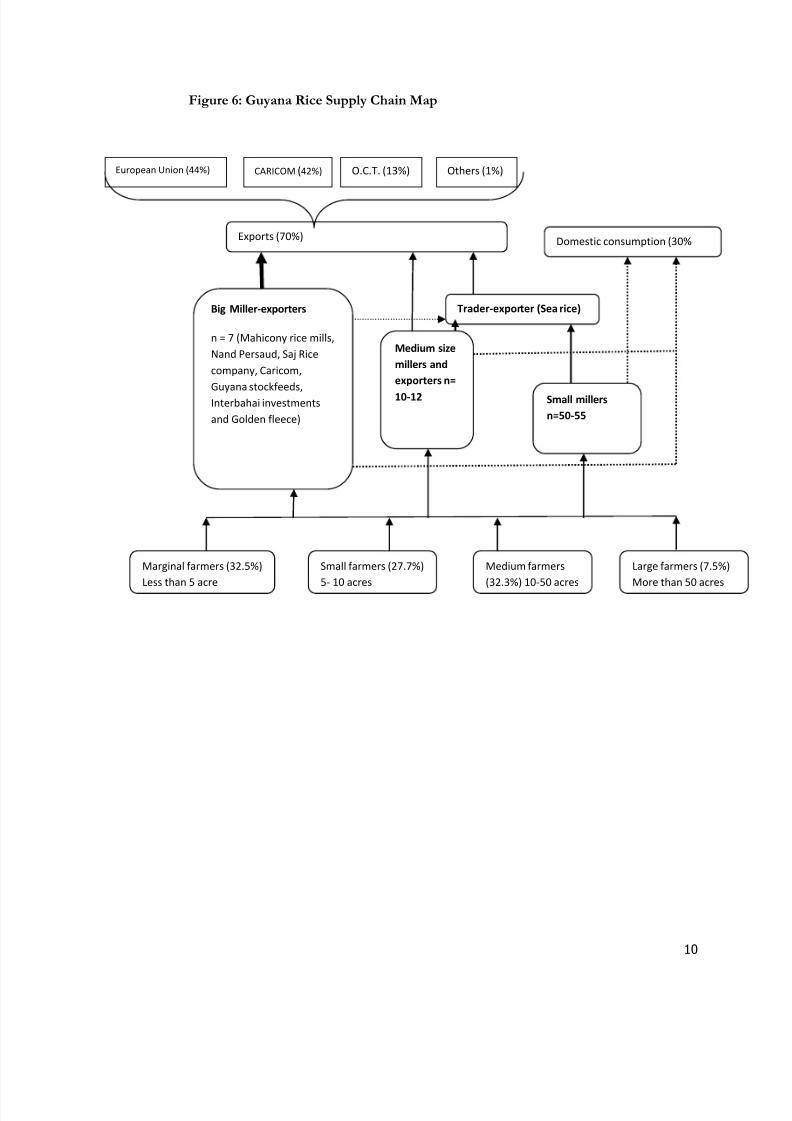
3.0 Structure of the rice supply chain in Guyana
The rice supply chain (figure 6) is marked by direct interaction between farmers and miller-exporters. It is
primarily geared for export markets and approximately 70% of the total rice production is exported. The
primary industry participants are farmers, millers (processors) and exporters with support services provided
by banks / micro finance institutions, input suppliers (seeds, fertilizers and chemicals) and shipping
companies. In addition, GRDB provides a series of critical services to the industry including seed production
and distribution, quality assurance, monitoring and auditing, extension services and fumigation of exports. In
addition to GRDB, the Rice Producers Association (RPA) also plays a role in providing extension services to
farmers.
The number of participants in the supply chain has sharply reduced over the past thirty years due to
consolidation. The total number of farmers and processors (millers) operating within the Guyanese rice
supply chain has fallen consistently over time. While there were 12,600 rice farmers in 1978, currently only
7,993 farmers are engaged in rice cultivation. The number of millers has declined from 96 in 2000 to 69 to
2009.
The two major export markets for rice are the European Union and the Caribbean, with 52% of total exportsgoing to the EU and 34% heading for CARICOM countries in 2009. Historically, the market was primarily
focused on the EU which provided preferential market access through the Other Countries and Territories
(OCT)6 route. However, preferential market access has declined over time and by the end of 2010, it will have
completely disappeared. Figure 5 represents the shift in the rice export market for Guyana. Jamaica is
currently the main Caribbean market for Guyanese rice followed by Trinidad and Haiti, collectively
accounting for over 90% of all Guyanese Caribbean rice exports7. Guyana rice exports benefit from a 25%
CARICOM tariff on extra-regional rice imports and also from lower shipping costs due to its geographic
proximity to the Caribbean markets.
Figure 5: Shift in the share of rice exports to major destinations (1996-2009)
(Source: GRDB Annual Reports)
6 There are 20 overseas countries and territories (OCTs) which are linked to Denmark, France, the Netherlands and the UK and areassociated with the EU.7 GRDB Annual Report 2008 – page 58
1518,
0%
204012,
78%
52531,
20%
4204,
2%
Rice Export (MT) 1996
EU Direct
OCT
Caricom
Others
135991,
52%
3988, 2%
88485,
34%
32351,
12%Rice Export (MT) 2009
EU Direct
OCT
Caricom
Others
8/7/2019 WorldBank – Guyana Rice Supply Chain Risk Assessment – May 2010
http://slidepdf.com/reader/full/worldbank-guyana-rice-supply-chain-risk-assessment-may-2010 10/40
10
Figure 6: Guyana Rice Supply Chain Map
Marginal farmers (32.5%)
Less than 5 acre
Small farmers (27.7%)
5- 10 acres
Large farmers (7.5%)
More than 50 acres
Big Miller-exporters
n = 7 (Mahicony rice mills,
Nand Persaud, Saj Rice
company, Caricom,
Guyana stockfeeds,
Interbahai investments
and Golden fleece)
Small millers
n=50-55
Medium size
millers and
exporters n=
10-12
Medium farmers
(32.3%) 10-50 acres
European Union (44%) CARICOM (42%) O.C.T. (13%) Others (1%)
Exports (70%) Domestic consumption (30%
Trader-exporter (Sea rice)
8/7/2019 WorldBank – Guyana Rice Supply Chain Risk Assessment – May 2010
http://slidepdf.com/reader/full/worldbank-guyana-rice-supply-chain-risk-assessment-may-2010 11/40
11
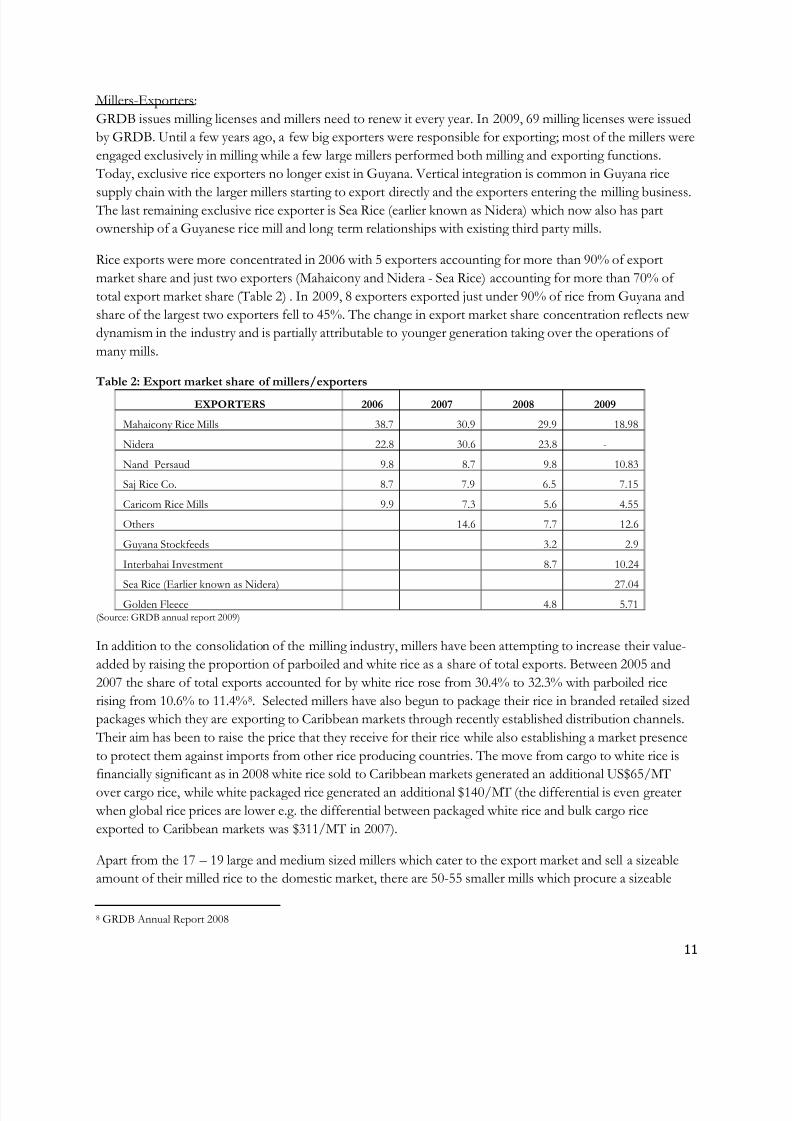
Millers-Exporters:
GRDB issues milling licenses and millers need to renew it every year. In 2009, 69 milling licenses were issued
by GRDB. Until a few years ago, a few big exporters were responsible for exporting; most of the millers were
engaged exclusively in milling while a few large millers performed both milling and exporting functions.
Today, exclusive rice exporters no longer exist in Guyana. Vertical integration is common in Guyana rice
supply chain with the larger millers starting to export directly and the exporters entering the milling business.The last remaining exclusive rice exporter is Sea Rice (earlier known as Nidera) which now also has part
ownership of a Guyanese rice mill and long term relationships with existing third party mills.
Rice exports were more concentrated in 2006 with 5 exporters accounting for more than 90% of export
market share and just two exporters (Mahaicony and Nidera - Sea Rice) accounting for more than 70% of
total export market share (Table 2) . In 2009, 8 exporters exported just under 90% of rice from Guyana and
share of the largest two exporters fell to 45%. The change in export market share concentration reflects new
dynamism in the industry and is partially attributable to younger generation taking over the operations of
many mills.
Table 2: Export market share of millers/exporters
EXPORTERS 2006 2007 2008 2009
Mahaicony Rice Mills 38.7 30.9 29.9 18.98
Nidera 22.8 30.6 23.8 -
Nand Persaud 9.8 8.7 9.8 10.83
Saj Rice Co. 8.7 7.9 6.5 7.15
Caricom Rice Mills 9.9 7.3 5.6 4.55
Others 14.6 7.7 12.6
Guyana Stockfeeds 3.2 2.9
Interbahai Investment 8.7 10.24
Sea Rice (Earlier known as Nidera) 27.04Golden Fleece 4.8 5.71
(Source: GRDB annual report 2009)
In addition to the consolidation of the milling industry, millers have been attempting to increase their value-
added by raising the proportion of parboiled and white rice as a share of total exports. Between 2005 and
2007 the share of total exports accounted for by white rice rose from 30.4% to 32.3% with parboiled rice
rising from 10.6% to 11.4%8. Selected millers have also begun to package their rice in branded retailed sized
packages which they are exporting to Caribbean markets through recently established distribution channels.
Their aim has been to raise the price that they receive for their rice while also establishing a market presence
to protect them against imports from other rice producing countries. The move from cargo to white rice is
financially significant as in 2008 white rice sold to Caribbean markets generated an additional US$65/MT
over cargo rice, while white packaged rice generated an additional $140/MT (the differential is even greater
when global rice prices are lower e.g. the differential between packaged white rice and bulk cargo rice
exported to Caribbean markets was $311/MT in 2007).
Apart from the 17 – 19 large and medium sized millers which cater to the export market and sell a sizeable
amount of their milled rice to the domestic market, there are 50-55 smaller mills which procure a sizeable
8 GRDB Annual Report 2008
8/7/2019 WorldBank – Guyana Rice Supply Chain Risk Assessment – May 2010
http://slidepdf.com/reader/full/worldbank-guyana-rice-supply-chain-risk-assessment-may-2010 12/40
12
amount of rice from the farmers. The bulk of the production of medium and small sized millers is exported
by Sea Rice. These smaller millers also sell in the domestic market and some of them provide a fee-based
service to farmers for processing their rice.
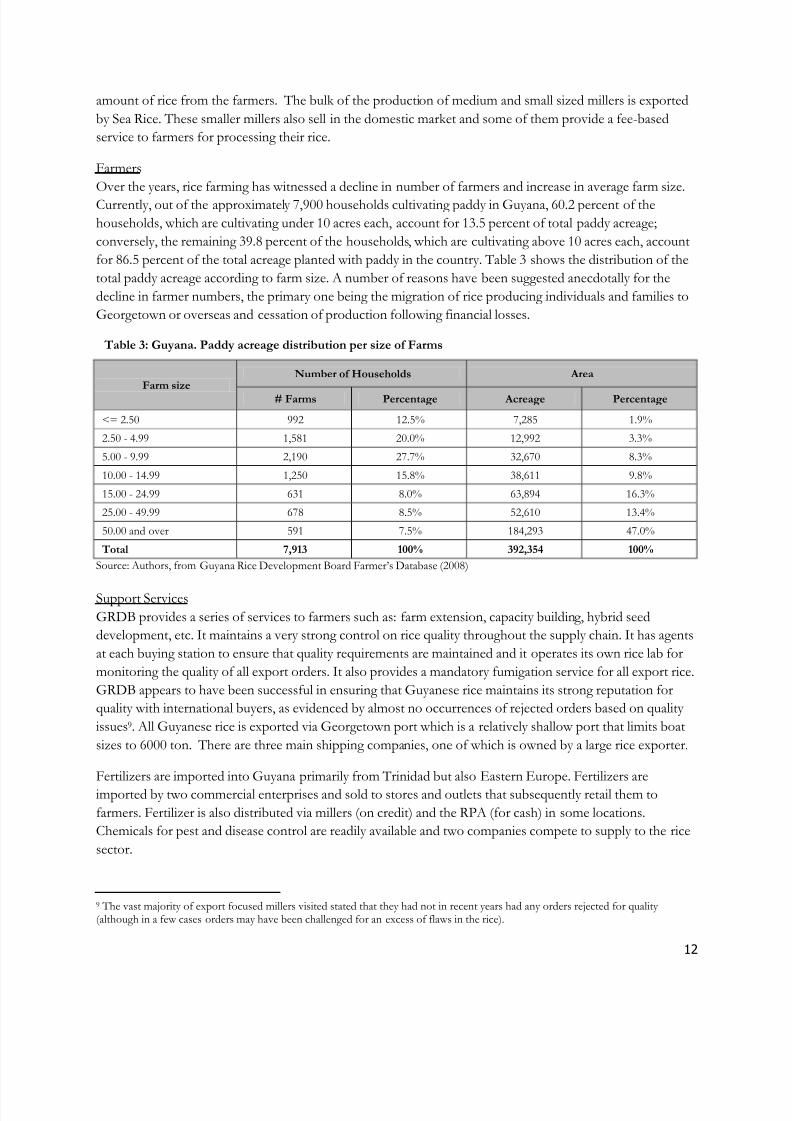
Farmers
Over the years, rice farming has witnessed a decline in number of farmers and increase in average farm size.
Currently, out of the approximately 7,900 households cultivating paddy in Guyana, 60.2 percent of the
households, which are cultivating under 10 acres each, account for 13.5 percent of total paddy acreage;
conversely, the remaining 39.8 percent of the households, which are cultivating above 10 acres each, account
for 86.5 percent of the total acreage planted with paddy in the country. Table 3 shows the distribution of the
total paddy acreage according to farm size. A number of reasons have been suggested anecdotally for the
decline in farmer numbers, the primary one being the migration of rice producing individuals and families to
Georgetown or overseas and cessation of production following financial losses.
Table 3: Guyana. Paddy acreage distribution per size of Farms
Farm sizeNumber of Households Area
# Farms Percentage Acreage Percentage
<= 2.50 992 12.5% 7,285 1.9%
2.50 - 4.99 1,581 20.0% 12,992 3.3%
5.00 - 9.99 2,190 27.7% 32,670 8.3%
10.00 - 14.99 1,250 15.8% 38,611 9.8%
15.00 - 24.99 631 8.0% 63,894 16.3%
25.00 - 49.99 678 8.5% 52,610 13.4%
50.00 and over 591 7.5% 184,293 47.0%
Total 7,913 100% 392,354 100%
Source: Authors, from Guyana Rice Development Board Farmer‟s Database (2008)
Support Services
GRDB provides a series of services to farmers such as: farm extension, capacity building, hybrid seed
development, etc. It maintains a very strong control on rice quality throughout the supply chain. It has agents
at each buying station to ensure that quality requirements are maintained and it operates its own rice lab for
monitoring the quality of all export orders. It also provides a mandatory fumigation service for all export rice.
GRDB appears to have been successful in ensuring that Guyanese rice maintains its strong reputation for
quality with international buyers, as evidenced by almost no occurrences of rejected orders based on quality
issues9. All Guyanese rice is exported via Georgetown port which is a relatively shallow port that limits boat
sizes to 6000 ton. There are three main shipping companies, one of which is owned by a large rice exporter.
Fertilizers are imported into Guyana primarily from Trinidad but also Eastern Europe. Fertilizers are
imported by two commercial enterprises and sold to stores and outlets that subsequently retail them to
farmers. Fertilizer is also distributed via millers (on credit) and the RPA (for cash) in some locations.
Chemicals for pest and disease control are readily available and two companies compete to supply to the rice
sector.
9 The vast majority of export focused millers visited stated that they had not in recent years had any orders rejected for quality (although in a few cases orders may have been challenged for an excess of flaws in the rice).
8/7/2019 WorldBank – Guyana Rice Supply Chain Risk Assessment – May 2010
http://slidepdf.com/reader/full/worldbank-guyana-rice-supply-chain-risk-assessment-may-2010 13/40
13
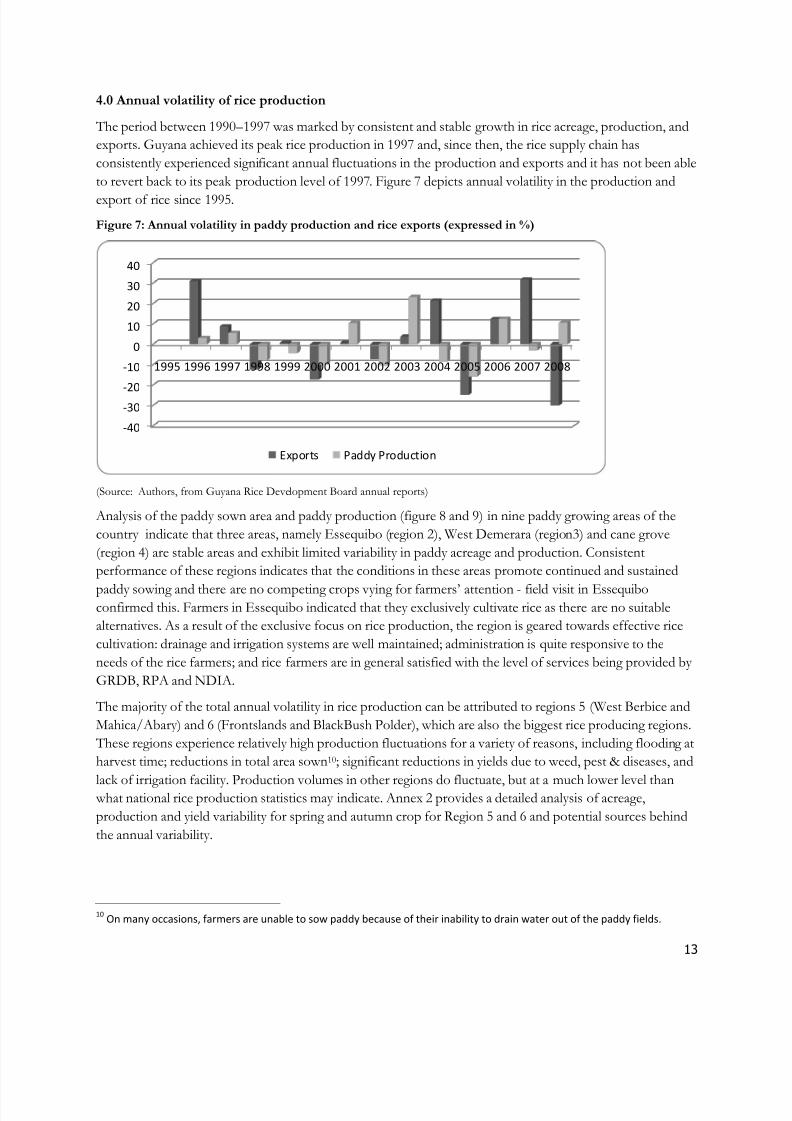
4.0 Annual volatility of rice production
The period between 1990– 1997 was marked by consistent and stable growth in rice acreage, production, and
exports. Guyana achieved its peak rice production in 1997 and, since then, the rice supply chain has
consistently experienced significant annual fluctuations in the production and exports and it has not been able
to revert back to its peak production level of 1997. Figure 7 depicts annual volatility in the production and
export of rice since 1995.
Figure 7: Annual volatility in paddy production and rice exports (expressed in %)
(Source: Authors, from Guyana Rice Development Board annual reports)
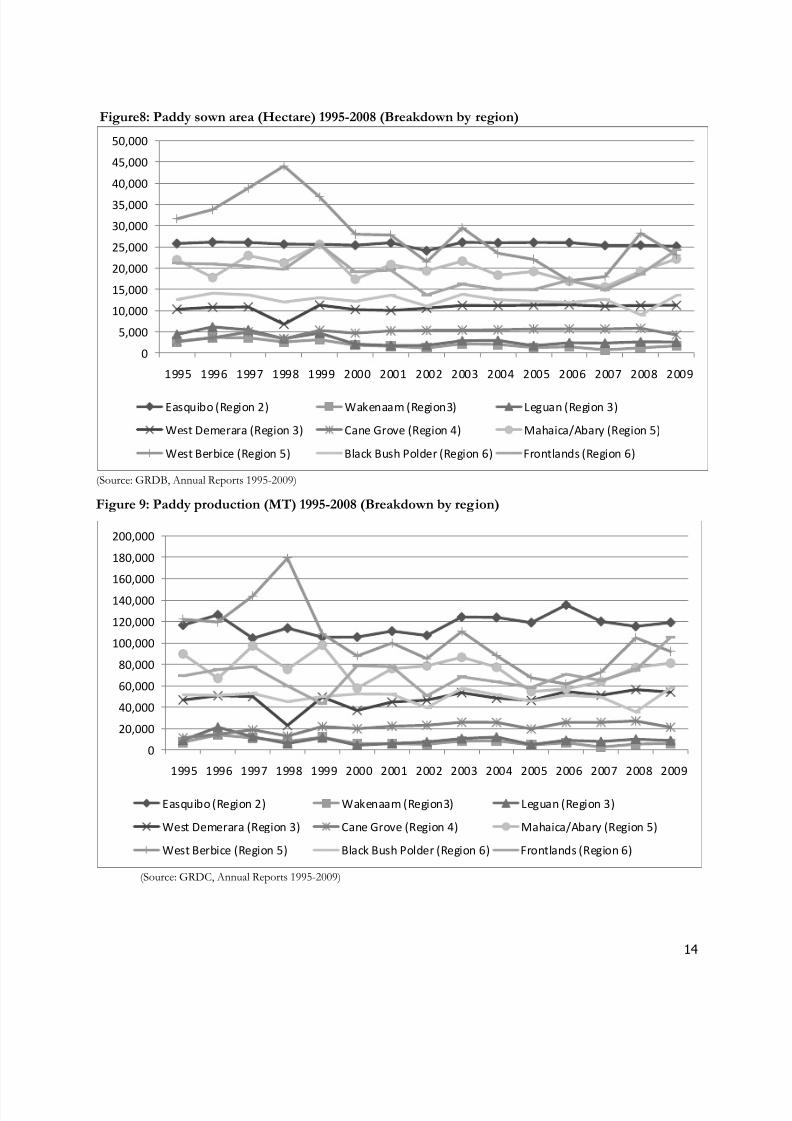
Analysis of the paddy sown area and paddy production (figure 8 and 9) in nine paddy growing areas of the
country indicate that three areas, namely Essequibo (region 2), West Demerara (region3) and cane grove
(region 4) are stable areas and exhibit limited variability in paddy acreage and production. Consistent
performance of these regions indicates that the conditions in these areas promote continued and sustained
paddy sowing and there are no competing crops vying for farmers‟ attention - field visit in Essequiboconfirmed this. Farmers in Essequibo indicated that they exclusively cultivate rice as there are no suitable
alternatives. As a result of the exclusive focus on rice production, the region is geared towards effective rice
cultivation: drainage and irrigation systems are well maintained; administration is quite responsive to the
needs of the rice farmers; and rice farmers are in general satisfied with the level of services being provided by
GRDB, RPA and NDIA.
The majority of the total annual volatility in rice production can be attributed to regions 5 (West Berbice and
Mahica/Abary) and 6 (Frontslands and BlackBush Polder), which are also the biggest rice producing regions.
These regions experience relatively high production fluctuations for a variety of reasons, including flooding at
harvest time; reductions in total area sown10; significant reductions in yields due to weed, pest & diseases, and
lack of irrigation facility. Production volumes in other regions do fluctuate, but at a much lower level thanwhat national rice production statistics may indicate. Annex 2 provides a detailed analysis of acreage,
production and yield variability for spring and autumn crop for Region 5 and 6 and potential sources behind
the annual variability.
10On many occasions, farmers are unable to sow paddy because of their inability to drain water out of the paddy fields.
-40
-30-20
-10
0
10
20
30
40
1995 1996 1997 1998 1999 2000 2001 2002 2003 2004 2005 2006 2007 2008
Exports Paddy Production
8/7/2019 WorldBank – Guyana Rice Supply Chain Risk Assessment – May 2010
http://slidepdf.com/reader/full/worldbank-guyana-rice-supply-chain-risk-assessment-may-2010 14/40
14
Figure8: Paddy sown area (Hectare) 1995-2008 (Breakdown by region)
(Source: GRDB, Annual Reports 1995-2009)
Figure 9: Paddy production (MT) 1995-2008 (Breakdown by region)
(Source: GRDC, Annual Reports 1995-2009)
0
5,000
10,000
15,000
20,000
25,000
30,000
35,000
40,000
45,000
50,000
1995 1996 1997 1998 1999 2000 2001 2002 2003 2004 2005 2006 2007 2008 2009
Easquibo (Region 2) Wakenaam (Region3) Leguan (Region 3)
West Demerara (Region 3) Cane Grove (Region 4) Mahaica/Abary (Region 5)
West Berbice (Region 5) Black Bush Polder (Region 6) Frontlands (Region 6)
0
20,000
40,000
60,000
80,000
100,000
120,000
140,000
160,000
180,000
200,000
1995 1996 1997 1998 1999 2000 2001 2002 2003 2004 2005 2006 2007 2008 2009
Easquibo (Region 2) Wakenaam (Region3) Leguan (Region 3)
West Demerara (Region 3) Cane Grove (Region 4) Mahaica/Abary (Region 5)
West Berbice (Region 5) Black Bush Polder (Region 6) Frontlands (Region 6)
8/7/2019 WorldBank – Guyana Rice Supply Chain Risk Assessment – May 2010
http://slidepdf.com/reader/full/worldbank-guyana-rice-supply-chain-risk-assessment-may-2010 15/40
15
5.0 Constraints in the Guyana rice supply chain
Though this report focuses upon the major risks facing the rice supply chain in Guyana, it is also important to
acknowledge the significant constraints which affect the day to day operations of the rice supply chain.
Besides reducing the efficiency of the rice sector, some of the constraints may themselves exacerbate the risks
facing the supply chain. Two major constraints facing the rice sector in Guyana are:
Access to finance
Farmers: Total lending to the rice sector declined from G $11.6 billion in 2000 to G$3.4 billion in 2008.
Frequent flooding, bankruptcy of millers, and default by big farmers were cited as the main reasons behind
this decline. Lending by commercial banks to the rice farmers in Guyana fell from G$5.7 billion in 2000 to
G$1.7 billion in 200811. Mainly larger farmers are able to access loans from commercial banks and bank
lending to small farmers is very limited. Farmers requiring credit either for seasonal inputs or for longer term
farm investments tend to borrow, if at all, from alternative credit providers (rice millers, input suppliers,
equipment suppliers and microfinance institutions). Both the commercial banks and the alternative credit
suppliers charge relatively high rates of interest to their borrowers. The commercial bank facilities providedto processors and exporters currently sit at around 14%12 per annum, while the microfinance rates for farmers
average around 21%13. The high costs of finance reduce the profitability of supply chain participants and
reduce investment within the sector.
Millers and exporters: Lending to the rice millers declined from G$5.9 billion in 2000 to G$1.7 billion in
200814. Most of the rice millers visited during the mission reported difficulties in accessing sufficient finance
from local banks, both long term finance for investment purposes and short term finance for seasonal buying
/ trade finance purposes. This constraint has grown in severity with the recent doubling of paddy prices not
being matched by an equivalent rise in banking facilities15 (a doubling of paddy prices doubles the working
capital requirements of millers). This constraint is currently being managed by millers by either securing funds
from other sources or more commonly by delaying payments to producers (farmers) until payment has beenreceived from buyers, directly increasing the risk of late payment / default between farmers and millers.
High(er) shipping costs
Bulk of the rice exports and imports (fertilizers and chemicals) takes place through Georgetown port which is
a relatively shallow port and limited to a maximum cargo boat size of 6,000 tons. Such boats are relatively
small in global shipping terms and hence shipping costs per unit (for both exports and imports) are relatively
high when compared to other countries that can access larger ships. Higher shipping costs raises the cost of
inputs and the cost of exportation (export orders are based on “Cost and Freight” – C and F). In addition, it
was suggested that the relative scarcity of smaller cargo boats further aggravates the problem.
11 Source: Presentation by the Chairman of the Guyana Association of Bankers Mr. John Tracey at the Symposium on Agricultural
risk and insurance, December 7, 2009.12 Source: various discussions with commercial banks and rice processors / exporters13 Source: discussions with IPED – interest and fees14 Source: Presentation by the Chairman of the Guyana Association of Bankers Mr. John Tracey at the Symposium on Agriculturalrisk and insurance, December 7, 2009.15 Bank of Guyana – Banking System Statistical Abstract December 2009
8/7/2019 WorldBank – Guyana Rice Supply Chain Risk Assessment – May 2010
http://slidepdf.com/reader/full/worldbank-guyana-rice-supply-chain-risk-assessment-may-2010 16/40
16
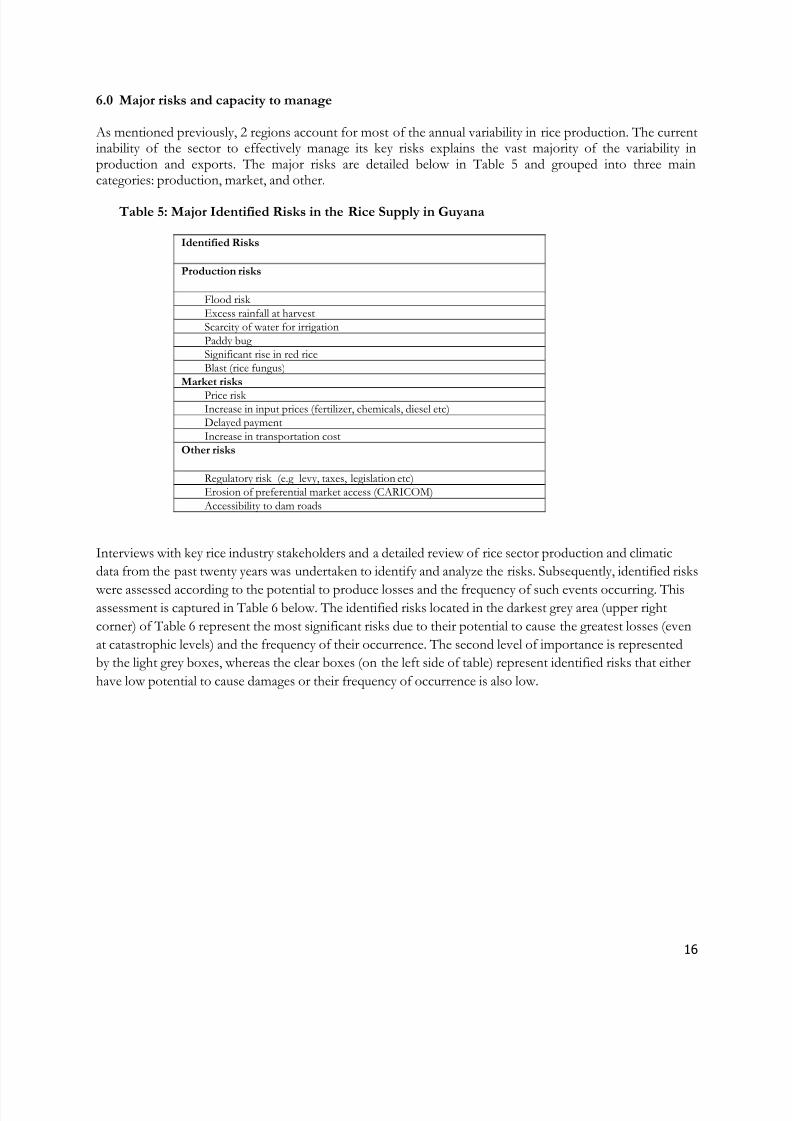
6.0 Major risks and capacity to manage
As mentioned previously, 2 regions account for most of the annual variability in rice production. The currentinability of the sector to effectively manage its key risks explains the vast majority of the variability inproduction and exports. The major risks are detailed below in Table 5 and grouped into three maincategories: production, market, and other.
Table 5: Major Identified Risks in the Rice Supply in Guyana
Identified Risks
Production risks
Flood risk Excess rainfall at harvestScarcity of water for irrigationPaddy bug Significant rise in red riceBlast (rice fungus)
Market risks
Price risk Increase in input prices (fertilizer, chemicals, diesel etc)Delayed paymentIncrease in transportation cost
Other risks
Regulatory risk (e.g levy, taxes, legislation etc)Erosion of preferential market access (CARICOM)Accessibility to dam roads
Interviews with key rice industry stakeholders and a detailed review of rice sector production and climatic
data from the past twenty years was undertaken to identify and analyze the risks. Subsequently, identified risks
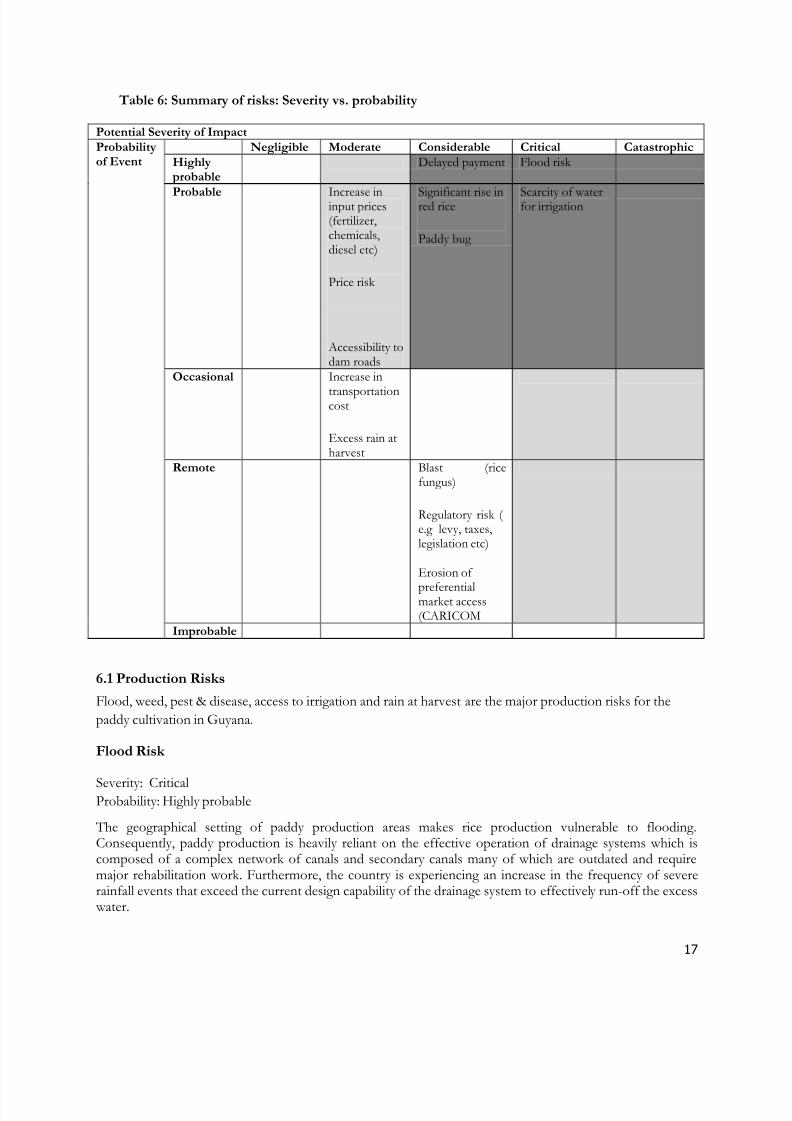
were assessed according to the potential to produce losses and the frequency of such events occurring. Thisassessment is captured in Table 6 below. The identified risks located in the darkest grey area (upper right
corner) of Table 6 represent the most significant risks due to their potential to cause the greatest losses (even
at catastrophic levels) and the frequency of their occurrence. The second level of importance is represented
by the light grey boxes, whereas the clear boxes (on the left side of table) represent identified risks that either
have low potential to cause damages or their frequency of occurrence is also low.
8/7/2019 WorldBank – Guyana Rice Supply Chain Risk Assessment – May 2010
http://slidepdf.com/reader/full/worldbank-guyana-rice-supply-chain-risk-assessment-may-2010 17/40
17
Table 6: Summary of risks: Severity vs. probability
Potential Severity of Impact Probabilityof Event
Negligible Moderate Considerable Critical Catastrophic Highlyprobable
Delayed payment Flood risk
Probable Increase ininput prices(fertilizer,chemicals,diesel etc)
Price risk
Accessibility todam roads
Significant rise inred rice
Paddy bug
Scarcity of waterfor irrigation
Occasional Increase in
transportationcost
Excess rain atharvest
Remote Blast (ricefungus)
Regulatory risk ( e.g levy, taxes,legislation etc)
Erosion of
preferentialmarket access(CARICOM
Improbable
6.1 Production Risks
Flood, weed, pest & disease, access to irrigation and rain at harvest are the major production risks for the
paddy cultivation in Guyana.
Flood Risk
Severity: CriticalProbability: Highly probable
The geographical setting of paddy production areas makes rice production vulnerable to flooding. Consequently, paddy production is heavily reliant on the effective operation of drainage systems which iscomposed of a complex network of canals and secondary canals many of which are outdated and requiremajor rehabilitation work. Furthermore, the country is experiencing an increase in the frequency of severerainfall events that exceed the current design capability of the drainage system to effectively run-off the excesswater.
8/7/2019 WorldBank – Guyana Rice Supply Chain Risk Assessment – May 2010
http://slidepdf.com/reader/full/worldbank-guyana-rice-supply-chain-risk-assessment-may-2010 18/40
18
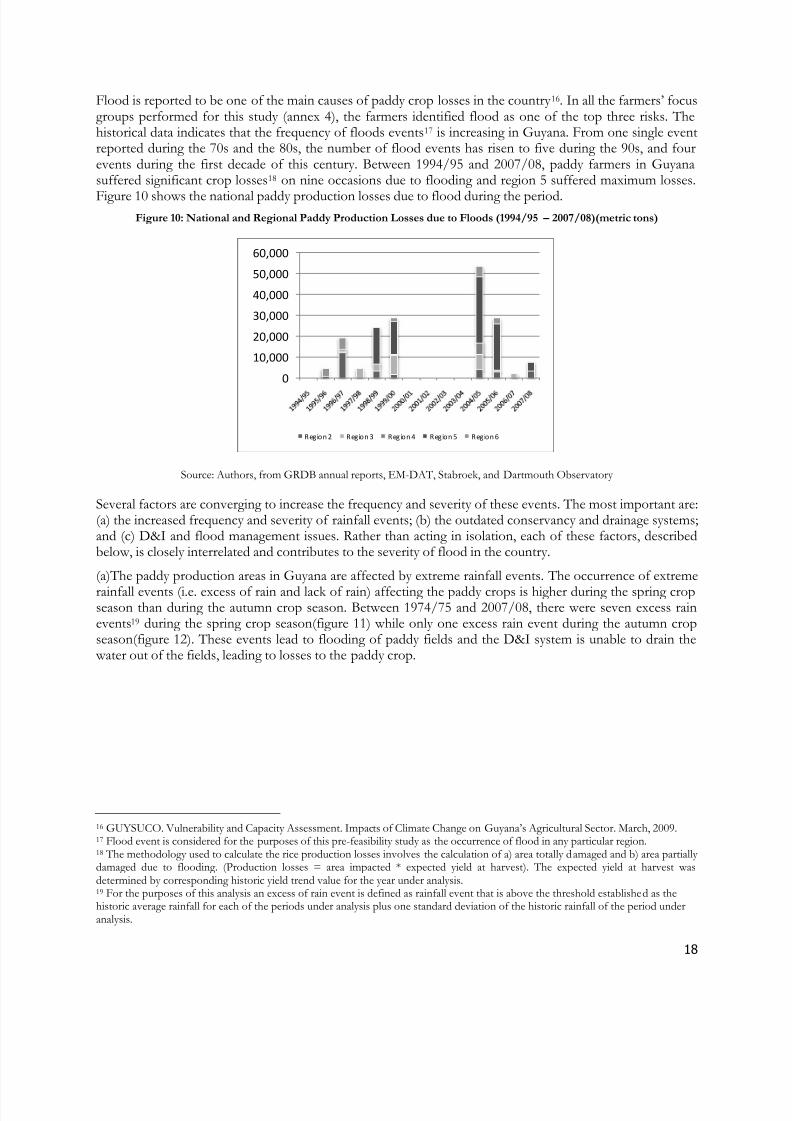
Flood is reported to be one of the main causes of paddy crop losses in the country 16. In all the farmers‟ focusgroups performed for this study (annex 4), the farmers identified flood as one of the top three risks. Thehistorical data indicates that the frequency of floods events17 is increasing in Guyana. From one single eventreported during the 70s and the 80s, the number of flood events has risen to five during the 90s, and fourevents during the first decade of this century. Between 1994/95 and 2007/08, paddy farmers in Guyanasuffered significant crop losses18 on nine occasions due to flooding and region 5 suffered maximum losses.
Figure 10 shows the national paddy production losses due to flood during the period.Figure 10: National and Regional Paddy Production Losses due to Floods (1994/95 – 2007/08)(metric tons)
Source: Authors, from GRDB annual reports, EM-DAT, Stabroek, and Dartmouth Observatory
Several factors are converging to increase the frequency and severity of these events. The most important are:(a) the increased frequency and severity of rainfall events; (b) the outdated conservancy and drainage systems;and (c) D&I and flood management issues. Rather than acting in isolation, each of these factors, describedbelow, is closely interrelated and contributes to the severity of flood in the country.
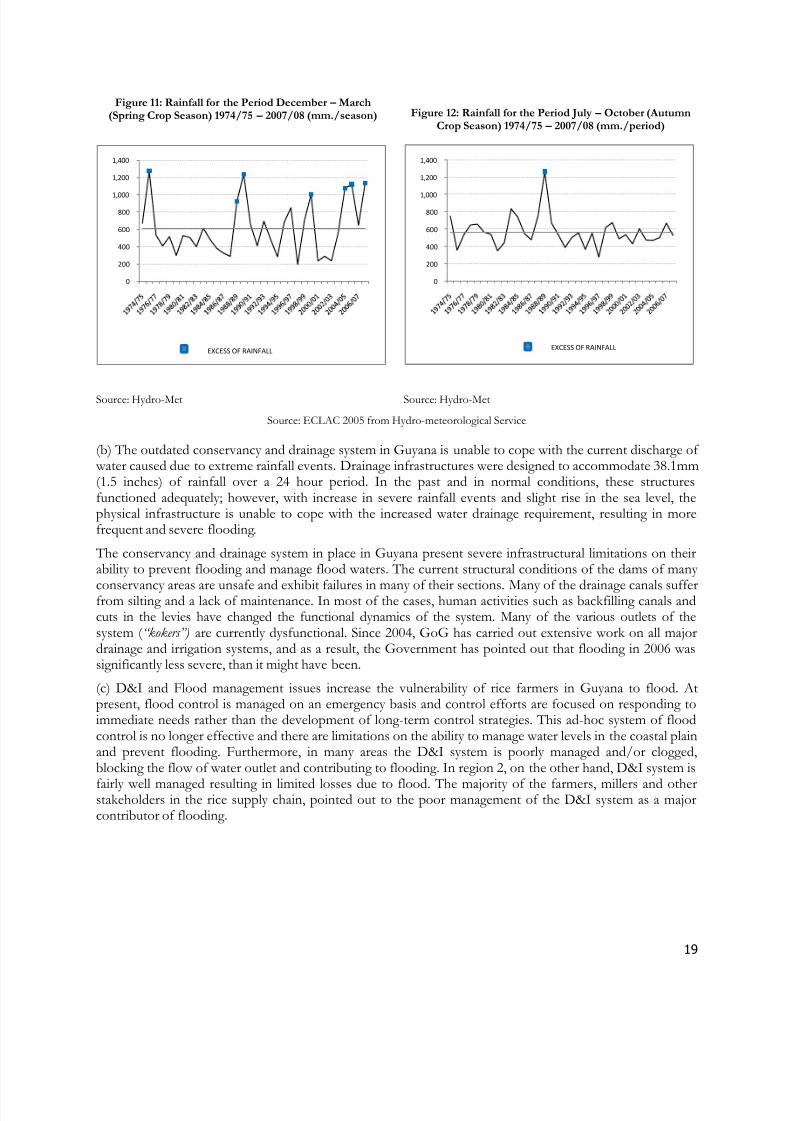
(a)The paddy production areas in Guyana are affected by extreme rainfall events. The occurrence of extreme
rainfall events (i.e. excess of rain and lack of rain) affecting the paddy crops is higher during the spring cropseason than during the autumn crop season. Between 1974/75 and 2007/08, there were seven excess rainevents19 during the spring crop season(figure 11) while only one excess rain event during the autumn cropseason(figure 12). These events lead to flooding of paddy fields and the D&I system is unable to drain thewater out of the fields, leading to losses to the paddy crop.
16 GUYSUCO. Vulnerability and Capacity Assessment. Impacts of Climate Change on Guyana‟s Agricultural Sector. March, 2009. 17 Flood event is considered for the purposes of this pre-feasibility study as the occurrence of flood in any particular region.18 The methodology used to calculate the rice production losses involves the calculation of a) area totally damaged and b) area partially damaged due to flooding. (Production losses = area impacted * expected yield at harvest). The expected yield at harvest wasdetermined by corresponding historic yield trend value for the year under analysis. 19 For the purposes of this analysis an excess of rain event is defined as rainfall event that is above the threshold established as thehistoric average rainfall for each of the periods under analysis plus one standard deviation of the historic rainfall of the period underanalysis.
0
10,000
20,000
30,000
40,000
50,000
60,000
Region 2 Region 3 Region 4 Region 5 Region 6
8/7/2019 WorldBank – Guyana Rice Supply Chain Risk Assessment – May 2010
http://slidepdf.com/reader/full/worldbank-guyana-rice-supply-chain-risk-assessment-may-2010 19/40
19
Figure 11: Rainfall for the Period December – March(Spring Crop Season) 1974/75 – 2007/08 (mm./season) Figure 12: Rainfall for the Period July – October (Autumn
Crop Season) 1974/75 – 2007/08 (mm./period)
Source: Hydro-Met Source: Hydro-Met
Source: ECLAC 2005 from Hydro-meteorological Service
(b) The outdated conservancy and drainage system in Guyana is unable to cope with the current discharge of water caused due to extreme rainfall events. Drainage infrastructures were designed to accommodate 38.1mm(1.5 inches) of rainfall over a 24 hour period. In the past and in normal conditions, these structuresfunctioned adequately; however, with increase in severe rainfall events and slight rise in the sea level, thephysical infrastructure is unable to cope with the increased water drainage requirement, resulting in morefrequent and severe flooding.
The conservancy and drainage system in place in Guyana present severe infrastructural limitations on theirability to prevent flooding and manage flood waters. The current structural conditions of the dams of many
conservancy areas are unsafe and exhibit failures in many of their sections. Many of the drainage canals sufferfrom silting and a lack of maintenance. In most of the cases, human activities such as backfilling canals andcuts in the levies have changed the functional dynamics of the system. Many of the various outlets of thesystem ( “kokers”) are currently dysfunctional. Since 2004, GoG has carried out extensive work on all majordrainage and irrigation systems, and as a result, the Government has pointed out that flooding in 2006 wassignificantly less severe, than it might have been.
(c) D&I and Flood management issues increase the vulnerability of rice farmers in Guyana to flood. Atpresent, flood control is managed on an emergency basis and control efforts are focused on responding toimmediate needs rather than the development of long-term control strategies. This ad-hoc system of floodcontrol is no longer effective and there are limitations on the ability to manage water levels in the coastal plainand prevent flooding. Furthermore, in many areas the D&I system is poorly managed and/or clogged,blocking the flow of water outlet and contributing to flooding. In region 2, on the other hand, D&I system is
fairly well managed resulting in limited losses due to flood. The majority of the farmers, millers and otherstakeholders in the rice supply chain, pointed out to the poor management of the D&I system as a majorcontributor of flooding.
0
200
400
600
800
1,000
1,200
1,400
EXCESS OF RAINFALL
0
200
400
600
800
1,000
1,200
1,400
EXCESS OF RAINFALL
8/7/2019 WorldBank – Guyana Rice Supply Chain Risk Assessment – May 2010
http://slidepdf.com/reader/full/worldbank-guyana-rice-supply-chain-risk-assessment-may-2010 20/40
20
Figure 13: Investment in D&I Works
Source: Govt. of Guyana
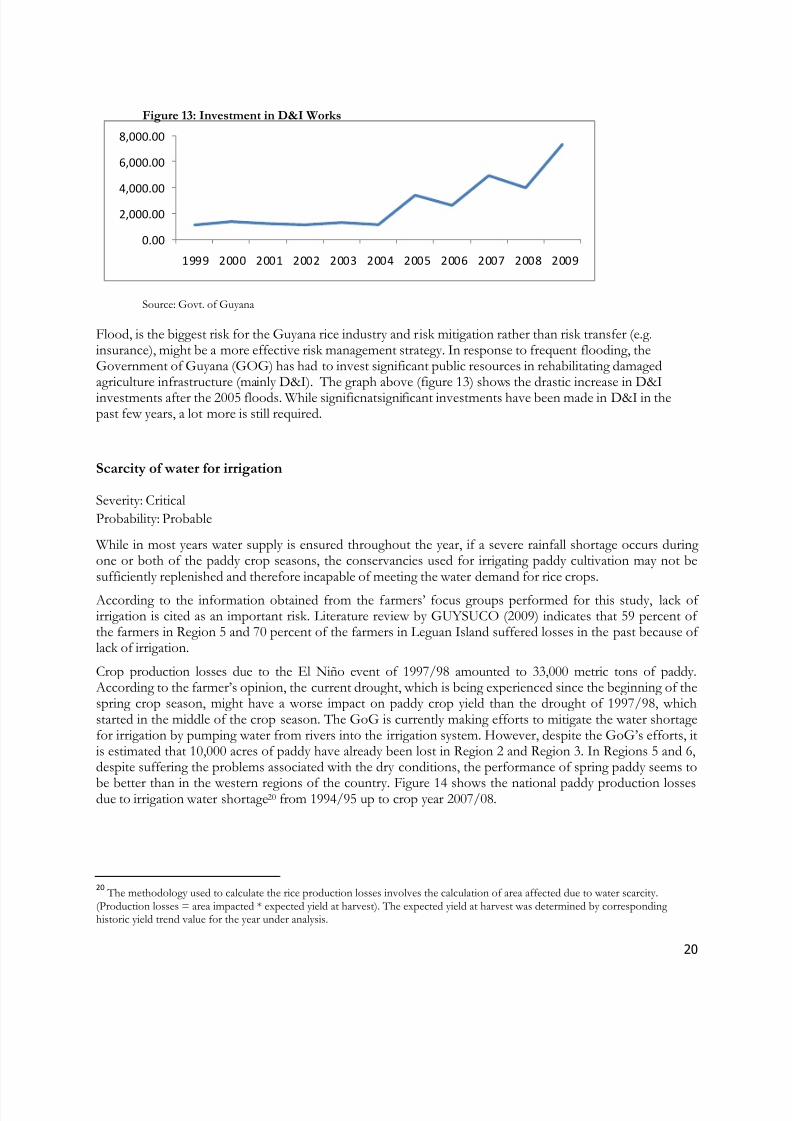
Flood, is the biggest risk for the Guyana rice industry and risk mitigation rather than risk transfer (e.g.insurance), might be a more effective risk management strategy. In response to frequent flooding, theGovernment of Guyana (GOG) has had to invest significant public resources in rehabilitating damagedagriculture infrastructure (mainly D&I). The graph above (figure 13) shows the drastic increase in D&Iinvestments after the 2005 floods. While significnatsignificant investments have been made in D&I in thepast few years, a lot more is still required.
Scarcity of water for irrigation
Severity: Critical
Probability: Probable
While in most years water supply is ensured throughout the year, if a severe rainfall shortage occurs during one or both of the paddy crop seasons, the conservancies used for irrigating paddy cultivation may not besufficiently replenished and therefore incapable of meeting the water demand for rice crops.
According to the information obtained from the f armers‟ focus groups performed for this study, lack of irrigation is cited as an important risk. Literature review by GUYSUCO (2009) indicates that 59 percent of the farmers in Region 5 and 70 percent of the farmers in Leguan Island suffered losses in the past because of lack of irrigation.
Crop production losses due to the El Niño event of 1997/98 amounted to 33,000 metric tons of paddy.According to the farmer‟s opinion, the current drought, which is being experienced since the beginning of thespring crop season, might have a worse impact on paddy crop yield than the drought of 1997/98, whichstarted in the middle of the crop season. The GoG is currently making efforts to mitigate the water shortagefor irrigation by pumping water from rivers into the irrigation system. However, despite the GoG‟s efforts, itis estimated that 10,000 acres of paddy have already been lost in Region 2 and Region 3. In Regions 5 and 6,despite suffering the problems associated with the dry conditions, the performance of spring paddy seems to
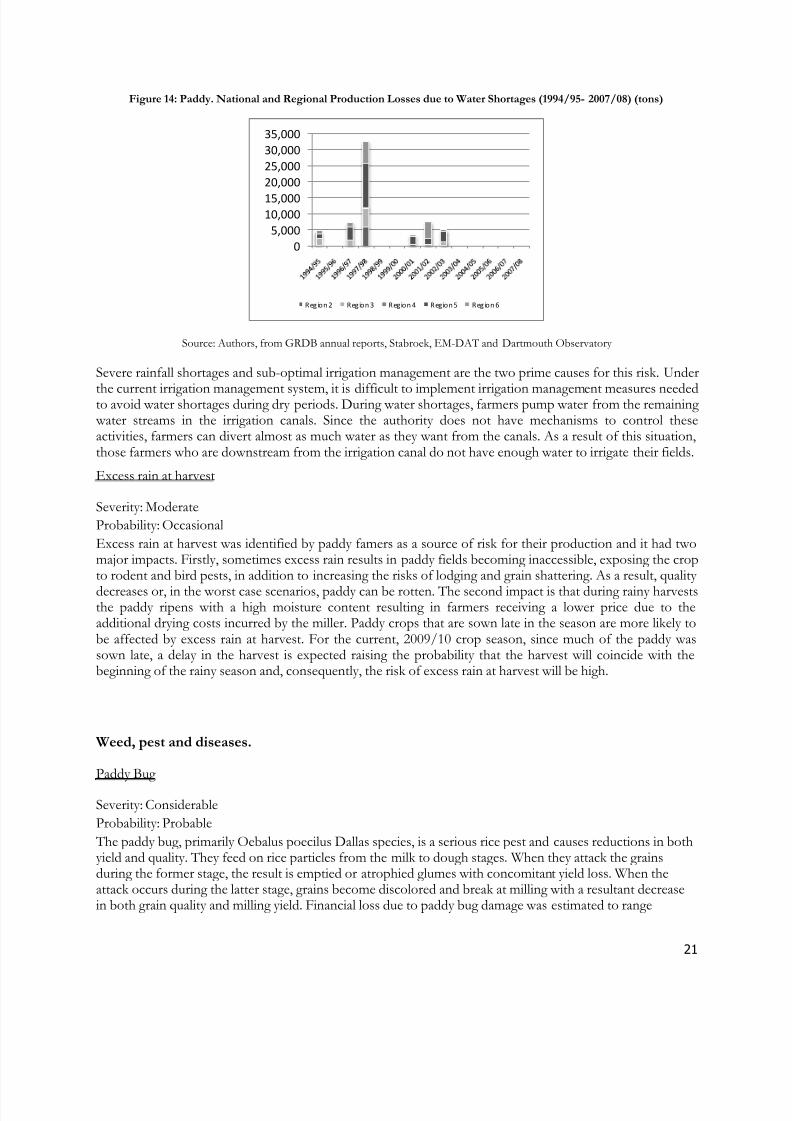
be better than in the western regions of the country. Figure 14 shows the national paddy production lossesdue to irrigation water shortage20 from 1994/95 up to crop year 2007/08.
20 The methodology used to calculate the rice production losses involves the calculation of area affected due to water scarcity.
(Production losses = area impacted * expected yield at harvest). The expected yield at harvest was determined by corresponding historic yield trend value for the year under analysis.
0.00
2,000.00
4,000.00
6,000.00
8,000.00
1999 2000 2001 2002 2003 2004 2005 2006 2007 2008 2009
8/7/2019 WorldBank – Guyana Rice Supply Chain Risk Assessment – May 2010
http://slidepdf.com/reader/full/worldbank-guyana-rice-supply-chain-risk-assessment-may-2010 21/40
21
Figure 14: Paddy. National and Regional Production Losses due to Water Shortages (1994/95- 2007/08) (tons)
Source: Authors, from GRDB annual reports, Stabroek, EM-DAT and Dartmouth Observatory
Severe rainfall shortages and sub-optimal irrigation management are the two prime causes for this risk. Under
the current irrigation management system, it is difficult to implement irrigation management measures neededto avoid water shortages during dry periods. During water shortages, farmers pump water from the remaining water streams in the irrigation canals. Since the authority does not have mechanisms to control theseactivities, farmers can divert almost as much water as they want from the canals. As a result of this situation,those farmers who are downstream from the irrigation canal do not have enough water to irrigate their fields.
Excess rain at harvest
Severity: Moderate
Probability: Occasional
Excess rain at harvest was identified by paddy famers as a source of risk for their production and it had twomajor impacts. Firstly, sometimes excess rain results in paddy fields becoming inaccessible, exposing the cropto rodent and bird pests, in addition to increasing the risks of lodging and grain shattering. As a result, quality
decreases or, in the worst case scenarios, paddy can be rotten. The second impact is that during rainy harveststhe paddy ripens with a high moisture content resulting in farmers receiving a lower price due to theadditional drying costs incurred by the miller. Paddy crops that are sown late in the season are more likely tobe affected by excess rain at harvest. For the current, 2009/10 crop season, since much of the paddy wassown late, a delay in the harvest is expected raising the probability that the harvest will coincide with thebeginning of the rainy season and, consequently, the risk of excess rain at harvest will be high.
Weed, pest and diseases.
Paddy Bug
Severity: Considerable
Probability: Probable
The paddy bug, primarily Oebalus poecilus Dallas species, is a serious rice pest and causes reductions in bothyield and quality. They feed on rice particles from the milk to dough stages. When they attack the grainsduring the former stage, the result is emptied or atrophied glumes with concomitant yield loss. When theattack occurs during the latter stage, grains become discolored and break at milling with a resultant decreasein both grain quality and milling yield. Financial loss due to paddy bug damage was estimated to range
0
5,000
10,00015,000
20,000
25,000
30,000
35,000
Region 2 Region 3 Region 4 Region 5 Region 6
8/7/2019 WorldBank – Guyana Rice Supply Chain Risk Assessment – May 2010
http://slidepdf.com/reader/full/worldbank-guyana-rice-supply-chain-risk-assessment-may-2010 22/40
22
between 10.1% (First Crop) and 17.7% (Second Crop) and it was found that paddy harvested at the end of the cropping season had a higher percentage of bug-damaged grains (Rai, 1974)21. In 2002, the spring paddy crop suffered the highest level of paddy bug infestation in years. Region Five and Region Six were the mostaffected areas where the bugs were responsible for some 38% 22 of the damage done.
In the past, paddy bug outbreak affected the country on several occasions. However, in recent years, due to
the improvement in pest management practices, the losses due to this pest have been reduced. Yet, paddy bug is still an important risk (annex 4) and farmers suffer considerable looses due to it. Integrated pestmanagement involving cultural, chemical and biological control and monitoring and surveillance needs to beadopted by the farmers to manage this risk.
Significant rise of red rice infestation
Severity: Considerable
Probability: Probable
One of the major risks to the production of rice in directly-seeded areas is the incidence of red rice (Oryzabarthi and O. longistaminata) which leads to considerable volume and quality losses. In 1998, light red rice
infestation was found in 46 percent of the planted area, while 15 and 5 percent showed moderate and highinfestation23, respectively. Agronomic practitioners estimate that a 10 percent infection of red rice weeds in afield will reduce yield by 25 percent. Crop losses due to red rice incidence may be as high as 60 percent inheavy field infestation. It is difficult to assess the actual levels of loss related to quality reductions, as these aredependent on individual deliveries and prevalent market conditions.
The main sources of red rice infestation are: contaminated rice seeds, the existence of red rice seeds in soil,and poor weed management. Therefore, any control measure should be aimed at the reduction of infestationfrom these sources. In that regard, the use of seeds free of red rice must be promoted by the Governmentand the implementation of weed management must be implemented by the farmers. Besides that, goodagronomic practices, including better water management, will help reduce red rice infestation.
Blast infestation
Severity: Considerable
Probability: Remote
The occurrence and severity of rice blast, caused by the fungus Pyricularia grisea, varies by year, location and
even within a field depending on environmental conditions and crop management practices. Whenever the
disease occurs, it causes severe yield reductions that can account for up to 75 percent of the expected yield of
the crop. The disease is favored by long periods of high moisture, high humidity, little or no wind at night
and mild night temperatures. Other factors that favor the disease are the excessive use of nitrogen fertilizer,
aerobic soils and the drought stress. Owing to the high relative humidity and lack of air movement,
vulnerability and severity increases in the paddy fields within 3-5 miles [5-8 km] from the tidal flat or
riverbank. According to the information collected from the field, 1987/88 and 1997/98 were years with a
high ratio of blast infestation on paddy crops which added to the drought problems associated with El Niño.
21 RAI, B. K. Losses caused by the paddy bug and "red rice" in Guyana. Lanham: FAO, 1974. p. 82-86. (Plant Protection Bulletin, 22)
23 http://www.fao.org/docrep/005/Y4347E/y4347e03.htm
8/7/2019 WorldBank – Guyana Rice Supply Chain Risk Assessment – May 2010
http://slidepdf.com/reader/full/worldbank-guyana-rice-supply-chain-risk-assessment-may-2010 23/40
23
With the introduction of blast resistant rice varieties in 2004, the incidence of this disease is currently undercontrol. Although the adoption of rice blast resistance varieties keeps the disease at acceptable levels, there isa possibility that the pathogen causing blast undergoes genetic mutation. If that happens, the current blastresistant varieties might not be effective in coping with the mutation and new varieties will have to bedeveloped.
6.2 Market Risks
There are multiple market risks facing the Guyana rice sector and most are interrelated in their cause and
effects. Price, both for rice and inputs, delayed or no payment, and rising transportation costs are the
dominant market risks for the rice supply chain.
Price risk
Severity: Moderate
Probability: Probable
There are three distinct dimensions of price risks for the rice supply chain in Guyana: a) substantial decline ininternational rice prices, b) rise in international rice prices, and c) uncertainty of paddy prices at harvest.
Substantial decline in international rice prices: The price that Guyanese exporters can sell rice for is
determined by the international rice markets, with Caribbean export prices determined by North American
rice prices and European export prices determined by Asian (Thailand and Vietnam) rice prices. Millers
calculate the paddy price for the farmers by working backwards from the international market prices. Overall,
the rice supply chain appears relatively efficient and the cost structure is relatively set, indicating that there is
little scope for reducing the costs of production in response to a global rice price fall.
Rise in international rice prices: Rise in international rice prices is generally perceived as good news for the
Guyanese rice industry as farmers see the price paid for their paddy rise e.g 2008 and 2009, enabling them to
raise their rice related incomes. However, significant rise in rice prices can lead to difficulties for theprocessing and exporting sectors due to the increased working capital requirements that come from rising
prices. The availability of bank lending, however, is limited and a rise in rice prices may not necessarily be
accompanied by an equivalent expansion in credit facilities (loan sizes). In 2008, the average price paid by
millers for paddy more than doubled from the previous year, yet total loan amounts to the rice sector only
rose by 6% between September 2007 and September 2008 24. This shortage of working capital resulted in
some farmers remaining unpaid by the millers for a number of months (until the millers received payment
from buyers). This risk, however, is not of major concern since the benefits of the rising price more than
compensates for the losses.
Uncertainty of paddy prices at harvest: Rice farmers incur input and labor costs at the start and during a
season, without any clear knowledge or awareness of what prices they will receive for their paddy when they
come to harvest and sell. At times, farmers even sell their paddy to the millers without a clear understanding
of the prices they would receive later. This creates a risk that the eventual price the farmer might receive for
their paddy might be below their cost of production. This uncertainty might act as a disincentive and inability
to recoup their investment costs might force farmers to default on loans and/or cease production of rice.
Increase in input prices
24 Bank of Guyana – Statistical Abstract – December 2009 – Commercial Banks Loans & Advances Pages 21&23
8/7/2019 WorldBank – Guyana Rice Supply Chain Risk Assessment – May 2010
http://slidepdf.com/reader/full/worldbank-guyana-rice-supply-chain-risk-assessment-may-2010 24/40
24
Severity: Moderate
Probability: Probable
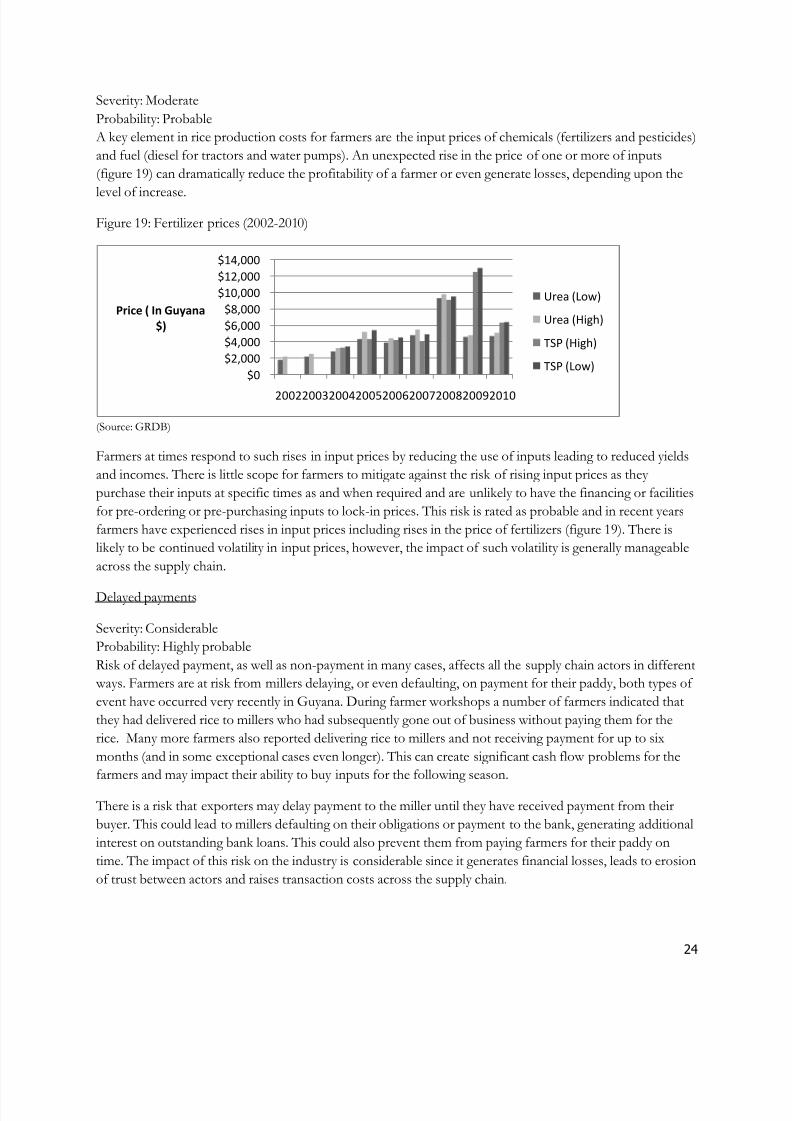
A key element in rice production costs for farmers are the input prices of chemicals (fertilizers and pesticides)
and fuel (diesel for tractors and water pumps). An unexpected rise in the price of one or more of inputs
(figure 19) can dramatically reduce the profitability of a farmer or even generate losses, depending upon the
level of increase.
Figure 19: Fertilizer prices (2002-2010)
(Source: GRDB)
Farmers at times respond to such rises in input prices by reducing the use of inputs leading to reduced yields
and incomes. There is little scope for farmers to mitigate against the risk of rising input prices as they
purchase their inputs at specific times as and when required and are unlikely to have the financing or facilities
for pre-ordering or pre-purchasing inputs to lock-in prices. This risk is rated as probable and in recent years
farmers have experienced rises in input prices including rises in the price of fertilizers (figure 19). There is
likely to be continued volatility in input prices, however, the impact of such volatility is generally manageable
across the supply chain.
Delayed payments
Severity: Considerable
Probability: Highly probable
Risk of delayed payment, as well as non-payment in many cases, affects all the supply chain actors in different
ways. Farmers are at risk from millers delaying, or even defaulting, on payment for their paddy, both types of
event have occurred very recently in Guyana. During farmer workshops a number of farmers indicated that
they had delivered rice to millers who had subsequently gone out of business without paying them for the
rice. Many more farmers also reported delivering rice to millers and not receiving payment for up to six
months (and in some exceptional cases even longer). This can create significant cash flow problems for the
farmers and may impact their ability to buy inputs for the following season.
There is a risk that exporters may delay payment to the miller until they have received payment from their
buyer. This could lead to millers defaulting on their obligations or payment to the bank, generating additional
interest on outstanding bank loans. This could also prevent them from paying farmers for their paddy on
time. The impact of this risk on the industry is considerable since it generates financial losses, leads to erosion
of trust between actors and raises transaction costs across the supply chain.
$0
$2,000
$4,000
$6,000
$8,000
$10,000
$12,000
$14,000
200220032004200520062007200820092010
Price ( In Guyana
$)
Urea (Low)
Urea (High)
TSP (High)
TSP (Low)
8/7/2019 WorldBank – Guyana Rice Supply Chain Risk Assessment – May 2010
http://slidepdf.com/reader/full/worldbank-guyana-rice-supply-chain-risk-assessment-may-2010 25/40
25
Most exporters believe that their knowledge of, and relationship with, their buyers provides them with
reasonable protection against the risk of buyers‟ default. Financial instruments for managing this risk at the
exporter level do exist, specifically letters of credit, however, exporters are reluctant to use such instruments
due to cost and time. GRDB has recently enacted a regulation mandating millers to make full payment to the
farmers within 56 days of the delivery of paddy 25. This, if enforced properly, could lead to timely payments to
the farmers.
Rising transportation costs
Severity: Moderate
Probability: Occasional
Guyana‟s rice export industry already faces significantly higher transportation rates than other rice exporting
countries due to the need to utilize more costly smaller sized cargo boats. In addition, imported fertilizers and
chemicals, also have higher prices due to high transportation costs. A substantial rise in cargo costs into and
out of Guyana could greatly reduce the rice sector‟s competitiveness.
5.3 Other Risks
“Other risks” refer to risks that face the Guyanese rice supply chain that are not market or production based.
The major risks within this section relate to regulatory risks (both domestic and international) and physical
access to paddy fields for farmers.
Regulatory risk
Severity: Considerable
Probability: Remote
This supply chain assessment identified that the regulatory regime for rice in Guyana is relatively supportive
of the industry, providing stability and security to supply chain actors. However, it was noted by some supply chain actors that a recent rise in the GRDB levy (2009) was introduced with insufficient warning or
consultation and might have had a negative impact on the largest millers/exporters who had been storing rice
for future export to buyers. While no clear figures are available to identify the impact of the rise in levies, it
was reported verbally that the rise turned profitable forward contracts with buyers into loss making forward
contracts.
Erosion of preferential market access (CARICOM)
Severity: Considerable
Probability: Remote
Guyanese rice benefits from the CARICOM tariff regime which imposes a 25% tariff on extra-regional rice
imports. This tariff assists Guyanese rice exporters in maintaining their competitiveness in the region
especially against US rice exports. There is a potential risk of the current CARICOM tariff structure for rice
being reduced, thereby diminishing the protection and support currently provided to Guyanese exporters
25The Bill, No. 35 of 2009, was assented to by President Bharrat Jagdeo on December 22, 2010after being tabled in the National
Assembly on October 15 and passed on October 22, 2009, after three readings. Millers have a period of two weeks by which to
pay 50 percent of total sale to individual farmers as opposed to just 50 percent of total paddy sale. They are also granted an
additional 42 days to pay the remainder; failing which they face the possibility of having their license revoked. (Source:
http://agriculture.gov.gy/Bulletins/January%202010/Rice%20Factories%20(Amendment)%20Bill%20now%20in%20force.html)
8/7/2019 WorldBank – Guyana Rice Supply Chain Risk Assessment – May 2010
http://slidepdf.com/reader/full/worldbank-guyana-rice-supply-chain-risk-assessment-may-2010 26/40
26
supplying rice to the Caribbean markets. Already there are concerns that exemptions are being granted to
extra-regional rice imports that are being sent to Caribbean mills for polishing and further processing. A
reduction in the tariff rates will expose Guyanese rice to full market competition.
Accessibility to dam roads
Severity: ModerateProbability: Probable
Rice harvesting is undertaken using mechanical combines which need to be able to access rice fields to
harvest the rice. Guyana‟s rice fields are contained within a system of dams and irrigation and drainage canals
and access to fields is often via dam roads. During rainy periods the dam roads may become unusable by
heavy combine vehicles and as such the rice fields may be inaccessible to combine harvesters. Delays in
harvesting can result in rice being damaged and failing to be collected at the appropriate time either damaging
yields or leading to no harvesting at all. This risk is location specific (for farms that are reliant on dam roads
to access their fields) but where it exists, it appears to be a regular occurrence and one with a reasonably high
impact upon the farmers.
8/7/2019 WorldBank – Guyana Rice Supply Chain Risk Assessment – May 2010
http://slidepdf.com/reader/full/worldbank-guyana-rice-supply-chain-risk-assessment-may-2010 27/40
27
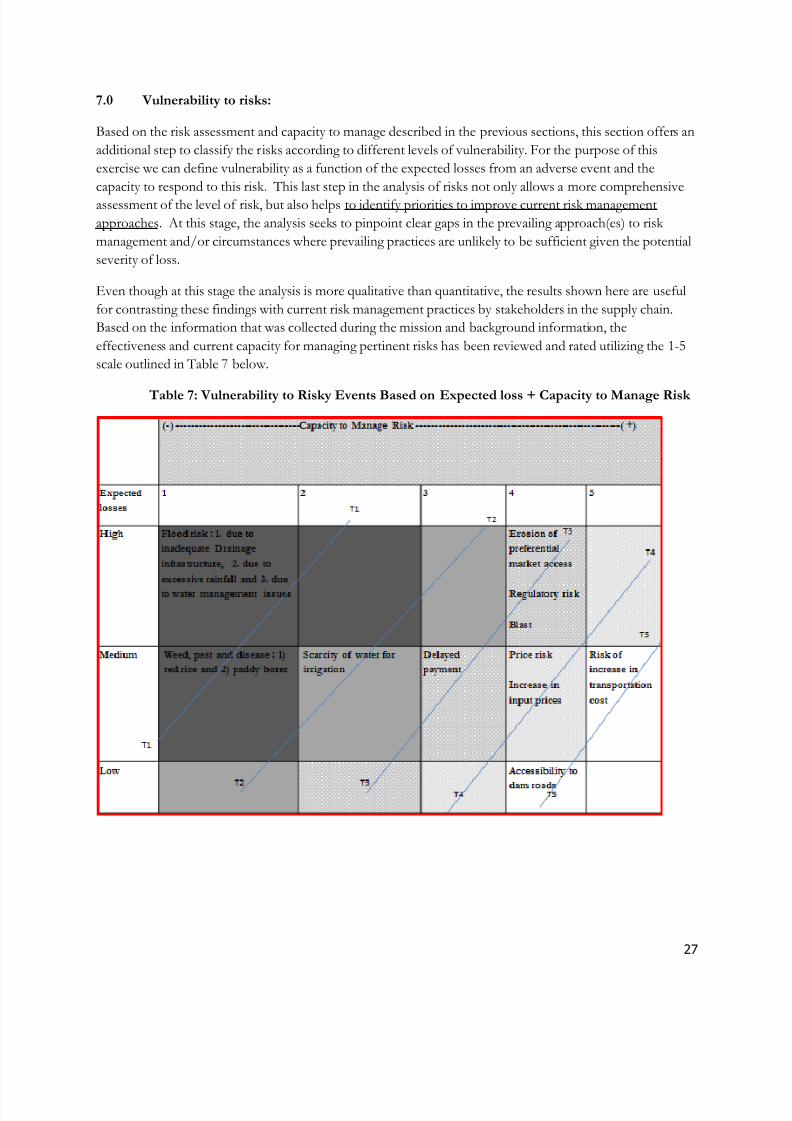
7.0 Vulnerability to risks:
Based on the risk assessment and capacity to manage described in the previous sections, this section offers an
additional step to classify the risks according to different levels of vulnerability. For the purpose of this
exercise we can define vulnerability as a function of the expected losses from an adverse event and the
capacity to respond to this risk . This last step in the analysis of risks not only allows a more comprehensive
assessment of the level of risk, but also helps to identify priorities to improve current risk management
approaches. At this stage, the analysis seeks to pinpoint clear gaps in the prevailing approach(es) to risk
management and/or circumstances where prevailing practices are unlikely to be sufficient given the potential
severity of loss.
Even though at this stage the analysis is more qualitative than quantitative, the results shown here are useful
for contrasting these findings with current risk management practices by stakeholders in the supply chain.
Based on the information that was collected during the mission and background information, the
effectiveness and current capacity for managing pertinent risks has been reviewed and rated utilizing the 1-5
scale outlined in Table 7 below.
Table 7: Vulnerability to Risky Events Based on Expected loss + Capacity to Manage Risk

8/7/2019 WorldBank – Guyana Rice Supply Chain Risk Assessment – May 2010
http://slidepdf.com/reader/full/worldbank-guyana-rice-supply-chain-risk-assessment-may-2010 28/40
28
The resulting matrix classifies vulnerabilities to the identified risks into three groups, from the highest
vulnerability containing the risks in the boxes with the darkest shade marked as T1 (tier 1) upper left corner,
towards the risks ranked with lowest vulnerability shown in the boxes with the clear shades towards the right
bottom side of the table marked as T5 (tier 5). There are in between three additional intermediate
vulnerability levels which are in lighter shade. The importance of this matrix is that, through a process of
prioritization, it is possible to identify those risks in Tier 1 and Tier 2 that are mainly responsible for causing volatility of earnings for the various stakeholders. Managing these risks will, to a large extent, reduce
vulnerability of the rice industry.
8/7/2019 WorldBank – Guyana Rice Supply Chain Risk Assessment – May 2010
http://slidepdf.com/reader/full/worldbank-guyana-rice-supply-chain-risk-assessment-may-2010 29/40
29
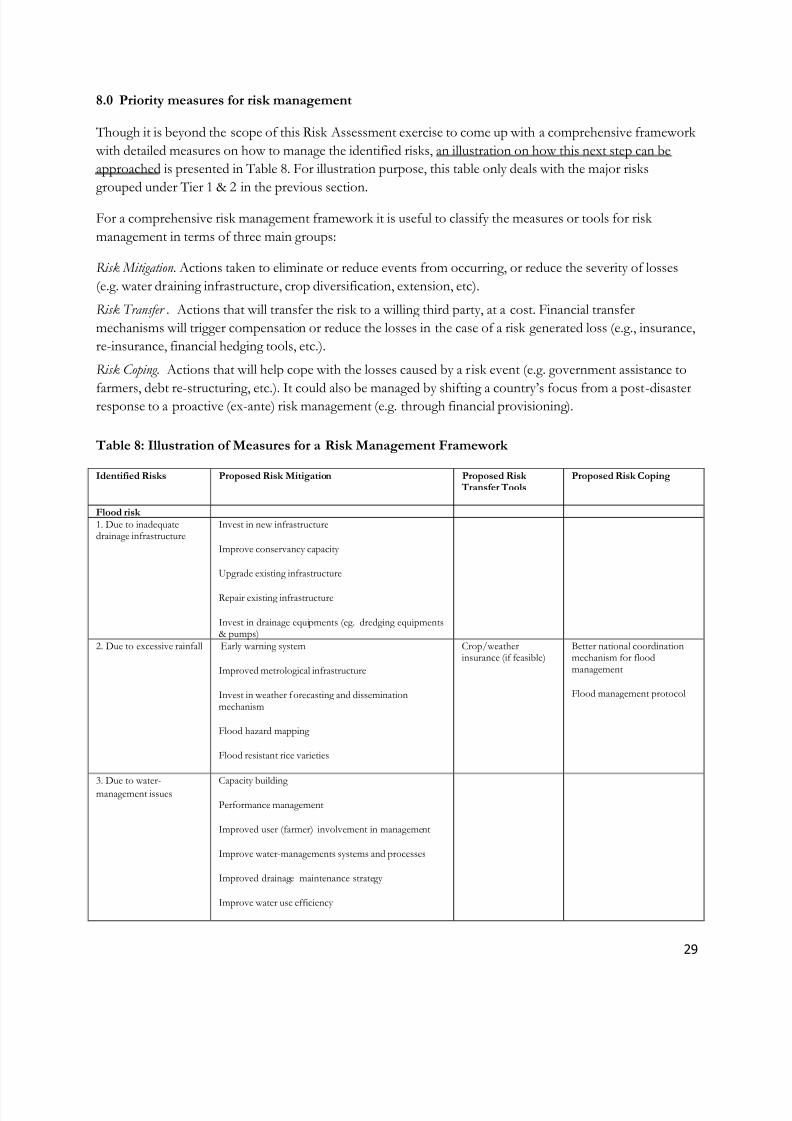
8.0 Priority measures for risk management
Though it is beyond the scope of this Risk Assessment exercise to come up with a comprehensive framework
with detailed measures on how to manage the identified risks, an illustration on how this next step can be
approached is presented in Table 8. For illustration purpose, this table only deals with the major risks
grouped under Tier 1 & 2 in the previous section.
For a comprehensive risk management framework it is useful to classify the measures or tools for risk
management in terms of three main groups:
Risk Mitigation . Actions taken to eliminate or reduce events from occurring, or reduce the severity of losses
(e.g. water draining infrastructure, crop diversification, extension, etc).
Risk Transfer . Actions that will transfer the risk to a willing third party, at a cost. Financial transfer
mechanisms will trigger compensation or reduce the losses in the case of a risk generated loss (e.g., insurance,
re-insurance, financial hedging tools, etc.).
Risk Coping. Actions that will help cope with the losses caused by a risk event (e.g. government assistance to
farmers, debt re-structuring, etc.). It could also be managed by shifting a country‟s focus from a post-disasterresponse to a proactive (ex-ante) risk management (e.g. through financial provisioning).
Table 8: Illustration of Measures for a Risk Management Framework
Identified Risks Proposed Risk Mitigation Proposed Risk Transfer Tools
Proposed Risk Coping
Flood risk 1. Due to inadequatedrainage infrastructure
Invest in new infrastructure
Improve conservancy capacity
Upgrade existing infrastructure
Repair existing infrastructure
Invest in drainage equipments (eg. dredging equipments& pumps)
2. Due to excessive rainfall Early warning system
Improved metrological infrastructure
Invest in weather forecasting and disseminationmechanism
Flood hazard mapping
Flood resistant rice varieties
Crop/weatherinsurance (if feasible)
Better national coordinationmechanism for floodmanagement
Flood management protocol
3. Due to water-management issues Capacity building
Performance management
Improved user (farmer) involvement in management
Improve water-managements systems and processes
Improved drainage maintenance strategy
Improve water use efficiency
8/7/2019 WorldBank – Guyana Rice Supply Chain Risk Assessment – May 2010
http://slidepdf.com/reader/full/worldbank-guyana-rice-supply-chain-risk-assessment-may-2010 30/40
30
Public awareness program for clean drainage system
Weed, pest and disease1) Red rice Better farm management practices
Improved and increased farm extension services
Improved and increased access to quality seed (
improving seed quality and seed commercializationstandards)
Better water management
Effective mapping targeting of infected regions andfarmers
Better farm managementpractices
Improved and increased farmextension services
Better water management
2) Paddy bug Paddy bug resistant seed variety
Better farm management practices
Improved and increased farm extension services
Effective usage of chemicals/ pesticides
Better farm managementpractices
Improved and increased farmextension services
Effective usage of chemicals/pesticides
Scarcity of water forirrigation
Capacity building
Improved user (farmer) involvement in management
Improve water-managements systems and processes
Improve water use efficiency
Investment in irrigation equipment (e.g. pumps etc)
Crop/weatherinsurance (if feasible)
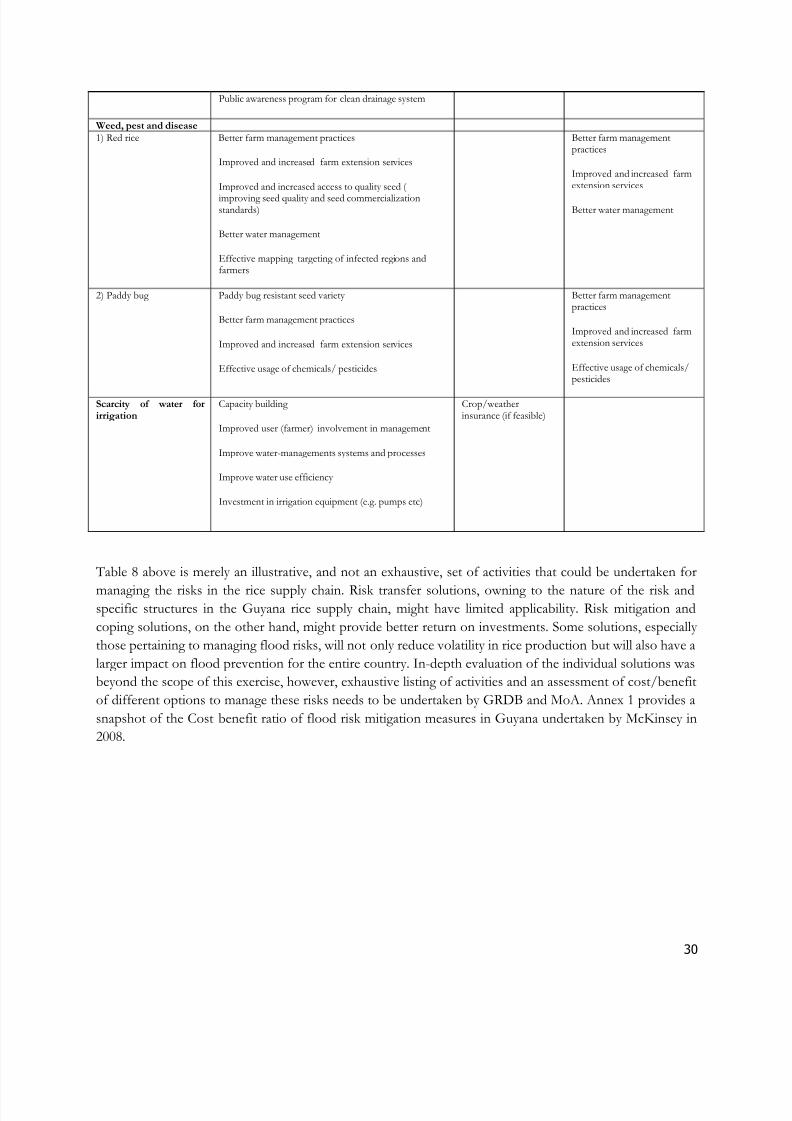
Table 8 above is merely an illustrative, and not an exhaustive, set of activities that could be undertaken for
managing the risks in the rice supply chain. Risk transfer solutions, owning to the nature of the risk andspecific structures in the Guyana rice supply chain, might have limited applicability. Risk mitigation and
coping solutions, on the other hand, might provide better return on investments. Some solutions, especially
those pertaining to managing flood risks, will not only reduce volatility in rice production but will also have a
larger impact on flood prevention for the entire country. In-depth evaluation of the individual solutions was
beyond the scope of this exercise, however, exhaustive listing of activities and an assessment of cost/benefit
of different options to manage these risks needs to be undertaken by GRDB and MoA. Annex 1 provides a
snapshot of the Cost benefit ratio of flood risk mitigation measures in Guyana undertaken by McKinsey in
2008.
8/7/2019 WorldBank – Guyana Rice Supply Chain Risk Assessment – May 2010
http://slidepdf.com/reader/full/worldbank-guyana-rice-supply-chain-risk-assessment-may-2010 31/40
31
9.0 Final remarks
The rice supply chain in Guyana has, to date, proven itself to be quite resilient, having successfully survived
several shocks over the past 50-100 years. The supply chain is relatively well-functioning and efficient, having
retained its competitive position, despite challenging local and global conditions. The industry stakeholders
have so far been successful in managing most of the risks confronted.
While the industry faces multiple market and regulatory risks, however, production risks are primarily
responsible for causing variability in rice production and have a negative impact on the long term
competitiveness of the industry. Sustained competitiveness will require effective management of production
risks, leading to reduced volatility in production and export volumes. Good management practices are often
also good risk management practices and consist of mitigation-transfer-coping with the risks.
Guyana is the „land of many rivers‟ and while the abundance of water has provided rich fertile ground for riceand sugarcane cultivation, excess water is one of the biggest risks that farmers confront on a regular basis.Floods in Guyana stem from three interrelated factors: excessive rainfall, inadequate drainage infrastructure,and sub-optimal water management. Given this, a risk transfer solution (e.g. insurance), might have limited
applicability. Instead, effective flood mitigation strategies focusing on further physical improvement andbetter management of D&I system, and better national and local level coordination mechanisms might yieldricher dividends, not only for the rice supply chain, but also for the entire country.
Weed, pest and disease, namely paddy bug and red rice, cause significant losses to farmers and have anegative impact on the quality of rice milled and exported. Every year, the rice supply chain looses a sizeableamount of volume and value due to this which could be averted by further investment in weed, pest anddisease control. GRBD is doing commendable work in farm extension and has been able to reduce the lossesowing to weed, pest and disease, yet more needs to be done.
This document highlights and prioritizes risks in the Guyana rice supply chain and could be used to stimulate
discussion and inform the planning of a rice supply chain risk management strategy. GoG has already taken
many initiatives to mitigate many of the risk described in the document. Many of the existing initiatives needsto be continued and strengthened and many new activities added for a comprehensive management of the
risks in the rice supply chain. This report provides an indicative list of potential solutions to addresses the
dominant risks in the rice supply chain, however, the assessment/evaluation of the individual solutions was
beyond the scope of this exercise. To ensure the greatest return on future public investments in implementing
risk management solutions, GRDB and MoA needs to undertake an exhaustive cost/benefit assessment of
different options. This will enable MoA to indentify the necessary activities to be implemented to reduce the
vulnerability of the rice supply chain in Guyana.
8/7/2019 WorldBank – Guyana Rice Supply Chain Risk Assessment – May 2010
http://slidepdf.com/reader/full/worldbank-guyana-rice-supply-chain-risk-assessment-may-2010 32/40
32
References : Bank of Guyana (2009) Banking System Statistical Abstract, Georgetown, Guyana. Dartmouth Flood Observatory (2005) Dartmouth College Hannover, NH 03755 USA Guyana Rice
Development Board, Annual Reports From 1995 up to and including 2009. GUYSUCO (2009) Vulnerability and Capacity Assessment. Impacts of Climate Change on Guyana‟sAgricultural Sector. March, 2009.
EM-DAT. OFDA/CRED International Disaster Database. www.em-dat.net. Universite Catolique deLovrain. Brussels. Belgium
FAO (2002) Major weed problems in rice – red/weedy rice and the Echninochloa complex by R. Labrada In FAO RiceInformation Vol. II December 2002. ftp://ftp.fao.org/docrep/fao/005/y4347E/y4347e00.pdf
McKinsey (2009) Shaping climate-resilient development: A framework for decision-making (2009),Economics of Climate Adaptation Working Group. Pp 99).
RAI, B. K. (1974) Losses caused by the paddy bug and "red rice" in Guyana. Lanham: FAO, 1974. p. 82-86. (Plant Protection Bulletin, 22) Tracey John (2009) Presentation by the Chairman of the Guyana Association of Bankers Mr. John Tracey at the Symposium on Agricultural risk and insurance, December 7, 2009. UN/ECLAC (2005) Guyana: Socio-economic assessment of the damages and losses caused by theJanuary-February 2005 Flooding
UNEP/OCHA (2006) Guyana Floods: Geotechnical and hydraulic assessment of the East DemararaWater Conservancy dam, Joint UNEP/Ocha Environmental Unit, February 2005
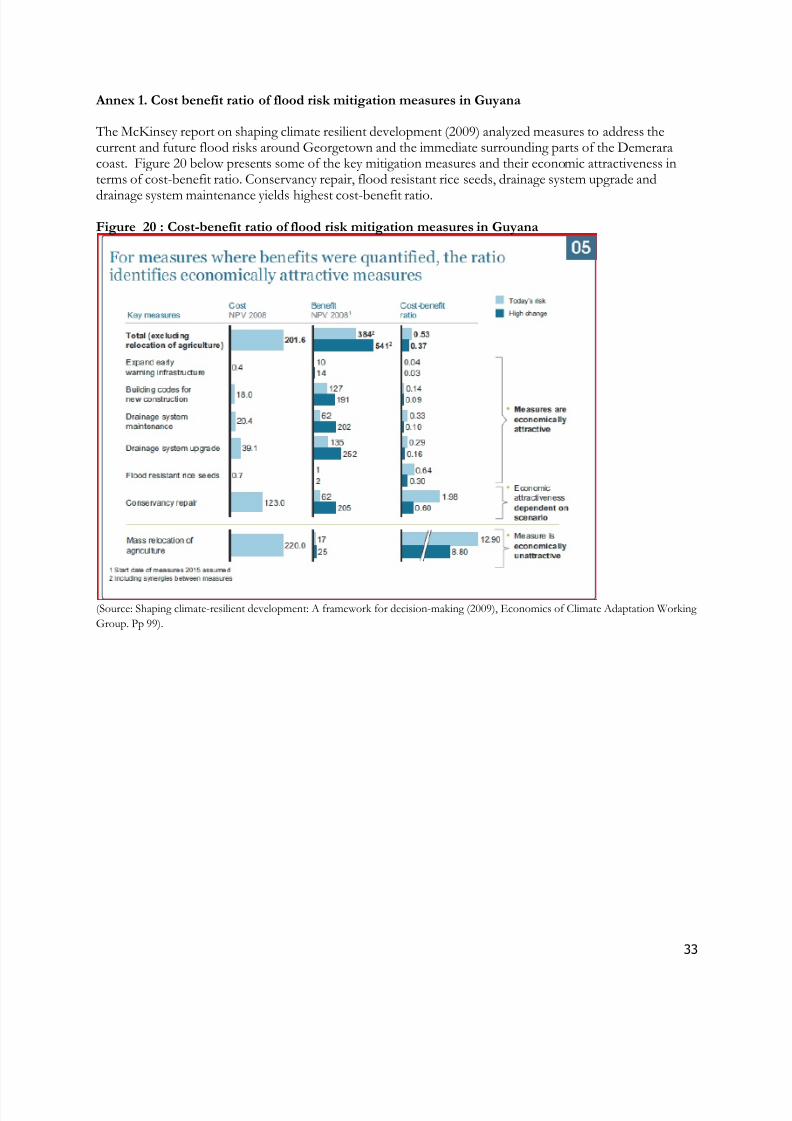
8/7/2019 WorldBank – Guyana Rice Supply Chain Risk Assessment – May 2010
http://slidepdf.com/reader/full/worldbank-guyana-rice-supply-chain-risk-assessment-may-2010 33/40
33
Annex 1. Cost benefit ratio of flood risk mitigation measures in Guyana
The McKinsey report on shaping climate resilient development (2009) analyzed measures to address thecurrent and future flood risks around Georgetown and the immediate surrounding parts of the Demeraracoast. Figure 20 below presents some of the key mitigation measures and their economic attractiveness interms of cost-benefit ratio. Conservancy repair, flood resistant rice seeds, drainage system upgrade and
drainage system maintenance yields highest cost-benefit ratio.
Figure 20 : Cost-benefit ratio of flood risk mitigation measures in Guyana
(Source: Shaping climate-resilient development: A framework for decision-making (2009), Economics of Climate Adaptation Working
Group. Pp 99).
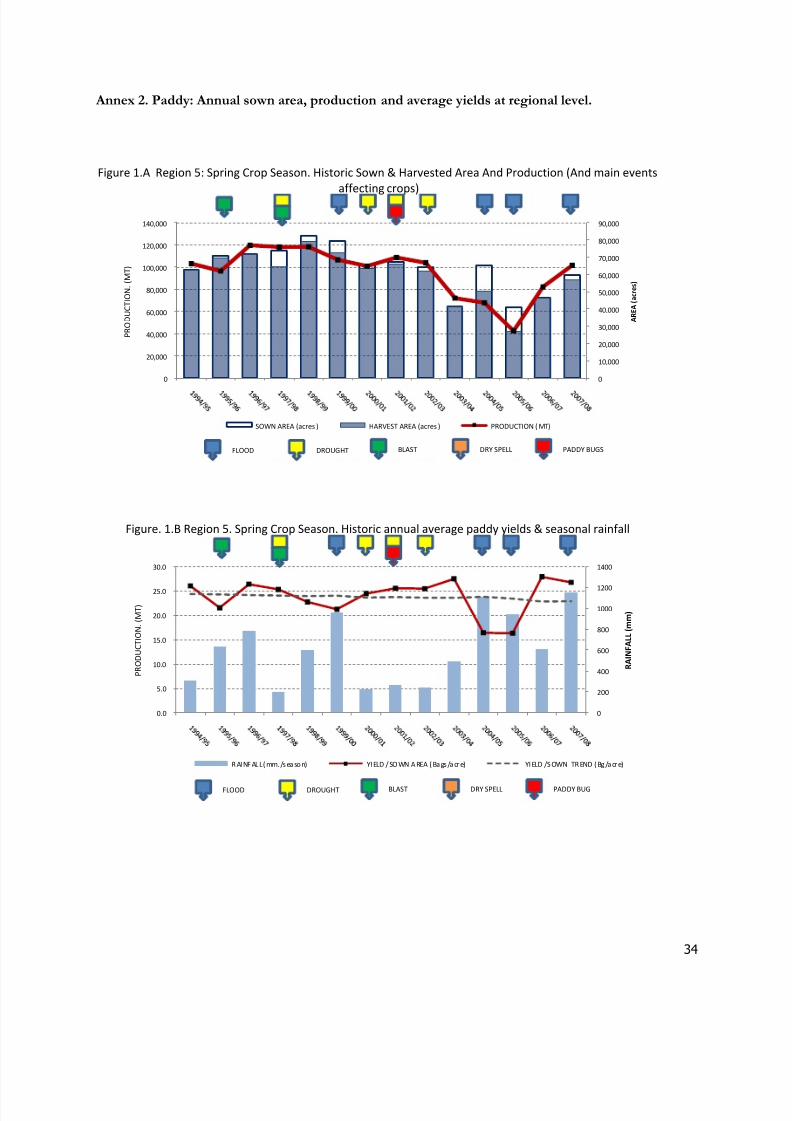
8/7/2019 WorldBank – Guyana Rice Supply Chain Risk Assessment – May 2010
http://slidepdf.com/reader/full/worldbank-guyana-rice-supply-chain-risk-assessment-may-2010 34/40
34
Annex 2. Paddy: Annual sown area, production and average yields at regional level.
Figure 1.A Region 5: Spring Crop Season. Historic Sown & Harvested Area And Production (And main events
affecting crops)
Figure. 1.B Region 5. Spring Crop Season. Historic annual average paddy yields & seasonal rainfall
0
10,000
20,000
30,000
40,000
50,000
60,000
70,000
80,000
90,000
0
20,000
40,000
60,000
80,000
100,000
120,000
140,000
AREA (acres)
PRODUCTION. (MT)
SOWN AREA (acres ) HARVEST AREA (acres ) PRODUCTION ( MT)
FLOOD DROUGHT BLAST DRY SPELL PADDY BUGS
0
200
400
600
800
1000
1200
1400
0.0
5.0
10.0
15.0
20.0
25.0
30.0
RAINFALL (mm)
PRODUCTION. (MT)
RAINFAL L ( mm./season) YIELD /SOWN A REA ( Bags/acr e) YIELD /SOWN TREND ( Bg /acr e)
FLOOD DROUGHT BLAST DRY SPELL PADDY BUG
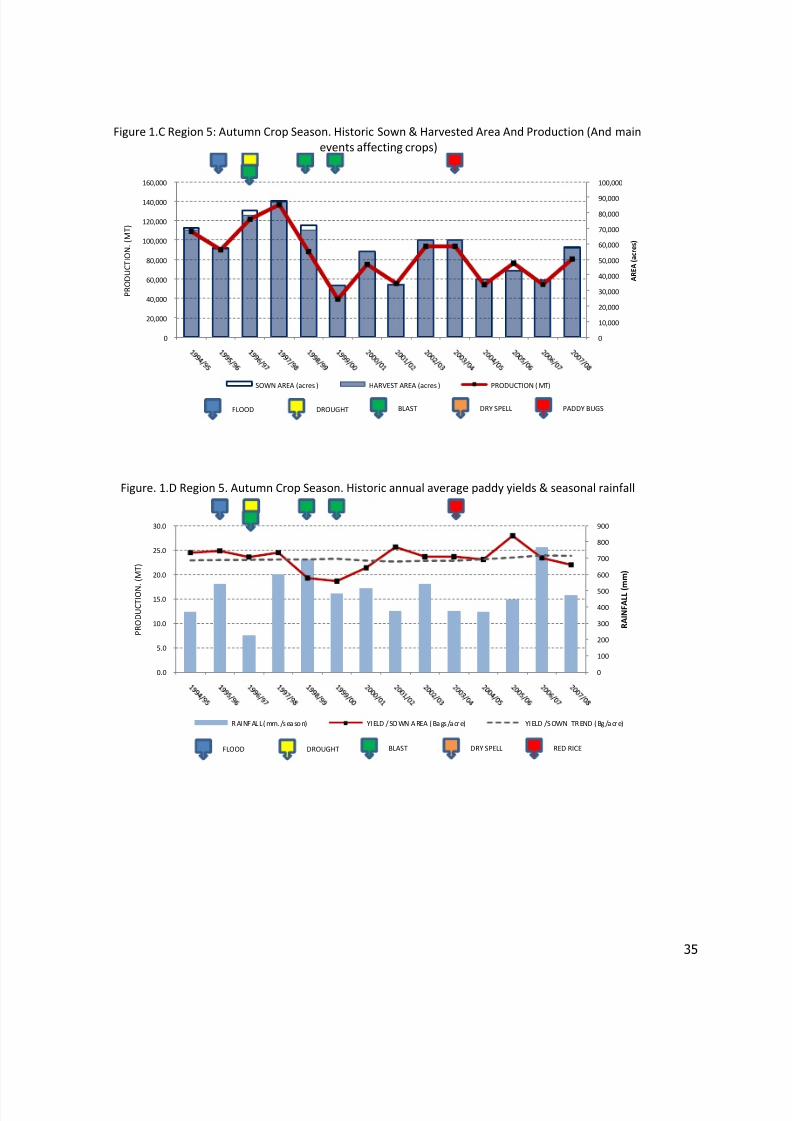
8/7/2019 WorldBank – Guyana Rice Supply Chain Risk Assessment – May 2010
http://slidepdf.com/reader/full/worldbank-guyana-rice-supply-chain-risk-assessment-may-2010 35/40
35
Figure 1.C Region 5: Autumn Crop Season. Historic Sown & Harvested Area And Production (And main
events affecting crops)
Figure. 1.D Region 5. Autumn Crop Season. Historic annual average paddy yields & seasonal rainfall
0
10,000
20,000
30,000
40,000
50,000
60,000
70,000
80,000
90,000
100,000
0
20,000
40,000
60,000
80,000
100,000
120,000
140,000
160,000
AREA (acres)
PRODUCTION. (MT)
SOWN AREA (acres ) HARVEST AREA (acres ) PRODUCTION ( MT)
FLOOD DROUGHT BLAST DRY SPELL PADDY BUGS
0
100
200
300
400
500
600
700
800
900
0.0
5.0
10.0
15.0
20.0
25.0
30.0
RAINFALL (mm)
PRODUCTION
. (MT)
RAINFAL L ( mm./season) YIELD /SOWN A REA ( Bags/acr e) YIELD /SOWN TREND ( Bg /acr e)
FLOOD DROUGHT BLAST DRY SPELL RED RICE
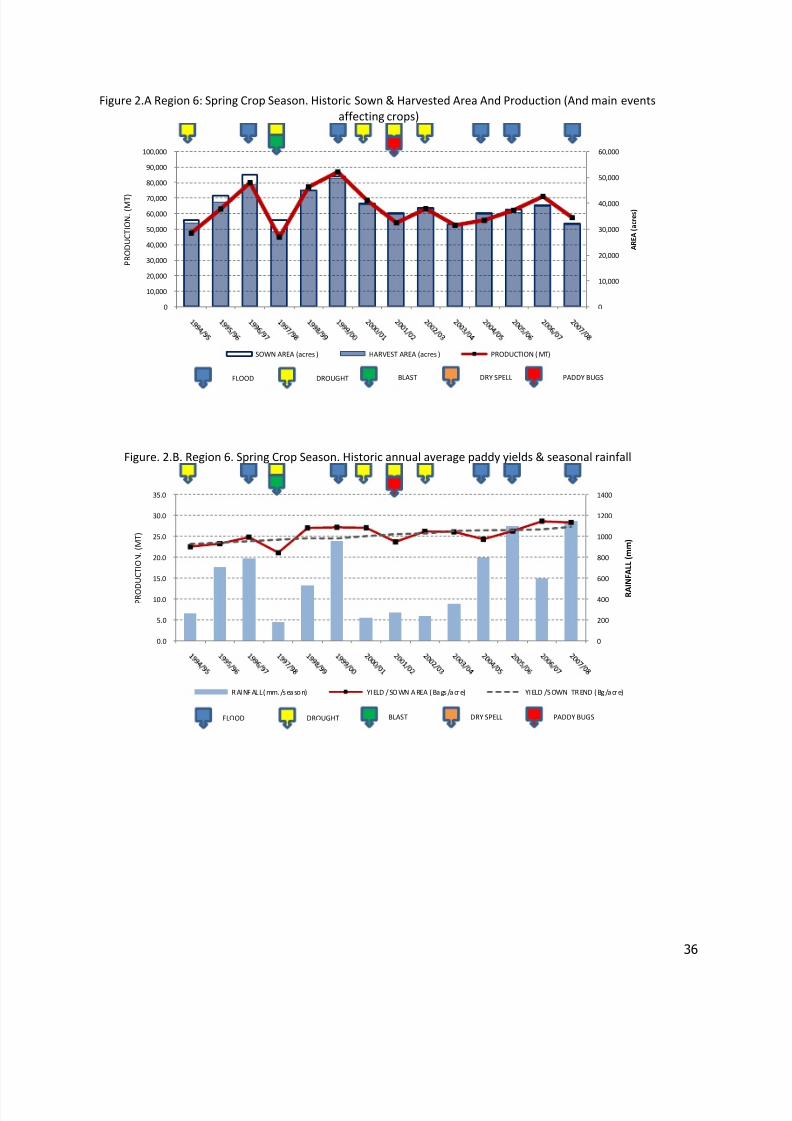
8/7/2019 WorldBank – Guyana Rice Supply Chain Risk Assessment – May 2010
http://slidepdf.com/reader/full/worldbank-guyana-rice-supply-chain-risk-assessment-may-2010 36/40
36
Figure 2.A Region 6: Spring Crop Season. Historic Sown & Harvested Area And Production (And main events
affecting crops)
Figure. 2.B. Region 6. Spring Crop Season. Historic annual average paddy yields & seasonal rainfall
0
10,000
20,000
30,000
40,000
50,000
60,000
0
10,000
20,000
30,000
40,000
50,000
60,000
70,000
80,000
90,000
100,000
AREA (acres)
PRODUCTION. (MT)
SOWN AREA (acres ) HARVEST AREA (acres ) PRODUCTION ( MT)
FLOOD DROUGHT BLAST DRY SPELL PADDY BUGS
0
200
400
600
800
1000
1200
1400
0.0
5.0
10.0
15.0
20.0
25.0
30.0
35.0
RA
INFALL (mm)
PRODUCTION. (MT)
RAINFAL L ( mm./season) YIELD /SOWN A REA ( Bags/acr e) YIELD /SOWN TREND ( Bg /acr e)
FLOOD DROUGHT BLAST DRY SPELL PADDY BUGS
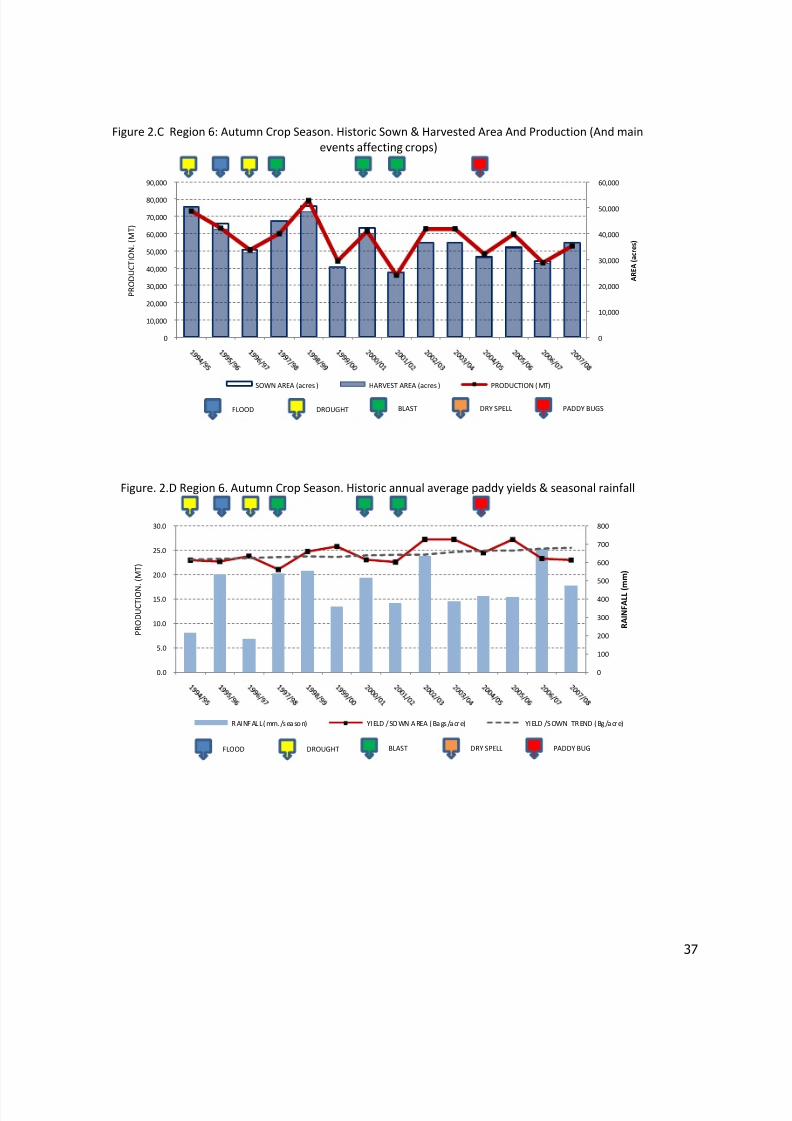
8/7/2019 WorldBank – Guyana Rice Supply Chain Risk Assessment – May 2010
http://slidepdf.com/reader/full/worldbank-guyana-rice-supply-chain-risk-assessment-may-2010 37/40
37
Figure 2.C Region 6: Autumn Crop Season. Historic Sown & Harvested Area And Production (And main
events affecting crops)
Figure. 2.D Region 6. Autumn Crop Season. Historic annual average paddy yields & seasonal rainfall
0
10,000
20,000
30,000
40,000
50,000
60,000
0
10,000
20,000
30,000
40,000
50,000
60,000
70,000
80,000
90,000
AREA (acres)
PRODUCTION. (MT)
SOWN AREA (acres ) HARVEST AREA (acres ) PRODUCTION ( MT)
FLOOD DROUGHT BLAST DRY SPELL PADDY BUGS
0
100
200
300
400
500
600
700
800
0.0
5.0
10.0
15.0
20.0
25.0
30.0
RAINFALL (mm)
PRODUCTION
. (MT)
RAINFAL L ( mm./season) YIELD /SOWN A REA ( Bags/acr e) YIELD /SOWN TREND ( Bg /acr e)
FLOOD DROUGHT BLAST DRY SPELL PADDY BUG
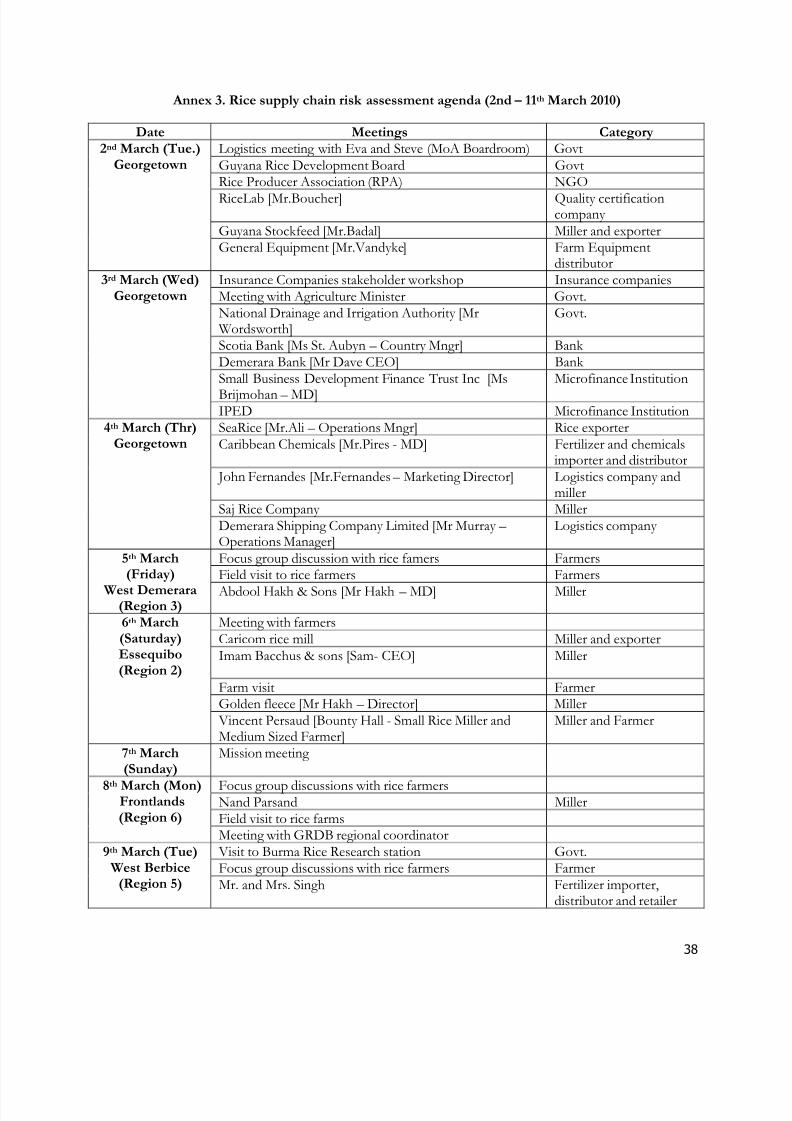
8/7/2019 WorldBank – Guyana Rice Supply Chain Risk Assessment – May 2010
http://slidepdf.com/reader/full/worldbank-guyana-rice-supply-chain-risk-assessment-may-2010 38/40
38
Annex 3. Rice supply chain risk assessment agenda (2nd – 11th March 2010)
Date Meetings Category2nd March (Tue.)
GeorgetownLogistics meeting with Eva and Steve (MoA Boardroom) GovtGuyana Rice Development Board GovtRice Producer Association (RPA) NGO
RiceLab [Mr.Boucher] Quality certificationcompany
Guyana Stockfeed [Mr.Badal] Miller and exporterGeneral Equipment [Mr.Vandyke] Farm Equipment
distributor3rd March (Wed)
GeorgetownInsurance Companies stakeholder workshop Insurance companiesMeeting with Agriculture Minister Govt.National Drainage and Irrigation Authority [MrWordsworth]
Govt.
Scotia Bank [Ms St. Aubyn – Country Mngr] Bank Demerara Bank [Mr Dave CEO] Bank Small Business Development Finance Trust Inc [Ms
Brijmohan – MD]
Microfinance Institution
IPED Microfinance Institution4th March (Thr)
GeorgetownSeaRice [Mr.Ali – Operations Mngr] Rice exporterCaribbean Chemicals [Mr.Pires - MD] Fertilizer and chemicals
importer and distributorJohn Fernandes [Mr.Fernandes – Marketing Director] Logistics company and
millerSaj Rice Company MillerDemerara Shipping Company Limited [Mr Murray – Operations Manager]
Logistics company
5th March(Friday)
West Demerara(Region 3)
Focus group discussion with rice famers FarmersField visit to rice farmers Farmers
Abdool Hakh & Sons [Mr Hakh – MD] Miller
6th March(Saturday)Essequibo(Region 2)
Meeting with farmersCaricom rice mill Miller and exporterImam Bacchus & sons [Sam- CEO] Miller
Farm visit FarmerGolden fleece [Mr Hakh – Director] MillerVincent Persaud [Bounty Hall - Small Rice Miller andMedium Sized Farmer]
Miller and Farmer
7th March(Sunday)
Mission meeting
8th March (Mon)Frontlands(Region 6)
Focus group discussions with rice farmersNand Parsand MillerField visit to rice farmsMeeting with GRDB regional coordinator
9th March (Tue)West Berbice
(Region 5)
Visit to Burma Rice Research station Govt.Focus group discussions with rice farmers FarmerMr. and Mrs. Singh Fertilizer importer,
distributor and retailer
8/7/2019 WorldBank – Guyana Rice Supply Chain Risk Assessment – May 2010
http://slidepdf.com/reader/full/worldbank-guyana-rice-supply-chain-risk-assessment-may-2010 39/40
39
Mahicony rice mill Miller and exporter10th March (Wed.)
GeorgetownGRDB [Ricky] & RPA [Ricky] GRDB and RPABank of Guyana [Mr Ganga – Deputy Governor) Central Bank Presentation preparation
11th March(Thur.)
Georgetown
Wrap up workshopMeeting with finance minister
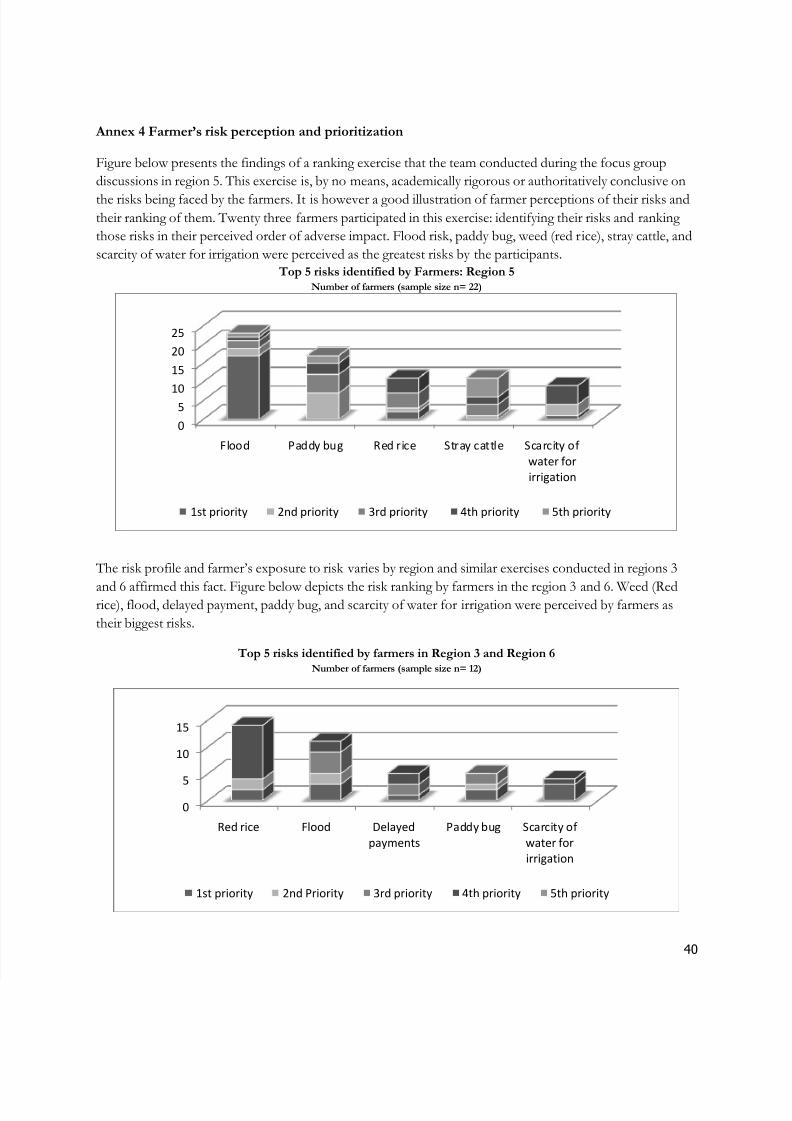
8/7/2019 WorldBank – Guyana Rice Supply Chain Risk Assessment – May 2010
http://slidepdf.com/reader/full/worldbank-guyana-rice-supply-chain-risk-assessment-may-2010 40/40
Annex 4 Farmer’s risk perception and prioritization
Figure below presents the findings of a ranking exercise that the team conducted during the focus group
discussions in region 5. This exercise is, by no means, academically rigorous or authoritatively conclusive on
the risks being faced by the farmers. It is however a good illustration of farmer perceptions of their risks andtheir ranking of them. Twenty three farmers participated in this exercise: identifying their risks and ranking
those risks in their perceived order of adverse impact. Flood risk, paddy bug, weed (red rice), stray cattle, and
scarcity of water for irrigation were perceived as the greatest risks by the participants.Top 5 risks identified by Farmers: Region 5
Number of farmers (sample size n= 22)
The risk profile and farmer‟s exposure to risk varies by region and similar exercises conducted in regions 3
and 6 affirmed this fact. Figure below depicts the risk ranking by farmers in the region 3 and 6. Weed (Redrice), flood, delayed payment, paddy bug, and scarcity of water for irrigation were perceived by farmers as
their biggest risks.
Top 5 risks identified by farmers in Region 3 and Region 6Number of farmers (sample size n= 12)
0
510
15
20
25
Flood Paddy bug Red rice Stray cattle Scarcity of
water for
irrigation
1st priority 2nd priority 3rd priority 4th priority 5th priority
0
5
10
15
Red rice Flood Delayed
payments
Paddy bug Scarcity of
water for
irrigation
1st priority 2nd Priority 3rd priority 4th priority 5th priority


![[WorldBank] Qualitative Data](https://img.pdfslide.us/doc/110x75/577c7b911a28abe05497f7cb/worldbank-qualitative-data.jpg)