Embed Size (px)
Citation preview

ResonanceCo.com/BestCityBrands
S EC R E TS O F
T H E TO P 10 C I T I ES
P. 0 6
I N D I V I D UA L
CAT EG O RY R A N K I N G S
P. 11
T H E F U L L
C I T Y- BY- C I T Y L I ST
P. 19
WORLD’S BEST CITY BRANDSA Global Ranking of Place Equity

ResonanceCo.com
Resonance Consultancy creates development strategies, plans, policies and brands that shape the future of places around the world.
We have advised developers, destinations, and governments in more than 75 countries.
We provide these leading public and private sector organizations with research, visioning, strategic planning, development strategy and brand storytelling to enhance their economic prosperity, sustainability and resiliency.
To learn more, visit ResonanceCo.com
HELLO THERE.
PA G E 2 W O R L D ’ S B E S T C I T Y B R A N D S

R E S O N A N C E C O . C O M P A G E 3
Why city brands—and their place equity—matter more than ever.
Places are powerful. Neighborhoods, cities and nations create energy and excitement. Places connect us to one another in ways that online worlds cannot. Today, the idea of place and
its relative quality play growing roles in our prosperity as well.
Famed urbanist Jane Jacobs once described the purpose of cities simply and succinctly as a means to create wealth. Cities that do not cannot sustain or improve their citizens’ quality of life.
The wealth of cities and nations has historically been determined primarily by location: climate, access to resources, ports and proximity to other centers of trade.
For centuries, advantages in one or more of these areas attracted capital and investment, created jobs and sustained prosperity. But in the past few decades, developed economies have shifted from manufacturing to service and technology, lessening geography’s impact on economic success.
Increasingly, reputation, identity and the perceived quality of place determine where talent, capital and tourism flow.
The Resonance 2017 World’s Best City Brands Report benchmarks places using a unique combination of core statistics and visitor perception metrics from a range of social media. This helps global cities understand their strengths and weaknesses through the lens of the people who matter most—visitors and residents. Turn the page for more on our proprietary methodology.
As research by Resonance Consultancy and others has shown, perception of place is influenced by a wide range of factors: the quality of the natural environment; parks and open spaces; diversity of people; safety; economic prosperity; variety of restaurants and nightlife; and the quality of the arts and culture. These assets and many others shape the perception and identity of places in the minds of people when evaluating places to live, visit or invest.
We developed the Resonance Place Equity Index to quantify and benchmark the relative quality of place, reputation and competitive identity for global cities with metropolitan populations of 2 million or more and capital cities with metropolitan populations of 1 million or more by analyzing and comparing six key factors using the data sources detailed in the individual category rankings.
We hope you find this exclusive global ranking informative and inspiring. Please connect with us to discuss city and place branding any time at ResonanceCo.com.

PA G E 4 W O R L D ’ S B E S T C I T Y B R A N D S
Proprietary Resonance research evaluates each qualifying city across the six pillars of place equity: Place, Product, Programming, People, Prosperity and Promotion. The performance of the Top 100 city brands in this report is summarized in radar charts. Each hexagon in a radar chart represents a category of a city’s place equity.
THE RESONANCE RANKING

R E S O N A N C E C O . C O M P A G E 5
Over the past decade, Resonance Consultancy has undertaken destination assessments and
development strategies for a wide range of communities, cities and countries. The more we researched, the more we understood that traditional performance indicators, like economic output, investment and visitors don’t reveal the whole story to cities and their tourism and economic development agencies.
Our team became interested in the way visitors and citizens themselves influence the identity and perception of cities. Increasingly, they do it through their evaluation of experiences on social media and via the
Methodology
comments, images and reviews they share with family, friends and people around the world. These opinions and attitudes, much more than traditional marketing, influence the way people perceive places today.
Our methodology has been developed to rank cities based on a relative performance. The data was collected during Q3 2016. Note that city rankings are based on the most current data available. As our study is based on publicly-available information, national or regional data is used as a proxy for city data in some limited cases.
Resonance evaluated global principal cities with a metropolitan population of 2 million
A city’s Place Equity Ranking is calculated over six categories and measures the perceived appeal of a city in which to live, invest or visit.
or more and capital cities with a population of 1 million or more, of which we ranked the Top 100 cities in the world. Principal cities are defined as the largest city in each urban area. For each of the ranked cities, our Place Equity Index considers both statistical performance and qualitative evaluations by locals and visitors in 20 areas that we have grouped into the six core categories below.
P L A C E Perceived quality of a city’s natural and built environment
P R O D U C T
A city’s key institutions,
attraction and infrastructure
P R O G R A M M I N G The arts, culture and entertainment in a city
P E O P L E Immigration and diversity of a city
P R O S P E R I T Y Employment, GDP per capita and corporate head offices
P R O M O T I O N Quantity of articles, references and recommendations online

P A G E 6 W O R L D ’ S B E S T C I T Y B R A N D S
The sophistication of the world’s tourists has finally caught up to London. Travelers have always
sought out best-in-class embodiments of their values and interests. London, right now, is a tight, highly curated Venn diagram of multi-ethnic revelry, enviable luxury retail, coveted universities and colleges (more than 40 institutions of higher education are based in the city), and—finally!—the restaurants to sate the palates of these curious global wanderers.
Given the record volume of visitors streaming into the city—the 31.5 million in 2015 was a 20% increase from five years earlier and 2016 was even better—no other city generates more online reviews, according to our Promotion filter, and no other city surfaces as much content online for visitors. Only happy to feed the curiosity is London & Partners, the official city marketing department founded in 2011 by the Mayor of London and commercial partners to harness the Olympic spotlight. The single point of branding has finally given the city sophisticated and consistent marketing at a time when it matters more than ever.
Arrivals are also easier than anywhere else on earth. London ranked first for Product due to its world-leading Airport Connectivity to the rest of the globe,
The Global Top 10 City Brands
The ‘Capital of Capitals’ reigns atop the planet’s city brands, sparked by the 2012 Summer Games and a coordinated effort to harness the global obsession ever since.
1. LONDON
L O N D O N ’ S F I N A N C I A L D I S T R I C T
with its five local airports—including a recently approved Heathrow expansion—ensuring a steady stream of bankers, real estate tourists, entrepreneurs and wide-eyed students.
Last summer’s Brexit vote certainly side-swiped London’s reputation for inclusivity, but given that the brand is more global city-state than Britain’s capital, it will only come back brighter from adversity.
POP: 13,879,757 | METRO: 8,382 km2
A closer look at the attributes and place equity of this year’s top-ranking cities.

R E S O N A N C E C O . C O M P A G E 7
Few cities have achieved as much, as quickly as the city-state of Singapore in the past 50 years.
The meteoric rise from politically unstable, resource-poor and unskilled ex-colony to the talent- and capital-hungry shipping hub (the world’s busiest) and, subsequently, Asia’s wealth management capital is brand engineering at its most ambitious.
Singapore topped all cities in our Prosperity ranking, with miniscule unemployment (ninth overall), a growing cluster of Global 500 companies (29th overall) and high per capita GDP (35th overall). It also ranked second for Place due to its second-lowest crime rate in our rankings, plentiful sun (ninth) and top 40 finishes for sites and landmarks, and parks and outdoors. Its recently announced $2.77-billion Research, Innovation and Enterprise Plan 2020 aims to duplicate Nordic and Israeli innovation in addition to the financial dominance.
No other city elicits more visceral reactions—from giddy anticipation to fond recollection—than
America’s largest. In many ways, NYC has an unfair advantage, with two centuries of thoughtful exposure in books, film, music and art that sings its praises and surfaces its charms to the world. But the city that embodies the American dream more than any other hustles to reap what it’s sown. Relentless stewardship of the Programming space, ranked third overall globally, driven by a first-overall Shows and Concerts ranking (thanks, Hamilton), and second-overall Shopping and Nightlife, is outdone only by the city’s second-overall ranking in Promotion (volume of online reviews and content). NYC & Company, the newly redesigned tourism and marketing organization, keeps things curated with a design staff much larger than that of most multinationals in town.
With the City of Light in collective darkness over the terrorist killing of 130
Parisian concertgoers in late 2015, the cover of Charlie Hebdo, the city’s satirical magazine, channeled the Parisian’s peerless resoluteness to live and love enlightened: over a bullet-riddled reveler drinking, and leaking, champagne were the words ‘They have weapons. F— them. We have champagne’. Global travelers raised a glass to that sentiment, spiking visitor numbers back to pre-attack levels by the time EURO 2016 rolled into town in June. The resilience is captured in the city’s top ranking in our Product category. Paris scored second globally in Airport Connectivity, fourth in Convention Space and fifth in quality of Museums. Infrastructure investment has also sped up, with six new hotels opened in the past year as well as, poetically, a new 600-seat concert hall right on the Seine called FLOW Paris.
2. SINGAPORE 3. NEW YORK 4. PARISAsia’s financial powerhouse turns its ambition to livability and innovation.
The openness, density and creative heritage celebrate the potential of urbanism.
A commitment to haute everything keeps Paris in the hearts of destination seekers.
L U X U R Y A N D I N D U S T R Y C E N T R A L PA R K E L E VAT E D L I V I N G
POP: 5,664,322 | METRO: 719.1 km2 POP: 20,182,305 | METRO: 34,490 km2 POP: 12,405,426 | METRO: 17,174.4 km2

P A G E 8 W O R L D ’ S B E S T C I T Y B R A N D S
5. SYDNEY 6. AMSTERDAM 7. LOS ANGELES
B O N D I B E A C H C A N A L A R C H I T E C T U R E D O W N T O W N S U N S E T
If Sydney weren’t so (relatively) isolated, chances are it would be challenging Paris and London for visitor number
supremacy. It’s the laidback, safe and sunny manifestation of the good life. Ranked third overall in our multifaceted Place category, with an impressive seventh overall in Parks and Outdoor Activities, Sydney is just getting started. The long-serving local government has committed to extensive light rail build-outs to battle increased traffic congestion, and the newly formed Greater Sydney Commission will finally centralize planning and development in the city. Meanwhile the contentious Barangaroo development commences build-out on the waterfront, and the shovels hit the dirt on the new Western Sydney Airport. Given its third overall ranking for Prosperity in our index, including third overall for per capita GDP, the investment to keep a good thing going isn’t surprising.
Surprised to see a mid-sized European capital with a fading party reputation ranked so high?
You obviously haven’t visited in a while. Not content with its raunchy, pot- and prostitution-fueled rep (and the tourist ‘quality’ it drew), Amsterdam doubled down on its rich architecture, mobility and anti-authoritarian confidence. That’s why new museums open annually, the most recent being the Warhol and Banksy-stuffed Moco. And why a repurposed semi-suburban Shell complex is now the A’DAM Tower, complete with 24/7 music and dining... and the city’s priciest hotel room. The airport boasts an outpost of the lauded Rijksmuseum, testament to the city’s ranking of sixth overall in Product, including sixth globally in Airport Connectivity and 17th overall for Museums. The airport will keep growing, with current additions and a new terminal in 2023, all to accommodate the four-fold increase in city visitors over the past 20 years.
How does a city brand composed of 88 municipalities resonate? If you’re L.A., you start taking
care of your heart. Long a hollowed-out afterthought for visitors preferring sunscreen to street life, Downtown Los Angeles is doing the unthinkable: creating acres of streetscape meant for pedestrians. The city will likely eclipse its seventh overall ranking for Product, including improving on its current 20th ranking for Museums. Grand Park, opened in 2012 at the foot of iconic Bunker Hill, is now a must-see with the new Diller Scofidio + Renfro-designed Broad Museum. Taste-making pioneers Standard Hotel and the Ace Hotel are being joined by no fewer than $3 billion of new hotel and residential projects. Even the neglected Los Angeles River is being redeveloped in the next few years by none other than Frank Gehry.
Friendly, warm and rich, Sydney is a beauty with a growing line of suitors.
A relentless optimization of city assets gives Amsterdam authenticity to spare.
The land of fantasy, suntans and traffic is looking inward and finding its soul.
POP: 4,921,000 | METRO: 12,367.7 KM2 POP: 2,332,773 | METRO: 2,580.3 km2 POP: 13,340,068 | METRO: 12,562 km2

R E S O N A N C E C O . C O M P A G E 9
8. TOKYO 9. SAN FRANCISCO 10. TORONTO
T O K Y O ’ S L I T T L E D E TA I L S G O L D E N G AT E B R I D G E C I T Y B Y A L A K E
Tokyo’s round-the-clock kinetic mobility, innovation and efficiency mesmerize global visitors. But it’s
only when the motivation for this legendary engineering and grand design is considered that another characteristic emerges: resilience—in the face of nuclear radiation, earthquakes, tsunamis and, in the past five years, all three simultaneously. Today, with an unprecedented commitment to sustainable development—and the goal to reduce citywide greenhouse emissions by 25% from 2000 levels—the 2020 Tokyo Olympic Games will speed Tokyo’s race back to the pinnacle of urban livability for its residents. The new investment will complement an already exceptional ranking in our Programming category, led by the best overall global Restaurants ranking and a fifth overall finish for Shopping. Equally impressive is the fifth overall Product category ranking, powered by top five finishes in museum quality and entertainment options.
Its unofficial tagline of “Everybody’s Favorite City” may seem inflated, but only to those who’ve never been.
Perhaps it’s the Golden Gate Bridge glowing against the shifting Pacific fog that gets you, or the realization that even the geology has an algorithm, with 49 hills within the seven-by-seven mile grid. Long a vanguard of global counterculture, San Francisco is now defining the mainstream, often with the innovation dreamt up in Silicon Valley 45 minutes south first tested on its streets. Dreamers have long sought their fortune here, and the city ranks eighth globally in our Prosperity category with the seventh highest GDP per capita in the world and 14th most Fortune 500 companies headquartered here. Happily, nature still resonates, with the city ranking 16th globally in our Place category, led by Parks and Outdoor Activities and Air Quality.
Canada’s largest city has always been a hedge for people and capital—from English companies
moving here in the ‘70s from Francophone Montréal to immigrants seeking a foothold to start a better life. The thing about welcoming everyone is that many appreciate the hospitality and never leave, creating a diversity of individuals that blends into a unified critical mass. With 46% of its population foreign-born, Toronto powered into the Top 10 based on its fifth overall ranking in our People category. The city’s open doors, combined with its financial density (with a Fortune 500 head office ranking of eighth) has resulted in unprecedented downtown density and local swagger, egged on by real estate wealth and whatever nickname Drake gives his beloved hometown this week.
The ancient capital seizes an opportunity to transcend recent calamity and host the world.
Beautiful, witty and influential, San Francisco just keeps getting more sublime.
The City of Neighborhoods becomes the the City of Nations and attracts the world.
POP: 37,800,000 | METRO: 13,572 km2 POP: 4,656,132 | METRO: 6,410 km2 POP: 6,055,724 | METRO: 5,905.7 km2

06
PA G E 1 0 W O R L D ’ S B E S T C I T Y B R A N D S

R E S O N A N C E C O . C O M PA G E 1 1
THE SIX PILLARS OF PLACE EQUITY

P A G E 1 2 W O R L D ’ S B E S T C I T Y B R A N D S
Our most layered category quantifies a city’s elusive sense of place.
Both the natural and the built environment of a city are key factors in shaping our perception of a
destination. From how often the sun shines, to the air quality, to the safety of the streets, a number of readily measurable, often-cited factors influence our perceptions of a city.
Less easy to quantify are the relative natural beauty and quality of the built environment in a city or destination. Placemaking is an approach to urban design that considers the built environment as a vehicle for creating a sense of place and fostering community within a destination. Whether through the beauty of their natural environment or urban design, exceptional physical places exist in destinations ranging from metropolitan centers to suburbs and islands.
To gauge the relative attractiveness of a city’s placemaking, Resonance identifies the number of Very Good and Excellent local- and traveler-recommended neighborhoods, landmarks, parks and outdoor activities on TripAdvisor for each destination.
Lisbon’s Enviable Lifestyle That Lisbon scored first in the Place category, yet didn’t place in our Top 10, speaks volumes about the Portuguese capital’s lead in safety, climate and local pride over other cities. The Mediterranean climate is well documented, as is the welcoming spirit of Lisbon’s millennia-old crossroads. But it’s the reinvention of its port and industrial lands, ignited by Expo ’98, that bolsters its much older, pedestrian-focused streetscape and enchants new and returning visitors.
Place
Top 15 City Brands for Place
1. LISBON
2. SINGAPORE
3. SYDNEY
4. BARCELONA
5. MADRID
6. ROME
7. TOKYO
8. HONG KONG
9. SAN DIEGO
10. LONDON
11. BANGKOK
12. NEW YORK
13. PARIS
14. MELBOURNE
15. BRISBANE
1. World Health Organization2. National Climatic Data Center - Weatherbase3. Office for National Statistics
Office for Regional Statistics Official police records UN Office on Drugs and Crime International homicide statistics Eurostat Mexican Citizens’ Council for Public Security and Criminal Justice
4. TripAdvisor5. TripAdvisor
Factors considered in each destination’s overall Place ranking are...
• Average air quality index1
• Average number of sunny days2
• Homicide rate3
• Number of Very Good and Excellent neighborhoods and landmarks recommended by locals and visitors4
• Number of Very Good and Excellent parks and outdoor activities recommended by locals and visitors5
TA K I N G T R A N S I T I N L I S B O N

R E S O N A N C E C O . C O M P A G E 1 3
A ranking of the ‘hardware’ of a city—often the most difficult metric for cities to get right.
“Moscow’s leadership here shouldn’t be surprising, given the sheer number of cultural institutions.”
A city’s infrastructure and institutions shape its identity via the quantity, quality and reputation of
‘products’ such as institutions of higher learning, museums, convention centers and airports. University rankings and the number of institutional buildings can have considerable impact on reputation and are often top of mind when it comes to what outsiders know of and understand about a city or destination. Expensive and difficult to develop and maintain, exceptional ‘products’ are often found only in large cosmopolitan cities.
Museums and Mobility in MoscowWhile finishing well below high-ranking London and Paris overall, Moscow kept pace with the two cities in the Product category. Moscow’s leadership here shouldn’t be surprising, given the sheer number of cultural institutions in Europe’s most populous city (after some redrawing of the borders allowed it to pass Istanbul). Big news in the museum space includes the 120th anniversary of the Moscow Museum in 2015, with the opening of another— Gulag History State Museum—to remember the millions who perished under Stalin. The two are part of the city’s approximately 500 museums and galleries—a staggering number, even for a national capital.
Product
Top 15 City Brands for Product
1. PARIS
2. LONDON
3. MOSCOW
4. NEW YORK
5. TOKYO
6. AMSTERDAM
7. LOS ANGELES
8. SINGAPORE
9. BARCELONA
10. BERLIN
11. SHANGHAI
12. MADRID
13. ISTANBUL
14. SÃO PAULO
15. HONG KONG
Factors considered in each destination’s overall Product ranking are...
• Ranking of top local university6
• Number of direct destinations served by airport
• Size of convention center
• Number of Very Good and Excellent attractions and amusements recommended by locals and visitors7
• Number of Very Good and Excellent museums and fine arts institutions recommended by locals and visitors8
The city’s airport is also growing rapidly, with the recent approval of the Northern Terminal Complex, which will increase capacity to 55 million passengers annually—a number sure to move Moscow up from its current fourth ranking for Connectivity.
6. QS World University Rankings® 2016-2017 7. TripAdvisor 8. TripAdvisor
M O S C O W ’ S G L E A M I N G B U S I N E S S D I S T R I C T

P A G E 1 4 W O R L D ’ S B E S T C I T Y B R A N D S
This category measures the experiential pillars of a great visit: food, shows, shopping and nightlife.
“The city is a culinary hive unlike anywhere else on the continent.”
If product is the ‘hardware’ of cities or destinations, the mosaic of cultural programming and lifestyle experiences
they offer is the ‘software’ that makes them run. While individually insignificant, it is the sum of programming initiatives that fosters a community’s connection to place. To gauge the relative attractiveness of a city’s programming, Resonance identifies the number of Very Good and Excellent recommendations of culinary and cultural experiences on TripAdvisor for each destination.
Paris Enchants as the All-Consuming CityLondon may have topped both the Programming category and the overall Best City Brand (read all about it on pg. 6), but Paris was a very close second. Where Paris reigns supreme globally is in the Shopping sub-section of our Programming category—perhaps not surprising, given that this city invented department stores and mass fashion in the 1800s. Those are still there, of course, but today treasure hunters can go niche like never before—from absinthe apothecaries to parasol boutiques—with nary a chain store in sight.
Programming
Top 15 City Brands for Programming
1. LONDON
2. PARIS
3. NEW YORK
4. TOKYO
5. ROME
6. MOSCOW
7. BARCELONA
8. MADRID
9. SÃO PAULO
10. CHICAGO
11. ISTANBUL
12. BERLIN
13. PRAGUE
14. RIO DE JANEIRO
15. LOS ANGELES
Factors considered in each destination’s overall Programming ranking are...
• Number of Very Good and Excellent shopping experiences recommended by locals and visitors9
• Number of Very Good and Excellent culture and performing arts experiences recommended by locals and visitors10
• Number of Very Good and Excellent places to eat and drink recommended by locals and visitors11
• Number of Very Good and Excellent nightlife experiences recommended by locals and visitors12
Paris also ranked fourth overall globally for Restaurants, fueled by the most Michelin Stars of any city in Europe and France’s national pastime of dining out. With a half-dozen new luxury hotels and their high-profile restaurants that opened in 2016, the city is a culinary hive unlike anywhere else on the continent.
9. TripAdvisor10. TripAdvisor 11. TripAdvisor 12. TripAdvisor
P E D E S T R I A N PA R A D I S E I N PA R I S
R E S O N A N C E C O . C O M P A G E 1 5
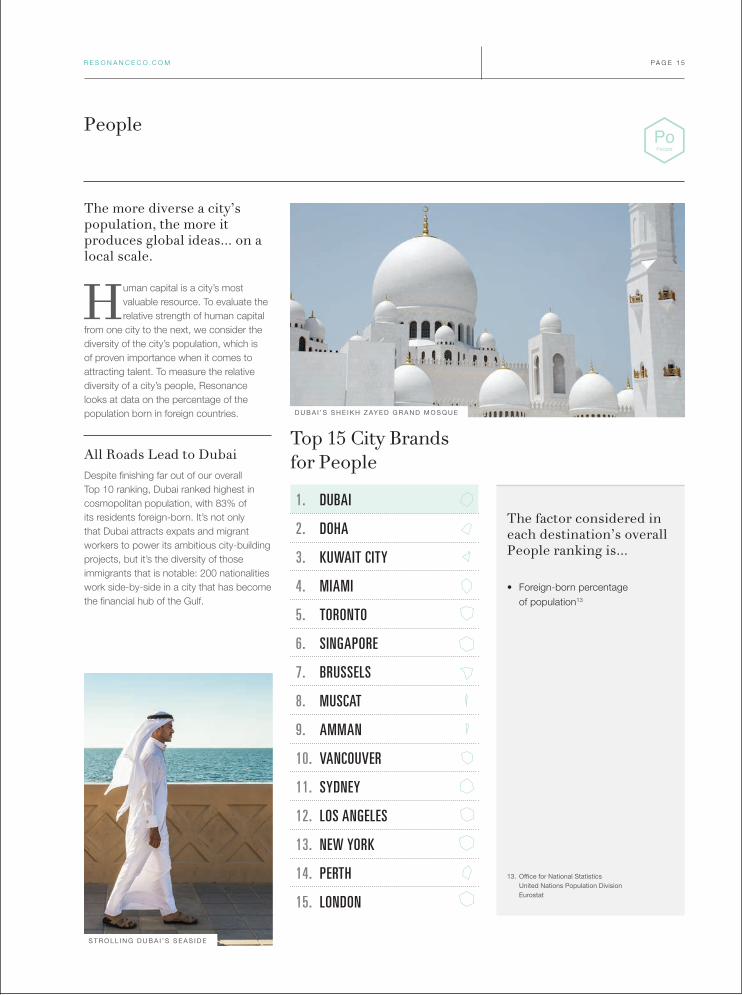
The more diverse a city’s population, the more it produces global ideas... on a local scale.
Human capital is a city’s most valuable resource. To evaluate the relative strength of human capital
from one city to the next, we consider the diversity of the city’s population, which is of proven importance when it comes to attracting talent. To measure the relative diversity of a city’s people, Resonance looks at data on the percentage of the population born in foreign countries.
All Roads Lead to DubaiDespite finishing far out of our overall Top 10 ranking, Dubai ranked highest in cosmopolitan population, with 83% of its residents foreign-born. It’s not only that Dubai attracts expats and migrant workers to power its ambitious city-building projects, but it’s the diversity of those immigrants that is notable: 200 nationalities work side-by-side in a city that has become the financial hub of the Gulf.
People
Top 15 City Brands for People
1. DUBAI
2. DOHA
3. KUWAIT CITY
4. MIAMI
5. TORONTO
6. SINGAPORE
7. BRUSSELS
8. MUSCAT
9. AMMAN
10. VANCOUVER
11. SYDNEY
12. LOS ANGELES
13. NEW YORK
14. PERTH
15. LONDON
The factor considered in each destination’s overall People ranking is...
• Foreign-born percentage of population13
13. Office for National Statistics United Nations Population Division Eurostat
D U B A I ’ S S H E I K H Z AY E D G R A N D M O S Q U E
S T R O L L I N G D U B A I ’ S S E A S I D E

P A G E 1 6 W O R L D ’ S B E S T C I T Y B R A N D S
A well-paid, economically secure citizenry facilitates stewardship and innovation.
As noted, Jane Jacobs defined cities as places that produce wealth. If they cannot generate wealth, they
cannot sustain the employment and quality of life needed to attract and retain people. In general, beliefs about the wealth and prosperity of a city are informed by statistics such as the unemployment rate and income of citizens, and they are shaped by the presence or absence of large, recognizable corporations—this despite the fact that startups and innovation increasingly drive a city’s development and economic growth. Yet these stats don’t tell the whole story: unemployment and GDP per capita are of growing concern in measuring quality of place.
Singapore Seizes Its FutureSingapore, the fast-emerging financial superpower in Asia, ranks first in our Prosperity category. Powered by its ability to evolve from the planet’s busiest transshipment hub into a commodity and foreign exchange powerhouse, the island nation has become a premier wealth management destination. Singapore’s reinvestment into research, talent and corporate headquarters recruitment ensures it will be home to a sustainably wealthy citizenry for decades to come.
Prosperity
Top 15 City Brands for Prosperity
1. SINGAPORE
2. DOHA
3. SYDNEY
4. HONG KONG
5. TOKYO
6. SEATTLE
7. MELBOURNE
8. SAN FRANCISCO
9. DUBAI
10. OSAKA
11. MUNICH
12. BEIJING
13. SEOUL
14. HOUSTON
15. MINNEAPOLIS
Factors considered in each destination’s overall Prosperity ranking are...
• Unemployment rate14
• GDP per capita15
• Number of Global 500 corporate headquarters16
14. Office for National Statistics Eurostat World Bank Statistics EURES
15. Office for National Statistics World Bank Statistics OECD Statistics UNdata International Labour Organization
16. Fortune.com
S I N G A P O R E ’ S G A R D E N S C U L P T U R E S
M A X W E L L R O A D I N S I N G A P O R E

R E S O N A N C E C O . C O M P A G E 17
A city’s ability to tell its story (and help visitors do the same) depends on how it incents and rewards sharing of experience by locals and visitors.
The amount and frequency of media coverage, online articles, references and place-based recommendations
influence our perception of cities on a daily basis, whether the news is good or bad. While larger economic centers receive the most attention, effective promotion and communication for cities can have an outsized impact on perception: medium global cities like Dublin, Vienna and Munich command more attention than their size alone would merit. Today, residents, businesses and visitors promote a city to the world more than city marketers or chambers of commerce. But cities themselves still have an important role to play in developing and managing the ever-growing numbers of communication and media channels. Successful management fosters an integrated omnichannel experience and creates consistent and aligned messaging that can encourage investment, development and visitation.
They Love New YorkLondon topped our Promotion category in addition to the overall Best City Brand (see pg. 6), but New York City was a close second. Curating official marketing is NYC & Company, the newly redesigned tourism and marketing organization that keeps things sharable and slick. More reminiscent of a newsroom than a DMO, the organization even boasts its own typefaces at NYCgo.com. Then there’s the visceral need by visitors themselves to tell their own versions of the stories they’ve grown up with, whether it’s about a stroll on the High Line or an Instagram from DUMBO on a sunny afternoon.
Promotion
Top 15 City Brands for Promotion
1. LONDON
2. NEW YORK
3. PARIS
4. MELBOURNE
5. BERLIN
6. SINGAPORE
7. AMSTERDAM
8. HONG KONG
9. MADRID
10. TOKYO
11. SYDNEY
12. WASHINGTON
13. DUBLIN
14. SAN FRANCISCO
15. TORONTO
Factors considered in each destination’s overall Promotion ranking are...
• Number of Google references for each city
• Number of TripAdvisor reviews for each city
N E W Y O R K C I T Y ’ S I C O N I C D E N S I T Y

2017
PA G E 1 8 W O R L D ’ S B E S T C I T Y B R A N D S

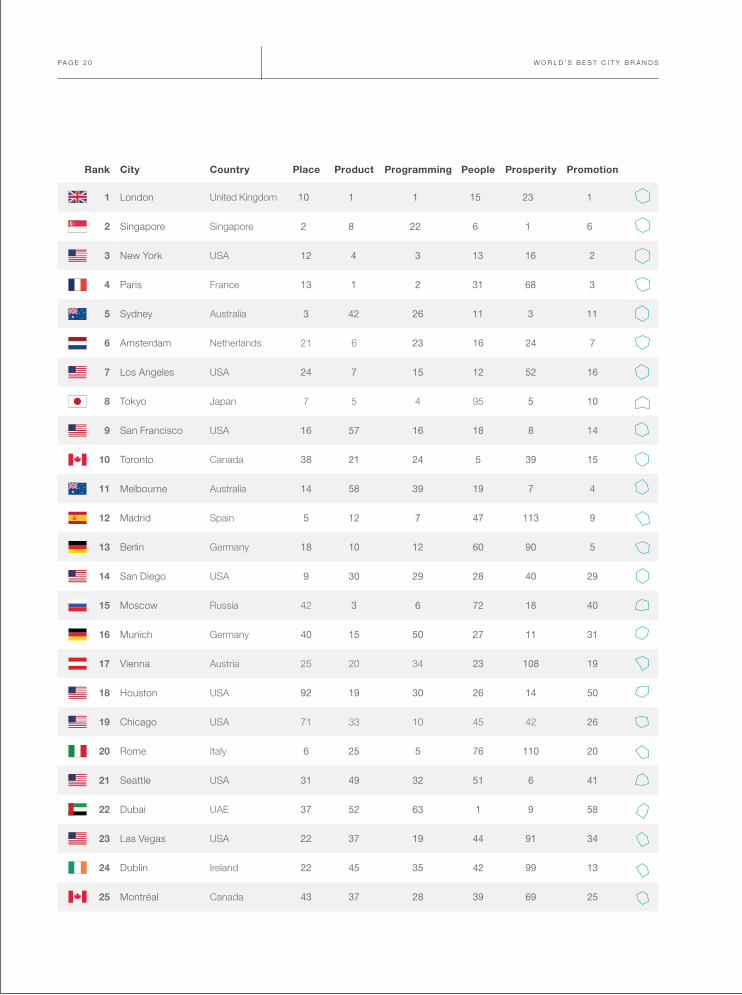
TOP 100 WORLD’S BEST CITY BRANDS
R E S O N A N C E C O . C O M PA G E 1 9
P A G E 2 0 W O R L D ’ S B E S T C I T Y B R A N D S
Rank City Country Place Product Programming People Prosperity Promotion
1 London United Kingdom 10 1 1 15 23 1
2 Singapore Singapore 2 8 22 6 1 6
3 New York USA 12 4 3 13 16 2
4 Paris France 13 1 2 31 68 3
5 Sydney Australia 3 42 26 11 3 11
6 Amsterdam Netherlands 21 6 23 16 24 7
7 Los Angeles USA 24 7 15 12 52 16
8 Tokyo Japan 7 5 4 95 5 10
9 San Francisco USA 16 57 16 18 8 14
10 Toronto Canada 38 21 24 5 39 15
11 Melbourne Australia 14 58 39 19 7 4
12 Madrid Spain 5 12 7 47 113 9
13 Berlin Germany 18 10 12 60 90 5
14 San Diego USA 9 30 29 28 40 29
15 Moscow Russia 42 3 6 72 18 40
16 Munich Germany 40 15 50 27 11 31
17 Vienna Austria 25 20 34 23 108 19
18 Houston USA 92 19 30 26 14 50
19 Chicago USA 71 33 10 45 42 26
20 Rome Italy 6 25 5 76 110 20
21 Seattle USA 31 49 32 51 6 41
22 Dubai UAE 37 52 63 1 9 58
23 Las Vegas USA 22 37 19 44 91 34
24 Dublin Ireland 22 45 35 42 99 13
25 Montréal Canada 43 37 28 39 69 25

R E S O N A N C E C O . C O M P A G E 2 1
Rank City Country Place Product Programming People Prosperity Promotion
26 Milan Italy 33 34 21 55 86 20
27 Prague Czech Republic 19 46 13 58 110 22
28 Washington USA 53 30 44 63 25 12
29 Brisbane Australia 15 69 73 24 26 29
30 Vancouver Canada 61 59 49 10 72 23
31 Miami USA 35 51 59 4 64 47
32 Barcelona Spain 4 9 7 43 133 90
33 Brussels Belgium 82 24 51 7 116 33
34 Hong Kong China 8 15 37 158 4 8
35 Bangkok Thailand 11 71 17 84 64 28
36 Hamburg Germany 46 49 43 38 32 52
37 Buenos Aires Argentina 19 47 20 65 145 18
38 Lisbon Portugal 1 44 27 70 148 44
39 Copenhagen Denmark 36 27 55 62 29 48
40 Philadelphia USA 74 22 38 67 60 46
41 Stockholm Sweden 50 26 91 39 40 35
42 Seoul South Korea 51 18 30 99 13 54
43 Boston USA 47 35 46 29 36 73
44 St. Petersburg Russia 39 23 18 78 49 78
45 Orlando USA 61 56 55 50 74 36
46 Oslo Norway 94 37 89 33 18 51
47 Frankfurt Germany 85 36 88 20 33 63
48 Athens Greece 26 48 42 34 159 48
49 Istanbul Turkey 56 13 11 96 140 43
50 Dallas USA 99 61 66 35 22 59

P A G E 2 2 W O R L D ’ S B E S T C I T Y B R A N D S
Rank City Country Place Product Programming People Prosperity Promotion
51 Beijing China 66 15 32 158 12 24
52 São Paulo Brazil 59 14 9 138 122 27
53 Manchester United Kingdom 132 62 68 30 82 36
54 Shanghai China 67 11 25 158 36 31
55 Rio de Janeiro Brazil 44 54 14 138 94 16
56 Birmingham United Kingdom 79 29 72 41 108 61
57 Portland USA 41 94 36 63 44 65
58 Denver USA 104 63 62 54 29 67
59 Budapest Hungary 29 40 46 81 137 36
60 San Antonio USA 51 86 52 61 21 68
61 Osaka Japan 49 55 40 107 10 76
62 Perth Australia 27 109 134 14 17 60
63 Mexico City Mexico 88 41 44 98 88 45
64 Tel Aviv Israel 96 74 64 32 67 86
65 Santiago Chile 65 75 41 101 91 42
66 Phoenix USA 61 65 103 46 47 71
67 Taipei Taiwan 28 53 48 108 42 81
68 Atlanta USA 98 32 57 79 45 89
69 Cologne Germany 119 66 90 37 31 88
70 Kuala Lumpur Malaysia 58 81 82 77 45 62
71 Ottawa Canada 54 112 84 48 79 55
72 Warsaw Poland 69 28 92 109 60 53
73 Mumbai India 17 72 65 125 75 57
74 Helsinki Finland 90 43 95 69 94 69
75 Minneapolis USA 130 73 78 58 14 98
R E S O N A N C E C O . C O M P A G E 2 3
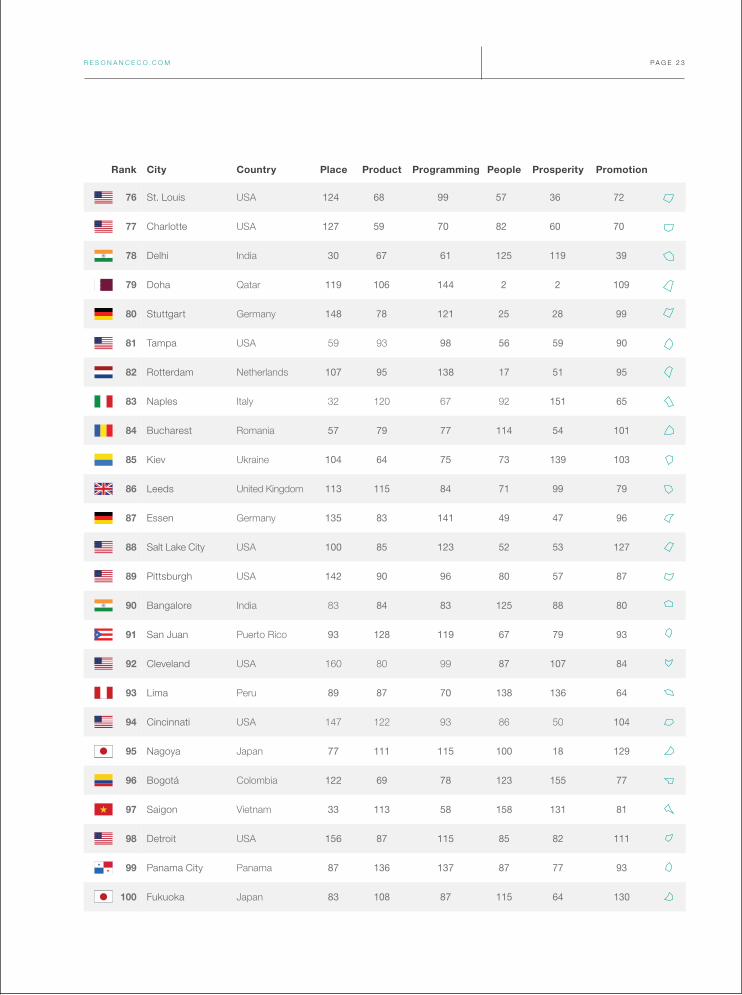
Rank City Country Place Product Programming People Prosperity Promotion
76 St. Louis USA 124 68 99 57 36 72
77 Charlotte USA 127 59 70 82 60 70
78 Delhi India 30 67 61 125 119 39
79 Doha Qatar 119 106 144 2 2 109
80 Stuttgart Germany 148 78 121 25 28 99
81 Tampa USA 59 93 98 56 59 90
82 Rotterdam Netherlands 107 95 138 17 51 95
83 Naples Italy 32 120 67 92 151 65
84 Bucharest Romania 57 79 77 114 54 101
85 Kiev Ukraine 104 64 75 73 139 103
86 Leeds United Kingdom 113 115 84 71 99 79
87 Essen Germany 135 83 141 49 47 96
88 Salt Lake City USA 100 85 123 52 53 127
89 Pittsburgh USA 142 90 96 80 57 87
90 Bangalore India 83 84 83 125 88 80
91 San Juan Puerto Rico 93 128 119 67 79 93
92 Cleveland USA 160 80 99 87 107 84
93 Lima Peru 89 87 70 138 136 64
94 Cincinnati USA 147 122 93 86 50 104
95 Nagoya Japan 77 111 115 100 18 129
96 Bogotá Colombia 122 69 78 123 155 77
97 Saigon Vietnam 33 113 58 158 131 81
98 Detroit USA 156 87 115 85 82 111
99 Panama City Panama 87 136 137 87 77 93
100 Fukuoka Japan 83 108 87 115 64 130

We hope you enjoyed this 2017 ranking of the World’s Best City Brands.
To enjoy more exclusive insights on global cities, destinations, real estate and the future of tourism and travel, please go to ResonanceCo.com/Our-Reports.
Cheers.
New York6 East 43rd St - Floor 25New York, NY 10017 P +1.347.817.7916E [email protected] ResonanceCo.com
The Resonance Report is produced for general interest only; it is not definitive. It must not be relied upon in any way. Although high standards have been used in preparing the information and analysis presented in this report, no responsibility or liability whatsoever can be accepted by Resonance Consultancy Ltd. for any loss or damage resultant from any use of, reliance on, or reference to the contents of this document. We make no express or implied guarantee of its accuracy. Please be advised that your use of The Resonance Report document constitutes your agreement to (i) use the content under a limited license only for your own internal purposes, and (ii) not disclose, publish or otherwise make public or provide the content, in whole or in part, to any third person or entity without the prior written consent of Resonance Consultancy Ltd. The content is and remains at all times the exclusive intellectual property of Resonance Consultancy Ltd. Copyright © 2017 Resonance Consultancy Ltd.
Vancouver801 - 602 W Hastings StVancouver, B.C. V6B 1P2P +1.604.681.0804E [email protected]