Embed Size (px)
Citation preview

GLOBEFISH RESEARCH PROGRAMME
Food and Agriculture Organization of the United NationsFishery Industries Division
Viale delle Terme di Caracalla00100 Rome, Italy
Tel.: +39 06 5705 6673Fax: +39 06 5705 5188
www.globefish.org
World Tuna Markets
Volume 74
Salmon - A Study of Global Supply and Demand
Wo
rld Tuna M
arketsV
olum
e 74

ACKNOWLEDGEMENTS
I would wish to thank my supervisors, Jochen Nierentz and Helga Josupeit of FAO FIIU, for their support during the preparation of the study. Other words of gratitude go to the Services of the FISH INFOnetwork (INFOFISH, INFOPÊCHE, INFOPESCA and INFOSAMAK), Ms Marcela Campa and Mssrs Chris Lischewski and Mike McGowan, Bumble Bee Seafoods, Mr Pierre Commère of the Association des Entreprises de Produits Alimentaires Elaborés (ADEPALE), Ms Rossella Marricchi, Associazione Nazionale Conservieri Ittici e delle Tonnare (ANCIT) and Dr Peter Miyake (Federation of Japan Tuna Fisheries Co-operative Association) for the information provided.
Other thanks go to Karine Boisset and Adelaide Tesei for their help during the preparation of the study and to Yvonne Davidson for her administrative assistance.
iii

TABLE OF CONTENTS 1 INTRODUCTION..................................................................................................... 1 2 GLOBAL TUNA PRODUCTION........................................................................... 2 3 THE CANNED TUNA MARKET........................................................................... 5
3.1 The EU...................................................................................................................... 6 3.1.1 France............................................................................................................... 22 3.1.2 Germany........................................................................................................... 25 3.1.3. Italy ................................................................................................................. 26 3.1.4. Spain ............................................................................................................... 30 3.1.5. The United Kingdom ...................................................................................... 35
3.2. The United States of America................................................................................ 40 3.3. Mexico ................................................................................................................... 49 3.4. Thailand, the Philippines and Indonesia ................................................................ 50 3.5. Japan ...................................................................................................................... 57 3.6. Developing countries as markets for canned tuna ................................................. 58
4 TUNA FOR DIRECT CONSUMPTION: SASHIMI AND OTHER USES ...... 62
4.1. Japan ...................................................................................................................... 63 4.2. The United States of America................................................................................ 79 4.3. The EU................................................................................................................... 83
5 CONCLUSION ....................................................................................................... 89
5.1.1. The canned tuna market ...................................................................................... 89 5.1.2. The market of tuna for direct consumption......................................................... 91
REFERENCES................................................................................................................ 92 APPENDIX I: List of main tuna producers, importers and exporters...................... 99 APPENDIX II: Latest import regulations affecting tuna products ......................... 126
iv

1 INTRODUCTION The most important species of tuna from a commercial point of view are skipjack tuna (Katsuwonus pelamis), albacore, or longfin tuna (Thunnus alalunga), yellowfin tuna (Thunnus albacares), Southern bluefin tuna (Thunnus maccoyii), bigeye tuna (Thunnus obesus), Pacific bluefin tuna (Thunnus orientalis), and Atlantic bluefin tuna (Thunnus thynnus). The species utilized for canning are skipjack, yellowfin and albacore. Because of the colour of the meat, canned skipjack and yellowfin are also known as “light meat tuna”, while canned albacore is also known as “white meat tuna”. Skipjack is also marketed in Japan in dried and smoked form (fushi). In turn, the main species utilized in the sashimi market are bigeye and the three bluefin species, but also high quality yellowfin caught by longliners. Albacore is also increasingly used in the sashimi market. Furthermore, in Japan, about 100 000 tonnes of skipjack are consumed in sashimi form or takami per year. The present report provides an overview of the global tuna market, with a focus on tuna supply, international demand (imports) and prices. In the report, tuna production is analysed in chapter 2. Canned tuna markets are analysed in chapter 3, and markets of tuna for direct consumption are analysed in chapter 4. In the conclusive chapter the potential for expansion of the tuna market is explored. Furthermore, an overview of the development of different tuna products and expected trends is given. The appendices to the study include a list of producers, exporters and importers of tuna and the latest import regulations affecting tuna commodities.

2 GLOBAL TUNA PRODUCTION This chapter provides an overview of the development of tuna production from capture fisheries as well as some information on the most recent developments in tuna farming. According to FAO FISHSTAT Plus (hereinafter: FISHSTAT +), captures of commercial tuna species increased from 403 050 tonnes in 1950 to more than 4 million tonnes in 2002 (Figure 2.1); the total catch of commercial tuna species represented 70 percent of total catches of tunas and billfishes during the 1950-2002 period. According to FISHSTAT + data, the main fishing grounds for commercial tuna species are located in the Pacific Ocean, which provided about 70 percent of catches of commercial tuna during the 1950-2002 period.
World catches of commercial tuna species, 1950-2002
0
500 000
1 000 000
1 500 000
2 000 000
2 500 000
3 000 000
3 500 000
4 000 000
1950 1954 1958 1962 1966 1970 1974 1978 1982 1986 1990 1994 1998 2002
year
tonn
es
Figure 2.1. World catches of commercial tuna, 1950-2002 (source: FISHSTAT +)
The main captured species are skipjack and yellowfin, followed by bigeye, albacore and the three bluefin species (Figure 2.2).
2

World catches of commercial tuna by species, 1950-2002
0
200 000
400 000
600 000
800 000
1 000 000
1 200 000
1 400 000
1 600 000
1 800 000
2 000 000
1950 1954 1958 1962 1966 1970 1974 1978 1982 1986 1990 1994 1998 2002
year
tonn
es
Skipjack tuna
Yellow fin tuna
Bigeye tuna
Albacore
Atlantic, Pacif ic andSouthern bluefin tunas
Figure 2.2. World catches of commercial tuna by species, 1950-2002 (source: FISHSTAT +) The main tuna fishing entities are Japan, Taiwan Province of China, Indonesia, Spain and the Republic of Korea (Table 2.1). The European fleets are mainly composed by purse seiners mostly targeting yellowfin and skipjack destined to the canned tuna market, while the Asian fleets are composed by both longliners (targeting bigeye and yellowfin for the sashimi market) and purse seiners. Table 2.1. Main tuna catching countries/entities, quantity (tonnes), 1996-2002 (source: FISHSTAT +)
Country/Entity 1996 1997 1998 1999 2000 2001 2002 Japan 547 352 629 953 688 864 598 189 621 458 564 476 560 754 Taiwan Province of China 382 324 354 100 459 720 405 060 435 946 439 251 495 855 Indonesia 332 462 347 536 392 031 429 651 419 512 387 866 406 175 Spain 262 716 258 196 233 896 306 428 289 456 254 004 277 453 The Republic of Korea 195 883 212 147 255 346 182 036 218 197 230 510 257 570 The Philippines 171 284 177 439 199 884 204 231 206 380 190 836 211 964 Other nei 146 871 140 011 170 589 188 096 190 703 180 151 208 030 France 163 605 136 967 125 783 153 197 151 937 136 025 161 230 Mexico 150 375 165 995 135 528 143 559 120 422 144 717 160 151 The United States 206 437 205 241 216 849 217 184 152 361 149 743 154 153
3
Atlantic bluefin tunas, Pacific bluefin tunas and Southern bluefin tunas are commercially ranched (the so-called “penning” or “fattening”), mainly for the Japanese sashimi market. Generally, the fish are caught in the summer and harvested four to six months later, by which time they would have fattened by 15 to 30 percent of their original weight. Their harvest normally takes place during the main consuming period in Japan, the end of the year, which brings the highest prices for sashimi. The main Atlantic bluefin tuna farms are located, inter alia, in Spain, Italy, Malta, Turkey, Libya, Tunisia and Croatia. At present, 12 tuna farms operate in the Mediterranean region, with many of them being subsidised by the European Union (EU). Aquaculture statistics featured in FISHSTAT + provide very limited data and estimates on the production of farmed tuna, due to the hybrid nature of tuna farming, which cannot be defined neither as catch nor as aquaculture fishery. However, total production of the tuna ranching industry in 2002 was estimated to be 5 000 tonnes in Spain, 4 000 tonnes in Croatia, 2 000 tonnes in Turkey, 1 800 tonnes in Italy and 1 000 tonnes in Malta. According to FISHSTAT + data, in 2002 Australia was estimated to produce some 8 000 tonnes of farmed Southern bluefin for the Japanese sashimi market. Imports of wild-caught tunas are mainly concentrated in spring, from February to June, as pre-spawning bluefin can fetch an extremely high price in the Japanese market. In turn, bluefin tuna farmers target the winter period to market their tunas. In the winter, sashimi consumption is particularly high as a consequence of the New Year festivities. It is estimated that during the 1997-2002 period, imports of farmed bluefin tuna from the Mediterranean rose from almost nil to 70 percent of total imports of bluefin tuna by Japan from the Mediterranean. The harvesting of bluefin tunas is often subject to catch quotas; their trade is subject to monitoring and certification. The Regional Fishery Bodies and Arrangements (RFBAs) managing Atlantic, Pacific and Southern bluefin captures and monitoring trade in those species are the International Commission for the Conservation of Atlantic Tunas (ICCAT) and the Commission for the Conservation of Southern Bluefin Tuna (CCSBT)1.
1 Bluefin tunas are subject to catch quotas. However, as tuna fattening is considered a post-harvest practice, it does not fall within the regulatory framework on bluefin quotas set by bodies such as the ICCAT and the CCSBT. Furthermore, live bluefin trade may sometimes escape international and regional monitoring. In fact, sometimes bluefin tunas are traded live after capture, and farmed in other countries’ waters. While some countries request import certificates for live bluefin trade on the basis of what the implementation of the ICCAT Bluefin Statistical Document (BSD) and the CCSBT Trade Information Scheme (TIS) requests for trade in fresh, chilled and frozen bluefins, other countries do not ask for such certificates.
4

3 THE CANNED TUNA MARKET Canned tuna is one of the most widespread and recognizable fish commodities in the world. The first records of tuna preserved in oil date back to XV century Andalusia. In 1903, the first tuna to be canned in tin was albacore Thunnus alalunga in Southern California, as a consequence of a shortage of sardines for canning. The species generally utilized for canning are skipjack, yellowfin and albacore. Because of the colour of the meat, canned skipjack and yellowfin are also known as “light meat tuna”, while canned albacore is also known as “white meat” tuna. Among the range of canned tuna products, canned white meat tuna from albacore is a luxury product with a distinctive taste. The best quality of light meat tuna is ensured by yellowfin, whose flesh is more solid and produces less waste than that of skipjack. Yellowfin and skipjack for canning are generally caught by purse seiners or pole and line vessels; albacore for canning is generally caught by trolling. After capture, there are different steps to process tuna for canning. When the fish are unloaded from the vessel they are thawed in running water or through sprays of water. The fish are then quickly gilled, gutted, headed and frozen or chilled. After cutting, the tunas are loaded into trays and taken to the pre-cooker. After pre-cooking and cooling, the cleaners remove the skin from the fish and separate the loins from the skeleton. The last step, canning, is a totally automated process. Canned tuna products are packed in oil, brine, spring water, sauce, vegetable broth or in “tuna salad” form. Once the cans are sealed, they are cooked a second time (“retort cooking”), for two to four hours. After the retort cooking, the cans are cooled, labelled, and finally packed into cardboard cases for distribution. It is a relatively common practice by the EU and United States’ tuna industry to undertake all the processing stages up to tuna loining as close as possible to the landing areas in developing countries and to export the semi-processed product (frozen pre-cooked tuna loins for canning) to canneries in developed countries. Thus, the internationally traded tuna raw material for canning takes the following forms:
whole (or round), headed and gutted (H&G), frozen; • • •
• •
pre-cooked loins, frozen; whole (or round) and H&G, fresh and chilled (in minor percentage).
Internationally traded canned tuna may be:
solid pack, in chunks, flakes and grated.
Tuna may be canned in tin or in glass jars. In the United States, the standard weight of tuna cans has shrunk progressively from 7oz, equivalent to 200 g, to 6 oz, equivalent to 170 g net weight. In the EU, there is no standard weight for tuna cans. However, in net
5
weight terms, smaller tuna cans generally tend to weigh 80 and 120 g, while larger cans tend to weigh 160, 185, 200, 240, 500 g and even 1 kg. Cans used by the catering sector usually weigh 2 to 5 kg. Other than the traditional canned tuna in tins (or in glass jars), tuna is processed into other value-added products such as tuna salads, tuna in pouch, tuna hors d’oeuvres, canned tuna belly (ventresca di tonno) and tuna fillets in glass jars, sometimes preserved in extra-virgin olive oil. The top world markets of canned tuna are the EU, the United States and Japan. The main global markets of whole tuna raw material are Spain and large canned tuna producers in developing countries: Thailand and the Philippines in Asia; Côte d’Ivoire, Mauritius and Ghana in Africa. The EU and the United States also import frozen pre-cooked loins for canning from Latin America (Ecuador and Colombia).
3.1 The EU Europe has an old tuna fishing tradition and is the world’s largest canned tuna market. The old continent, and Southern Europe in particular, consumes about 35 percent of the global consumption of canned tuna. As a general rule, the more price-conscious Northern European market favours skipjack, while the more quality-conscious Southern European market favours yellowfin. However, Northern European consumers in traditional skipjack consuming areas (the United Kingdom and Germany) are increasingly switching to yellowfin due to its superior quality. According to data from the Fédération Française des Industries d’Aliments Conservés (FIAC), the EU market for canned tuna grew from 490 000 tonnes (net weight) of cans purchased in 1996 to 560 000 tonnes in 2001 (Figure 3.1.1 [a]). Purchase of canned tuna over a three years’ average (1999-2000-2001) was estimated by FIAC at 551 000 tonnes net weight. The main markets for canned tuna were estimated to be Italy, with 118 400 tonnes, worth 22 percent of the EU market, followed by the United Kingdom with 108 100 tonnes, worth 20 percent of the market. Other important markets were estimated to be Spain, which totalled 89 600 tonnes, France, which totalled 86 200 tonnes and Germany, which totalled 59 100 tonnes (Figure 3.1.1 [b]).
6

(a) growth of the EU market for canned tuna (1 000 MT), 1996-2001
490
504
530
545 547
560
440
460
480
500
520
540
560
580
1996 1997 1998 1999 2000 2001
year
1 00
0 M
T
(b) the EU market for canned tuna (metric tonnes), average 1999-2001
Spain, 89 587
France, 86 161 Germany, 59 069
Netherlands, 12 228
Portugal, 15 745
Bel/Lux, 11 306
Denmark, 5 799
Greece, 5 912
Finland, 6 110
Ireland, 3 558
Austria, 4 936
Sw eden, 5 106
Italy, 118 435UK, 108 072
Figure 3.1.1 (a) and (b). The EU canned tuna market (source: FIAC)
According to FIAC data, the average EU consumption of canned tuna over three years (1999-2000-2001) amounted to 1.51 kg/year/inhabitant. The main consumers of canned
7

tuna in the EU are Spain with 2.18 kg/year/inhabitant and Italy with 2.05 kg/year/inhabitant, followed by Portugal with 1.81 kg/year/inhabitant and the United Kingdom with 1.57 kg/year/inhabitant (Figure 3.1.2).
Average EU consumption of canned tuna (kg/inhabitant/year), 1999-2001
2.182.05
1.81
1.57 1.51 1.46
1.18 1.09 1.060.94
0.77 0.720.61 0.58 0.56
0
0.5
1
1.5
2
2.5
Spain
Italy
Portug
alUK
EU avera
ge
France
Finlan
d
Denmark
Bel/Lu
x
Irelan
d
Netherl
ands
German
y
Austria
Sweden
Greece
country
kg/in
habi
tant
/yea
r
Figure 3.1.2. Average EU canned tuna consumption by main countries, 1999-2001 (source: FIAC) According to FISHSTAT + data, EU catches of commercial tuna species increased from 56 300 tonnes in 1950 to 463 400 tonnes in 2002, reaching a peak of 502 100 tonnes in 1995. Spanish and French landings totalled 90 percent of EU commercial tuna catches during the 1950-2002 period. The EU fleet is indeed composed by 67 Spanish and French purse seiners. EU-owned purse seiners also fly African, Caribbean and Pacific (ACP) flags. In fact, the EU tuna fleet operates under the so-called the so-called “Southern Agreements”, covering the activities of the fleet in the Exclusive Economic Zone (EEZ) of several developing countries. As a consequence of the high consumption of canned tuna in the EU, the canneries need to import tuna in addition to those caught by the EU-ACP fleet. Imports of whole tuna raw material for industrial preparations are in principle duty-free from any country. In turn, tuna loins for canning and canned tuna should be in principle subject to a tariff of 24 percent when entering the EU market. For tuna loins, the Union has lowered the basic tariff to 6 percent for a quota of 4 000 tonnes per year. The EU imports canned tuna and frozen pre-cooked tuna loins from ACP and Latin American Countries. Imports of canned tuna and tuna loins from ACP (and Least
8

Developed Countries, LDC) are duty-free. Furthermore, since 1990, the EU has been granting tariff exoneration to drug producing countries (including Central American and Andean Countries) committed to tackling drug production and trafficking. Through the “drugs” regime, canned tuna and tuna loins from Central American and Andean Countries are granted a zero tariff when entering the EU market2. In most of those countries, which are linked to the EU by trade preferences, European corporations set up processing plants in order to cut their costs of production. The EU and ACP developed an integrated industry for tropical tuna, mainly skipjack and yellowfin. The EU fishing fleet catches the tunas, while ACP canneries process it into standard products, e.g. tuna in vegetable oil and in brine. EU investments in ACP stir growth, employment and income creation. In Latin America production of loins as well as of canned tuna for the EU market is particularly important. All preferential tariffs applied to processed tuna are subject to a strict clause of origin: the raw material must come from the countries the agreement is applied to, or by the EU fleet, and must be processed in establishments belonging to the beneficiaries3. The EU also imports substantial quantities of canned tuna from large producing and exporting countries such as Thailand, the Philippines and Indonesia. However, imports of canned tuna from Thailand, the Philippines and Indonesia have been historically subject (until recently) to the general 24 percent tariff. The EU tariff applied to canned tuna imports from Thailand, the Philippines and Indonesia was lowered to 12 percent for a quota of 25 000 tonnes as from 1 July 2003. According to EU regulation 975/2003, the tariff quota should be opened annually for an initial period of five years. Its volume for the first two years was fixed at 25 000 tonnes from 1 July 2003 to 30 June 2004, and 25 750 tonnes from 1 July 2004 to 30 June 2005. Thailand is set to benefit from 52 percent of the annual volume, the Philippines from 36 percent of the annual volume, Indonesia from 11 percent of the annual volume and other third countries from 1 percent of the annual volume. The reduction of the EU common tariff on prepared and preserved tuna from Southeast Asia falls within the measures launched by Member States of the World Trade Organization (WTO) to achieve the trade liberalization targets set by WTO through, inter alia, the phasing out of tariff barriers between Member States. Regulation 975/2003 created a strong precedent for the dismantling of the system erected by the EU to protect the domestic and the ACP tuna industries, which may therefore suffer of lack of competitiveness vis-à-vis the cheaper and more productive Southeast Asian industries.
2 The twelve countries under the Multi-annual Scheme of Generalised Tariff Preferences (GSP) with the Central America and the Andean Countries, also called “Drugs GSP” are Bolivia, Colombia, Costa Rica, Ecuador, El Salvador, Guatemala, Honduras, Nicaragua, Pakistan, Panama, Peru and Venezuela. 3 Save for a limited quota (circa 8 000 tonnes canned tuna and 2 000 tonnes tuna loins per year) which, according to Regulation 891/2002, may originate from tuna raw material from third countries but yet be labelled (and exported to the EU) as ACP products if processed within an ACP Country.
9

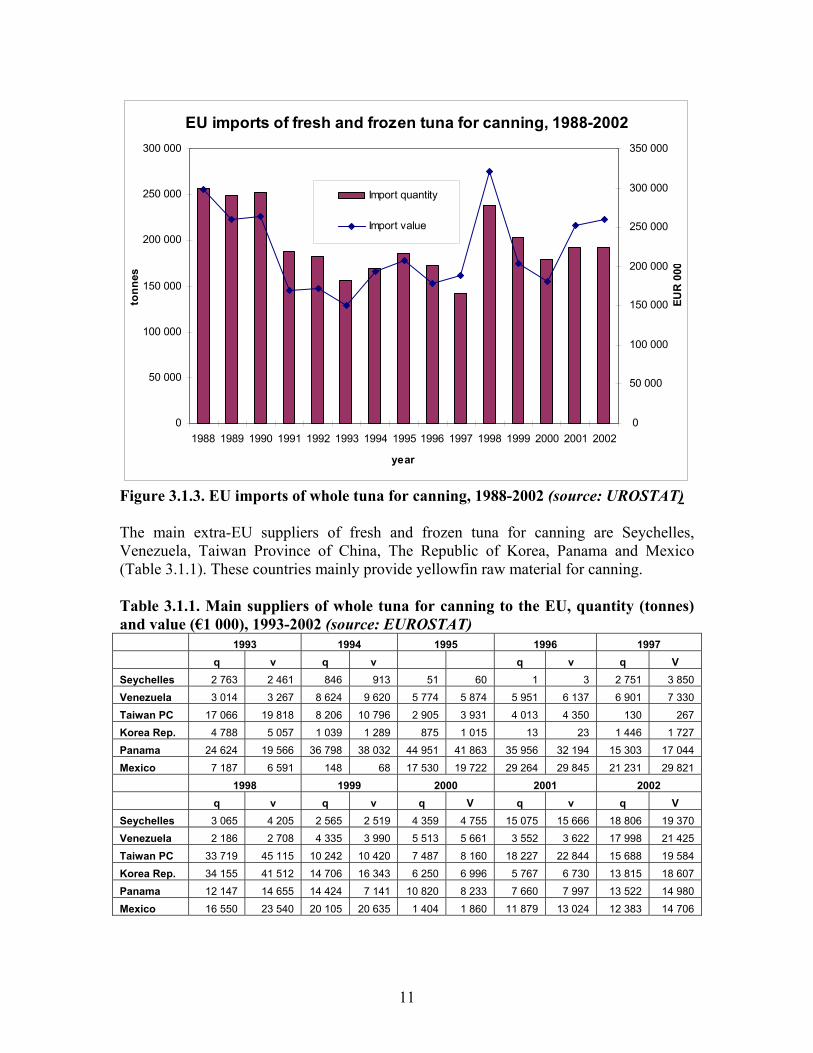
Due to the importance of international trade for the EU tuna industry, the EU has been setting up, over time, an elaborated health and safety framework governing trade in tuna products, with marketing standards, tariffs and health and safety rules. The Community established common marketing standards for preserved tuna and bonito in Regulation 1536/92. Preserved tuna must fall within the Common Nomenclature (CN) Codes 1610 14 10 and 1604 20 70. It must be prepared from fish of the genus Thunnus spp. and of the species Euthynnus (Katsuwonus) pelamis. Different species may not, in principle, be mixed in different containers. The trade description on the pre-packaging of tuna and bonito shall state, inter alia, the type of fish, its marketing presentation, and the nature of the culinary preparation. The use of hydrolysed protein to increase the drained weight of canned tuna is regarded by the EU as a consumer fraud, hence prohibited. Among the EU health and safety rules, relevant measures for tuna products refer to maximum levels established in Commission regulations for heavy metals (lead, cadmium and mercury) and dioxins. Regarding canned food in particular, the Commission has introduced restrictions to certain epoxy derivatives in materials and articles intended to come into contact with food. Further initiatives include investigations into possible measures to reduce the presence of other contaminants in food, such as Polycyclic Aromatic Hydrocarbons (PAH), organotins and inorganic tin in canned food. EU imports of fresh and frozen whole tuna for canning declined from 256 900 tonnes in 1988, worth €299 million, to 156 100 tonnes in 1993, worth €151 million. The shortage of raw material for the European canning sector in 1993 resulted from disappointing catches and the tuna-dolphin issue4 penalizing imports of yellowfin from the Eastern Pacific. In the years which followed, imports of tuna remained around or slightly above the 1993 level, but below 1988-1990 levels. However, in 1998, EU imports of fresh and frozen tuna for canning reached 238 500 tonnes, worth €321 million. The high imports of that year were generated by reduced EU catches in the Western Indian Ocean and in the Eastern Central Atlantic and larger availability of lower-priced tuna imported from the Western Pacific area. Imports normalized once again at the end of the decade, reaching 178 800 tonnes in 2000, worth €181 million. EU imports of tuna for canning increased once again to 192 500 tonnes in 2002, worth €260 million (Figure 3.1.3). There are several reasons behind the decline of imports of whole tuna for canning from 1988 to 2002, including the increasing dependence on loins from Latin America and on canned tuna from Latin America, ACP and Southeast Asia.
4 On the tuna-dolphin issue, please read Section 3.2.
10
EU imports of fresh and frozen tuna for canning, 1988-2002
0
50 000
100 000
150 000
200 000
250 000
300 000
1988 1989 1990 1991 1992 1993 1994 1995 1996 1997 1998 1999 2000 2001 2002
year
tonn
es
0
50 000
100 000
150 000
200 000
250 000
300 000
350 000
EUR
000
Import quantity
Import value
Figure 3.1.3. EU imports of whole tuna for canning, 1988-2002 (source: UROSTAT) The main extra-EU suppliers of fresh and frozen tuna for canning are Seychelles, Venezuela, Taiwan Province of China, The Republic of Korea, Panama and Mexico (Table 3.1.1). These countries mainly provide yellowfin raw material for canning. Table 3.1.1. Main suppliers of whole tuna for canning to the EU, quantity (tonnes) and value (€1 000), 1993-2002 (source: EUROSTAT) 1993 1994 1995 1996 1997 q v q v q v q V Seychelles 2 763 2 461 846 913 51 60 1 3 2 751 3 850 Venezuela 3 014 3 267 8 624 9 620 5 774 5 874 5 951 6 137 6 901 7 330 Taiwan PC 17 066 19 818 8 206 10 796 2 905 3 931 4 013 4 350 130 267 Korea Rep. 4 788 5 057 1 039 1 289 875 1 015 13 23 1 446 1 727 Panama 24 624 19 566 36 798 38 032 44 951 41 863 35 956 32 194 15 303 17 044 Mexico 7 187 6 591 148 68 17 530 19 722 29 264 29 845 21 231 29 821 1998 1999 2000 2001 2002 q v q v q V q v q V Seychelles 3 065 4 205 2 565 2 519 4 359 4 755 15 075 15 666 18 806 19 370 Venezuela 2 186 2 708 4 335 3 990 5 513 5 661 3 552 3 622 17 998 21 425 Taiwan PC 33 719 45 115 10 242 10 420 7 487 8 160 18 227 22 844 15 688 19 584 Korea Rep. 34 155 41 512 14 706 16 343 6 250 6 996 5 767 6 730 13 815 18 607 Panama 12 147 14 655 14 424 7 141 10 820 8 233 7 660 7 997 13 522 14 980 Mexico 16 550 23 540 20 105 20 635 1 404 1 860 11 879 13 024 12 383 14 706
11
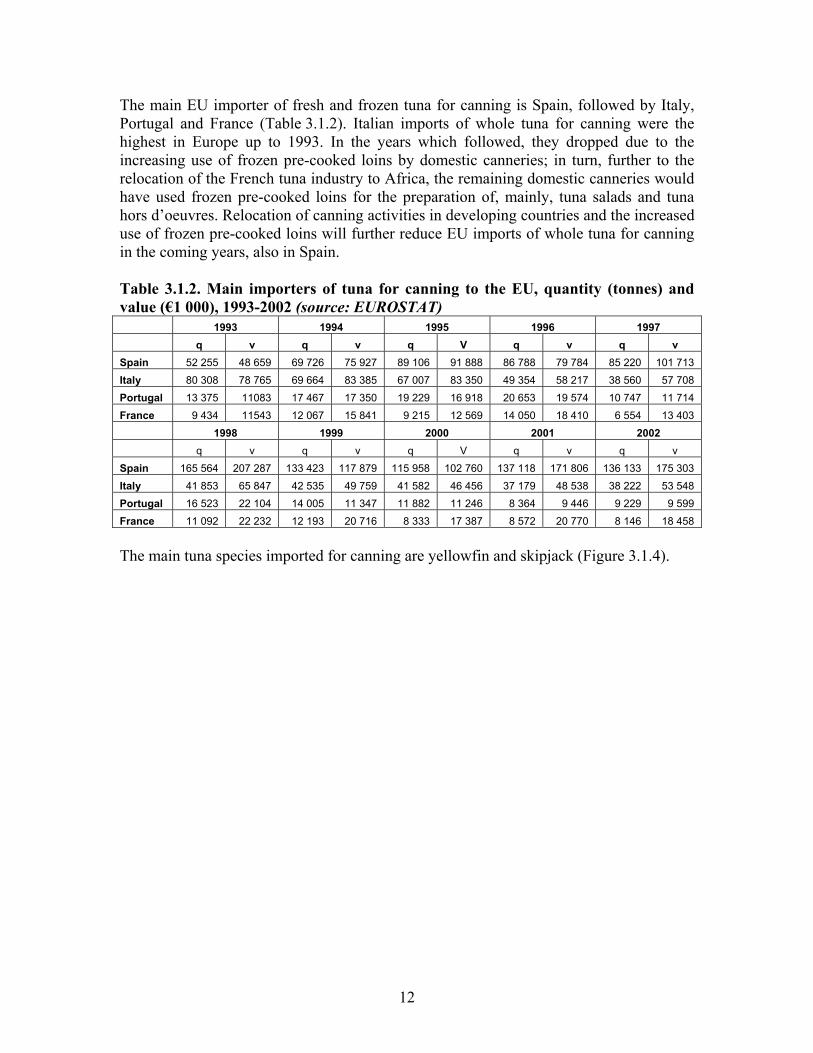
The main EU importer of fresh and frozen tuna for canning is Spain, followed by Italy, Portugal and France (Table 3.1.2). Italian imports of whole tuna for canning were the highest in Europe up to 1993. In the years which followed, they dropped due to the increasing use of frozen pre-cooked loins by domestic canneries; in turn, further to the relocation of the French tuna industry to Africa, the remaining domestic canneries would have used frozen pre-cooked loins for the preparation of, mainly, tuna salads and tuna hors d’oeuvres. Relocation of canning activities in developing countries and the increased use of frozen pre-cooked loins will further reduce EU imports of whole tuna for canning in the coming years, also in Spain. Table 3.1.2. Main importers of tuna for canning to the EU, quantity (tonnes) and value (€1 000), 1993-2002 (source: EUROSTAT) 1993 1994 1995 1996 1997 q v q v q V q v q v Spain 52 255 48 659 69 726 75 927 89 106 91 888 86 788 79 784 85 220 101 713 Italy 80 308 78 765 69 664 83 385 67 007 83 350 49 354 58 217 38 560 57 708 Portugal 13 375 11083 17 467 17 350 19 229 16 918 20 653 19 574 10 747 11 714 France 9 434 11543 12 067 15 841 9 215 12 569 14 050 18 410 6 554 13 403 1998 1999 2000 2001 2002 q v q v q V q v q v Spain 165 564 207 287 133 423 117 879 115 958 102 760 137 118 171 806 136 133 175 303 Italy 41 853 65 847 42 535 49 759 41 582 46 456 37 179 48 538 38 222 53 548 Portugal 16 523 22 104 14 005 11 347 11 882 11 246 8 364 9 446 9 229 9 599 France 11 092 22 232 12 193 20 716 8 333 17 387 8 572 20 770 8 146 18 458
The main tuna species imported for canning are yellowfin and skipjack (Figure 3.1.4).
12

EU imports of fresh and frozen whole tuna for canning by main species (in MT), 2002
Yellow fin63%
Skipjack21%
Other species3%
Albacore13%
Figure 3.1.4. EU imports of whole tuna for canning by main species, 2002 (source: EUROSTAT) Prices of frozen yellowfin raw material in Spain increased during the nineties, up to the peak of US$1.95/kg in September 1998. As a result of the oversupply of raw material in the months which followed, prices declined to a minimum of US$0.99/kg in September 1999. The decline in catches occurred in the months which followed raised prices to US$1.51/kg in December 2002. However, prices of frozen yellowfin for canning declined in the months that followed to US$1.11/kg in March 2004 (Figure 3.1.5).
13

Monthly Spanish yellowfin raw material prices, origin Spanish vessels, 1993-2004
0.0
0.2
0.4
0.6
0.8
1.0
1.2
1.4
1.6
1.8
2.0Ja
n-93
Jul-9
3
Jan-
94
Jul-9
4
Jan-
95
Jul-9
5
Jan-
96
Jul-9
6
Jan-
97
Jul-9
7
Jan-
98
Jul-9
8
Jan-
99
Jul-9
9
Jan-
00
Jul-0
0
Jan-
01
Jul-0
1
Jan-
02
Jul-0
2
Jan-
03
Jul-0
3
Jan-
04
month-year
US$
/kg
Figure 3.1.5. Prices of yellowfin whole raw material for canning, 1993-2004 (source: GLOBEFISH European Price Report, EPR) According to FISHSTAT + data, estimated EU production of canned tuna increased from 80 400 tonnes in 1976 to 379 200 tonnes in 2002. The main producer is Spain, followed by Italy, France and Portugal. In the years which follow, EU production of canned tuna is estimated to decline further to the increased reliance on imports. The main EU tuna canners are:
Bolton-Saupiquet; • • • •
the four Spanish canners Calvo, Jealsa, Garavilla and Salica; Heinz-John West; and Mitsubishi-Princes Food.
Bolton Alimentari (former Trinity Alimentari Italia) and the French Saupiquet are owned by the Dutch Corporation Bolton Group. Bolton Alimentari produces the tuna called Rio Mare, which commands today over a third of the Italian market and is also widely distributed in Greece, Slovenia, the Czech Republic, Saudi Arabia and Austria. Saupiquet is present at all stages of the production chain, from fishing to processing and marketing. It has a fishing fleet of 5 purse seiners with a fishing rate of 40 000 tonnes of tuna per year. The fleet is mainly active in the Atlantic Ocean, delivering the fish to its factories located in Abidjian (Côte d’Ivoire), Quimper and Vannes (France), and Cermenate (Milan, Italy). Saupiquet has an important subsidiary in Germany; it is the leading brand
14

of canned tuna in France, Germany and Belgium. The main products are yellowfin tuna in brine, tuna fillets, tuna salads and, recently, also tuna in pouch. The Spanish leading canneries are Calvo, Jealsa (with its brands Jealsa and Rianxeira) and Garavilla, with its brands Albo and Isabel. Calvo holds 18.6 percent of the Spanish market and 15 percent of the Italian market through the brand Nostromo. Calvo is present at all stages of the production chain, from fishing to processing and marketing. It owns a fleet of 10 ships and processing plants in Spain, Venezuela and El Salvador. Jealsa-Rianxeira is also present at all stages of the production chain. Jealsa owns canneries in Spain, Italy, where it owns 50 percent of the local brand Star, and in Guatemala. Garavilla is also integrated within all stages of the production chain. It holds processing plants in Spain, and, overseas, a processing plant in Morocco and Ecuador. It markets albacore and yellowfin. An important Spanish tuna fishing company, the Basque-Galician Grupo Albacora, produces canned tuna in Spain and abroad under the name Salica. Heinz Europe, the European brand of the United States’ food giant Heinz, owns tuna canneries in the Seychelles, Ghana, Portugal and France. Heinz also owns the British brand John West, the French brand Petit Navire and the Italian brand Mareblu. The Japanese corporation Mitsubishi, which owns canneries in Thailand in partnership with Thai Union Frozen Products Plc. and in Mauritius, owns the brand Princes Food. Plants which process whole tuna raw material into loins belong, inter alia, to EU corporations. Furthermore, the independent fishing corporation Tri-marine is specialized in the production of frozen pre-cooked loins for canning. Tri-marine operates 11 fishing vessels under United States, Solomon Islands, Vanuatu and Federated States of Micronesia flags. These vessels supply a global network of loin processing plants located in Colombia, Costa Rica, Ecuador, Kenya, the Solomon Islands and Thailand. In Europe and in the United States (mainly American Samoa) the frozen pre-cooked loins are eventually transformed into the final product, mostly canned tuna in oil or other seasoning. EU imports of tuna loins increased from 30 900 tonnes in 1994, worth €89 million, to 64 100 tonnes in 2002, worth €217 million (Figure 3.1.6). The main importers of tuna loins are Italy, France and Spain and the main suppliers are Colombia and Ecuador (EUROSTAT data).
15

Reported EU imports of frozen pre-cooked tuna loins, 1994-2002
0
10 000
20 000
30 000
40 000
50 000
60 000
70 000
1994 1995 1996 1997 1998 1999 2000 2001 2002
year
tonn
es
0
50 000
100 000
150 000
200 000
250 000
EUR
000
Import quantity
Import value
Figure 3.1.6. Reported EU imports of frozen pre-cooked tuna loins for canning, 1988-2002 (source: EUROSTAT) In Italy, the use of loins for canning is estimated to average about 70 percent of total canned tuna production during the 1994-2002 timeframe. Prices of yellowfin loins in Italy averaged €3.40/kg up to 2002. However, good supplies in canneries led main yellowfin consuming countries, such as Italy, to slow down their demand for loins in 2002 and 2003; hence prices started to decline. On March 2004, prices of yellowfin tuna loins reached €2.55/kg (Figure 3.1.7). In turn, prices of skipjack loins declined from €2.51/kg in January 1999 to €1.88/kg in January 2001. The restrictive measures on skipjack catches implemented between the end of 2000 and the beginning of 20015 generated an increase in prices of skipjack loins to €3.35/kg in August 2001. However, in the months which followed, prices of skipjack loins declined further up to €2.14/kg in March 2004 (Figure 3.1.7).
5 See Chapter 3.4.
16

Prices of tuna loins in Italy, origin Latin America, 1999-2004
1.5
2.0
2.5
3.0
3.5
4.0
Jan-
99M
ar-9
9M
ay-9
9Ju
l-99
Sep-
99N
ov-9
9Ja
n-00
Mar
-00
May
-00
Jul-0
0Se
p-00
Nov
-00
Jan-
01M
ar-0
1M
ay-0
1Ju
l-01
Sep-
01N
ov-0
1Ja
n-02
Mar
-02
May
-02
Jul-0
2Se
p-02
Nov
-02
Jan-
03M
ar-0
3M
ay-0
3Ju
l-03
Sep-
03N
ov-0
3Ja
n-04
Mar
-04
month-year
Euro
/kg
Yellow finloins
Skipjackloins
Figure 3.1.7. Frozen pre-cooked tuna loins prices in Europe, 1999-2004 (source: GLOBEFISH EPR) EU imports of canned tuna increased from 124 300 tonnes in 1988, worth €323 million, to 503 000 tonnes in 2002, worth €1.4 billion (Figure 3.1.8). The EU is a net importer of canned tuna: in fact, in 2002, it exported 169 900 tonnes of canned tuna, worth €569 million (mostly intra-EU trade).
17

EU imports of canned tuna, 1988-2002
0
100 000
200 000
300 000
400 000
500 000
600 000
1988 1989 1990 1991 1992 1993 1994 1995 1996 1997 1998 1999 2000 2001 2002
year
tonn
es
200 000
400 000
600 000
800 000
1 000 000
1 200 000
1 400 000
1 600 000
EUR
000
Import quantity
Import value
Figure 3.1.8. EU imports of canned tuna, 1988-2002 (source: EUROSTAT) The EU is the traditional market reference for prices of canned tuna. In the most recent years, and especially further to the peak of 1998, prices of canned tuna declined due to exceptionally abundant skipjack catches; currently (March 2004), prices of canned skipjack chunks in the EU amount to US$18.50 per carton (Figure 3.1.9).
18

Monthly prices of canned skipjack chunks (origin Thailand), Europe 1984-2004
0
5
10
15
20
25
30Ja
n-84
Jan-
85
Jan-
86
Jan-
87
Jan-
88
Jan-
89
Jan-
90
Jan-
91
Jan-
92
Jan-
93
Jan-
94
Jan-
95
Jan-
96
Jan-
97
Jan-
98
Jan-
99
Jan-
00
Jan-
01
Jan-
02
Jan-
03
Jan-
04
month-year
US$
/car
ton
(car
ton:
48*
6.5
oz)
Figure 3.1.9. Prices of canned skipjack chunks in the EU, 1988-2004 (source: INFOFISH Trade News) The main EU importers of canned tuna are the United Kingdom, France, Germany and Italy. Traditionally, Southern Europe (Italy in particular) imports canned tuna from other EU Countries and ACP Countries, while Northern Europe (Germany and the United Kingdom in particular) imports canned tuna from both Southeast Asian and ACP Countries. However the tuna market in those major countries of destination is going to be more uniform in the future, due to:
the increased penetration of canned tuna from Asia in Southern Europe further to the lowering of the tariffs occurred in July 2003; and
•
• the increased awareness over the quality of canned tuna in Northern Europe, and increased consumption of yellowfin tuna.
According to EUROSTAT data, the main non-EU suppliers of canned tuna to the EU are Seychelles, Côte d’Ivoire, Thailand, the Philippines, Ecuador, Mauritius and Ghana (Table 3.1.3). During the 1988-2002 period, these countries accounted for an average of 55 percent of EU canned tuna imports in terms of quantity and 51 percent in terms of value (EUROSTAT data).
19
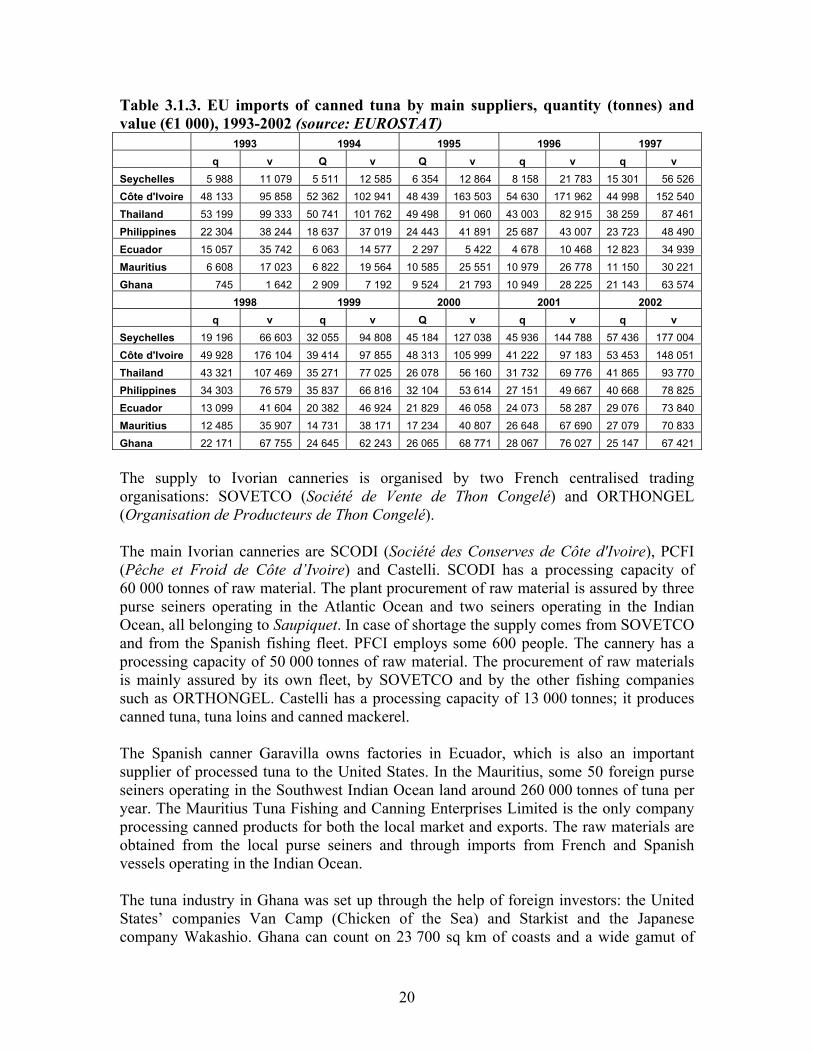
Table 3.1.3. EU imports of canned tuna by main suppliers, quantity (tonnes) and value (€1 000), 1993-2002 (source: EUROSTAT) 1993 1994 1995 1996 1997 q v Q v Q v q v q v Seychelles 5 988 11 079 5 511 12 585 6 354 12 864 8 158 21 783 15 301 56 526 Côte d'Ivoire 48 133 95 858 52 362 102 941 48 439 163 503 54 630 171 962 44 998 152 540 Thailand 53 199 99 333 50 741 101 762 49 498 91 060 43 003 82 915 38 259 87 461 Philippines 22 304 38 244 18 637 37 019 24 443 41 891 25 687 43 007 23 723 48 490 Ecuador 15 057 35 742 6 063 14 577 2 297 5 422 4 678 10 468 12 823 34 939 Mauritius 6 608 17 023 6 822 19 564 10 585 25 551 10 979 26 778 11 150 30 221 Ghana 745 1 642 2 909 7 192 9 524 21 793 10 949 28 225 21 143 63 574 1998 1999 2000 2001 2002 q v q v Q v q v q v Seychelles 19 196 66 603 32 055 94 808 45 184 127 038 45 936 144 788 57 436 177 004 Côte d'Ivoire 49 928 176 104 39 414 97 855 48 313 105 999 41 222 97 183 53 453 148 051 Thailand 43 321 107 469 35 271 77 025 26 078 56 160 31 732 69 776 41 865 93 770 Philippines 34 303 76 579 35 837 66 816 32 104 53 614 27 151 49 667 40 668 78 825 Ecuador 13 099 41 604 20 382 46 924 21 829 46 058 24 073 58 287 29 076 73 840 Mauritius 12 485 35 907 14 731 38 171 17 234 40 807 26 648 67 690 27 079 70 833 Ghana 22 171 67 755 24 645 62 243 26 065 68 771 28 067 76 027 25 147 67 421
The supply to Ivorian canneries is organised by two French centralised trading organisations: SOVETCO (Société de Vente de Thon Congelé) and ORTHONGEL (Organisation de Producteurs de Thon Congelé). The main Ivorian canneries are SCODI (Société des Conserves de Côte d'Ivoire), PCFI (Pêche et Froid de Côte d’Ivoire) and Castelli. SCODI has a processing capacity of 60 000 tonnes of raw material. The plant procurement of raw material is assured by three purse seiners operating in the Atlantic Ocean and two seiners operating in the Indian Ocean, all belonging to Saupiquet. In case of shortage the supply comes from SOVETCO and from the Spanish fishing fleet. PFCI employs some 600 people. The cannery has a processing capacity of 50 000 tonnes of raw material. The procurement of raw materials is mainly assured by its own fleet, by SOVETCO and by the other fishing companies such as ORTHONGEL. Castelli has a processing capacity of 13 000 tonnes; it produces canned tuna, tuna loins and canned mackerel. The Spanish canner Garavilla owns factories in Ecuador, which is also an important supplier of processed tuna to the United States. In the Mauritius, some 50 foreign purse seiners operating in the Southwest Indian Ocean land around 260 000 tonnes of tuna per year. The Mauritius Tuna Fishing and Canning Enterprises Limited is the only company processing canned products for both the local market and exports. The raw materials are obtained from the local purse seiners and through imports from French and Spanish vessels operating in the Indian Ocean. The tuna industry in Ghana was set up through the help of foreign investors: the United States’ companies Van Camp (Chicken of the Sea) and Starkist and the Japanese company Wakashio. Ghana can count on 23 700 sq km of coasts and a wide gamut of
20
tuna resources, mainly skipjack. Landings of tuna by the industrial fleet of national and EU own averaged about 34 000 tonnes/year in the 1995-2001 period. The two main canning factories in Ghana are:
• Pioneer Food Cannery (PFC); and • Ghana Agro Food Company Ltd. (GAFCO).
The supply to canneries is organised by TTV, a French-owned locally operating company. Canneries also buy raw material from local fishing companies. PFC, a subsidiary of Heinz, is the largest tuna canning operator in Ghana. The plant is located in the free port of Tema and processes about 50 000 tonnes of tuna per year, representing 70 percent of Ghana’s canned tuna production. The turnover of PFC is about US$57 million per year. GAFCO, a producer of fish flour, processes around 30 000 tonnes of tuna per year and accounts for about 20 percent of Ghana’s canned tuna production. GAFCO distributes its own canned tuna products under the brand names of its partner companies in Europe, for an annual export volume of some 4 800 tonnes. An analysis of the main tuna markets in the EU follows.
21

3.1.1 France The French tuna industry is an extremely concentrated one, in the hands of few players such as Saupiquet, owned by the Dutch corporation Bolton Group, and Paul Paulet/Petit Navire, owned by Heinz Seafood Europe. The other “historical” French tuna company left, Pêche et Froid, was acquired by Bolton-Saupiquet in 2000. Furthermore, the French tuna industry is a largely internationalized one. French tuna companies moved progressively their processing plants to ACP Countries, where the lower production costs and proximity to landing areas generated a vertical integration of all sectors, e.g. catch, processing and marketing. ORTHONGEL (Organisation de Producteurs de Thon Congelé) is the organization grouping the French tuna fleet owners and supplying:
• the factories of Heinz in the Seychelles, Ghana, Portugal and Madagascar; • the former factories of Pêche et Froid, now subsidiaries of Bolton-Saupiquet, in
Côte d’Ivoire and Madagascar; • the factories of SCODI (Société des Conserves de Côte d’Ivoire) and Castelli in
Côte d’Ivoire (subsidiaries of Bolton-Saupiquet). As a result of internationalization, in the last decade France seems to have increased its reliance on loins and canned tuna from French and Spanish canneries in ACP and Latin America. These products are either imported directly into France or through other EU Countries, such as Spain or Italy. The catch of the French tuna fleet, amounting to 161 200 tonnes in 2002, of which 70 700 tonnes of skipjack and 67 900 tonnes of yellowfin (FISHSTAT + data), is generally exported. In 2002, the country exported 126 900 tonnes of fresh, chilled and frozen tuna, worth €152 million. According to national statistics, in 2003, the country exported 188 200 tonnes of fresh, chilled and frozen tuna, equivalent to €151 million. In turn, French imports of fresh, chilled and frozen tuna declined from 40 300 tonnes in 1988, worth €53 million, to 16 300 tonnes in 2002, worth €48 million. In 2003, imports picked up slightly to 17 100 tonnes, worth €44 million. French imports of fresh and frozen tuna for canning declined from 37 600 tonnes in 1988, worth €45 million, to 8 100 tonnes in 2002, worth €18 million. According to national statistics, in 2003 the country imported 8 200 tonnes of fresh, chilled and frozen tuna for canning, worth €14 million. In order to capitalize on cheaper factors of production of third countries while at the same time protecting its remaining domestic canneries, France started to increase imports of semi-processed tuna products (loins) destined to final canning in France. Overall, the use of loins as raw material by French canneries increased from 30 percent in 1992 to 89 percent in 2002. Reported imports of loins by France increased from 9 000 tonnes in 1995, worth €29 million, to 14 300 tonnes in 2001, worth €43 million, to decline to 11 400 tonnes, worth €37 million, in 2002. According to French statistics, French imports of loins declined slightly to 11 300 tonnes in 2003, worth €32 million. Loins are either
22

directly imported from Thailand, Seychelles, Côte d’Ivoire and Ecuador, or through Italy and Spain (EUROSTAT data and national statistics). Over time, domestic production of canned seafood, including tuna, increased in terms of outputs and turnover. This growth corresponded to a parallel reduction in the number of companies and plants, due to, particularly in the case of the tuna industry, concentration of companies and internationalization of the production chain. The concentration of the French tuna industry reflects the concentration of the canned seafood industry in France, of which canned tuna represents some 42 percent of inputs and 52 percent of outputs. According to FIAC data, the number of canning companies decreased from 200 in the fifties to 18 units in 2002. At the same time, the whole seafood canning industry increased its turnover from slightly more than an estimated €80 million in 1980 to €917 million in 2002. Domestic production of canned tuna, according to FISHSTAT + data, increased from 16 100 tonnes in 1976 to 47 700 tonnes in 2001. According to FIAC 2002 and FISHSTAT + data, production of canned tuna declined slightly to 43 000 tonnes in 2002. Currently, domestic production of canned tuna seems to have occupied the market niche of value-added products, particularly tuna salads. According to FIAC, while processing of traditional products such as the traditional solid pack tuna in brine or in oil is declining, the production of value-added products such as tuna salads and hors d’oeuvre is gradually increasing. In 2002, production of tuna salads reached coverage of 70 percent of domestic canned tuna production. France has always been a net importer of canned tuna. Furthermore, while imports of tuna for canning declined in the nineties, imports of canned tuna were increasing over the same period. These trends show the progressive relocation of canning activities from France to Africa. French canned tuna imports grew from 55 000 tonnes in 1988, worth €133 million, to 117 800 tonnes in 2002, worth €310 million, but declined to 107 200 tonnes in 2003, worth €270 million (Figure 3.1.1.1). Imports of canned tuna from the main supplier, Côte d’Ivoire, increased from 32 100 tonnes in 1988, worth €74 million, to 49 400 tonnes in 1994, worth €96 million, to decline to 30 300 tonnes in 2003, worth €75 million (Figure 3.1.1.2). Other important suppliers of canned tuna to France are Spain, Seychelles, Madagascar and Italy.
23

French imports of canned tuna, 1988-2003
0
20 000
40 000
60 000
80 000
100 000
120 000
140 000
1988198919901991 1992199319941995 1996199719981999 2000200120022003
year
tonn
es
0
50 000
100 000
150 000
200 000
250 000
300 000
350 000
EUR
000
Import quantity
Import value
Figure 3.1.1.1. French imports of canned tuna, 1988-2003 (source: EUROSTAT -1988 to 2002- and national statistics -2003-)
French imports of canned tuna from Côte d'Ivoire, 1988-2003
0
10 000
20 000
30 000
40 000
50 000
60 000
1988 19891990 1991 19921993 1994 19951996 1997 19981999 2000 20012002 2003
year
tonn
es
0
20 000
40 000
60 000
80 000
100 000
120 000
140 000
160 000
180 000
EUR
000
Import quantity
Import value
Figure 3.1.1.2. French imports of canned tuna from Côte d’Ivoire, 1988-2003 (source: EUROSTAT -1988 to 2002- and national statistics -2003-)
24

3.1.2 Germany Germany is neither tuna fishing nor processing nation. However, the country is an important market for canned tuna. The German market has historically been, as a general rule, more concerned about the inexpensiveness, than the quality, of the product. However, in the past ten years, the German tuna market opened to higher quality tuna preparations. Saupiquet leads the premium market and offers a great variety of qualities and preparations. Most of tuna is sold at the retail market, in 200 g cans. Higher quality smaller cans of 100 g also exist. Finally, 2 kg cans are mainly imported from the Philippines and aimed at the catering market and at the industry. In the early eighties, dressed tuna (e.g. tuna with vegetables such as peas or onions) from Taiwan Province of China accounted for two thirds of German tuna imports. Over time, low quality caused consumers to turn to other canned tuna forms, e.g. tuna in oil and in brine, mainly from Thailand. However, the crisis of the Thai tuna industry in the mid-nineties generated a shift, as a main supplier, from Thailand to the Philippines. According to EUROSTAT, German imports of canned tuna increased from 6 200 tonnes in 1988, worth €14 million, to 91 700 tonnes in 2003, worth €200 million (Figure 3.1.2.1). The main exporters of tuna into Germany are the Philippines and France (sources: national statistics and EUROSTAT data).
25

German imports of canned tuna, 1988-2003
0
10 000
20 000
30 000
40 000
50 000
60 000
70 000
80 000
90 000
100 000
19881989199019911992 199319941995199619971998 19992000200120022003
year
tonn
es
0
50 000
100 000
150 000
200 000
250 000
EUR
000
Import quantity
Import value
Figure 3.1.2.1. German imports of canned tuna, 1988-2003 (source: EUROSTAT -1998 to 2002- and national statistics -2003-)
3.1.3. Italy Italy does not have a large, commercial tuna fishing fleet; rather, its fleet catches relatively small quantities of Atlantic bluefin tuna which are partly exported to Japan, and partly consumed locally. According to FIAC data, Italy is the largest market of canned tuna in the EU with 118 400 tonnes of cans marketed in 2001 and the second largest consumer of canned tuna in the EU after Spain with 2.05 kg consumed per person each year. Due to the absence of a commercial tuna fleet targeting species for canning, Italy must rely on imported raw material, including frozen pre-cooked loins, to be processed domestically, and on the import of the final product, e.g. canned tuna. Italy mainly relies, for its canned tuna production and market, on frozen pre-cooked tuna loins and on high quality frozen whole yellowfin originating mainly from EU vessels operating in the Indian and in the Atlantic Ocean. According to EUROSTAT, Italian imports of frozen yellowfin for canning make some 80 percent of total imports of whole tuna in Italy. Italian imports of frozen yellowfin for canning declined from 82 600 tonnes in 1992 to 35 800 tonnes in 2002. According to national statistics, Italian imports of
26

frozen yellowfin for canning declined to 31 300 tonnes in 2003 (Figure 3.1.3.1). The main suppliers of frozen whole yellowfin for canning to Italy are Taiwan Province of China, France and Spain.
Italian imports of frozen whole yellowfin for canning, quantity 1992-2003
0
10 000
20 000
30 000
40 000
50 000
60 000
70 000
80 000
90 000
1992 1993 1994 1995 1996 1997 1998 1999 2000 2001 2002 2003
year
tonn
es
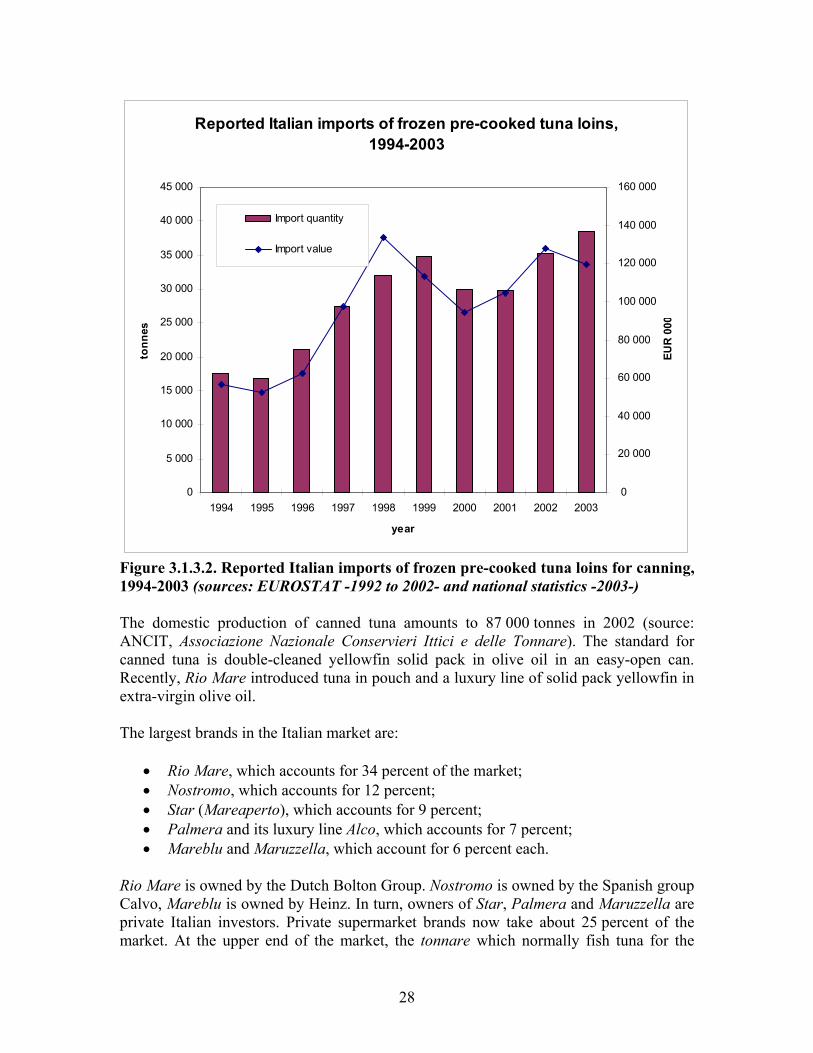
Figure 3.1.3.1. Italian imports of frozen whole yellowfin for canning, 1992-2003 (sources: EUROSTAT -1992 to 2002- and national statistics -2003-) The decline of imports of frozen whole yellowfin for canning was generated mainly by economic reasons: the high labour costs of Italian canneries led tuna companies to utilize frozen pre-cooked tuna loins (pre-processed in Latin America, Africa and Asia), or to invest in developing countries (e.g. the Saupiquet cannery in Abidjan, Côte d’Ivoire, where the Rio Mare canned tuna in brine is produced). According to EUROSTAT, reported imports of loins increased from 17 600 tonnes in 1994, worth €56 million, to 35 200 tonnes in 2002, worth €128 million. According to provisional data from the Istituto Nazionale di Statistica (ISTAT), import of tuna loins in 2003 totalled 38 400 tonnes, worth €119 million (Figure 3.1.3.2). The main suppliers of tuna loins to Italy are Ecuador and Colombia (EUROSTAT data).
27
Reported Italian imports of frozen pre-cooked tuna loins, 1994-2003
0
5 000
10 000
15 000
20 000
25 000
30 000
35 000
40 000
45 000
1994 1995 1996 1997 1998 1999 2000 2001 2002 2003
year
tonn
es
0
20 000
40 000
60 000
80 000
100 000
120 000
140 000
160 000
EUR
000
Import quantity
Import value
Figure 3.1.3.2. Reported Italian imports of frozen pre-cooked tuna loins for canning, 1994-2003 (sources: EUROSTAT -1992 to 2002- and national statistics -2003-) The domestic production of canned tuna amounts to 87 000 tonnes in 2002 (source: ANCIT, Associazione Nazionale Conservieri Ittici e delle Tonnare). The standard for canned tuna is double-cleaned yellowfin solid pack in olive oil in an easy-open can. Recently, Rio Mare introduced tuna in pouch and a luxury line of solid pack yellowfin in extra-virgin olive oil. The largest brands in the Italian market are:
• Rio Mare, which accounts for 34 percent of the market; • Nostromo, which accounts for 12 percent; • Star (Mareaperto), which accounts for 9 percent; • Palmera and its luxury line Alco, which accounts for 7 percent; • Mareblu and Maruzzella, which account for 6 percent each.
Rio Mare is owned by the Dutch Bolton Group. Nostromo is owned by the Spanish group Calvo, Mareblu is owned by Heinz. In turn, owners of Star, Palmera and Maruzzella are private Italian investors. Private supermarket brands now take about 25 percent of the market. At the upper end of the market, the tonnare which normally fish tuna for the
28

Japanese sashimi market, process Atlantic bluefin and high quality yellowfin products for connoisseurs: solid pack canned tuna and tuna fillets in olive oil (including extra-virgin olive oil), the ventresca di tonno (the abdominal muscles of the fish) and the tarantello di tonno (the lower abdominal muscles of the fish) in tin or glass jar. Total Italian production of canned tuna increased from 38 200 tonnes in 1976 to 93 100 tonnes in 1992, declining to 62 800 tonnes in 1993 and fluctuated around similar values in the 1993-1995 period, when the Italian canning tuna industry was going through crises because of a combination of low yellowfin catches and the aggressive competition from emerging economies. Due to the increasing use of tuna loins by the Italian canning industry, production picked up from 61 000 tonnes of 1995 (FISHSTAT + data) to 87 000 tonnes in 2002 (ANCIT data).
Italian imports of canned tuna increased from 30 300 tonnes in 1992, equivalent to €98 million to 68 600 tonnes in 2002, worth €263 million (Figure 3.1.3.3).
Italian imports of canned tuna, 1992-2003
0
10 000
20 000
30 000
40 000
50 000
60 000
70 000
80 000
1992 1993 1994 1995 1996 1997 1998 1999 2000 2001 2002 2003
year
tonn
es
0
50 000
100 000
150 000
200 000
250 000
300 000
EUR
000
Import quantity
Import value
Figure 3.1.3.3. Italian imports of canned tuna, 1992-2003 (sources: EUROSTAT -1992 to 2002- and national statistics -2003-) The main suppliers of canned tuna to Italy are Spain, for Nostromo (Calvo) tuna, Côte d’Ivoire, for Rio Mare and the Seychelles, for Mareblu-Heinz (Table 3.1.3.1).
29
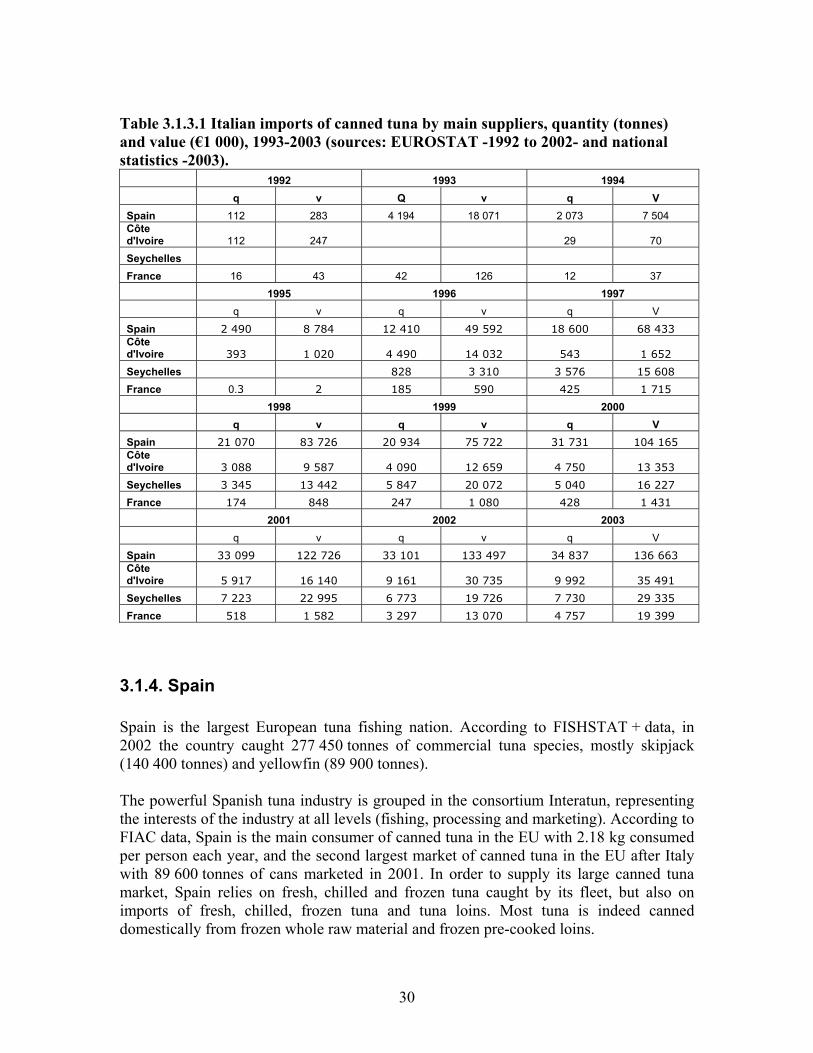
Table 3.1.3.1 Italian imports of canned tuna by main suppliers, quantity (tonnes) and value (€1 000), 1993-2003 (sources: EUROSTAT -1992 to 2002- and national statistics -2003).
1992 1993 1994 q v Q v q V Spain 112 283 4 194 18 071 2 073 7 504 Côte d'Ivoire 112 247 29 70 Seychelles France 16 43 42 126 12 37 1995 1996 1997 q v q v q V Spain 2 490 8 784 12 410 49 592 18 600 68 433 Côte d'Ivoire 393 1 020 4 490 14 032 543 1 652 Seychelles 828 3 310 3 576 15 608 France 0.3 2 185 590 425 1 715 1998 1999 2000 q v q v q V Spain 21 070 83 726 20 934 75 722 31 731 104 165 Côte d'Ivoire 3 088 9 587 4 090 12 659 4 750 13 353 Seychelles 3 345 13 442 5 847 20 072 5 040 16 227 France 174 848 247 1 080 428 1 431 2001 2002 2003 q v q v q V Spain 33 099 122 726 33 101 133 497 34 837 136 663 Côte d'Ivoire 5 917 16 140 9 161 30 735 9 992 35 491 Seychelles 7 223 22 995 6 773 19 726 7 730 29 335 France 518 1 582 3 297 13 070 4 757 19 399
3.1.4. Spain Spain is the largest European tuna fishing nation. According to FISHSTAT + data, in 2002 the country caught 277 450 tonnes of commercial tuna species, mostly skipjack (140 400 tonnes) and yellowfin (89 900 tonnes). The powerful Spanish tuna industry is grouped in the consortium Interatun, representing the interests of the industry at all levels (fishing, processing and marketing). According to FIAC data, Spain is the main consumer of canned tuna in the EU with 2.18 kg consumed per person each year, and the second largest market of canned tuna in the EU after Italy with 89 600 tonnes of cans marketed in 2001. In order to supply its large canned tuna market, Spain relies on fresh, chilled and frozen tuna caught by its fleet, but also on imports of fresh, chilled, frozen tuna and tuna loins. Most tuna is indeed canned domestically from frozen whole raw material and frozen pre-cooked loins.
30

Spanish imports of fresh, chilled and frozen raw material for canning increased from 52 300 tonnes in 1993, equivalent to €49 million, to 199 300 tonnes in 2003, equivalent to €224 million (Figure 3.1.4.1). The decline in import quantity and value experienced from 1998 to 2000 is due to the persisting excess of supply of tuna raw material in those years.
Spanish imports of fresh, chilled and frozen whole tuna for canning, 1993-2003
0
50 000
100 000
150 000
200 000
250 000
1993 1994 1995 1996 1997 1998 1999 2000 2001 2002 2003
year
tonn
es
0
50 000
100 000
150 000
200 000
250 000
EUR
000
Import quantity
Import value
Figure 3.1.4.1. Spanish imports of fresh, chilled and frozen whole tuna for canning, 1993-2003 (sources: EUROSTAT -1993 to 2002- and national statistics -2003-) The main suppliers of tuna raw material to Spain are Mexico, France, Seychelles and the United States of America (Table 3.1.4.1).
31
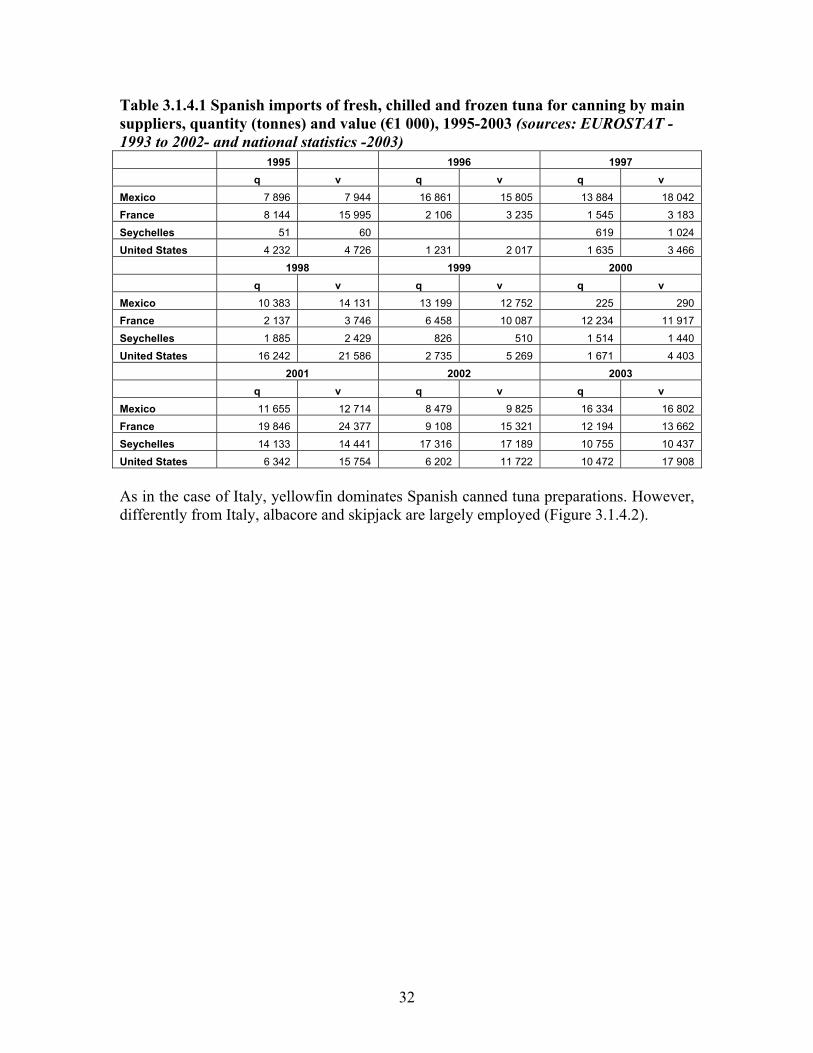
Table 3.1.4.1 Spanish imports of fresh, chilled and frozen tuna for canning by main suppliers, quantity (tonnes) and value (€1 000), 1995-2003 (sources: EUROSTAT -1993 to 2002- and national statistics -2003) 1995 1996 1997 q v q v q v Mexico 7 896 7 944 16 861 15 805 13 884 18 042 France 8 144 15 995 2 106 3 235 1 545 3 183 Seychelles 51 60 619 1 024 United States 4 232 4 726 1 231 2 017 1 635 3 466 1998 1999 2000 q v q v q v Mexico 10 383 14 131 13 199 12 752 225 290 France 2 137 3 746 6 458 10 087 12 234 11 917 Seychelles 1 885 2 429 826 510 1 514 1 440 United States 16 242 21 586 2 735 5 269 1 671 4 403 2001 2002 2003 q v q v q v Mexico 11 655 12 714 8 479 9 825 16 334 16 802 France 19 846 24 377 9 108 15 321 12 194 13 662 Seychelles 14 133 14 441 17 316 17 189 10 755 10 437 United States 6 342 15 754 6 202 11 722 10 472 17 908
As in the case of Italy, yellowfin dominates Spanish canned tuna preparations. However, differently from Italy, albacore and skipjack are largely employed (Figure 3.1.4.2).
32

Spanish imports of fresh and frozen whole tuna for canning by main species (in MT), 2003
Other tunas
AlbacoreSkipjack
Yellow fin
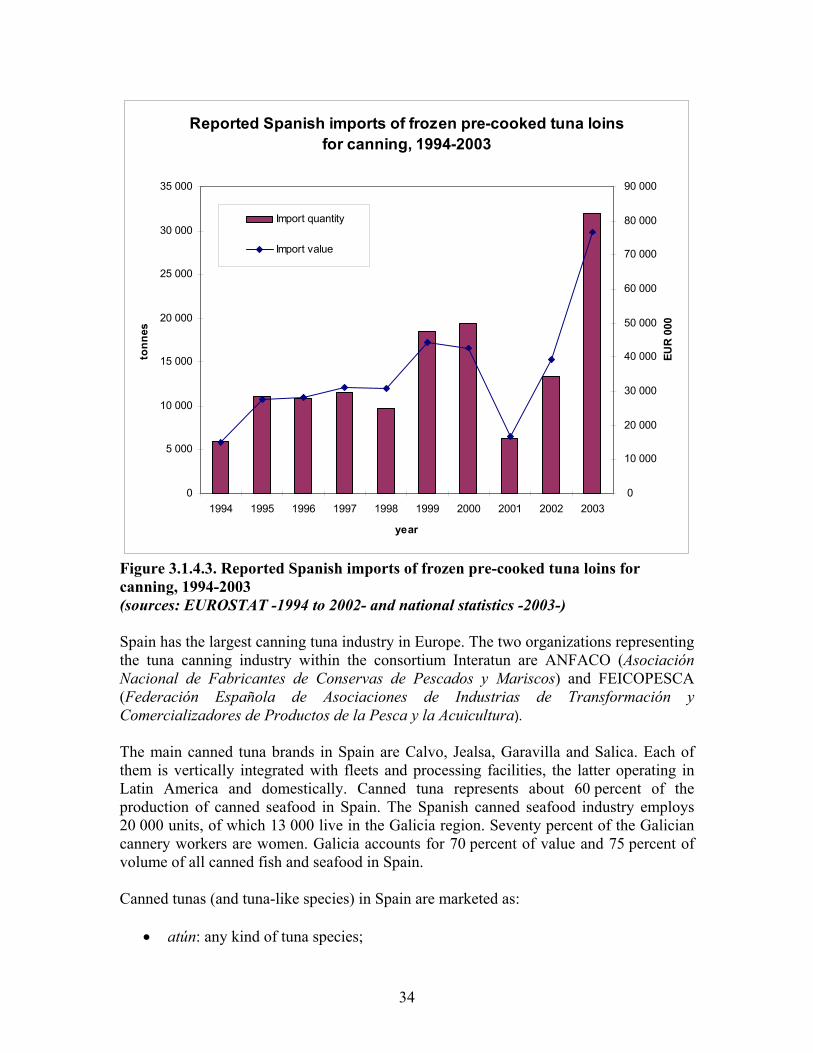
Figure 3.1.4.2. Spanish imports of tuna for canning by main species, quantity 2003 (source: national statistics) In the past years, imports of frozen pre-cooked tuna loins increased from 5 900 tonnes in 1994, worth €15 million, to 31 900 tonnes in 2003, worth €77 million (Figure 3.1.4.3). The main supplier of frozen pre-cooked tuna loins to Spain is Ecuador (sources: EUROSTAT and national statistics).
33
Reported Spanish imports of frozen pre-cooked tuna loins for canning, 1994-2003
0
5 000
10 000
15 000
20 000
25 000
30 000
35 000
1994 1995 1996 1997 1998 1999 2000 2001 2002 2003
year
tonn
es
0
10 000
20 000
30 000
40 000
50 000
60 000
70 000
80 000
90 000
EUR
000
Import quantity
Import value
Figure 3.1.4.3. Reported Spanish imports of frozen pre-cooked tuna loins for canning, 1994-2003 (sources: EUROSTAT -1994 to 2002- and national statistics -2003-) Spain has the largest canning tuna industry in Europe. The two organizations representing the tuna canning industry within the consortium Interatun are ANFACO (Asociación Nacional de Fabricantes de Conservas de Pescados y Mariscos) and FEICOPESCA (Federación Española de Asociaciones de Industrias de Transformación y Comercializadores de Productos de la Pesca y la Acuicultura). The main canned tuna brands in Spain are Calvo, Jealsa, Garavilla and Salica. Each of them is vertically integrated with fleets and processing facilities, the latter operating in Latin America and domestically. Canned tuna represents about 60 percent of the production of canned seafood in Spain. The Spanish canned seafood industry employs 20 000 units, of which 13 000 live in the Galicia region. Seventy percent of the Galician cannery workers are women. Galicia accounts for 70 percent of value and 75 percent of volume of all canned fish and seafood in Spain.
Canned tunas (and tuna-like species) in Spain are marketed as:
• atún: any kind of tuna species;
34
• atún blanco or bonito del Norte: the high priced Thunnus alalunga (instead, bonito is the tuna-like species whose Latin name corresponds to Sarda spp.)
• atún claro: generally tropical tuna of the species Thunnus albacares. Canned tuna in Spain is sold in brine and in vegetable oil and, to a lesser extent, in olive oil. According to FISHSTAT + data, Spanish production of canned tuna increased from 19 700 tonnes in 1976 to 251 000 tonnes in 2002. According to national statistics, in 2003 Spanish exports of canned tuna totalled 71 000 tonnes, worth €246 million. Spanish imports of canned tuna are, traditionally, relatively limited. However, in just one year, Spanish imports of canned tuna increased from 9 900 tonnes, worth €29 million (2002) to 17 200 tonnes, worth €41 million (2003), mainly from Ecuador, where the Garavilla plants are located. Furthermore, Spanish canners, which used to be largely present in Latin America and Morocco with (mostly) loin production facilities, invested €200 million in 2003 to open new canneries in El Salvador (Calvo) and Guatemala (Jealsa). Hence, imports of canned tuna by Spain will be likely to increase in the coming years while mainland canneries will specialize in the processing of value-added products, such as tuna salads.
3.1.5. The United Kingdom The United Kingdom has neither tuna industry, nor tuna fleet, or processing facilities. However, the United Kingdom is one of the world’s largest consumers and importers of tuna. Consumers favour skipjack, even if yellowfin is progressively being introduced in the market because of its superior quality. The traditional upmarket product is solid pack canned skipjack from the pole and line fishery, however lower quality products such as less expensive chunks and flakes were made available increasingly in the market. Yellowfin in olive oil and spring water and albacore in olive oil, the latter imported from Spain, are gaining increasing importance. Albacore fillets in extra-virgin olive oil are considered a gourmet delicacy. Tuna, whether solid pack, in chunks or in flakes, may be found in supermarkets all over the United Kingdom canned in brine, in vegetable oil, and in any other dressing, such as mayonnaise, lemon and garlic but also in exotic-named sauces, such as “1 000 islands” and “Mediterranean”. Tuna in pouch is also gaining increased popularity. As a general rule, tuna is consumed cold and spread on sandwiches; however, several value-added products mushroomed in the most recent times, including:
• tuna paste; • ready-to-eat tuna-based meals; • tuna fillets; • tuna burgers; • tuna steaks.
35

The main tuna companies in the United Kingdom are John West and Princes Food. They cover more than 50 percent of the market of the United Kingdom and have their own canneries, Heinz-John West in the Seychelles and Ghana, and Princes Food in the Mauritius. John West was bought by Heinz from Unilever in 1997. The current ranges of John West products include those listed in Table 3.1.5.1.
Table 3.1.5.1. John West tuna products (source: Bernard O’Brien) Product description Can Size Carton UK Pallet Quantity Origin Tuna Steak in Sunflower Oil 200g 48 77 Ghana/Seychelles/MaldivesTuna Steak in Sunflower Oil 100g 48 154 Ghana/Seychelles/MaldivesTuna Steak in Brine 200g 48 77 Ghana/Seychelles/MaldivesTuna Steak in Brine 100g 48 154 Portugal/Indonesia Tuna Chunks in Sunflower Oil 400g 24 80 Thailand/Ghana Tuna Chunks in Sunflower Oil 185g 48 77 Thailand Tuna Chunks in Brine 400g 24 80 Thailand Tuna Chunks in Brine 185g 48 77 Ghana/Seychelles Tuna Chunks in Springwater 185g 48 77 Ghana Tuna Slices in Sunflower Oil 125g 12 546 Thailand Tuna Slices Smoked in Sunflower Oil 125g 12 546 Thailand Sandwich Tuna in Sunflower Oil 185g 48 77 Ghana/Seychelles Sandwich Tuna in Brine 185g 48 77 Ghana/Seychelles Tuna Specialities Tuna in Mayonnaise & Sweetcorn 185g 24 154 Thailand Tuna in Garlic & Herbs Sauce 185g 24 154 Thailand Tuna in 1000 Island Sauce 185g 24 154 Thailand Tuna with Onions 185g 24 154 Thailand Tuna Salads 3 Bean 192g 24 154 Thailand Indian 192g 24 154 Thailand Mediterranean 192g 24 154 Thailand Sweetcorn & Potato 192g 24 154 Thailand Tuna Meal Makers Tuna Supreme 395g 24 80 Thailand Tuna Chilli 395g 24 80 Thailand Tuna Bolognese 395g 24 80 Thailand All Day Light Meals
36

Tuna Florida 200g 20 140 Thailand Tuna Mediterranean 200g 20 140 Thailand Tuna Italian 200g 20 140 Thailand Lunch Kits Tuna Mayonnaise & Sweetcorn 108g 10 192 Thailand Tuna Garlic & Mayonnaise 108g 10 192 Thailand Tuna 100 Island Dressing 108g 10 192 Thailand Tuna Mediterranean 108g 10 192 Thailand Light Lunch Tuna Light Lunch French Style 250g 6 288 France Tuna Light Lunch Mediterranean 250g 6 288 France Tuna Light Lunch Tomato Salsa 250g 6 288 France Princes Food is owned by Mitsubishi. It mainly sells:
• tuna in sunflower oil 95 g, 195 g and 1880 g • pouch pack tuna in sunflower oil, 1220 g; • tuna in brine 95 g, 195 g and 1880 g; • tuna with vegetables in sauce, 90g and 185 g; • tuna in olive oil, 160 g; • pouch pack tuna in olive oil, 80 g; • smoked tuna, 185 g; • tuna Mexicana, 185 g; • tuna in curry sauce, 185 g; • tuna in Thai sauce, 185 g; • tuna in tomato sauce, 185 g; • tuna belly (ventresca) in olive oil, 110 g.
Other than the traditional brands, supermarkets such Sainsbury’s and Tesco are selling their own canned tuna products, from the lower end such as skipjack chunks or flakes in brine, to high quality products such as albacore in extra-virgin olive oil from the Bay of Biscay, marketed under the Sainsbury’s “Taste the Difference” line. The United Kingdom is a traditional importer of canned tuna, the largest importer of canned tuna within the EU. Imports of canned tuna to the United Kingdom increased from 42 200 tonnes in 1988, worth €106 million, to 138 300 tonnes in 2002, worth €340 million (Figure 3.1.5.1).
37

Imports of canned tuna by the United Kingdom, 1988-2002.
0
20 000
40 000
60 000
80 000
100 000
120 000
140 000
160 000
1988 1989 1990 1991 1992 1993 1994 1995 1996 1997 1998 1999 2000 2001 2002
year
tonn
es
0
50 000
100 000
150 000
200 000
250 000
300 000
350 000
400 000
EUR
000
Importquantity
Importvalue
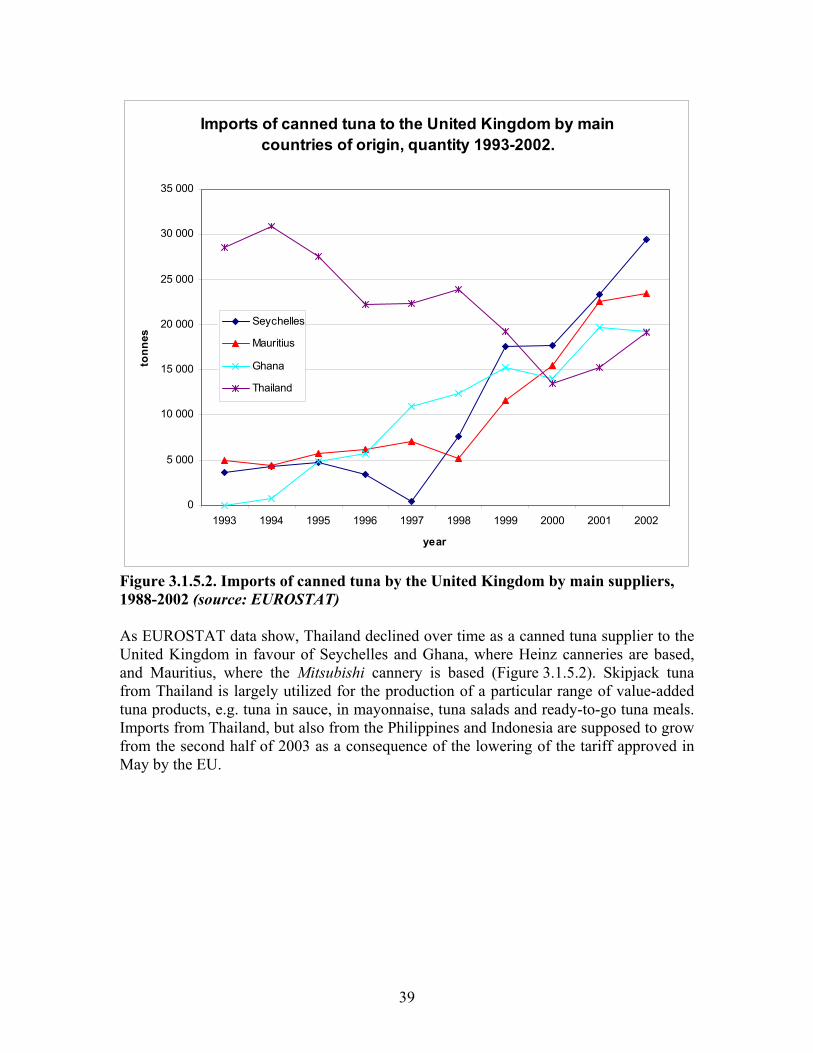
Figure 3.1.5.1. Imports of canned tuna by the United Kingdom, 1988-2002 (source: EUROSTAT) According to EUROSTAT data, the main suppliers of canned tuna to the United Kingdom are Seychelles, Mauritius, Ghana and Thailand (Figure 3.1.5.2). Traditionally, Thailand has been the main supplier of canned tuna to the United Kingdom. As a matter of fact, EU imports of canned tuna from Thailand have been historically hit by a 24 percent duty rate, while Heinz and Mitsubishi own canneries in the ACP benefiting from 0 percent duty rate upon imports of canned tuna into the EU. On May 2003, the EU tariff applied to canned tuna imports from Thailand, the Philippines and Indonesia was lowered to 12 percent for a quota of 25 000 tonnes.
38
Imports of canned tuna to the United Kingdom by main countries of origin, quantity 1993-2002.
0
5 000
10 000
15 000
20 000
25 000
30 000
35 000
1993 1994 1995 1996 1997 1998 1999 2000 2001 2002
year
tonn
es
Seychelles
Mauritius
Ghana
Thailand
Figure 3.1.5.2. Imports of canned tuna by the United Kingdom by main suppliers, 1988-2002 (source: EUROSTAT) As EUROSTAT data show, Thailand declined over time as a canned tuna supplier to the United Kingdom in favour of Seychelles and Ghana, where Heinz canneries are based, and Mauritius, where the Mitsubishi cannery is based (Figure 3.1.5.2). Skipjack tuna from Thailand is largely utilized for the production of a particular range of value-added tuna products, e.g. tuna in sauce, in mayonnaise, tuna salads and ready-to-go tuna meals. Imports from Thailand, but also from the Philippines and Indonesia are supposed to grow from the second half of 2003 as a consequence of the lowering of the tariff approved in May by the EU.
39

3.2. The United States of America At present, the three main tuna canners in the United States are:
• Starkist, owned by Del Monte, covering 40 percent of the United States’ market; • Bumble Bee Seafoods LLC, owned by the investment firm Centre Partners
Management Ltd, covering 24 percent of the market; • Chicken of the Sea, owned by Thai Union International Inc., covering 17 percent
of the market. During the eighties, the United States tuna fleet was moved to foreign flags because of the high cost of fuel and insurance as well as bureaucratic restrictions. This process went together with a reorganization of the canneries, which moved away from the mainland to cheaper labour cost areas such as Puerto Rico, for tuna caught in the Eastern Central Pacific, and American Samoa, for tuna caught in the Western Central Pacific. In the past fifteen years, the canned tuna industry underwent a period of crisis, due to the tuna-dolphin issue, to poor marketing strategies, and to government’s warnings to limit eating of canned seafood because of mercury contents. One of the highest-profiled crises of the world tuna industry, and still unresolved from 1990, was determined by the tuna-dolphin issue. In May 1990 the main North American canners decided not to process any more tuna caught in association with dolphins, therefore leading most of the tuna fleets to move from the Eastern Pacific, where dolphins and yellowfin tuna form mixed schools, to the Western Pacific, also creating the conditions for an embargo to countries catching tuna by using the “encircling” tuna and dolphins practice, such as Mexico. In 1991 Mexico complained under the GATT (General Agreement on Tariffs and Trade) dispute settlement procedure. The panel reported to GATT members in September 1991. It ended with the United States not being allowed to set an embargo on imports of tuna products from Mexico just because Mexican regulations on the way tuna was produced did not satisfy United States’ regulations. However, the United States could apply its regulations on the quality or content of the tuna imported. Furthermore, GATT rules did not allow a country to take measures to force other countries to implement its domestic legislation (extra-territoriality). However, the panel report was never adopted. Therefore, Mexico and the United States held their own bilateral consultations aimed at reaching an agreement outside GATT. The outcome of the consultations was the Agreement on the International Dolphin Conservation Program (AIDCP), entered into force in 1999. By the end of December 2002, the Department of Commerce of the United States ruled that encircling dolphins would not significantly harm them, through the implementation of the measures set forth by the AIDCP. Should all encircled dolphins be safely rescued from the nets, the tuna could be marketed as dolphin-safe, as opposed to the previous definition of “dolphin-safe”, introduced by the Earth Island Institute (EII), which
40
excluded the labelling of “dolphin-safe” to any tuna caught by using the practice of encircling. EII and other environmental NGOs immediately filed a lawsuit against the decision by the Department of Commerce. In early April 2003, the Federal Court in San Francisco granted an injunction to implement the new definition on the basis of the reliance, by the Department of Commerce, on factors which the Congress of the United States did not intend to consider, and the demonstration by the plaintiffs that they were likely to succeed on their claim that the final finding of the Department of Commerce was contrary to the best available scientific evidence. By the end of the nineties, the methyl mercury scare severely affected tuna consumption and imports in the United States. Mercury occurs naturally in the environment, it can be released into the air through industrial pollution and it can be absorbed by surface waters. Bacteria living in water convert inorganic mercury into methyl mercury, and fish absorb it through the water itself and by feeding on other aquatic organisms. Clearly, long-lived, larger predators such as sharks, tilefish (Macalanthidae), swordfish and king mackerel (Scomberomorus cavalla) tend to accumulate the highest levels of methyl mercury. According to the United States’ Food and Drug Administration (FDA), swordfish has an average concentration of methyl mercury of 1 ppm, shark has an average concentration of 0.96 ppm, fresh/frozen tuna has an average concentration of 0.32 ppm and canned tuna has an average concentration of 0.17 ppm. In fact, while tuna steaks are taken from older, larger tunas, tunas for canning are younger and smaller individuals with lower methyl mercury concentration. Methyl mercury is mainly found in the fish muscles (fillets), bound to proteins. Skinning and trimming the fish does not reduce the mercury concentration, and the cooking process increases the concentration of mercury, resulting from elimination of the moisture. The primary danger of methyl mercury in fish is the harmful effect it has on the development of the nervous system in unborn children and in children of less than six years of age. Therefore, in March 2001, the United Stated Food and Drug Administration issued a consumer advisory warning pregnant women and women of childbearing age who may become pregnant about the risk of mercury poisoning. According to the FDA, while pregnant women and women of childbearing age who want to become pregnant should abstain from eating sharks, tilefish, swordfish and king mackerel, they may nevertheless eat twelve ounces per week (0.454 kg) of other cooked fish. Because of the chronic toxicity of methyl mercury on the cardiovascular and immune system, in June 2001, the Environmental Protection Agency (EPA) set more precise and stringent limits, according to which adult consumers (70 kg body weight) were recommended to limit their monthly fish intake to, inter alia:
• 4 meals (0.908 kg) per month of fish with 0.12 to 0.24 ppm methyl mercury concentration levels, this group possibly including canned tuna according to the estimates made by FDA; or
41
• 3 meals (0.681 g) per month of fish with 0.24 to 0.32 ppm methyl mercury concentration levels, this group possibly including fresh and frozen tuna; or
• 2 meals (0.454 kg) per month of fish with 0.32 to 0.48 ppm methyl mercury concentration levels, this group possibly including fresh and frozen tuna.
EPA’s warning concerns, first and foremost, women of childbearing age who eat more than 10 g of fish a day and women of childbearing age who eat fish with high methyl mercury levels. Some states have set even more stringent protection levels. Later on, EPA and FDA’s warnings were incorporated in a “Draft Advice For Women Who Are Pregnant, Or Who Might Become Pregnant, and Nursing Mothers, About Avoiding Harm To Your Baby Or Young Child From Mercury in Fish and Shellfish”. The advisory can be easily summarised into its three rules for pregnant, pregnant-to-be, nursing women and young children:
1. do not eat shark, swordfish, king mackerel or tilefish because they contain high levels of mercury;
2. levels of mercury in other fish can vary. You can safely eat up to 12 ounces (2 to 3 meals) of other purchased fish and shellfish a week. Mix up the types of fish and shellfish you eat and do not eat the same type of fish and shellfish more than once a week;
3. Check local advisories about the safety of fish caught by family and friends in your local rivers and streams. If no advice is available, you can safely eat up to 6 ounces (one meal) per week of fish you catch from local waters, but do not consume any other fish during that week.
On 22 March 2004, the FDA and EPA issued a new advisory acknowledging the low concentration of mercury in canned light meat tuna, but at the same time recommending pregnant, pregnant-to-be, nursing women and young children not to exceed the consumption of canned albacore to six ounces (one average meal) per week. In fact, according to FDA, albacore has a higher mercury concentration than other tunas. As a consequence of the canned tuna industry crisis, landings, consumption and imports of tuna in the United States declined in the past twenty years. The annual eatings of canned tuna per capita declined from 13.3 in 1990 to 10.2 in 2000; the percentage of households eating canned tuna at least once a year declined from 80.7 percent in 1997 to 77.1 percent in 2000. Statistics compiled by the NMFS showed that in 2001 1.54 kg of shrimp per person was consumed, against the 1.32 kg per person of tuna. According to FISHSTAT +, total landings of commercial tuna species declined from 301 000 tonnes in 1976 to 154 200 tonnes in 2002. United States’ imports of fresh and frozen tuna declined from 205 900 tonnes in 1989, worth US$267 million, to 45 000 tonnes in 2003, equivalent to US$240 million (NMFS data). According to NMFS data, the United States mostly imports fresh yellowfin (15 300 tonnes), followed by frozen albacore (12 600 tonnes). Fresh yellowfin is mostly imported for direct consumption, while frozen albacore is imported for canning.
42

In principle, all fresh, chilled and frozen tuna imports into the United States enjoy a duty-free status6. In turn, frozen pre-cooked loins, canned tuna and tuna in pouch are subject to tariffs. Like the EU, United States’ tariffs are subject to a tiered structure composed by a general tariff and a series of tariff preferences. The tariff preferences which are relevant to the import of tuna loins and canned tuna are:
• the duty-free status for products entering the United States from its insular possessions, such as American Samoa and Puerto Rico;
• the duty-free status for product from Australia, granted on February 2004; • the Compact of Free Association between the United States, the Federated States
of Micronesia and the Marshall Islands; it provides duty-free treatment for products from Micronesia and the Marshall islands entering the United States up to a quota worth 10 percent of the United States’ yearly canned tuna consumption;
• the GSP, applied to developing countries (in the case of canned tuna and tuna loins, generally to least developed countries only) which are members of the WTO and the International Monetary Fund (IMF) and share some democracy and market economy characteristics;
• the North American Free Trade Agreement (NAFTA) between the United States, Canada and Mexico, aimed at creating a free trade area in the region;
• the African Growth and Opportunity Act (AGOA)7, aimed at promoting development in Sub-Saharan Africa through, inter alia, tariff reduction, providing pre-requisites of market economy, democracy, protection of human rights and fundamental freedom and elimination of barriers to United States’ investments;
• the Caribbean Basin Economic Recovery Act (CBERA) and the United States-Caribbean Basin Trade Partnership Act (CBTPA)8, encompassing trade concession for the Caribbean basin, preliminary steps towards the United States-Central American Free Trade Agreement, or CAFTA;
• the free trade areas with Chile, Israel, Jordan and Singapore; • the Andean Community and Andean Trade Preference Act (ATPA), amended by
the Andean Trade Promotion and Drug Eradication Act (ATPDEA), including tariff concessions for Colombia, Ecuador, Peru and Bolivia.
Like in Europe, in the United States the phenomenon of “loining” gained momentum during the nineties. The United States imports frozen pre-cooked loins to be processed
6 However, Mexico and all countries fishing yellowfin tuna in the Eastern Pacific Ocean are still hit by the de facto embargo posed by North American tuna canners on yellowfin caught by the practice of encircling dolphins for animal welfare reasons. 7 Countries eligible under the AGOA regime are: Benin; Botswana; Cameroon; Cape Verde; Chad; the Congo; Côte d'Ivoire; the Democratic Republic of the Congo; Djibouti; Ethiopia; Gabon; The Gambia; Ghana; Guinea; Guinea-Bissau; Kenya; Lesotho; Madagascar; Malawi; Mali; Mauritania; Mauritius; Mozambique; Namibia; the Niger; Nigeria; Rwanda; Sao Tome and Principe; Senegal; Seychelles; Sierra Leone; South Africa; Swaziland; Tanzania; Uganda and Zambia. 8 Countries eligible under CBERA and CBTPA are: Antigua and Barbuda; Anguilla; Aruba; the Bahamas; Barbados; Belize; the British Virgin Islands; Cayman Islands; Costa Rica; Dominica; the Dominican Republic; El Salvador; Grenada; Guatemala; Guyana; Haiti; Honduras; Jamaica; Montserrat; the Netherlands Antilles; Nicaragua; Panama; Saint Kitts and Nevis; Saint Lucia; Saint Vincent and the Grenadines; Suriname; Trinidad and Tobago and the Turks and Caicos Islands.
43

into canned tuna in the two canneries in American Samoa, belonging to Starkist and Chicken of the Sea, and in the two canneries left in California and Puerto Rico, both belonging to Bumble Bee. Imports of tuna loins increased from 3 600 tonnes in 1989, worth US$6 million, to 51 600 tonnes in 1999, worth US$125 million. In the years that followed, imports of tuna loins declined slightly to 32 400 tonnes in 2001, worth US$92 million, and picked up slightly in 2003 to 43 800 tonnes, worth US$109 million9 (Figure 3.2.1).
Reported imports of tuna loins by the United States, 1989-2003.
0
5 000
10 000
15 000
20 000
25 000
30 000
35 000
40 000
45 000
50 000
55 000
60 000
1989 1990 1991 1992 1993 1994 1995 1996 1997 1998 1999 2000 2001 2002 2003
year
tonn
es
0
20 000
40 000
60 000
80 000
100 000
120 000
140 000
US$
000
Import quantity
Import value
Figure 3.2.1. Reported imports of frozen tuna loins by the United States, 1989-2003 (source: National Marine Fisheries Service, NMFS) Tuna loins over 6.8 kg are subject to a general tariff of 1.1 cents per kg., to a special free-trade treatment for GSP-eligible LDCs, Canada, AGOA, CBERA, Chile, Israel, ATPA and ATPDEA, Jordan, Singapore and to a special tariff of 0.2 cents per kg to Mexico. Other tuna loins (under 6.8 kg) are subject to a general tariff of 6 percent, to a special free-trade treatment for all GSP countries with the exception of Thailand, and for Canada, CBERA, Chile, Israel, Jordan, ATPA and ATPDEA, Mexico, and to a special tariff of 4.5 percent to Singapore. Main suppliers of tuna loins to the United States are:
• Fiji and Trinidad and Tobago, where the Bumble Bee canneries are located; • Ecuador, where Starkist and Bumble Bee plants are located;
9 However, the data above may be under-representative of the real extent of the utilization of the tuna loins by the United States’ industry.
44

• Thailand, where the Thai Union – Chicken of the Sea cannery is located. Ecuador is declining as a supplier of loins to the United States market presumably because the Starkist and Bumble Bee canneries are now more concentrated in the production of canned tuna and tuna in foil pouches. Table 3.2.1. Main suppliers of tuna loins to the United States, quantity (tonnes) and value (US$ 1000), 1999-2003 (source: NMFS) Country 1999 2000 2001 2002 2003
q v q v q V q v q v
Fiji 2 972 2 297 3 089 7 782 11 522 49 163 10 852 45 676 11 917 47 128
Trinidad and Tobago 0 0 0 0 0 0 2 162 2 953 11 115 14 436
Ecuador 28 958 76 190 31 856 71 535 16 177 32 610 12 866 26 936 10 901 26 933
Thailand 13 829 33 579 7 706 13 921 4 105 9 034 6 349 15 083 9 645 20 406
The canners. Starkist, Bumble Bee and Chicken of the Sea have canneries in the mainland (California), in overseas territories (Puerto Rico and especially American Samoa) and abroad (Ecuador, Fiji and Trinidad and Tobago). In order to cut production costs, canneries were progressively moved from the mainland to Puerto Rico and American Samoa first, and then to third countries. Mainland. The only cannery left in the mainland belongs to Bumble Bee and it is located in Santa Fe Spring. It processes canned tuna from loins. The Starkist cannery in Terminal Island closed in 1979, the Chicken of the Sea cannery and the Bumble Bee cannery in San Diego closed in 1981 and 1982, respectively; the Terminal Island cannery of Chicken of the Sea closed in 2001. Puerto Rico. All major tuna brands in the United States used to operate canneries in Puerto Rico. However, owing to higher labour costs and higher raw material costs, in combination with depressed supply of raw material from the Eastern Central Pacific as a consequence of the tuna-dolphin issue, the Chicken of the Sea plant in Ponce was closed in 1990 and the Starkist plant in Mayaguez was closed in 2001. Now there is only one cannery left, belonging to Bumble Bee. American Samoa. Currently, the main Starkist and Chicken of the Sea canneries are located in American Samoa, which is certainly less expensive in terms of production factors than California, and also less expensive than Puerto Rico. However, American Samoa still remains relatively more expensive than countries like Thailand and the Philippines, but the canneries in American Samoa enjoy economies of scale and they are able to produce efficiently duty-free canned tuna for the United States’ market.
45
Third countries. United States’ brands also operate canneries abroad. Starkist and Bumble Bee are operating plants in Ecuador, Bumble Bee is also operating a plant in Fiji and Trinidad. Furthermore, Thai Union, the owner of Chicken of the Sea, is a major tuna canner in Thailand. The Starkist cannery in American Samoa produces about 60 percent of the total American canned tuna production while the Chicken of the Sea cannery in the same insular possession produces the remaining 40 percent. Seventy percent of the supplies to the two canneries come from the United States tuna fleet operating in the region. Due to the stiff competition by Latin American and Asian canners, the American Samoan canneries are trying to cut production costs by bringing in frozen pre-cooked tuna loins from other countries such as the Pacific Island countries, Thailand and Ecuador. According to FISHSTAT +, production of canned tuna in the United States averaged 280 000 tonnes in the 1976-2000 period, dropped to 230 300 tonnes in 2001 and picked up slightly to 248 100 tonnes in 2002. In turn, imports of canned tuna (excluding tuna in foil pouches) by the United States, while declining in the 1989-1996 period, increased from 87 600 tonnes in 1996, worth US$216 million, to 167 500 tonnes in 2003, equivalent to US$324 million (Figure 3.2.2).
46

Imports of canned tuna by the United States, 1989-2003.
0
50 000
100 000
150 000
200 000
1989 1990 1991 1992 1993 1994 1995 1996 1997 1998 1999 2000 2001 2002 2003
year
tonn
es
0
50 000
100 000
150 000
200 000
250 000
300 000
350 000
400 000
US$
000
Import quantity
Import value
Figure 3.2.2. Imports of canned tuna10 by the United States, 1989-2003 (source: NMFS) According to NMFS data, the main supplier of canned tuna to the United States (excluding tuna in foil pouches) is by far Thailand, followed by the Philippines, Ecuador and Indonesia. Table 3.2.2. Main suppliers of canned tuna11 to the United States, quantity (tonnes) and value (US$1 000), 1999-2003 (source: NMFS)
Country 1999 2000 2001 2002 2003 q v q v q v q v q v Thailand 86 335 201 956 79 929 155 435 64 037 167 503 68 542 162 729 79 906 156 714
The Philippines 38 592 69 476 35 253 46 530 28 164 42 582 34 174 54 265 38 382 57 879 Ecuador 1 884 7 326 2 379 6 267 14 617 44 221 23 595 73 578 23 424 49 620 Indonesia 17 435 40 341 13 392 30 383 15 215 37 044 14 207 34 926 16 954 39 804
Tuna chunks and flakes in pouch are a relatively new product in the world market of tuna. The success of tuna in pouch in the United States is largely a consequence of the practicality of its packaging, which makes the preparation of sandwiches and salads 10 Excluding tuna in foil pouches. 11 Excluding tuna in foil pouches.
47

extremely quick. Imports of tuna in pouch increased from 18 600 tonnes in 2002, equivalent to US$49 million, to 40 700 tonnes in 2003, equivalent to US$132 million. The main suppliers of tuna in pouch to the United States are Ecuador and Thailand. Table 3.2.3. Main suppliers of tuna in foil pouches to the United States, 2002-2003 (source: NMFS) Country 2002 2003 tonnes US$1000 tonnes US$1000 Ecuador 12 479 32 483 21 280 70 444 Thailand 3 897 12 321 16 081 53 228
Total (including others) 18 595 48 882 40 667 131 788 The tariffs applied to imports of canned tuna in oil, both in tin and in pouch, by the United States are:
• a general tariff of 35 percent; • a special duty-free treatment allowed to GSP-eligible LDCs, Canada, AGOA and
Israel; • a special tariff of 9.3 percent to Mexico and CBTPA; • a special tariff of 21 percent to Jordan; and • a special tariff of 31.5 percent to Chile and Singapore.
The tariffs applied to imports of canned tuna not in oil, both in tin and in pouch (within the quota12) are:
• a general tariff of 6 percent; • a special duty-free treatment allowed to GSP-eligible LDCs, Canada, AGOA,
Israel and Jordan; • a special tariff of 1.6 percent to Mexico and CBTPA; • a special tariff of 4.5 percent to Singapore; • a special tariff of 5.4 percent to Chile.
The tariffs applied to canned tuna not in oil, both in tin and in pouch, outside the quota, are:
• a general tariff of 12.5 percent; • a special duty-free treatment allowed to GSP-eligible LDCs, Canada, AGOA and
Israel; • a special tariff of 3.3 percent to Mexico and CBTPA; • a special tariff of 2.5 percent to Jordan; • a special tariff of 10.9 percent to Singapore;
12 4.8 percent of apparent United States consumption of canned tuna during the immediately preceding year.
48
• a special tariff of 11.2 percent to Chile. The only duty-free concession given to the ATPA-ATPDEA on processed tuna is the faculty, given to the President of the United States, to allow such Andean countries duty-free treatment for tuna in pouch, with the stipulation that tuna must originate from Andean or United States vessels and must be processed in companies of ATPA ownership. Duty-free treatment for tuna in pouch from Bolivia, Colombia, Ecuador and Peru is registered by US Harmonized Tariff Schedule under chapter 98 “Special classification provisions”, heading 9821.01.01. Overall, in 2003 the United States imported 252 000 tonnes of processed tuna, of which: canned tuna (167 500 tonnes, 66 percent of total imports), frozen pre-cooked tuna loins for canning (43 800, 17 percent) and tuna in foil pouches (40 700, 16 percent). Thailand and Ecuador are the main suppliers of processed tuna to the United States. While the Thai tuna industry developed independently from international donors, the Ecuadorian tuna industry was set up with the help of North American investors. The purpose was to grant a constant supply of canned tuna to the market of the United States. At present, with 68 purse seiners operating mainly in international waters, Ecuador is now the most important tuna fishing country in the Eastern Pacific Ocean. Ecuadorian catches of commercial tuna species are concentrated in the Southeast Pacific. The main targeted species is skipjack, followed by yellowfin and bigeye. Ecuadorian catch of tuna increased from 2 900 tonnes in 1950 to 199 500 tonnes in 1999, to decline to 135 400 tonnes in 2002 (FISHSTAT + data). There are about 20 companies currently involved in tuna processing, with an installed capacity of some 120 000 tonnes/year. Circa 90 percent of the processing and canning plants are located in Manta. The historical series of production shows an increasing trend, from 2 400 tonnes of canned tuna produced in 1976 to 80 300 tonnes in 2002, including loins (FISHSTAT + data).
3.3. Mexico The expansion of the Mexican tuna industry occurred in the eighties, further to the development of the purse seine fleet, most of the vessels being of United States’ origin. After the initial stage, many national vessels, as well as some imported from other countries, joined the Mexican tuna fleet. In the nineties, the number of vessels had been increasing steadily. In 2000, the tuna fleet reached 123 vessels, with a 52 percent increase when compared to the 81 vessels registered in 1991. The catch of commercial tuna species in Mexico increased from 200 tonnes in 1954 to the peak of 166 000 tonnes in 1997, declining to 120 400 tonnes in 2000 and picking up to 160 200 tonnes in 2002. The main landed species is yellowfin tuna in the Eastern Central Pacific (FISHSTAT + data). Mexico is also an important producer and exporter of wild and farmed Pacific bluefin tuna for the Japanese sashimi market.
49
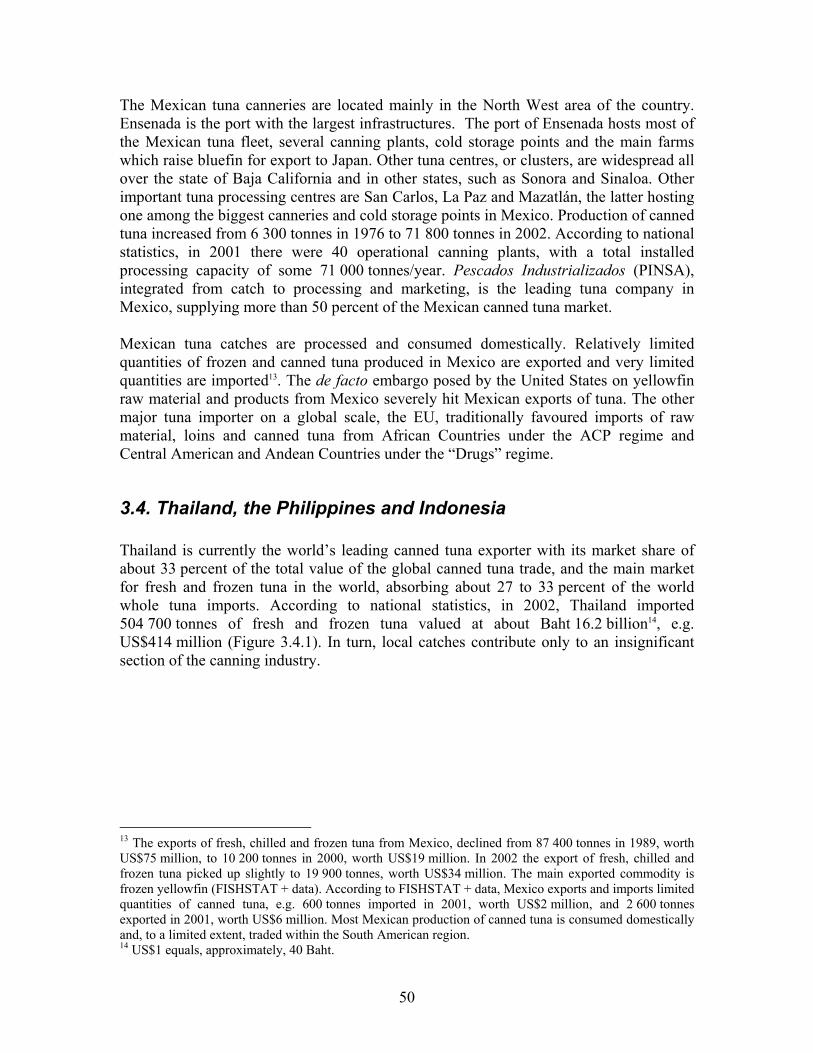
The Mexican tuna canneries are located mainly in the North West area of the country. Ensenada is the port with the largest infrastructures. The port of Ensenada hosts most of the Mexican tuna fleet, several canning plants, cold storage points and the main farms which raise bluefin for export to Japan. Other tuna centres, or clusters, are widespread all over the state of Baja California and in other states, such as Sonora and Sinaloa. Other important tuna processing centres are San Carlos, La Paz and Mazatlán, the latter hosting one among the biggest canneries and cold storage points in Mexico. Production of canned tuna increased from 6 300 tonnes in 1976 to 71 800 tonnes in 2002. According to national statistics, in 2001 there were 40 operational canning plants, with a total installed processing capacity of some 71 000 tonnes/year. Pescados Industrializados (PINSA), integrated from catch to processing and marketing, is the leading tuna company in Mexico, supplying more than 50 percent of the Mexican canned tuna market. Mexican tuna catches are processed and consumed domestically. Relatively limited quantities of frozen and canned tuna produced in Mexico are exported and very limited quantities are imported13. The de facto embargo posed by the United States on yellowfin raw material and products from Mexico severely hit Mexican exports of tuna. The other major tuna importer on a global scale, the EU, traditionally favoured imports of raw material, loins and canned tuna from African Countries under the ACP regime and Central American and Andean Countries under the “Drugs” regime.
3.4. Thailand, the Philippines and Indonesia Thailand is currently the world’s leading canned tuna exporter with its market share of about 33 percent of the total value of the global canned tuna trade, and the main market for fresh and frozen tuna in the world, absorbing about 27 to 33 percent of the world whole tuna imports. According to national statistics, in 2002, Thailand imported 504 700 tonnes of fresh and frozen tuna valued at about Baht 16.2 billion14, e.g. US$414 million (Figure 3.4.1). In turn, local catches contribute only to an insignificant section of the canning industry.
13 The exports of fresh, chilled and frozen tuna from Mexico, declined from 87 400 tonnes in 1989, worth US$75 million, to 10 200 tonnes in 2000, worth US$19 million. In 2002 the export of fresh, chilled and frozen tuna picked up slightly to 19 900 tonnes, worth US$34 million. The main exported commodity is frozen yellowfin (FISHSTAT + data). According to FISHSTAT + data, Mexico exports and imports limited quantities of canned tuna, e.g. 600 tonnes imported in 2001, worth US$2 million, and 2 600 tonnes exported in 2001, worth US$6 million. Most Mexican production of canned tuna is consumed domestically and, to a limited extent, traded within the South American region. 14 US$1 equals, approximately, 40 Baht.
50
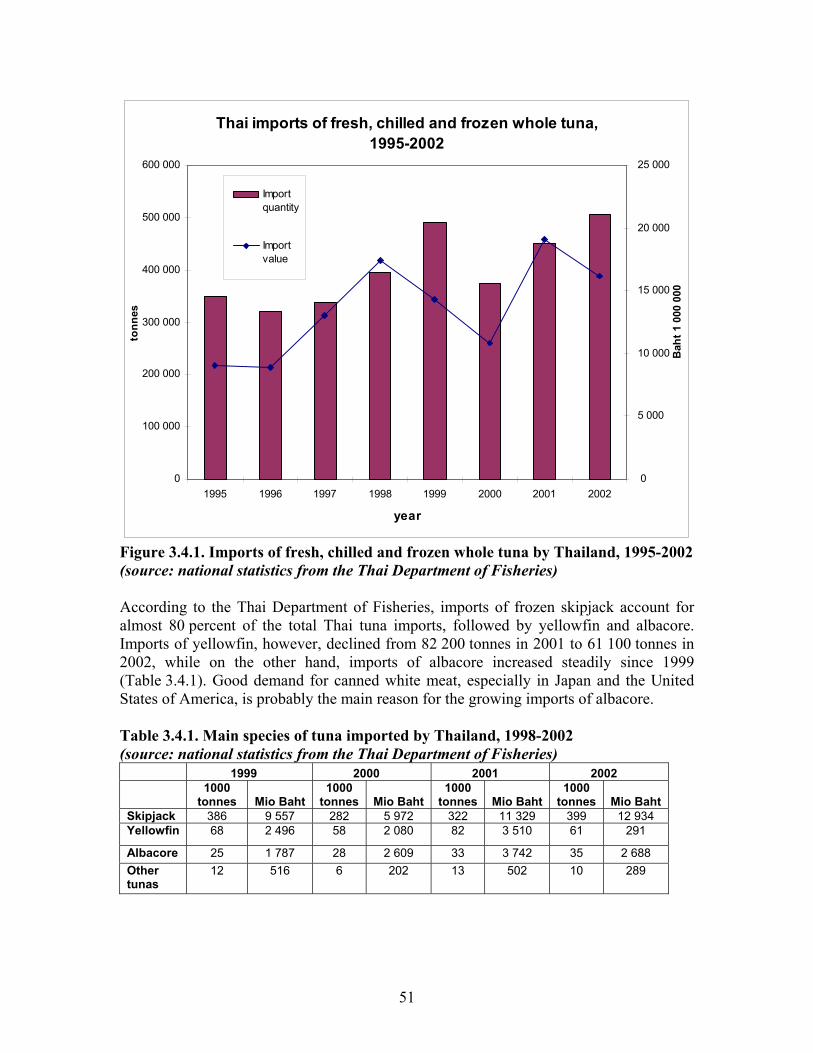
Thai imports of fresh, chilled and frozen whole tuna, 1995-2002
0
100 000
200 000
300 000
400 000
500 000
600 000
1995 1996 1997 1998 1999 2000 2001 2002
year
tonn
es
0
5 000
10 000
15 000
20 000
25 000
Bah
t 1 0
00 0
00
Importquantity
Importvalue
Figure 3.4.1. Imports of fresh, chilled and frozen whole tuna by Thailand, 1995-2002 (source: national statistics from the Thai Department of Fisheries) According to the Thai Department of Fisheries, imports of frozen skipjack account for almost 80 percent of the total Thai tuna imports, followed by yellowfin and albacore. Imports of yellowfin, however, declined from 82 200 tonnes in 2001 to 61 100 tonnes in 2002, while on the other hand, imports of albacore increased steadily since 1999 (Table 3.4.1). Good demand for canned white meat, especially in Japan and the United States of America, is probably the main reason for the growing imports of albacore. Table 3.4.1. Main species of tuna imported by Thailand, 1998-2002 (source: national statistics from the Thai Department of Fisheries)
1999 2000 2001 2002
1000
tonnes Mio Baht 1000
tonnes Mio Baht 1000
tonnes Mio Baht 1000
tonnes Mio Baht Skipjack 386 9 557 282 5 972 322 11 329 399 12 934 Yellowfin 68 2 496 58 2 080 82 3 510 61 291
Albacore 25 1 787 28 2 609 33 3 742 35 2 688 Other tunas
12 516 6 202 13 502 10 289
51

Thailand imports tuna mainly from countries fishing in the Western and Central Pacific Ocean and Indian Ocean. The main tuna suppliers to Thailand are Taiwan Province of China, Japan, the Republic of Korea, Maldives, Seychelles and Indonesia (Table 3.4.2). Table 3.4.2. Main suppliers of fresh and frozen tuna to Thailand, quantity (tonnes) and value (Baht 1 million), 1999-2002 (source: national statistics from the Thai Department of Fisheries)
1999 2000 2001 2002
Country/Territory Q v q v q v q v Taiwan PC 105 269 3 073 93 946 2 892 127 791 6 040 117 340 4 548Japan 38 329 1 871 25 217 1 151 42 218 1 892 47 180 2 182Maldives 15 188 347 11 497 225 8 336 248 30 315 935Seychelles 13 867 284 20 179 510 14 019 574 23 983 888Rep. of Korea 30 976 951 11 936 282 16 049 701 16 928 716Indonesia 7 040 192 5 736 135 7 977 300 5 702 213United States 6 079 172 773 49 4 154 238 2 855 115France 610 17 19 2 1 300 60 900 28Singapore 43 350 750 6 279 617 451 45 640 48Others 229 966 6 668 272 176 7 344 226 269 8 889 250 502 8 762 Frozen skipjack price in Bangkok (Figure 3.4.2) is considered as a barometer of the world skipjack price, as the former will directly influence price levels in other parts of the world. The price movement is usually determined by certain factors such as:
• fishing seasons and catch level (especially in the Western Pacific Ocean and Indian Ocean);
• level of skipjack stocks in cold storage holdings; and • global canned tuna market situation.
As Figure 3.4.2 shows, from 1994 to 1998, skipjack prices were increasing on average due to buoyant demand of skipjack by canneries and relatively low (albeit increasing) catches15. The low catch trend continued until prices of frozen skipjack reached their all time high in April 1998, at US$1 250/tonnes. Subsequently, skipjack caches increased exponentially until oversupply turned into a persisting phenomenon (for two years). Between May and December 2000, skipjack prices reached their minimum levels (US$400/tonnes).
15 The low catches of mid-decade generated an increase in skipjack prices to US$1 100/tonnes in August to September 1995. As a result, the Thai canning giant UNICORD remained closed in those months. 1996 was an extremely unstable year for skipjack due to a period of low catches and high prices in the first nine months of the year; at the same time, UNICORD in Thailand could not re-open its canneries and was forced to sell the recently-acquired (1989) United States’ canner Bumble Bee. The UNICORD crisis is reflected in the import figures of skipjack tuna and production of canned tuna in Thailand. Thai imports of frozen tuna declined from 400 000 tonnes in 1995 to 316 800 tonnes in 1996; Thai production of canned tuna declined from an estimated 221 300 tonnes in 1995 to an estimated 188 400 tonnes in 1996 (FISHSTAT + data).
52

On 1 December 2000, the Second World Tuna Boat Owners Meeting (now institutionalized as World Tuna Purse Seine Organization, WTPO), decided for a drastic reduction in skipjack fishing, e.g. all participating countries decided to stop fishing for a minimum of 30 days, for the next 60 days, or to implement a reduction of 35 percent in their fishing effort. Further to these measures the market stabilized in 2001, but prices started to decline once again in 2002. The so-called “Bangkok bottleneck” between the end of 2002 and the beginning of 2003 was brought about by vessels in the Indian and Atlantic Ocean selling and unloading their fish in the nearby Bangkok market instead of using traditional sales’ channels such as Seychelles, Mauritius and Maldives. With an already oversupplied Bangkok market, this practice causes world skipjack prices to drop as a consequence. In February 2003, the solution proposed by the WTPO consisted in the reduction of skipjack catches by increasing the number of days in port, and the commitment by the French and Spanish fleet not to supply the Bangkok market below the current market levels. Because of the unwillingness of members to complying with the WTPO recommendations as they stood, the recommendations were reformulated two months later. By that time (late April 2003) frozen skipjack prices had dropped to US$450/tonnes. In the months which followed, WTPO-led supply reduction measures and a natural decline in catches generated a continuous increase in skipjack prices in the Bangkok market from US$500/tonnes in May 2003 to US$860/tonnes in February 2004 and US$850/tonnes in March 2004.
53
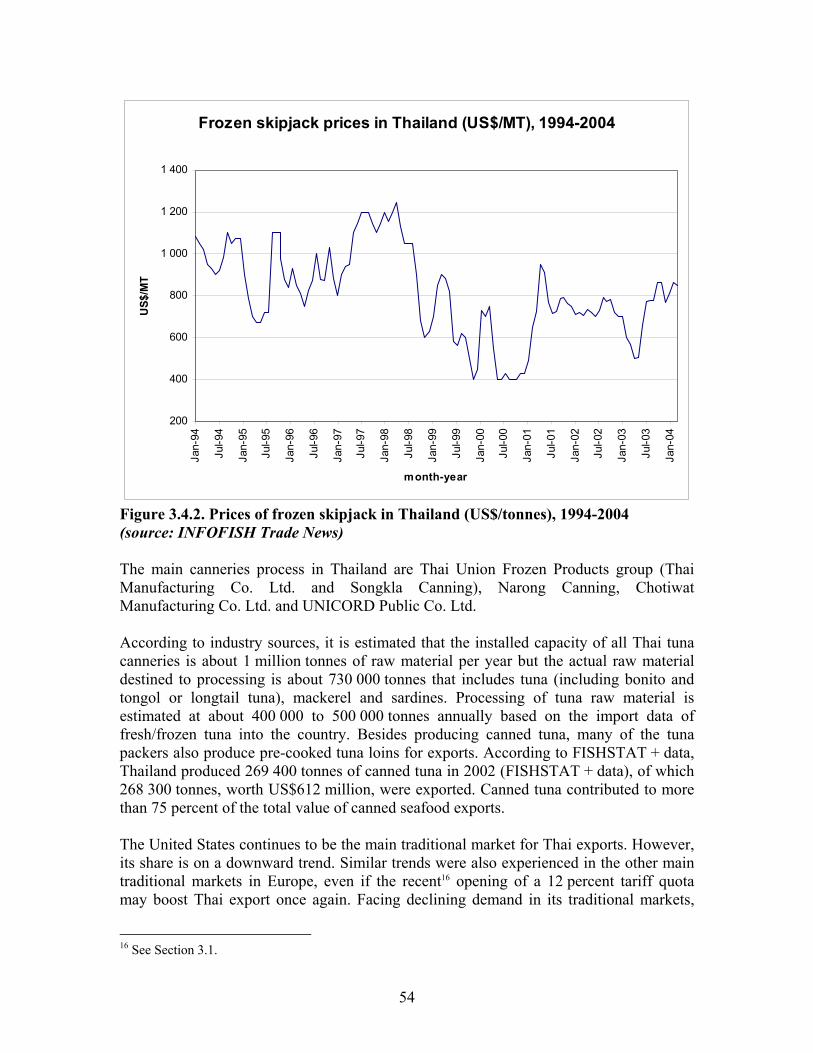
Frozen skipjack prices in Thailand (US$/MT), 1994-2004
200
400
600
800
1 000
1 200
1 400
Jan-
94
Jul-9
4
Jan-
95
Jul-9
5
Jan-
96
Jul-9
6
Jan-
97
Jul-9
7
Jan-
98
Jul-9
8
Jan-
99
Jul-9
9
Jan-
00
Jul-0
0
Jan-
01
Jul-0
1
Jan-
02
Jul-0
2
Jan-
03
Jul-0
3
Jan-
04
month-year
US$
/MT
Figure 3.4.2. Prices of frozen skipjack in Thailand (US$/tonnes), 1994-2004 (source: INFOFISH Trade News) The main canneries process in Thailand are Thai Union Frozen Products group (Thai Manufacturing Co. Ltd. and Songkla Canning), Narong Canning, Chotiwat Manufacturing Co. Ltd. and UNICORD Public Co. Ltd. According to industry sources, it is estimated that the installed capacity of all Thai tuna canneries is about 1 million tonnes of raw material per year but the actual raw material destined to processing is about 730 000 tonnes that includes tuna (including bonito and tongol or longtail tuna), mackerel and sardines. Processing of tuna raw material is estimated at about 400 000 to 500 000 tonnes annually based on the import data of fresh/frozen tuna into the country. Besides producing canned tuna, many of the tuna packers also produce pre-cooked tuna loins for exports. According to FISHSTAT + data, Thailand produced 269 400 tonnes of canned tuna in 2002 (FISHSTAT + data), of which 268 300 tonnes, worth US$612 million, were exported. Canned tuna contributed to more than 75 percent of the total value of canned seafood exports. The United States continues to be the main traditional market for Thai exports. However, its share is on a downward trend. Similar trends were also experienced in the other main traditional markets in Europe, even if the recent16 opening of a 12 percent tariff quota may boost Thai export once again. Facing declining demand in its traditional markets,
16 See Section 3.1.
54

Thailand has successfully diversified and increased canned tuna exports to new markets, mainly the Middle East and Africa where the demand is also growing. Thailand was also able to exploit the growing demand for canned tuna in other Asian markets like Malaysia, Singapore and Hong Kong, and in Pacific markets in Oceania like Australia and New Zealand. Most of the canned tuna products displayed in supermarkets in Southeast Asian countries like Malaysia, Singapore, Brunei and Thailand itself are produced in Thailand. The major brands like Ayam Brand (A. Clouet Co.) and TC Boy (Tropical Canning) are manufactured in Thailand. Thai exports within the Asian-Pacific region are increasing due to health consciousness of consumers and the ability of the Thai tuna industry to develop value-added tuna products based on local preference (tuna spread, tuna curry, chilli tuna, tuna rendang17, tuna ginger, tuna tom-yam18, etc.). In Asia, other main producers of canned tuna are the Philippines and Indonesia. The Philippines is the second largest canned tuna exporter in Asia after Thailand. However, unlike the Thai tuna industry that largely depends on imports of tuna raw material for its canneries, the Philippines has a large domestic tuna fishing industry that supplies most of the raw materials to its canneries. In Indonesia, the tuna industry represents the most important provider of foreign earnings from fishery after shrimp. Again, Indonesia has a large tuna fishing industry and does not depend on imports. Overall tuna landings in the Philippines for the period from 1991 to 2002 increased from 198 000 tonnes to 212 000 tonnes. Catches mainly consisted of skipjack and yellowfin (FISHSTAT + data). About 50 percent of the tuna landed is consumed locally and the other half is either exported as sashimi-grade tuna or sent to tuna processing plants. In the Philippines, there are a total of 13 canneries processing skipjack and yellowfin tunas, mostly to be exported as canned light meat tuna. Bigger can size for the food service sector dominates production, but lately more small cans for the retail market are produced to cater to the growing demand in other markets, especially in Southeast Asia and in the Middle East. The Philippines also imports significant amounts of tuna to top up supplies from domestic tuna fishing vessels. According to FISHSTAT +, imports of fresh, chilled and frozen tuna into the Philippines increased from 3 400 tonnes in 1986, worth US$2 million, to 72 200 tonnes in 1998, worth US$43 million. However, imports of fresh, chilled and frozen tuna by the Philippines declined to 19 100 tonnes in 2001, worth US$9 million, to pick up slightly to 30 200 tonnes in 2002, worth US$17 million. According to FISHSTAT + data, in 2002 canned tuna exports contributed to 68 percent of the total tuna export quantity, followed by frozen tuna (24 percent) and by fresh/chilled sashimi-grade tuna (8 percent). The main markets for canned tuna from the Philippines are the United States and the EU (Germany and the United Kingdom). 17 A dry curry dish. 18 A soup.
55
In Indonesia, catches increased from 2 200 tonnes in 1950 to 429 700 tonnes in 1999, mainly due to fleet expansion, but declined to 406 200 tonnes in 2002. Skipjack contributed 60 percent and yellowfin contributed to 35 percent of the total catch in 2002, while the rest consisted of bigeye and limited quantities of albacore and Southern bluefin tuna. According to the Ministry of Marine Affairs and Fisheries of Indonesia, in 2001, there were around 102 tuna processing plants of which 45 were fresh and frozen tuna processing plants, 32 loining/steaks/fillets processing establishments, 16 canneries and 9 plants were involved in processing Katsuobushi. According to FISHSTAT + data, tuna exports have been following an unstable trend since 1991. The peak was recorded in 1998 with 104 300 tonnes valued at US$215 million. In 2001, they dropped to 84 200 tonnes valued at US$218 million. The increasing export value against declining export quantity was due to higher exports of valuable fresh and chilled tuna. In 2002, exports of tuna from Indonesia picked up in terms of quantity to 92 800 tonnes, worth US$212 million. Japan, Singapore, South Korea, Philippines and Thailand are the main export destinations for fresh, chilled and frozen tuna from Indonesia. For canned tuna exports, the main markets are the United States, Japan, Saudi Arabia, Egypt, the United Kingdom and Germany.
56

3.5. Japan Despite being traditionally known for its sashimi tuna market, Japan is also an important consumer of canned tuna19, both domestically produced and imported. According to FISHSTAT + data, Japanese production of canned tuna increased from 93 200 tonnes in 1976 to 144 600 tonnes in 1984, declining to 62 000 tonnes in 2002. A parallel phenomenon to the decline of Japanese canned tuna production was the increase of imports, mainly from Thailand, due to the low cost of imports from Thailand in relation to the high costs of domestically-produced canned tuna. According to the Japanese Fish Traders Association (JFTA), imports of canned tuna by Japan increased from 2 900 tonnes in 1988 to 37 700 tonnes in 2003. Imports of canned tuna from Thailand represented 64 percent of total imports of tuna by Japan during the 1988-2003 period (source: JFTA).
Total Japanese imports of canned tuna and imports by main country of origin, quantity 1988-2003
0
5 000
10 000
15 000
20 000
25 000
30 000
35 000
40 000
1988 1989 1990 1991 1992 1993 1994 1995 1996 1997 1998 1999 2000 2001 2002 2003
year
tonn
es
Total
Thailand
Figure 3.5.1. Total Japanese imports of canned tuna and imports by main country of origin, 1988-2003 (source: JFTA)
19 The present paper includes canned skipjack within the wider category of “canned tuna” for simplicity reasons. In fact, canned skipjack is not labelled as canned tuna in Japan because in the country skipjack is not considered as a tuna species.
57

The tariff codes 1604 applied to canned tuna in Japan is also applied to boiled and dried skipjack, a local speciality. In Japan, boiled and dried skipjack products are also called fushi. Among all fushi, the most widely known is katsuobushi, e.g. skipjack fillets which are boiled, broiled over charcoal several times and then dried. Japanese imports of katsuobushi increased from 1 200 tonnes in 1988 to 4 700 tonnes in 2003 (Figure 3.5.2).
Total Japanese imports of dried and boiled skipjack (fushi ), quantity 1988-2003
0
500
1 000
1 500
2 000
2 500
3 000
3 500
4 000
4 500
5 000
1988 1989 1990 1991 1992 1993 1994 1995 1996 1997 1998 1999 2000 2001 2002 2003
year
tonn
es
Figure 3.5.2. Total Japanese imports of boiled and dried skipjack, 1988-2003 (source: JFTA) According to the JFTA, Indonesia is the main supplier of skipjack fushi to Japan.
3.6. Developing countries as markets for canned tuna Tuna has numerous health benefits. It contains minerals such as phosphorous which is important for the nervous system and the bones, and iodine, which favours a balanced growth. It also contains proteins and vitamin B12 for cells growth, and niacin, which ensures a correct metabolism of fatty acids and cholesterol. Tunas and other oily fish (salmon, mackerel and swordfish) are rich in Omega-3 which is a polyunsaturated fat. The consumption of fish rich in Omega-3 is associated with a decreased risk of heart diseases, cholesterol reduction, regulation of high blood pressure, prevention of arteriosclerosis and other health benefits. Canned tuna in particular is an extremely cheap source of nutritional benefits.
58

Developing countries are important producers and exporters of tuna: countries like Côte d’Ivoire, Ecuador, Ghana, Madagascar, Maldives, Mauritius, Papua New Guinea and Seychelles can count on state of the art canneries, set up also through the help of foreign investments. Hence, in order to fight food insecurity and nutritional deficiencies it is important to promote the consumption of canned tuna locally and to foster South-South trade in tuna, rather than seeing canned tuna as a product which is solely destined to supply the markets of developed countries. According to estimates from FISHSTAT + data on production and trade and United Nations Population Division, consumption of canned tuna in developing countries (excluding China) in the 2000-2002 period totalled 0.05 kg per caput per year, which is still extremely low if compared to the 1.51 kg per caput consumed yearly by the EU and the 1.32 kg per caput consumed by the United States in 2001. However, imports of canned tuna20 by developing countries increased steadily from 3 200 tonnes in 1976 to 122 600 tonnes in 2001, but declined slightly to 115 900 tonnes in 2002 (FISHSTAT + data, Figure 3.6.1).
Total developing countries' imports of canned tuna, quantity 1976-2002
0
20 000
40 000
60 000
80 000
100 000
120 000
140 000
1976 1978 1980 1982 1984 1986 1988 1990 1992 1994 1996 1998 2000 2002
year
tonn
es
Figure 3.6.1. Imports of canned tuna by developing countries, quantity 1976-2002 (source: FISHSTAT +)
20 Including frozen pre-cooked loins for canning.
59

The imports of canned tuna by developing countries increased steadily in the nineties, driven by the increase of imports by the Arab Region and South America. The imports by Sub-Saharan Africa and Asia are still very marginal, but increasing (Figure 3.6.2).
Imports of canned tuna by developing countries by region, quantity 1976-2002
0
10 000
20 000
30 000
40 000
50 000
60 000
1976 1978 1980 1982 1984 1986 1988 1990 1992 1994 1996 1998 2000 2002
year
tonn
es
Near EastAmericasAsiaAfricaOceania
Figure 3.6.2. Imports of canned tuna by developing countries by region, quantity 1976-2002 The main importers of canned tuna among developing countries are Egypt, Colombia, Saudi Arabia and Chile (Figure 3.6.3). According to calculation from FISHSTAT + data and estimates on production and trade, and UN data on population, it is estimated that in 2002, consumption of canned tuna in those countries totalled:
0.5 kg per caput per year in Saudi Arabia; • • • •
0.5 kg per caput per year in Chile; 0.3 kg per caput per year in Colombia; 0.2 kg per caput per year in Egypt.
60

Main importers of canned tuna among developing countries, quantity 1976-2002
0
5 000
10 000
15 000
20 000
25 000
1976 1978 1980 1982 1984 1986 1988 1990 1992 1994 1996 1998 2000 2002
year
tonn
es
Egypt
Colombia
Saudi Arabia
Chile
Figure 3.6.3. Main importers of canned tuna among developing countries, quantity 1976-2002 The different level of development undoubtedly plays a fundamental role in the consumption of value-added commodities such as canned tuna. This is the reason why the Middle East and developing countries of the Americas import more canned tuna than Africa and Oceania. Cultural habits also play an important role. The consumption of canned tuna is a typical feature of the Mediterranean diet, hence the high imports by the Arab Region. In turn, despite the high level of development and the large tuna production of most Asian countries, consumption and imports are relatively low due to the small niche occupied by canned tuna in Asian cuisine.
61

4 Tuna for direct consumption: sashimi and other uses
Japan is the traditional market for sashimi, which is however expanding to the United States and Europe. Sashimi originates from fresh raw tuna meat, or from tuna frozen at a temperature below -40° immediately after harvest. Traditional sashimi is processed from bluefin, bigeye and yellowfin tunas. Sashimi processed from skipjack is generally called tataki. Albacore, mainly caught with pole and line fisheries and longlines, once just used for canning, is increasingly being processed as sashimi. Furthermore, in Japan, marlins are also considered as tuna and processed into sashimi. Concerning the species, Atlantic and Pacific bluefin sashimi provides the highest quality ones, followed by Southern bluefin, bigeye and yellowfin21. As a general rule, larger fish are preferred to smaller fish. In terms of capture method, tuna for the premium sashimi market is generally caught by handline and then longlines, which ensure the best handling of the fish. Pole and line specifically developed for the bluefin catch ensure good quality fish. Purse seine follows. In terms of processing method, connoisseurs of the premium sashimi market favour fresh and chilled tuna, while sea-frozen tuna is used for the preparation of both sashimi and tuna steaks. When tuna is sea-frozen it means that immediately after capture the fish is bled, gilled, gutted, tailed and then frozen at a temperature less than 40 degrees below zero. It is important to note that the product must remain frozen at the same temperature as frozen, during the whole time since the onboard freezing until being sold at the market, to maintain the quality of flesh Tuna for the sashimi market is first assessed objectively by: species, time and area of catch, size, conservation method (fresh, chilled, frozen), core temperature and fishing method. They are also graded subjectively on the basis of visual characteristics, such as fat contents, bright/clear appearance of the skin, clear and moist eyes, elastic skin and undamaged abdominal walls, colour, clarity and texture of flesh, odour, and on the fat content. According to connoisseurs, the best sashimi is processed from large individuals caught during the pre-spawning season. Different sashimi cuts from different species have various market values, depending on the fat content: the higher the fat content and the more valued the sashimi will be. • 1+: tuna, generally bluefins and bigeye, with a bright red colour, firm texture,
translucent flesh and high fat content. This is the rarest grade, reserved to the top quality Japanese sashimi market; this high quality tuna is generally caught by handline or longlines, chilled on board and served fresh.
• 1: tuna, with bright red muscle tissue, firm in texture, translucent flesh (clarity) and less fat, which is also used for good quality Japanese sashimi; grade 1 tuna is caught by longlines, chilled on board and served fresh.
• 2: tuna with red muscle tissue, firm in texture, some translucency and no fat, generally used in the lower-end sashimi market in Japan, or processed into tuna steaks
21 However, the quality of prime bigeye is generally superior to low or average quality bluefin.
62
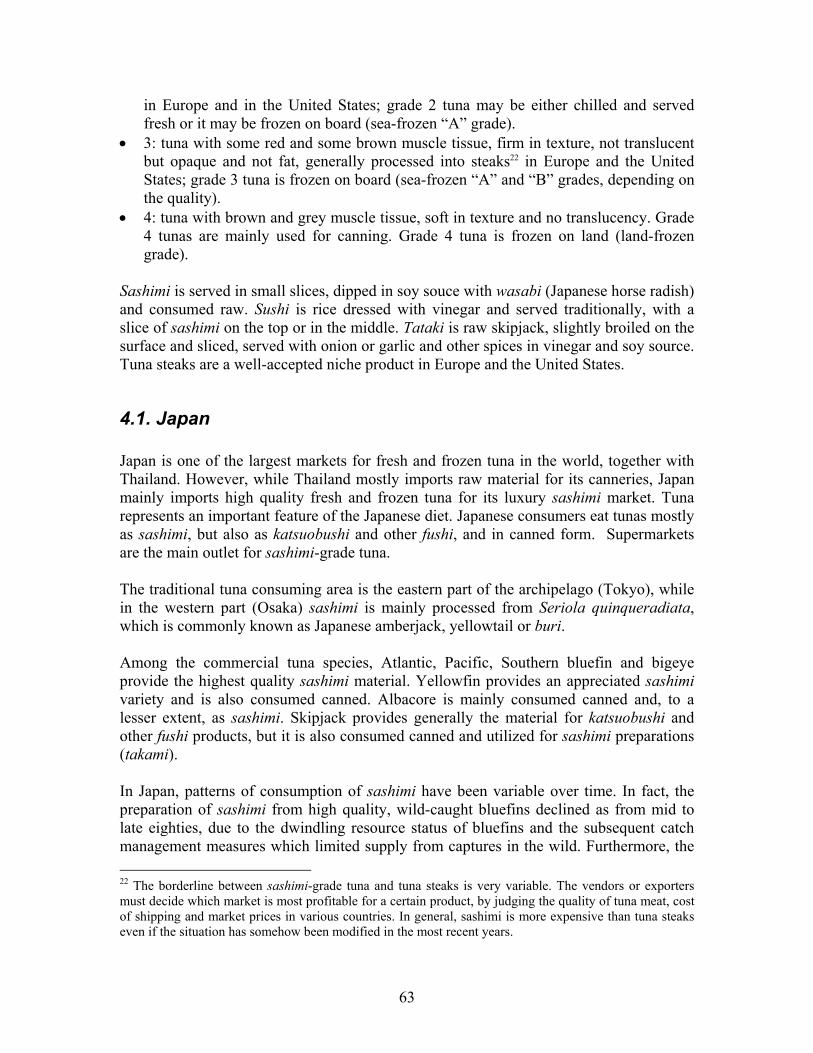
in Europe and in the United States; grade 2 tuna may be either chilled and served fresh or it may be frozen on board (sea-frozen “A” grade).
• 3: tuna with some red and some brown muscle tissue, firm in texture, not translucent but opaque and not fat, generally processed into steaks22 in Europe and the United States; grade 3 tuna is frozen on board (sea-frozen “A” and “B” grades, depending on the quality).
• 4: tuna with brown and grey muscle tissue, soft in texture and no translucency. Grade 4 tunas are mainly used for canning. Grade 4 tuna is frozen on land (land-frozen grade).
Sashimi is served in small slices, dipped in soy souce with wasabi (Japanese horse radish) and consumed raw. Sushi is rice dressed with vinegar and served traditionally, with a slice of sashimi on the top or in the middle. Tataki is raw skipjack, slightly broiled on the surface and sliced, served with onion or garlic and other spices in vinegar and soy source. Tuna steaks are a well-accepted niche product in Europe and the United States.
4.1. Japan Japan is one of the largest markets for fresh and frozen tuna in the world, together with Thailand. However, while Thailand mostly imports raw material for its canneries, Japan mainly imports high quality fresh and frozen tuna for its luxury sashimi market. Tuna represents an important feature of the Japanese diet. Japanese consumers eat tunas mostly as sashimi, but also as katsuobushi and other fushi, and in canned form. Supermarkets are the main outlet for sashimi-grade tuna. The traditional tuna consuming area is the eastern part of the archipelago (Tokyo), while in the western part (Osaka) sashimi is mainly processed from Seriola quinqueradiata, which is commonly known as Japanese amberjack, yellowtail or buri. Among the commercial tuna species, Atlantic, Pacific, Southern bluefin and bigeye provide the highest quality sashimi material. Yellowfin provides an appreciated sashimi variety and is also consumed canned. Albacore is mainly consumed canned and, to a lesser extent, as sashimi. Skipjack provides generally the material for katsuobushi and other fushi products, but it is also consumed canned and utilized for sashimi preparations (takami). In Japan, patterns of consumption of sashimi have been variable over time. In fact, the preparation of sashimi from high quality, wild-caught bluefins declined as from mid to late eighties, due to the dwindling resource status of bluefins and the subsequent catch management measures which limited supply from captures in the wild. Furthermore, the 22 The borderline between sashimi-grade tuna and tuna steaks is very variable. The vendors or exporters must decide which market is most profitable for a certain product, by judging the quality of tuna meat, cost of shipping and market prices in various countries. In general, sashimi is more expensive than tuna steaks even if the situation has somehow been modified in the most recent years.
63
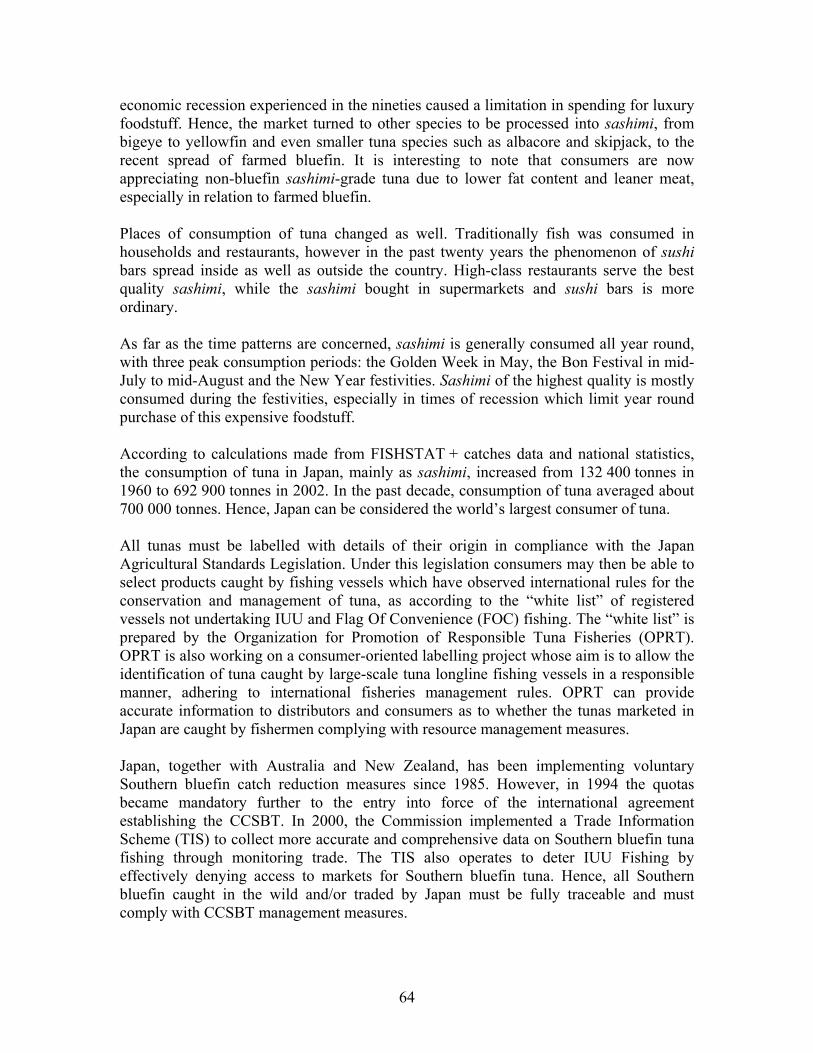
economic recession experienced in the nineties caused a limitation in spending for luxury foodstuff. Hence, the market turned to other species to be processed into sashimi, from bigeye to yellowfin and even smaller tuna species such as albacore and skipjack, to the recent spread of farmed bluefin. It is interesting to note that consumers are now appreciating non-bluefin sashimi-grade tuna due to lower fat content and leaner meat, especially in relation to farmed bluefin. Places of consumption of tuna changed as well. Traditionally fish was consumed in households and restaurants, however in the past twenty years the phenomenon of sushi bars spread inside as well as outside the country. High-class restaurants serve the best quality sashimi, while the sashimi bought in supermarkets and sushi bars is more ordinary. As far as the time patterns are concerned, sashimi is generally consumed all year round, with three peak consumption periods: the Golden Week in May, the Bon Festival in mid-July to mid-August and the New Year festivities. Sashimi of the highest quality is mostly consumed during the festivities, especially in times of recession which limit year round purchase of this expensive foodstuff. According to calculations made from FISHSTAT + catches data and national statistics, the consumption of tuna in Japan, mainly as sashimi, increased from 132 400 tonnes in 1960 to 692 900 tonnes in 2002. In the past decade, consumption of tuna averaged about 700 000 tonnes. Hence, Japan can be considered the world’s largest consumer of tuna. All tunas must be labelled with details of their origin in compliance with the Japan Agricultural Standards Legislation. Under this legislation consumers may then be able to select products caught by fishing vessels which have observed international rules for the conservation and management of tuna, as according to the “white list” of registered vessels not undertaking IUU and Flag Of Convenience (FOC) fishing. The “white list” is prepared by the Organization for Promotion of Responsible Tuna Fisheries (OPRT). OPRT is also working on a consumer-oriented labelling project whose aim is to allow the identification of tuna caught by large-scale tuna longline fishing vessels in a responsible manner, adhering to international fisheries management rules. OPRT can provide accurate information to distributors and consumers as to whether the tunas marketed in Japan are caught by fishermen complying with resource management measures. Japan, together with Australia and New Zealand, has been implementing voluntary Southern bluefin catch reduction measures since 1985. However, in 1994 the quotas became mandatory further to the entry into force of the international agreement establishing the CCSBT. In 2000, the Commission implemented a Trade Information Scheme (TIS) to collect more accurate and comprehensive data on Southern bluefin tuna fishing through monitoring trade. The TIS also operates to deter IUU Fishing by effectively denying access to markets for Southern bluefin tuna. Hence, all Southern bluefin caught in the wild and/or traded by Japan must be fully traceable and must comply with CCSBT management measures.
64

Stringent catch quotas are also applied by ICCAT, of which Japan is a member, to wild-caught Atlantic (and Pacific) bluefin tuna; ICCAT quotas also apply to the Atlantic stocks of albacore. ICCAT launched the statistical document on bluefin in 1992 and that on bigeye in 2001. The statistical documents are trade certificates aimed at monitoring the imports, exports and re-exports of those valuable species. Japanese landings of tunas, including traditional non-sashimi species such as skipjack and albacore, increased from 114 600 tonnes in 1950 to 788 200 tonnes in 1984, to decline to 560 800 tonnes in 2002. Japanese landings of main sashimi species (bigeye, bluefins and yellowfin) increased from 63 800 tonnes in 1952 to 329 500 tonnes in 1961, to decline to 215 900 tonnes in 2002; the main landed species are bigeye and yellowfin (Figure 4.1.1).
Total Japanese catches of main sashimi tuna species, 1952-2002
0
50 000
100 000
150 000
200 000
250 000
300 000
350 000
1952 1962 1972 1982 1992 2002
year
tonn
es
Atlantic, Pacific and Southern bluefins
Yellow fin
Bigeye
Figure 4.1.1. Total Japanese catches of main sashimi-tuna species, 1952-2002 (source: FISHSTAT +) Consumption of imported sashimi-grade tuna in Japan expanded rapidly from 1975 onwards due to favourable economic conditions and the strong currency. Hence, domestic landings were progressively replaced by imports. As a consequence, the import duties on fresh, chilled and frozen tunas (whole fish and fillets) are relatively low: the general rate of duty is 5% and the WTO rate is 3.5%. Japanese imports of fresh, chilled and frozen tuna (whole fish) increased substantially in the 1985-2003 period (source: JFTA). Fresh, chilled and frozen tuna imports increased from 141 300 tonnes in 1985 to 399 600 tonnes in 2002, declining slightly to
65

374 500 tonnes in 2003. Imports of fresh and chilled tuna increased from 16 200 tonnes in 1985 to 72 400 tonnes in 1995. In the years which followed, Japanese imports of fresh and chilled tuna declined to 60 200 tonnes. Japanese imports of frozen tuna increased from 125 100 tonnes in 1985 to 314 300 tonnes in 2003 (Figure 4.1.2).
Fresh, chilled and frozen whole tuna imports by Japan, 1952-2003
0
50 000
100 000
150 000
200 000
250 000
300 000
350 000
400 000
450 000
1985 1986 1987 1988 1989 1990 1991 1992 1993 19941995 1996 1997 1998 1999 2000 2001 2002 2003
year
tonn
es
Fresh and chilled Frozen
Figure 4.1.2. Total Japanese imports of fresh, chilled and frozen tuna, 1985-2003 (source: JFTA) The main species used in the sashimi market are bigeye, yellowfin and the three bluefin species. Japanese bigeye imports increased from 49 900 tonnes in 1985, worth ¥29.5 billion, to 162 600 tonnes in 2002, worth ¥99.6 billion, to decline slightly to 145 500 tonnes in 2003, worth ¥90 billion. Japanese yellowfin imports increased from 62 400 tonnes in 1985, worth ¥36.4 billion, to 140 600 tonnes in 2002, worth ¥54.3 billion, to decline to 130 200 tonnes in 2003, worth ¥46.2 billion (Figure 4.1.3). Bluefins are another important tuna resource entering Japanese markets, especially in terms of value. Imports of Atlantic and Pacific bluefin increased from 3 900 tonnes in 1985, worth ¥6.4 billion, to 15 400 tonnes in 2003, worth ¥32.3 billion. Imports of Southern bluefin tuna increased from 800 tonnes in 1993, worth ¥1.5 billion, to 10 800 tonnes in 2002, worth ¥25 billion, to decline to 8 200 tonnes in 2003, worth ¥16.4 billion (Figure 4.1.3).
66
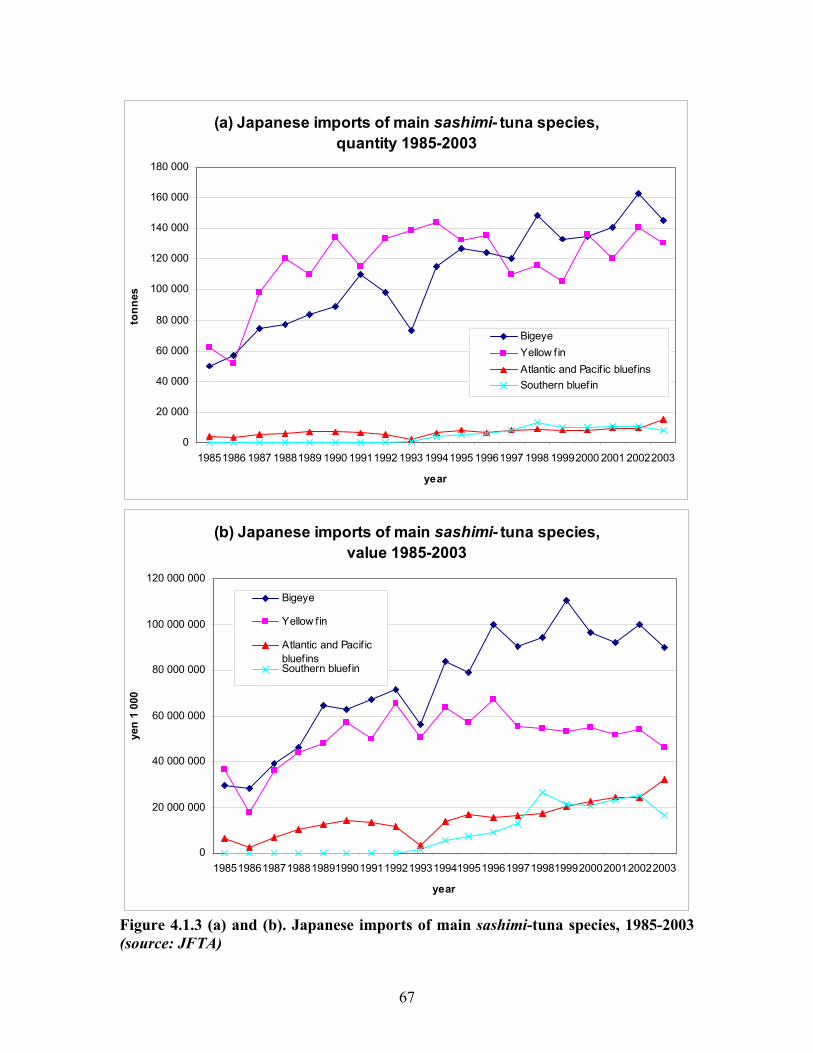
(a) Japanese imports of main sashimi- tuna species, quantity 1985-2003
0
20 000
40 000
60 000
80 000
100 000
120 000
140 000
160 000
180 000
19851986 1987 19881989 1990 19911992 1993 19941995 19961997 1998 19992000 2001 20022003
year
tonn
es
BigeyeYellow finAtlantic and Pacif ic bluefinsSouthern bluefin
(b) Japanese imports of main sashimi- tuna species, value 1985-2003
0
20 000 000
40 000 000
60 000 000
80 000 000
100 000 000
120 000 000
1985198619871988198919901991199219931994199519961997199819992000200120022003
year
yen
1 00
0
Bigeye
Yellow fin
Atlantic and Pacif icbluefinsSouthern bluefin
Figure 4.1.3 (a) and (b). Japanese imports of main sashimi-tuna species, 1985-2003 (source: JFTA)
67

The traditional suppliers of bigeye tuna to Japan are Taiwan Province of China and the Republic of Korea. Imports of bigeye from Taiwan Province of China increased from 13 600 tonnes in 1985, worth ¥8.3 billion, to 85 600 tonnes in 2003, worth ¥50.2 billion. In fact, imports of bigeye from the Republic of Korea were relatively stable during the period considered, increasing from 28 000 tonnes in 1985, worth ¥17.2 billion, to 31 700 tonnes in 2002, worth ¥19.3 billion, but declined to 16 700 tonnes in 2003, worth ¥10 billion. In 2003, imports from the Republic of Korea nearly halved from the previous year and China (mainland) took over its position as second most important supplier of bigeye tuna to Japan (Figure 4.1.4 [a] and [b]).
(a) Japanese imports of bigeye tuna by main suppliers, quantity 1985-2003
0
10 000
20 000
30 000
40 000
50 000
60 000
70 000
80 000
90 000
1985 1986 1987 1988 1989 1990 1991 1992 1993 1994 1995 1996 1997 1998 1999 2000 2001 2002 2003
year
tonn
es
Taiw an Province of China
China (mainland)
Republic of Korea
68

(b) Japanese imports of bigeye tuna by main suppliers, value 1985-2003
0
10 000 000
20 000 000
30 000 000
40 000 000
50 000 000
60 000 000
1985198619871988198919901991199219931994199519961997199819992000200120022003
year
yen
1 00
0
Taiw an Province ofChina
China (mainland)
Republic of Korea
Figure 4.1.4 (a) and (b). Japanese imports of bigeye tuna by main suppliers, 1985-2003 (source: JFTA) The main suppliers of fresh, chilled and frozen yellowfin to Japan are Taiwan Province of China, the Republic of Korea and Indonesia. Imports from the Republic of Korea and Indonesia were relatively stable during the period considered; in turn, imports from Taiwan Province of China increased from 17 400 tonnes in 1985, worth ¥3.6 billion, to 47 300 tonnes in 2003, worth ¥16.3 billion. In 1993, yellowfin imports from Taiwan Province of China peaked to 106 000 tonnes, worth 47.6 billion23 (Figure 4.1.5 [a] and [b]).
23 The large shipments of frozen yellowfin from Taiwan Province of China to Japan in 1993 justified the fixing of a maximum amount of tuna to be shipped to Japan at about 90 000 tonnes. In addition, for each shipment, exporters from Taiwan Province of China were supposed to fill an export certificate.
69
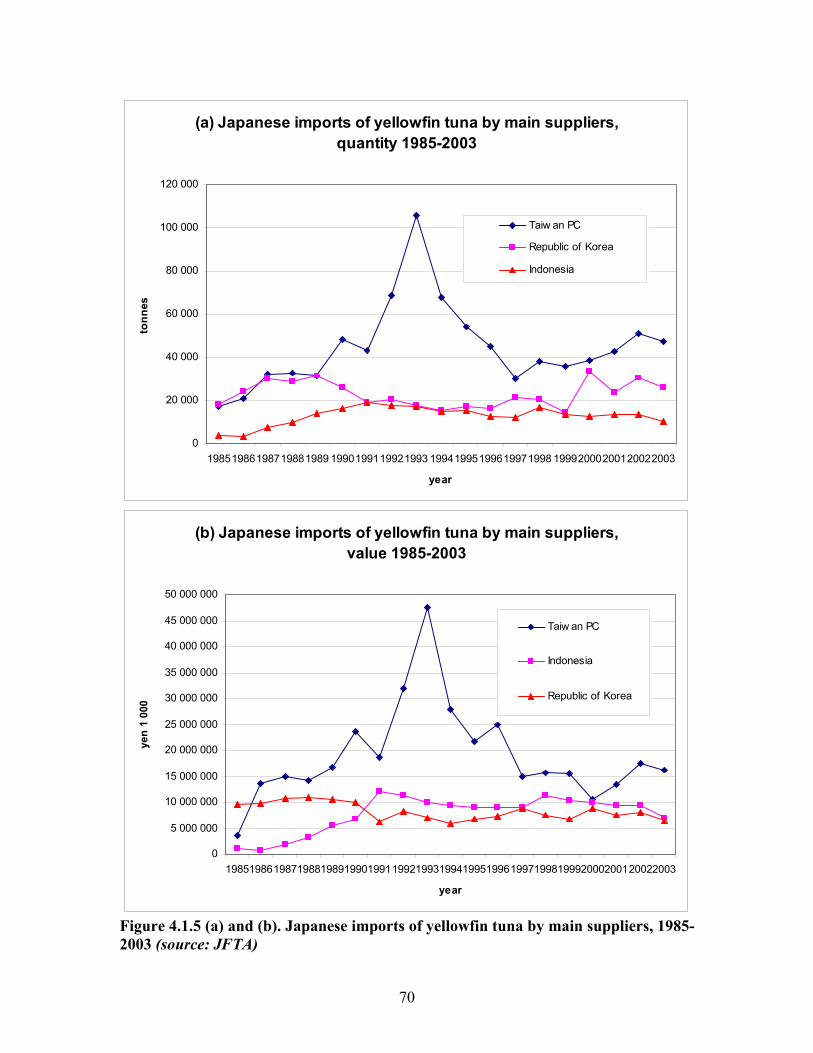
(a) Japanese imports of yellowfin tuna by main suppliers, quantity 1985-2003
0
20 000
40 000
60 000
80 000
100 000
120 000
19851986198719881989 1990199119921993 19941995199619971998 19992000200120022003
year
tonn
es
Taiw an PC
Republic of Korea
Indonesia
(b) Japanese imports of yellowfin tuna by main suppliers, value 1985-2003
0
5 000 000
10 000 000
15 000 000
20 000 000
25 000 000
30 000 000
35 000 000
40 000 000
45 000 000
50 000 000
1985198619871988198919901991199219931994199519961997199819992000200120022003
year
yen
1 00
0
Taiw an PC
Indonesia
Republic of Korea
Figure 4.1.5 (a) and (b). Japanese imports of yellowfin tuna by main suppliers, 1985-2003 (source: JFTA)
70

Australia is by far the main supplier of bluefins (in this case, Pacific and Southern bluefin tunas) to Japan. The expansion of exports from Croatia, Mexico, Turkey and Malta is mainly due to the development of tuna farming (Table 4.1.1). Table 4.1.1. Japanese imports of Atlantic, Pacific and Southern bluefin tuna by main suppliers, quantity (tonnes) and value (¥1 million), 1995-2003 (source: JFTA) 1995 1996 1997 q v q v q V Australia 3 249 5 080 3 182 5 336 6 125 10 171 Republic of Korea 970 480 648 1 246 1 781 1 361 Spain 1 524 3 235 823 2 226 1 188 3 284 Croatia 0 0 22 61 345 954 Mexico 1 6 2 5 1 2 Turkey 134 178 133 209 292 375Taiwan PC 1 878 1 080 2 089 2 992 1 828 2 336 Italy 1 020 1 981 715 1 838 400 988 Malta 158 273 56 96 20 37United States 898 2 661 821 2 522 800 2 618 1998 1999 2000 q v q v q V Australia 6 256 12 352 7 028 16 465 7 835 17 029 Republic of Korea 1 870 3 164 1 313 1 935 1 528 1 877 Spain 2 124 5 789 2 611 9 156 2 257 9 379 Croatia 234 737 514 755 698 1 936 Mexico 10 26 70 158 262 831Turkey 334 528 266 505 424 627 Taiwan PC 2 616 2 838 2 740 3 383 2 256 2 798 Italy 256 26 299 607 323 702 Malta 39 67 29 55 151 187 United States 859 2 390 833 2 338 772 2 472 2001 2002 2003 q v q v q V Australia 8 228 19 671 8 232 21 610 6 345 13 048Republic of Korea 1 921 2 127 1 790 2 058 3 157 1 453 Spain 3 011 11 354 2 867 9 604 3 050 9 050 Croatia 1 003 2 549 1 785 4 519 2 520 6 074 Mexico 346 903 641 1 303 1 912 3 614 Turkey 412 539 333 674 1 372 3 246 Taiwan PC 2 322 2 707 1 358 1 282 1 169 1 278 Italy 278 747 632 1 815 767 1 945 Malta 215 609 258 828 686 1 587 United States 887 2 700 742 2 122 586 1 326
The sashimi market has been characterised, during the nineties, by the development of Atlantic, Pacific and Southern bluefin tuna farming in several areas of the world, mainly:
71

Australia, Japan, some Mediterranean countries24 and Mexico. This practice was originally launched with the aim of topping up declining wild supplies of sashimi-grade tuna to the Japanese market, especially further to the introduction of stringent catch quotas by CCSBT and ICCAT. In 2002 Australia was estimated to produce some 8 000 tonnes of farmed Southern bluefin for the Japanese sashimi market. It is estimated that in the 1997-2002 period, imports of farmed Atlantic bluefin tuna from the Mediterranean rose from almost nil to 70 percent of total imports of Atlantic bluefin tuna from the Mediterranean to Japan. Japanese imports of fresh, chilled and frozen sashimi preparations, e.g. mainly bluefin tuna fillets and meat, increased from 3 300 tonnes in 1985, worth ¥4.1 billion, to 18 100 tonnes in 2003, worth ¥29.4 billion (Figure 4.1.6). The main supplier of fresh, chilled and frozen tuna fillets and meat to Japan are the Republic of Korea and Panama.
Japanese imports of tuna fillets and meat (fresh and frozen), 1985-2002
0
2 000
4 000
6 000
8 000
10 000
12 000
14 000
16 000
18 000
20 000
1985 1988 1991 1994 1997 2000 2003
year
tonn
es
0
5 000 000
10 000 000
15 000 000
20 000 000
25 000 000
30 000 000
35 000 000
Yen
000
Import quantity
Import value
Figure 4.1.6. Japanese imports of tuna fillets and meat, 1985-2003 (source: JFTA) Sashimi-grade tuna presents:
• high income elasticity (which is the response of demand to income changes); • high price elasticity (which is the response of demand to price changes).
24 Croatia, Italy, Malta, Spain and Turkey.
72
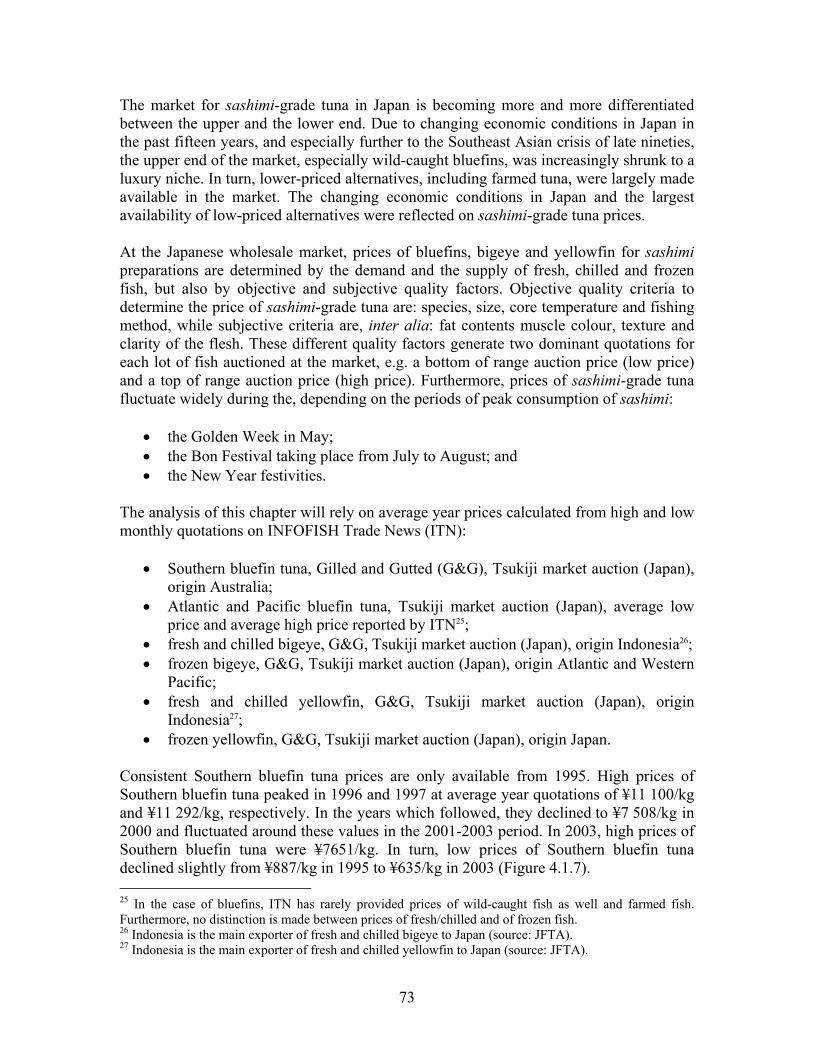
The market for sashimi-grade tuna in Japan is becoming more and more differentiated between the upper and the lower end. Due to changing economic conditions in Japan in the past fifteen years, and especially further to the Southeast Asian crisis of late nineties, the upper end of the market, especially wild-caught bluefins, was increasingly shrunk to a luxury niche. In turn, lower-priced alternatives, including farmed tuna, were largely made available in the market. The changing economic conditions in Japan and the largest availability of low-priced alternatives were reflected on sashimi-grade tuna prices. At the Japanese wholesale market, prices of bluefins, bigeye and yellowfin for sashimi preparations are determined by the demand and the supply of fresh, chilled and frozen fish, but also by objective and subjective quality factors. Objective quality criteria to determine the price of sashimi-grade tuna are: species, size, core temperature and fishing method, while subjective criteria are, inter alia: fat contents muscle colour, texture and clarity of the flesh. These different quality factors generate two dominant quotations for each lot of fish auctioned at the market, e.g. a bottom of range auction price (low price) and a top of range auction price (high price). Furthermore, prices of sashimi-grade tuna fluctuate widely during the, depending on the periods of peak consumption of sashimi:
• the Golden Week in May; • the Bon Festival taking place from July to August; and • the New Year festivities.
The analysis of this chapter will rely on average year prices calculated from high and low monthly quotations on INFOFISH Trade News (ITN):
• Southern bluefin tuna, Gilled and Gutted (G&G), Tsukiji market auction (Japan), origin Australia;
• Atlantic and Pacific bluefin tuna, Tsukiji market auction (Japan), average low price and average high price reported by ITN25;
• fresh and chilled bigeye, G&G, Tsukiji market auction (Japan), origin Indonesia26; • frozen bigeye, G&G, Tsukiji market auction (Japan), origin Atlantic and Western
Pacific; • fresh and chilled yellowfin, G&G, Tsukiji market auction (Japan), origin
Indonesia27; • frozen yellowfin, G&G, Tsukiji market auction (Japan), origin Japan.
Consistent Southern bluefin tuna prices are only available from 1995. High prices of Southern bluefin tuna peaked in 1996 and 1997 at average year quotations of ¥11 100/kg and ¥11 292/kg, respectively. In the years which followed, they declined to ¥7 508/kg in 2000 and fluctuated around these values in the 2001-2003 period. In 2003, high prices of Southern bluefin tuna were ¥7651/kg. In turn, low prices of Southern bluefin tuna declined slightly from ¥887/kg in 1995 to ¥635/kg in 2003 (Figure 4.1.7). 25 In the case of bluefins, ITN has rarely provided prices of wild-caught fish as well and farmed fish. Furthermore, no distinction is made between prices of fresh/chilled and of frozen fish. 26 Indonesia is the main exporter of fresh and chilled bigeye to Japan (source: JFTA). 27 Indonesia is the main exporter of fresh and chilled yellowfin to Japan (source: JFTA).
73
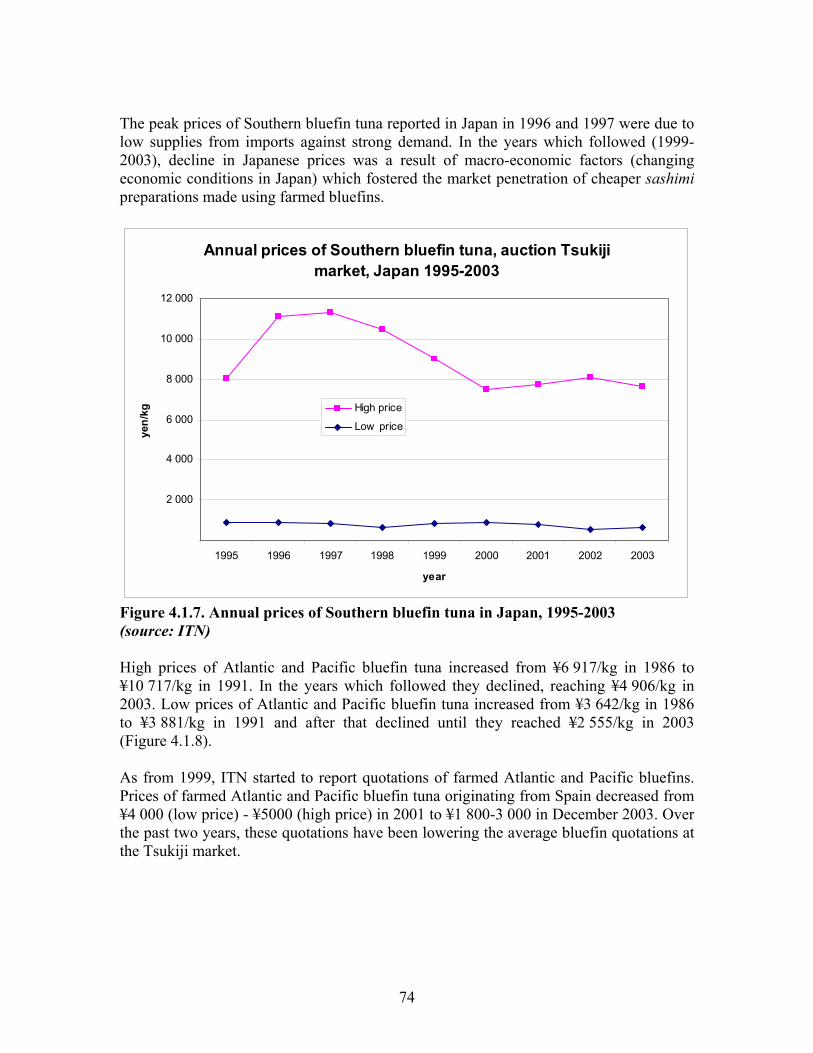
The peak prices of Southern bluefin tuna reported in Japan in 1996 and 1997 were due to low supplies from imports against strong demand. In the years which followed (1999-2003), decline in Japanese prices was a result of macro-economic factors (changing economic conditions in Japan) which fostered the market penetration of cheaper sashimi preparations made using farmed bluefins.
Annual prices of Southern bluefin tuna, auction Tsukiji market, Japan 1995-2003
2 000
4 000
6 000
8 000
10 000
12 000
1995 1996 1997 1998 1999 2000 2001 2002 2003
year
yen/
kg High price
Low price
Figure 4.1.7. Annual prices of Southern bluefin tuna in Japan, 1995-2003 (source: ITN) High prices of Atlantic and Pacific bluefin tuna increased from ¥6 917/kg in 1986 to ¥10 717/kg in 1991. In the years which followed they declined, reaching ¥4 906/kg in 2003. Low prices of Atlantic and Pacific bluefin tuna increased from ¥3 642/kg in 1986 to ¥3 881/kg in 1991 and after that declined until they reached ¥2 555/kg in 2003 (Figure 4.1.8). As from 1999, ITN started to report quotations of farmed Atlantic and Pacific bluefins. Prices of farmed Atlantic and Pacific bluefin tuna originating from Spain decreased from ¥4 000 (low price) - ¥5000 (high price) in 2001 to ¥1 800-3 000 in December 2003. Over the past two years, these quotations have been lowering the average bluefin quotations at the Tsukiji market.
74
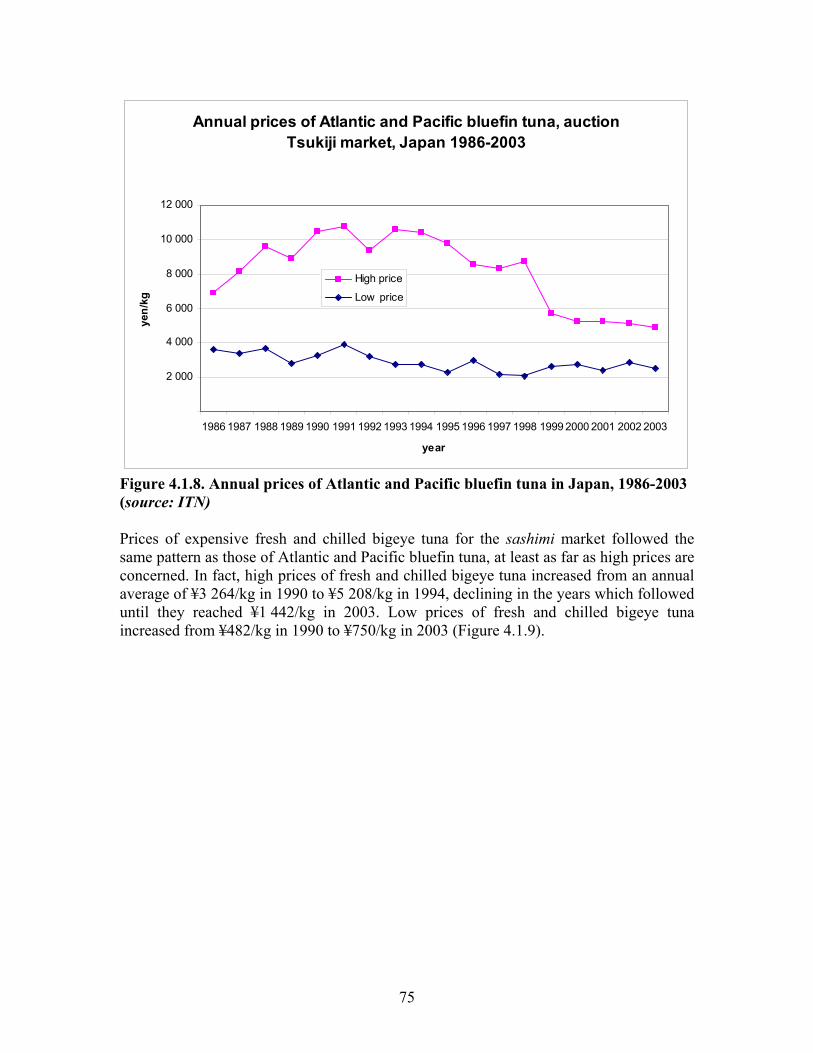
Annual prices of Atlantic and Pacific bluefin tuna, auction Tsukiji market, Japan 1986-2003
2 000
4 000
6 000
8 000
10 000
12 000
1986 1987 1988 1989 1990 1991 1992 1993 1994 1995 1996 1997 1998 1999 2000 2001 2002 2003
year
yen/
kg
High price
Low price
Figure 4.1.8. Annual prices of Atlantic and Pacific bluefin tuna in Japan, 1986-2003 (source: ITN) Prices of expensive fresh and chilled bigeye tuna for the sashimi market followed the same pattern as those of Atlantic and Pacific bluefin tuna, at least as far as high prices are concerned. In fact, high prices of fresh and chilled bigeye tuna increased from an annual average of ¥3 264/kg in 1990 to ¥5 208/kg in 1994, declining in the years which followed until they reached ¥1 442/kg in 2003. Low prices of fresh and chilled bigeye tuna increased from ¥482/kg in 1990 to ¥750/kg in 2003 (Figure 4.1.9).
75

Annual prices of bigeye tuna, fresh and chilled, auction Tsukiji market, Japan 1990-2003
1 000
2 000
3 000
4 000
5 000
6 000
1990 1991 1992 1993 1994 1995 1996 1997 1998 1999 2000 2001 2002 2003
year
yen/
kg
High price
Low price
Figure 4.1.9. Annual prices of fresh and chilled bigeye tuna in Japan, 1986-2003 (source: ITN) High prices of frozen bigeye increased from ¥5 264/kg in 1990 to ¥6 153/kg in 1994. In the years which followed, prices of frozen bigeye declined until they reached a low of ¥2 708/kg in 2002. However, in 2003 they picked up to ¥3 960/kg. Low prices of frozen bigeye increased from ¥981/kg in 1990 to ¥1 260/kg in 1994, declining to ¥460/kg in 2002 and recovering slightly in 2003 to ¥502/kg (Figure 4.1.10).
76

Annual prices of bigeye tuna, frozen, auction Tsukiji market, Japan 1990-2003
1 000
2 000
3 000
4 000
5 000
6 000
7 000
1990 1991 1992 1993 1994 1995 1996 1997 1998 1999 2000 2001 2002 2003
year
yen/
kg
High price
Low price
Figure 4.1.10. Annual prices of frozen bigeye tuna in Japan, 1986-2003 (source: ITN) Since 1994, high prices of bigeye tuna have been following the same declining pattern as Atlantic, Pacific and Southern bluefin prices. This pattern was a result of the continuing good world bigeye tuna catches in the 1991-2000 period and of the substitution of high quality bigeye with medium quality bigeye, which is reflected in the relatively buoyant low prices of bigeye. The lower price of bigeye is also due to the increased supply of farmed bluefin tuna. However, the increase of high prices in 2003, seems to be largely due to a low supply of the species, against high demand resulting from consumer preference for to the leaner meat of bigeye (and yellowfin) compared to farmed bluefins, which are reported to contain too much fat as a result of to artificial feeding. High prices of fresh and chilled yellowfin tunas increased from an annual average of ¥1 773/kg in 1990 to ¥2 782/kg in 1991, dropping in the years which followed and reaching a low of ¥1 517/kg in 2000. In 2002, prices recovered slightly to ¥1 883/kg, but declined again to ¥1 746/kg in 2003. Low prices of fresh and chilled yellowfin tuna increased from ¥423/kg in 1990 to ¥783/kg in 1996, declining to ¥183/kg in 2001 and picking up slightly to ¥327/kg in 2002 and ¥322/kg in 2003 (Figure 4.1.11).
77
Annual prices of yellowfin tuna, fresh and chilled, auction Tsukiji market, Japan 1990-2003
500
1 000
1 500
2 000
2 500
3 000
1990 1991 1992 1993 1994 1995 1996 1997 1998 1999 2000 2001 2002 2003
year
yen/
kg
High price
Low price
Figure 4.1.11. Annual prices of fresh and chilled yellowfin tuna in Japan, 1986-2003 (source: ITN) High prices of frozen yellowfin tuna increased from ¥1 850/kg in 1990 to ¥2 817/kg in 1995. In the years which followed, they declined until they reached a low of ¥962/kg in 2003. Low prices of frozen yellowfin fluctuated around an average of about ¥480/kg during the whole period (Figure 4.1.12).
78

Annual prices of yellowfin tuna, frozen, auction Tsukiji market, Japan 1990-2003
500
1 000
1 500
2 000
2 500
3 000
1990 1991 1992 1993 1994 1995 1996 1997 1998 1999 2000 2001 2002 2003
year
yen/
kg
High price
Low price
Figure 4.1.12. Annual prices of frozen yellowfin tuna in Japan, 1986-2003 (source: ITN) High yellowfin prices seem to follow the same pattern as high bluefin and bigeye prices, with an increase followed by a drastic decline. Low yellowfin prices appear relatively stable over the period considered. While lovers of traditional fat sashimi may find farmed fish a cheaper alternative to wild-caught bluefin, those who prefer leaner meat can turn to wild-caught bigeye, yellowfin and albacore. There have been concerns over the quality of farmed bluefin, especially in relation to excessive fat contents of the meat. Furthermore, environmental groups expressed their concerns over the environmental impact of tuna farming, especially as far as waste management was concerned.
4.2. The United States of America The United States is an important market for sashimi preparations, due to the spread of sushi bars and Japanese restaurants especially in the West Coast (California) and in large cities. The United States is also a traditional market for tuna steaks. NMFS statistics do not differentiate between imports of tuna for canning and imports of tuna for other uses. However, assuming that most fresh and chilled tunas and fresh,
79

chilled and frozen bigeye and bluefins are mainly utilized for direct consumption the analysis of this chapter will be focused on imports of fresh and chilled tuna by species and imports of frozen tuna by species. United States imports of fresh and chilled tuna increased from 6 000 tonnes in 1990, equivalent to US$27 million, to 19 300 tonnes in 2003, equivalent to US$171 million (Figure 4.2.1 [a] and [b]). The main imported species is by far yellowfin tuna, which, in fresh form, is used for the preparation of steaks, sashimi, and, marginally, for canned preparations. Bigeye and bluefins, which are almost exclusively used for the preparation of steaks and sashimi, follow.
(a) United States imports of fresh/chilled tuna by species, quantity 1990-2003
0
5 000
10 000
15 000
20 000
25 000
30 000
1990 1991 1992 1993 1994 1995 1996 1997 1998 1999 2000 2001 2002 2003
year
tonn
es
SkipjackSouthern bluefinTunas neiAlbacoreAtlantic and Pacif ic bluefinsBigeyeYellow fin
80

(b) United States imports of fresh/chilled tuna by species, value 1990-2003
0
20 000
40 000
60 000
80 000
100 000
120 000
140 000
160 000
180 000
1990 1991 1992 1993 1994 1995 1996 1997 1998 1999 2000 2001 2002 2003
year
US$
000
SkipjackSouthern bluefinTunas neiAlbacoreAtlantic and Pacif ic bluefinsBigeyeYellow fin
Figure 4.2.1 (a) and (b). United States imports of fresh and chilled tuna by species, 1990-2003 (source: NMFS) Conversely, imports of frozen tunas (mainly aimed at canned preparations, with the exceptions of bluefins and bigeye) dropped from 132 300 tonnes in 1990, worth US$180 million, to 19 300 tonnes in 2003, worth US$69 million. The reason lies within the increased reliance on tuna loins by domestic canners (now mostly located in American Samoa) and on canned tuna from Ecuador and Thailand. It is interesting to note that the decline of yellowfin imports in terms of quantity was not matched by a parallel decline in import value, because the United States substituted the imports of yellowfin for canning with more expensive yellowfin for direct consumption. Frozen albacore, which is a traditional raw material for canning in the United States, dropped vigorously in terms of import quantity and value. Imports of frozen skipjack, another traditional raw material for canning of the United States’ industry, almost disappeared. Imports of bigeye and bluefins in frozen form are marginal in relation to fresh/chilled imports (Figure 4.2.2 [a] and [b]).
81

(a) United States imports of frozen tuna by species, quantity 1990-2003
0
20 000
40 000
60 000
80 000
100 000
120 000
140 000
160 000
1990 1991 1992 1993 1994 1995 1996 1997 1998 1999 2000 2001 2002 2003
year
tonn
es
Southern bluefinAtlantic and Pacif ic bluefinsTunas neiSkipjackBigeyeYellow finAlbacore
(b) United States imports of frozen tuna by species, value 1989-2003
0
50 000
100 000
150 000
200 000
250 000
1989 1990 1991 1992 1993 1994 1995 1996 1997 1998 1999 2000 2001 2002
year
US$
000
Southern bluefinSkipjackTunas neiAtlantic and Pacif ic bluefinsBigeyeAlbacoreYellow fin
Figure 4.2.2 (a) and (b). United States imports of frozen tuna by species, 1990-2003 (source: NMFS)
82

Imports of fresh, chilled and frozen tuna by the United States have become increasingly fragmented as well as reduced. Figure 4.2.3 (a) (b) and (c) presents the top five suppliers of fresh, chilled and frozen tuna to the United States in three different years (1990, 1996 and 2003). While in 1990 most imports of whole tuna from the United States came from Taiwan Province of China and Ghana, in 1996 while Taiwan Province of China was still keeping its dominant position, imports from Ghana had largely declined. In 2003, most top suppliers of previous years disappeared, with the exception of Ecuador. The main suppliers of tuna to Canada in 2003 are fellow American countries and territories of Canada, Trinidad and Tobago, the Netherlands Antilles and Ecuador, as well as Viet Nam (Figure 4.2.3 [a] [b] and [c]). Surprisingly, with the exception of Ecuador, none of these countries can count on a large domestic tuna industry.
(a) 1990
GhanaJapan
Spain
OthersTaiw.PC
Ecuad.
(b) 1996
Taiwan PC
France
JapanEcuad.Ghana
Others
(c) 2003
Canada
Neth. Ant illes
Viet Nam
Ecuad.
Others
Trin.Tobago
6
Figure 4.2.3 (a) and (b). United States imports of fresh, chilled and frozen tuna by top five suppliers, quantity (in tonnes) 1990, 1996 and 2003 (source: NMFS) Imports of whole tuna in the United States are now mostly aimed at direct consumption. The few domestic canneries left, mostly located in American Samoa, mostly process tuna from frozen pre-cooked loins for cost-effectiveness reasons. In the future, imports of whole tuna will presumably fluctuate around current levels, because tuna for direct consumption is unlikely to turn into a mass distribution commodity, due to the price-consciousness of the North American consumer and the impact of Federal Government warnings on consumption of fish with high methyl mercury contents.
4.3. The EU The EU is also a large market for fresh, chilled and frozen tuna for non-canning purposes. As a general rule, fresh, chilled and frozen tunas for non-canning purposes are subject to a 22 percent duty rate. However, countries belonging to the ACP, LDC and Central American and Caribbean groups export fresh, chilled and frozen tuna for non-canning purposes to the EU duty-free. EU imports of tuna for non-canning uses increased from 34 800 tonnes in 1993, equivalent to €46 million, to 99 200 tonnes in 2001, equivalent to €128 million, to decline slightly to 87 200 tonnes in 2002, equivalent to €157 million (Figure 4.3.1).
83

EU imports of fresh, chilled and frozen tuna for direct consumption, 1993-2002
0
20 000
40 000
60 000
80 000
100 000
120 000
1993 1994 1995 1996 1997 1998 1999 2000 2001 2002
year
tonn
es
0
20 000
40 000
60 000
80 000
100 000
120 000
140 000
160 000
180 000
EUR
000
Import quantity
Import value
Figure 4.3.1. EU imports of tuna for direct consumption, 1993-2002 (source: EUROSTAT) Imports of tuna for non-canning purposes from non-EU countries represent 70 percent of quantity and 50 percent of value of total EU imports of tuna for non-canning purposes. The main extra-EU suppliers of tuna for non-canning purposes to the EU are the Netherlands Antilles and Guatemala. Table 4.3.1. EU imports of tuna for direct consumption by main suppliers, quantity (tonnes) and value (€1 000), 1993-2002 (source: EUROSTAT)
1993 1994 1995 1996 1997 q v q v q v q v Neth. Antilles 28 37 26 21 6 976 5 451 22 644 33 272 Guatemala 14 15 12 27 514 546 2396 2 242 2325 3 293 1998 1999 2000 2001 2002 q v q v q v q v q v Neth. Antilles 14 194 18 873 18 750 15 108 17 764 11 588 21 556 19 392 20 555 21 471 Guatemala 151 341 301 518 2031 2 341 24 199 25 587 10 858 12 628
The main country of destination of EU imports of tuna for non-canning purposes is Spain, whose imports of tuna for non-canning purposes accounted for 70 percent quantity
84
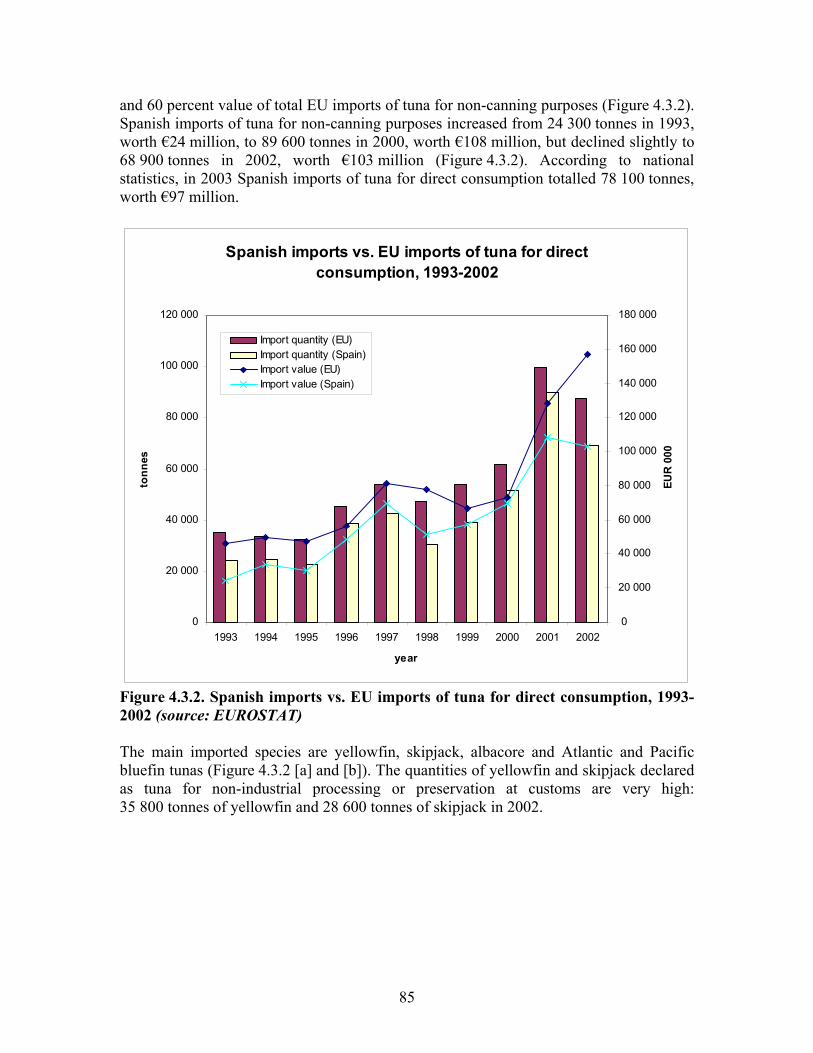
and 60 percent value of total EU imports of tuna for non-canning purposes (Figure 4.3.2). Spanish imports of tuna for non-canning purposes increased from 24 300 tonnes in 1993, worth €24 million, to 89 600 tonnes in 2000, worth €108 million, but declined slightly to 68 900 tonnes in 2002, worth €103 million (Figure 4.3.2). According to national statistics, in 2003 Spanish imports of tuna for direct consumption totalled 78 100 tonnes, worth €97 million.
Spanish imports vs. EU imports of tuna for direct consumption, 1993-2002
0
20 000
40 000
60 000
80 000
100 000
120 000
1993 1994 1995 1996 1997 1998 1999 2000 2001 2002
year
tonn
es
0
20 000
40 000
60 000
80 000
100 000
120 000
140 000
160 000
180 000
EUR
000
Import quantity (EU)Import quantity (Spain)Import value (EU)Import value (Spain)
Figure 4.3.2. Spanish imports vs. EU imports of tuna for direct consumption, 1993-2002 (source: EUROSTAT) The main imported species are yellowfin, skipjack, albacore and Atlantic and Pacific bluefin tunas (Figure 4.3.2 [a] and [b]). The quantities of yellowfin and skipjack declared as tuna for non-industrial processing or preservation at customs are very high: 35 800 tonnes of yellowfin and 28 600 tonnes of skipjack in 2002.
85

(a) EU imports of tuna for non-canning purposes by main species, quantity 1993-2002
5 000
10 000
15 000
20 000
25 000
30 000
35 000
40 000
45 000
50 000
1993 1994 1995 1996 1997 1998 1999 2000 2001 2002
year
tonn
es
Yellow fin
Skipjack
Atlantic and Pacif ic bluefins
Albacore
Other tunas
(b) EU imports of tuna for non-canning purposes by main species, value 1993-2002
10 000
20 000
30 000
40 000
50 000
60 000
70 000
1993 1994 1995 1996 1997 1998 1999 2000 2001 2002
year
EUR
000
Yellow fin
Atlantic and Pacif ic bluefins
Albacore
Skipjack
Other tunas
Figure 4.3.3 (a) and (b). EU imports of tuna for direct consumption by main imported species, 1993-2002 (source: EUROSTAT).
86
The EU market of tuna for direct consumption, despite being generally considered as a niche one, has been growing over the past decade, according to EUROSTAT data on tuna for non-canning purposes. Some market analysts believe that, in time, several tonnes of raw material for canning purposes (loins) may have been registered at customs as tuna for non-canning. As a matter of fact, increasing quantities of tuna steaks are seen on display in fishmongers and supermarkets, and in menus at seafood restaurants all over the EU. Furthermore, Japanese restaurants and sushi bars are a well-established reality in major European cities. However, due to the luxury character of Japanese cuisine in Europe, the consumption of sashimi is likely to stay confined to a limited niche of European connoisseurs and Japanese expatriates. According to EUROSTAT data, the EU increased its imports of frozen Thunnus and Euthynnus fillets from 1 142 tonnes in 1993 to 11 000 tonnes in 2002. Tariffs for fresh, chilled and frozen tuna fillets amount to 18 percent erga omnes, with some preferences, while tariffs for fresh and chilled tuna meat (whether or not minced) amount to 15 percent erga omnes, with some preferences, and tariffs for frozen tuna meat (whether or not minced) amount to 7.5 percent erga omnes, with some preferences. However, these data should be interpreted with caution because of the possible confusion with raw material for canning (loins) which may occur at customs. Prices of tuna for direct consumption in the EU have been soaring in the nineties, with the exception of skipjack. Albacore prices increased from an average of US$1.82/kg in 1989 to an average of US$3.14/tonnes in 2001. Yellowfin prices (over 10 kg) have been increasing from an average of US$1.59/kg to an average of US$1.97/kg in 2001. Yellowfin (under 10 kg) prices have been increasing from an average of US$1.32/kg in 1989 to an average of US$1.86 kg in 2001. Skipjack prices declined from US$1.16/kg in 1989 to a low of US$0.83 in 1998, picking up to reach US$1.44/kg in 2001 (Figure 4.3.3).
87

Prices of tuna for direct consumption in the EU: yearly average 1989-2001
0
1
1
2
2
3
3
4
1989 1990 1991 1992 1993 1994 1995 1996 1997 1998 1999 2000 2001
year
US$
/kg
Albacore
Yellow fin>10kg
Yellow fin<10 kg
Skipjack
Figure 4.3.4. Prices of tuna for direct consumption in the EU (market reference: Spain), 1989-2001.
88

5 Conclusion
5.1.1. The canned tuna market There are eight principal regional markets of canned tuna and tuna raw material: Northern Europe, Southern Europe, the United States, Africa, Latin America, Southeast Asia, Japan and the Middle East. Northern and Central European Countries such as the United Kingdom, Benelux and Scandinavia do not produce canned tuna but rely on imports of, mainly, skipjack from Southeast Asia. However, the product ranges in Northern European supermarkets are more varied now than ten or fifteen years ago. In terms of species, yellowfin and albacore are now being increasingly marketed in Northern and Central Europe due to their superior quality and distinctive taste. In terms of product ranges, tuna salads, tuna hors d’oeuvres and tuna in pouch have been increasingly made available in Northern and Central European supermarkets. The Northern European tuna market still remains environmental conscious; hence, canned tuna must be labelled “dolphin-free” to be marketed safely in Northern Europe. The Southern European market of canned tuna relies both on domestic production and imports. Southern European canneries mostly produce canned tuna in olive oil and other value-added products (tuna salads, tuna hors d’oeuvres) mainly from frozen pre-cooked loins. In turn, standard products such as tuna in brine and tuna in vegetable oil are imported from Latin America and Africa, where EU canneries have increasingly relocated, but also from Southeast Asia. Tuna in pouch is also produced by EU-ACP canneries and imported from third countries; however, the market penetration of this product has been more difficult than in the United States, due to the more conservative nature of the EU market28. In Eastern Europe, the main markets for tuna are Poland and the Czech Republic; however their imports of canned tuna fluctuate around 4 000 to 5 000 tonnes. It may be likely that these markets will grow as a result of the forthcoming EU enlargement29. The reduction of import duty from Thailand, the Philippines and Indonesia is likely to expand the export of Southeast Asian countries to the EU, including Southern Europe. The United States tuna market mainly relies on imports from Southeast Asia and Ecuador, and domestic production is almost exclusively undertaken in American Samoa, where canned tuna is processed from loins. The image of canned tuna has undergone
28 At present, EUROSTAT nor national statistics of EU Members provide a separate tariff code for tuna in pouch. 29 Ten more countries, i.e. Cyprus, the Czech Republic, Estonia, Hungary, Latvia, Lithuania, Malta, Poland, the Slovak Republic, and Slovenia are joining the EU on 1 May 2004.
89

difficult times during the past fifteen years, due to the tuna-dolphin issue and the methyl mercury scare. However canned tuna remains a well accepted commodity by United States’ households and the launching of tuna in pouch has been particularly successful. At present, there are two contrasting trends in the United States tuna industry: internationalization and protection of domestic production. In the future, the domestic tuna industry may specialize in processing upmarket products. In turn, mass distribution commodities may still be imported from other countries (Thailand and Ecuador), but they will have to grant the environmental friendliness and health benefits of the product in order not to lose consumer preference. Africa is just a market for raw material, and despite the presence of state of the art canneries in Côte d’Ivoire, Madagascar, Senegal, and Seychelles (installed through EU investments), local consumption is very limited and production is almost exclusively exported to the EU. However, due to the WTO-led progressive lowering of import tariffs for processed products, African-based canneries may eventually lose their competitiveness in the EU and other international markets to Southeast Asian canneries. European and Northern American offshore investments are also largely present in Latin America, however domestic consumption of canned tuna in Latin American Countries is relatively high, and especially in Mexico, Venezuela, Brazil and Argentina. Southeast Asia (Thailand, the Philippines and Indonesia) is a traditional producing and exporting area, with little domestic market. However, the introduction of Western habits has already fostered the regional consumption of canned tuna. Canned tuna for regional consumption is mainly produced in Thailand. Japan is a large canned tuna consuming country, which has been substituting over time domestic production with imports, mainly from Thailand, for cost-effectiveness reasons. The Middle East is a healthy and growing market for canned tuna, the most important national markets being Egypt and Saudi Arabia. Cheap preparations from Thailand dominate the market, but also more expensive yellowfin preparations: for instance, the Italian Rio Mare leads the premium market in Saudi Arabia. The tuna industry in the EU-ACP area and in the United States (American Samoa) will have to focus on value-addition to remain competitive vis-à-vis Thailand, the Philippines, Indonesia and Ecuador. Value-addition should encompass all the tuna salads, tuna in sauce, tuna hors d’oeuvre and tuna spread ranges but also, in more conservative markets, by enhancing traditional canned tuna products without modifying their essential features. Examples include the marketing of solid pack packing yellowfin in extra-virgin olive oil and the development of luxury lines of tuna fillets or other tuna products (such as tuna belly, ventresca di tonno, in Italy) packed in glass jar and preserved in olive oil, including extra-virgin olive oil.
90

5.1.2. The market of tuna for direct consumption The main markets of tuna for direct consumption are Japan and the United States, followed by Western Europe (and Southern Europe in particular). In Japan, tuna is consumed mainly as sashimi; in the United States, tuna is consumed both as sashimi and tuna steaks and in Europe tuna is consumed mainly as steaks. The likely developments of the Japanese sashimi tuna market and industry in the future will be:
Further restrictions to captures in the wild and to international trade of bluefins; • • •
Investing in quality and sustainability of bluefin tuna farming; Opening of the markets to farmed bigeye and yellowfin.
Further catch and trade restrictions, driven by the need to preserve Atlantic, Pacific and Southern bluefin stocks in the wild will push wild-caught bluefin to an even smaller luxury niche, against the cheaper, widespread farmed bluefin. However, investing in quality and sustainability (through, for instance, better waste management) may require additional costs to tuna farmers, who may want to market their tuna at higher price levels than the current ones for farmed tuna. The development of China (mainland) as a producer of tuna for the sashimi market should be taken into account, as well as the development of a sashimi market in Southeast Asia outside Japan. In Europe, the market of tuna for direct consumption, albeit growing, is set to remain confined (at least in the short to medium term) to the niche of coastal areas (steaks), sushi bars, Japanese restaurants and gourmet sections of supermarkets of large metropolitan areas. The main reasons lie within the expensive nature of the products and the lack of a tradition of direct consumption of tuna with the exception of some coastal areas. The United States is the second largest consumer of sashimi in the world after Japan and tuna steaks are well accepted products. However, the methyl mercury scares as well as the luxury character of tuna for direct consumption are major obstacles to the mass marketing of tuna for direct consumption in North America.
91
References ADB/INFOFISH. 1991. Global industry update: tuna, H. Josupeit (ed.). INFOFISH,
Kuala Lumpur. 134 pp. Allen, R. 2002. Global tuna resources: limits to growth and sustainability. In Subasinghe,
S. & Sudari, P. (eds.). 2002. Global Tuna Industry Situation and Outlook: Resources, Production & Marketing Trends and Technological Issues. Proceedings of the Tuna 2002 Kuala Lumpur, 7th INFOFISH World Tuna Trade Conference, Kuala Lumpur, Malaysia, 30 May-1 June, 2002, pp. 3-12. Kuala Lumpur, INFOFISH. 208 pp.
ANFACO. 2003. Estudio para la identificación de necesidades y perspectivas del sector
de la transformación de los productos de la pesca y de la acuicultura en España. ANFACO, Vigo. 10 pp.
Anonymous. The Sushi World Guide. (http://www.sushi.infogate.de/lang.htm). Anzer, W. J. 2002. EU legislation for tuna and tuna products. In Subasinghe, S. &
Sudari, P. (eds.). 2002. Global Tuna Industry Situation and Outlook: Resources, Production & Marketing Trends and Technological Issues. Proceedings of the Tuna 2002 Kuala Lumpur, 7th INFOFISH World Tuna Trade Conference, Kuala Lumpur, Malaysia, 30 May-1 June, 2002, pp. 131-133. Kuala Lumpur, INFOFISH. 208 pp.
ATUNA. Archive Tuna Market News. (http://www.atuna.com/markt/market_index_M.htm). Bernard O’Brien. 2003. John West. (http://www.ees.ndo.co.uk/John_West/john_west.html). Bolton Group. 2003. Products. Food. (http://www.boltongroup.net/en/publishing.asp?ArticlePath=14-25-). Brus, H. J. C. 2002. The EU market for canned tuna. In Subasinghe, S. & Sudari, P.
(eds.). 2002. Global Tuna Industry Situation and Outlook: Resources, Production & Marketing Trends and Technological Issues. Proceedings of the Tuna 2002 Kuala Lumpur, 7th INFOFISH World Tuna Trade Conference, Kuala Lumpur, Malaysia, 30 May-1 June, 2002, pp. 94-99. Kuala Lumpur, INFOFISH. 208 pp.
Carril Diaz, A. 2002. Technological Developments in Tuna Canning and Processing. In
Subasinghe, S. & Sudari, P. (eds.). 2002. Global Tuna Industry Situation and Outlook: Resources, Production & Marketing Trends and Technological Issues. Proceedings of the Tuna 2002 Kuala Lumpur, 7th INFOFISH World Tuna Trade Conference, Kuala Lumpur, Malaysia, 30 May-1 June, 2002, pp. 143-147. Kuala Lumpur, INFOFISH. 208 pp.
92

Chicken of the Sea. 2002. Frequently Asked Questions. (http://www.chickenofthesea.com/faqs.asp). CNN. 2001. Cooked tuna could be hazardous to your health. (http://www.cnn.com/2001/HEALTH/03/13/cooked.tuna/). Commission Regulation (EC) No 2454/1993 of 2 July 1993 laying down provisions for
the implementation of Council Regulation (EEC) No 2913/92 establishing the Community Customs Code. OJ L253, 11/10/1993, pp. 1-766.
(http://europa.eu.int/smartapi/cgi/sga_doc?smartapi!celexapi!prod!CELEXnumdoc&lg=EN&numdoc=31993R2454&model=guicheti).
Council Regulation (EC) No 379/2004 of 24 February 2004 opening and providing for
the management of autonomous Community tariff quotas for certain fishery products for the period 2004 to 2006. OJ L379, 2/3/2004, pp. 7-10.
(http://europa.eu.int/eur-lex/pri/en/oj/dat/2004/l_064/l_06420040302en00070010.pdf). Commission Regulation (EC) No 466/2001 of 8 March 2001 setting maximum levels
for certain contaminants in foodstuffs. OJ L 77 16/3/2001, pp. 1–13. (http://europa.eu.int/smartapi/cgi/sga_doc?smartapi!celexapi!prod!CELEXnumdoc&lg=EN
&numdoc=32001R0466&model=guicheti). Council Regulation (EC) No 2501/2001 of 10 December 2001 applying a scheme of
generalised tariff preferences for the period from 1 January 2002 to 31 December 2004. OJ L346 31/12/2001, pp. 1-59.
(http://europa.eu.int/smartapi/cgi/sga_doc?smartapi!celexapi!prod!CELEXnumdoc&lg=EN&numdoc=32001R2501&model=guicheti).
Council Regulation (EC) No 2803/2000 of 14 December 2000 opening and providing
for the administration of autonomous Community tariff quotas for certain fishery products. OJ L 331 27/12/2000, pp. 61-62.
(http://europa.eu.int/smartapi/cgi/sga_doc?smartapi!celexapi!prod!CELEXnumdoc&lg=EN&numdoc=32000R2803&model=guicheti).
Council Regulation (EC) No 975/2003 of 5 June 2003 opening and providing for the
administration of a tariff quota for imports of canned tuna covered by CN codes 1604 14 11, 1604 1418 and 1604 20 70. OJ L141 7/6/2003, pp. 1-2.
(http://europa.eu.int/smartapi/cgi/sga_doc?smartapi!celexapi!prod!CELEXnumdoc&lg=EN&numdoc=32003R0975&model=guicheti).
Council Regulation (EEC) No 1536/1992 of 9 June 1992 laying down common
marketing standards for preserved tuna and bonito. OJ L 163 17/6/1992, pp. 1-4. (http://europa.eu.int/smartapi/cgi/sga_doc?smartapi!celexapi!prod!CELEXnumdoc&lg=EN
&numdoc=31992R1536&model=guicheti).
93

Council Regulation (EEC) No 493/1991 of 22 July 1991 laying down the health conditions for the production and the placing on the market of fishery products. OJ L268 24/9/1991, pp. 15-34.
(http://europa.eu.int/smartapi/cgi/sga_doc?smartapi!celexapi!prod!CELEXnumdoc&lg=EN&numdoc=31991L0493&model=guicheti).
Curto, R. 2001. Perception, Specialization and Cooperation. Tri-marine International
Inc. San Pedro (CA), United States. 12 pp. (http://www.trimarine-usa.com/news/events/vigo-speech.pdf). Decision No 2/2002 (2002/891/EC) of the ACP-EC Customs Cooperation Committee
of 28 October 2002 derogating from the concept of "originating products" to take account of the special situation of the ACP States regarding the production of canned tuna and of tuna loins (HS heading ex 16.04). OJ L311 14/11/2002, pp. 22-24.
(http://europa.eu.int/smartapi/cgi/sga_doc?smartapi!celexapi!prod!CELEXnumdoc&lg=EN&numdoc=22002D0891&model=guicheti).
DNSCE. 2003. Statistiques du commerce extérieur. Résultats mensuels Produits-Pays.
Décembre 2002. CD Rom. EPA. 2001. “Mercury Update: Impact on Fish Advisories”. EPA Office of Water Fact
Sheet [EPA-823-F-01-11]. 10 pp. (http://www.epa.gov/ost/fishadvice/mercupd.pdf). Escurís, J. M. A. 2001. ANFACO – Conferencia Atún 19/09/01 Conservas de Atún y
sus Marcas en España. In Second European Tuna Conference. Vigo, Spain, 18-19 September 2001, pp. 151-160. ANFACO, CECOPESCA, Vigo, Spain. 209 pp.
Euro Business Club. 2003. Conservas Garavilla SA. (http://www.eurobc.net/conservasgaravilla/). European Commission TARIC Database. (http://europa.eu.int/comm/taxation_customs/dds/en/tarhome.htm). European Commission. 2002. The EU’s relations with the Andean Community.
(http://www.europa.eu.int/comm/external_relations/andean/intro/index.htm). EUROSTAT data. Faleomaveaga, E. 2002. The Impact of Expected US Duty Revision on American Samoa
with regard to Developing Longline Fisheries in Samoa Islands and Fiji In Subasinghe, S. & Sudari, P. (eds.). 2002. Global Tuna Industry Situation and Outlook: Resources, Production & Marketing Trends and Technological Issues. Proceedings of the Tuna 2002 Kuala Lumpur, 7th INFOFISH World Tuna Trade Conference, Kuala Lumpur, Malaysia, 30 May-1 June, 2002, pp. 52-54. INFOFISH. 208 pp.
94
FAO FIDI. FISHSTAT Plus data. FAO. 2003. UN Committee recommends new dietary intake limits for mercury. FAO
Newsroom. Rome, FAO. (http://www.fao.org/english/newsroom/news/2003/19783-en.html). FAO/GLOBEFISH. 2002. The German Market for Fish and Seafood, by J. Rüdiger.
FAO/GLOBEFISH Research Programme, Vol. 71. Rome, FAO/GLOBEFISH. 116 pp.
FAO/GLOBEFISH. Data bank. (http://www.globefish.org). FDA and EPA. 2003. Draft Advice For Women Who Are Pregnant, Or Who Might
Become Pregnant, and Nursing Mothers, About Avoiding Harm To Your Baby Or Young Child From Mercury in Fish and Shellfish. Consumer Advisory. Washington, FDA and EPA.
(http://www.fda.gov/oc/opacom/mehgadvisory1208.html). FDA. 2001. An important message for pregnant women and women of childbearing age
who may become pregnant about the risks of mercury in fish. Consumer Advisory, Center for Food Safety and Applied Nutrition, US Food and Drug Administration. Washington, FDA.
(http://www.cfsan.fda.gov/~acrobat/hgadv1.pdf). FDA. 2003. EAFUS: A Food Additive Database.
(http://www.cfsan.fda.gov/~dms/eafus.html). Ferrari, F. 2001. Il tonno: alle origini di quella scatoletta… Il Pesce, Giugno 2001. (http://www.pubit.it/sunti/pes0103l.html). FIAC. 2003. Rapport Économique 2002 - Produits de la mer. Paris, ADEPALE. 16 pp. Fiji National Trade Statistics. Fisheries Agency, Council of Agriculture, Executive Yuan. 2003. Taiwan Province of
China Fisheries Statistical Yearbook. Gillett, R., McCoy, M. & Itano, D.G. 2002. Status of the United States Western Pacific
Tuna Purse Seine Fleet and Factors Affecting Its Future. Pelagic Fisheries Research Program. Honolulu (HI), USA, JIMAR. 64 pp.
95
Gillett, R., McCoy, M. & Itano, D.G. 2002. Status of the United States Western Pacific Tuna Purse Seine Fleet and Factors Affecting Its Future. Pelagic Fisheries Research Program. Honolulu (HI), USA, JIMAR. 64 pp.
Hampton, J. and Williams, P. 2003. The Western and Central Pacific tuna fishery:
overview and status of the stocks. Noumea, SPC. 54 pp. (http://www.spc.int/OceanFish/Docs/Research/TFAR_2001_No4.pdf). Harada, Y. 2002. Tuning tuna. Samudra 33:32-34. (http://www.icsf.net/jsp/publication/samudra/pdf/english/issue_33/art07.pdf). Health Canada. 2001. Advisory (29 May 2001) – Information on mercury levels in fish. (http://www.hc-sc.gc.ca/english/protection/warnings/2001/2001_60e.htm). INFOFISH Trade News. Interatun. 2003. ¿Que organizaciones componen INTERATUN? (http://www.interatun.com/MiembrosMain.html). ISTAT. Coeweb – statistiche del commercio estero. Rome, ISTAT. (http://www.coeweb.istat.it/). JFTA. 2003. Trade Statistics. (http://www.customs.go.jp/toukei/srch/indexe.htm?M=&P=). King, D.M. 1987. US Tuna Market. In Doulman, D. (ed.) Tuna Issues and Perspectives
in the Pacific Islands, pp. 63-80. Honolulu (HI), USA, Pacific Islands Development Program, East-West Center.
LEDA Fish Info. 2002. Info tuna quality. (http://www.ledafish.com/tuna.htm). Lehodey, P. In press. Impacts of El Niño Southern Oscillation on tuna populations and
fisheries. Secretariat of the Pacific Community, Noumea. Lischewski, C. 2000. The US Market for Canned Tuna. In Subasinghe, S. & Sudari, P.
(eds.). 2000. Tuna 2000 Bangkok. Papers of the 6th World Tuna Trade Conference, Bangkok, Thailand, 25-27 May 2000, pp. 87-90. Kuala Lumpur, INFOFISH. 234 pp.
Lischewski, C. 2002. The US Market for Canned Tuna. In Subasinghe, S. & Sudari, P.
(eds.). 2002. Global Tuna Industry Situation and Outlook: Resources, Production & Marketing Trends and Technological Issues. Proceedings of the Tuna 2002 Kuala Lumpur, 7th INFOFISH World Tuna Trade Conference, Kuala Lumpur, Malaysia, 30 May-1 June, 2002, pp. 87-93. Kuala Lumpur, INFOFISH. 208 pp.
Maldivian Ministry of Fisheries, Agriculture and Marine Resources data.
96
Ministero delle Politiche Agricole e Forestali. 2002. Premessa generale e stato di
attuazione del quinto piano. Parte II Titolo I – le strutture a terra. Roma, MiPA. (http://www.politicheagricole.it/PESCA/SFOP/Piano/PianoV/ParteIITitolo1.htm). Miyake, M.P. In press. International Marketing of Farmed Tuna. Prepared for the
GFCM/ICCAT Working Group on Sustainable Tuna Farming Practices in the Mediterranean. Rome, FAO. 11 pp.
Myers, G.J., Davidson, P.W., Cox C., Shamlaye, C.F., Palumbo, D., Cernichiari, E.,
Sloane-Reeves, J., Wilding, G. E., Kost, J, Huang, L. & Clarkson, T.W. 2003. Prenatal methylmercury exposure from ocean fish consumption in the Seychelles child development study. The Lancet, 361(9370):1686-1692.
NMFS. 2003. NMFS Foreign Trade Information. Washington, NMFS. (http://www.st.nmfs.gov/st1/trade/index.html). Nostromo. 2003. Chi è Calvo. (http://www.tonnonostromo.it/web/Calvo.html). Office National Interprofessionnel des Produits de la Mer et de l’Aquaculture
(OFIMER). 2000. « Le marché du thon ». Note présentée au Conseil de Direction de l’OFIMER du 24 mai 2000 »
(http://www.ofimer.fr/PDF/obseco/11_notesthem/thon.PDF). Philippine National Trade Statistics. Princes Food. 2003. Products. (http://www.princes.co.uk/products/index.asp). Republic of Korea Trade Statistics. Samoa National Trade Statistics. Saupiquet. 2002. Saupiquet – some background info. (http://www.Saupiquet.com/gb/enbref.htm). Slayne, M. A. 2002. EU developments on food safety – relevance for tuna and tuna
products. In Subasinghe, S. & Sudari, P. (eds.). 2002. Global Tuna Industry Situation and Outlook: Resources, Production & Marketing Trends and Technological ssues. Proceedings of the Tuna 2002 Kuala Lumpur, 7th INFOFISH World Tuna Trade Conference, Kuala Lumpur, Malaysia, 30 May-1 June, 2002, pp. 129-130. INFOFISH. 208 pp.
Sushi Zen. 2000. Things you’ve always wanted to ask about sushi. (http://sushizen-ny.com/demystify/toro.html).
97

Tamate, J. 2000. The Tuna Industry in the Western and Central Pacific: Recent Developments. In Subasinghe, S. & Sudari, P. (eds.). 2000. Tuna 2000 Bangkok. Papers of the 6th World Tuna Trade Conference, Bangkok, Thailand, 25-27 May 2000, pp. 54-69. Kuala Lumpur, INFOFISH. 234 pp.
Tanabe, R. 2000. The Tuna Market in Japan. pp. 96-101 In Subasinghe, S. & Sudari, P.
(eds.). 2000. Tuna 2000 Bangkok. Papers of the 6th World Tuna Trade Conference, Bangkok, Thailand, 25-27 May 2000, pp. 96-101. Kuala Lumpur, INFOFISH. 234 pp.
Thaifood Processors’ Association 2004. (http://www.thaifood.org). Thailand Department of Fisheries data. Tri-marine. 2003. Tri-marine cooked loins. (http://www.trimarine-usa.com/products/loins.html). US Department Of Commerce (DOC). 2003. AGOA. (http://www.agoa.gov/). US Department Of Labor (DOL). 2003. American Samoa Economic Report.
Washington DC, DOL. (http://www.dol.gov/esa/whd/AS/toc.htm). US International Trade Commission (USITC). 2002. Likely impact of US Tariff
Modification for tuna imported from ATPA beneficiaries. Washington DC, USITC. USITC. 2004. Harmonized tariffs of the United States (2004). Washington DC, USITC. (http://hotdocs.usitc.gov/tariff_chapters_current/toc.html). US Trade Representative (USTR). 1999. US Generalized System of Preferences.
Guidebook. Washington DC, USTR. 75 pp. (http://www.ustr.gov/pdf/gspintro.pdf). USTR. 2003. US-Central American Free Trade Agreement. Washington DC, USTR. (http://www.ustr.gov/new/fta/cafta.htm). Varela Suanzes-Carpegna, D. 2001. El mercado interior europeo: un nuevo escenario
para el atún. Consumo, posibilidades y desafío. In ANFACO-CECOPESCA (eds.) Second European Tuna Conference. Vigo, Spain, 18-19 September 2001, pp. 212-19. Vigo, Spain, ANFACO, CECOPESCA 2001. 209 pp.
WTO. 2001. Trading into the future. Geneva, WTO. 68 pp. (http://www.wto.org/english/res_e/doload_e/tif.pdf). WTO. Online. Mexico etc. vs. US: tuna-dolphin. Geneva, WTO. (http://www.wto.org/english/tratop_e/envir_e/edis04_e.htm).
98

Appendix I: List of main tuna producers, importers and exporters
99

Appendix II: Latest import regulations affecting tuna products
126

GLOBEFISH MARKET RESEARCH PROGRAMME
This activity is part of the services provided by the Fish Marketing and Utilization Service (FIIU) of the Fisheries Department of the Food and Agriculture Organization of the United Nations.
Issued
Language
US$1
No. of copies
Vol.63 The World Market for Herring (96p.) ........................................................................... Mar 2000 Eng 30 ── Vol.64 World Trade in Mackerel and Horse Mackerel (98p.).........................……….April 2000 Eng 30 ── Vol.65 Effect of World Trade Organization’s Regulation on World Fish Trade (87p.)…..Mar 2000 Eng 30 ── Vol.66 European Union Standards for Fishery Products (including EU duties) (248p.)…..June 2000 Eng 30 ── Vol.67 The Ornamental Fish Market 91p.)...........................................................Oct 2000 Eng 30 ── Vol.68 The World Market for Frog Legs (44p.).............................................................…… ..June 2001 Eng 30 ── Vol.69 Fishery Industry Profile – Thailand (76p.) ................................................................... Nov 2001 Eng 30 ── Vol.70 The Fishery Industry in Greece (59p.) .......................................................................... Nov 2001 Eng 30 ── Vol.71 The German Market for Fish and Seafood (116p.)........................................................ Jan 2002 Eng 30 ── Vol.72 Fish Roe in Europe: Supply and Demand Conditions (47p.) .................................... …Nov 2002 Eng 30 ── Vol.73 Salmon – A Study of Global Supply and Demand (151p.).……………………….. …. July 2003 Eng 30 ── Vol. 74 World Tuna markets (135p.).................................................................May 20004 Eng 30 ──
1) Prices include air mail delivery
……………………………………………………………………………………………………………………………………………………. ORDER FORM COPIES ARE AVAILABLE FROM: FAO GLOBEFISH - Fish Utilization and Marketing Service, Fishery Industries Division Viale delle Terme di Caracalla, 00100 Rome, Italy Tel.: (39-06)570 56313 - Fax: (39-06) 570 55188 - E-mail: [email protected] – http//:www.globefish.org 20% DISCOUNT IS OFFERED ON ORDERS FOR MORE THAN TWO COPIES I should like to order _____ copy(ies) of those volume number(s) as indicated above for a total of US$ _____
By bank cheque/draft in US$__________ payable to GLOBEFISH (see address above)
By credit card: Card No.: ____________________________________ Diners/Visa Euro/Master Card American Express Expiry date: __________________________________ Signature: ____________________________
Bank transfer to: FAO/UN Trust Fund US$ Account 490650/67/72 with the IntesaBCI, FAO Branch (Swift Code BCIT IT MM 700), ABI: 03069, CAB: 03356; IBAN IT24N03693356004906507681; Viale delle Terme di Caracalla – 00100 Rome, making reference to FAO Account Code TFAA970089102 (GLOBEFISH) for US$_________________ Name: ______________________________________ Company: _______________________________________
Street Address: _________________________________________________________________________________________
City and Postcode: ______________________________ Country: ________________________________________
Tel:_____________________Fax: _________________ E-mail: _________________________________________

GLOBEFISH RESEARCH PROGRAMME
Food and Agriculture Organization of the United NationsFishery Industries Division
Viale delle Terme di Caracalla00100 Rome, Italy
Tel.: +39 06 5705 5074Fax: +39 06 5705 5188
www.globefish.org
Seafood Price Indices
Volume 78


![GUIDELINES ON ECO-LABELING FOR THE CANNED TUNA …map.seafdec.org/downloads/pdf/EcoLabel_full.pdf · GUIDELINES ON ECO-LABELING FOR THE CANNED TUNA INDUSTRY] SEAFDEC/TD 3 -To investigate](https://img.pdfslide.us/doc/110x75/5f10d3e07e708231d44b026d/guidelines-on-eco-labeling-for-the-canned-tuna-map-guidelines-on-eco-labeling-for.jpg)