Embed Size (px)
DESCRIPTION
World Trends in Population. Trends you know?. China and India Developed vs. Developing Europe Africa Other??. Population Density. A measure of how compact or concentrated a population is. It takes area of land into account as well as population. - PowerPoint PPT Presentation
Citation preview

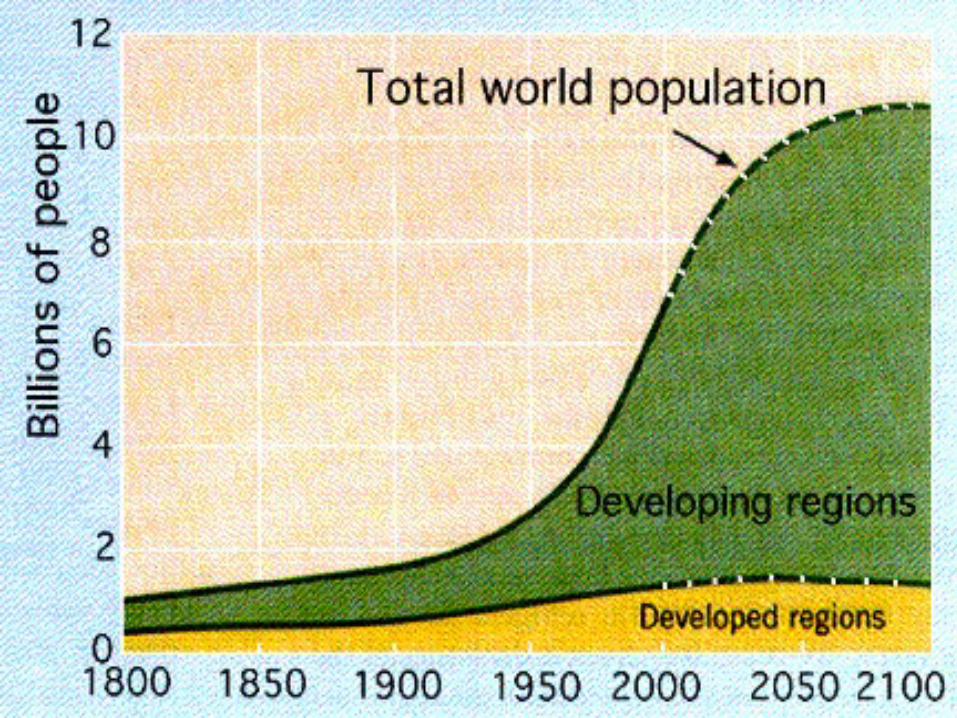
World Trends in PopulationWorld Trends in Population
Trends you know?Trends you know?
China and IndiaChina and IndiaDeveloped vs. DevelopingDeveloped vs. DevelopingEuropeEuropeAfricaAfricaOther??Other??
Population DensityPopulation Density
A measure of how compact or A measure of how compact or concentrated a population is. It takes area concentrated a population is. It takes area of land into account as well as population. of land into account as well as population.
For example Canada as a whole has a much larger For example Canada as a whole has a much larger population than Winnipeg alone. However Canada is population than Winnipeg alone. However Canada is spread out over a much larger area than is Winnipeg. spread out over a much larger area than is Winnipeg. Therefore, Winnipeg would have a higher population Therefore, Winnipeg would have a higher population
density than Canadadensity than Canada

DensityDensity
Check out this website….Check out this website….http://www.pbs.org/wgbh/nova/worldbalan
ce/eart-flash.html
How to find density…How to find density…
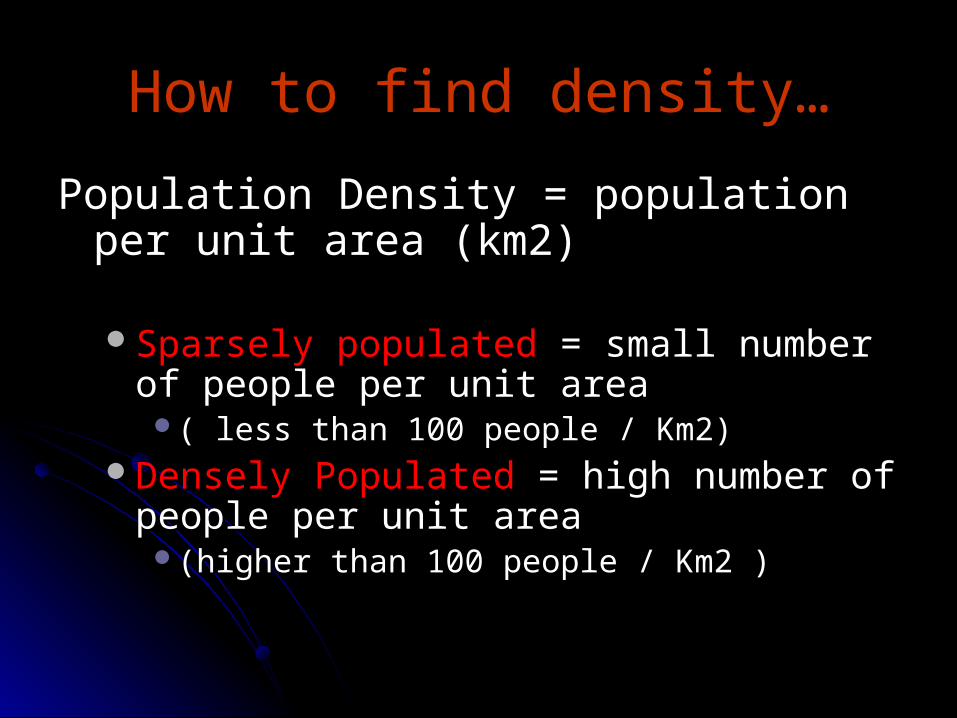
Population Density = population per unit Population Density = population per unit area (km2)area (km2)
Sparsely populated Sparsely populated = small number of people = small number of people per unit area per unit area ( less than 100 people / Km2) ( less than 100 people / Km2)
Densely Populated Densely Populated = high number of people = high number of people per unit area per unit area (higher than 100 people / Km2 ) (higher than 100 people / Km2 )

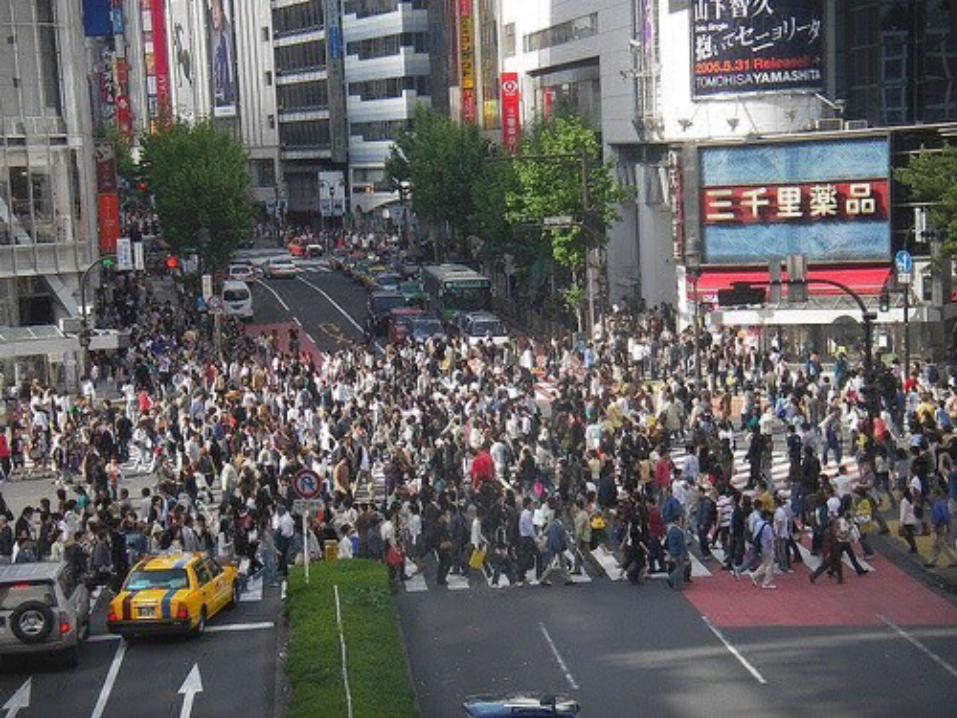
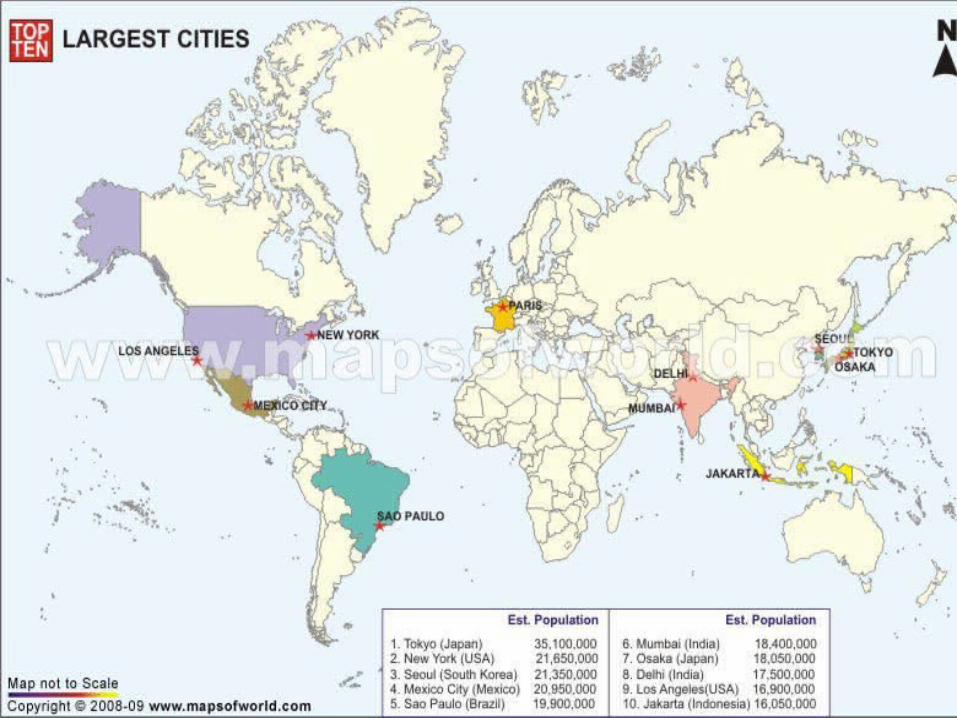
World’s Densest CitiesWorld’s Densest Cities
Some busy places.....
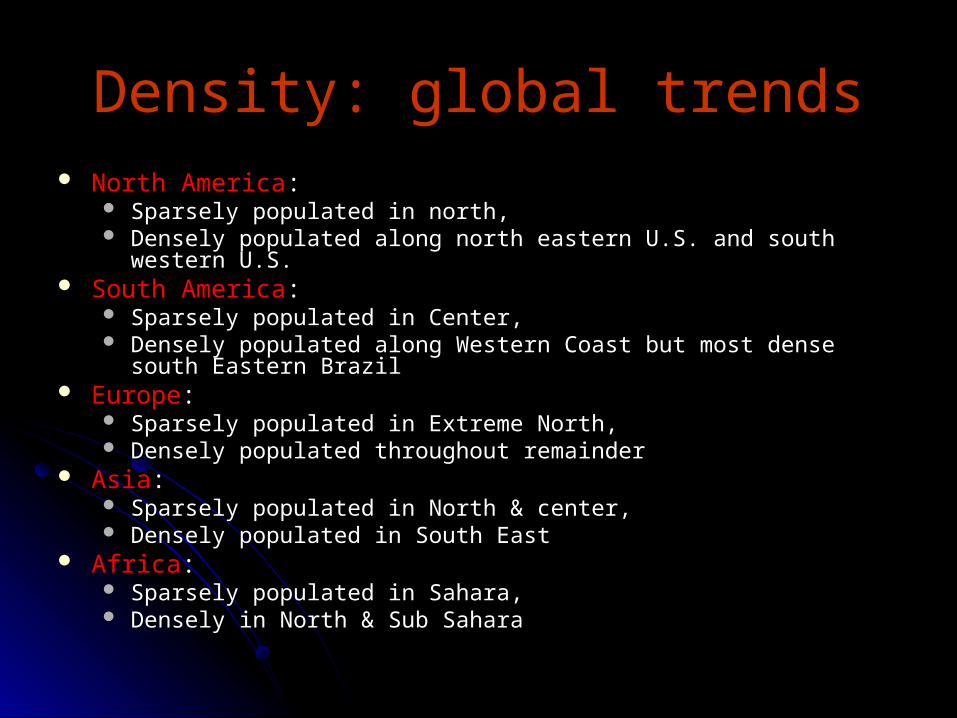
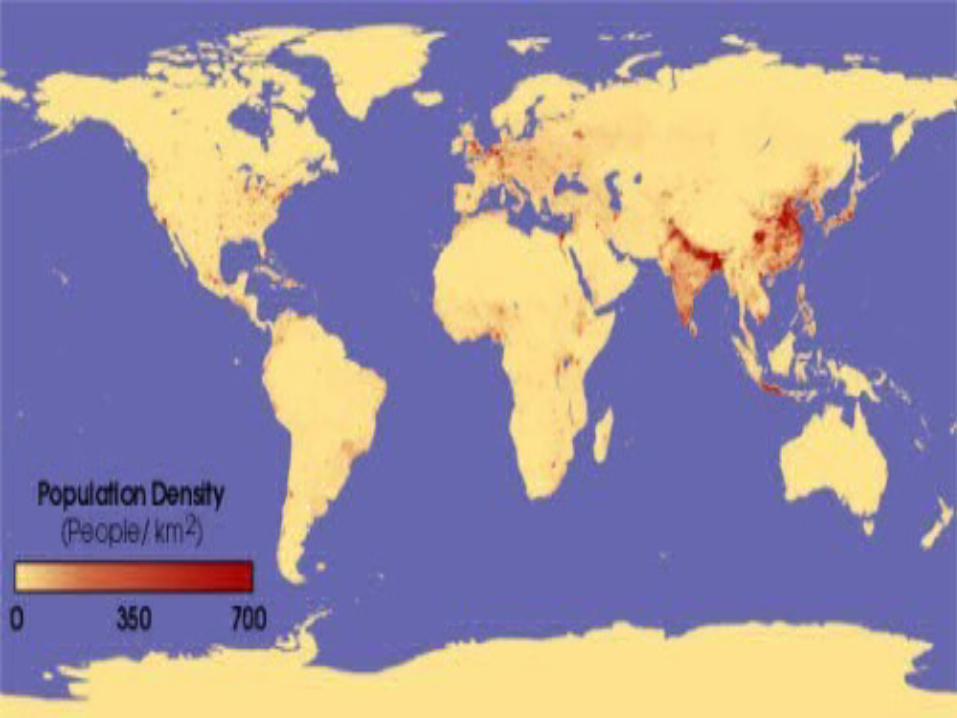
Density: global trendsDensity: global trends North AmericaNorth America: :
Sparsely populated in north, Sparsely populated in north, Densely populated along north eastern U.S. and south western U.S. Densely populated along north eastern U.S. and south western U.S.
South AmericaSouth America: : Sparsely populated in Center, Sparsely populated in Center, Densely populated along Western Coast but most dense south Eastern Densely populated along Western Coast but most dense south Eastern
Brazil Brazil EuropeEurope: :
Sparsely populated in Extreme North, Sparsely populated in Extreme North, Densely populated throughout remainder Densely populated throughout remainder
AsiaAsia: : Sparsely populated in North & center, Sparsely populated in North & center, Densely populated in South East Densely populated in South East
AfricaAfrica: : Sparsely populated in Sahara, Sparsely populated in Sahara, Densely in North & Sub Sahara Densely in North & Sub Sahara
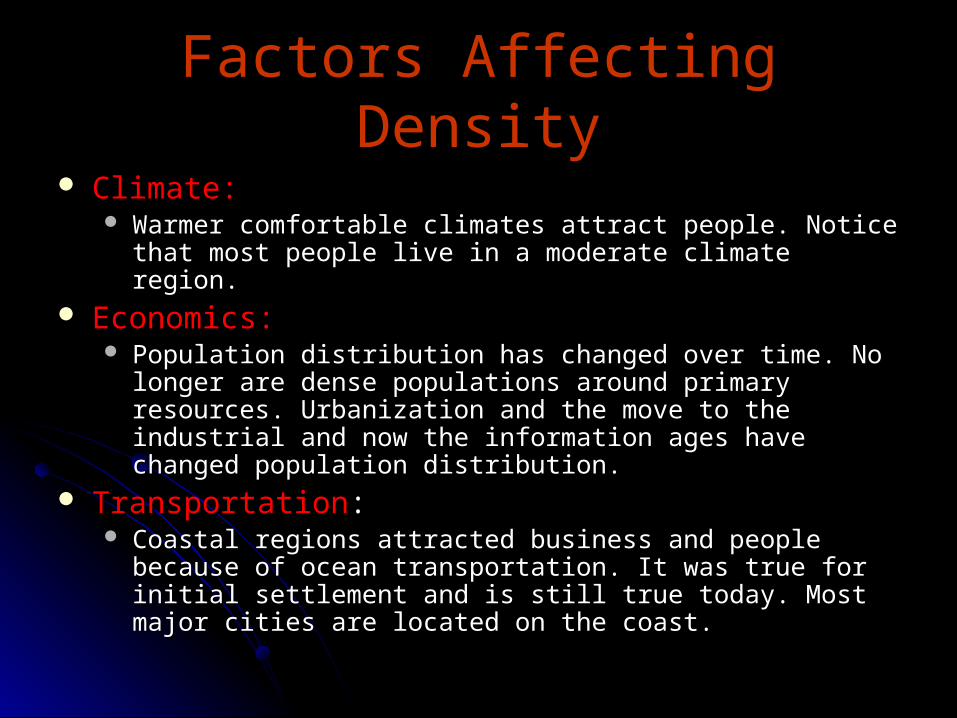
Factors Affecting DensityFactors Affecting Density Climate:Climate:
Warmer comfortable climates attract people. Notice that most Warmer comfortable climates attract people. Notice that most people live in a moderate climate region. people live in a moderate climate region.
Economics: Economics: Population distribution has changed over time. No longer are Population distribution has changed over time. No longer are
dense populations around primary resources. Urbanization and dense populations around primary resources. Urbanization and the move to the industrial and now the information ages have the move to the industrial and now the information ages have changed population distribution. changed population distribution.
TransportationTransportation: : Coastal regions attracted business and people because of Coastal regions attracted business and people because of
ocean transportation. It was true for initial settlement and is still ocean transportation. It was true for initial settlement and is still true today. Most major cities are located on the coast. true today. Most major cities are located on the coast.
Annual Growth Rate (AGR)Annual Growth Rate (AGR)
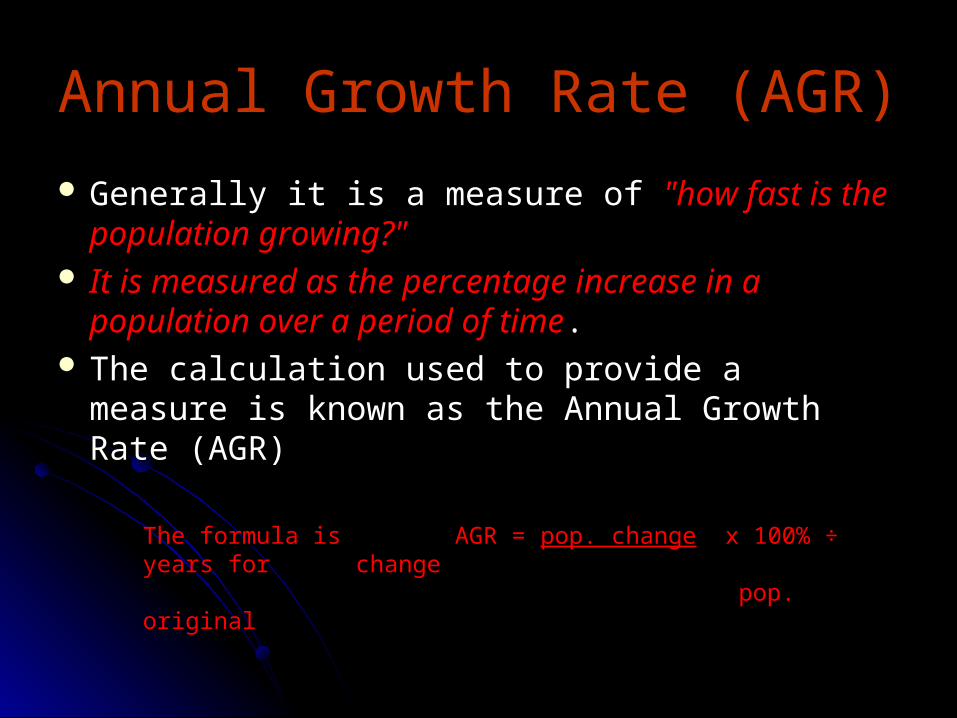
Generally it is a measure of Generally it is a measure of "how fast is the "how fast is the population growing?" population growing?"
It is measured as the percentage increase in a It is measured as the percentage increase in a population over a period of timepopulation over a period of time. .
The calculation used to provide a measure is The calculation used to provide a measure is known as the Annual Growth Rate (AGR) known as the Annual Growth Rate (AGR)
The formula is AGR = The formula is AGR = pop. changepop. change x 100% ÷ years for x 100% ÷ years for
changechange pop. original pop. original
Sample calculation of AGRSample calculation of AGR
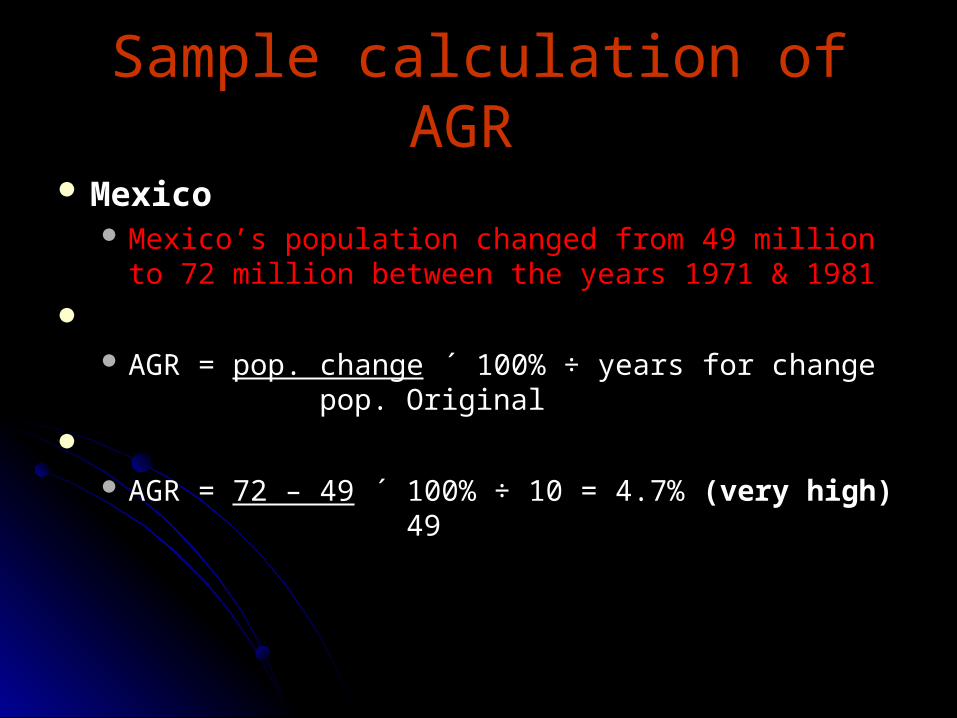
MexicoMexico Mexico’s population changed from 49 million to 72 Mexico’s population changed from 49 million to 72
million between the years 1971 & 1981 million between the years 1971 & 1981
AGR = AGR = pop. changepop. change ´ 100% ÷ years for change ´ 100% ÷ years for change
pop. Original pop. Original
AGR = AGR = 72 – 4972 – 49 ´ 100% ÷ 10 = 4.7% ´ 100% ÷ 10 = 4.7% (very high)(very high)
49 49
Another…Another…
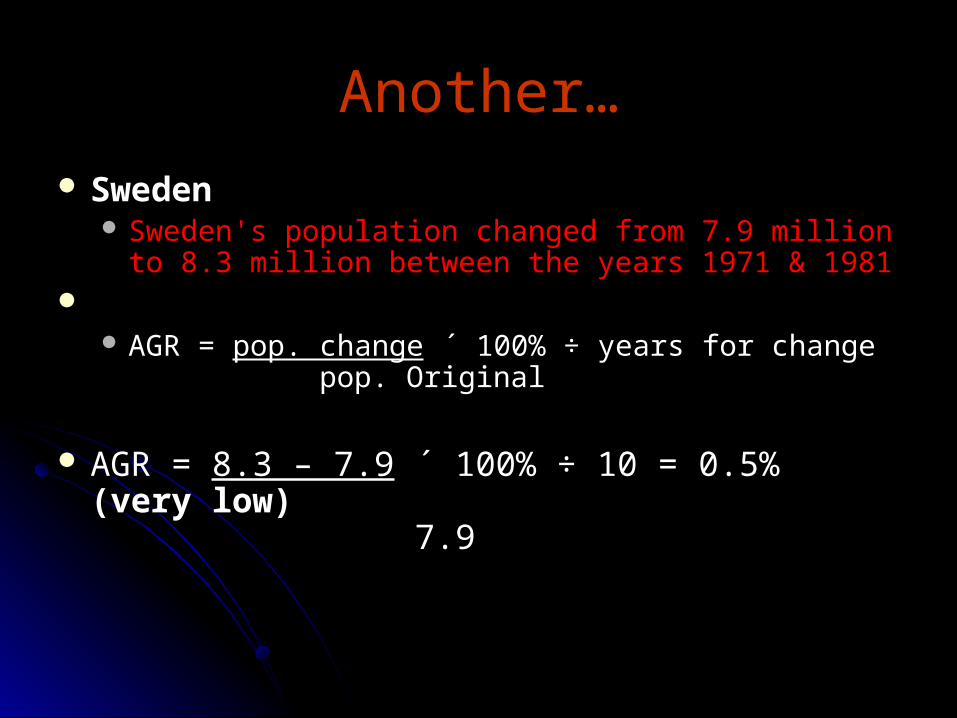
SwedenSweden Sweden's population changed from 7.9 million to 8.3 Sweden's population changed from 7.9 million to 8.3
million between the years 1971 & 1981 million between the years 1971 & 1981
AGR = AGR = pop. changepop. change ´ 100% ÷ years for change ´ 100% ÷ years for change pop. Original pop. Original
AGR = AGR = 8.3 – 7.98.3 – 7.9 ´ 100% ÷ 10 = 0.5% ´ 100% ÷ 10 = 0.5% (very low)(very low) 7.9 7.9
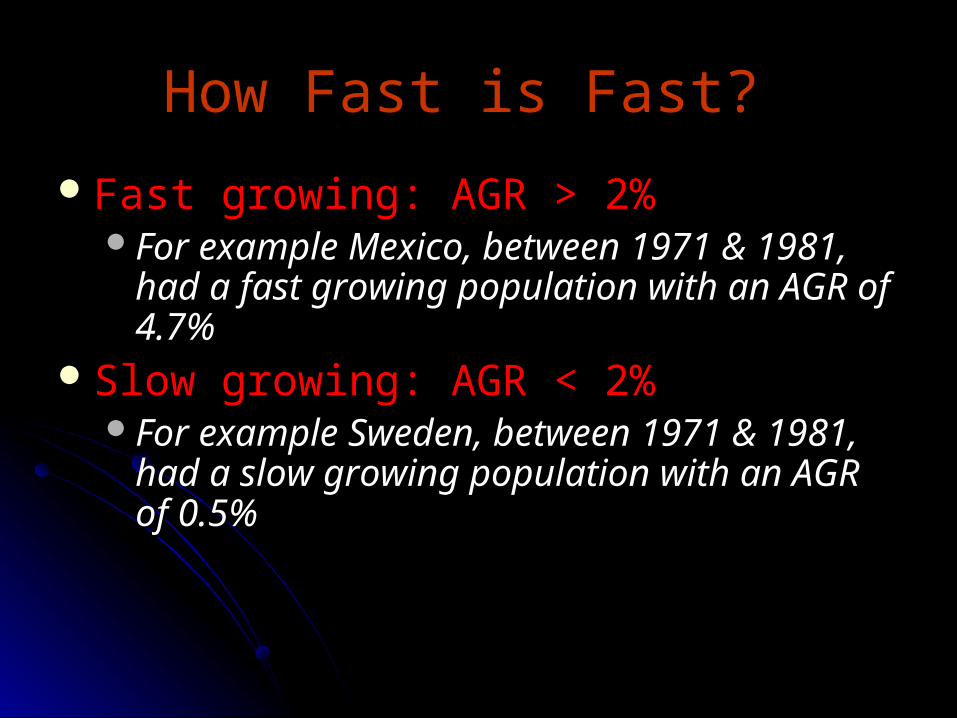
How Fast is Fast?How Fast is Fast?
Fast growing: AGR > 2% Fast growing: AGR > 2% For example Mexico, between 1971 & 1981, For example Mexico, between 1971 & 1981,
had a fast growing population with an AGR of had a fast growing population with an AGR of 4.7% 4.7%
Slow growing: AGR < 2% Slow growing: AGR < 2% For example Sweden, between 1971 & 1981, For example Sweden, between 1971 & 1981,
had a slow growing population with an AGR of had a slow growing population with an AGR of 0.5% 0.5%

What Is Canada’s AGR?What Is Canada’s AGR?
Canada’s population was 30.7 million in Canada’s population was 30.7 million in 2000, and it is now 34.8 million in 2012.2000, and it is now 34.8 million in 2012.
What is our AGR over the past 12 years?What is our AGR over the past 12 years?
AGR: AGR:

MB’s AGRMB’s AGR
Manitoba grew in population from 1.15 Manitoba grew in population from 1.15 million in 2000, to 1.26 million in 2012. million in 2000, to 1.26 million in 2012.
What is our AGR?What is our AGR?

Trends in population growth Trends in population growth rates rates
Most countries population growth rates are Most countries population growth rates are declining. declining. Especially developed nationsEspecially developed nations. .
This trend towards lower growth rates should not be This trend towards lower growth rates should not be confused with decreasing populations. The world’s confused with decreasing populations. The world’s population is still growing at a phenomenal rate. population is still growing at a phenomenal rate.
Note: Developed nations have lower AGRs. Note: Developed nations have lower AGRs. Why? Why?

Economic Conditions that Affect Economic Conditions that Affect Country’s AGRCountry’s AGR
Better economic conditions affect a Better economic conditions affect a number of things that have allowed number of things that have allowed developed nations to stabilize their developed nations to stabilize their populations. populations. Some of the amenities that Some of the amenities that developed nations enjoy that promote developed nations enjoy that promote population control includepopulation control include::

1. Education of Masses1. Education of Masses
What does school teach you?What does school teach you?Where else can you become educated?Where else can you become educated?What is the point of school?What is the point of school? If you are educated, what things can you If you are educated, what things can you
do now?do now?Beyond subjects, what else does school Beyond subjects, what else does school
teach you?teach you?

1. Education rate of the masses:1. Education rate of the masses:
o educated people are more aware of birth educated people are more aware of birth control and statistics show that increased control and statistics show that increased education is correlated with decreased education is correlated with decreased number of children. number of children.
2. Education of Females2. Education of Females
Why specifically this gender?Why specifically this gender?What can women do with this? What can women do with this? What will they most likely not do with this?What will they most likely not do with this?How can this be a solution to How can this be a solution to
overpopulation?overpopulation?Where does this need to happen and Where does this need to happen and
why?why?How can this happen?How can this happen?
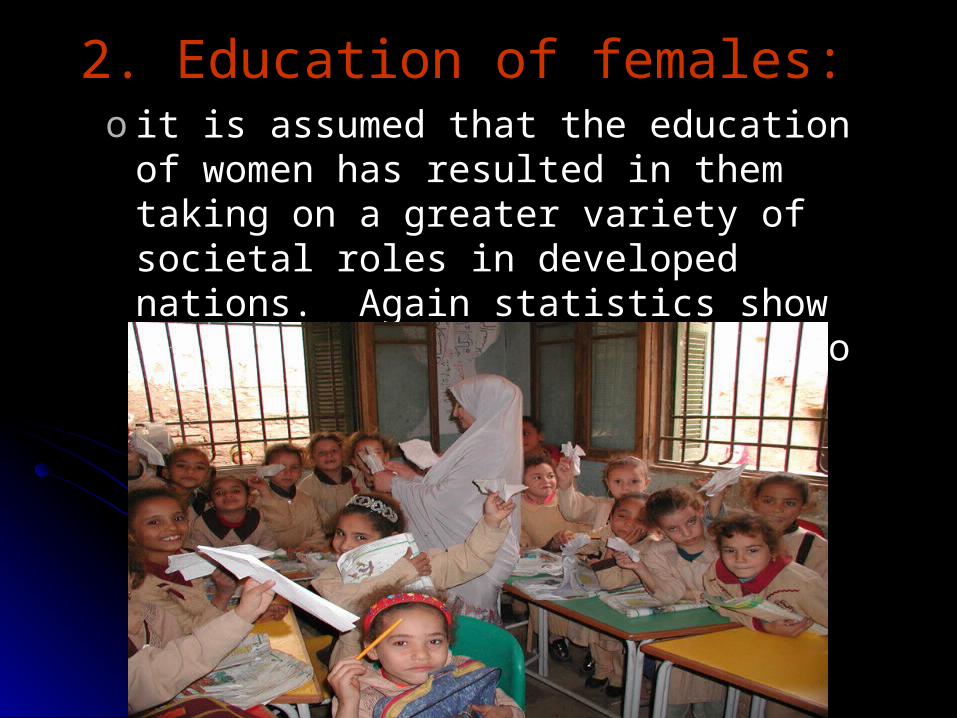
2. 2. Education of females:Education of females: o it is assumed that the education of women it is assumed that the education of women
has resulted in them taking on a greater has resulted in them taking on a greater variety of societal roles in developed nations. variety of societal roles in developed nations. Again statistics show that more educated Again statistics show that more educated women tend to have fewer children. women tend to have fewer children.

3. Employment of Females3. Employment of Females
What kind of employment can you have What kind of employment can you have without education? Why?without education? Why?
When do humans usually start their When do humans usually start their careers?careers?
When do humans usually have children?When do humans usually have children?

3. 3. Employment for females:Employment for females: o instances of females working outside the instances of females working outside the
home are more common in developed home are more common in developed nations. This goes hand in hand with nations. This goes hand in hand with increased education. Statistics show that in increased education. Statistics show that in developed nations women are having children developed nations women are having children later in life and are having fewer children as later in life and are having fewer children as they put family on hold to develop a career. they put family on hold to develop a career.
4. Birth Control4. Birth Control
How much does it cost?How much does it cost?Where can people get it?Where can people get it? Is it a priority for people who are starving?Is it a priority for people who are starving?Who is starving?Who is starving?How can WE help?How can WE help?

4. 4. Ability to access birth control:Ability to access birth control:
While a trip to the corner store for birth While a trip to the corner store for birth control is a simple task in a developed control is a simple task in a developed nation, in lesser developed nations the nation, in lesser developed nations the cost is prohibitive. cost is prohibitive. Feeding the family Feeding the family takes precedent over birth control.takes precedent over birth control. Furthermore the availability of a corner Furthermore the availability of a corner store is a problem for some let alone the store is a problem for some let alone the availabilityavailability
5. Rural to Urban5. Rural to Urban
Why are people moving to urban places?Why are people moving to urban places?What does that have to do with What does that have to do with
overpopulation?overpopulation?Where is overpopulation prevalent?Where is overpopulation prevalent? Is there a connection?Is there a connection?

5. 5. Service sector jobs & the move Service sector jobs & the move from agriculture to urbanization:from agriculture to urbanization: o people do not need large families to help on people do not need large families to help on
the farm if they work in the city where the jobs the farm if they work in the city where the jobs are predominantly in manufacturing and in the are predominantly in manufacturing and in the service sector. service sector.

6. Health Care and Services6. Health Care and Services
What kind of services do you receive or What kind of services do you receive or have access to as a Canadian?have access to as a Canadian?
What do most developing nations have What do most developing nations have access to?access to?
What does this have to do with What does this have to do with overpopulation?overpopulation?

6. 6. Health careHealth care
o prenatal and family planning services are prenatal and family planning services are expensive and are predominantly found in expensive and are predominantly found in more developed nationsmore developed nations. We may not . We may not recognize the services we have available to recognize the services we have available to us because we are so accustomed to them. us because we are so accustomed to them. However our government collects millions of However our government collects millions of dollars in taxes that contribute to public health dollars in taxes that contribute to public health nurses, hospitals, family planning clinics, and nurses, hospitals, family planning clinics, and family living courses in grade school. family living courses in grade school.
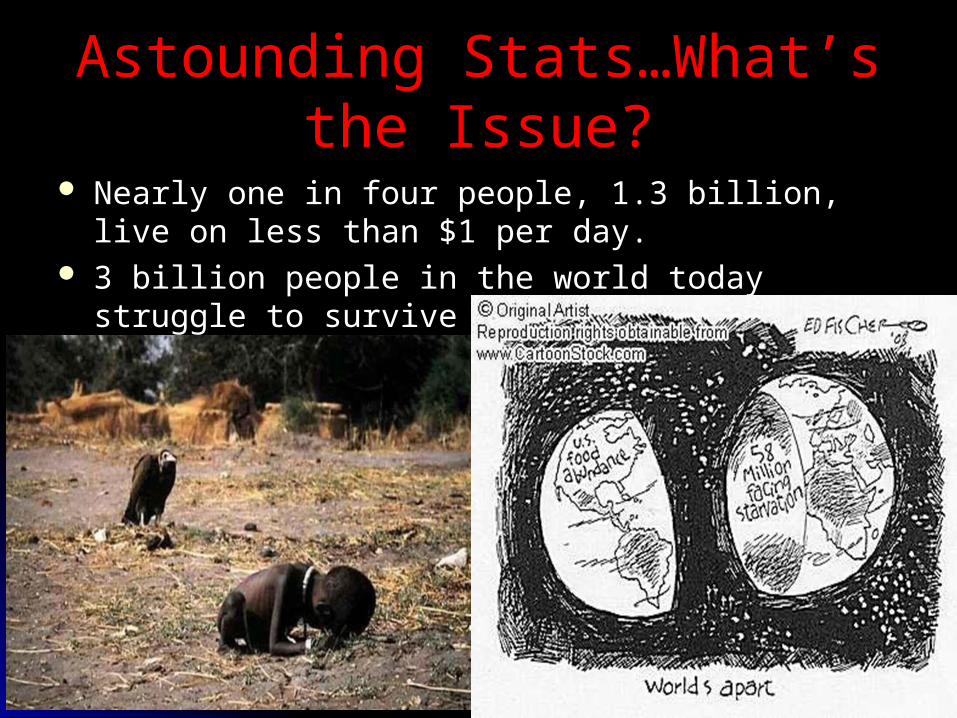
Astounding Stats…What’s the Astounding Stats…What’s the Issue?Issue?
Nearly one in four people, 1.3 billion, live on less than $1 Nearly one in four people, 1.3 billion, live on less than $1 per day.per day.
3 billion people in the world today struggle to survive on 3 billion people in the world today struggle to survive on US$2/dayUS$2/day
Population ControlPopulation Control
In developed nations family planning, pension In developed nations family planning, pension plans, easy access to birth control, education plans, easy access to birth control, education and a changing standard of living have all led to and a changing standard of living have all led to a controlled, stable population. However, in a controlled, stable population. However, in lesser developed nations, education, family lesser developed nations, education, family planning, birth control and pensions are all very planning, birth control and pensions are all very difficult to obtain.difficult to obtain.
What plan (of the 7) would you support to help What plan (of the 7) would you support to help developing nations control their population?developing nations control their population?

11
Legislation by government could make it Legislation by government could make it illegal to have more than a certain illegal to have more than a certain number of babies. number of babies.
Is that humane? How do we ensure the Is that humane? How do we ensure the correct number. What is done with correct number. What is done with children over the limit? children over the limit?

22
Some people have proposed that war and Some people have proposed that war and famine used to be our natural means of birth famine used to be our natural means of birth control. control.
However if we want to have a manageable However if we want to have a manageable plan to control the earth's population surely we plan to control the earth's population surely we cannot let people in famine go unaided or cannot let people in famine go unaided or reduce peacekeeping missions. Clearly this is reduce peacekeeping missions. Clearly this is not an option. not an option.

33
Increasing education of the masses is Increasing education of the masses is correlated with decreased births. correlated with decreased births.
Could we help to provide education in Could we help to provide education in developing nations? Is that humane? developing nations? Is that humane?

44
Pension plans & RRSP's allow us to be Pension plans & RRSP's allow us to be secure into our old age and we do not secure into our old age and we do not have to worry about having children to have to worry about having children to take care of us. take care of us.
Is this something we could promote in Is this something we could promote in under-developed nations? under-developed nations?
55
In some regions of the world the disparity In some regions of the world the disparity between the education received by between the education received by females and males is tremendous. We females and males is tremendous. We know that education of women is know that education of women is correlated with decreased births. correlated with decreased births.
Is the education of women something we Is the education of women something we could promote? could promote?
66
There is little doubt that birth control is There is little doubt that birth control is the biggest factor limiting populations in the biggest factor limiting populations in developed nations. developed nations.
Could we provide less expensive birth Could we provide less expensive birth control for developing nations? control for developing nations?

77
Highly developed economies are Highly developed economies are associated with decreased birth rates. associated with decreased birth rates.
Should we concentrate on supporting Should we concentrate on supporting improvements to their economies as an improvements to their economies as an ultimate route to controlling birth rates? ultimate route to controlling birth rates?

88
Technology has increased and health care Technology has increased and health care has improved. Death rates are decreasing has improved. Death rates are decreasing and people are surviving longer…and people are surviving longer…
Should we stop keeping people alive for so Should we stop keeping people alive for so long? Is that humane? Who decides?long? Is that humane? Who decides?
Natural ChangeNatural Change
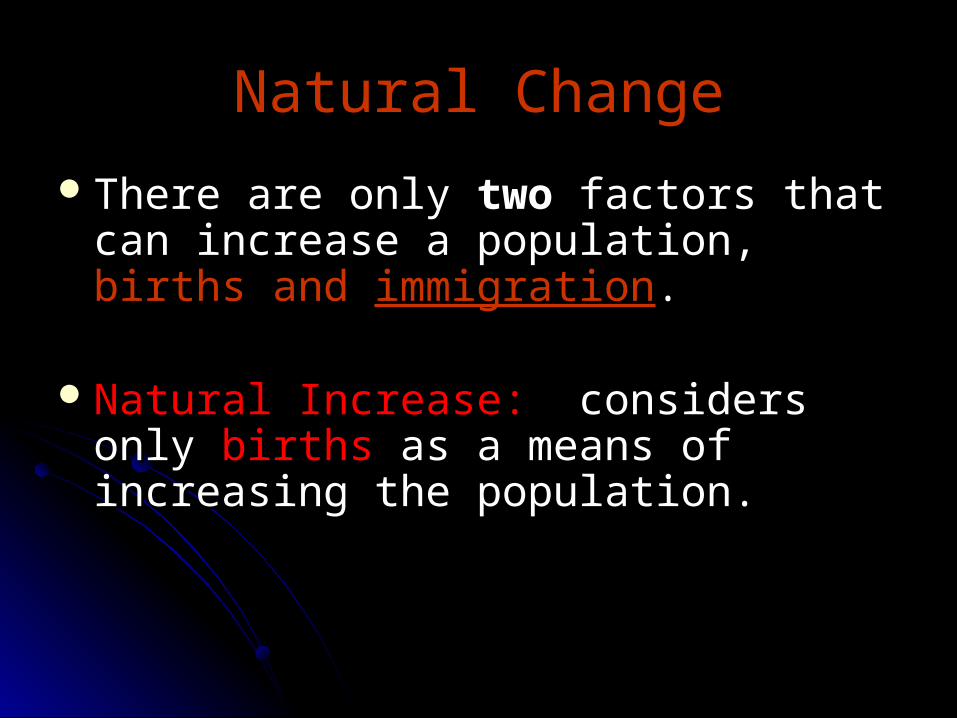
There are only There are only twotwo factors that can factors that can increase a population, increase a population, births and births and immigrationimmigration. .
Natural Increase: Natural Increase: considers only considers only birthsbirths as as a means of increasing the population.a means of increasing the population.
Natural ChangeNatural Change
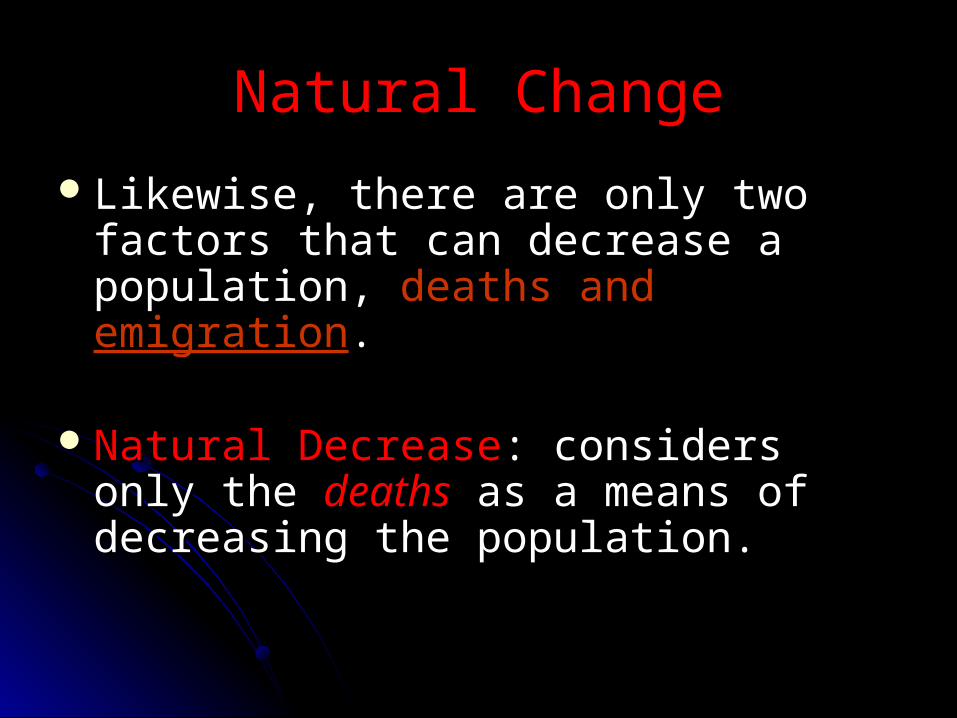
Likewise, there are only two factors that Likewise, there are only two factors that can decrease a population, can decrease a population, deaths and deaths and emigrationemigration. .
Natural DecreaseNatural Decrease: considers only the : considers only the deathsdeaths as a means of decreasing the as a means of decreasing the population.population.
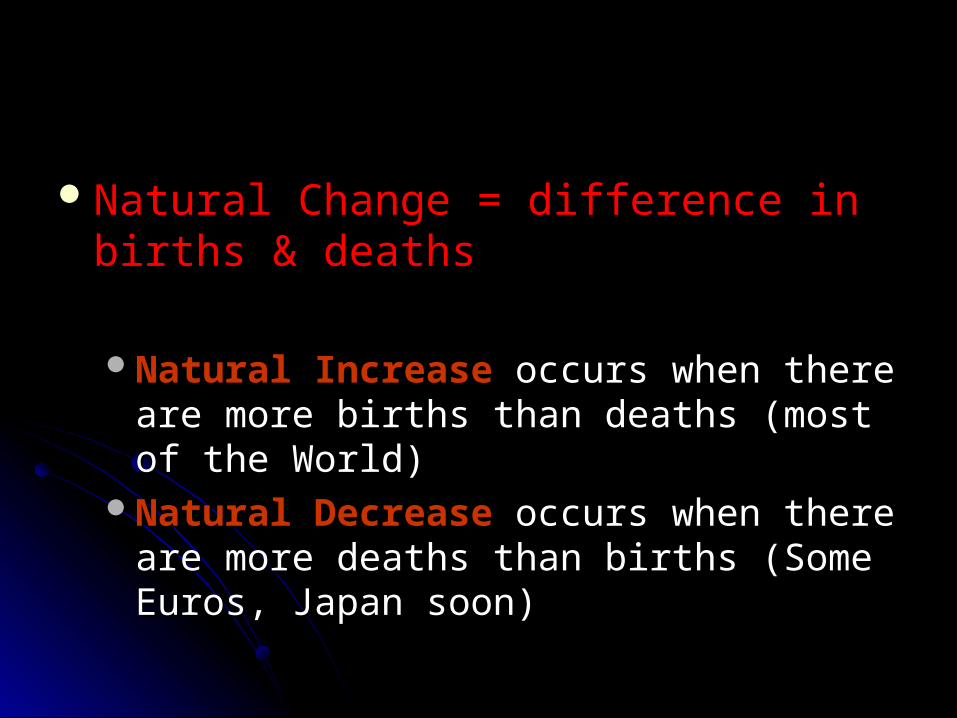
Natural ChangeNatural Change = difference in births & = difference in births & deaths deaths
Natural IncreaseNatural Increase occurs when there are more occurs when there are more births than deaths (most of the World)births than deaths (most of the World)
Natural DecreaseNatural Decrease occurs when there are occurs when there are more deaths than births (Some Euros, Japan more deaths than births (Some Euros, Japan soon)soon)
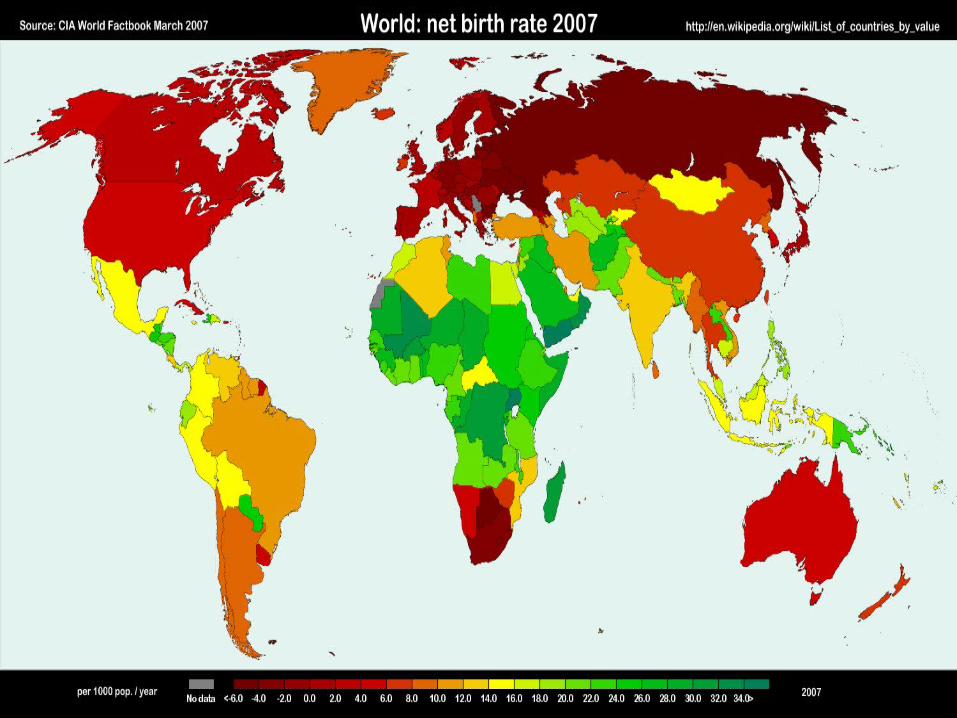
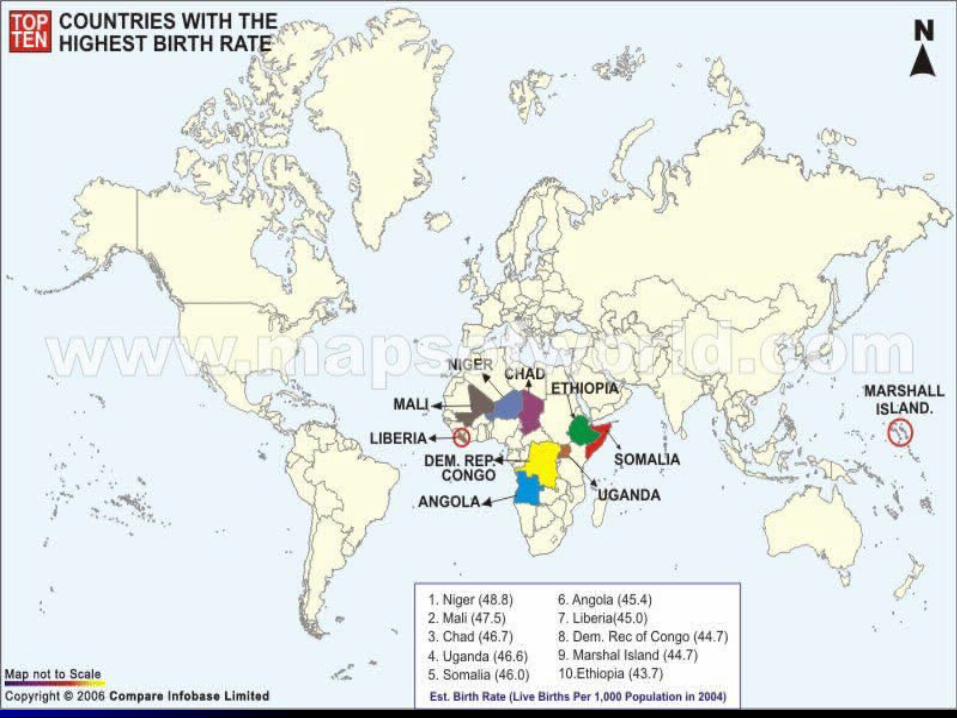
TOP 10 Worst BR’sTOP 10 Worst BR’s
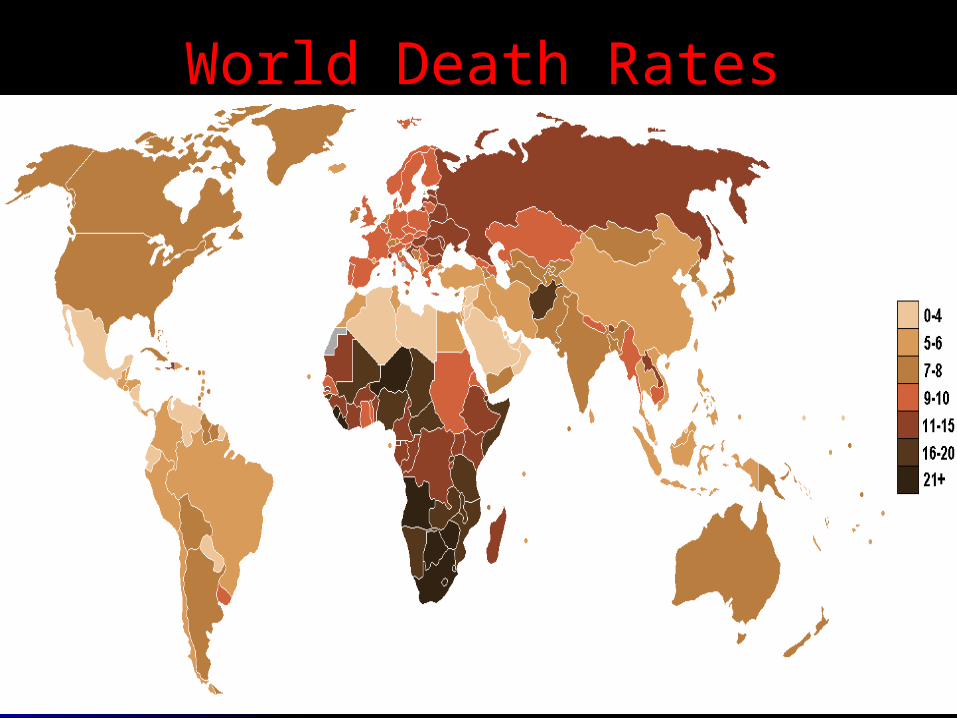
World Death RatesWorld Death Rates
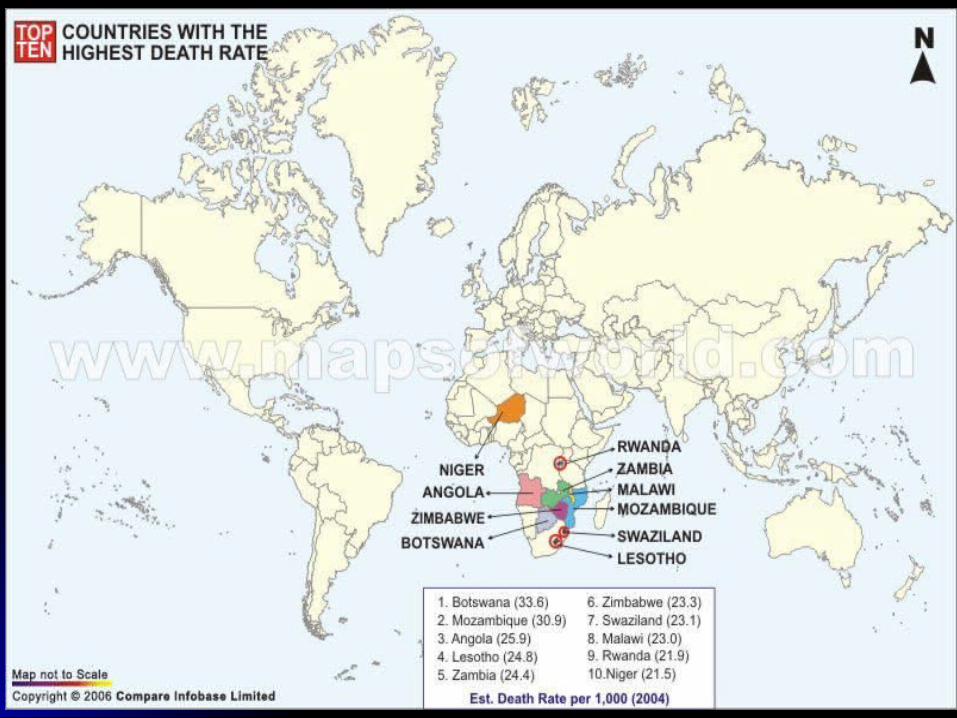
Top 10 Worst DR’sTop 10 Worst DR’s
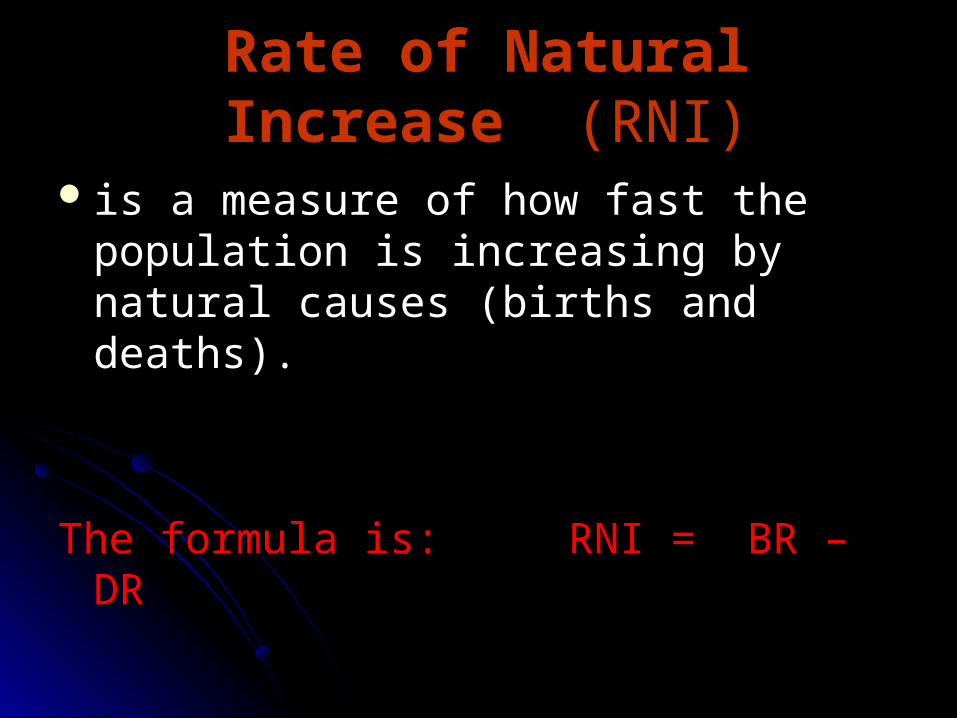
Rate of Natural IncreaseRate of Natural Increase (RNI) (RNI)
is a measure of how fast the population is is a measure of how fast the population is increasing by natural causes (births and increasing by natural causes (births and deaths).deaths).
The formula is: RNI = BR – DR The formula is: RNI = BR – DR
Population Growth Rate & Population Growth Rate & Standard of LivingStandard of Living
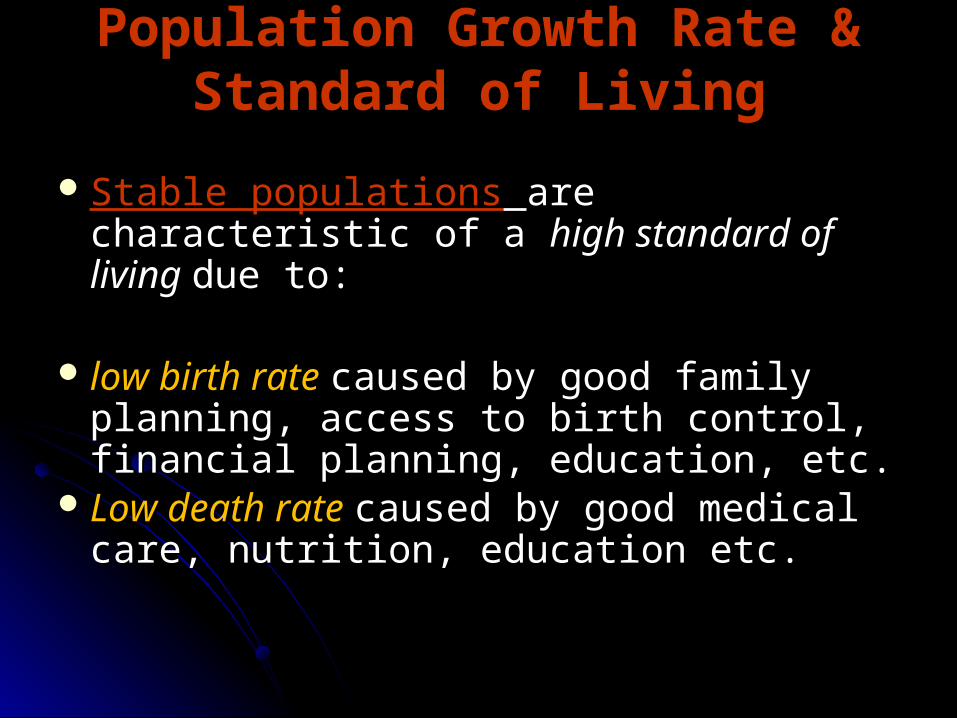
Stable populationsStable populations are characteristic of a are characteristic of a high standard of living high standard of living due to:due to:
low birth rate low birth rate caused by good family caused by good family planning, access to birth control, financial planning, access to birth control, financial planning, education, etc. planning, education, etc.
Low death rate Low death rate caused by good medical caused by good medical care, nutrition, education etc.care, nutrition, education etc.
Population Growth Rate and Population Growth Rate and Standard of LivingStandard of Living
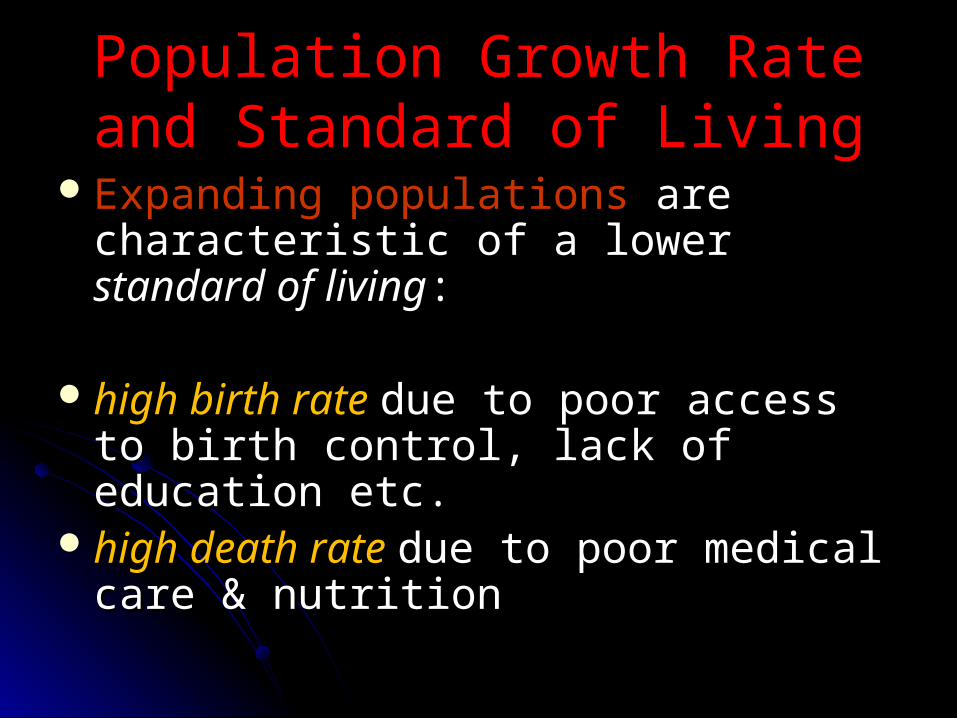
Expanding populationsExpanding populations are characteristic are characteristic of a lower of a lower standard of livingstandard of living::
high birth rate high birth rate due to poor access to birth due to poor access to birth control, lack of education etc.control, lack of education etc.
high death rate high death rate due to poor medical care & due to poor medical care & nutrition nutrition

China vs. IndiaChina vs. India
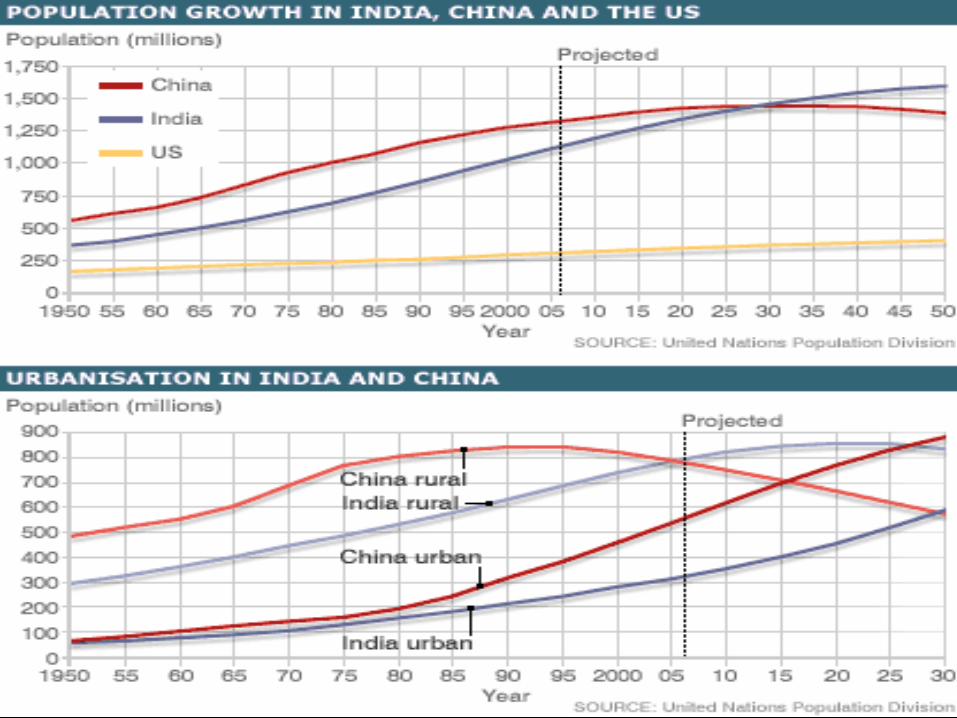
1 in 3 people worldwide lives in either 1 in 3 people worldwide lives in either ChinaChina, (largest communist country), or , (largest communist country), or IndiaIndia, (largest democracy), (largest democracy)
China remains the most populous nation, China remains the most populous nation, with 1.3 billion people, followed by India, with 1.3 billion people, followed by India, which is home to 1.1 billion.which is home to 1.1 billion.

China vs. IndiaChina vs. India
India's higher fertility rate India's higher fertility rate means the gap means the gap is narrowing and the UN expects it to is narrowing and the UN expects it to overtake China before 2030.overtake China before 2030.
BothBoth are experiencing rapid growth in are experiencing rapid growth in urban populationsurban populations..

China vs. IndiaChina vs. India
India and China have to face the challenge India and China have to face the challenge of providing for their ageing populations, of providing for their ageing populations, just as many Western nations do.just as many Western nations do.
As people live longer and fertility As people live longer and fertility decreases, there will be millions more decreases, there will be millions more people in retirement and fewer workers to people in retirement and fewer workers to support them. support them.

China vs. IndiaChina vs. India
It has been suggested that China will have It has been suggested that China will have to ease its strict one child policy to to ease its strict one child policy to overcome the problem.overcome the problem.
In India, where only 10% of the workforce In India, where only 10% of the workforce is covered by formal pension schemes, is covered by formal pension schemes, there are questions over how the elderly there are questions over how the elderly will be supported.will be supported.
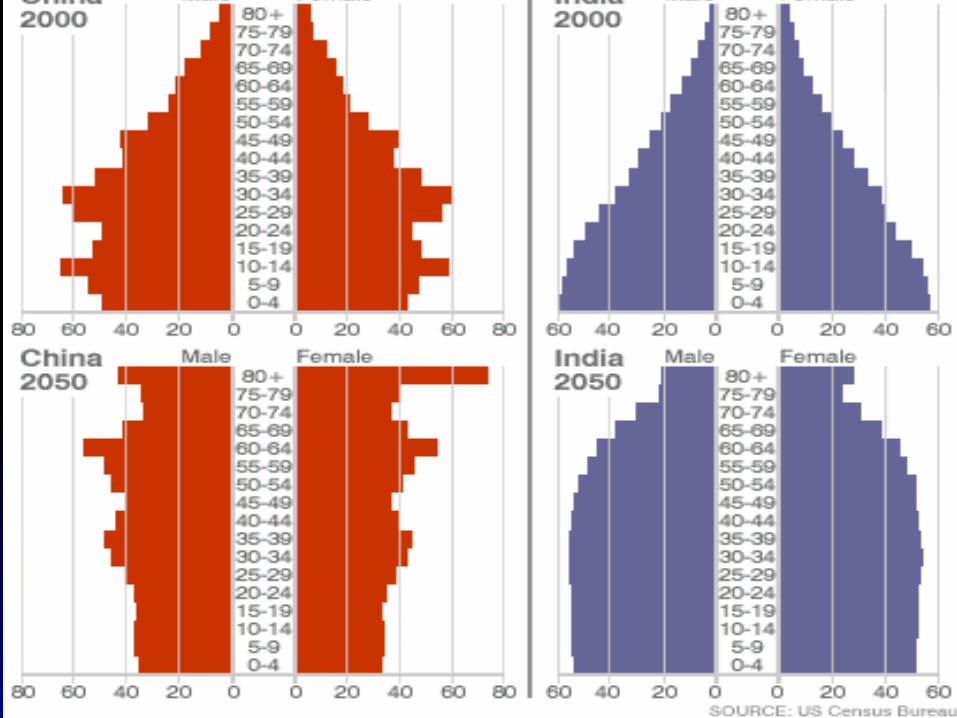
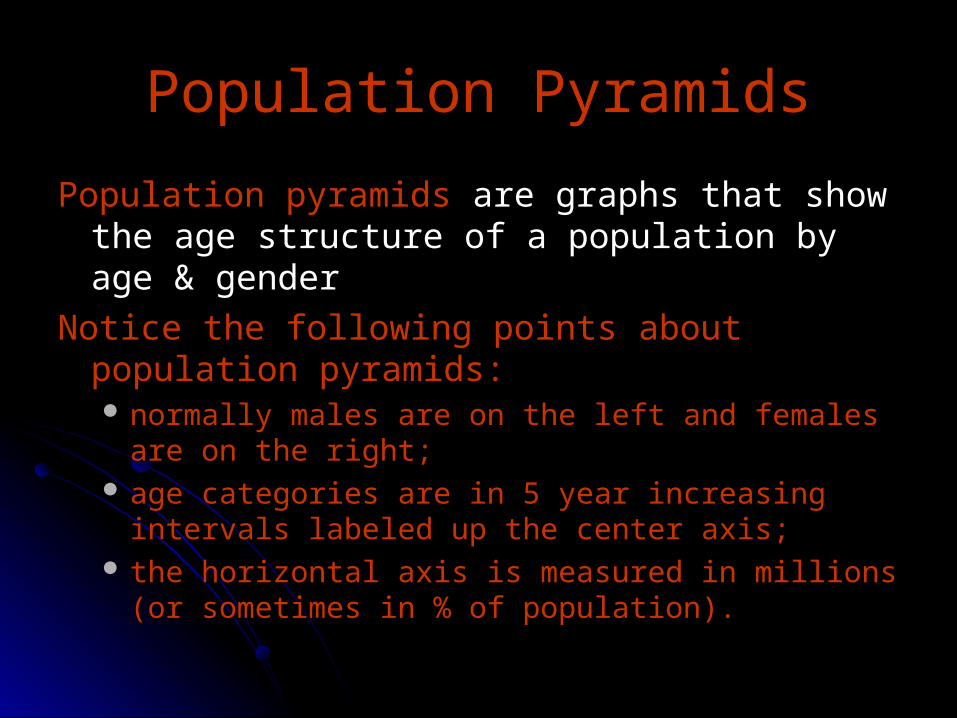
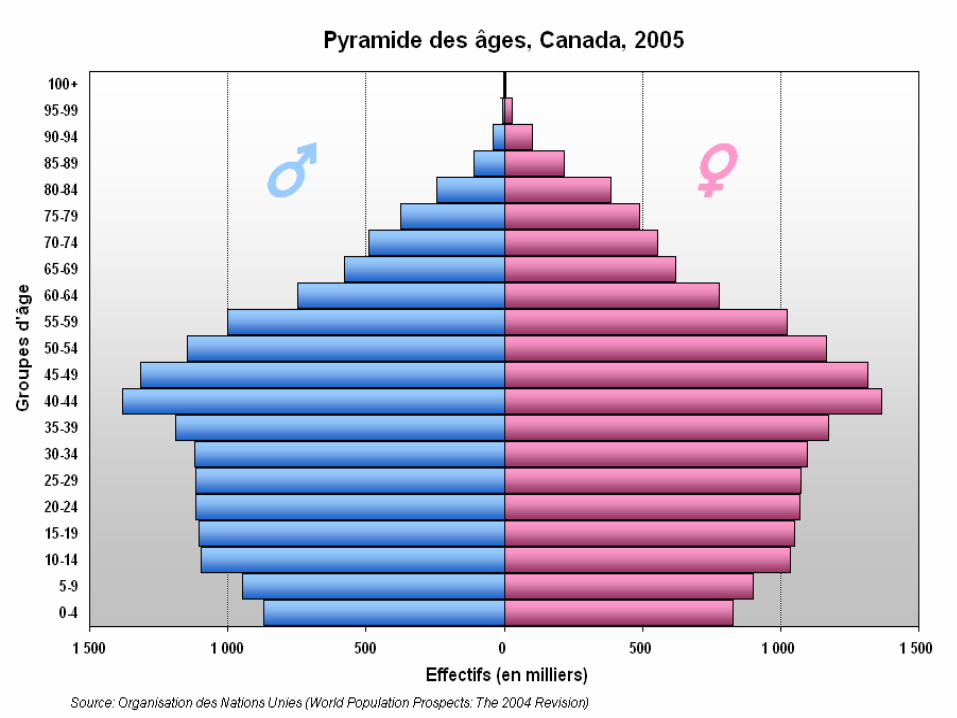
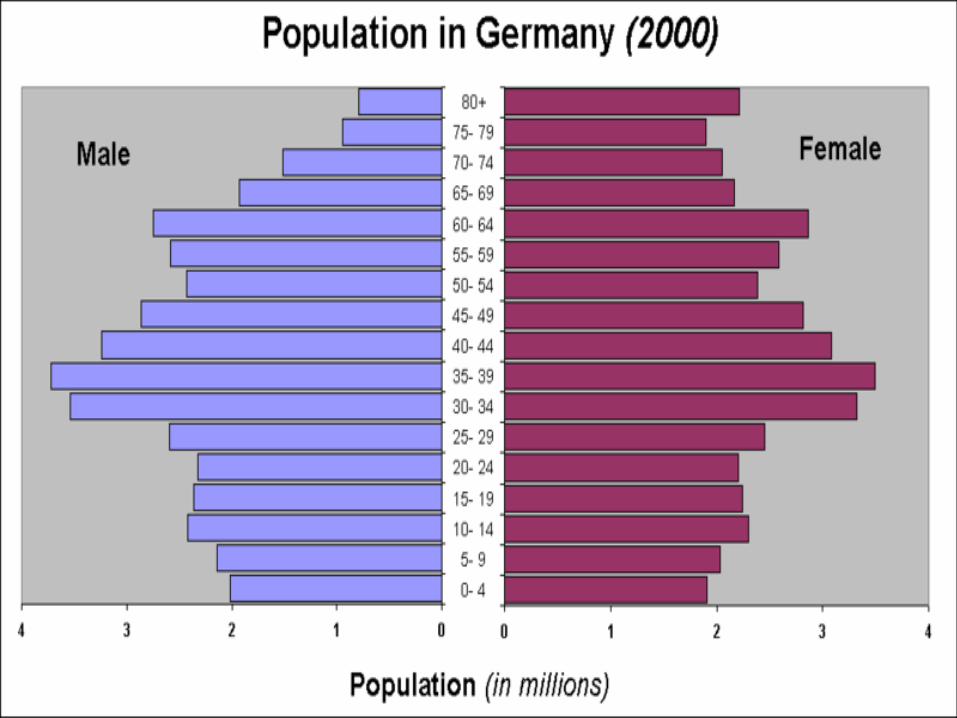
Population PyramidsPopulation Pyramids
Population pyramidsPopulation pyramids are graphs that show the age are graphs that show the age structure of a population by age & genderstructure of a population by age & gender
Notice the following points about population Notice the following points about population pyramids:pyramids: normally males are on the left and females are on the normally males are on the left and females are on the
right;right; age categories are in 5 year increasing intervals age categories are in 5 year increasing intervals
labeled up the center axis;labeled up the center axis; the horizontal axis is measured in millions (or the horizontal axis is measured in millions (or
sometimes in % of population).sometimes in % of population).
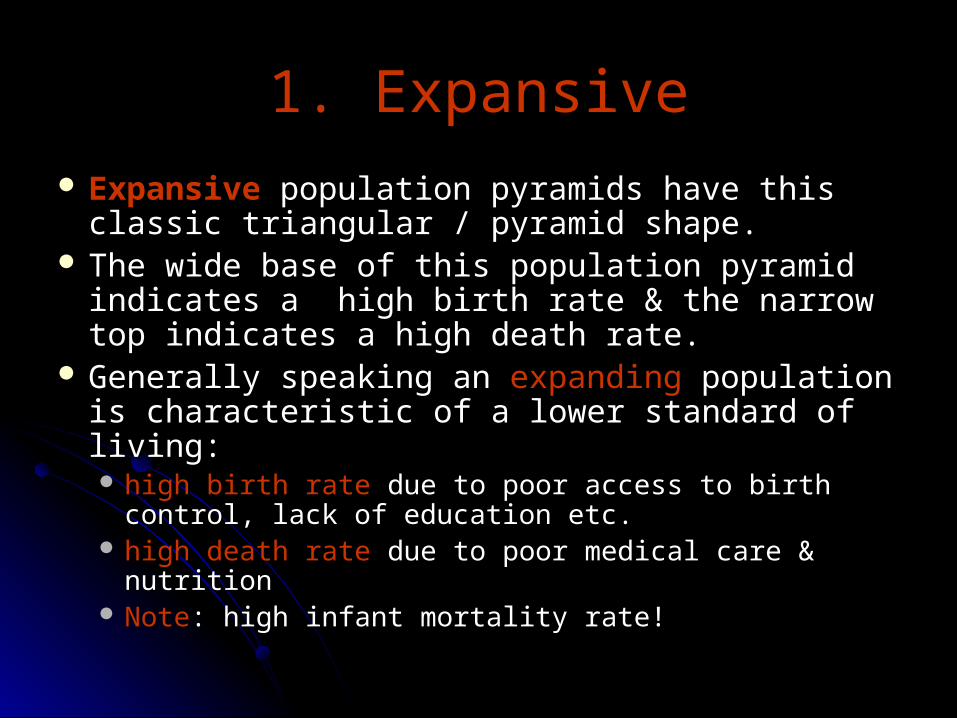
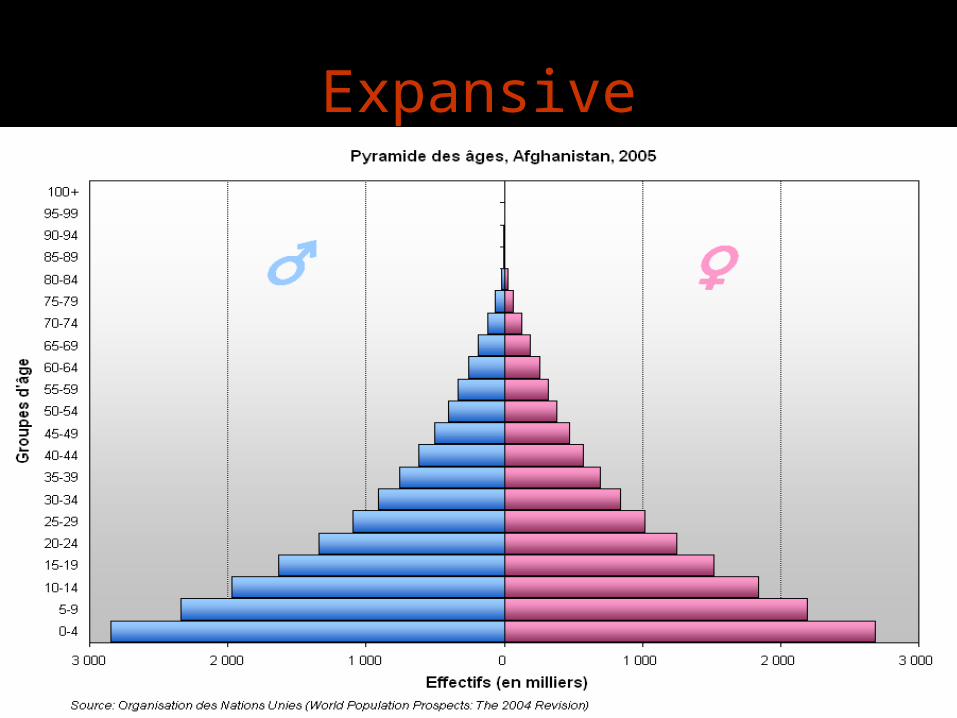
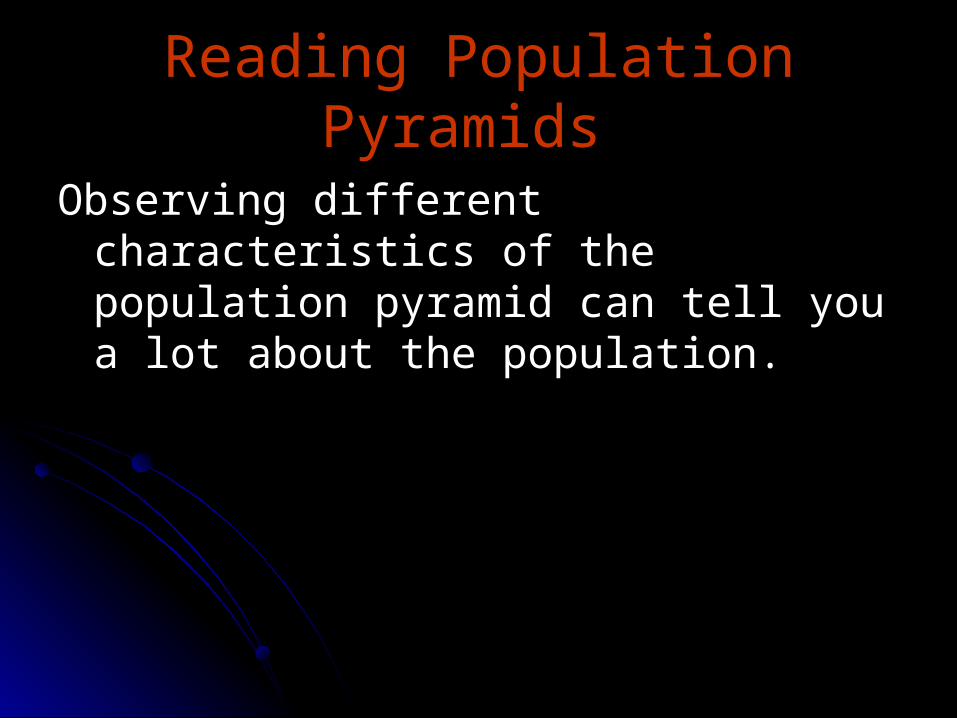
1. Expansive1. Expansive
ExpansiveExpansive population pyramids have this population pyramids have this classic triangular / pyramid shape. classic triangular / pyramid shape.
The wide base of this population pyramid The wide base of this population pyramid indicates a high birth rate & the narrow top indicates a high birth rate & the narrow top indicates a high death rate.indicates a high death rate.
Generally speaking an Generally speaking an expandingexpanding population is population is characteristic of a lower standard of living:characteristic of a lower standard of living: high birth ratehigh birth rate due to poor access to birth control, lack due to poor access to birth control, lack
of education etc.of education etc. high death ratehigh death rate due to poor medical care & nutrition due to poor medical care & nutrition NoteNote: high infant mortality rate! : high infant mortality rate!
ExpansiveExpansive
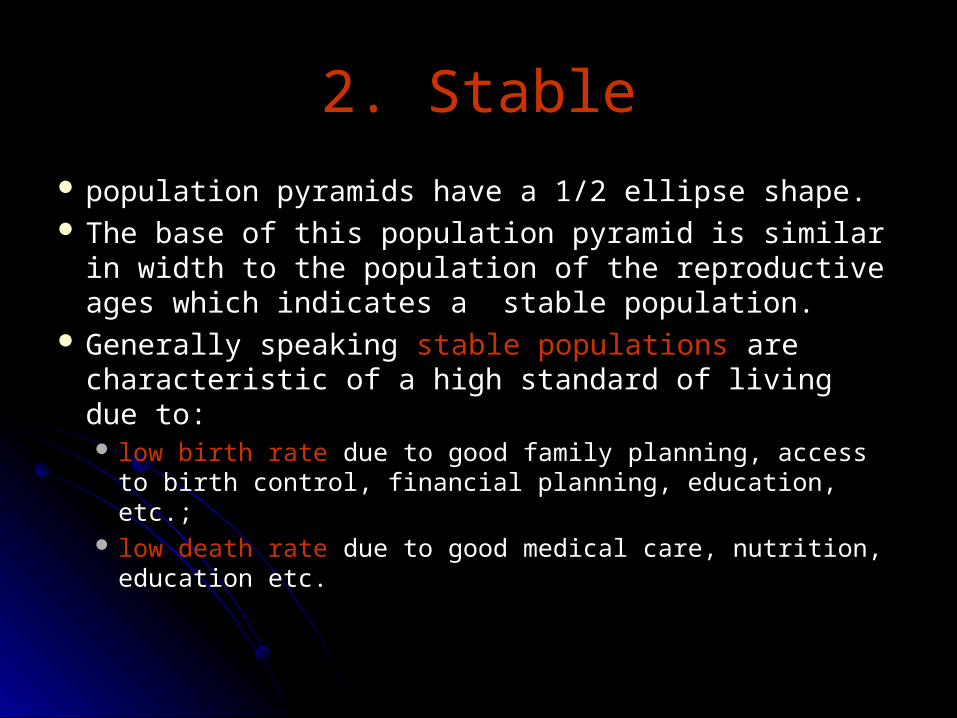
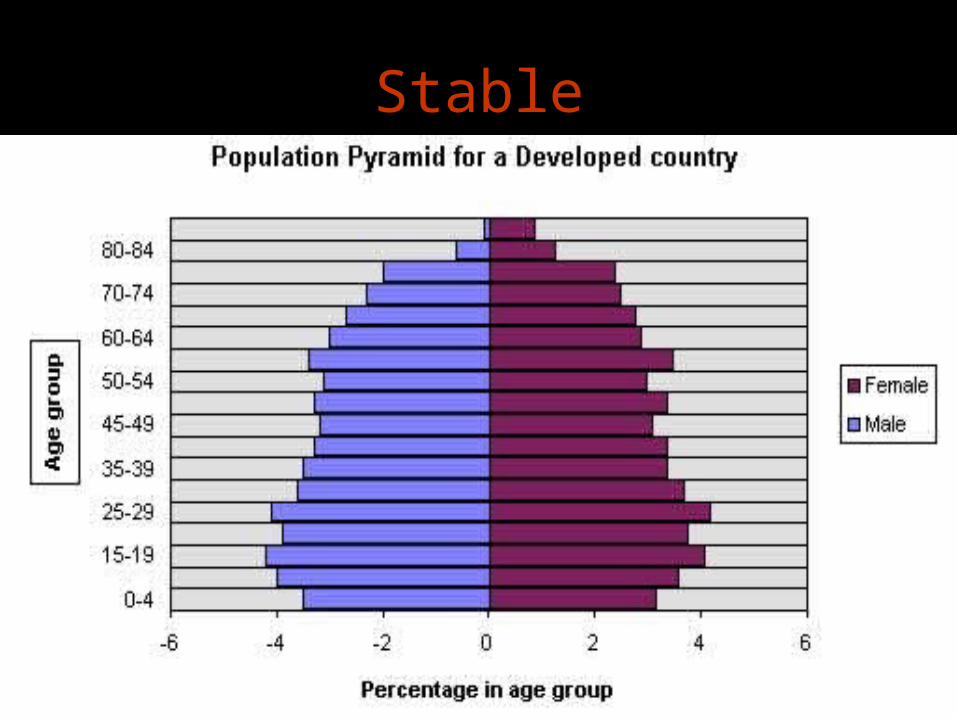
2. Stable2. Stable
population pyramids have a 1/2 ellipse shape. population pyramids have a 1/2 ellipse shape. The base of this population pyramid is similar in The base of this population pyramid is similar in
width to the population of the reproductive ages width to the population of the reproductive ages which indicates a stable population.which indicates a stable population.
Generally speaking Generally speaking stable populationsstable populations are are characteristic of a high standard of living due to:characteristic of a high standard of living due to: low birth ratelow birth rate due to good family planning, access to due to good family planning, access to
birth control, financial planning, education, etc.;birth control, financial planning, education, etc.; low death ratelow death rate due to good medical care, nutrition, due to good medical care, nutrition,
education etc.education etc.
StableStable
3. Contracting3. Contracting
population pyramids have a narrower base population pyramids have a narrower base than the reproductive age population. than the reproductive age population.
This indicates a decreasing population This indicates a decreasing population trend. trend.
The low birth rate is indicative of a well The low birth rate is indicative of a well developed country.developed country.
Reading Population PyramidsReading Population Pyramids
Observing different characteristics of the Observing different characteristics of the population pyramid can tell you a lot about population pyramid can tell you a lot about the population.the population.
Note: width of the baseNote: width of the baseBirth rate varies with the width of the base. Birth rate varies with the width of the base. A wide base indicates a high birth rate and a A wide base indicates a high birth rate and a
narrow base indicates a low birth rate.narrow base indicates a low birth rate.
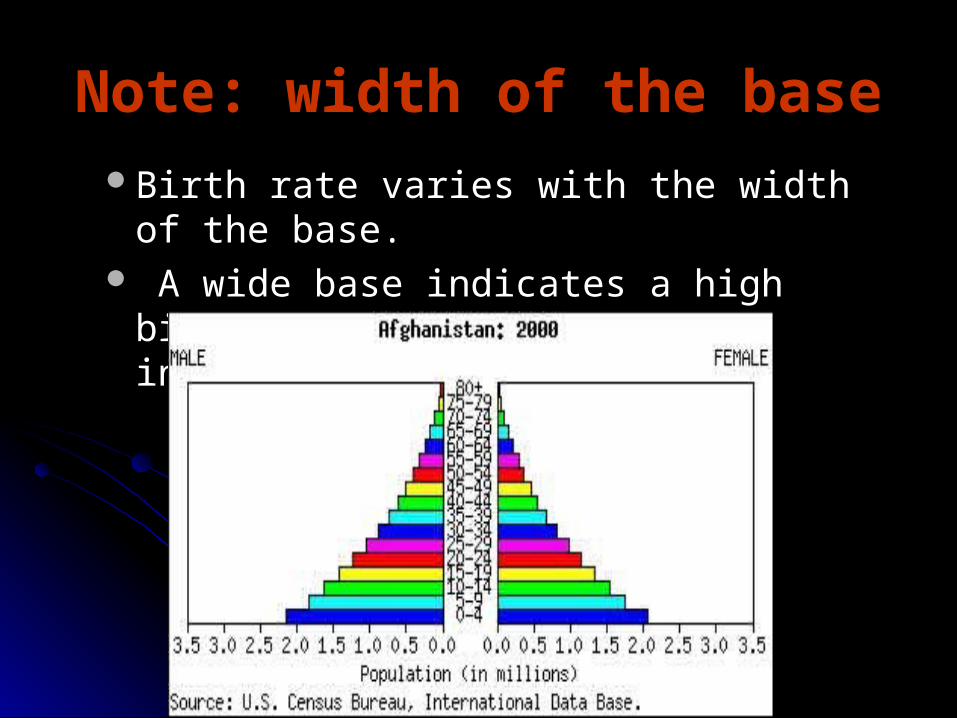
Note: SymmetryNote: Symmetry
SymmetrySymmetry
Statistically speaking pyramids should be Statistically speaking pyramids should be relatively symmetrical. relatively symmetrical.
Any asymmetry indicates a difference in Any asymmetry indicates a difference in the male and female population. the male and female population.
This pyramid shows more females at the This pyramid shows more females at the 85+ age range which indicates that 85+ age range which indicates that women are living to older ages than maleswomen are living to older ages than males
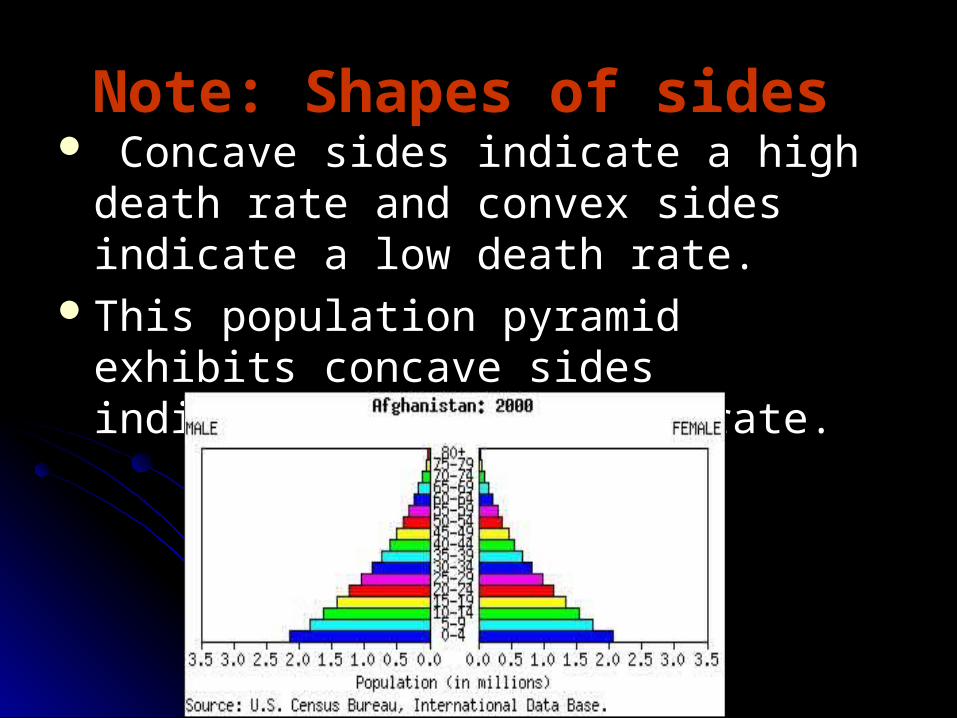
Note: Shapes of sidesNote: Shapes of sides Concave sides indicate a high death rate Concave sides indicate a high death rate
and convex sides indicate a low death and convex sides indicate a low death rate. rate.
This population pyramid exhibits concave This population pyramid exhibits concave sides indicating a high death rate.sides indicating a high death rate.
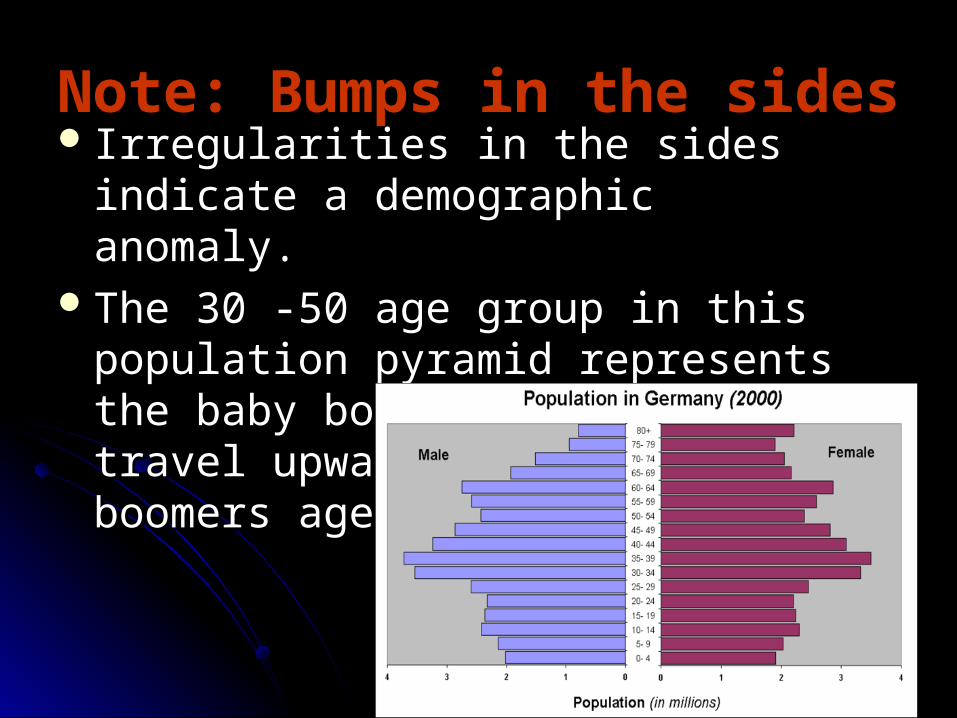
Note: Bumps in the sidesNote: Bumps in the sides Irregularities in the sides indicate a Irregularities in the sides indicate a
demographic anomaly. demographic anomaly. The 30 -50 age group in this population The 30 -50 age group in this population
pyramid represents the baby boom. This pyramid represents the baby boom. This bump will travel upward as the baby bump will travel upward as the baby boomers age.boomers age.
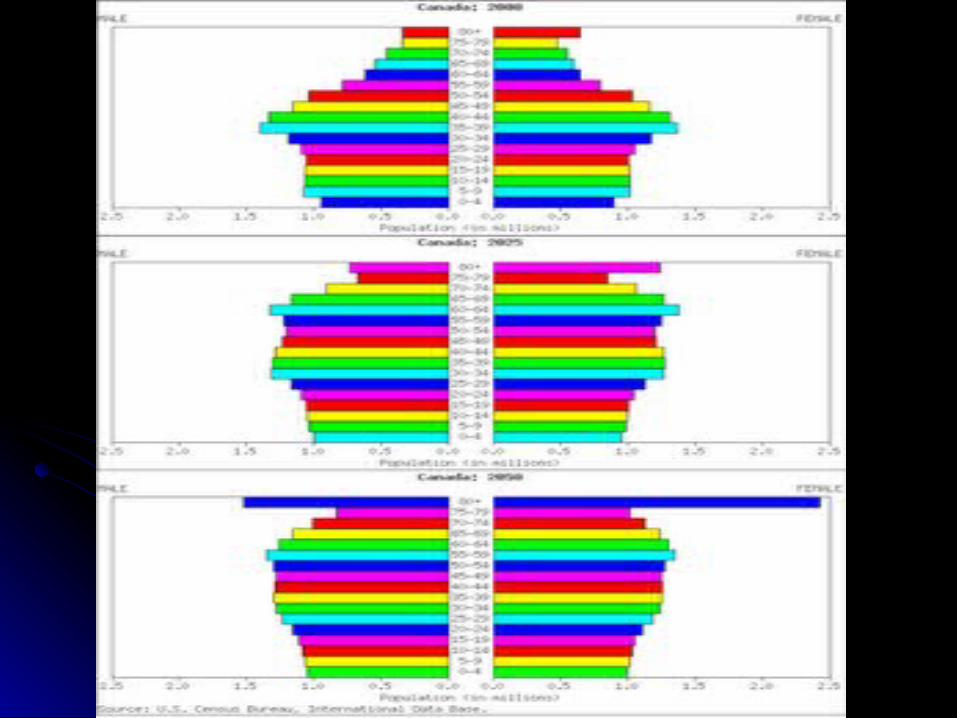
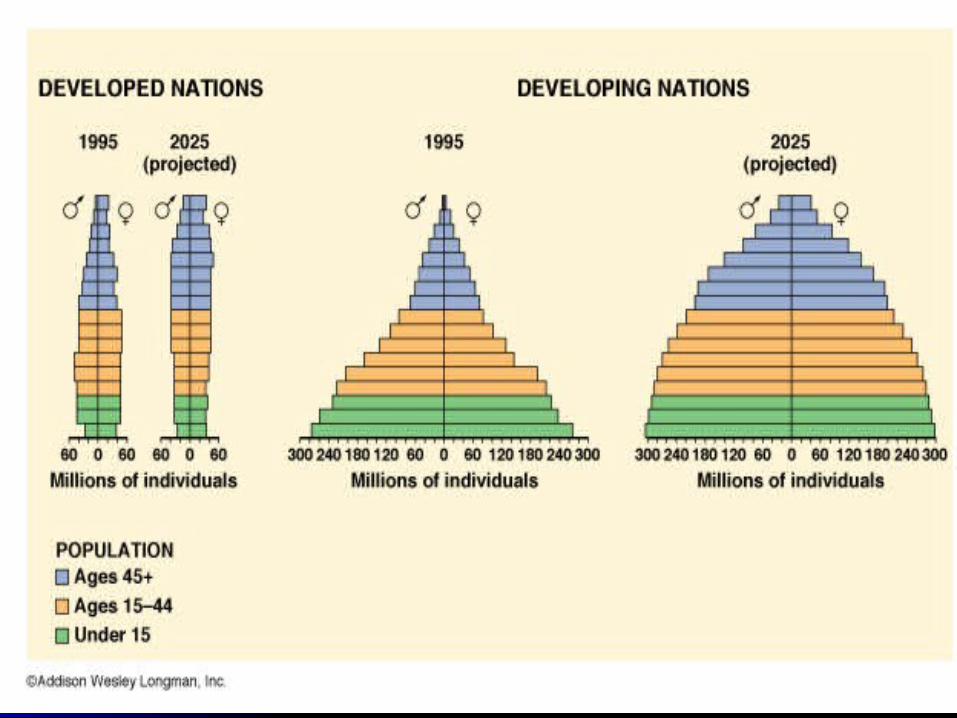
Trends with PyramidsTrends with Pyramids
Developed NationsDeveloped Nations Less people having children (lower birth rates)Less people having children (lower birth rates) Stable populationStable population Lower Death RatesLower Death Rates Symmetrical pyramids throughoutSymmetrical pyramids throughout Other?Other?Developing NationsDeveloping Nations Higher BR (more births)Higher BR (more births) Higher DR (more deaths)Higher DR (more deaths) Looks like a pyramidLooks like a pyramid Mostly young population (lower life expectancy)Mostly young population (lower life expectancy) Other?Other?

What do our “two” What do our “two” Worlds look like now? Worlds look like now? What will “they” look What will “they” look
like later?like later?
![World Populations Why is the population uneven across the globe? WG.7.C describe trends in world population growth and distribution [READINESS STANDARD]](https://img.pdfslide.us/doc/110x75/5697c02e1a28abf838cda383/world-populations-why-is-the-population-uneven-across-the-globe-wg7c-describe.jpg)