Embed Size (px)
Citation preview
l d
PROCESS ECONOMICS
PROGRAM ERI INTERNATIONAL MalloPukcdlfanh
Abetract
Rocese Econm~cs Program Report No. 121A
UDgLD PEfWCE&lICAL FEI08TDCK8 TO 1990: AVAILABILITY AND PRICE
(June 1981)
The first Process Economics Program study of world petrochemical
feedrtocks performed in 1977 wae undertaken to gain a greater under-
standing of the impact of the sharp run-up ,of crude oil prices in
1973-74. However, since 1977, a new outburst of events has disrupted
the euergy and chemical businesses. This study was undertaken in an
effort to track the new data on econapic activity, energy use, petro-
chemical demand, oil and basic petrochemical prices, and other items of
special Interest , such as the gasoline situation in the United States.
These data were extrapolated to 1990 la an attempt to obtain a perspec-
tive of the comlug decade for each of the three major industrial
areas--the United States, Western Europe, and Japan.
PEP’80 SF ’
Report No.121A
WORLD PETROCHEMICAL FEEDSTOCKS
SUPPLEMENT A
by STANFORD FIELD
June 1981
A private report by the
PROCESS ECONOMICS PROGRAM
Menlo Park, California 94025
For detailed marketing data and information, the reader is
referred to one of the SRI programs specializing in marketing
research. The CHEMICAL ECONOMICS HANDBOOK Program covers
most major chemicals and chemical products produced in the
United States and the WORLD PETROCHEMICALS Program covers
major hydrocarbons and their derivatives on a worldwide basis.
In addition, the SRI DIRECTORY OF CHEMICAL PRODUCERS services
provide detailed lists of chemical producers by company, prod-
uct, and plant for the United States and Western Europe.
ii
-
a
CONTENTS
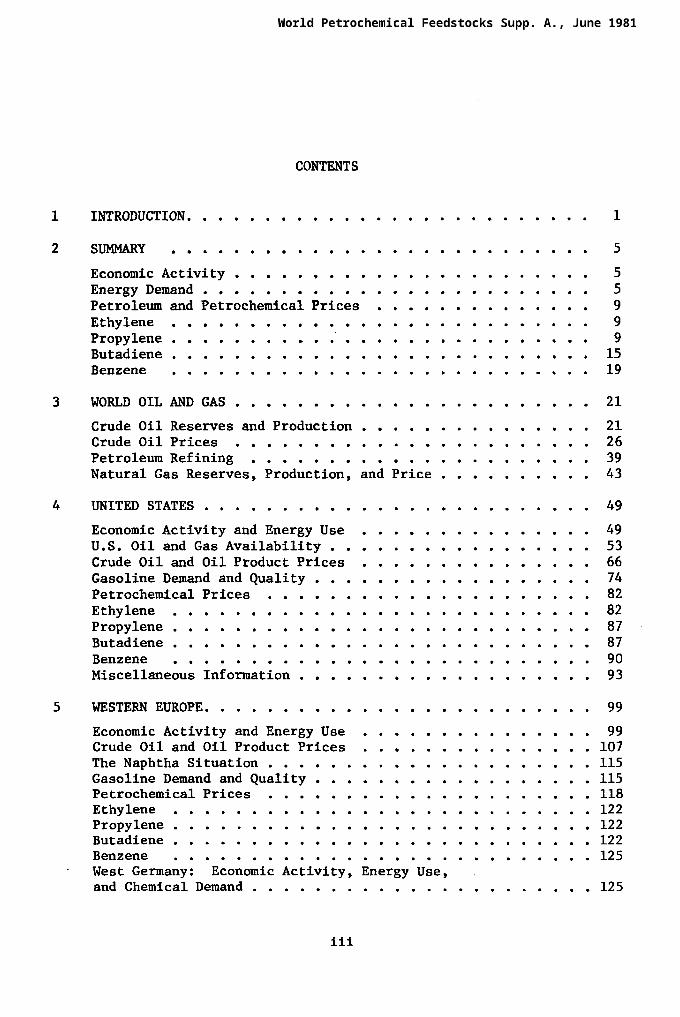
INTRODUCTION. .........................
SUMMARY ...........................
Economic Activity ....................... Energy Demand ......................... Petroleum and Petrochemical Prices .............. Ethylene ........................... Propylene ........................... Butadiene ........................... Benzene ...........................
WORLD OIL AND GAS .......................
Crude Oil Reserves and Production ............... Crude Oil Prices ....................... Petroleum Refining ...................... Natural Gas Reserves, Production, and Price ..........
UNITED STATES. ........................
Economic Activity and Energy Use ............... U.S. Oil and Gas Availability ................. Crude Oil and Oil Product Prices ............... Gasoline Demand and Quality .................. Petrochemical Prices ..................... Ethylene ........................... Propylene ........................... Butadiene ........................... Benzene ........................... Miscellaneous Information ...................
WESTERN EUROPE. ........................
Economic Activity and Energy Use ............... Crude Oil and Oil Product Prices ............... The Naphtha Situation ..................... Gasoline Demand and Quality .................. Petrochemical Prices ..................... Ethylene ........................... Propylene ........................... Butadiene ........................... Benzene ........................... West Germany: Economic Activity, Energy Use, and Chemical Demand ......................
1
5
5 5 9 9 9 15 19
21
21 26 39 43
49
49 53 66 74 82 82 87 87 90 93
99
99 107 115 115 118 122 122 122 125
125
iii
CONTENTS
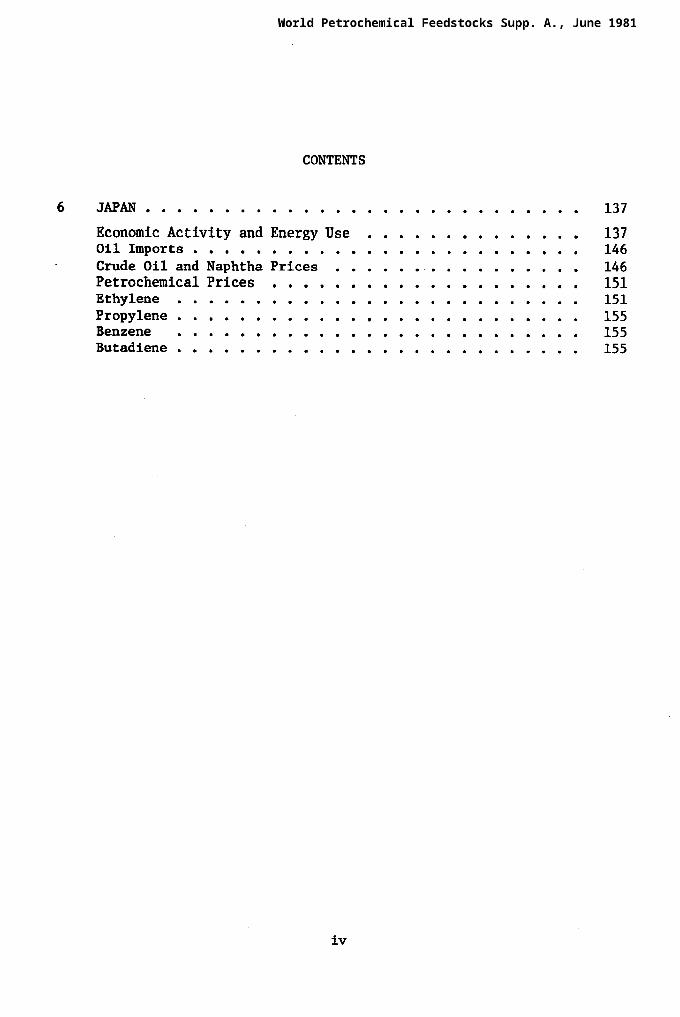
6 JAPAN ............................ 137
Economic Activity and Energy Use .............. 137 Oil Imports ......................... 146 Crude Oil and Naphtha Prices ................ 146 Petrochemical Prices .................... 151 Ethylene .......................... 151 Propylene .......................... 155 Benzene .......................... 155 Butadiene .......................... 155
iv
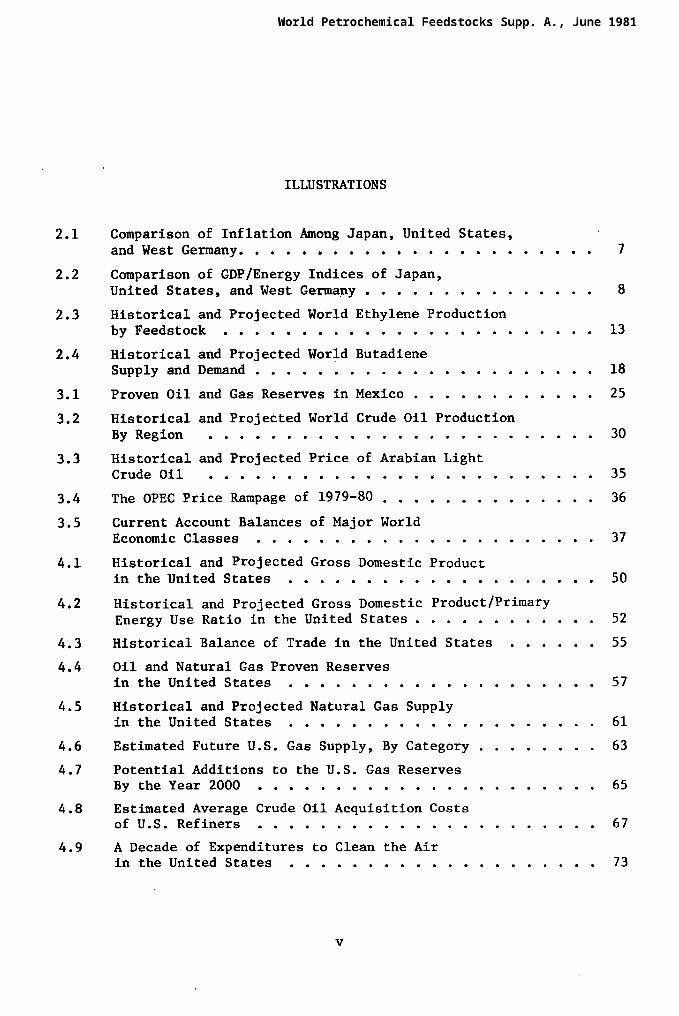
ILLUSTRATIONS
2.1 Comparison of Inflation Among Japan, United States, and West Germany. . . . , . . . . . . . . . . . . . . . . . . 7
2.2 Comparison of GDP/Energy Indices of Japan, United States, and West Germany............... 8
2.3 Historical and Projected World Ethylene Production by Feedstock . . . . . . . . . . . . . . . . . . . . . . . . 13
2.4 Historical and Projected World Butadiene Supply and Demand . . . . . . . . . . . . . . . . . . . . . . 18
3.1 Proven Oil and Gas Reserves in Mexico . . . . . . . . . . . . 25
3.2 Historical and Projected World Crude Oil Production ByRegion . . . . . . . . . . . . . . . . . . . . . . . . . 30
3.3 Historical and Projected Price of Arabian Light CrudeOil . . . . . . . . . . . . . . d . . . . . . . . . . 35
3.4 The OPEC Price Rampage of 1979-80 . . . . . . . . . . . . . . 36
3.5 Current Account Balances of Major World Economic Classes . . . . . . . . . . . . . . . . . . . . . . 37
4.1 Historical and Projected Gross Domestic Product in the United States . . . . . . . . . . . . . . . . . . . . 50
4.2 Historical and Projected Gross Domestic Product/Primary Energy Use Ratio in the United States . . . . . . . . . . . . 52
4.3 Historical Balance of Trade in the United States . . . . . . 55
4.4 Oil and Natural Gas Proven Reserves in the United States . . . . . . . . . . . . . . . . . . . . 57
4.5 Historical and Projected Natural Gas Supply in the United States . . . . . . . . . . . . . . . . . . . . 61
4.6 Estimated Future U.S. Gas Supply, By Category . . . . . . . . 63
4.7 Potential Additions to the U.S. Gas Reserves By the Year 2000 . . . . . . . . . . . . . . . . . . . . . . 65
4.8 Estimated Average Crude Oil Acquisition Costs of U.S. Refiners . . . . . . . . . . . . . . . . . . . . . . 67
4.9 A Decade of Expenditures to Clean the Air in the United States . . . . . . . . . . . . . . . . . . . . 73
V
ILLUSTRATIONS
4.10 Historical and Projected U.S. Gasoline Demand. . . . . . . . . . 76
4.11 Historical and Projected Octane Number of the Average U.S. Gasoline Pool . . . , . . . . . . . . . . . . . . . 78
4.12 Research Octane Number of Unleaded Gasoline Required to Satisfy New U.S. and Imported Cars . . . . . . . . . 79
4.13 Ethyl Corporation Lead Alkyl Antiknock Susceptibility Chart Typical U.S. Research 0. N. '. . . . . . . . . . . . . . . . . . 80
4.14 Ethyl Corporation Lead Alkyl Antiknock Susceptibility Chart Typical U.S. Motor 0. N. . . . . . . . . . . . . . . . . . . . . 81
4.15 Relationship Between Heat of Combustion and Oxygen Content of Various Fuels . . . . . . . . . . . . . . 83
4.16
4.17
4.18
5.1
5.2
5.3
5.4
5.5
5.6
5.7
Historical and Projected Ethylene Demand as a Function of Economic Activity in the United States . . . . . . . . . . . 86
Historical and Projected Sources of U.S. Butadiene Supply. . . . 92
Historical and Projected Chemical Benzene Production in the United States, by Source . . : . . . . . . . . . . . . . 94
Historical and Projected GDP/Energy Ratio of OECD Europe . . . . 100
Historical and Projected Primary Energy Use in OECD Europe . . . 102
Historical and Projected Crude Oil Supply for Western Europe . . . . . . . . . . . . . . . . . . . . . . . 105
Historical and Projected Natural Gas Supply for Western Europe . . . . . . . . . . . . . . . . . . . . . . . 109
Historical and Projected Price Differential Between Naphtha and Crude Oil in Western Europe. . . . . . . . . 111
Historical and Projected Crude Oil and Naphtha Prices in Western Europe . . . . . . . . . . . . . . . . . . . . . . . 113
Historical and Projected (Naphtha-Gas Oil) Price Differential in Western Europe . . . . . . . . . . . . . 114
5.8 Historical and Projected Trend of Gross Domestic Product in West Germany . . . . . . . . . . . . . . . . . . . . . . . . 130
5.9 Historical and Projected Gross Domestic Product/Energy Use in West Germany . . . . . . . . . . . . . . . . . . . . . . . . 131
vi
ILLUSTRATIONS
-
5.10 Historical and Projected Ethylene Demand as a Function of Economic Activity in West Germany ...... 132
5.11 Historical and Projected Chemical Propylene Demand as a Function of Economic Activity in West Germany ...... 133
5.12 Historical and Projected Benzene Demand as a Function of Economic .Activity in West Germany ...... 134
6.1 Historical and Projected Gross Domestic Product in Japan ... 139
6.2 Historical and Projected Gross Domestic Product/Energy Use inJapan .......................... 140
6.3 Monetary Inflation Rate in Japan ............... 143
6.4 Trend of World Trade by Japan ................ 144
6.5 Trend of Japan-U.S. Trade .................. 145
6.6 Historical and Projected Demand for Petroleum in Japan .... 147
6.7 Historical and Projected Naphtha Price Margin Over Crude Oil in Japan ................... 150
6.8 Historical and Projected Ethylene Demand as a Function of Economic Activity in Japan ................ 154
6.9 Historical and Projected Chemical Propylene Demand as a Function of Economic Activity in Japan ......... 157
6.10 Historical and Projected Chemical Benzene Demand as a Function of Economic Activity in Japan ......... 158
Vii
TABLES
0, 2.1 Historical and Projected Economic Activity Comparison for the United States, West Germany, and Japan. . . . . . . . . 6
2.2 Historical and Projected World Energy Use . . . . . . . . . . . 10
l 2.3 Estimated Refinery Gate Prices for Crude Oil, Petroleum
Products, and Basic Petrochemicals in the United States, Western Europe, and Japan . . . . . . . . . . . 11
2.4 Historical and Projected World Ethylene Supply . . . . . . . . 12
2.5 Historical and Projected World Chemical Propylene Supply and Demand . . . . . . . . . . . . . . . . . . 14
0
0
0
a
2.6
2.7
2.8
3.1
3.2
3.3
3.4
3.5
3.6
3.7
3.8
3.9
3.10
3.11
/
Historical and Projected World Chemical Propylene Supply from Steam Crackers . . . . . . . . . . . . . 16
Historical and Projected World Butadiene Supply and Demand . . . . . . . . . . . . . . . . . . . . . . . 17
Historical and Projected Chemical Benzene Demand in the United States, Western Europe, and Japan . . . . . . . . . . . 19
Comparison of Estimated World Crude Oil Resources of 1973 With Those of 1979 . . . . . . . . . . . . . . . . . . . . . . 22
Summary of Historical and Projected World Crude Oil Availability . . . . . . . . . . . . . . . . . . . . 24
Estimated World Crude Oil Reserves . . . . . . . . . . . . . . 24
Estimated Oil Sand Resources of Alberta, Canada, asof . . . . . . . . . . . . . . . . . . . . . . . . . . 27
Estimated World Crude Oil Supply and Demand Balance byRegion........................... 28
Crude Oil Sources of Major Oil Companies as of 1979 . . . . . . 31
Estimated World Natural Gas Liquids Production . . . . . . . . 32
Historical and Projected Sales Prices of Nigerian and Saudi Arabian Crude Oils . . . . . . . . . . . . . 34
World Retail Gasoline Prices . . . . . . . . . . . . . . . . . 38
World Petroleum Refining Capacity . . . . . . . . . . . . . . . 40
Estimated Free World Petroleum Capital Investments . . . . . . 41
iX
TABLES
3.12. Distribution of Catalytic Cracking, Hydrocracking, and Catalytic Reforming Capacities in Free World Petroleum Refineries in 1978 . . . . . . . . . . . . . . . . 41
3.13 Estimated Free World Petroleum Product Demand in 1979 . . . 42
3.14 Comparison of Petroleum Refinery Output in Major Industrial Areas in 1977 . . . . . . . . . . . . . . . 42
3.15 Estimated Ultimately Recoverable Resources of Natural Gas in the World as of January 1979 . . . . . . . . 44
3.16 Estimated World Natural Gas Production and Reserves . . . . 45
3.17 Estimated World Natural Gas Reserves . . . . . . . . . . . . 46
3.18 World Natural Gas Import Prices . . . . . . . . . . . . . . 47
3.19 World LNG Trade . . . . . . . . . . . . . . . . . . . . . . 48
4.1 Historical and Projected Economic Activity and Primary Energy Use in the United States . . . . . . . . . . 51
4.2 Historical Balance of Trade in the United States . . . . . . 54
4.3 Oil and Natural Gas Proven Reserves in the United States . . . . . . . . . . . . . . . . . . . . 56
4.4 Historical Crude Oil and Oil Product Imports by the United States . . . . . . . . . . . . . . . . . . . . 58
4.5 Historical and Projected Oil Supply and Demand in the United States . . . . . . . . . . . . . . . . . . . . 59
4.6 Historical and Projected Natural Gas Supply, Demand, and Price in the United States . . . . . , . . . . . . . . . 62
4.7 Historical and Projected Average Prices for Natural Gas in the United States . . . . . . . . . . . . . . 64
4.8 Historical and Projected Average Prices of Crude Oil Imported by the United States . . . . . . . . . . 68
4.9 Historical and Projected Average Prices for Crude Oil and Petroleum Products at the Refinery Gate in the United States . . . . . . . . . . . 70
4.10 Components of Regular Grade Gasoline Pump Price in the United States . . . . . . . . . . . . . . . . . . . . 71
-
a -
0
X
4.11
4.12
4.13
4.14
4.15
4.16
4.17
4.18
4.19
4.20
4.21
4.22
5.1
5.2
5.3
5.4
5.5
5.6
TABLES
Oil Industry Capital Expenditures in the United States .... 72
Historical and Projected Gasoline Demand and Quality in the United States ..................... 75
Typical Clear Octane Numbers ................. 84
Historical and Projected Average Prices for Selected Petrochemicals in the United States ......... 85
Historical and Projected Ethylene Supply in the United States ..................... 88
Historical and Projected Propylene Supply and Demand in the United States ..................... 89
Historical and Projected Butadiene Supply and Demand in the United States ..................... 91
Historical and Projected Benzene Production in the United States ..................... 93
Typical Steam Cracker Yield Structure ............ 95
Comparison of Typical C4 Stream Compositions ......... 96
Comparison of C8 Aromatics Compositions, Catalytic Reformer vs. Steam Cracker ............. 97
Comparison of Cg Aromatics Compositions, Catalytic Reformer vs. Steam Cracker ............. 97
Historical and Projected Economic Activity and Pr$mary Energy Use in OECD Europe ............ 101
Historical and Projected Primary Energy Use in OECD Europe ........................ 103
Historical and Projected Crude Oil Supply for Western Europe ...................... 104
Crude Oil Deliveries from the USSR to Western Europe in 1979 .................... 106
Historical and Projected Natural Gas Supply for Western Europe ...................... 108
Historical and Projected Average Prices for Crude Oil and Petroleum Products at the Refinery Gate in Western Europe ............ 110
Xi
TABLES
5.7 Naphtha and Gasoline Demand in Western Europe. ........ 112
5.8 Cracking Surge in the European Economic Community. ...... 116
5.9 Historical and Projected Naphtha Balance for Western Europe ...................... 117
5.10 Typical Premium Gasoline Components in West Germany ....................... 119
5.11 Gasoline Specifications in West Germany ........... 120
5.12 Historical and Projected Average Prices for Selected Petrochemicals in Western Europe .......... 121
5.13 Historical and Projected Ethylene Supply in Western Europe ...................... 123
5.14 Historical and Projected Chemical Propylene Supply and Demand in Western Europe. ............. 124
5.15 Historical and Projected Butadiene Supply and Demand in Western Europe ................... 127
5.16 Historical and Projected Chemical Benzene Production in Western Europe ...................... 128
5.17 Historical and Projected Economic Activity and Energy Use in West Germany ................ 129
5.18 Historical and Projected Ethylene, Propylene, and Benzene Demand in West Germany .............. 135
6.1 Historical and Projected Economic Activity in Japan. ..... 138
6.2 Historical and Projected Economic Activity and Energy Use in Japan .................... 141
6.3 Historical and Projected Primary Energy Use in Japan ..... 142
6.4 Crude Oil Imports by Japan .................. 148
6.5 Imports of LPG by Japan ................... 149
6.6 Historical and Projected Average Prices for Crude Oil and Petroleum Products at the Refinery Gate in Japan .................. 149
6.7 Historical and Projected Average Prices for Selected Petrochemicals in Japan ............. 152
6.8 Historical and Projected Ethylene, Propylene, and Benzene Demand in Japan ................. 153
xii
TABLES
6.9 Historical and Projected Ethylene Supply in Japan. . . . . . . 156
6.10 Historical and Projected Butadiene Supply and Demand in Japan . . . . . . . . . . . . . . . . . . . . . 156
xiii