Embed Size (px)
Citation preview

WORLD OUTLOOK
and State of
FOOD AND AGRICULTURE 1950
Food and Agriculture Organizationof the United Nations
WASHINGTON, D. C., U. S. A.
OCTOBER 1950

Food and Agriculture Organization of the United Nations
MEMBER NATIONS
Afghanistan Finland Nicaragua
Austral ia France Norway
Austria Greece Pakistan
Belgium Guatemala Panama
Bolivia Haiti Paraguay
Brazil Honduras Peru
Burma Hungary Philippine RepublicCanada Iceland *Poland
Ceylon India Portugal
Chile Indonesia Saudi Arabia
China Iraq Sweden
Colombia Ireland Switzerland
Costa Rica Israel Syria
Cuba Italy Thailand
*Czechoslovakia Korea Turkey
Denmark Lebanon Union of South Africa
Dominican Republic Liberia United Kingdom
Ecuador Luxembourg United States of America
Egypt Mexico Uruguay
El Salvador Netherlands Venezuela
Ethiopia New Zealand Yugos lavia
*Notice of intention to withdraw from membership was submitted by Czechoslovakia on27-December 1949 and by Poland on 25 April 1950.
DIRECTOR-GENERAL: Norris E. DoddDEPUTY DIRECTOR-GENERAL: Sir Herbert Broadley, K. B. E.

PREFACE
In line with recommendations of the Fifth Session of the FAO Conference, this report brings togetherinformation on the general economic outlook; the outlook for individual farm, forestry, and fisheries commodi-ties; the changing patterns of world trade; the changes in international investment; and the general state offood and agriculture. Last year these subjects were presented in separate documents.
The World Outlook and State of Food and Agriculture - 1950 opens with an interpretive foreword by theDirector-General.
The main body.of the work falls into three sections.
Part I presents the outlook for food and agriculture for the next two years in terms of prospects for theworld as a whole, its major regions, and selected countries. In appraising demand for farm, fisheries, andforest products it has been necessary to give considerable attention to general economic situations throughoutthe world. Facts and analyses made available by member governments and by other agencies of the UnitedNations provide much of the basis for this part of the report. But here, as elsewhere in the book, the responsi-bility for conclusions is FAO's.
Part II covers the outlook for selected individual commodities for 1950/51 and 1951/52 against the back-ground of developments during the past marketing year. The commodities dealt with include the major farm,forest and fisheries products.
Part III reviews the developments in the demand, production, marketing and consumption of agriculturalproducts, the prices of farm products, and the incomes of farmers during the past crop year, 1949/50. It showsthe relation of these developments to general economic conditions and to the changing pattern of world trade.It also considers the changes in international investment.
The tables in the Appendix summarize a few of the key facts with regard ro the world's food supply,production, and trade in agriculture. Tables for individual commodities are not included, since they arealready available in the FAO monthly statistical bulletins and in the various commodity bulletins.'
Far-reaching economic developments have grown out of the crisis in Korea. Many aspects of the out-look for food and agriculture have changed since last June, and still are changing. This report takes accountof major changes up to early September. It has seemed best to delay publishing the material until trendsbecame clearer so that as timely a study as possible might be offered for the use of next sessions of theCouncil and Conference of FAO. The Foreword by the Director-General and "The Outlook in Brief" weredispatched in advance to member governments so that they might be considered before the Council andConference sessions.
1During the first eight months of 1950, commodity bulletins or reports were published on grains, sugar, wool, jute, hardfibers, rice, cocoa, fats and oils, fertilizers, and poultry and eggs. During the rest of 1950, additional publications arescheduled to appear on coffee, g-rains, sugar, cocoa, rice, tobacco, and fruits.
lii
CONTENTSPreface i
BASIC TRENDS AND ISSUES-
-A Foresvord by the Director-General
THE OUTLOOK IN BRIEF-
-A Summary of the Situation and Prospects by Areas and by Commodities 5
Outlook by Regions 5Outlook for World Trade 6Outlook for Selected Commodities 7
Farm Products 7Fisheries Products 9Forestry Product s 9
I. OUTLOOK FOR AGRICULTURE AND FOOD
World and Regional Aspects 11
World Outlook 1_1
Outlook by Regions 11North America 11
Western Europe 12Eastern Europe and the Soviet Union 14Latin America 14
f rica. 15Near East 15Far East 16Oceania 17
Prospective World Trade, 1950/51 and 1951/52 17
II. OUTLOOK FOR SELECTED COMMODITIES
Farm ProductsGrains 20Rice 22Livestock Products 24Fats and OilsSugar 28Citrus Fruit 30Dried Fruit 32Coffee 34Tea 35Coco a 37Tobacco 38Rubber 40Cotton 41Wool 43Hard Fibers 44jute 45
Fisheries Products 46Fresh and Frozen Fish

Salted Fish 47Canned Fish 48Oils and Meals 48
Forestry Products 48Softwood Lumber 48Wood Pulp 50
Newsprint 51Outlook, Wood Pulp and Newsprint 51
III. AGRICULTURAL DEMAND CONDITIONS IN 1949/50
Summary 52World Review 52
Intemal Conditions 52International Trade 58International Investment 59
Demand Conditions in Regions and Selected Countries 59North America 59Western Europe 61Eastern Europe 64Latin America 64
Africa 66Near East 66Far East 67Oceania 71
vi
SIC TRENDS AND ISSUES
A Fore ord by the Director-General
The crisis in Korea has had an impact on the economy of many nations which has brought about anumber of fundamental changes in the outlook for food and agriculture. Demand for agricultural products willbe stronger than had been anticipated; some of the currency impediments to international trade will be reduced.
It now appears that, at least during the next year or two, the requirements of both producing and import-ing countries will be so substantial that the threat of unmarketable surpluses will fade. Prices co producerswill be firm or rising; in fact, some prices may go so high that large groups of consumers may be unable toobtain all they need unless governments act to assure fair distribution and control hoarding and speculation.
These are the probabilities in the broadest terms. There are a number of exceptions applying toindividual commodities and to particular countries and regions.
This report deals with the outlook for agricultural, forestry, and fisheries products as it appeared in theearly part of September 1950. The world situation, which has changed so greatly in the past few months, stillis changing. We of the FAO secretariat have sought out the fullest information we could obtain from membergovernments and other sources. But the rapid march of events continues. Recent announcements that theUnited States will aim for an army of 3 million rather than 1 1million men and that some Western Europeannations will quicken the pace of their rearmament are examples of unforeseen major developments, the conse-quences of which affect the outlook for food and agriculture. Others may follow'.
Just before the Council and Conference meet later this autumn I plan to prepare a brief paper which willtake account of the newest developments and thus bring up to date my report to FAO member nations on majortrends and issues likely to arise in the field of food and agriculture.
Meanwhile, I hope that the report which follows will be useful ro member governments in forming judg-ments as to what is likely to happen and What actions should be taken to meet the situations likely to arise.In this interpretive foreword I shall make no attempt to restate in any detail the information contained in thebody of the report. In fact, the reader will notice that a summary of the outlook material immediately followsthis section. My only purpose here is to set down in everyday language a few of the major trends as I seethem, and to call attention to some of the immediate issues likely ro confront member governments of the Foodand Agriculture Organization.
One assumption which underlies all forecasts throughout the report must be emphasized. It is that therewill be no major, widespread war. Naturally the fighting in Korea, includinig intervention operations of theUnited Nations, has been treated as one of the known factors in the situation. So have other localizedinstances of hostilities or civil unrest. Recent decisions of a number of countries to put more men under armsand generally expand military preparations also are ponderable facts and have been considered as such. Butthat is all; welave gone no further in attempting to look into the future.
Though events since fighting began in Korea have profoundly modified the outlook for food and agricul-ture and may change it still further, they have not completely altered the picture. A fundamental worldwidetrend toward continued strong demand for food has been evident for many months.
By early summer it appeared likely that the buying power of consumers and the over-all demand for foodand other agricultural products would continue through 1950/51 and 1951/52 at the generally high levels pre-vailing during the first half of 1950. This applied to most of the deficit countries of Europe and to the export-ing countries of the Americas and Oceania. Also, it already was apparent that total production and suppliesin 1950/51 probably would be slightly larger than last year's. In fact, buying power was expected to expandmore than supplies. This indicated rising prices with consequent difficulties for those importing nations andgroups of consumers not sharing in the general increase of purchasing power.
Both buying power and supply could be considered as favorable only in comparison with earlier years.Supplies of food and the ability to buy it still were far below the levels required to give all of the world'speople enough to eat.

Before trouble started insl(orea, currency difficulties loomed as a great barrier to international distribu-tion of the supplies anticipated in the year ahead. A considerable part of the probable import demand for foodand other agricultural products was expected to come from food-deficit countries with soft currencies, chieflyin Western Europe. During the next year or two only slight increases in domestic agricultural production wereexpected in most of these countries; their total demand could be met only by the addition of substantial imports.
But how? That was the dilemma.
A large part of the supplies available for export would be held in hard-currency countries; purchasesfrom these sources could be made only to the extent that dollars or other hard currencies could be scrapedtogether. Only limited export supplies were in prospect, in soft-currency producing countries, where thecurrency of the nations wishing to buy would be acceptable. Thus it appeared that in one direction the foodimports of countries wishing to buy would be limited by shortage of dollars, while in the other direction theywould be limited by shortage of supplies.
Since the Korean fighting began a number of countries have announced that they will sharply increasetheir military expenditures. It may well be that total military expenditures in 1950/51 and 1951/52 will beeven greater than the amounts mentioned officially thus far. This increased spending by governments probablywill be large enough to have a significant effect on the domestic and internal economies of a large part of theworld. In many countries of Western Europe and the Western Hemisphere, where the prospect already was forcontinued high employment and consumer purchasing power, increased spending would bring still higher levelsof economic activity and purchasing power, together with the danger of a return of inflationary pressures,which had begun to subside. In other countries, such as Belgium, Western Germany, and Japan, where therehad been considerable unemployment and signs of deflation, higher employment and increased purchasingpower are now in prospect.
It is likely that the recent developments will to some extent reduce the international currency difficul-ties. On the whole there will be more dollars around the world than had been expected, although somecountries will feel the effects of this far more than others. As a result, world trade in food and other agricul-tural products should be stimulated.
The greatly expanded mutual defense and military assistance programs of the United States will directlyincrease the number of dollars available in many other countries. Far more important is the prospective effectof the whole United States armament program on that country's own economy and in tum upon the world economy.Assuming an annual rate of military spending of about $30,000 million by the middle of 1951 -- and that is aconservat;ve figure -- the gross national income of the United States may approach an annual rate of $300,000million before the end of 1950 and go higher by the middle of 1951. The record level thus far is the anntialrate of $270,000 million attained in the second quarter of 1950. As a consequence, the demand for importsinto the United States of manufactured goods, raw materials, and foodstuffs should tend to rise appreciably.For the next two years at least, the amount of dollars available to the rest of the world should continue toincrease.
It is already clear that many countries will not be able to expand supplies of export commoditiessufficiently ro meet the expected import demands of the United States. Many of the foodstuffs and rawmaterials from Latin America, the Near East, and the Far East talce time to produce; output cannot be raisedquickly. Many Western European countries will find it hard to increase exports of manufactured goods beyonda certain point because already they have virtual full employment and must meet the added requirements oftheir own military programs.
If in the next few years prices in the United States should rise more than prices elsewhere, there wouldbe a continuing incentive to other countries to produce more for export to the United States and to limit theirpurchases from it. The effect on world trade would be much the same as that of the devaluations of 1949.Dollar earnings would be increased, although it is likely that the physical difficulties of expanding productionand uncertainty as to the duration of such a strong United States demand would set a top limit to thisdevelopment.
To sum up the impact of events since the Korean outbreak upon the outlook for food and agriculture, itappears that:
2

There has been no significant change in the prospects for food and agricultural production andsupplies in 1950/51. They still are expected to be slightly larger than last year's.
Widespread expansion of military programs will lift purchasing power and intensify in many countriesthe already strong prospective total demand for food and other agricultural products o-ver the next MOyears.The volume of international trade will rise and its general pattern should tend to improve. Higherimport demands and military-aid expenditures of the United States will lead to an appreciableincrease in the dollars available throughout che world for purchases of goods, including agriculturalproducts, from the United States, Canada, and other countries. As a less direct result, trade amongcountries outside the dollar area will tend ro rise and become better balanced. The extent andduration of these gains will depend largely on the extent to which soft-currency countries can expandtsheir production and exports, cope with price increases of goods they must buy for dollars, and main-tain relatively stable don) estic economies.
These developments will to a considerable degree help move the level and pattern of world trade in thedirection required for a longer-term solution of international trade and payment difficulties. This appea.rs tobe true even after full allowance for the added difficulties co be encountered by a number of countries,particularly those in soft-currency areas.
It seems that bitter fighting on a peninsula of Asia and world-wide increases in economically unproduc-tive armaments will do more to improve certain aspects of the international distribution of food than all of thedirect efforts made since 1946. This is not a flattering commentary on international statesmanship. But byall-means let us take full advantage of this by-product of a troubled situation, and hope that in the future wecan do better in developing methods that will work in an atmosphere of international good will.
Even the briefest glance at the situation and outlook suggest a large number of specific problems likelyto be encountered in the months ahead. I shall mention here only a few of the broader issues which seem mosturgent and most likely to call for consideration by che Council of FAO at its next session.
Distribution of scarce commodities. Demand for products directly related to military mobilization hasbeen intensified since fighting began in Korea. In the agricultural field, wool and rubber have been the majorcommodities affected. Prices of the two prod-acts already have risen dangerously, and further United Statespurchases are expected to push them still higher. Rice also has been affected, and, to a lesser extent,cotton, coffee, and cocoa. Within the next few months some other commodities may feel che pressure ofstronger demand. It is not possible to increase supplies of these scarce products in the immediate future;the only course is to make the best use of the quantities that are available. Governments already arediscussing with each other the possibilities of controlling the movement of certain scarce commoditiesthrough international action. If international allocations are re-established, questions will arise as to whatproducts should be controlled and what machinery would be best for administering the controls. For instance,how much could be accomplished through an organization like the International Emergency Food Committee ofthe FAO Council, how much through individual commodity arrangements? Or should other kinds of organiza-tion be considered? The part that FAO itself might play is especially pertinent in che light of the long delayin establishing the International Trade Organization. If commodity arrangements are felt desirable, shouldFAO call for comModity conferences in its field? Mutual consideration of the whole problem also mighthelp to clear up some questions concerning the internal action by which governments can safeguard consumersagainst excessive price rises and unequal distribution.
Directed increases in production. Measures to improve, distribution of scarce supplies are emergencyexpedients at best. The long-range aim must be ro raise production to the levels required, but here somestubborn difficulties stand in the way. Aside from rice and cotton, the agricultural commodities alreadyaffected by the current upsurge in demand all take a long time to produce; output cannot be materially increased from one year to the next. Invorting nations and individual consumers need more of these scarceproducts and they also need protection against che unreasonable prices and lopsided distribution that result
3

from scarcity. Farmers and other primary producers will gladly produce more, but under the economic systemsprevailing in nearly all FAO member countries they cannot increase output without the assurance of a fairretum when their products come to market. Here again basic questions arise. Under the circumstances, whatjustification is there in urging expanded production of scarce commodities of which the added output would beobtained from three to seven years hence? What safeguards to producers would be needed to make this kind ofrecommendation effective? Could sufficient national or international price guarantees be given? To whatextent could commodity arrangements be used to supply the needed safeguards, to consumers as well asproducers?
As to the commodities for which extreme scarcity is not in immediate prospect ir seems likely thatnational stockpiles will diminish rapidly. What production policies seem best for cereals, livestock products,cotton, tobacco, and other commodities in this group?
3. Related Issues. Two other immediate issues are suggested by recent events. One is the likelihoodthat the United Nations, having undertaken military action in Korea, can be expected also to take responsi-bility for relief and rehabilitation and that the specialized agencies may be called upon for work in theirrespective fields. The second is the clearly shown need to forestall war or civil disturbance by vigorousagricultural programs before, rather than after, the crisis begins. Land reform, for instance, is a basicproblem in most of Asia. Should FAO make preliminary studies with a view to drawing up programs of actionin consultation with governments concerned? How can technical assistance programs be shaped so that theirbenefits will not be withheld from people on the land through unjust and inefficient systems of landhol.2'ng?Other long-term trends and issues have a bearing on the immediate questions concerning supply and distribu-tion of farm, fisheries, and forest products. The extent to which expanded armament programs and theircon sequences will ease the dollar shortage and thus stimulate and redirect world trade has already been noted.So has the need for a more permanent method of expanding trade and, in fact, general economic activity aroundthe world. The new technical assistance program should be a powerful force, both in the immediate future andfor the long pull, in increasing the production and dollar-earning capacities of the less developed countriesand thus contributing to a larger and more balanced world output and trade. The present regular programs ofFAO are working, of course, to the same ends. Also of great possible significance for the long run are currentplans for our co-operation with the United Nations Secretariat in broad new studies of economic factors under-lying international trade and payments.
I have mentioned only a few of the immediate issues as I see them. The familiar, continuing problemsremain. The slight gains in prospect for supplies and distribution of food are tiny- in comparison with nutri-tional needs. The progress that has been made since the war in raising levels of production and consumptionhas been greatest in the parts of the world that had the highest living standards before the war. The parts ofthe world that have had the lowest living standards face most of the problems they faced before the war,frequently in intensified form.
During the past five years developments in world trade, international investment, and general relationsamong nations have not borne out the high expectations of international action held at Quebec when FAO wasfounded. Instead, the drift has been in the other direction. National considerations usually have outweighedthe international approach. The world is strained by tensions, divided by political and economic cleavages.
But despite the changes in world conditions and the limitations of many of its own programs, FAO stillis on the right track. The need is as great now as it was in 1945 to increase the production and consumptionof food and agricultural products and to improve the living levels of millions of the producers of these products.
4
a aDirector-General

5
H E T L 0 0 K U4 BRIEF
A Surnmary of the Situation and Prospects by Areas and by Commodities*
The world food supply for 1950/51, from indications in early September 1950, is likely to be only slightlybetter in quantity and nutritive value than in the preceding year. Lumber and pulp production probably willcontinue to increase. Fiber production will be somewhat smaller.
The increase in food crop production will barely keep pace with population growth. Increases in the out-put of meat ànd livestock products may be somewhat greater than for crops. Fish production may be curtailed.In all, world food supplies per caput will be larger, but the gain slight; there may be none in some of the regionswhere improvement is needed most.
Levels of econornic activity in most countries will be higher in 1950/51 than in 1949/50. With expandingemployment, income, and purchasing power, the demandl for farm, forestry, and fisheries products will continuegenerally high and rising, except possibly in the Near East and the Far East. With very limited increases inproduction, the demand for food and agricultural products will tend to run ahead of supply.
There will be a continued expansion in the volume and some improvement in the patterns of internati-:-Ialtrade in 1950/51. In part these will result from a marked increase in dollars available to many countries be-cause of intensified U. S. economic activity and import demands. Effective demand for internationally tradedfood and agricultural commodities will continue to rise. Thus, larger trade in agricultural commodities may beexpected, with increased exports from both soft- and hard-currency countries.
Viewing the supply and demand situations together, it is clear that prices will continue to rise, and prob-lems of distribution may reappear. Governments may have to take steps to prevent the withholding of stocksfrom regular channels, and to assure the equitable distribution of foodstuffs to consumers at reasonable prices.
OUTLOOK BY REGIONS
North America (Canada and the United States.) Prospects are for about the sarne size of wheat crop aslast year, maize production only slighdy smaller than last year's bumper crop, and for a substantial reductionin cotton production. Combined food supplies for consumption per caput will be somewhat larger than lastyear. Industrial activity and demand for agricultural products, both domestically produced and imported, willcontinue to increase, supported by expanding defense expenditures, and will be significantly higher in 1950/51and 1951/52 than in 1949/50. The value of raw material imports will probably continue to rise rapidly. Withimproved markets for exports and rising internal prices, farmers' real income should cease to decline, and maytend to increase somewhat.
Western Europe. Conditions are generally favorable for good grain and sugar crops in 1950, and for in-creased production of meat and livestock products, though meat output will still be slightly below prewar.Demand for farm products will probably continue to rise, with continued emphasis on expanding domestic foodproduction and obtaining food imports from soft-currency regions. Real income to farmers will generally con-tinue to expand, with the likelihood of higher prices to consumers, modified by price controls or governmentsubsidies.
*This summary covers the material presented in more detail in Part I of this Report (Outlook for Food and Agriculture:World and Regional Aspects) and Part II (Outlook for Selected Commodities: Farm, Fisheries, and Forestry Products).
1The term "demand" is used in this report in the sense of the intensity of desire to buy (for consumption, export, orstocks) backed by the means and the readiness to buy. An increase in demand means that more can be sold at the sameprice, or, if sufficiently large quantities are not available, that prices will rise; a fall in demand means that less can besold at the same price, or, if the same qu.tritity is available, that prices will fall. Effective price control or rationincan, of course, prevent or modify these re tctions to changes in demand.

Eastern Europe and Soviet Union In spite of the severe drought damage to the 1950 maize crop in theDanube basin, agricultural production in the region as a whole is likely to show an increase over last yearNational plans call for substancial increases in industrial production and consumers real income. With the ex-ception of-07e Da,.upe countries, Hungary, Romania, and Yugoslavia, farmers' real income seems likely to in-crease as well in 1950/51,
Latin America. Expanding agricultural production should keep pace with che rapid growth of population,but consumption levels per caput will probably show little increase in 1950/51. Expanding domestic marketsmay absorb the increasing farm output in most countries, with a good income to farmers and possibly risingprices co consumers. Countries largely dependent on exports to dollar areas will benefit from the rising importdemands in North America. Continued European demands for non-dollar foodstuffs and raw materials may en-courage an expansion of production for export from Argentina and other countries.
Africa. In areas affected by drought last year, prospects for food production in 1950/51 are better than in1949/50. Generally throughout the region, production of food crops for domestic consumption expands butslowly, largely because of continued emphasis On production of cash crops for export. A gradual increase indernand and in the levels of farmers' real income seems likely.
Near East. A_gricultural supplies in 1950/51 are likely to be larger, with an improved harvest of mostcrops, particularly cereals. Demand prospects are mixed: domestic economic stagnation is restricting internaldemand in many countries, and increasing trade barriers are restricting intraregional trade. Export marketsoutside of the region will tend co be better. Farm prospects for production and income are brighter in Turkeyand in Israel.
Far East. Barring further unfavorable weather, crop production in 1950/51 may increase slightly, but anyanticipated increase would leave per caput food supplies below the prewar level. Reported midsummer floodsin China, however, indicate that improvement, if any, in wheat, rice, and secondary crops, will be less thanexpected. The probable loss of a substantial portion of the Korean rice crop will create a serious domesticsupply shortage, in addition to wiping out any possible exportable surplus such as Korea had last year. Con-tinued unsettled conditions will keep buying power low and impede transport and distribution in a number ofother Asian countries. Better prospects may be expected, however, for industrial and agricultural activity andincome in the Indian subcontinent, Indonesia, and Japan. Commercial agricultural producers in Asian exportingcountries have gained froni the expansion of import demand in North America, and in soma cases have gainedfrom changes in the terms of trade following devaluation. These developments will probably continue.
Oceuniakgricultural production is likely to continue high, with a 1950/51 wool ad dairy output largerthan last year's. The demand for farm products, both for export and for dornestie consumption, will continue toincrease. Export demands should continue active for all available products except possibly butter. The pro-spe.ct is for rising industrial activity, consumer prices, and domestic income, including farm income, in 1950/51and 1951/52.
OUTLOOK FOR WORLD TRADE
Total volume of world trade may expand by more than one-tenth in 1950/51. Agricultural exports may ex-parid, but not in the same degree. The expansion should come from both the dollar and non-dollar exportingregions. A large part of recent agricultural exports from hard-currency countries has been financed by UnitedStates dollar contributions. United tates import values are increasing substantially. Dollar earnings willrise because of increased armaments expenditures by the United States. This will ease the pressure of dollarshortages, and modify the previous plans of many countries for further cuts in their purchases from hard-currencyarea's during 1950/51.
To correct the dollar deficit in Europe's balance of payments, Europe needs Lo reduce its direct dollar def-icit with the United States and Canada. This probably could be acuomplished more through reducing importsfrom those countries than through expanding exports. Europe also needs ro expand exports to other overseas
6
countries so as to establish a surplus with them and thus earn dollars from them with which to pay North Amer-ica, rather than malcing them net dollar payments, as is now the case. That would mean greatly- expandingEurope's trade with the other non-dollar regions. The inability of some primary producing countries to increaserapidly their exports of certain raw materials, especially of farm products, to both dollar and non-dollar areasmay be the limiting factor in such an expansion. Trade between non-dollar countries, however, may continueto expand more rapidly than trade transacted in hard currencies. Intraregional trade will probably continue toexpand in Asia, but its further expansion seems unlikely in Latin America, while east-west trade in Europeseems likely to lag behind that of Europe as a whole.
OUTLOOK FOR SELECTED COMMODITIES
Farm Products
Grains. Grain production fell in 1949/50, mostly in maize, wheat exports were materially lower, andU. S. stocks of wheat increased substantially. Under the International Wheat Agreement, half of world wheatexports moved at prices below free market prices., The outlook for 1950/51 is for grain crops possibly some-what larger than last year's in the Northern Hemisphere. Exportable supplies will be at least as large asthose of 1949/50. And, while until recently, lower imports were expected in 1950/51, increasing dollar avail-abilities may modify the outlook.
Rice. World production in 1949/50 nearly equaled prewar levels. World consumption percaput continued low, and world trade was only two-fifths of prewar volume. In 1950/51, increased output seemslikely in the Far East. Rice supplies will continue short compared to other grains, and relatively high priceswill probably continue, especially in soft-currency countries, while imports and consumption of wheat will con-tinue high in countries which earlier had depended largely on rice.
Livestocic products. Production of meat and livestock products increased materially in Europe in 1949/50,especially in milk and pork. Production continued high in other important producing regions; in Argentina,drought forced unusually heavy livestock slaughter. Present indications point to a further substantial increasein 1950/51 output of meat and dairy products in Europe, and of continued high levels of output in most othermajor producing areas. Prices of livestock have declined from previous very high levels, but are still general-ly remunerative to producers. Demand for meat and livestock products, and international trade in these pro-ducts, may increase further as a result of the increasing tempo of world economic activity.
Fats and oils. Production continued to expand in 1949, consumption rose nearer to prewar-levels, andprices declined sharply, especially in exporting countries in the dollar area. In non-dollar regions, however,supplies continued relatively short, and prices in national currencies remained far above, prewar levels. Worldproduction and consumption seem likely to increase further in 1950, with the increase largely occurring in theregions where supplies are shortest relative to prewar. Since the middle of 1950 prices have turned sharply up-ward under the initial impact of precautionary reserve buying and stronger purchasing power in some countries.Demand seems likely to increase in both hard- and soft-currency areas, and some of the latter will probably beable to finance larger purchases of fats from dollar regions than hitherto seemed likely.
Sugar. Production and consumption have risen steadily and seem likely to continue to do so. All regionsshared in the increased output in 1949/50, and present indications for 1950/51 are for a substantially largercrop. To date, expanding world consumption has kept pace with expanding production, and much more could beconsumed if remaining rationing schemes were relaxed or very high internal prices were reduced. The increas-ed availability of dollars expected to result from acc.eleration of the United States armament program will nodoubt facilitate maintenance of purchases of sugar from dollar areas.
Citrus fruit. World production declined slightly in 1949, chiefly as the result of a drop in grapefruit out-put in the United States. World trade increased, with most European countries except the United Kingdom in-creasing citrus takings. Since devaluation, the ability of United States exports to compete in the European
7

market has been further reduced despite substantial export subsidies. With the liberalization of trade betweensoft-currency countries, international trade may rise further, while the rapidly expanding market for frozen juiceconcentrates in the United States seems likely to offset without difficulty the effects of any further decline inthat country's exports.
Dried fruit. Production of raisins and figs declined in 1949/50, buc that of currants anci prunes increasedslightly. Total internacional trade fell, principally because of sharp reductions in United States exports, de-spite heavy export subsidies; trade 'among soft-currency countries expanded. Prices declined somewhat (indollars) from their previous very high levels in Mediterranean countries, but advanced in the United States.Turkey and Greece partially restored their prewar output, arid Germany re-entered the market as a large r11-
potter. Although production prospects for 1950/51 are still uncertain, the trend is upward. Trade within Europemay expand further as a result of a general reduction in restrictions on dried fruir imports from soft-currencyareas.
Coffee. Consumption again exceeded production in 1949, the remaining Brazilian Government DNCstocks were used up, leaving only normal working stocks, and prices soared to very high levels. Productionmay be slightly lower in 1950/51, and world imports for consumption will likely be 5 to 10 percent below lastyear. rProduction prospects are somewhat better for 1951/52. Coffee prices and incomes of coffee-exportingcountries will continue high, while producers take the time required to expand production,
Tea. World production increased only slightly in 1949, but world trade rose sharply with increased tak-ings, especially by the United Kingdom. Prices rose until November. 1-,dications for 1950/51 are for furtherincreases in output. Continued gradual increases in acreage and production in the major exporting countriesare provided for by the renewed Interim Producers Agreement, and provision is also made for restoredIndonesian production. Tea consumption seems likely to rise further in 1950/51 and following years, in viewof the short coffee supplies and rising consumers' incomes.
Cocoa. Supplies are still quite short, the intensity of demand is increasing steadily, and carryover stocksare much reduced. No material change in production is expected in 1950/51; the swollen shoot disease in WestAfrica still is seriously affecting production. Production is tending to increase slowly, but nesv plantings areas yet much too small to catch up with the enlarged and expanding postwar demands The increase in demandmay be fuither intensified by developments since the Korean outbreak. Producers and governments have beenhesitant to expand production, fearing a repetition of the distressed conditions following the 1929 collapse.
Tobacco. World production declined slightly in 1949, mainly in China, but exceeded the prewar averageby 10 percent. Trade increased sharply and exceeded the prewar level, with soft-currency countries increasingexports more than hard-currency areas, and with United States exports continuing heavily dependent on ECAfinancing. Prices were generally firm. Demand for tobacco is ex-pected CO continue expanding in 1950, espe-cially in the United States. Before the economic developments arising out of the Korean hostilities, it was ex-pected that United States exports would decrease slightly in 1950. It now seems that they may be relativelywell maintained in 1950/51 and 1951/52, while production and trade among soft-currency countries will continueto grow.
Rubber. Sharply increased prices have stimulated output of natural rubber, especially in Indonesia andBorneo, but these gains may be offset Eo SOM e extent by the increasingly precarious situation in Indochina andby the uncertain outlook for other strategically vulnerable supply areas. World supply of new rubber is beingincreased by the rapid reactivation and expansion of synthetic rubber production in the United Stares. Acushion is also provided by the existence of certain stockpile reserves, but the supply for civilian uses islikely to remain tight. Natural rubber prices in the U. S. advanced 73 percent from June to early September, tothree times the fixed price for GR-S synthetic. Because of the military importance of natural rubber, questionshave been raised conceming the control of shipments by destination. These matters are being currently review-ed in intergovernmental discussions.

Cotton. The world cotton situation is undergoing a radical change. In contrast to the position a y-ear
ago, when a considerable surplus of American cotton was in prospect, the world is now faced with a 'very tightsupply position. Prices in the new season opened about 20 percent above the August 1949 level, and in theU. S. increased another 10 percent by early September. With a reduction of nearly two-fifths in the UnitedStates crop, the expected 10 to 15 percent expansion in aggregate production of other countries will still leaveworld production about 13 percent below the 1949/50 level. World consumption in 1950/51 will not be signifi-cantly larger than in the preceding year. In contrast to that period, when production exceeded consumption by5 percent, use in 1950/51 may exceed output by about 10 percent, leaving a world carryover as of 1 August1951 nearly 3 million bales less than a year earlier. World production in 1951/52 is expected to benefit ma-terially from the prospective lifting of acreage restrictions in the U. S. and the stimulus of high prices. If
adequate supplies are available, a substantial rise of world cotton consumption in the 1951/52 season is like-ly, in consequence of the expected rapid advance in industrial production and consumers' demand.
Wool. With growing military requirements superimposed on a tight world market for civilian uses, problemsof world wool supply have become a matter of serious concern. Stocks held in all hands as of mid-1950 weredown ro little more than working stock requirements. Since then, the continuing strength of civilian demandand the greatly increased defense requirements have caused wool prices to rise to levels far in excess of allprevious records. When this review was written, the possibility of a system of international allocations for rawwool was being reviewed in intergovernmental discussions. If these discussions resulted in plans for interna-tional action, the proposals were to be placed before a meeting of the International Wool Study Group in earlyOctober.
Hord fibers. Aggregate output in 1951 may increase by about 10 percent and approach the prewar level,though abaca production is likely to remain far below the prewar average. Prices in the first half of 1950,while below the 1949 peaks, continued over three times the prewar average for both abaca and sisal. Exceptfor a short-lived boom in the abaca market in early August, price increases in hard fibers since the Korean warhave generally been around 10 percent. Since demand is likely to increase more rapidly than output in the nearfuture, owing to expanding military and rearmament programs, a very tight position may develop in these fibers.
Jute. The chronic postwar shortage of jute was intensified in 1949/50 by the disruption of Indo-Pakistantrade after Indian devaluation. The trade deadlock was at least temporarily broken in late April 1950. Duringthe recent years of food shortage and high prices for rice, jute farmers have diverted a considerable portion oftheir lands to rice. World jute production in 1950/51, though probably substantially larger than in 1949/50,probably will still be considerably below the prewar average. With short-run demand likely to be strengthenedconsiderably by expanding industrial demand, the world jute position is likely to continue tight. Interconti-nental trade in the fiber may be larger, however, though still below prewar.
Fisheries Products
Total production in 1949 continued at the high levels of 1948, although it was slightly lower in someregions; prices generally declined as a result of sharper competition from other foodstuffs. Accordingly, agreater part of the landings was diverted from the fresh fish trade to salting and to oil and meal reduction.The quantities of fresh and frozen fish marketed showed a decline in the early part of 1950 as a result of a de-crease in demand. Production of salted cod and allied species might increase during 1950. The decline inthe production of salted herring which occurred in 1949 might continue during 1950. The output of high-pricedcanned products from sardine and salmon will depend upon the abundance and availability of these species.Production of canned tuna, which reached a record in 1949, might show a slight increase in 1950. With general-ly higher consumer incomes in 1950/51 and 1951/52, and intensified demands for most foodstuffs, the demandfor fisheries products should tend to strengthen, with prices holding or rising somewhat in some products.
Forestry Products
Softwood lumber. World production was slightly srnsaller in 1949, but consumption was maintained at aboutthe previous level, depleting stocks somewhat. World trade increased slightly, with great activity in
9

intra-European trade, but exports from Canada to other continents, notably Europe and South America, declinedconsiderably. In 1950 and 1951, world consumption will probably be larger. Construction activity in the UnitedStates and Canada is expected to remain strong, with firm or rising prices. Trade will expand, especially be-tween Canada and the United States. It is not believed that European production over the longer trend will riseto meet expected expansion in consumption, and increased European imports from other regions will be required.
Wood pulp and newsprint. Production and consumption of wood pulp was slightly reduced in 1949, andprices were lower. Consumption and prices both rose in 1950. Exports were somewhat higher in 1949 than in1948, despite a drop in Canada's exports. International trade rose sharply in early 1950, with improving eco-nomic conditions; later in the year supplies became harder to obtain. North American and European productionof newsprint expanded, the former attaining a new high level in 1949. Consumption also increased in NorthAmerica and Europe, and dollar prices were firm despite the business recession in the first half of 1949.Canadian exports were largely to the United States.
Production and consumption of wood pulp and newsprint will probably continue to expand in 1950 and1951. International trade also is likely to expand, with Europe supplying an increased share of overseasmarkets.
10

PART I. OUTLOOK FOP AGRICULTURE AND FOOD
World and Regional Aspects
WORLD OUTLOOK
The world's food supply for the year 1950/51 (July through June) seems likely to be slightly larger andof higher nutritive value than in 1949/50, judging from crop conditions and prospects as they appear in mid-September 1950.The demand for farm products also has good prospects for continued expansion in 1950/51.Recovery from the 1949 recession in U. S. production and imports, and greatly expanded armaments expendi-tures, have removed that threat to continued economic progress elsewhere. Crop production, especially of riceand bread grains, seems likely to increase about enough to keep pace with growing population; the output ofmeat and livestock products is likely to expand considerably more. Fish production may be relatively wellmaintained, while lumber and pulp production will probably continue to grow.
OUTLOOK BY REGIONS
North Americo
United States of America. Agricultural and food supplies for domestic consumption will be maintaineddespite prospective reductions in the 1950 crops of wheat, maize, cotton, and other products. Livestock out-put continues to expand. The demand for farm products, both domestically produced and imported, is expectedto be higher in 1950/51 and 1951/52 than in 1949/50. With rising domestic and export demands and a renewedexpansion of output, farm incomes and the real purchasing power of farmers should turn up, and rise through1950/51 and 1951/52. Imports of raw materials will probably continue to rise, with 1950/51 and 1951/52 im-port values substantially exceeding those for 1949/50.
The latest official report estimates that total 1950 wheat production in the United States is down about12 percent from the 1949 crop. Indicated maize production is somewhat smaller than the 1949 bumper crop.
The number of cattle and swine on farms has increased. Meat production may be slightly higher in1950/51 than during the previous year for beef and veal, somewhat lower for mutton and lamb, but considerablyhigher for pork. The 1950 spring pig crop is estimated at 6 percent above that of 1949. Output of milk anddairy products will also probably exceed that of 1949, while egg production is running 6 percent above lastyear. Combined food supplies per caput may be somewhat larger than last year.
Before the outbreak in Korea, economic conditions in the U. S. indicated a continued rise in the demandfor agricultural products, both domestic and imported, in 1950/51, with the possibility of a slight slackeningin 1951/52. This prospect was based on the expectation of continued high levels of public expenditures, ofhousing construction, and of automobile sales in 1950/51, more than offsetting an expected slightcontraction in private investment in plant and equipment. The possibility of a downturnin housing in 1951/52 and a more marked contraction in automobile sales are not likely to be offset byexpansion in other industries.
UN intervention in the Korean war and the expanded U. S. defense program to back it up has created anew economic situation. The expected increase of roughly $20,000 million in defense expenditures ensuresthat full employment will be maintained and that demand will rise through 1950/51 and 1951/52. This programalso restores the danger of continued inflationary pressure. The gross national income of the United Statesmay approach an annual rate of $300,000 million before the end of 1950, and exceed that rate by the middle of1951; as compared with the record rate of $270,000 million in the second quarter of 1950.
1Midyear Economic Report of the President (Washington, July 1950) pp. 1-18, 40-47.
11

Limitation of construction and automobile production, controls on prices and credit, allocation or prioritysystems for steel and other scarce materials, and increased taxes have been proposed, discussed, or author-ized. How soon or how extensively such controls may be applied, and how successful they will be in meetingthe difficulties of superimposing a partial war economy on a booming peacetime economy cannot yet be judged.In the absence of controls, U. S. wholesale prices advanced 6 percent between early July and September, 1950.With the projected defense program carried through, an expanding economy will continue in the United Statesthrough 1951/52, with such modifications in the demand for particular products as the developing political andmilitary situation may create.
Farm incomes in the United States were sharply reduced in 1949, and prices of farm products fell to below100 percent of "parity" for the first time since 1941. The improved domestic buying power, renewed expansionof output, and higher prices, will create a sustained or rising real farm income in 1950/51 and 1951/52.
With expanding U. S. industrial activity and consumers' incomes in 1950/51 and 1951/52, and with highdemands for products like rubber because of military needs, imports of raw materials will probably continue toincrease in quantity and even more in value, assuring expanding dollar export markets for farmers in othercountries.
Canada Despite some reduction in beef production, food supplies per caput for domestic consurnption in1950/51 are expected to average about the sarne as last year. Domestic demand for farm products should con-tinue high, with employment, industrial output, income, and effective demand running above last year duringihe remainder of 1950 and in 1951.
s.Vheat production in 1950 may be above last year's, despite a slight reduction in acreage. Reductions areexpected in mutton and lamb and possibly in beef production, but there is a considerable increase in pork pro-duction. Inspected hog slaughter during the first three months of 1950 was 19 percent above the correspondingperiod of 1949. Domestic consumption of pork during the same period was about 25 percent above last year,largely as a result of reduced export outlets. Similarly, domestic consumption of eggs has increased in recentmonths, following termination of the British egg contract. The 1950 chick-hatch is about 14 percent below thatof 1949, which may lead to reduced output of eggs as well as poultry. Dairy production will probably be aboutthe same as in 1949.
Public expenditures are expected to exceed tax collections, in contrast to last year, when expenditureswere below collections. At midyear 1950 the rate of gross capital investment was estimated to be substantial-ly above that of 1949,2 and some increase in inventories may take place. In consequence, the level of grossnational income will increase materially in 1950/51.
The effort of European countries to cut down on dollar imports had threatened to affect somewhat the de-mand for Canadian exports, as indicated by the one-third reduction of exports to these countries in the firstfive months of 1950 compared to the same months of 1949, but the increase in dollar availabilities in 1950/5 1and 1951/52 will probably lead to an improvement in demand for Canadian exports. Exports of forest productsto the United States, which were suprisingly well maintained in 1949 despite the U. S. recession, will probablyincrease further.
Western Europ e
Prospects for wheat and rye are reasonably favorable, with combined production about equal to lastyear's. The area under wheat is now estimated to be about 2.5 percent up from last year, and that under ryeto be down 2 percent. Carryover stocks of bread grains may be somewhat larger. Prospects for sugar areoptimistic, with a substantial export surplus (150,000 to 200,000 metric tons) probable in France, and a reduc-tion in Western German import needs of about 200,000 metric tons, due to a 20 percent increase in area.
Livestock numbers have increased continuously, and the output of livestock products in 1950/51 may be'about 10 to 12 percent in 1949/50. Meat output will still be 5 percent below prewar, but milk production willbe slightly above. Excluding Germany, milk supplies per caput will equal prewar, and will exceed prewar inNorway, France, the Netherlands, and the United Kingdom.
2Private and Public lrzvestrnent in Canada, Mid-Year Survey, 1950, (Ottawa: Department of Trade and Commerce,30 June 1950.)
12

United Kingdom Indications are that livestock production and sales of livestock and livestock productswill continue to increase in 1950/51. The 1950 wheat crop seems likely to exceed last year's, and prospectsfor other crops were favorable.
The value of gross national production is expected co be appreciably larger in 1950 than in 1949. Expend-iture for consumption is expected to rise correspondingly. Agricultural prices may show a further rise during1950 and maintain or improve their position in relation to industrial prices, producing a further substantial risein farm income in 1950/51. Increased military expenditures make it clear that this upward trend in industry andagriculture will continue into 1951/52.
Official U. K. estimates on gross national production in 1950, released before the outbreak of hostilitiesin Korea, assumed little further increase in workers, but a gain of about 2.5 percent in output per worker (some-what under the 4-percent gain in 1949), and a slight rise in prices despite continued restraints.3 Thus far in1950, production and efficiency have increased more than expected, indicating that the gain in efficiency in1950 might equal that of last year, and produce an even greater rise in income than anticipated.
With additional military expenditures, national income in 1950 will be appreciably greater than in 1949.Part of the buying power for increased production was expected (before the Korean outbreak) to come from ex-port sales increasing much more than expenditures for imports; part was to come from larger public expendi-tures without correspondingly increased tax collections. The greater demand from these two factors wasexpected to more than offset a slight decrease in expenditures for plant, equipment, and other goods for domes-tic capital formation. Consumption expenditures viere also expected to rise, but no more than total income.With the additional developments since July, the expansionary forces may be appreciably larger in 1950/51 thanin 1949, with a resulting marked inflationary pressure, increased demands for wage increases, and a possiblerise in prices.
In addition to its own projected balance-of-payments surplus, the general U. K. financial position hasbeen strengthened by the improved dollar-earning power of the sterling area. In addition to the favorabledomestic factors already mentioned, the steady growth in the general European economy, expanding marketsfor U. K. exports in non-dollar countries, increased dollar exports because of devaluation, and the rise in im-port demands in the U. S. which will follow in the increased U. S. military expenditures all indicate that theupward trend in British industrial activity and income will probably continue for the next few years.
With continuing growth in U. K.'s domestic buying power, there will be a pressure towards agriculturalprices (other than subsidized prices) showing a further rise during 1950, improving their position relative co in-dustrial prices, especially if rationing or price controls are eased. With continued normal weather in the1950/51 year, farm income will probably be substantially larger than in 1949/50.
Continental Western Earope. Conditions are favorable for good grain and sugar crops and for increasedproduction of meat and livestock products.
Domestic demand for farm products seems likely to rise substantially in 1950/5 1, as a result of increasedmilitary expenditures, industrial production, and cOnsumers' income, with a further rise likely in 195 1/52. Al-most complete elimination of price or rationing controls has added co the intensity of market demands for farmproducts, and is probably resulting in a less equitable distribution of the available supplies. Devaluation in-creased the pressure to expand food production in most devalued countries, and may tend to raise farm incomemore rapidly than incomes of other groups.
There is the possibility that a few countries may find it difficult to market their full supplies of certainlivestock products, especially dairy products: Milk production is increasing in France, but consurners do notfavor increased use of liquid milk. Butter consumption is declining in the Netherlands, in competition withmargarine of excellent quality, which is available at a considerably lower price. Thus, greater quantities ofdairy products, particularly cheese, will be available for export in Europe. Two countries, Sweden and Finland,,may become more important as exporters of livestock products. If the output of pork continues to increase atthe present rate, farmers in some countries, where the purchasing power of large groups is very limited, mayhave difficulties in increasing sales.
In most countries of Western Europe, where future increases in output must depend primarily on increasesin productivity (owing to the lack of any substantial reserve of manpower), industrial production is expected to
3Econornic Survey for 1950 (London: I-1M Stationery Office, Cmd. 7915, March 1950.)
13
increase at least 5 or 6 percent between 1949/50 and 1950/51.4 In Belgium, Germany, and Italycountrieswith excess manpower or substantial unemploymenta more rapid increase could occur. Such an increase maybe stimulated by generally enlarged defense programs.
Devaluation has tended to raise the cost of food imports into Europe and to make it even more necessaryto produce as much food domestically as is economically feasible. For a considerable time after devaluation,prices of wheat, butter, and probably some other foods were lower (in dollars) in several European food-import-ing countries than in some exporting countries overseas. To encourage increased domestic food production andto reduce imports at high prices, these countries may raise prices to their own farmers. Except where offset bychanges in price controls or other special arrangements, this would tend to raise farm income in comparisonwith that of other groups, and to encourage further expansion of food production in European food-importingcountries.
Eastern Europe and the Soviet Union
Agricultural production in 1950/51 will probably show an over-all increase over last year in spite of theseverely drought-damaged maize crop in the Danube basin. Substantial increases in industrial production andconsumers' real income are called for by national plans, which may, however, be altered appreciably.
Established plans in Eastern Europe call for continuous increases in total agricultural production, withproduction of grain 10 to 15 percent above 1949, of sugar 10 percent, and of livestock still higher percentages.In view of below-average 1950 crops in the Danube countries, it seems unlikely that these targets will be at-tained in 1951, except in Czechoslovakia and Poland. Should the need for foreign exchange to carry out indus-trial development or increased military production necessitate placing more food on export markets, requiringmaintenance of present low nutritional levels, food distribution controls might have to be reimposed orstrengthened.
In the Soviet Union, official reports indicate that the goals set for major crops in 1950 may be realized,with grain production reaching 127 million tons as compared to 124 million last year and 119 million in 1940.This would provide potential grain exports of possibly 3 million tons in 1950/51. Livestock production, whichstill shows a serious lag, seems likely to be appreciably improved in 1950. For the 1950/51 consumption year,continued improvement in the food situation appears likely, with larger supplies of meat, milk, fats and oilsallbadly needed to improve the balance of the average Russian diet.
Potential buying power for agricultural products in Eastern Europe will continue to grow in 1950 and 1951if planned yearly increases are realized, ranging from 10 to 18 percent in national incomes and 15 to 25 percentin industrial output above the prevailing very low levels. Wages, which have recently increased more rapidlythan productivity in some countries of the region, may not advance in proportion to productivity next year.Food supplies, except cereals and potatoes, are not yet adequate to satisfy consumer demands at controlledprices. The result is that prospective increases in food production could be readily absorbed at existing pricesor at higher prices if controls were abandoned.
Prospects are broadly similar in the Soviet Union, with substantial increases in industrial output projectedfor 1950 and 1951. In recent years the Soviet Union has distributed increases in real buying power mostly inthe form of reduced prices for products and in enlarged supplies at fixed prices. Prices, especially those ofnonrationed goods, however, both in the Soviet Union and in the countries of Eastern Europe, are still generallyfar above the levels in most countries.
Latin America
The production of food, of industrial products for domestic consumption, and the volume of internationaltrade will all probably rise over the next two years. Per caput supplies of food in 1950/51 will probably beabout the same as in 1949/50 for most countries of the region. The gradual expansion in production facilities,both agricultural and industrial, should provide work for the growing population, increase industrial output percaput, and stimulate a still larger inflow of investments to most parts of the region. Farmers' real income willprobably continue to grow.
4Economic Commission for Europe, Economic Survey for 1950.
14

With normal weather conditions, 28 million metric tons of cereals (wheat, rye, barley, oats, maize) may beproduced in 1950/51, 15 percent above last year's poor crop.
Argentina's production of wheat for 1950 is estimated to be 5 percent greater than in 1949. This indicatesan increase of 50 percent in the amount of wheat which could be exported. But production in the other LatinAmerican countries taken together is estimated to be 8 percent lower than in 1949. Thus,,if the available sup-ply in these countries is to be maintained at the same per caput level as in 1949, their imPorts would have tobe substantially larger than in 1949.
Owing to the almost complete failure of the current Argentine maize crop, it is expected that none will beavailable for export during 1950. This will seriously affect non-dollar coarse-grain supplies for Europe in1950/51. A record rice crop is now being harvested, more than twice prewar, and continued high production isbeing sought. Sugar production has been at high levels, and so have exports, especially since the Korean out-break.
production and export of meat from Argentina and Uruguay in 195 0/51 will be reduced below those of lastyear by severe droughts in 1949/50. In other countries, livestock numbers are gradually increasing. Averageper caput domestic consumption of meat and livestock products will at least be maintained in 1950/51.
The improved financial position of several countries, resulting from rising demand in North America andEurope and from rising or well-sustained prices of most export products, should be supporting factors in1950/5 1 and 195 1/52. Latin America has improved its dollar position by restricting imports while continuingexports, and has regained its prewar position as a net earner of dollars.
The Argentine foreign-payments position has been temporarily eased by a dollar loan. Production for theinternal market has been expanding steadily. Although Argentina has announced a plan to place more emphasison stimulating agriculture, and government controls on prices and the distribution of farm products have beenrelaxed somewhat, it is too early to judge what effect these actions may have on farm production for export.
Africa
Prospects for food production in 1950 in the region as a whole are better than in 1949, when severedroughts reduced production in South, Central, and parts of West Africa. Meat production, however, is stilloutstripped by demand, which has greatly increased with European immigration and the rising urbanization ofnatives. Competition of such cash crops as tobacco and oilseeds with crops for domestic consurnption is like-ly to remain serious, aggravated by the postdevaluation increase in prices of export products and the strongdemand for these products in the non-dollar area.
In French North Africa, cereals production seems likely to be slightly below the excellent 1949 crop.Pasturage throughout this region is reported to be excellent. A record rice crop is reported in French WestAfrica. In the Gold Coast, active measures are being taken to increase food production and stocks to combatrising food prices in urban areas. In South and Central Africa, 1950 cereals production will probably be wellabove the previous drought-stricken year and will about cover the cereals requirements.
Removal of restrictions on the manufacture and sale of white margarine in the Union of South Africa mayincrease consumption of locally produced oilseeds. The various agricultural development schemes appear tobe making slow but steady progress, except the East African Oilseeds Production Scheme, which again hasbeen delayed by drought.
In the Union of South Africa, production of mineral and manufactured products, stimulated by devaluation,is expected to rise steadily, and farm income will be substantially higher. In the rest of Africa, including boththe regions of commercial and of self-sufficient agriculture, only a gradual increase in the real income of agri-culture seems likely, though the inflationary effects of devaluation may produce a substantial increase inmoney income.
Near East
Improved harvests, particularly of cereals, are expected to increase the 1950/51 supply of agriculturalproducts in the region as a whole. Except in countries where devaluation may increase returns to producers ofexport crops, the prospects for dern and are generally uncertain, because of internal economic stagnation inmost countries.
Increased grain crops are expected in 1950, except in Lebanon and Egypt. Wheat sowings are no longer
15

enforced in Egypt and cotton has expanded greatly at the expense of wheat. Average consumption of cereals inEgypt during 1950/51 may be reduced unless more can be irnported. In Iraq, combined barley, wheat, and riceproduction is expected to be about one-fifth above last year's. Iran's wheat and barley crops are expected to-gether to increase by about one-third. In Israel, the agricultural targets for 1951 aim at doubling the cultivatedarea of 1949, but, with a swollen population and a tight food supply, food rationing is likely to continue.
Recent trends toward rising trade barriers, declining investment, and economic stagnation in manycountries may continue, unless reversed by the temporary market for exports outside the region. These trendsare illustrated by Egypt's difficulties in disposing of surplus rice; the accumulation of pulse and oilseedsstocks in Turkey; Iran's difficulties in selling exports since the devaluation in other countries; Iraq's recentlyimposed customs duties on both imports and exports and its ban on imports of edible oilseeds and vegetableoils; and the dissolution in March 1950 of the Syro-Lebanese customs union.
The volume of agricultural production promises to be higher in 1950 than in 1949, and might expand furtherin the next few years. However, low internal markets may cause surpluses and further drops in agriculturalprices, while prices for farm requisites may remain relatively high as governments continue to restrict their im-ports to save foreign exchange.
Turkey has better prospects than most other countries of the region and is vigorously expanding its pro-duction and economic activity, while Egypt may benefit from a rising demand for its cotton exports.
Far East
Barring further unfavorable weather conditions later in the main crop areas, production in 1950/51 may besomewhat above 1949/50. Per caput food consumption, however, will still remain below prewar. The outlookfor a good export demand is much brighter, but internal demand for commercial crops is uncertain. In the Indiansub-continent, in Indonesia, in Japan, and perhaps in China there are possibilities for more rapid improvementin industrial and agricultural activity and incomes. In some other regions guerrilla warfare still limits economicprogress, and the Korean war is causing heavy destruction and disruption of production.
The expectation of slightly better Asian food supplies in 1950/51 is based on:Large crops in Thailand and the Philippine Republic. The Philippine Islands, however, will need to
continue some rice imports this year to bring per caput consumption up to prewar levels. The 1950/51 sugarcrop in the Philippines is expected to be more than 25 percent larger, increasing exportable supplies to neartheir prewar average.
Expected increases in food crops for domestic use and export in Ceylon, India, Indonesia, Japan,Malaya, and Pakistan. India is expected to eliminate most of its former grain imports by a substantial increasein the production of domestic food grains. The other countries in this group, however, are expected to continuefood imports at about the same level as last year.
The possibility of increased production in 1950/51 over 1949/50 in Burma and about the same levelof production in Indochina, despite continued civil disorders in these areas. Producrinn in these two rice-exporting countries, however, will still be substantially below prewar.
On the other hand, in spite of an active campaign to increase food production in China, reported midsum-mer floods in Northern Anhwei Province, Kiangsu, and other areas indicate that the improvement, if any, inwheat, rice, and secondary crops will be less than hoped for. And, the probable loss of a substantial portionof the Korean rice crop will create a serious domestic supply shortage in addition to wiping out any possibleexportable surplus such as Korea had last year.
Fnless disturbances growing out of the hostilities in Korea disrupt shipments from other countries, thedemand for farm products in 1950/51 and 1951/52 will be aided by the expanding demand for raw-material ex-ports both to dollar and non-dollar countries. Subject to the same limitations, trade should expand within Asia,especially between Japan and other Asiatic countries.
The end of civil war on the Chinese maintand and improved economic relations between India and Pakistanindicate the possibility of_more rapid improvement in production and trade in these countries.
Declining U. S. economic aid to Japan and che Philippines has created problems of readjustment for thesecountries. Upset conditions, guerilla activities or open warfare in extended regions of Asia, continue to hampereconomic progress. The increase in industrial output is slow in most countries. In the leading industrialcountries (Japan and India) much re-equipment and readjustment to changed markets is needed for further sub-stantial growth.
16

Aside from the regions dealing in commercial exports, agriculture and food consumption in Asia is often amatter of local self-sufficiencyhandicraft products are exchanged for food in the local markets. Given securi-ty and order, production and consumption can expand in these regions with little regard to the world economic
situation. Similarly, crop failures and famines can occur in specific areas without neighboring areas being ableto help because of lack of transportation. Production and standards of living can increase as rapidly as invest-ment and economic development can provide new facilities for transport, communications, and commerce. But,political and economic insecurity have limited investment and development as well as production.
Oceania
Australia. Agricultural production seems likely to be on about the same high level as last year, with wooland dairy production inc-reasing appreciably. The demaad for farm products, both for export and for domesticconsumption, will continue to increase, with active export demands for all available products, except possiblybutter. High and rising industrial activity and income are expected, with the prospect that farm income will in-crease substantially both in money and in real terms.
Grain acreages for the 1950/51 harvest are expect2d to be about the same as last year, and moisture con-ditions so far have been favorable. Livestock nurnbers have been increasing gradually in sheep and dairycattle, but declining in beef cattle. With favorable pastures, production of milk and dairy products is likely toincrease about 5 to 10 percent in 1950/51, and the wool clip is expected to be larger, with sales at higher
prices than in 1949.Sugar production also is expected to rise further, as a result of profitable assured prices under a new
seven-year purchasing agreement with the United Kingdom.Australia is one of the great potential sources of increased non-dollar raw-material exports. It has gained
sharply from improved terms of trade since devaluation. With stable government, highly developed agriculture,rapidly expanding population (the result of natural increase and immigration) and modern industry, it is growingsteadily in production and standard of living. Australia's close ties with Western Europe, its forward salescontracts, and its price-stabilization measures all help ro assure markets for its expanding production.
Grain export prices have risen in Australia until they are now about in line with prices in other exportingregions,but weighted average prices paid to farmers are about one-quarter lower because of contributions to thestabilization fund and because prices for domestic consumption are below those of world markets. Meat pricesare still relatively low under the advance purchase contracts, but wool prices are very attractive. Under theseconditions, the incentive to Australian farmers to expand wool output is larger than to expand wheat or meat.Given continued favorable rainfall and weather conditions, Australian farmers seem sure of several years of
even greater prosperity than in recent years.
New Zealand. The government is encouraging expansion of crop production by increasing producer pricesand lifting price controls. Livestock numbers are increasing, and dairy production ,will probably continue to in-crease in 1950/51.
PROSPECTIVE WORLD TRADE, 1950/51 AND/951/52
Prospects are good for an expansion in total world trade over the next year or two. The total volume oftrade, which was slightly decreased by the reduced volume of U. S. imports in 1949, will probably be over 10percent larger in 1950/51, and should continue to increase in 1951/52. Agricultural exporting countries in thenon-dollar regions have expanding export markets in general, with attractive prices for their products comparedto those of industrial products offered in repayment. And farm-product exports from the dollar regions shouldincrease as dollar availabilities rise with expanded U. S. military expenditures and general imports.
Farm products make up a substantial portion of the raw materials imported by Europe from dollar countries.A large and increasing proportion of those imports has been financed by ERP and other dollar contributions.Dollar scarcities have put increased pressure on European countries to cut their imports from dollar countries,especially in 1949; the cuts were carried out and inten.sified by import controls and devaluation. Further re-ductions had been planned for 1950/51. As matters now stand, however, dollar returns from exports to the
17

United States and other hard-currency countries will be appteciably larger in 1950/51, and there may also beconsiderable dollar earnings in connection with the expanded military assistance program. These dollaravailabilities should lessen the pressure for saving dollars and modify the determination of many countries tomake further cuts in their purchases from hard-currency areas.
U. S. appropriations for various aid programs in 1950/51, including ERP, are close to $4,000 million,plus almost $250 million unspent from the previous year's appropriation. This total comes to within $500 millionof actual U. S. foreign-aid disbursements in 1949/50. Including disbursements out of an additional $4,000million for mutual defense assistance, combined total U. S. expenditures abroad in 1950/51 may be up to orabove those of 1949/50,
U. S. imports in the first half of 1950 exceeded the value of those in the first half of 1949 by 10 percent.Import values will increase further in 1950/51, and may exceed those of 1949/50 by $1,000 to $2,000 millionby 1951/52. Loans by the International Bank and the Export-Import Bank in 1950 have been running abovethose of a year earlier, and this increase may continue into 1950/51. Altogether, total dollars available fromall sources in 1950/51 may be substantially larger than in 1949/50. While this may be offset to some extentby higher prices of U. S. exports,the total pressure of dollar shortages may be definitely less in 1950/51 than in 1949/50.
Trade between non-dollar countries will probably continue to expand. The improved intra-European pay-ments scheme, coupled with a further decrease of quantitative trade restrictions, should enhance the prospectsof continuing the still rapidly growing intra-European trade.
A major factor influencing the future of intra-European trade is Germany, which reappeared towards theend of 1949 as a major importer of European supplies, predominantly foodstuffs. Germany had a heavy tradedeficit in 1949, and early 1950 figures indicate a sharp curtailment of German imports from the U. S., whileother imports continued to expand. Industrial exports froto Germany to European countries, which rose onlymoderately in 1949, increased strongly in the first quarter of 1950.
The volume of imports of Eastern European countries and the U. S. S. R. from Western Europe increasedsomewhat more rapidly in 1949 than did trade within Europe as a whole, but reached only 63 percent of prewar,as compared to 88 percent of prewar for total European trade.5 The prospects of removing obstacles to east-west trade in Europe are rather_gloomy.
Intra-Asian trade shows some signs of further expansion, with the easing of tension between India andPakistan and greater supplies coming from the recovering Japanese industrial production if political ormilitary disturbances elsewhere do not prevent.
Trade among the Latin American countries was traditionally quite small but increased sharply during thewar period and remained at a somewhat higher level through 1948. A sharp contraction occurred in 1949, mostlyowing to Argentina's import restrictions. In 1950/51, domestic supplies of food will be somewhat larger anddollar availabilities will be substantially larger because of improved export markets. In consequence, theregion will probably continue to depend largely upon imports from outside the region, rather than appreciablyexpanding intraregional trade.
Trade between metropolitan areas in Etrope and their dependencies, particularly in Africa, should con-tinue to improve as the dependent territories expand their raw-material exports. The Union of South Africa,on the other hand, although greatly profiting from higher gold prices ( in terms of sterling), intends to holddown imports to 20 percent below the level of the first half of 1949 and to keep imports from hard-currencysources even lower.
Within the framework of an expanding world trade, trade in agricultural products is likely to increase also,but less rapidly than the total. Before the Korean development, many importing countries were planning toreduce food imports and to depend more on domestic production co maintain consumption. This appliedgenerally to bread grains and sugar in Western Europe and to rice in India, Indonesia, the Philippines, andeven China. In addition, Western European countries planned to import more coarse grains and to expandbread-grain imports from soft-currency areas. Lessening dollar shortages may modify some of diese programs.
The same general pattern of expanding world trade will probably continue in 1951/52, if political ormilitary disturbances do not intervene. The physical ability of non-dollar exporting areas to satisfy theexpanding raw-material needs of Europe may, however, be a limiting factor in the growth of trade.
Immediately before the Korean war, two basic adjustments appeared necessary if international trade
5ECE, Economic Suruey of Europe in 1949 (Geneva, May 1950), pp. 75 and 90.
18
difficulties, particularly the dollar shortage, were to be overcome. The first adjustment was for WesternFurope to reduce its direct dollar deficit with the U. S. It seemed that this would be done more by reducingimports from than by expanding exports to the United States. Secondly, it appeared essential that WesternEurope expand its exports to other overseas countries so as to remove the need for making net dollar pay-ments, and come to earn dollars from such countries. This last adjustment may well be aided appreciably bythe economic developments arising out of expanded armament programs. On the one hand, the raw-materialand agricultural exporting countries should be earning more dollars because of higher U. S. imports andprices; and, on the other, these countries may look to Western Europe for more industrial goods, as U. S.prices becotne comparatively higher and as the U.S. milita.ry program ctrtails the amou_nt of such goods avail-able for export.
The first adjustment may be modified, since Western Europe may now be able to expand its exports to theUnited States to a greater extent than was thought feasible earlier. But, the curtailment of Europe's importsfrom the United States would s till be limited by the inability of non-dollar countries to expand their exports,especially of food and other agricultural products.
Substantial expansion of dollar investment in underdeveloped countries would enable Europe, throughtriangular or multilateral trade, to continue more of its imports of raw materials from dollar countries, thuscreating another possible solition to the longer-term economic problem. No sign of a substantial expansion ofinternational dollar investment, however, is yet in sight.
19

PART II. OUTLOOK FOR SELECTED COMMODITIES
FARM PRODUCTS
Grains
The principal features of the grain year July 1949/June 1950, as compared with 1948/49, were (1) aslight decline in total world production, most of it occurring in the world maize output, largely owing toreduced crops in the United States; (2) a reduction in the volume of grain exports, owing for the most part toa substantial contraction in wheat shipments from the United States; (3) an increase in end-of-season stocksin the United States, particularly of wheat, but li,cle net change in wheat stocks, and a decrease in coarse-grain stocks in the other major exporting couni.e. ; (4) relatively little change in terms of U. S. dollars in theprices of "free" wheat (i.e., wheat sold outsicie the International Wheat Agreement); and (5) the first year'soperation of the International Wheat Agreement, under which about half of the total world wheat exports movedat a price significantly below the free-market price.
Production. The main difference in production between 1949 and 1948 occurred in North America, whereall grain crops were smaller; the decline, however, was from the exceptionally high levels of 1948, and thetotal harvest was still considerably above prewar leve- . In Europe the grain crops, particularly bread grains,made another advance without quite recovering the prewar average. Not all countries shared in this improve-ment, but there were notable increases in some of the principal grain-importing countries, especially WesternGermany and Italy, while France for the first time since the war became a net exporter of wheat. In Asia,increases in India and Pakistan were more than offset by reductions in China and Turkey. In South Americathere was little change in wheat output and a decline in coarse-grain production owing to an unusually poormaize harvest in Argentina. In Africa there was little net change. In Oceania, bread-grain results weresatisfactory. Australia harvesting its third su cessive good wheat crop, while coarse-grain output was wellmaintained. In the U. S. S. R. it was reporten that total grain production increased again in 1949 and thatbread-grain areas are now larger than in 1934-38.
For t world as a whole (excluding the U. S. S. R.), total grain production, despite a decline of about5 percent from the 1948 level, was some 12 percent better than the 1934-38 average. While this net improvementcarried the world total above earlier prewar years, production in the postwar years in all regions except NorthAmerica has been smaller than the prewar average (or only slightly better), resulting in a less satisfactorybalance of production with regional requirements.
International Trade. Total grain shipments declined from 38.1 to 35.8 million tons. Exports of wheat andwheat flour fell from 27.0 to 23.0 million tons, almost 15 percent. Wheat shipments from the United States werereduced by 40 percent, other sources showing a slight net increase. Coarse-grain exports increased from 10.2to 11.4 million tons, sources other than the four major exporters increasing their shipments by 2 million tons.
On the import side, decreased takings by European countries account for nearly all the contraction intrade. This decline resulted from an increase in European bread-grain production in 1949 and the somewhatmore adequate stock position resulting from the high imports of the preceding year. It was to be expected thatpurchases would be reduced first from hard-currency sources.
Asia showed only a slight decline in its 1949/50 imports, though it was anticipated that better suppliesof rice and efforts to _stretch domestic grain supplies in some countries would result in an appreciable reductionfrom the 1948/49 level. Imports into Africa were somewhat smaller in 1949/50, owing to better crop results inNorth Africa, which, after several years of net imports, again became a grain exporter. In the remainingregions, changes were relatively small.
20

Carryover Stocks. On 1 July 1950, stocks of wheat in the four principal exporting countries were estimat-ed at 783 million bushels (21.3 million metric tons), an increase of 15 percent over the previous year, owinglargely ro an increase of 109 million bushels (2.9 million tons) in U.S. carryover stocks.
Wheat stocks have been increasing since the postwar grain scarcity and were larger at the end of the1949/50 crop year than at any year-end since 1933, except for the war years, when the curtailment of tradecaused heavy accumulations. This increase, and in particular the addition made in 1949/50, had been regard-ed by some observers, before the outbreak in Korea, as the sign of a return to wheat surpluses characteristicof many years in the thirties. There are, however, several qualifying features in the current situation whichdifferentiate it from the prewar period. Among these are the larger volume of international trade in wheatsince World War II and the limited extent of stock rebuilding in importing countries. The bulk of the carryoveris in the United States, stocks elsewhere being of moderate volume and scarcely large enough to provideagainst reduced harvests. Most of the United States carryover is owned or controlled by the Government aspart of its price-support program, and does not have a depressing influence on prices. Finally, even ifUnited States wheat exports should continue to decline, it seems unlikely, owing to the smaller 1950 crop,that U. S. stocks will be increased in 1950/51.
Stocks of coarse grains in the four major exporting countries on 1 July 1950 were somewhat smaller thana year earlier, but very large in relation to che volume of trade in recent years. The bulk of these supplies(mostly maize) is also in the United States, in government-controlled stocks. Supplies of coarse-grains otherthan maize (and particularly of maize in Argentina) were smaller than a year earlier.
Prices. Average prices of wheat in 1949/50 were not xvidely different from those of 1948/49 in NorthAmerica. In the United States, the determining factor was the support price which, in years of adequate supplysuch as 1948/49 and 1949/50, serves as a floor. Since the United States is the largest exporter of wheat,U. S. price support also has an important influence on world wheat prices. In Canada, too, there was littlechange, in terms of local currency, in average prices for the two years, although, in terms of United Statescurrency, Canadian wheat since devaluation has been at a discount. Australian "free" wheat export prices,in terms of Australian pounds, have advanced substantially since devaluation, but were firm in terms ofUnited States dollars . In Argentina, export prices reported for transactions in 1949/50 closely approximatedfree-wheat prices for export from other sources.
Much of the wheat exported in the past year was so/d either under bilateral agreements or under theInternational Wheat Agreement at prices different from those in open-market quotations. The selling price forWheat Agreement wheat was, for the most part, the maximum in the price range specified in the AgreementUS $1.80 per bushel. In the United States, this involved a government subsidy to the export rate of 50 centsor more per bushel. In the other exporting countries, no special arrangements were required, since exportsales are made by goverment selling agencies.
In the majority of importing countries, wholesale or producers' prices of wheat and other grains continuedto be fixed by governments. In general, these official prices were about the same as in 1948/49.
7'he International WIteat Agreement. The Wheat Agreement, concluded in 1949, went into operation on1 August 1949. The total number of countries adhering to the Agreement, including those which have joinedsince its operations began, reached 43 in mid-1950; 4 were exporting members and 39 importing members.Total quotas of exports and imports accepted by member countries for 1949/50 amounted to about 14.3 milliontons. Actual transactions in the first full year of operations were expected co total nearly 12 million tons,representing about 52 percent of total world wheat exports in 1949/50. Transactions were generally made atthe maximum of the Agreement's specified price range (I1S S1.80). This level is significantly below the exportprice for non-Agreement wheat, so it can he assumed that member importers benefited substantially thoughit is impossible to say at what level wheat would have been traded without the Agreement.
The exchange problem is reflected in IWA operations. Soft-currency exporters (Australia and France)were able to export virtually their entire quotas, while about 30 percent of the United States quota and 10percent of the Canadian quota remained unsold at the end of the first year. The currency issue may beexpected to have an important bearing on the future working of the Agreement: Importer members werereluctant co accept new accessions with large import quotas unless accompanied by limitation on the proportionof new quotas to be filled from soft-currency sources.
21

Outlook for 1950/51. The 1950 bread-grain harvest of the Northern Hemisphere will apparently show litt/echa.nge from that of 1949. The United States wheat crop is estimated to be only slightly above the 1,000-millierr-bushel mark, following planned restriction in acreage and a less favorable winter, but this decline was largelyoffset by the sharply increased Canadian wheat crop. In other regions, the reports point to crops as large orlarger than those of the previous year. Preliminary indications from Europe suggest some expansion in area;crop conditions in all the principal regions of the continent appear to have been favorable, but late reportsindicate some decline in condition because of excessive rain. In Asia, crops in India and Pakistan are reportedto be about the same as last year, while Turkey, a deficit country in 1949/50, and other Near Eastern countrieshave good crops. In Argentina, government encouragement and a higher price for wheat growers have resultedin a significantly larger area planted. In Australia, reports on sowings indicate an acreage only slightly belowlast year's.
Owing to the increased carryover in the United States, a larger Canadian crop, and increased acreage inthe Southern Hemisphere, it is likely that exportable supplies of bread-grain in the four major exporting countrieswill be somewhat larger than those of a year ago and ample in relation to probable import requirements. Pro-spective supplies of coarse grains are also large, but with a high concentration in the United States. Owing toits poor maize crop, Argentina will have little or none for export until the next crop becomes available afterApril 1951. Coarse-grain export possibilities from the Danube countries have been reduced by drought.
Prospects for grain trade in 1950/51 are not yet clearly defined. Before the Korean outbreak, some furthercontraction in wheat exports was expected, particularly from hard-currency sources, on the assumption thatgeneral economic and currency conditions would prove broadly similar to those of 1949/50, with possibly somecurtailment of United States financing of food exports, and that harvest prospects in importing countries wouldbe realized. On the other hand, any price change in favor of grain importers, or the improved availability ofhard currency, might have been expected to produce a ready response in larger shipments. Coarse-grain demand,in these circumstances, however, would probably prove more elastic than that for wheat. The principal operativeprice factor, however, is the United States support price for 1950 crops, which has been determined at a levelfractionally higher than that of 1949. The support price, together with the restrictive provisions against dis-posal of government-held stocks, pointed toward the maintenance for some time of present levels. Legislativechanges embodying a modification of present export policies, such as a subsidy program going beyond that nowassociated with Wheat Agreement sales or a widening of export financing by the United States, might haveaffected profoundly the volume of exports, but it appeared unlikely that such changes could occur in time tohave any substantial effect on 1950/51 movements.
The Korean hostilities, and the consequent changes in the world economic situation, may modify theseearlier expectations. Importing countries may increase imports to increase their security stocks. No significantbuying for this purpose has yet come to light in the grain market, though stock levels in importing countries arestill below what was previously regarded as normal. Increased import requirements might also be created byreduced domestic bread-grain procurement in importing countries, such as could result from a tendency amongproducers to retain larger quantities on farms in anticipation of higher prices or for livestock feeding. Improvingdollar availabilities may also increase the willingness of Western European countries to buy from hard-currencyexporters.
These factors are now latent in the world grain market; their strength will be determined by developmentsin the general international situation.
Rice
World rice production was about back to che prewar level in 1949/50, with increased areas and productionin India, partial crop failure in China, and bumper crops in Malaya, the Philippines, and Thailand, but worldconsumption per caput continued low. Because of the low level of supplies in Southeast Asia, world foreigntrade in rice remained at about two-fifths of the prewar volume. With rice continuing far more expensive thanwheat, Far Eastern imports of wheat were maintained at high levels despite currency difficulties, while netimports of rice into the Far East almost disappeared. Increased Far Eastern production and imports of wheatand coarse grains, however, compensated partially for the decline in the region's per caput rice supplies inrelation to the prewar per caput level of consumption.
In India, weather in most areas was favorable and a country-wide food-production campaign was conducted.
22

Rice production increased, although apparently not to the same extent that the rice area was expanded.Certain basic changes in India's crop-reporting system, however, have made its statistics of current productionnot strictly comparable with those for previous years.
In the absence of official crop statistics, the extent of rice losses in certain provinces of continentalChina, due to adverse weather, floods, and civil war, cannot be ascertained with any degree of accuracy, butfamine conditions were reported over wide areas.
Postwar recovery of production in the "rice bowl" areas of Southeast Asia suffered a setback in 1949/50.In Burma, normally the largest rice-exporting country in the world, the continuation of political unrest andmilitary operations have adversely affected this year's harvest. In Indochina, where conditions are similar tothose of Burma, production remained well below prewar. Unsettled conditions prevailing in the interior ofBurma and Indochina account for the provisional nature of the current harvest estimates of these two countries.Nevertheless, it would appear reasonable to assume that the crop decreases in Burma have outweighed theproduction gain in Thailand, which harvested another bumper crop in 1949/50.
Record crops are reported to have been harvested in the United States and in Colombia, Mexico, andseveral other Latin American countries. Production gains in the rice-surplus countries of the Western Hemis-phere have been greater than crop reductions in Egypt and Italy, brought about by a lessening of the areaplanted.
Although world exportable rice supplies in 1950 may exceed the 3.5 million tons exported in the precedingyear, high prices and payment difficulties may limit 1950 world exports to about the 1949 level, with the volumeof rice supplies entering international trade remaining, for three years running (1947-49), practically static at alevel 60 percent below prewar. The proportion of world output entering international trade may be only 4 percentin 1950, as compared with the prewar average of 9 percent. Despite the serious shrinkage in volume, the valueof world rice exports is likely to remain at least twice as high as prewar.
The Far East's share in world exports of rice rose steadily from 63 percent in 1947 to 71 percent in 1949,whereas imports within the region reached a peak in 1948 and declined thereafter. Although the volume of ricetrade was well below the reasonable requirements of the region's growing population, the year 1949 marked thebeginning of a transition from the previously existing seller's market.
Present indications are that, with the recently reported improvement of the internal situation in Burma,exports of rice from Southeast Asia in 1950 may be maintained at the previous year's level of 2.5 million metrictons. If that happens, exportable supplies of rice in the Far East would more or less balance with the current-ly estimated regional import requirements. This precarious balance may, however, be upset by direct and in-direct effects of the Korean conflict. Although the Korean people are accustomed to a mixed-cereal diet, riceneeds in South Korea may be quite considerable in the coming winter. However, the Korean conflict hasseriously inflated prices and caused widespread hoarding of marketable rice supplies. Food-deficit countriesof the Far East are likely to be faced with increasing difficulties in the coming months in procuring rice importsto meet their ration commitments. If these trends continue unchecked, Far Eastern import requirements may-exceed rice supplies available for export in 1950.
Major changes in the direction of international rice trade in 1950 may be attributed to the drastic reductionof India's import demand, the virtual withdrawal of China as an important buyer of the Southeast Asia surplus,and the entry of Japan into the Far Eastern rice market for substantial imports. The improved position ofdomestic rice supplies, as well as the prospect of securing adequate imports of wheat on relatively advantageousterms, enabled India to limit its rice imports in the first half of 1950 to small shipments from Burma and Thailand.On the other hand, in order to reduce its dependence on American cereal supplies, Japan found it necessary toget substantial rice imports from Thailand and Burma in exchange for industrial products. The probability ofJapan's supplanting India as the world's largest importer of rice in 1950 has not only reduced the likelihonc' ofundisposable rice surpluses accumulating in the Far East, but also even before the outbreak in Korea, helpedto maintain export prices of rice in the Far East at their postwar peak. These factors may be a step inthe development of a new pattern of foreign trade in Asia.
Outside Asia, reduced import demar,d has reportedly led to a piling up of rice stocks in the exportingcountries, especially where payments in c'ollars and other hard currencies are required. Substantial gains inexportable supplies in the Western Hemisphere have also cause.' a reduction of price quotations in both theWestern Hemisphere and the Near East. Nevertheless, export prices of common qualities of rice in terms ofU. S. dollars remain well above the ruling prices of wheat in the world markets, running about one and a halfto two times wheat prices.
23

In the Far East, the landed cost of imported wheat, irrespective of source, continues well below that ofrice imported from within the region. The wide price disparity,plus the shortage of foreign exchange, contribut-ed in 1949 to record imports (6.7 million tons) of wheat and coarse grains into the food-deficit countries of theregion. Although prices favor wheat imports, the balance-of-payments problem imposes a limit on supplies thatcan be purchased from Western Hemisphere sources.
Domestic prices of rice, especially where controlled, are also below export prices. The rice-importingcountries using rationed distribution have paid heavy subsidies to equalize retail prices of domestic and im-ported rice.
Outlook for 1950/51 and 1951/52. Barring widespread crop failure in any of the major rice-producingcountries, world production may exceed prewar in 1950/51 qnd continue to expand in 1951/52. However, ricewill probably continue relatively short compared with other grains, and relatively high prices for rice willprobably continue, especially in soft-currency countries.
The expansion of rice area in India by extension of irrigation, double-cropping, and reclamation of culti-vable wasteland is likely to continue in the coming years. Production may also show a corresponding increase.The partial Chinese crop failure in 1949/50, coup,.ed with cessation of military operations on the mainland ofChina, has reportedly stimulated increased sowing of rice in 1950/51, but severe floods have again been re-ported in some of the producing areas. Press reports indicate that steps have been taken to bring immediatelyunder the plow all available fallow or cultivable wasteland in the country. In coming years there may be an ex-pansion of production in Indonesia, Malaya, the Philippine;, and a further shift from jute to rice in EasternBengal (Pakistan).
Rice area in Thailand has been increasing at a greater rate than production. Any further expansion ofarea and yield in this country depends upon the development of transport facilities and water-control systems.Recovery of rice area and production in Burma, Indochina, ana Korea is highly problematical as long as civilconflict continues.
The Korean conflict and the uncertain Far Eastern sttuition probably will reverse the trend toward riceacreage restriction in non-Asiatic exporting countries, which until recently were faced with the difficulties ofsurplus disposal. In Brazil, the largest producer in the Western Hemisphere, production of rice may continue toincrease, but only a small proportion of the output is likely to be made available for export.
The low level of supplies in the "rice bowl" areas of Southeast Asia; high export prices of rice, andlimited foreign exchange resources for purchase of cereals from the Western Hemisphere are all tending toaccelerate national self-sufficiency programs in the Far East. These programs aim at holding down rice con-sumption to the current level until domestic production can be increased by further expansion of rice area andby raising yields through a large number of relatively minor irrigation and land-improvement projects. India has,in fact, set a definite target for the attainment of self-sufficiency in food grains after 1951, though selectiveimports to build up domestic reserves may continue for some time thereafter.
Rehabilitation of the rice industry of Southeast Asia depends on the dessation of military operations andon the restoration of law and order in rural areas. Mere recovery of production in the surplus areas would not,however, be enough to restore the international rice trade to its prewar level. Domestic consumption in thesecountries is increasing with the high rate of population growth. Production would have to expand well abovethe prewar average and rice would need to sell at prices competitive with wheat before international trade couldbe restored to the prewar volume. The food-deficit countries of the Far East cannot restore their per caput riceconsumption to the prewar level with anything like the prewar scale of imports. Expanded domestic supplies ofrice and other cereals has therefore become a matter of highest priority in national economic planning. In fact,some of these countries have already embarked on large-scale irrigation and land-improveme-nt projects, whichare likely to be completed and productive in the not too distant future.
Livestock Products
The most notable change in the livestock situation during the past year has been the marked increase inoutput of livestock products chiefly milk and pig meat in most European countries. This increase wasachieved as a result of good pasture conditions and price relationships favorable to producers. In other im-portant livestock areas there has been generally a continued high level of output. Argentina suffered a setback
24

from drought, and liquidated some livestock in late 1949 and early 1950. This measure temporarily increasedmeat output but reduced subsequent production.
eat. On a world-wide basis, production of meat in the past year was significantly above the volume pro-duced in 1948. The major increase was in European countries, where pig production was rapidly acceleratedas more concentrate feeds became available from domestic production and imports. In Western and CentralEurope, total production of meat in 1949 was about 20 percent above the previous year; the increase in pig meatalone amounted to 45 percent. The expansion was particularly outstanding in Belgium, Denmark, Netherlands,and Western Germany, where the gains over 1948 ranged from one-fourth to one-half. Yet, meat output inWestern and Central Europe in 1949 was still only about 80 percent of the prewar volume. Western Germanyand Austria, each with an output in 1949 less than 60 percent of prewar, had the lowest output in the grouprelative to prewar volume.
Less information is available from Eastern Europe, but apparently favorable feed supplies have alsoencouraged a rapid expansion in pig meat there. In Poland and Czechoslovakia, pork output was about 30 to40 percent above the preceding year, and in all the Eastern European countries (excluding U. S. S. R.) produc-tion of total meat in 1949 appears to have been about three-quarters of prewar.
In the principal meat-producing areas outside of Europe, high levels of output were generally sustained.Production of all meat in the United States was up slightly over 1948, whereas in Canada there was a smalldecrease. In both of these countries, however, production continued about 35 percent greater than the prewarvolume.
Production of meat in Australia in 1949 was slightly higher than a year earlier, and about at the prewarvolume; New Zealand's output has changed very little in the last three years, but is 10 to 15 percent aboveprewar.
In the major meat-producing countries of South America (Argentina and Brazil), production in 1949 re-mained at about the 1948 level, but in Uruguay there was a substantial increase. Drought conditions in bothArgentina and Uruguay in late 1949 caused considerable liquidation of livestock, which temporarily increasedslaughter and meat production to a higher than normal level.
Dairy Products. As with meat, the major.gains in milk production in 1949 were in Europe. Pastures wereexcellent during most of 1949 and concentrate feeds were more readily available than in any other postwar year.As a result, output of milk in the Western and Central European countries increased by 16 percent over 1948and was near the prewar volume. The increase was especially notable in Belgium, Denmark, Netherlands, andWestern Germany, where the average gain in 1949 milk output was abouc 20 percent above 1948. From thescanty data for Eastern European countries it appears that production has made remarkable gains in the pasttwo or three years under the stimulus of good feed supply and price relationships favorable to producers.
In the United States and Canada, the output of milk in 1949 was about 3 percent higher than the previousyear and was about 15 percent above prewar. Australia and New Zealand also showed gains over 1948, and thevolume was somewhat above the prewar volume.
During the war and immediately following, governments emphasized greater consumption of liquid milk,and nearly all the important milk-producing countries in recent years have had a larger proportion of their totalmilk supply consumed in fluid form. Manufactured dairy products, however, are increasing from the low levelsof the early postwar years. The increase in butter output has been fairly general among the major milk-produc-ing countries. In 1949 the Western and Central European countries produced 20 percent more butter than in1948 (about one-half of the average increase in milk production in these countries was converted to butter);the increase in the United States and Canada amounted to 10 percent. Australia and New Zealand had a smallerincrease, 5 or 6 percent in 1949 over the previous year. Production of butter in Western and Central Europeancountries and in the United States and Canada in 1949 was, however, still 15 to 20 percent below the prewarvolume.
Cheese output also expanded in 1949, exceeding the prewar level in important milk-producing countries.In general, since the war, cheese production has expanded more rapidly than butter, but recently butter outputhas been increasing at a faster rate than cheese. Other manufactured products, such as condensed and driedmilk, also had an expanded output.
25

Trade. International trade in total meat in 1949 was only slightly above 1948 and considerably below theprewar volume. Increased exports by some of the surplus-producing European countries were almost whollyoffset by the decline in Argentine exports. The result is, for example, that imports of meat of all kinds intothe United Kingdom in 1949, although at the 1948 level, were only about 70 percent of prewar and of 1947.Trade in dairy products, on the other hand, was generally higher in 1949 than in the previous year, chiefly as aresult of increased exports of butter and cheese from Denmark and the Netherlands. The Netherlands alsoshowed a substantial increase in the export of processed milk, which largely offset the decline in exports ofcanned and dried whole milk from the United States.
Outlook. The first half of 1950 was an exceptionally good feed year in most of the important livestock-producing countries. Indications point to a substantial gain in the 1950 output of livestock products, bothmeat and dairy products, in European countries and continued high levels of output in most other areas. Pricesof livestock products have declined from previous very high levels, but are still generally remunerative toproducers; in some countries they advanced again after the outbreak in Korea.
In the Western and Central European countries, 1950 meat production is likely to be about 10 percentabove 1949 and about 85 percent of the prewar volume. Milk production in this area is expanding rapidly andwill be somewhat above the prewar level in most countries. Some small expansion in meat and milk output isexpected in the United States and Canada. The situation is similar in Oceania; New Zealand is having one ofits best years with respect to dairy production.
Because of the increased output of livestock products expected this year, some expansion in the volumeof trade is likely. The principal increase in exports will come from Denmark and the Netherlands, both ofwhich are expanding their trade in bacon and dairy products. In the countries outside Europe, no change islikely in the volume of exports. This is particularly true of Australia and New Zealand'. In Argentina there islikely to be a decline in total meat export. In Canada, exports of beef and veal to the United States are ex-pected to rise considerably above 1949.
The United States Government has accumulated rather large quantities of dairy products and dried eggs,purchased in the course of maintaining agricultural price supports. Because of exchange difficulties andrelatively high prices, these products have had no ready demand in other countries. The United States hassold some of them at concession prices and has disposed of sizable quantities through school-lunch programsand similar outlets, but it appears that the volume on hand at the end of 1950 will be very large.
The longer-range outlook points toward further expansion in the production of trade in livestock products.Prospective programs for extensive armament in many parts of the world, with fuller employment and generallyexpected higher consumer purchasing power, will increase the demand for most foods and especially for theprincipal livestock products. Prices, which have been generally favorable to livestock producers, are expectedto remain remunerative for some time. This should encourage a higher output of meat, milk, and poultryproducts in most areas.
Rising national income and imports in the United States and U.S. help to Western Europe will tend to in-crease dollar availability in soft-currency areas. This is not likely to result in substantial exports of livestockproducts from North America, but it may enable Western European countries to maintain their imports of sub-stantial quantities of feed grains frorn dollar areas, thus making possible a continued expansion in livestockproducts in countries where a high level of livestock output depends on feed from outside sources.
It would seem that any increase in demand for dairy products in North America or Western Europe islikely to be concentrated more on fluid milk, cheese, and possibly ice cream, than on butter. This would tendto reduce the proportion of milk going into butter, and this factor, together with some strengthening in thedemand for butter itself, should remove the difficulties of marketing butter at satisfactory prices, which, justbefore the Korean outbreak, seemed to be increasing in the United States, Canada, and some Western Europeancountries. Once the U.S. works off its older stocks of government-held butter and dried skim milk there is astrong possibility that goverrment-held stocks of these products will not be burdensome in the foreseeablefuture.
Increased economic activity in a large number of countries will likely bring about some increase in thevolume of livestock products entering international trade. There is the possibility of increased shipments ofcertain types of meat and cheese from soft-currency to hard-currency areas, particularly if U.S. prices shouldrise faster than those in some of the Western European exporting countries. On an over-all basis, however, it
26

seems to be doubtful that the volume of meat in international trade in the next few years will reach the prewarlevel; it is almost certain that the butter trade will remain below prewar volume for some time to come. Insuch major non-European exporting countries as Australia, New Zealand, Argentina, and Uruguay, the volumeof meat or dairy exports is not expected in the next few years to average much above the current level. And,there is the possibility that the rapidly increasing population in Australia may cause some decline in its ex-port of livestock products.
Fats and Oils
World production of fats and oils continued to expand in the 1949 calendar year. Consumption was nearerprewar levels than in 1948, and prices declined sharply in the early months, especially in dollar exportingregions.
Major increases occurred in Western European production, in U.S. production and exports, and in exportsupplies from Africa and Indonesia. Despite a reduced output of olive oil in Southern Europe, of linseed inArgentina, and of vegetable oils in India and Pakistan, total world production excluding U.S.S.R. was up morethan 3 percent. With about the same addition to stocks as in 1948, consumption also increased about 3 percent,bringing world per caput supplies up to about 93 percent of prewar, but these supplies were still very unevenlylocated as compared with prewar consumption patterns. Exports from the United States ard other hard-currencyareas continued far above prewar, and exports from soft-currency exporting areas were still, in the aggregate,much below the prewar volume. Except for the temporary setback in the olive-oil producing regions, per caputconsumption generally increased in 1949 and by the end of the year was approaching prewar levels, except inCentral Europe, the Mediterranean Basin, and Japan.
With increasing world supplies and a temporary decline in demand and imports in the United States, pricesof oils ard oilseeds fell sharply from the second half of 1948 to the middle of 1949 in such markets as Malaya,the Philippines, and the United States. After stabilizing somewhat, prices (in dollar terms) firmed or roseafter devaluation for copra and coconut oil, but stayed fairly stable to the errl of the year for most other oils.The 1948/49 price declines in soft-currency countries were generally less marked than in those with hardercurrencies.
At the time of devaluation, prices of fats in the dollar markets were in general about 50 percent belowthose of fats produced in soft-currency areas (reflecting the tighter supply position in the latter, relative toeffective international demands). Devaluation had no noticeable effect on prices of soft-currency supplies,since probably less than 5 percent of these are now shipped to dollar areas. Supplies from dollar countries,however, automatically became dearer in terms of the devalued soft currencies, thus closing most of the gapwhich had previously existed between the two types of market.
After devaluation, there was a certain amount of fluctuation in prices of soft-currency supplies, with aninitial slight downward tendency in whale oil and palm oil (reversed during the spring of 1950), and a slightupward tendency in copra and some other products. In the second quarter of 1950, U.S. prices showed a markedincrease, and reached levels by mid-1950 higher than those in the spring of 1949, particularly in soybeans.This partly reflected stronger consumer demand but was largely speculative and it is believed that most marketrequirements had been covered for the 1949/50 marketing season at a somewhat lower price level.
The relative scarcity of fats and oils in importing soft-currency regions was reflected in price levels inthe first half of 1950. In general, prices of soft-currency supplies of fats and oils as such (not necessarilyincluding raw materials) in domestic currencies were five to six times the immediate prewar level, whereasprices in the United States before the July rise were only 50 percent over the 1935-39 average for fats and oilsand about twice the prewar average for butter. Prices of actual oilseeds and copra (percent terms),however,were two to three times prewar inthe U.S. and Argentina, and nearly four times prewar in the Philippines.These higher seed prices reflected the stronger oilcake market.
(The six years prior to the war were rather abnormal for fats and oils, owing to the U.S. droughts of 1934and 1936; if 1924-28 is regarded as a more normal price period, 13rices in 1949 for soft-currency oilseeds andfats showed increases of 100 to 150 percent, compared with those within the U.S.A. of 25 to 100 percent).
During the first six months of 1950, fat consumption was generally maintained at about the levels reachedby the end of 1949, the principal exceptions being the United Kingdom, where edible-fat rations were sub-stantially increased and the decision was announced to terminate linseed-oil allocation and soap rationing
27

during the summer, and the Mediterranean region, where good olive-oil production in 1949/50 was sufficient tocover an increase in consumption and some reduction in the regional net import balance in fats and oils as awhole. This over-all improvement in supplies was achieved in spite of a modest decline in European purchasesof dollar fats, which was more than offset by better indigenous production of animal fats and vegetable oil,together with a slight net increase in imports from the non-dollar area, mainly Argentina. The removal of fatrationing in Germany late in 1949 resulted in little increase in consumption, which remained at about half theprewar per caput level owing to the high retail prices of fats, soap, etc., relative to the generally low level ofreal wages arid income.
Heavy stocks in Argentina (principally of linseed and oil), accumulated from 1947 onwards, were carriedforward into 1950/51. Linseed oil and butter stocks have grown considerably in the United States and Canada,but total holdings of other items are still much below the prewar level. United Kingdom and continentalEuropean stocks are being steadily restored to somewhere near the prewar levels.
Current Situation and Further Outloolc. Before the outbreak of hostilities in Korea, the outlook for 1950/51seemed to be a dualism of inadequate supplies with continued high prices in the soft-currency areas and ofample-to-surplus supply conditions in the dollar area, where prices of most fats and oils were below generalagricultural price levels. The smaller 1950/51 ECA appropriations, only partly offset by reductions in thedollar gap, presaged a contracting demand for dollar fats by the soft-currency areas. This would, it appeared,lead to "surplus" or curtailment of production in North America and the Philippines, to still higher prices inmost importing countries, and to the further expansion of oilseed production in Europe and some other regionswhere it would normally be regarded as anuneconomic use of agricultural resources. This would pose difficultproblems of future agricultural development and the use of scarce foreign exchange. Urnless domestic produc-tion of fats were thus further stimulated, or heavy allocations of hard currency were made for the purchase ofdollar fats, many soft-currency countries seemed to face the prospect within the next twelve to eighteen monthsof either reimposing rationing or of letting retail prices rise steeply, restricting supplies to the majority of lessaffluent consumers.
The outlook has now been changed by international developments following the Korea hostilities. As re-gards demand, there was a considerable amount of immediate precautionary buying by final consumers ratherthan by manufacturers and distributors. This initial nervousness has subsided but buying interest remainsstrong, reflecting the generally expected upswing in purchasing power. Prices of most fats and oils on bothsides of the Atlantic in early September were about 30 percent above the June levels, the principal exceptionbeing soybeans, the price of which had previously risen sharply. So far there has been little evidence ofstrategic stockpiling, but increased procurement of oils with a high glycerine content (coconut, palm, etc.) andof special industrial oils (castor, rape, etc.) is likely to take place when markets have become adjusted to thenew conditions.
There is no great change in the supply outlook, since the heavy prospective increase in the U.S. soybeancrop arrl the more modest increase in pig-farrowings and lard production have about offset the heavy cut in U.S.production of cottonseed and groundnuts and the smaller increases lately reported in Indian groundnut production.The announcement of an estimated heavy increase in U.S. soybean production caused no real price drop in U.S.markets, indicating the strength of the demand.
Of equal if not more significance is the probability of larger dollar availabilities abroad than seemedpossible before July, which might enable some soft-currency countries to purchase larger quantities of dollarfats, despite the 1950/51 cuts in ECA appropriations.
This might reduce the incentive to expand oilseed production in soft-currency importing countries and,combined with the stronger internal U.S. demand, might greatly expand the total demands on American and otherdollar supply sources. Prospective supplies of hard-currency oilseeds and other fats and oils may be none toolarge to meet such a total requirement, even after allowing for a drop in consumer purchases on account of theincrease in prices that may take place.
Sugar
The world sugar economy has been dominated by two distinct trends. Production increased steadily duringthe past few years and indications are that the increase will continue. An annual world production of 36 to 38
28

million metric tons within a few years is quite possible, as compared with 31.3 million metric tons (in terms ofraw sugar, and excluding the U.S.S.R.) in 1949/50. The demand for and consumption of sugar have risensteadily in many parts of the world, and no end of the increase is in sight. A substantial demand for refinedsugar has developed in many areas in which the prewar consumption was very low and consisted mainly ofprimitive types. In consequence of these developments, the world sugar industry -- including hundreds ofthousands of farmers and agricultural laborers is even more vulnerable than before the war. Its economicstability depends increasingly on the maintenance of an expanding world economy and on a solution of theinternational monetary and financial disequilibrium.
Review of 1949/50. The production of sugar during the year 1949/50 is likely to reach 31.3 millionmetric tons (raw value), as compared with 30.7 million tons in 1948/49 and the prewar average of 26.2 milliontons (all three figures exclusive of the U.S.S.R.). All continents shared in the production increase. Europeanproduction rose, notwithstanding the disastrous drought in Britain and France. In Asia, crops were generallyfavorable. The Latin American total was lifted by the extremely favorable outturn in Cuba.
Outlook. Although it is still too early to forecast production, weather conditions to date have beengenerally favorable, and present indications are that production in 1950/51 will be considerably higher thanlast year. Indeed, it is not impossible that world production may exceed the 1949/50 outturn by 1 to 1.5million metric tons.
The area devoted to sugar beets and cane has expanded, and newer and better-yielding varieties are beingconstantly introduced. Scientific production techniques are spreading, probably at a faster pace than in prewaryears. In the United States of America, improved profitability of sugar beets as compared with competitivecrops has resulted in a very large increase in the beet area. United States beet-sugar production may, in 1950,reach 1.6 million tons (the maximum quota established by the Sugar Act of 1948) for the first time since 1947/48and for the second time since 1940. Many European countries have expanded the area planted tosugar beets. In some places--notably in Germany, Austria, and some Eastern European countries--the expansion is substantial. European countries which greatly expanded their sugar beet area in1949/50 have generally maintained the increased acreage.
Further efforts to ircrease sugar production are being made by some countries in all continents, whichuntil now have depended on imported supplies to meet certain percentages of consumption: Western Germanyplans to double its 1949/50 production in a few years; in Switzerland, agitation continues for construction of asecond beet factory; the Netherlands hopes to attain self-sufficiency; a new beet-sugar factory will be openedsoon in Canada; new factories are being constructed in Near Eastern countries and in some territories of theFar East; and further gradual but steady expansion in sugar production is scheduled to take place in manyLatin American sugar-deficit countries.
Expansion programs have also been developed by many exporting countries. In Cuba, there appears tohave been much more planting and replanting of new cane varieties than has been generally recognized. Givenaverage weather conditions in 1950/51, Cuba is likely to produce a larger crop than that of 1949/50. Productionis recovering also, although very slightly, in Java. A large expansion program has been launched by the Gov-ernment of the Dominican Republic, which hopes to develop exports of 700,000 tons within a few years (ascompared with actual exports of about 400,000 tons in 1949/50. Haiti hopes to increase production for export,as do Brazil, Czechoslovakia, Mexico, Poland, etc.
Stimulated by the assurance until 1958 of an annual market for a minimum 2.4 million metric tons in theU.K., a large proportion at "remunerative prices," British Commonwealth and colonial areas are now makingpreparations for a great expansion of production. Despite the many difficulties in milting so great an expansion,the program cannot be dismissed as completely visionary. Instead of providing a market for about 900,000 tonsof "free" supplies, as the U.K. group of countries did in 1949/50, they might thus eventually become practic-ally self-sufficient, unless consumption were allowed to rise. Even in the United States, both in Puerto Ricoand on the mainland, pressure is increasing to raise the ceiling on home production established by the SugarAct of 1948. Puerto Rico did in fact produce 200,000 tons above its quota in 1949, which was sold to Germanytuxler the ERP.
Until now the demand for sugar has outstripped the increase in production. Indeed, there has been anunsatisfied effective demand for 1 to 2 million tons, which has necessitated rationing in some countries. The
29

U.K. alone could consume at least half a million tons more than it has had available in recent years. Sugarrationing has had to be introduced or re-established during the past 12 months in a number of Far Easterncountries, notably in India, Java, and Malaya. In India, the shortage of refined sugar has been severe. Con-sumption has increased substantially in almost all Latin American countries, in Africa, and in many othercountries in which per caput consumption was always very low, such as Egypt, Mexico, the Union of SouthAfrica, and various British colonial territories. (On the other hand, experience seems to indicate that percaput consumption of sugar tends to stabilize at 40 to 50 kilograms, and is affected very slightly thereaftereven by substantial increases in national income.)
Further increases in consumption will depend on the expansionor at least the maintenanceof the currentlevel of international trade in sugar. No doubt the overwhelming majority of countries could become self-sufficient, but at an uru-easonable cost. Despite enormous technical advances in the production of sugar frombeets, the specialized cane-producing countries can still produce sugar more efficiently and more economically.
Whether the current level of international trade in sugar will be maintained or expanded will depend ondemandon the maintenance of full employment throughout the World, on an expanding world economy, and onsolution of the basic exchange problems which have plagued the globe since World War II. Until now adequatefinancial resources have been found to finance international sugar trade in a volume larger than prewar, not-withstanding the fact that a greatly increased percentage of sugar exports came from dollar countries. AfterJuly 1950, the demand for dollar sugar was stimulated by the outbreak of hostilities in Korea and prices roseto the highest level in almost 30 years. The rearmament program in the United States, since it is likely tolead to larger exports of dollars, will no doubt facilitate the maintenance of a high level of sugar imports fromdollar producing countries.
In spite of the improved demand position for the next two years, previous national policies relating tosugar suggest governments believe that there may be some future difficulty in disposing of export supplies,especially in dollar exporting regions. The new draft World Sugar Agreement designed to prevent a collapseof world prices if surplus unmarketable stocks should appear, is now under study by governments.
Citrus Fruit
World citrus production, which in 1948 reached a level of about 35 percent over the prewar averagefor oranges and grapefruit and 10 percent above prewar for lemons and limes, declined about 3 percent in 1949.There was little decline in orange and lemon output, but the severe decrease in grapefruit production becauseof frost damage in the United States cut the world total substantially. Exports and imports expanded con-siderably, however, as most European countries except the United Kingdom increased their imports. With theliberalization of trade among soft-currency countries the outlook for further increase in citrus trade is favor-able. Prices have been increasing in 1949 and in the 1949/50 season.
Production. The aggregate 1949 production of oranges, tangerines, and clementines in the major pro-ducing and exporting countries was only about 1 percent below the 1948 crop, and about 2 percent below the1946-49 average. Production in the United States increased about 3 percent and was 85 percent above pre-war. Of the other important producers, Argentina, Brazil, French Morocco, and Mexico increased productionin 1949, whereas Algeria, Israel, Italy, and Spain had a decline, mainly because of frost damage in the earlypart of the production yeas. Also Australia, Japan, and the Union of South Africa had lower production. Com-pared with prewar, Israel, Italy, Japan, Spain, and the Union of South Africa were below average, whereasBrazil had some increase and Algeria, Australia, and French Morocco had considerable increase.
Grapefruit production was much lower than in 1948 and far below the 1946-48 average. United Statesproduction was only 27 percent above prewar, whereas its production in 1946/47 was more than 100 percentabove prewar. Of other important producers, Israel had a 10-percent increase over 1948 and the Union of SouthAfrica a 20-percent decline. Production in Israel was slightly above the prewar average in undivided Palestineand South African production was slightly below the prewar average.
Lemon and lime production declined in 1949, mainly in Greece, Italy, and Mexico. Increased U.S. pro-duction was about one-fifth above prewar, whereas Italy, the most important exporter of lemons, producedabout two-thirds of the prewar average.
30

international Trade. The quantity of fresh citrus moving in international trade was considerably higherin 1949 for oranges and lemons, with increases of about 14 percent and 22 percent. In grapefruit, however,there was a decline of more than 20 percent.
There was a remarkable increase in total orange imports into Western Europe, in spite of the cut in U.K.imports which declined further in early 1950. France is now the major importer, with more than a 50-percentincrease in imports over the preceding year. Germany increased imports from insignificant quantities in 1948to about the prewar level. If this expansion continues, it will be a stabilizing factor for the Mediterraneancitrus industry. Israel, North Africa, and Spain noticeably increased exports whereas the United States, with afurther 25-percent decline, had the lowest exports of any postwar year.
Grapefruit production in Israel remained rather low. United States exports declined, but were still morethan 50 peicent above prewar. Only South Africa was able to increase exports.
The total export of lemons increased comparatively more than that of oranges. United States export de-clined further, to only one-fourth of the prewar average, whereas increased Italian exports brought that country'stotal exports up to about 85 percent of prewar. A reduction in the United States import tariff for lemons inearly 1950, as a result of the General Agreement on Tariffs and Trade (GATT), may lead to a further increasein Italy's export of lemons to the United States.
The United Kingdom i_s still the most important export market for grapefruit; France and Germany are themost important for lemons. The only important export market for U.S. citrus fruit now seems to be Canada,which in 1949 took 76 percent of U.S. orange exports.
A United States export subsidy, covering fresh oranges and orange juice and amounting to about 50 per-cent of the f.o.b. price since November 1949, or $2.2 million, has failed to maintain the European market. Theforeign demand for orange juice from the United States is more likely to be maintained than that for freshoranges, but total exports were 11 percent lower in November-April 1949/50 than in the same season last year.
United States exports, even before the 1949 decline, absorbed only about 6 percent of the production oforanges, 5 percent of grapefruit, and 1.5 percent of lemons, but rapidly increasing consumption in the domesticmarket, mainly in the form of concentrated and frozen canned juice, has offset declining exports. This newproduction has increased tremendously since- its start only five years ago. The proportion of the total orangecrop going into frozen concentrates increased between 1948/49 and 1949/50 from 10 percent to 20 percent. Theconventional-canning industry (producing the unfrozen product) absorbed slightly less than the year before, butthe percentage marketed as fresh fruit declined. sharply.
In soft-currency countries citrus prices, except those for tangerines, were firm through 1949 and 1949/50,compared with the 1948/49 season. The United Kingdom average unit value of import was about 3 percenthigher for oranges, including mandarins, in 1949, and 9 percent for grapefruit. The trend was about the samefor import from all supplying countries. Italian export prices in lire for the 1949/50 season were higher for allcitrus except tangerines. Prices were higher in other markets than in the United Kingdom.
After devaluation, the United States' ability to compete in the European market was further reduced. InSwitzerland, with unchanged dollar rates, oranges and grapefruit from the United States cost more than fruitfrom other competing exporters, even after allowance for the U.S. export subsidy.
Outlook, 1950/51. It is too early to predict the supplies for the 1950/51 season as the yields still maybe affected by weather, and are fluctuating heavily from year to year, but available information seems to indi-cate continued expansion of production in Italy, North Africa, and Spain, and successful efforts in Israel torestore production. The Union of South Africa expects a considerable increase in production this year. TheUnited States crop condition as of 1 September 1950 is slightly below average, but considerably above lastyear for oranges, grapefruit, and lemons. Prices are expected to be firm.
If production in the Mediterranean area, in Brazil, and in South Africa follows the trend during the lastfew years, the high level of international trade in citrus fruit reached during 1949 should be maintained andeventually increased. The liberalization of trade in Europe under the OEEC agreement has removed tradebarriers which have been particularly restrictive on citrus fruit. Under quantitative import control, manyimporting countries had considered citrus fruit less essential than other food, particularly because of an in-creased indigenous production of other fruits. The United Kingdom ended bulk purchases through the Ministryof Food early in May 1950, and unrestricted import from soft-currency countries is now permitted throughcommercial channels. The immediate effect was a considerable increase in prices, particularly of oranges, but
31

as imports increase prices are expected to decline. Orange prices,' however, will probably remain higher than)efore the control was lifted. Meantime, the United Kingdom is attempting to make itself independent ofdollar supplies of citrus juices. New processing plants have been established in the West Indies, and a ten-year contract was signed this year with Jamaica for 2,750 tons annually of concentrated sweet orange juice.Similar but smaller contracts are being negotiated with Trinidad and British Honduras.
Expansion in French North Africa in citrus production is important primarily to the French market, sincecurrent prices make competition difficult outside rhe French metropolitan area. Production in 1950/51 isexpected to be substantially above last year, and it is planned by 1954 to reach about 400,000 tons inAlgeria and 300,000 tons in Morocco, as against 185,000 and 120,000 tons last year.
Israel's citrus program includes an export subsidy and appropriations for the rehabilitation of groves andthe improvement of water supplies. About 2,000 hectares of land will be leased to private farmers for culti-vation of new groves, and the government will contribute to the payment of union wages to orchard workers.Two new 4,000-ton fruit vessels have been ordered, and modernized equipment has been purchased for use inthe groves.
The demand for citrus should increase with further recovery of European production and trade, and homeconsumption in the exporting countries is also likely to expand.
Dried Fruit
Production of raisins and figs declined moderately in 1949/50, but output of currants and prunes wasslightly higher. Quantities of dried fruits moving in international trade declined, owing to sharp reductionsin U.S. exports and despite heavy export subsidies. Trade expanded among soft-currency countries, withraisin exports from Turkey and Greece passing the postwar average, and Germany re-entering the dried fruitmarket as a large buyer. Prices increased in the United States under a new controlled marketing system, butin Europe, where they had earlier been very high, they declined in dollars. The 1950/51 outlook is forgradually increasing world production if weather conditions continue favorable. European consumption mayrise as a result of the general reduction of restrictions on dried-fruit imports, but restoration to earlier con-sumption levels may be slow. The most important varieties of dried fruit moving in international trade areraisins, prunes, figs, and dates, with apples, apricots, and peaches accounting for only a small fraction ofworld trade.
Production in 1949/50. Production of raisins and figs was, respectively, about 5 and 10 percent belowthe 1948 level, whereas production of currants and prunes was slightly above the previous year. Raisin pro-duction in the United States, by far the largest producer, was more than 10 percent above the 1948 level, butproduction in Australia, Iran, and Turkey was lower. In Greece there was an increase in production of raisinsand currants. United States production of prunes and figs was little changed. Unofficial figures for che Balkancountries indicate further, recovery of prune production which, however, is still only about 50 percent of prewar.There was a very great decline in Turkish production of figs: 50 percent of the fig trees were destroyed in thesevere winter of 1948/49, and production was the lowest in 25 years. Date production increased more than 20percent in Iran, whereas in Iraq, a major producer and exporter, production declined 40 percent and export 20percent.
International Trade and Prices. The quantity of dried fruit moving in international trade in 1949 wasconsiderably lower than the year before. The United States had considerable difficulty in finding outlets forthese products, which before the war were largely exported to the European market. U.S. exports of raisinsdeclined from 120,000 metric tons to 72,000 metric tons, of prunes from 135,000 to 57,000 metric tons.
Australia increased raisin exports to Canada by reducing the quantities shipped to the United Kingdomunder the sales agreement. This was approved by the United Kingdom in the general interest of increasingCommonwealth dollar earnings. Turkey's fig exports declined as a result of low production, but exports to theUnited States increased. Greece and Turkey considerably increased export of raisinsTurkey by more than50 percent, Greece by 20 percentlifting their raisin exports above the prewar average. Greece also increasedits export of currants, but this trade has only reached 70 percent of prewar. For the first time since the war,
32

Germany took large quantities of dried fruit from Turkey and Greece. However, Turkish raisin stocks havebeen increasing, and prices droppedon Sultanas #9 to $200 per ton, f.o.b., in April 1950, as compared to$270 before devaluation. Prices in sterling, however, went up in the same period from 68/- to 72/- per cwt.Prices of the 1950 crop, after progressive advances, reached a peak late in August of $303 per ton (108/- percwt.) for Sultanas #9, but later declined somewhat. Greek export prices in the 1949/50 season were about 20percent below 1948/49 prices, on a dollar basis. The average export price for raisins to markets other than theUnited Kingdom was £78 per ton ($218), whereas the price agreed upon in the bulk-purchase agreement with theUnited Kingdom for 40,640 tons was £65 per ton ($182).
Prices in the United States market for 1949 averaged somewhat higher than in 1948, and increased duringthe year, mainly as a result of the controlled marketing of fruits, government purchases for export under theECA program, subsidies for export, and diversion of surplus fruit into noncommercial channels. With the ex-port premiums paid during a part of the 1949/50 year, however, U.S. prices on dried fruit c.i.f. Europe are lowerthan those from several Mediterranean countries.
The United States' controlled marketing system was established in 1949 for raisins, prunes, and figs, anda similar system has been proposed in 1950 for dates. Of the total production of Thompson seedless andSultana raisins, 45 percent of production was permitted to move freely, whereas 20 percent was transferred to areserve pool and 35 percent to a surplus pool for noncommercial disposal. The ordinary market has been ableto absorb more than the free quantity and the reserve pool has gradually been released. The United Kingdompurchased 22,000 metric tons of raisins from the surplus pool in the spring of 1950, with 50 percent of theprice paid by the United States Government as an export subsidy. An agreement with Western Germany to buythe remaining 9,000 tons of the surplus pool with United States subsidy will clear the surplus pool before thenew marketing season in the fall of 1950. The United Kingdom Government has also purchased 7,000 tons ofprunes from the surplus pool, in addition to more than 11,000 tons of the 1948 crop of small prunes held by theCommodity Credit Corporation. Total U.S. export subsidies for dried fruit in the financial year ending 30 June1950 amounted to $9.5 million. In the 1949/50 season approximately 29 percent of the total U.S. dried fruitpack has been moved under a government-financed program. For 1948/49 and 1947/48 the percentages were28 and 47.
Outlook for 1950/51 and Later. In 1950/51 U.S. prune and raisin production may be little changed. Thereare no indications as yet of the 1950/51 crop in the Mediterranean area, but, except for possible changes inwearher conditions, the trend is upward. Australian raisin production is expected to be 25 percent above thelow 1949 production but 14 percent below the 1944-48 average. The South African prune crop is known to beless than half of last year's. The forecast for Iraq's date crop is favorable.
As a result of the Annecy Tariff Agreement, tariffs for dried fruit have been reduced in several countries,and the West European trade liberalization may have the same stimulating effect on these imports from theMediterranean area as it has had on citrus fruits. Canada, as of 1 July 1950, transferred imports of dried fruitfrom the "prohibited list" to quota list, permitting imports up to 44 percent of those in 1946/47. The duty ondate imports has been cancelled. United Kingdom imports in the first five months of 1950 were extremely lowin dates, prunes, and raisins, but higher than last year in currants and figs.
With the trend in production indicating further expansion outside the United States, there has been someconcern about the future of marketing. Consumption of dried fruits has been declining somewhat since the war;in most European countries consumption has been extremely low because of import controls and shortage offoreign currencies; there is undoubtedly a latent demand which may be effective as trade restrictions arefurther abolished. It is dubious whether the United States will be able to maintain its European market, whichin prewar years absorbed a considerable proportion of total production. The small commercial export to Europeduring the last years has only been made possible by ECA financing or heavy export subsidies, which havemade U.S. export prices rather attractive in spite of the general shortage of dollars.
Should the availability of dollars increase during the next five or ten years, there is likely to be a growingcompetition in the dried fruit trade. Exporting countries in the soft-currency area will be unlikely to continuereceiving the comparatively high returns of the postwar years. Unless they can increase efficiency and reducethe costs of production and marketing, several Mediterranean exporters may find it difficult to compete withU.S. prices in a free world market.
33

Coffee
Since the war, world consumption of coffee has outrun production. Demand has been met only by drawingon Brazil's accumulated government stocks. These were estimated at some 500,000 metric tons in September1945; they shrank to 127,000 metric tons by the end of 1948 and were exhausted by the end of 1949. Worldimports in 1949 were nearly 5.5 percent above 1948, while the crop was 5 percent below the preceding year.Prices advanced very sharply in the fall of 1949 as the shortness of supplies became evident, but declinedslightly late in the year.
Postwar world production shows a decline from prewar of about 15 percent, mainly as a result of reducedoutput in Brazil and to a lesser extent in Indonesia, third largest producer in the prewar years. Since the warBrazil's output has represented about 50 percent of global production, compared with over 60 percent beforethe war. Outside Brazil, postwar production has increased one-fourth over 1934-38.
World production in 1949/50 is expected to amount to some 2.1 million metric tons or some 5 percent lessthan the 1948/49 crop, which was 8 percent higher than the previous crop.
World imports in 1949 of coffee for consumption approximated 2.0 million metric tons. For the first timein the history of the coffee industry they were valued at slightly over $1,000 million.1 Imports into Europeincreased considerably above the previous year and represented nearly 25 percent of the world total. Never-theless, consumption in 1949 was still only 70 percent of prewar. Imports to the United States rose by about5 percent as compared with 1948 and reached 1.3 million metric tons, or 66 percent of the world total, valuedat nearly $800 million. Imports increased slightly also in South and Central America. In the African region,on the other hand, imports in 1949 were less than in 1948. In Asia and Oceania total imports in 1949 werenearly the same as in 1948 52,000 metric tons), though Australia showed a decrease pf 10 percent.
World prices were maintained at about the same levels as in 1948 until the summer months of 1949, whenfirst estimates indicated a possible drop in the 1949/50 output as a result of unfavorable weather conditions,mainly in Brazil. Prices started to move slowly upward, from 26.80 U.S. cents a pound for Santos 4 in May to29.90 in September. When no rain fell until about mid-Octobergood rains are necessary in the months ofAugust, September, and October to produce good floweringBrazilian growers believe the 1950/51 crop wouldbe a complete failure. (As things turned out, no such disaster occurred, lout output was relatively low.) Atthe same time, the final liquidation of the Brazilian Government DNC stocks was announced. In addition tohoarding, other factors that contributed to the rapid rise of coffee prices in the fall of 1949 were the damagecaused by a severe drought to the coffee crop in British East Africa and heavy rains and floods in othercoffee-producing areas, notably Haiti and Guatemala. Aware of the tight supply-demand situation, roastersnevertheless postponed buying, hoping, since England and numerous other countries had devalued theircurrencies in September 1949, that Brazil might follow suit, which would have meant far lower dollar pricesfor coffee. When the Bank of Brazil finally gave out its buying rate for soft currencies, the last prop wastaken away and heavy buying started. From September to October Santos 4 increased 18 percent and in No-vember jumped ,another 41 percent over the preceding month, with December showing a decline of 2 percentover November.
However, during December 1949 world imports, particularly to the United States, increased. Although pricesreceded somewhat in the closing days of 1949, Santos 4 spot prices in the last quarter of 1949 had climbed to anaverage of 44.40 U. S. cents per pound, or nearly one-fourth above the 1948 prices over the correspondingperiod. The yearly average during 1949, amounting to 31.76 cents a pound, represented an increase of 15 per-cent over the 1948 average (retail price rose nearly 7 percent). Consumption again exceeded production in1949 and could be met only by a further reduction of stocks (some 17 percent) in importing and exportingcountries, largely Brazil.
World imports for the first half of 1950 were about 15 percent below the import levels for the same periodin 1949. Imports into Europe, where coffee still is rationed in many countries, showed an indicative upwardtrend as compared to the first six months of 1949, in spite of devaluation and the rise in prices. Markedincreases in imports occurred in Finland, France, Italy, and the Netherlands. On the other hand, imports de-clined into the Scandinavian countries, Belgium, Czechoslovakia, Portugal, and Spain. In the Western Hemis-phere, imports into the United States over the first six months in 1950 declined some 25 percent, and into Canada
1Net at point of origin; no freight, insurance or other charges.
34

14 percent, as against a remarkable increase in Argentina. Although imports into Anglo-Egyptian Sudan,Egypt, and South Africa declined substantially during the first six months of 1950, imports into the Africanregion as a whole increased 10 to 15 percent over the first half of 1949, because of an unusual increase inAlgeria. Imports into Asia and Oceania declined about 20 percent.
Prices for the first six months of 1950 averaged 47.35 U. S. cents per pound for Santos 4, New York spot,which was slightly below the average for December 1949, although nearly 60 percent above the average for thecorresponding period in 1949.
Outlook, 1950/51. World production in 1950/51 may be slightly below that of 1949/50. Weather conditionsto date in some major producing areas have been rather unfavorable; increased crops, however, are expected inother producing areas, notably the African.
Even with the prevailing high prices it will take a considerable period before growers can expand pro-duction oil a large scale. In Brazilbecause of limited availibility of desirable new land for plantingincreasedproduction must be largely based on reuse of old land, which is less productive than new land and augmentsproduction costs. New plantings of some significance have been undertaken in the state of Parana, Brazil,the Dominican Republic, and the Belgian Congo (8,000 hectares in 1946). Great strides have been made byMexico and Colombia toward increasing yields, and significant research has been undertaken in other areas COdevelop better-yielding varieties.
World imports of coffee in 1950 probably will show a decline of 5 to 10 percent from the previous year.Imports into the United States likely will be maintained at a level of 10 percent or more below imports in1949. Nevertheless, with coffee prices during 1950 expected to average some 60 percent above 1949 levels,dollar earnings in the Western Hemisphere from sales to the United States alone'likely will soar to well overthe $1,000 million mark at point of origin, plus additional dollar revenues from other hard-currency importers.Contrary to 1949, when profits mainly accrued to the middlemen, in 1950 and thereafter growers and laborerswill benefit to a larger extent. Imports into Europe during 1950 may well advance to a rate near 10 percentabove those of 1949. Imports into all other areas are expected to fall off somewhat.
World economic developments since the outbreak of hostilities in Korea are likely to counteract to someextent the reluctance of some consurners to buy as much coffee as usual, which developed after the priceincreases in 1950. In view of the decline in prospective current supplies, the anticipated consumption in1950 will necessitate drawing further on current working stocks in importing and exporting countries. During1949/50 the working stocks in exporting countries declined by an estimated 20 percent, to around 550,000metric tons. Reliable figures on stocks in importing countries are not obtainable, but indications are thatthey also were drawn upon.
Production prospects for 1951/52 appear to be better. After two years of rather unfavorable weather andlow yields, production in Brazil and Colombia should show some recovery, while surveys in Africa indicate apossible increase in output of about 20 percent as compared with 1949/50.
Higher demands for coffee are likely to develop both from civilian and military sources and the volumeof imports may again approach the 1949 level.
In the producing areas at largeparticularly in the Western Hemispherewithout major changes in areasunder coffee cultivation, production will mainly depend on weather conditions and improved cultivationpractices.
Tea
Total world production of tea, estimated at 500,000 metric tons in 1949, increased only slightly as com-pared to 1948. World trade in tea, however, was about 25 perc ent higher than in the previous year. Teaprices increased considerably from March to November 1949, but declined after December 1949.
Production in India and Ceylon, the world's two dominant producers, continued in 1949 the high recordlevel of 1948, with output in India 4 percent over 1948. Production in Pakistan increased by 5 percent. InIndonesia, the third important exporting country in prewar years, 1949 production doubled that of 1948, but stillamounted to only one-third of prewar. Production in Japan was up 20 percent over 1948. For China no re-liable information is available, while in Thailand-there was a significant decline because of unfavorable
35

weather. In British East Africa, production apparently increased somewhat over 1948. Exports of the fourmajor producers in 1949 amounted to 392,000 metric tons.
All major importers increased their takings in 1949, the increases ranging from 4 percent in the UnitedStates up to 20 percent in Canada. The 15-percent increase in U.K. imports, however, absorbed 65 percentof the total trade expansion. U.K. imports exceeded estimated consumption by about 24,000 tons, which musthave been added to the stocks. Although Indonesia and Japan made the largest relative increase in exports,the largest part of the increase, 63,000 tons, came from India. The increased Indian exportsreflected improved quality and restored India as the chief supplier of the United States. Theincrease in Indian exports ro the United Kingdom, however, exceeded the total exports to theUnited States.
Auction prices in Calcutta for export leaf increased by 43 percent from January to November 1949, whilein Colombo the price for high-grown leaf almost doubled during the same peri5d. In both cases the sharpestincreases took place in the weeks preceding devaluation. In December, prices started to decline and continueddownward through the first five months of 1950, nearly eliminating the gains made during 1949. In July 1950,prices were again increasing, both at Calcutt'à and Colombo. Wholesale prices in New York increased slightlyduring 1949, reaching a maximum in August. Since then, however, there has been a steady decline until July1950.
Outlook. Preliminary indications are that the 1950/51 crop in India, Indonesia, and Pakistan will beeven higher than last year. The upward trend in production will continue over the next years. Indonesia'soutput is expected to be at prewar levels by 1954-73,000 tons as against 22,000 tons in 1949.
The renewed Interim Producers Agreement, signed in April 1950 and valid until 1955, increased thepermitted national area in tea by 4 percent above the old agreement and by 5 percent during the period theagreement is in effect.
Little is known about development plans for tea production in Africa, China, and Japan. As a result ofthe Interim Producers Agreement among Ceylon, India, Indonesia, and Pakistan, export of seed to countriesother than those participating has been prohibited, and this may limit African development. Production inJapan should continue its upward trend of the past years until it reaches prewar levels.
The total volume of trade is expected to expand considerably. The renewed agreement provides forexport quotas allowing an 18-percent increase in 1950/51 over the actual total 1949 exports of the four par-ticipants. Indonesian export in 1949 was, however, only 20 percent of its permitted quota, whereas exportfrom India exceeded its quota.
India has renewed the Tea Pact with the United Kingdom, providing for bulk purchases in 1950/51.The quantity agreed upon is reported to be 124,738 metric tons (13 percent less than 1949 exports), which maybe increased by 10 percent if supply is ample and of good quality. The price is to be fourpence per poundmore than last year. The bulk-purchase agreement between Ceylon and the United Kingdom was renewed inMay 1950 for the current year. As in the agreement with India, the price has been fixed at an additionalfourpence per pound over the 1949 contract price. The quantities to be delivered were set at 50,000 tons fordelivery up to 31 March 1951 (export to the United Kingdom in calendar 1949 was 55,000 tons).
Announcement by the United Kingdom Government that the International Tea Auction in London will bereopened soon has met witn little satisfaction in Ceylon and India. Since the war interrupted the Londonauctions, exporters in Asia have sold directly to the importers in the dollar areas, bringing dollar earningsto the producing countries. The trade in India and in Ceylon had hoped to develop a tea market for their ownarea, and they fear the re-establishment of the London market may reduce their dollar earnings.
The renewed Interim Producers' Agreement is more liberal on permitted production and exports. Its mainaim seems to be to make sure that Ceylon, India, and Pakistan refrain from overexpanding production duringthe period necessary for Indonesian output to recover from war destruction. Production quotas seem otherwiseto ensure ample supplies even if demand for tea should increase somewhat in the next few years.
Tea consumption shows little response to price changes, depending mainly on consumption habits and theavailability of other beverages, mainly coffee, at reasonable prices. With coffee supplies short, coffee priceshigh and still going up, and with buying power of consurners increasing, tea consumption in 1950/51 shouldincrease further unless the current level of British rations (reduced 20 percent on 16 July 1950) is continued.
36

Cocoa
Supplies are still quite short, compared with the increased demand. After a larger crop in 1948/49,production fell slightly in 1949/50. On the basis of early weather reports, no substantial change in productionseems likely in 1950/51. However, carryover,stocks are much reduced from a year ago; and, with increasingdemand from both developed and partially developed countries, prices seem likely co continue relativelyhighfar above prewar averages for several years. Production is expanding slowly, but new plantings are yettoo small to compensate fully for the ravages of disease in British West Africa and to catch up with enlargedand expanding demands.
The period of shortage, which began during the war years, has not yet ended; comparatively tight supplycond tions will probably continue for some years. Programs to increase production are on a comparativelysmall scale and will not come into full bearing for some years. During the cocoa year 1948/49, weatherconditions were exceptionally favorable in almost all producing areas, and the production of cocoa beans roseto 761,500 metric tons as compared with 621,800 in the previous year and with the prewar average of 733,200.British West Africa contributed the lion's share of the increaseits production rose from 305,900 to 394,500metric tons, almost as high as the prewar maximum. During 1949/50, however, world production declined toabout 740,000 metric tons, though weather conditions in most of the producing areas were generally not favor-able. In British West Africa the output of cocoa beans dropped to less than 360,000 tons. The rains cameat the right time and in sufficient abundance, but other climatic conditions were not so favorable.
No useful estimate of production during 1950/51 could be made when this survey was prepared. However,weather conditions during the spring and summer of 1950 were generally favorable in almost all producingareas, and average yieldsor slightly better were in prospect in early September for the cocoa year 1950/51.There is no reason to anticipate substantial changes from the production pattern of 1949/50.
Unlike the situation at the beginning of the 1949/50 crop year, however, when Brazil held stocksamounting to about 20,000 tons, carryover stocks in the producing-exporting countries in October 1950 at thebeginning of the 1950/51 crop year, will be negligible. Marketing authorities of British West Afti.ca will havepractically no carryover, nor is any likely from the midterm Brazilian crop. In fact, it was inadequate suppliesfrom this Brazilian crop that gave initial impetus to the steep rise in prices of cocoa beans during the summerof 1950.
The demand for cocoa beans continues high. Consumption has risen in the tropical and subtropical pro-ducing countries, most of which consumed very little before the war. As in the case of other semiluxury foods,the consumption of cocoa products has risen also in underdeveloped and in many partially developed countries,which during the last few years have enjoyed fuller employment, higher wages, and higher prices for theirexport commodities. The economic forces tending to increase consumption are also operating in many Europeancountries, except in Eastern Europe and the Soviet Union, where supplies are kept down by import restrictions.In the U.S.A., consumption is likely to be higher during calendar 1950 as compared with the previous year,even though manufacturers have learned to economize on cocoa beans in the preparation of confectioneryproducts because prices of cocoa beans have been higher than of the other ingredients. In the U.K., however,consumption of cocoa beans may decline somewhat, because of the greater availability of other ingredients forthe manuf acture of confectionery. Cocoa requirements for increased armed forces in several countries willstrengthen still further the demand for cocoa.
Consumption during the next year or year and a half will probably be limited largely by the availabilityof supply. Indications developed in midsummer 1950 that cocoa beans might be priced out of a part of themarket, not so much from the standpoint of consumers as from the standpoint of the governmental authoritiesresponsible for finding the foreign exchange with which to pay for imports of cocoa beans and products. Therewas still a premium on sales of cocoa in pounds sterling, amounting co about £40 per ton, even though manycocoa-importing countries were also finding sterling short as well as dollars.
Production is not likely to increase appreciably in the near future. In.West Africa the spread of theswollen shoot disease, which has affected tens of millions of trees, is now under better control but is not yetchecked. Since the inauguration of a system to compensate farmers for cutting out all diseased trees, nativegrowers have shown much greater willingness to co-operate with the agricultural authorities, but the diseaseis still spreading. However, it is probable that the amount of planting and replanting of new trees has beengreater than the authorities had estimated. Some new planting has taken place in Ceylon, French Africa, and
37
Liberia. Slightly more encouraging is the outlook for production in Latin America, where high prices since1947 have provided the financial resources for both governments and farmers to take better care of trees tomake new plantings. Research on better-yielding varieties, on the application of fertilizers, on techniques forcombating pests and diseases have been carried on in numerous research centers. Plantations neglectedduring the thirties have been revived and returned to production, and transportation facilities and marketingtechniques have improved.
While prices have been very remunerative to producers since the end of the war, there is, nevertheless,considerable reluctance to expand production. British authorities have investigated the possibility of develop-ing production in new areas, but most governments and private capital have shown little interest in launchingmajor production projects. Memories are still vivid of the 1930's,when cocoa beans sold on world markets for6 to 10 cents a pound, and so are fears of another period of overproduction and price collapse.
Tobacco
World production of tobacco in 1949, though somewhat below 1948, still exceeded prewar by about 10percent. World trade increased sharply in 1949 and is well above prewar, with soft-currency countries increas-ing exports more than hard-currency areas. United States'tobacco exports, which still make up a substantialportion of Europe's supplies, continued to lean heavily upon ECA financing. Europe's dependence onUnited States supplies was somewhat reduced, however, notably in the United Kingdom.
Prices were firm through 1949, remaining high on Oriental and flue-cured types from non-dollar areas.United States export prices remained stable, but average U.S. import prices declined. Producing regions insoft-currency areas are planning expanded production to meet the high demand for their tobacco, while exportdemand for U.S. tobacco may be maintained with improved dollar availabilities abroad. Difficulties in rapidlyexpanded production of high-quality cigarette leaf, particularly of the flue-cured type, limit the ability ofsoft-currency importing countries to make the mselves independent of American and Canadian supplies.
The decline in production was mostly in China, where, according to unofficial estimates, output wentdown about 25 percent. In spite of increased production in India and Indonesia, the Asiatic region had a totaldecline of 15 percent. Production in North America was unchanged, whereas Latin America increased pro-duction about 6 percent. Europe (including Turkey) and Africa show an increase of 12 percent above the1948 level. Expansion took place mainly in areas from which Europe is attempting to obtain soft-currencysupplies. Greece, India, Korea, Southern Rhodesia, and Turkey all increased production more or less sub-stantially, through higher yields and larger area planted. Cuba, a hard-currency country, also increased itsarea and production.
Output of flue-cured tob..cco, in high demand for the increasing cigarette market, declined in 1949 com-paratively more than total tobacco production. This was mainly owing to the sharp decline in China andmoderate declines in Brazil and Italy. Flue-cured production increased in Canada, Korea, Rhodesia, Taiwan(Formosa), and the United States, main suppliers of the European market.
The 1949 increase in trade amounted to about 115,000 tons, of which 33,000 tons were supplied by theUnited States and Canada, 12,000 tons by the major Latin American exporters (Brazil, Cuba, and the DominicanRepublic), and about 50,000 tons by exporters in the soft-currency area, such as Algeria, Greece, India, Indo-nesia, Nyasaland, Northern and Southern Rhodesia, and Turkey, the rest coming from several minor exportingcountries. Turkey increased its exports 60 percent, Algeria and Greece 50 percent, Brazil and India 20percent. Indonesia, which increased its exports fourfold, has reached only a fraction of its prewar level.Italy increased its exports sevenfold and found a market in the U.S.S.R.
In spice of the dollar shortage, the United States increased exports of leaf tobacco nearly 17 percent, andsupplied more than one-third of total world exports. This brought the quantity of U.S. exports above the1934-38 average and close to the average of 1924-28. Of the United States export of manufactured tobacco in
1949, 73 percent by value went to ECA countries in Western Europe. The proportion of such exports paid forby ECA was 86 percent in 1949, and, over the period from the beginning of Marshall Plan help in 1948 until theend of 1949, 74 percent. U.S. exports to Germany increased from a value of 88 million in 1948 to $33 million
in 1949.China, still in 1948 the second most important outlet for United States exports in quantity (but a smaller
38

proportion in value because of the civil war) absorbed in 1949 only a slight fraction.The United Kingdom, the world's largest importer, in spite of ECA grants, made further progress in
1949 in substituting leaf imports from soft-currency countries. The total import into the United Kingdomin 1949 was 135,000 tons as against 126,000 tons in 1948. The United States' share continued to decrease, atrend observable since 1946. The share from Commonwealth sources increased steadily to 40 percent in weightof all imports in 1949, as against 28 percent in 1947, but the manufacturers remain largely dependent on sup-plies from the United States and Canada. If, as is thought, dollar availabilities are improved, these sourcesmay be relatively well maintained.
United States imports of leaf tobacco in 1949 increased only slightly in quantity, while the value declined.More than half of the import consisted of the Oriental-type cigarette leaf tobacco, with no change in thequantity of that type imported.
Tobacco consumption in many regions has been restricted by rationing and by exceptionally high pricesfor the manufactured products, reflecting high taxes and currency shortages. Governments' interest in the highrevenue from tobacco taxes may interest some of them in keeping tobacco consumption up and in allocatingas much foreign currency for import as possible, in the light of other needs. The per caput consumption ofcigarettes in the United States is even higher than in war time, whereas the demand for other manufacturedtobacco products has declined. Total tobacco consumption per caput in the United States is one-third abovethe prewar average.
Tobacco prices were generally higher in 1949. United Kingdom average import values in pence per poundincreased substantially above the 1948 averages for all major countries of origin. The increases ranged from6 to 8 percent for Empire tobacco and from 15 to 25 percent for Canadian, Turkish, and U.S. tobacco. Thegreater part of the U.K. import was contracted for before devaluation. British wholesale prices for Rhodesiantobacco increased slightly in October 1949, whereas wholesale prices for Nyasaland tobacco remained un-changed. For Indian tobacco there was no increase until April 1950.
Prices in the United States continued firm, at levels established by price-support programs. The averagevalue in cents per pound of all manufactured tobacco exported was little changed from 1948. Export unitvalues for flue-ctu-ed types were also unchanged. Unit values for Burley tobacco were slightly lower, forcigar leaf there was a considerable decline, but for Maryland tobacco and certain other types there was anincrease. Average unit values of United States imports were also lower.
In spite of Turkey's maintenance of the dollar exchange rate, wholesale tobacco prices in Turkey and theaverage unit values of exports continued to increase after the sterling devaluation.
Outlook for 1950 and Later. Demand for tobacco is expected to continue strong in the United States in1950, with domestic consumption of cigarettes further expanded, but exports may be slightly lower for un-manufactured tobacco and substantially lower for manufactured tobacco, particularly cigarettes. Price supportsfor the 1950 U.S. crop will be somewhat higher than in 1949, for most types. Reduction in exports to WesternEurope, which usually has taken three-fourths of the total United States export, may be offset by rising dollarearnings from other sources.
The dollar allocation for United Kingdom imports of tobacco in 1949/50 amounted to $93.5 million asagainst $46.8 million in 1948/49; for 1950/51 and 1951/52 tobacco imports from dollar countries are,according to the present program, fixed at 868.6 million, but may be revised upward if dollar availabilitiesincrease.
Expanded production in soft-currency countries is expected to continue, particularly in Southern Rhodesia,where the 1949/50 crop is reported to be 25 percent above that of 1948/49. The long-term agreement of1947 between the Southern Rhodesia Tobacco Marketing Board and the United Kingdom was extended in thespring of 1950 for a further -"ear, through 1954. The United Kingdom has agreed to buy two-thirds of the crop,up to a 140-million-pound crop. In addition, the Board of Trade has agreed to buy, for the years 1955-56, notless than 75 million pounds annually. The agreement does not establish prices, but it is expected thatthe average market price for the 1950 sales might be about 3 shillings per pound-3 or 4 pence higher than the1948/49 average. The prices in 1949 were already above the comparable prices from the dollar area, in somecases even after devaluation. An important factor in Rhodesia's ability to compete with U.S. flue-cured to-bacco is the possibility of improving the quality of Rhodesian tobacco. Progress has already been made, andmuch effort is being spent on research to improve the growing and processing of the leaf.
For future developments in trade it is significant to notice that Brazil and Turkey, during 1949 and
39

1950, have agreed to more barter arrangements in tobacco. The Brazilian export to Germany was made on barterterms and similar arrangements have been negotiated with the Netherlands and Spain. Brazil expects, by sucharrangements, to market all available surplus leaf.
Official sources in the United States have expressed some concern that the present price-support programmay "price United States products out of the world market." This program may stimulate other countries toexpand their production to fill at least a part of the markets previously supplied by the United States. Pastexperience in exporting tobacco, as well as other price-supported commodities, indicates that such marketsonce lost are difficult to regain.
Rubber
Current problems of N-voi Id rubber supply and distribution are intensified by the strategic import-ance of the commodity and by the concentration of natural rubber production in the Far East. Sharply increasedprices have stimulated output, especially in Indonesia and Borneo, but these gains may be offset to some ex-tent by the increasingly precarious situation in Indochina and by the uncertain outlook for other strategicallyvulnerable supply areas. World supply of new rubber is being increased by the rapid reactivation and expansionof synthetic rubber production in the United States. A cushion is also provided by the existence of certainstockpile reserves, but the rubber supply situation for civilian uses is likely to remain tight. New York quota-tions for natural rubber in early September were about 75 percent above the June average, and approximatelythree times the U. S. Government selling price for GR-S synthetic, which has remained unchanged at 18.5cents a pound. Because of the military importance of natural rubber, questions have been raised concerningthe control of shipments by destination. These matters are being currently reviewed in intergovernmental dis-cussions.
World Supp/y and Distribution. At the Seventh Meeting of the International Rubber Study Group in May1950, it was estimated that world production of natural rubber in 1950 would reach 1.63 million metric tons,or about 8 percent more than in 1949, with most of the increase coming from Indonesia. Small increases werealso expected in some other countries, in view of the stimulus of high prices. In the light of latest reports,Indonesian production in 1950 will be even higher than expected at the Study Group Meeting, and there hasalso been some further improvement in Borneo. In Malaya, rubber production has not been seriously affectedby internal political strife, but it has not been stepped up, on the other hand, as a result of higher prices.Production on Malayan estates has been influenced by bad weather and by some difficulties encountered inretaining estate laborers, some of whom were induced to cash in on the good market by shifting to work onsmallholders' plantations on a sharecropping basis. Output in Indochina in the past three years has remainedat less than half the potencial production, and some further deterioration may well take place during theremainder of 1950. World production of natural rubber in 1950 is now estimated at about 1.73 million metrictons, i. e. approximately 14 percent more than in 1949.
The Study Group's May estimate of world consumption of new rubber in 1950 was set at 1.95 million metrictons 1.49 million tons natural and 465,000 tons synthetic rubber. In the light of subsequent developments,this estimate appears too conservative. In particular, its estimate of 1.04 million tons of new rubber consunv-tion in the United States may be exceeded by a considerable margin. Even prior to the Korean development,consumption was exceeding earlier expectations, owing to the unprecedented boom in the automotive industryand record tire production. United States consumption in 1950 is now tentatively estimated at about 1.16million metric tons and would have been even higher if additional consumption for military purposes had notbeen offset by some curtailment of civilian uses. Usage of natural rubber in the United States may exceed theStudy Group's estimate of some 600,000 tons, despite the stepping up of synthetic rubber production. Aggregateconsumption of new rubber in the rest of the world is also likely to exceed the 915,000 metric tons estimatedby the Study Group in May. The estimated consumption remains unchanged for Italy and also for France, whereprocessing capacity appears limited, but in the United Kingdom and in Canada consumption is expected toexceed previous estimates. German stocks are low and the country must now compete for new supplies at highprices. Russian buying appears to have been stepped up since the middle of the year. On balance, a tentativeestimate of world consumption of new rubber in 1950 is now set at more than 2 million metric tons.
Before the outbreak in Korea, the dollar price of RSS natural rubber was about 70 percent above the pre-
40

devaluation level and twice the 1934-38 average. Prices soared in July, reaching a peak on 8 August of 65.5cents per pound, or more than twice the June average. New York quotations in early September were about 75percent above the June average, and approximately three times the U. S. Government selling price for GR-Ssynthetic, which has remained unchanged at 18.5 cents per pound.
Frospects for 1951 and Beyond. Looking at the prospects for world productive capacity of naturalrubber in 1951 and beyond, it is apparent that the only territories from which substantially greater outputsmay be expected are Indonesia and Indochina. The productive capacity of Indonesia is considerably in excessof the estimated output of approximately 580,000 to 600,000 metric tons in 1950. Assuming conditions general-ly favorable to continuous production,. Indonesian shipments could gradually be increased substantially overthe 1950 estimate. A return to more peaceful conditions in Indochina could result in doubling its currentoutput, but this would mean an addition of only about 50,000 tons to the annual world supply of natural rubber.While substantial increases may be expected from Indonesia and less substantial ones from some otherterritories, there are on the other hand territories where production may tend to decline, owing to increasingage of the planted areas or to the cutting out of old areas for replanting. In general, new plantings and re-planting with high-yielding strains are likely to proceed at a slow rate. In estate production, investors aregenerally anxious to draw full dividends rather than to reinvest their earnings on estates under conditions ofpolitical uncertainty. As regards smallholders, it is difficult at all times for them to afford the investmentinvolved in replanting high-yielding strains. Moreover, both estates' and smallholders' incentives to replanthave now been lowered by increasingly profitable returns obtainable from tapping existing trees. Takingeverything into consideration it is difficult to foresee a world productive capacity for natural rubber in excessof, say, 1.90 million tons during the next few years.
In regard to the future world consumption of new rubber (natural and synthetic), the prospects are formarked expansion if political tensions persist, or for a continuing increase if there should be a peacefulexpanding world economy. Assuming peaceful expansion, consumption in accepted usage should increase inaccordance with rising real incomes of consumers and even more in the potential expansion of new uses. Thetwo most promising new fields for peacetime expansion are in foam-rubber goods and rubber roadways. Totalpeacetime consumption of new rubber over the next few years could well be in excess of 2 million tons a year.
Cotto n
The world cotton situation is undergoing a radical change. In contrast to the position a year ago, whena considerable surplus of American cotton was in prospect, the world is now faced with a very tight supplyposition. Prices in the new season opened about 20 percent above the August 1949 level, and increasedanother 10 percent by early September. With a reduction of nearly two-fifths in the United States crop, theexpected 10-to-15-percent expansion in aggregate production of other countries will still leave world productionabout 13 percent below the 1949/50 level. Unlike the previous season, when production exceeded consumptionby 5 percent, consumption in 1950/51 may exceed output by about 10 percent, leaving world carryover at 1August 1951 nearly 3 million bales1 less than a year earlier.
Situation and Outlook. The cotton supply situation is dominated by the unexpectedly large reduction inthe United States crop. When acreage controls were reintroduced for the 1950/51 season, the scheduled reduc-tion in area was 22 percent. The actual reduction has proved much heavier. According to the third officialcrop report, the area for harvest in 1950/51 is estimated at 32 percent smaller than the area actually harvesteda year earlier, while production was estimated at nearly 40 percent less than in 1949/50. The estimated totalU. S. supply for 1950/51, including a carryover of just over 6.5 million bales, is approximately 16.5 millionbales, or about 5 million bales less than in 1949/50, and only 1.5 to 2.0 million bales more than total dis-appearance in 1949/50.
About one-third of the U.S. crop reduction may be offset by an expected expansion of 10 to 15 percent ofaggregate output in all other countries. Such ex,Dansion may result from the campaign for increased production
*Prepared in co-operation with the International Cotton Advisory Committee.1Bales of approximately 217 kg. (478 lbs.), net weight.
41

in India, the more extensive planting of higher-yielding varieties in Pakistan, the resumption of upward trendsin Egypt and perhaps in Brazil, further advances in Mexican and other Latin American and African areas, andintensified production efforts in China and the Soviet Union. On the basis of these assumptions, the share ofthe United States in world production would be just over 35 percent, whereas its prewar ratio was around 40percent.
' Just two months before the beginning of the current season (i. e., before the release of the first officialU. S. crop estimate), it wa s thought, on supply grounds at least, that world cotton consumption in 1950/51might increase by about 1 million bales to a total of 30 million bales. Most of the increase was expected tooccur in the major producing countries. Although some decrease was expected in United States exports fromthe unusally high 1949/50 level of approximately 6 million bales, it was anticipated that this might be offsetby an increase in aggregate exports from other countries. Thus, a slight increase in European consumption andfurther recovery in Japanese consumption seemed feasible.
Expansion in military and defense programs will no doubt mean a substantial new demand for cottontextiles. At the same time, deterioration in the world supply position and the upward trend in prices in thecurrent cotton year will serve as a brake on total demand. In early September, cotton was placed under exportcontrol in the United States in order to permit the Government to determine the magnitude of American defenserequirements for cotton. Based on present indications, it is considered doubtful that world cotton exports in1950/51 will exceed 11 million bales, as compared with over 12 million in 1949/50. In the circumstances,prospects for increasing aggregate consumption of cotton in the major importing countries may depend ondepleting their rather meager stocks. In the United States, there is already evidence of expanded consumptionas a result of much higher demand for military and civilian uses. In India, consumption is expected to benefitfrom increased domestic production. Consumption in China and in the Soviet Union also seems likely to expandin response to larger cotton supplies in both countries. At present it looks as if world consumption of cottonin 1950/51 may be somewhat less than 30 million bales, but even at the preceding season's consumption levelof 29 million bales, world stocks would have to be drawn down by nearly 3 million bales.
World cotton prices have advanced sharply since early in July, mainly because of the deterioration in theU. S. crop outlook, although part of the inflationary pressure has come from strengthened demand following theoutbreak in Korea. By early August, cotton quotations in the United States markets were generally about 20percent higher than a year earlier. Prices of Brazilian cotton had risen even more than those of most othergrowths, and Sao Paulo Type 5 was selling at 4.5 cents a pound more than U. S. middling, 15/16", as against1.2 cents more in August 1949. Prices of Egyptian Ashmouni, good, which had risen out of proportion to allother cottons in the spring of 1950, owing to special short-term factors, became subject to a maximum pricelimitation in June. On 9 September spot prices for U. S. middling, 15/16':averaged 40.94 cents a pound, com-pared with 31.83 in 1949/50 and 11.18 for 1934-38.
Loan support rates for the 1950/51 crop in the United States have been fixed at 90 percent of parity asof 15 July, giving a support price of 29.45 cents a pound for middling, 15/16", as compared with 29.43 in1949/50. In view of the current level of market prices it seems very unlikely, however, that any appreciablequantity of cotton vvill move into the loan program in the current season. Indeed, most of the supplies whichwent into the loan program during the past season have since been repossessed by the growers, and betweenmid-July and early September, CCC had sold at market prices upwa rds of 2 million bales of the 1948 pooledstocks, totaling just over 3 million bales.
In 1951/52, the U. S. support price under existing legislation will shift to a sliding-scale basis and maybe fixed anywhere between 80 and 90 percent of parity, depending upon the relationship of supply to require-ments. On the question of acreage control, the Secretary of Agriculture will have declared by 15 Octoberwhether the 1950/51 supply exceeds the normal supply and accordingly whether controls will be applicable inthe 1951/52 season . On the basis of the crop forecast now available and last season's disappearance, suchcontrols would not be applicable.
In view of the present tightness in U. S. cotton supplies, and of the prospect of enlarged military andcivilian requirements, the U. S. acreage goal for 1951/52 presumably will be much higher than that for1950/51. Some further expansion in aggregate output in other countries seems feasible. It is possible,therefore, that world production in 1951/52 may recover to about the 1949/50 level of just over 30 millionbales. If adequate supplies are available in the 1951/52 season, a substantial rise in world cotton consumptionin that season is likely, in consequence of the expected continued rapid advance in industrial production andconsumer demand.
42

Woo!
With growing military requirements superimposed on a world market already tight for civilian uses, prob-lems of world wool supply have become a matter of serious concern. Government-held stocks, accumulatedduring the war years and used for closing the gap between new supply and commercial demand during the firstfive postwar years, have been virtually depleted. Stocks held in all hands as of mid-1950 were estimated tomeet little more than current working requirements. Since then, the continuing strength of civilian demand andthe greatly increased defense requirements have caused prices to rise to levels far in excess of all previousrecords. Sterling quotations at London and Dominion auctions in August ranged from 100 to 150 percent abovepred,valuation levels. In terms of dollars, prices of Dominion wool in August 1950 had risen to about 60percent above August 1949 levels for merinos and even more for crossbreds. When this report was prepared inmid-September, the possibility of a system of international allocations for raw wool was to be reviewed by thegovernments of some of the major producing and consuming countries at a London meeting later in the samemonth. In the event that these discussions resulted in plans for international action, the proposals were tobe placed before a meeting of the International Wool Group tentatively scheduled for early October.
World Supp/y cm.d Distribution. In the FAO review of prospects for farm commodities issued in August1949, it was stated that "the outlook for wool in 1950/51 appears firm in any case, and it may even be tight,particularly if U. S. economic conditions should strengthen. "1- This statement was subsequently- supported bydevelopments during 1949/50, when the world apparel wool supply situation was progressively tightened bythe speedy rate of stock disposals, influenced by the upswing in the United States and continuing strongdemand in other major consuming countries. High prices prompted increased substitution of lower qualities ofapparel wool, thus leading to a more than proportionate gain of crossbred prices and restoring the prewar ratioof merino to crossbred values. The strength of European demand was also evidenced by the large sales fromJoint Organisation stocks of inferior burry combing and carbonizing wools, which are used mainly in continent-al Europe. Total stocks held by the Joint Organisation on 30 June 1950 were down to less than 70,000 metrictons, greasy basis, or about one-twentieth of the quantity taken over in August 1945. Stocks held by the U.S.Commodity Credit Corporation were also depleted, sales having been aided by the sharp advances in worldmarket prices which made CCC selling prices more attractive.
Thus, even before the outbreak of the Korean war, it was evident that with the virtual depletion of rawwool reserves, consumption in 1950/51 would need to adjust itself to a level approximating the season'scurrent production, i.e. to about 10 or 15 percent below consumption in 1949/50. There was and still is littleprospect of any substantial increase in the 1950/51 world clip over that of the previous season. Some temporaryincrease may be obtained from reduced culling and extra shearings, stimulated by high prices. On the otherhand, the moderate upward trend of production in Oceania has been adversely affected by Australian sheeplosses resulting from floods and increased epidemics in parts of Queensland and New South Wales. in SouthAfrica, the effects of drought losses will still be felt in 1950/51, but not the transient gain of wool from sheepkilled by the drought. Argentine sheep numbers may be slightly larger, but in North America the postwarincrease in wool prices has not been sufficient so far to halt the sharp decline in production which wasprompted mainly by high costs of wool-growing and more attractive returns from competing farm enterprises.The 1950 wool clip in the United States was at a record low, or about 3 percent below the 1949 level.
With continuing strong pressure of demand, distribution of the limited supply of wool available for con-sumption in 1950/51 can be considered on the basis of two alternatives. One alternative is the internationalallocation of supplies, which presumably would have to be based on jointly agreed priorities for defense andcivilian uses in consuming countries participating under such an arrangement. It is not possible at thisstage to predict the outcome of intergovernmental discussions on the question of controlled internationaldistribution, but it is clear that the adoption of this alternative would require drastic changes in the existingworld marketing organization, which is dominated by the highly competitive bidding of individual bu-yers in freeauction sales. In some respects, the establishment of international controls superimposed on existingvirtually uncontrolled national markets would raise even more difficult administrative problems than during theSecond World War. Then, the superstructure of international raw-material control could be built on the more
IFAO, World Outlook for Individual Farm Comntodities, August 1949, pp. 12-13, "Wool."
43

easily ascertainable requirements and prior ties of highly controlled internal economies equipped with govern-mental direction of industrial output, quantitative limitations on civilian consumption, and the control ofinternal price levels at different stages of manufacture and distribution. Yet, if problems of internationalallocation cannot be solved, the world will be faced with the second alternative of intense competitive biddingfor a limited supply of raw wool. In that case, civilian consumption presumably will be adjusted downward bythe slower but painful process of sharply rising retail prices for wool goods. The effects of previous raw woolprice advances are already being increasingly felt, especially in the home markets of countries with devaluedcurrencies, where the cost structure of the wool textile industries has been seriously dislocated by the highworld price of the raw material.
' Efforts are being made to supplement the limited and costly supply of new wool by maximum use of wasteand shoddy, synthetics and other fibers. The margin for increased consumption of these materials is probablysmall, however, because their use had already been stimulated by the high cost of new wool even before thelatest price advance. The price spread between wool and staple fiber was drastically widened in postdevaluationmonths. While prices of staple fiber have remained relatively stable, the supply of these materials available tothe wool textile industry is limited by existing over-all capacity for staple-fiber production and by the compet-ing needs of the cotton textile industry, where inducements to use staple fiber have also been strengthened byrelative price changes and, in a number of countries, by currency difficulties. Assuming that about one-fifth ofworld production of rayon staple fiber may be available for use by the wool textile industry, the supply of thesematerials available in 1950/51 may add about one-fifth to the season's wool clip, clean basis.
New supply of raw wool in 1951/52 may be somewhat larger than in the two preceding years, but, on thewhole, the response of wool production to a booming market is bound to be rather slow and indirect. Grazingcapacity in major exporting countries is limited by technical and economic factors and the downward trend inNorth American sheep numbers is not likely to be sharply reversed.
Hard Fibers
Recovery in aggregate output of the three major hard fibers was interrupted in 1949 for the first timesince the end of the war. A moderate gain in sisal output was offset by decreases in the production of abacaand henequen. Total new supply of these fibers was approximately 475,000 tons, or about 4 percent less thanin 1948 and just over nine-tenths of the 1934-38 average. The entire reduction from the prewar total wascaused by abaca output, which showed a drop of 53 percent. Loss of output in the Philippines has been muchgreater than the additions resulting from the wartime development of abaca cultivation in Central America.World output of sisal, on the other hand, reached a record high of more than 275,000 tons in 1949, or about114 percent of the 1934-38 average. Henequen production also remained above prewar.
The expansion of world trade in hard fibers from low wartime levels has been slower than that ofproduction, mainly because of increased consumption in some of the major producing regions. Aggregateexports of the three major hard fibers in 1949 showed little change from che 1948 total of just over 400,000tons, or about four-fifths of the 1934-38 average.. The portion absorbed by North America was considerablylarger than before the war, while Europe and Japan received smaller shares of the reduced total.
Sisal is the only major hard fiber exported from soft-currency areas. Europe, formerly the world'slargest abaca-importing region, is now meeting most of its hard-fiber requirements with sisal. United Statesdemand for this fiber also is higher than before the war, owing in part to purchases for stockpiling. Privatetrade in British East African sisal was resumed in 1949 for the first time since 1940. After devaluation,sterling quotations rose sharply and, in 1950, dollar prices were almost back to predevaluation levels, or atabout 31/2 times the 1934-38 average.
Abaca prices were affected by declining United States purchases in the first half of 1949 and by im-proved production later in 1949 and in the first half of 1950. The 24-percent decline from the exceptionallyhigh January 1949 peak still left abaca prices in mid-1950 at nearly 31/ times the prewar average.
Weakness in henequen markets developed early in 1949 and continued until late in the year, whensubstantial price reductions stimulated purchases by the United States, the principal market for this fiber.United States imports of henequen in the first quarter of 1950 were nearly twice as large as a year earlier.During the first half of 1950 henequen sold at just over 21A times the 1934-38 average and thus was relativelycheap in comparison with sisal, its main competitor.
44

Since the outbreak in Korea, abaca prices have fluctuated widely. Unusually large purchases by theUnited States cordage industry in early August produced a short-lived but very steep rise in prices of thisfiber. An almost equally sharp decline later in the month left abaca prices at the end of August about 14 per-cent more than the June average. During the first two months after the outbreak in Korea there were priceincreases of about 10 percent in sisal and 7 percent in henequen.
Outlook. Aggregate production of hard fibers is not expected to show any marked change in 1950. By1951, howevei, the fiber potential probably will be close to the prewar level.
Benefits from postwar plantings of abaca in the Philippines are now being felt. In 1950, for the firsttime since 1947, there are good prospects for a considerable improvement in world output of this fiber. Givenfavorable prices of abaca as compared with those of other major export crops of the Philippines, abacaproduction may show further recovery in 1951, although it will probably still remain far below the prewaraverage. Central American output in 1950 and 1951 is expected to be somewhat below the 1949 level ofapproximately 15,000 tons. In August 1950, the U.S. Congress enacted legislation with provisions fordoubling the area of the U.S.-financed abaca projects in this region, but a minimum of three years will be re-quired to bring the new development into production.
The upward trend in world output of sisal is being retarded by the aftermath of severe drought in BritishEast Africa. Under more normal growing conditions, the effects of expanded postwar plantings in Africa andLatin America should again become apparent. A moderate increase in Indonesian output of hard fibers is inprospect, but apparently rehabilitation is proceeding slowly. It is unlikely that Indonesia will again be ableto contribute significantly to the world supply of hard fibers in the next two years.
Henequen output, which had been about one-fourth above prewar in 1947 and 1948, declined in 1949 andearly in 1950, owing to the depressing effect of excess stocks accumulated in Mexico in 1949. Production inMexico is again reviving, however, and some further recovery seems probable in 1951.
Hard fibers supply the raw material for a large share of the world's cordage, especially marine and otherheavy-duty ropes. With the prospect of larger military and civilian requirements for cordage, a substantialincrease in hard-fiber demand in the next two years may be expected. Moreover, increases in United Statespurchases of abaca and sisal for stockpiling appear likely. Thus, although considerable improvement in worldoutput over the next two years is anticipated, there is reason to believe that a very tight position in thesefibers may develop in the near future.
J ute
The world shortage of jute, which has prevailed throughout the postwar period, was intensified in 1949/50by the disruption of Indo-Pakistani trade following Pakistan's decision against currency devaluation. Thetrade deadlock was broken in April 1950, when the two Dominions signed a trade agreement providing, interalia, for the exchange of Pakistani jute fiber and Indian jute manufactures during May-July 1950. By a sub-sequent amendment to the agreement, delivery dates were extended to the end of September.
The slow rate of recovery in world jute production has been due mainly to shortage of food and high riceprices in the subcontinent of India. Despite a moderate increase over the previous season, estimated worldjute output for 1949/50 was only about 1.5 million tons, or four-fifths of the 1934-38 average. Even before theIndo-Pakistani trade deadlock, intercontinental trade in raw jute had recovered even less than production.Faced with an over-all shortage of raw-material supplies, India reduced its shipments of jute fiber in order tomaintain its mill activity and exports of jute manufactures. Pakistani shipments to overseas markets were notlarge enough to redress the balance. Thus, the proportions between world trade in jute fiber and jute manu-factures were drastically changed. Exports of raw jute from the subcontinent of India in 1949 were just overone-half the 1934-38 average, while exports of Indian jute manufactures were nearly nine-tenths of prewar.
Calcutta quotations for raw jute during the week before devaluation were nearly six times the 1934-38average. Following the interruption of trade between the two Dominions, Palcistani jute prices broke sharplybut floor prices established by the Pakistan government in late October still left the cost of Pakistani jute,landed Calcutta, well above the official ceilings which had been established in India at the beginning of themonth. Although dollar prices of jute in the first half of 1950 remained somewhat below the mid-September1949 level, they were still more than 3Y2 times the 1934-38 average. Comparable series are not yet available
45

for later months, but trade reports indicated little change in jute quotations in the New York market throughJuly and August.
Outlook. The Government of Pakistan's preliminary forecast of jute area in 1950/51 indicates an 18-percent decline from the final estimate for 1949/50. Trade estimates of the Pakistan crop anticipate higherproduction than in the previous season, but these appear to be unduly optimistic, despite the fact that growingconditions have been much better this year. Because of the critical deficit that developed in late 1949, fol-lowing the loss of imports from Pakistan, India accelerated its drive toward self-sufficiency in jute. Shortlybefore the planting season, the production goal for 1950/51 was raised to a level about 60 percent aboveestimated output in the previous season, when a gain of just over 50 percent was realized. No officialestimate of the Indian crop is yet available, but preliminary indications suggest that output will fall consider-ably short of the goal. It is tentatively estimated that total Indo-Palcistani jute production in 1950/51 may beabout 10 percent higher than in 1949/50. Thus, the supply position is likely to remain tight in 1950/51.Intercontinental trade in jute fiber may show a considerable improvement, however, since recent expansion inbaling-press and port facilities may enable Pakistan to increase direct shipments from Chittagong to more thantwice the 1949 rate. Total intercontinental trade in raw jute probably will still remain appreciably below pre-war, since exports from India are likely to remain small. India's fiber reserves are depleted, and, althoughdomestic production is being rapidly expanded, India is still faced with a serious jute deficit.
The prolonged world scarcity and high prices of jute have stimulated the use of substitute materials.Multiwall paper sacks are supplying a greatly increased share of total bag demand in the United States, whichis the world's largest consumer of jute goods. A similar situation exists in Canada., also an important marketfor jute. North American burlap consumption has declined markedly in the past three,years, and the 1949 total isestimated at less than 90 percent of the prewar average.. Some recovery in consumption occurred in late 1949,however, but improvement has been retarded by difficulties in obtaining supplies from India. Scarcity of juteis prompting a number of countries to develop or ex-pand, at considerable expense, production of long vegetablefibers which can be used as jute substitutes, but output of the new fiber crops is still comparatively small.With the short-run demand for jute likely to increase substantially as a result of expanding industrial and de-fense activities, jute will probably continue in tight supply in 1950/51 and 1951/52.
FISHERIES P RODUCTS
After an upsurge which began in 1945, world landings of fish now seem to be stabilizing on the 1948level, which FAO estimates to be in the neighborhood of 25 million metric tons. In Europe, where the returnsfrom the North Sea are noticeably smaller, total quantities landed in 1949 amounted to some 5.7 million metrictons as compared with 5.9 million tons in 1948. In North America, 1949 landings were estimated at 3.6million tons, compared with 3.2 million tons in 1948. In South America, 1949 landings have been estimated at435,000 tons compared with 425,000 tons in 1948. In Japan, which is the only country in Asia for which com-plete statistics have been reported, 1949 landings amounted to some 3.175 million tons against 2.45 milliontons in 1948. Prices generally declined in 1949, however, owing to larger supplies and lower prices of com-peting foods. Lay-up of craft because of depressed markets increased somewhat, and net income of fishermengenerally declined. Great interest has been shown in the expansion of fisheries inunderdeveloped areas, butsuch programs take time; no significant increase in world landings is expected during the next few years.
Reports from eight countries, which in 1949 accounted for 6.4 million metric tons or 25 percent of worldlandings, indicate an over-all increase of some 16 percent for the first five or six months of 1950 over thesane period during 1949. This, however, is basically due to a large increase of herring landings in Norway,of which 85 percent was converted to oil and meal.. 1950 landings as percentages of 1949 landings were as followsfor the individual countries: Canada 114, Denmark 99, Iceland 103, Ireland 98, Netherlands 87, Norway 137,United Kingdom 95, and United States 116.
The continued expansion, at high costs, of fishing fleets in many countries contrasts with relativelymoderate increases in catch, sharply rising operating costs, and slowly declining fish prices. The U.S.monthly index of wholesale prices for fish and fisheries products (1947 = 100) shows an average for 1949 of101.7 compared with 110.0 for 1948. The index figure for May 1950 was 94.7 compared with 100.9 in May 1949;
46

in July 1950 it reached 97,5 as compared with 96.8 in July 1949. The "Consumers Price Index for Moderate-income Families for Large Cities Combined" in the U.S.A. shows a 7-percent decrease in fish prices from May1949 to May 1950. In the United Kingdom, where cod has been described as flooding the rather sluggishmarkets, average prices for this species went down from about £38 per metric ton in January-July 1949 to about£29 in the same period of 1950. In a few other countries a different trend is shown: Canada's wholesaleindex shows an increase, and in Norway prices to fishermen during the 1950 spawning cod season went abovethe fixed minimurn.
The fishing industry is in the painful process of adjusting itself to keener competition with other food-stuffs, now available at lower prices and in greater abundance. In March 1950 Iceland, heavily dependent uponfish exports, devalued the krona specifically to stimulate such exports. In the United Kingdom the whitefishand herring industries are described as experiencing a serious crisis, and on 5 July 1950 subsidies were intro-duced for six months to assist catchers of whitefish in the near and middle waters, including inshore fishermen.Further restrictions on imports may be considered. In Portugal a great number of sardine fishing craft wereshowing deficits in their operations. Increasing lay-ups of fishing craft, owing to lack of profitable markets,have been reported.
The decline in demand for fish appeared to be primarily a result of the greater availability and often lowerprices of competing foods. In an attempt to attain a higher degree of self-sufficiency in food supply and a morediversified economy, fisheries have been expanded in consuming countries which used to import considerablequantities. Also, the fleets, in countries where war damage was great-, have now been reconstructed and im-ports have been cut down.
A large increase in the quantity of salted cod produced during 1950 and a further decline in production ofthe less expensive varieties of salted herring also are likely. Production of oil and meal will probably increasefurther, even without the impetus of more favorable prices, because that is the best outlet when other channelsare not as favorable. Prices of fish and fisheries pr iucts might be p,-evented from slipping further to lowerlevels, and be stiffened at present or even higher levels should an appreciable increase in the prices of com-peting foodstuffs emerge. It is to be noted, however, that the changing economic pattern as influenced by theinternational situation might result in sharp increases in labor and other operating costs.
Fresh and Frozen Fish
The quantities of fish marketed as fresh and frozen in 1949 were, according to reports from 15 countries,somewhat larger than in 1948, but this situation has been changing rapidly during the first few months of 1950,when demand from importing countries declined.
In the United Kingdom, imports of fresh and frozen fish during January-July 1950 amounted to only 62,200metric tons as compared with 119,000 metric tons during the same period in 1949 and 137,000 metric tons duringthe same period of 1948. Such changes in the supply pattern of the principal European consuming centers arealso reflected in the export statistics of the principal suppliers. Iceland's export of fresh arrl frozen fishduring January-July decreased from 94,500 metric tons in 1949 to 34,400 tons in 1950. The export statistics ofNorway show a considerable decline in the exports of fresh fisheries products excluding herring: 16,600 tonsduring January-May 1950 compared with 32,800 tons during the same period of 1949.
Salted Fish
In Europe, much larger quantities of groundfish are being salted and it is likely that world production ofsalted cod in 1950 will exceed 300,000 metric tons, which is expected to meet the demand. The increase ismainly owing to the switch from fresh and frozen products which is now taking place in Iceland, dictated bydrastic cuts in the imports of fresh fish into European markets, particularly Germany and the United Kingdom.
For salted herring there will possibly be a further decline in production, owing to a relatively unfavorablemarket outlook for this product. During the 1950 winter-herring season in Norway, the quantity salted was re-duced to about half of what it was in 1949.
47

Canned Fish
Production of the relatively high-priced canned sardines, such as that in the countries of Southern Europe,hinges almost entirely on the availability of fish, which has been very low during recent years. Disruption ofthe prewar marketing pattern has caused difficulties for established producers and for new producers just enter-ing the field. There is a downward tendency in the prices of less expensive canned sardines. Canned salmonwill probably be produced in the same quantity, stimulated by a relatively good market outlook in the U.S.However, competition from the U.S.S.R. may tend to reduce the European market for North American exports.
U.S. production of tuna, which reached a peak in 1949, is not likely to increase substantially during thisyear. The U.S. market, by far the most important, may not be able to absorb much larger quantities. Domesticproducers have expressed some fear of competition from Japan and other countries where tuna packing is beingrevived or initiated.
Oils and Meals
It appears likely that a relatively larger proportion of the 1950 landings of herring and allied species, andin some countries other species as well, will be converted into oils and meals. Both body oil and liver oilprices have dropped considerably since the war. Fish meals from soft-currency countries still move relativelyeasily; in the United States and Canada, production faces competition with imports and with the synthetic"animal protein factor." Whether fisheries which are largely based on oil and meal production can beoperated at a profit during the next year may largely depend on the extent to which recent technological im-provements--which are being worked on diligently--can be applied to match the increasing competition fromother products.
FORESTRY PRODUCTS
Softwood Lumber
World production of softwood lumber for 1949 appears to have been about 3 percent smaller than in 1948,although inclusion of figures from the U.S.S.R. might change this trend. World trade in 1949 was about 5 per-cent greater in volume than in the preceding year, but still considerably below the prewar level. Consumptionof lumber declined less than 1 percent. Supplies available in 1949 were adequate for the effective demand,which was still limited in a number of countries by currency difficulties.
During the first half of 1950 levels of production, consumption, and trade tended to rise throughout theworld as a whole.
The determining factor for the lower 1949 world production of softwood lumber was an 8-percent decline inthe United States output as compared with 1948, from 14.3 million standards to 13.2, and a 9-percent decline inCanadian production (from 3.20 million standards in 1948 without Newfoundland to 2.92 million in 1949 withNewfoundland). This was partly offset by increased production in Europe and Brazil. United States productionin the first half of 1950 was 15 percent above the figure for the corresponding period of 1949.
European production in 1949 was somewhat higher than in 1948. The 1948/49 felling season was favorablein almost all producing countries, demand was strong, and firm prices stimulated output. The largest gain wasin Scandinavian countries.
World trade continued to be marked by low exports from North America and the U.S.S.R. The reduction inex-ports from Canada to countries other than the United States was more pronounced than ever in 1949. Exportsfrom North America to overseas markets dropped from 74 percent of total exports in 1947 to 47 percent in 1949.The percentage of total European softwood exports going to markets outside the continent declined from 17 per-cent in 1947 to 15 percent in 1949.
The total volume of European trade in softwood lumber during 1949 increased about 20 percent over thepreceding year. Total imports from European sources were 1.9 million standards, 26 percent over 1948. Swedenand Finland together supplied over 60 percent of all imports, the rest coming principally from Austria, Czecho-slovalcia, Poland, and Yugoslavia. Canada supplied 260,000 standards as against 295,000 in the year before,
48

and a relatively small amount came from the United States. While the United Kingdom's imports, 1.09 millionstandards, were 24 percent above 1948, they were still only about one-half of its 1937 imports. During thefirst half of 1950 imports into the United Kingdom showed a marked decline. Imports of other Europeancountries, particularly the Netherlands, Denmark, and Italy rose during 1949, but those of France and Belgiumdeclined.
Canadian exports of 1.07 million standards were 9 percent less than in 1948. The decline resultedprincipally from a decrease in the exports to Canada's principal markets, the United States and the UnitedKingdom, which in 1949 took 63 percent and 22 percent respectively of total Canadian exports.
United States imports totaled 728,000 standards -- 14 percent lower than for 1948. Sharp increasesoccurred late in the year and have continued. Imports during the first half of 1950 were 130 percent abovethose of the corresponding period last year and were nearly equal to the total for all of 1949. Exports from theUnited States in 1949 increased somewhat as compared with 1948, but were still only barely half of prewar.Australia, Korea, Mexico, and the Union of South Africa took larger quantities of United States lumber than in1948, while Europe, Central America, and South American countries took less.
Latin American countries had to curtail their imports from Canada and the United States considerablyduring 1949 because of currency difficulties. Brazil has made new contracts for shipment of lumber toArgentina, the United Kingdom, and Uruguay.
Except in the United States and Canada, the trend in lumber consumption continued strongly upward in1949, as most countries tried to meet the accumulated and still accumulating demand for construction and newhousing. In Europe, where consumption had risen by 10 percent between 1947 and 1948, a further increasetook place, bringing total consumption about in line with production. This level is still considerably underthe prewar average consumption. The main reasons for this situation are a continuation of the relatively lowlevels of consumption in the United Kingdom and France, and the use of costlier but more readily availablesubstitute materials such as hardwood, steel, and pulp products in a number of Western and Central Europeancountries.
In the United States, total consumption of softwood lumber during 1949 totaled 13.5 million standards, adecline of only 5 percent from the 1948 level, despite the larger drop in production. Toward the end of theyear, demand was strong and rising.
New construction during the first half of 1950 was, in terms of new homes started, 53 percent higher thanduring the same period in 1949. Consumption of softwood lumber mounted from month to month and wasestimated at some 8 million standards for the first half of 1950, a record high.
In Canada, despite reports of unprecedented building and construction activity, consumption of softwoodlumber in 1949 was lower than in 1948. Relatively important increases in consumption over the precedingyear took place in Australia, Brazil, Chile, and some other South American countries.
Prices of softwood lumber for 1949 in most countries were only slightly higher than in 1948, except inthe United States, where they increased steadily after August. In Canada, prices were stable during the yearuntil November and December 1949, when increases occurred as a result of devaluation. During August andthe first half of September 1950, lumber prices in the United States were steadily rising. This trend has adirect effect on Canadian export prices and probably an indirect effect on lumber prices in Europe. In Europe,export prices were stabilized at comparatively low le veis at the beginning of the second quarter of 1949 andremained there until the end of the year, when they began to rise. Prices increased in the Scandinaviancountries, which supply 60 to 65 percent of total European exports. The already strong demand for lumber wasfurther stimulated in a number of countries by the lifting of regulations against private trading. There was anincreasing dependence of European importers on Scandinavian supplies in the absence of large U.S.S.R.exports and because of the tight dollar situation.
Out/ook. World production of softwood lumber in the remainder of 1950 and in 1951 is expected to show adefinite increase over 1949, barring any forced shifts of production and consumption that might result fromdevelopments touched off by the conflict in Korea. The anticipated consumption requirements of softwoodlumber will outstrip expected world production by a considerable margin during that period. Supplies availablefrom stocks are limited and have already been drawn upon in early 1950. Such market conditions will make forfirm or rising prices through 1950/51. The volume of trade in 1950/51 should increase compared with presentlevels, particularly United States imports and Canadian exports.
49

In the United States, restrictions on credit for housing, issued after the outbreak of hostilities in Korea,are expected to have only a limited effect upon the lumber market in the second half of 1950. IncreasedCanadian production is expected during the rest of 1950 and in 1951 to satisfy domestic and export markets.Canadian demand for lumber will increase considerably over 1949 levels.
Canadian exports are expected to be considerably above the 1949 level, not only to meet the higher U.S.demand but also to serve other traditional Canadian markets where the gap between consumption and pro-duction has widened.
In Europe, no sizable increase over the present production level can be expected during the remainder of1950 and 1951, as the production capacity of both the Scandinavian and Eastern European countries is limited.Timber consumption, on the contrary, might expand considerably. Controls over the rate of constructionare limiting consumption, particularly of such important consumers as the United Kingdom and France. Furthereconomic improvement and changes in import policies would increase their demand for lumber within the nextfew years.
German lumber requirements for the rest of this year and for 1951 will increase total European demandconsiderably. Although supplies for 1950 are thought to be sufficient to meet effective demand in Europe, it appears thatin 1951 a balance between consumption and supplies can only be achieved through more imports from theU.S.S.R., North America, and South America. Imports from the U.S.S.R.. in 1950 are expected to show someincrease as compared with the previous year.
An increase in both output and consumption during the balance of 1950 and in 1951 is foreseen forAustralia and New Zealand. Production may be 105,500 standards in 1951 in Australia, against an estimatedconsumption of 242,000 standards. New Zealand expects to increase its production enough to satisfy the newhigh levels of domestic demand and also to increase its exports.
Wood Pulp
In 1949, world production and consumption of wood pulp was very close to that of 1948. During the firstmonths of 1950 the production rate in North America and Europe was somewhat higher than a year before anddemand appeared to be growing steadily. Production in japan in 1949 rose one-third over 1948 levels. Tradein wood pulp followed its established pattern, with the United States absorbing most of Canadian exports, withEuropean, mainly Scandinavian, exports supplying all world markets, and with some North American exportsgoing overseas. Exports in 1949 were 4.94 million tons or 5 percent greater than in 1948, despite a drop of200,000 tons in Canadian exports. The first months of 1950 showed a rising trend, especially in U.S. imports.United States market prices for wood pulp are followed closely in other markets. The gap, which immediatelyafter devaluation existed between United States prices and prices in devaluing countries, had almost completelydisappeared by mid-1950. The outbreak of hostilities in Korea upset the relatively homogeneous price pattern.In late 1950 the trend was toward higher pulp prices with prices for individual prompt deliveries completelyout of line.
Although it was estimated that in 1949 there was well over 5 million tons of idle pulping capacity in theworld, new wood-pulp mills were being built everywhere. In North America, over 2 million tons of new capacityhave come or will soon come into operation. A number of countries in Western and Central Europe are planningto construct new mills and modernize old ones; Australia and New Zealand are expanding their pulping capacity,and in Asia and the Far East new pulp mills are also projected. One of the principal reasons for expansion wasthe desire to make economic use of the waste materials of other woodworking industries.
United States imports in 1949, amounting to 1.6 million tons, were one-fifth less than in 1948. Of theseimports, 1.4 million tons came from Canada, 14 percent less than a year earlier. United States imports from
Sweden and Finland dropped 30 and 20 percent respectively from 1948 levels. The Canadian share in the U. S.market has risen steadily at the expense of supplies from Europe, rising from 30 percent in 1937 to 75 percentin 1949.
During the first seven months of 1950, imports of Canadian and Scandinavian wood pulp into the UnitedStates showed considerable increases over 1949. Imports of most grades of Scandinavian pulp into the UnitedKingdom increased during the first half of the year, as compared v.,ith the corresponding period a year ago,while imports from Canada declined.
The total volume of European wood-pulp trade for 1949 was higher, with total exports up 14 percent and
50

imports up 11 percent. Swedish exports increased over 200,000 tons, Norwegian over 100,000 tons, andFinnish over 60,000 tons. Imports into the United Kingdom increased by 160,000 tons over 1948; imports intoItaly increased by 100,000 tons, and those into France by 80,000 tons. Imports into the Netherlands andSwitzerland each decreased by 50,000 tons.
Newsprint
Newsprint manufacture accounts for about 28 percent of the world's consumption of wood pulp.Production of newsprint in North America reached a new high of 5.5 million tons in 1949. As compared
with 1948, Canadian output increased by 2,8 percent and U. S. output by 3.5 percent. North American millcapacity has recently been increased and will be further increased. In practically all European newsprint-producing countries output increased over the preceding year. The largest production gain, more than140,000 tons, was shown by the United Kingdom. In Europe there still was much idle capacity owing to aninadequate supply of raw material.
North America uses three-fifths of the world's production of newsprint. In 1949, newsprint consumptionin the United States exceeded all previous records with a total of 5 million tons, an increase of 56 percentover the prewar level. Some 80 percent of U. S. consumption is now supplied by Canadian mills. Comparingthe five postwar years 1946-50 with the five prewar years 1935-39, newsprint consumption in the UnitedStates has increased by more than 1.36 million tons a year, while consumption in the rest of the world hasshown a decrease of 1.13 million tons per year. Prices in the United States advanced from $90 to $100 perton during the first seven months of 1948, and held unchanged at that price through 1949 and into 1950.
In 1949, 86 percent of Canadian production of newsprint went to the United States, 7 percent to otherforeign markets, and 7 percent to domestic markets. United,States imports from Canada were in 1949 nearly4 million tons. In Australia, Latin America, and the United Kingdom, newsprint imports from Northern Europehave, to a great extent, replaced decreasing imports from Canada,
Outlook, Wood Pulp and Newsprint
1X'ith higher levels of general economic activity in North America particularly, it is expected that produc-tion and consumption of xvood pulp and newsprint will continue to expand in the latter part of 1950 and in 1951.For the next few months the situation will continue particularly tight, with most importing countries trying tosecure adequate supplies. Since the outbreak of hostilities in Korea, the building up of pulp stocks has beenvery active and consumption has increased. It is not likely that Canada can step up wood-pulp exports to anymarked degree in the long run, since the requirements of the greatly expanded paper industry of the countrywill have to be met. The trend in prices is strengthening. Trade in pulp and newsprint is sensitive to thedevelopment in international politics, and changes in the import/export pattern can occur quickly.
51

PART III. AGRICULTURAL DE A D CONDITIONS IN 1949/50
Summary
Domestic demand for farm products was generally well sustained in 1949/50. The farm output, ofabout the' same size as a year earlier, was sold in 1949/50 at generally sustained prices and real returns. Thiscontrasted with the sharp fall in prices in 1948/49 from their previous high peak. Farm prices and incomes round theworld generally remained well above prewar, both absolutely and in relation to the buying power of othergroups.
In regions dependent on self-sufficient agriculture, farm and handicraft production continued expandingslowly, with slightly rising standards of living, except where prevented by political or military disturbances.
In commercial agricultural regions, production in 1949/50 was about the same as in 1948/49, cropvolume being slightly lower and livestock output slightly larger. The physical volume of industrial productiongenerally increased, except for the temporary downturn in the United States, national income and incomes paidconsumers were better maintained, and expenditures for food generally were sustained or increased, providingthe basis for sustained farm income.
International trade in farm products remained at about the same volume, with less wheat but morecotton. Trade in other products continued to expand and exceeded prewar, while trade in farm products remainedwell below prewar.
The structure of international trade changed, exports from the Americas declining, and exports fromother regions rising. Some Far Eastern and Latin American countries again began to become net dollar earnersafter the devaluation.
Devaluations were accompanied by increased restrictions on dollar imports. Closely followingdevaluation there was a marked economiC recovery in the United States and a strengthening of world markets,especially for a number of agricultural commodities. These combined developments have apparently (a)improved the position of devaluing countries exporting raw materials relative to those exporting manufacturedproducts; (b) improved the opportunities for export from Europe to the rest of the world; (c) reduced somewhatbalance-of-payment shortages; (d) improved the terms of trade of dollar countries, but (e) made it more difficultfor them to maintain exports.
The flow of international funds in 1949 was at about the same rate as in 1948, but was concentratedeven more in gifts and grants from the U S. Government. Private capital investment increased slightly, butwas still only one-tenth of the total. The flow of funds declined in early 1950, and this decline will probablycontinue in 1950 and 1951 unless new measures are developed.
Agricultural production was generally larger in 1949, and food supplies improved sharply in many countriesin 1949/50 (see Appendix, Tables A and B). Changes in supplies in 1949/50, and in the resulting foodsituation, have been reported in the FAO Monthly Bulletin of Food and Agricultural Statistics and in therecurring reports on the world food situation.1 The changes in the demand for farm products in 1949/50 and inthe economic situations underlying that demand, not previously reported, are reviewed in this section.
WORL D REVI EW
Internal Conditions
The domestic demand for farm product > was generally well sustained in the 1949/50 consumption year(July-June). In most parts of the world, supplies of farm products of about the same size as a year earlier
1For the latest World Food Appraisal see the May 1950 issue of the FAO Monthly Bulletin of Food and AgriculturalStatis tics, Vol. III, No. 5, pp. 29-56.
52

Cha rt 1
80 Belgiu
./60
o
40
Mil Sweden ... ****** ........
11.1402AS 111X12telea-1- glaggia os,
111
111111111111111Warilli111111111.111111110011United KingdoM
11111101.lifli 11H
,/
11111111111111 1111111111
Greece (19 9. 00
Aust
/.= 1 1
Germany (Bizone)(1936 100)
1
orta.
Luxembourg
1
******* -**........ i......Germany (Trizone)
(1936.1001
..
,.
20J FMAMJJASON947
FAO ECONOMICS ANO STATISTICS DIV1SION
Belgium and Sweden: Adjusted for seasonalvariation and number of working days.
Denmark, France, Norway, and TrizoneGermany: Adjusted for number of workingdays.
Germany: Bizone only for 1947 and 1948.Bizone and French zone combined from1949 on.
Ire/and: Quarterly averages
United Kingdom: Partially adjusted for num,ber of workingVays.
INDICES OF INDUSTRIAL PRODUCTION
INDICES DE LA PRODUCTION INDUSTRIELLE
INDICES DE PRODUCCION INDUSTRIAL
**z_,
Belgique et Suide Ajustés, compte tenu des varia-tions salsonnières et du nombre de jours ouvrables.
Danemark, France, Norvège et Allemagne (Trizone)Alustés, comete tono du nombre de jours ouvrables.
Allemagne : Pour 1947 et 1948, 81zone seulement:partir de 1949, Bizone et zone française combi-riges.
!Hiende : Noyennes trimastrielles.
Royaume-Uni : Partiellement ajustés, comete tenu danombre de jours ouvrables.
53
M J JASONDJFMAMJJ19 49 1950
ECONOM/C ANALYSIS BRANCH -50-3PM) Chart No. 354
Bélgica y Suecia: Ajustados tomando en cuenta loscambios temporales y el número de días laborables.
Dinamarca, Francia, Noruega y Alemania (Trizona):Ajustados tomando en cuenta el número de díaslaborables.
Alemania: Para 1947 y 1948, Bizona únicamente; apartir de 1949, Bizona y zona francesa combi-nadas.
Irlanda: Promedios trimestrales.
Reino Unido: Parcialmente ajustados según el númerode días laborables.
NI -111111MDerupar L.. . . ***7...,1 ...t ... ... ............
AllIn..411nallianIMMIRVIIIIMI7therlandslaMinrill
..7.: ,gop_
III111ME 11111111111iffirnam im imaimm
160140
120
100
80
60
**********
treiglyi*. **
......*** ..=~1M1111
France
I
WESTERN EUROPESEMI-LOGARITHMIC SCALE
40120
D J FMAMJ JASONDJFMA948
160
140
120
00
8070
160
140
120
00
8070
o
100
100
80

FAO ECONOMICS ANO STATISTICS DIVISION
Czechoslovakia. Finland, and United States:Ajusted for number of working days.
Canada: Adjusted for seasonal variation andnumber of working days.
Chile: Excluding mining, including buildingand electricity
Finland: 1948-50, quarterly averages.
Mexico: Quarterly averaget:
Po/and: Prewar territory.
300
200180160
14
120
100
80
70
AMJJA SONDJ FMAMJJ A1947 1948 1949
Tchécoslovaquie, Finlande et Etats-Unis : Ajustés,
compte tenu du nombre de jours ouvrables.
Ganada Ajustés, comete tenu des variations sal-sonnières et da nombre de jours ouvrables.
Chill : don compris l'industrie minière, y comprisl'Industrie du batiment et de l'électricité.
Finiande : 1003-50, moyennes trimestrielles.
Mexigue : Moyennes trimestrielles.
Pologne : Territoire d'avant-guerre.
54
ECONOMIC ANALYSIS SRANCH -50-4FAO Chart Mc. 355
Checoeslovaquia, Finlandia y los Estados Unidos deAmérica: Ajustados según el niSmero de días labo-rables.
Cenada: Ajustados tomando en cuenta los cambiostemporales y el número de días laborables.
Chile: Excluyendo la industria minera e incluyendolas de construcción y la eléctrica.
Finlandia: 19411-50, Promedios trimestrales.
México: Promedios trimestrales.
Polonia: Territorio antes de la guerra.
Bulgaria
1 . i , Poland....._ . (1938,--100)
I
-----,--1r.--,..
".. . 1t_.___.
Finland
:-......... i
_.
1
[
" 1 ' -....oo. ''''' °see. O. 1,
I i N / I !
1.. V/.0"
..CzechoslovakiaI No ° " i1 ' I i 1 1
I
I
1 1
1
I I
1
1
I
Ganada1 ,1
.....,,,,
1 11
. ..... , . ....0....
I1U.S.A.
1 i
I
1
1/ 1%
C'hile 1
./..----1 iPiIN:[rj
1 4
_L ..."\ ,..."/1
.
I/ NI .t. ...%
ii '
........
!
COMexi
-.
I
J
-.: .... I
1
I
..In
r"I
'
..........
Chart 2 INDICES OF INDUSTRIAL PRODUCTION
INDICES DE LA PRODUCTION INDUSTRIELLE
INDICES DE PRODUCCION INDUSTRIAL
1937=100
SEMI-LOGARITHMIC SCALE OTHER PARTS OF THE WORLD
SON DJ FMAMJ J A SO NO J F MAMJ J1950
200
18
16
140
12
00
18
16
140
12
10

were disposed of mostly at prices which, compared to prices of other products, meant no great change in thereal income or buying power of farmers. This was in striking contrast with the conditions of the precedingyear, 1948/49, when relative prices of farm products and incomes of farmers had declined in most parts of theworld frorn their previous very high postwar level. Despite the decline in farm income and purchasing powerin the Americas in 1949/50, the relative economic position of farmers around the world generally remainedwell above prewar, both absolutely and in relation to the buying power of other groups.
In the large regions dependent on self-sufficient agriculture, except in those disturbed by political orsocial unrest or warfare, the production and consumption of farm products and the production of handicraftproducts continued a slow expansion, with slightly improved rural standards of living.
In the regions of commercial agriculture, production was not much different from that of a year earlier.Slightly lower crop production (see note, Table B) was offset by somewhat larger livestock output. Thephysical volume of industrial production, meantime, was substantially larger than a year earlier, except in theUnited States of America and a few other countries (see Charts 1 and 2). The levels of national income andof income paid ro consumers were even better maintained, resulting in expenditures for food purchases in mostof these countries as large as or larger than those of a year earlier. In the United States, which had suffered froma mild recession in the previous consumption year, industrial production recovered strongly and incomesstrengthened.
The 1950/51 consumption year thus began with world levels of economic activity and domestic demandfor farm products well above those of a year earlier.
In the United States, consumers' expenditures ran about as high in 1949/50 as in 1948/49, but decliningexport outlets and accumulating supplies resulted in continuous pressure on farm prices and generally lowerlevels of farm buying power.
In Canada, farm incomes, though helped by sustained domestic economic adtivity, were also slightlylower in 1949.
In Europe, food supplies became somewhat easier as a result of two good crops in succession, and foodrationing and controls were further moderated or removed. The effects on farm income differed widely with thedifferent price-control and subsidy systems. In most European countries there was a steady increase in realincome and consun-ers' expenditures, and farm income was apparently sustained at or near the relatively highpostwar levels. In some countries, however, France for example, the real income of workers has not regainedthe prewar level, and the increased supplies of livestock products could be sold only at prices materiallyreduced from the previous high levels. This, combined with reduced crop output in France, probably resultedin a somewhat lower farm income in that country.
In Eastern Europe and the Soviet Union, real incomes continued to expand above their still very low percaput levels, with substantial increases in both farm and industrial output. There were substantial readjust-ments in pricing and rationing methods in various countries, and some sharp reductions in levels of fixedfood prices.
In Latin America, although a somewhat larger commercial farm production than a year earlier sold atprices generally higher, prices of other products advanced even more. While the rnoney income of farmerswas generally larger, their purchasing power was about the same as in the preceding year. Exports lowerthan in the preceding year offset expanding domestic demands.
In the Near East, domestic supplies of both agricultural and industrial consumer goods were moreplentiful in most countries, and declining prices through 1949 indicated a shift to a buyers' market, except inIsrael, Jordan, and Turkey.
In Asia, economic and political disturbances hampered economic activity, and farm output and dom esticmarkets were about the same as a year earlier. Export demands generally improved in the soft-currency butdeclined in the hard-currency countries, bringing some improvement in real farm income to the soft-currencycountries but sine decline to the hard-currency group.
In Oceania, farm output increased and prices for farm products rose, with rising export demands fromboth hard- and soft-currency countries, and higher prices on advance purchase contracts. Farm income, both inamount and in real purchasing power, showed more relative improvement in 1949/50 than in any other region.
Retail food prices remained about as high as or higher than other elements of the cost of living ascompared to the prewar relationship (except in some Latin American countries). This was generally true alsoof the wholesale prices of farm products compared to the general wholesale price level. (See Charts 3 and 4.)
55

Chart 3 WHOLESALE PRICE INDICES: RATIO OF AGRICULTURAL PRICES TO ALL PRICES
INDICES DES PRIX DE GROS : RAPPORT ENTRE LES PRIX AGRICOLES
ET LES PRIX EN GENERAL
INDICES DE PRECIO AL MAYOREO: RELAC1ON DE LOS PRECIOS AGRICOLAS
CON LOS PRECIOS EN GENERAL
1937=100
70
160
150
140
130
120
110
100
90
130
120
110
90
130
20
110
00
90
80
110
100
90
105
10
90
80
EUROPEAN COUNTRIES
France (1938.100)
111111111111 1111 Austria` .
O
................ ,,..Portugal---J F MAMJJASONDJ F M
N etherl ands 9938/39.100'
o* ...... . ..... ..***..
1947 1948 949 I 950JA SONO J F MAMJJ A SON D J F M A MJ J
00
00
100
100
100
56
FAC Chart No. 352
Checoeslovaguia y Finlandia: Los productos agricolasincluyen forrajes.
Portugal: Lisboa.
Finland 1
11II11111111
14NHungary
N,1
,. 441
Jan 947 001 E
I MIME111E1- , 1 =
0936-38=100r'Belgium InglinillMI
di11111111111111E
.....- ,,... asmaass ....
-..a. o. me
-
.....* .ft __I_ ...
Il 1E111 11111=11111111e I
IMICIrld (at 192580 1001 .... ... ..
I .*/111ValY (1938.100)
Swe1deInH I I (I 111111 1111111 1
,
1 .. ...J, II ... . .L...1 i
. ..NorwaY I ' . ) .. I ..-7111';
1...1.1 .. ,*-. ...,
.. :, 1 1, °7.1 _. ,
Czechoslovakia and Finland: Agricultural Tchicosiovagule et Finlande : Les produits agrico-prices include fodder. les comprennent /e fourrage.
Portugal: Lisbon. Portugal : Lisboane.
FAO ECONOMICS ANO STATiSTICS DIVISION ECONOMIC ANALYSIS BRANCH -50-I

Chart 4 WHOLESALE PRICE INDICES: RATIO OF AGRICULTURAL PRICES TO ALL PRICES
INDICES DES PRIX DE GROS : RAPPORT ENTRE LES PRIX AGRICOLES
ET LES PRIX EN GENERAL
INDICES DE PRECIO AL MAYOREO : RELACION DE LOS PRECIOS AGR1COLAS
CON LOS PRECIOS EN GENERAL
1937=-100
150
140
130
120
110
100
130
120
110
100
90
80
TO
11111111 MI11111111111111
1
U.S.A.
.. .
OTHER PARTS OF THE WORLD
ese
""" iran....- HIHIH 1111111111111
11.111~111i I I
111111111M11111 11111111111moull111111
"... EMal IIIMIMEIII I MI
111111111~111111111111.11~11111111111160JFMAMJJASONDJFMAMJJ A SONDJFMAM J JASONDJ FMAMJJ1947 1948 1949 1950
100
100
100
100
FAO ECONOMICS AND STATISTICS DIVISION
Costa Rica: San José.
Iran: Teheran.
Venezuela: Caracas.
Costa-Rica : San-José
Iran : Tagran.
Venezuela Caracas.
57
ECONOMICANALY0IS 8RANCH-50-1FAS Chart Sc. 353
Costa Rica: San Jese.
Irin: Tehergn.
Venezuela: Caracas.
IllIlIlIllIl 11111 INIIIIIIIIIMIIa (1938.1o0) I 1 ,', ; .0,..--0"
,11111i I
iMexico0939.
enezue s,,......- Ita01
,1
,
N. i ..'"! .'"*" ''''1 11111111
-... MI612tiel
'I..
........ , . ,... ,
. ......, ... ......
.. ...... 1
....
1111 111 __40........_..
Costa Rica I .--; .--.....- jor**,* 11°..... ___1._ %
CadaI I
.... *********
130
120
110
[00
90
80
150
140
130
120
110
100
90

International Trade
The volume of international trade in farm products in 1949 was about as large as a year earlier, decreasedexports of bread grains being balanced by increased exports of other products, notably cotton (see Appendix,Tables C and D). Total international trade increased more rapidly than trade in farm products, however, andexceeded prewar (1937) for the first time since the war, while agricultural trade was still below prewar (seeAppendix, Table E).
There was a substantial shift in the structure of international trade, the value of exports from North andSouth America declining, and the value of exports from other areas rising, as compared to the previous year(see Appendix, Table F). Although the value of U.S. imports during 1949 as a whole was only 6 percent lowerthan in 1948, the sharp cuts in U.S. imports in the first half of 1949 and the declining prices for many of itsraw-material imports intensified the dollar shortage and helped precipitate the subsequent currency devaluationsin other countries. Both in agriculture and in industry, the expansion in world trade since the war has been lessrapid than in total world production.
World trade during 1949/50 was disturbed first by threats and later by the actuality of widespread currencydevaluation. Most of the leading commercial nations, including most major importers of food products, revaluedtheir currencies relative to the dollar in che fall of 1949. (See Appendix, Table G, for extent of devaluationby countries.)
The effects of devaluation on prices, imports, and exports have been partly obscured by the concurrentstrengthening of the U.S. business situation and the consequent improved dollar demand for imports. Devalu-ation, together with stricter import controls, has improved the position of devaluing countries exporting rawmaterials relative to those exporting manufactured products, improved the opportunities for export from Europeto the rest of the world, and reduced somewhat the balance-of-payment shortages.
One effect of devaluation was to reduce imports from hard-currency areas, as indicated by U.S. exports.This has taken place to some extent (see Appendix, Ta'ple H), but it may have been due more to tighter contro son dollar imports than to devaluation. It was also expezted that countries with devalued currencies would beable over the long run both to maintain and expand exports to hard-currency countries and to compete moreeffectively for markets in countries with devalued currencies. Some increase in trade between soft-currencycountries seems to have occurred, but, as yet, there is tittle evidence of a significant expansion of exports tohard-currency countries, other than that associated with the recovery in the United States from the early 1949recession. The effect of devaluation in reducing dollar prices and improving the competitive position of de-valuing countries has been partly removed for some primary commodities, particularly agricultural productssuch as wool and rubber, by market conditions. Prices in devalued currencies have advanced in many countriesso much that the equivalent dollar prices are now near w, and in some cases even above, predevaluationlevels. This has meant an appreciable increase in import prices for importing countries which have also de-valued. This price advance is less general for manufactured goods, where the dollar price level of exports fromthe industrial countries which have devalued reflects most of the devaluation cut. On the other hand, compe-tition with exports from devalued countries has not as ye c reduced the average prices of industrial exports fromthe United States, as was expected by some. Freight COStS in devalued currencies have risen sharply, widen-ing price spreads between exporting and importing countries in the non-dollar group.
The effects of devaluation on the terms of trade have 'thus been modified by the improvement in U.S.economic activity, with the resulting increases in impott demand and in the prices of many of its raw-materialimports, including a number of farm products important in international trade. Devaluing countries exportingraw materials to the United States have experienced little deterioration in their terms of trade. Devaluingcountries exporting industrial commodities, on the contrary, have suffered a marked deterioration in their termsof trade both vis-a-vis the hard-currency countries and even vis-a-vis most other devaluing countries exportingprimary commodities. Devaluing countries exporting raw materials to other devaluing countries, at pricesfixed for long periods ahead by advance purchase contracts,_have suffered deterioration in their terms of trade.Devaluation and the other economic chttnges of 1949/50 have thus had the general effect of improving therelative economic position of most devaluing raw-material exporting countries, relative to that of devaluingcountries dependent on industrial exports. Whether this situation is likely to be maintained long enough toaffect the welfare and living standard of farmers and the general public in the several groups of countriesinvolved is explored more fully in the regional reviews which follow.
58

International Investment
The flow of international funds was apparently maintained in 1949 at about the same rate as in 1948,but was concentrated even more largely in gifts and grants from the U.S. Government. Private capital invest-ment from the United States and the United Kingdom increased gradually, and so did loan commitments by theInternational Bank, but these are still small compared :o the total. The flow of international funds declinedin the first quarter of 1950, and it seems likely that this decline will continue through 1950 and 1951, unlesslarge new measures are formulated and put into action.
Information is not yet available to estimate the world flow of international investment funds beyond 1948,the period covered in the Report on International Investment and Financing Facilities.2 Data are, however,available on funds from North An-erica, which has been furnishing three-fourths of all postwar internationalfunds.
Outflow of long-term capital, gifts, and grants from the United States and Canada was slightly increasedin 1949, running $7,100 million as compared with $6,600 million in 1948, but was much lower than the $7,900million of 1947. In the first quarter of 1950, however, the flow decliaed to an equivalent annual rate of about$5,800 million, and this reduced rate seems likely to continue through 1950, unless large new measures areadopted.
Although Canada contributed substantially to the total of international dollar funds in 1946 and 1947,since 1948 its contribution has been negligible, and practically all has come from the United States, largelyas governmental funds. The proportion of unilateral transfers (or gifts) rose in 1949 and early 1950, and theproportion of long-term public loans fell correspondingly. The share of private long-term investment in theU.S. total has been increasing gradually, rising from about $700 million in 1948 to $800 million in 1949, andrunning at a $900-million rate in the first quarter of 1950. This may increase ftirther if the pending bill toguarantee $250 million of private investment is approved by the Congress. Private gifts abroad from theUnited States have contracted to almost an equal extent, however, leaving the total outflow of U.S. privatefunds, long-term loans, and gifts at between $1,300 and $1,400 million annually in 1948, 1949, and the firstquarter of 1950.
Funds from regions other than North America continued mainly as investments of metropolitan areas intheir dependencies. The British Commonwealth has adopted a Commonwealth Aid Program of £22 millionfor Southeast Asia, and East Africa borrowed £20 million in the London capital market. With increasingexport goods available from Western Europe, other loans in non-dollar currencies may also increase; theInternational Bank has been exploring these possibilities.
The portion of international capital funds moving through international agencies is still small, net dis-bursements of the International Bank and Monetary Fund in 1949 totaling only $137 million, and running atonly a $40-million net annual rate in the first quarter of 1950. Loan commitments by the International Bankincreased substantially in 1949, totaling $209 million as contrasted with $32 million in 1948.For the first half of 1950, however, new Bank loans totaled only $72.3 million, a lower annual ratethan in 1949. Since the middle of 1949, all International Bank loans have gone to underdeveloped countries,and a substantial portion of these loans have been for agriculture or related industries (see Appendix, Table 1).
No specific indications are yet available of any early increase in the flow of international investment,despite the growing recognition of its importance. The matter was discussed at the summer session, 1950,of the Economic and Social Council; this may in time lead to some new developments in this field.
DEMAND CONDITIONS IN REGIONS AND SELECTED COUNTRIES
North America
The buying power of consumers was well maintained through 1949, despite industrial recession in theUnited States in the first half. Expenditures for food declined slightly and the prices of farm products andthe income of farmers were reduced further by declining export markets.
2FAO, Report on International Investment and Financing Facilities, C49/16, 20 October 1949.
59

United States of America. The income of farmers continued the downward trend first established in1948, declining during 1949 and early 1950 despite a volume of production nearly as large as in earlier post-war years, and despite the disposable income of consumers remaining at practically the postwar peaks. Pricesof the goods farmers buy fell less than farm prices, anc -the net income of farmers was even more sharply re-duced. Increasing supplies of automobiles and other durable goods led to some reduction in the proportion oftotal consumer expenditures going for foodstuffs, while declining exports produced accumulating supplies ofsome foodstuffs. Some farm prices fell temporarily even below official support levels.
The demand for newsprint and lumber expanded, _producing a sharp increase in expenditure for forestproducts and in income from forestry, both in the United States and Canada.
Consumers' expenditures were sustained in 1949 despite the sharp reduction in industrial activity to mid-1949, assisted by the subsequent recovery to mid-1950. For 1949/50 as a whole, industrial productionaveraged 4 percent below the average for 1948/49, and 8 percent below the peak levels in the fall of 1948.The decline in production in 1949 was due mainly to a sharp inventory liquidation after a long period of risinginventories, and to a definite but mild downward trend in private investment in plant and equipment. Therecovery in 1949/50 reflected production in residential construction and in automobiles, expanding to postwarrecords, a shift to replenishing inventories, and the stimulating effects of the disbursement of more than$2,000 million of veterans' insurance dividends in the spring of 1950.
Despite the industrial recession in 1949, disposable incomes and consumers' expenditures were main-tained by increased public expenditures, reduced tax receipts, and increases in industrial wage rates, whileliving costs were falling. These more than offset the eeclining income and purchasing power of farmers. Themaintained volume of consumption and sales contributed to the subsequent recovery in production.
The industrial recession affected U.S. imports sharply, the monthly value of imports declining steadilyto mid-1949, to a level one-quarter below the 1948 average. Imports recovered stron'gly thereafter, and by early1950 exceeded the 1948 average level. The 1949 decline in import values reflected sharp drops in prices aswell as in quantities of most imported agricultural raw materials except wool, coffee, cocoa, and sugar. Aftermid-1949 quantities imported and prices both rose. By May 1950, import prices of these imported commoditieswere generally as high as or higher than a year earlier.
U.S. exports, on the contrary, trended sharply down through 1949 and into 1950, considerably reducingthe net excess of exports over imports. Agricultural eyports for the first ten months of the 1949/50 yearwere 12 percent below the year earlier in volume, and about 20 percent lower in value. The reduction in exportswas specially marked in wheat, while exports of cotton, tobacco, oilseeds, fats and oils increased.
U.S. agricultural exports during 1949 became even more dependent upon U.S. financing than they had beenin 1948. The proportion financed by ECA, Export-Import Bank, and civilian supply programs remained at about50 percent for wheat, increased from 30 to 61 percent for tobacco, and for cotton it was about 75 percent inboth the 1948/49 and 1949/50 cotton marketing years (August through July).
Canada. Consumers' expenditures increased slightly in 1949/50 above those of 1948/49, with risingindustrial activity and national income. Farm production was lower than in 1948, and farm cash income in1949/50 was slightly lower than in 1948/49. Prices of goods and services purchased by farmers increased,reducing net farm income by about 4 percent in 1949 ani somewhat more in early 1950.
The sustained domestic buying power for farm products reflected a continued growth in labor force, in-dustrial production, and national income in 1949/50, even though at a less rapid rate than in earlier postwaryears. Civilian employment increased slightly, but less than the growth in the labor force, and, althoughunemployment increased, the number of unemployed remained quite low.
Total exports to the United States were sustained in 1949 despite the slight U.S. recession, and increasedto the United Kingdom, but were substantially reduced to other countries. Exports of farm products other thanwheat declined in volume and possibly in price. Despite the decline in prices of competing U.S. exports,prices of Canadian farm products declined only moderately, reflecting the gradual removal of controls whichhad previously held Canadian farm prices below those of the United States.
During 1949 general wholesale prices fell slightly; those of farm products dropped more sharply after mid-1949, -especially animal products. Prices received by Canadian farmers compared to prices paid, however,were still one-third higher than prewar. Although food prices declined a little, the cost of living rose slightly,owing largely to increased rents.
60

The better national income in 1949 was due to higher private investment and consumption expenditure,supported by increased public expenditure without corresponding increases in public revenues, which morethan offset a decline in inventory accumulation and a fall in the export surplus. Demand and industrialactivity were generally maintained in early 1950, with increased exports to the United States nearly off-setting, in terms of aggregate value, reduced exports to other regions. Prices remained fairly firm, whileindustrial production and employment held at about the levels of the previous year.
Western Europe
In most countries, industrial output and income continued to rise in 1949/50, while farm production wasonly slightly larger than the year before. Expenditures on capital formation and public activities generallywere higher in 1949 than in 1948, however, leaving a smaller proportion of total income available for con-sumption in many countries. Farm and food prices have maintained about their previous relation to otherprices in most European countries, while the real income of farmers, measured in ability to buy, apparentlycontinued at about the levels of previous years. After devaluation, under varying systems of control, therewere marked differences in the changes that took place in farm prices and incomes, but che general tendency,except in some Western European countries exporting agricultural products, was toward raising the level ofprices and incomes to European farmers and encouraging further expansion in production for domestic con-sumption.
Effective demand for food and other products continued high in most countries during 1949, but the in-creased food supplies helped reduce inflationary tendencies before devaluation. In most European countries,price levels generally declined in the early part of 1949, but advanced after devaluation.
United Kingdom. Farm production and marketing increased substantially in 1949. With national incomeand buying power also rising, and ration restrictions somewhat reduced, the larger farm production sold athigher prices, raising net farm income by about 10 percent.
During 1949 farm prices rose more than prices of products purchased by farmers, largely owing to higherprices for livestock and livestock products; farmers'net income increased about 10 percent. Farm marketingincreases ranged from 19 percent for potatoes and 27 percent for wheat to more than double for pigs. Nationalincome, in contrast, increased about 4 percent in 1949, with continued full employment, only a slight rise inthe labor force, and a continued gain in labor productivity.
Wholesale prices appeared to be leveling off during the middle of 1949; but with continued inflationarydemands and rising material costs after devaluation, prices moved up again in the closing months of the yearand early 1950. Between September 1949 and February 1950, wholesale prices rose 6 percent. Retail prices,relatively stable during the second half of 1948 and first quarter of 1949, in general rose steadily and byMarch 1950 were 4 percent above a year earlier. Food prices rose most sharply, 12 percent between March1949 and March 1950. Average wages increased 3 percent from October 1948 to October 1949, and the pressurefor postdevaluation wage increases is mounting.
The sustained demand for the products of 1949 was largely financed by an increase in public expenditureson goods, not covered by higher tax collections, sufficiently large to offset the decline which occurred inprivately financed investment.
Exports expanded in 1949, under the export drive, to 11 percent above 1948, and export prices wereslightly higher, but the volume and prices of imports rose almost as much, leaving the total trade deficit almostunchanged. British foreign trade showed little improvement in tie first four months of 1950, the value ofimports continuing to exceed that of exports by 15 percent, but in May a definite improvement in trade with theUnited States was reported.
The general balance of payments showed a slight improvement in 1949 as a whole, but the dollar deficitwas hardly changed. There was a considerable improvement in the balance of payments of the sterling areaas a whole in the postdevaluation period, mostly on account of members of the area other than the UnitedKingdom. U.K. terms of trade, which had improved before devaluation, worsened thereafter and in early 1950were still lower than a year earlier.
Despite the pressure to reduce dollar imports, the United Kingdom imported from overseas a larger quan-
61

tity in 1949 of bread grains, sugar, oilseeds, fats and oils, cotton, wool, hides and skins, tea, and tobaccothan in 1948, but cut imports of meat, rubber, and coarse grains, the latter almost by half. Substantially morecoarse grains, sugar, and tobacco were obtained from affiliated ateas overseas than in 1948, but for otherproducts, dependence on previous sources in general remained practically unchanged.
France. The demand for farm products was good in 1949, with industrial production, employment, andincomes all continuing to rise. Farm production was about the same as in 1948, with slightly lower crop yields
but larger marketings of milk, meat, and other livestoek products. The average level of farm prices rose inthe second half of 1949, despde a decline in meat prices. Other wholesale prices rose more than farm prices,and the net income and buying power of farmers was apparently slightly reduced. In the early months of 1950,agricultural prices declined slightly, while industrial prices continued to rise.
The sustained increase in French industrial production lowered inflationary pressures; prices leveled offin the first half of 1949 but advanced with devaluation and continued rising gradually into 1950. Real wagesof city workers, including living allowances, are apparently still about 5 percent below prewar in Paris, butsomewhat above prewar elsewhere, in contrast with national production of all products, which is about one-tenth above prewar. The low real income of city workers limits their ability to buy increasing supplies ofrelatively costly foods, such as milk and meat. With a larger share of production used by the Government andfor investment, real consumption is still below prewar. The total food consumed in 1949, valued at constantprices, was 7 percent below the prewar consumption, according to official estimates.
It is difficult to measure the extent to which the inflationary price rise in the postwar years led to re-distribution of income unfavorable to wage-earners and other low-income groups, but the decline in real pur-chasing power of a sizable part of the population was apparently rather severe. To the extent that rationingand price-control programs were effective, this drop in real purchasing power was alleviated. But by the end of1949 rationing of the major foodstuffs was abolished.
French foreign trade expanded sharply in 1949. The quantity of exports increased almost 40 percent,expanding particularly to the overseas French area and to the United Kingdom. These tendencies continued inearly 1950, with a marked increase of exports to Germany. Import volumes increased only 2 percent, with aslightly larger percentage from the sterling area and a slightly lower percentage from the dollar area. Even so,the total value of imports financed by the United States through the ERP ampunted to 22 percent of all Frenchimports and exceeded the total value of all its imports from dollar areas. Food made up 11 percent of theseERP shipments; other agricultural products accounted for 23 percent.
Germany. Food production in the four zones was materially higher in 1949, going up to 84 percent of the1934-38 average in Western Germany. Industrial production increased even more sharply, reaching 75 percentof 1938 in the western zones and 72 percent in the eastern.
Wholesale prices were generally stable in Western Germany. Living costs declined in 1949 and early1950, with food prices keeping just above the prewar relationship with other prices. Farmers' incomes in-creased substantially both in money and real levels, but farmers were required to pay heavy Immediate As-sistance levies.
While Eastern Germany extended its co-operation with the economies of the Soviet Union and EasternEuropean countries, Western Germany continued heavily dependent upon imports, especially of foodstuffs.With its population swollen by refugees and still rising, unemployment in Western Germany increasedsteadily, despite the rise in industrial production, affecting 13 percent of the labor force in early 1950. Thequantity of imports into Western Germany increased more than 50 percent in 1949 over 1948, and exports almostdoubled. Exports are still below half of prewar, while imports are above prewar, and the trade deficit waslarger in 1949 than in 1948, amounting to one-quarter of the value of imports. The persistent trade deficit inWestern Germany is a result of necessarily larger imports of food and raw materials, because of the newboundaries and increased population on the one hand, and of low postwar exports, especially to non-Europeanareas, on the other. Imports from the United States were $763 million in 1949, but exports to the United Statesonly $46 million.
After the monetary reform in 1948, Western Germany, assisted by the large import surplus, made a re-markable recovery both in rehabilitation and in expansion of production, while monetary controls preventedfurther inflation. Tight credits in early 1949 checked industrial expansion for a time, but relaxation of credit
62

in mid-1949 contributed to the further expansion of activity, while price levels remained stable. Foreignexchange reserves, however, declined rapidly in the last quarter of 1949.
The problem of expanding exports to pay for imports remains crucial. Much of the increased output hasgone into consumption, which reached prewar levels in the 1949/50 consumption year (or, per caput, 80 percentof prewar). Western Germany continues a major market for overseas imports, taking from overseas largequantities of bread and coarse grains, oilseeds, fats and oils, tobacco, wool, cotton, and other products.Agricultural imports from overseas increased 30 percent in 1949, and were valued at more than $1,000 million
(at 1948 prices).Total German exports to other European countries increased 62 percent in 1949, while imports doubled,
changing the net surplus of $68 million in trade with these countries in 1948 to a net deficit of $152 millionin 1949. Total German trade with Eastern Europe and the Soviet Union, though expanding, showed a netdeficit in both 1948 and 1949. Western German trade, while expanding, showed increasing deficits in 1949,both with Western Europe and with overseas countries, rather than reducing its dependence on foreign assis-tance.
Italy. Despite increased output in 1949, farmers apparently had net incomes slightly smaller than in1948. Farm production was about 9 percent above 1948, while industrial production averaged about 6 percenthigher. Domestic demand for farm products rose slightly and food consumption increased, despite continued heavyunemployment, both recorded and hidden.
Foreign trade expanded in 1949, with exports rising more than imports and the volume of food exportsgoing up 28 percent. In the last quarter of 1949, however, after devaluation, exports fell sharply. Generalprice levels and retail prices of food fell through 1949 and into 1950, while wholesale prices of farm productsstiffened a little after devaluation. Italy is still finding it difficult to earn enough foreign exchange to buythe necessary imported raw materials, but it has under way a massive investment program to increase agri-cultural and industrial output. If Italy is to continue its large imports of grain, cotton, and other agriculturalproducts from overseas, it will need to expand its industrial exports. Prospects for this expansion haveworsened as a result of increased competition from other European countries following their greater degree ofdevaluation.
Low Countries. Agricultural output was substantially larger in 1949. General economic conditions wereprosperous in the Netherlands, with industrial production and national output strongly increased, but inBelgium there was little change in either. Despite the general good level of industrial production and nationalincome in both countries, farm income apparently reflected the general trend of economic conditions in 1949,rising in the Netherlands but declining in Belgium.
Exports rose relative to imports in both countries, but imports actually fell in Belgium. The rise inDutch agricultural exports was especially marked, due to such transitory causes as drought in other countriesreducing their output, especially of root crops, while weather conditions were relatively good in the Nether-lands. The Belgian devaluation was much smaller than that of the sterling area and the Netherlands (seeAppendix; Table G). This made it still more difficult for Belgium to expand exports and wipe out unemploy-ment, which increased in 1949. Unemployment, though low, also increased in the Netherlands. The generalwholesale price level continued a downward trend in Belgium, but agricultural wholesale prices in Belgium, andgeneral and agricultural prices in the Netherlands, rose after devaluation.
Scandinavian Countries. Industrial production and agricultural output rose in 1949. The number of personsemployed remained practically unchanged. Skilled labor continued to be scarce, but among unskilled workersin Denmark and Finalnd there was an increase in the number of unemployed during 1949. In Denmark, unem-ployment declined after February 1950. Food consumption in general expanded slightly and, with risingnational income and exports, real agricultural income rose, except in Norway, where agricultural prices hadbeen fixed for the crop year.
After devaluation, internal prices of imported foods and feed-stuffs advanced sharply. As a result of thisincrease and other circumstances, food prices and other prices at the wholesale level increased considerably,except in Sweden. In Denmark the price increase was partly due to some reduction of government control overprices and trade. Subsidies were reduced in Denmark and Norway, whereas Sweden increased food subsidiesto offset the rise in costs arising from devaluation.
63

Production of wood pulp in Scandinavia declined during 1949 and the value of exports fell, reflectingreduced export demand, but production and exports of softwood lumber increased one-quarter above 1948.
The foreign payments position in 1949 improved in Sweden and Finland, where exports increased whileimports declined. In Denmark, exports rose more than imports, but in Norway the reverse occurred. Foreigntrade values continued to expand in the first quarter of 1950 in all countries of the region, with a considerableincrease in agricultural exports but with terms of trade much less favorable. This was especially true inDenmark, where export prices (in Danish currency) actually fell due to the decline in prices of butter, bacon,and eggs contracted for in long-term trade agreements with the United Kingdom. A sharp increase in the tradedeficit compared with the same quarter of 1949 occurred in Denmark and Norway. Exports of wood pulp alsoincreased substantially in the first quarter of 1950, with renewed sales to the United States and large contractsplaced for increased lumber exports.
Eastern Europe 3
Economic and agricultural expansion continued. Total agricultural output was higher by 5 to 10 percent,with a greater increase in livestock products than in crops, while industrial output increased more rapidly.Real income of both city and farm people increased substantially over 1948, at a rate larger for city peoplethan for farmers. Farmers' buying power increased because of larger output and reduced prices for theirpurchases.
Industrial employment and real income per caput were reported as higher than the very low prewar levelsin most countries of the region, and domestic demand for foodstuffs continued to grow. The increase in durableconsumer goods was relatively greater than in production goods, and prices were cut on textiles, footwear,farm implements, and requisites. With larger supplies, consumer prices were reduced, distribution controlmeasures were lightened, and farmers were allowed to sell a greater variety and a greater amount of theirproducts on the free market. Cost-of-living indexes decreased up to 8 percent. Official prices of most foods,except livestock products, were lowered significantly to the consumer, but controlled prices paid to farmersfor the 1949 output remained the same.
The trade of Eastern European countries among themselves showed no increase, perhaps due to the in-creasing disruption of their trade with Yugoslavia, while their trade with the Soviet Union increased over 50percent. Their trade with Germany (all zones), however, more than doubled in 1949.
U. S.S. R. Real incomes rose through a reduction in prices rather than through an increase in wages andincomes. Farm production increased, and farm buying power increased from reduced prices for their purchases.In February 1949 there were price reductions of 10 to 20 percent, and a year later further reductions of 10 to50 percent, as well as sharp cuts in the high turnover tax. The 1950 reductions in bread, butter, and fat priceswere about 30 percent, and in meats about 25 percent. Retail sales of manufactured consumer goods increasedsharply in 1949, with shoes and clothing items up about 30 to 60 percent, and manufactures of fruits, con-fectionery, grain products, and sausages up 20 to 40 percent. The increase in civilian consumption, however,was apparently less than hoped for, possibly owing to stockpiling and expenditures for rearmament.
The Soviet Union's trade increased with its affiliated Eastern European countries, which now account fortwo-thirds of the U.S.S.R.'s foreign trade. Its trade with Western Europe fell about one-fifth in 1949, and withthe U.S.A. to almost nothing. Unusually heavy imports were made of wool and rubber, and substantial exportsof wheat and coarse grains.
Latin America
Production generally increased in 1949/50, with industry apparently expanding more thanagriculture. The rate of increase in food supplies was not much more, however, than that of population growth.Export surpluses were less, budget deficits were reduced, and internal investment decreased, easing infla-tionary pressures. In some countries, such as Cuba, conditions became slightly deflationary. Price levelsand the cost of living continued Upward in many countries, however, though usually with a slowing rate of in-crease. Total real income generally increased about in proportion to population growth. Prices of food
3The discussion on Eastern Europe and the U.S.S.R. is based on partial and incomplete data.
64

generally fell or did not increase as much as other elements of the cost of living. With the larger output, how-ever, the real income of farmers was generally maintained. In the noncommercial regions, gradual increasesin agricultural and handicraft production probably contributed to a real but slight rise in average levels ofliving.
Prices and cost of living in most countries increased more rapidly than wages, resulting in some furtherdeterioration in real income of the greater number of people. In some cases, as in Chile, wages increased asmuch as prices, maintaining the living standard of workers. In other cases, as in Brazil, Cuba, DominicanRepublic, El Salvador, and Venezuela, where retail prices of food declined and employment was maintained,the standard of living of the workers probably improved. In the remaining countries of Latin America., theliving standard of workers possibly deteriorated. Food consumption in the lower-income groups, however,appears to have been maintained at about the same level as in previous years.
Foreign trade declined in 1949, with exports down 15 percent in value and 9 percent in volume from 1948,and imports down 9 percent in value. Except for continued heavy trade in coffee, export outlets for agricul-tural products were generally lower, not only in other continents but also in regional markets of LatinAmerica. Exports as a whole fell much more than imports, reducing the 'export surplus to less than was neededto cover invisible payments abroad. The contracting exports reflected lowered demands in the United States,increasing difficulties in Europe in paying for imports from Latin America, and continued shrinkage inArgentine production for export. Imports from the United States, however, were reduced more than exports tothe United States, improving the dollar position of many Latin American countries. This continued a trend inevidence over several years. By early 1950, Latin America had recovered its prewar status as a net dollarearner.
The diversity of developments in Latin America may be indicated by brief summaries of the situation inselected countries.
Mexico. 1949 was the second year of sustained good crops, though somewhat below 1948 because ofunfavorable weather and reduced maize yields, while industrial production and real national income continuedto expand. Food imports declined, contributing to the first favorable balance of international payments sincethe war. With industrial production increasing and real national income up about 5 percent, farm productionwas disposed of readily at prices which trended strongly upward after the currency devaluation in June 1949.In early 1950, prices steadied at a level about 10 percent above those of a year earlier.
Cuba. Sugar production was reduced 14 percent in 1949 and other farm production was slightly lower.The value of total exports declined 20 percent. Industrial activity, however, continued to increase except inbuilding construction. Workers' real income increased, with employment and wages sustained and prices offood and nonfood products lower. Food consumption continued high, as supplies increased through largerimports of most kinds of foodstuffs. With reduced output and lower prices, farm income was substantiallysmallerbelow the high levels of 1948 and 1947but still much above the depressed prewar average of 1935-39.
Brazil. The volume of total production expanded 4 percent in 1949, with the increase slightly larger infarm products than in industrial. With increased food production and somewhat lower food exports (excludingcoffee), food supplies for consumption were over 4 percent larger. Exports were materially lower in both volumeand value, though there was a marked increase in coffee prices late in the year, while the value of imports wasonly slightly lower. Despite declining free-market exchange rates and increased domestic buying power, whole-sale prices advanced only gradually over 1949 and into 1950, while retail prices of food averaged 4 percentlower in 1949 than in 1948. Total farm income apparently increased somewhat in 1949, with sharply increasedincome from coffee, and about the same income from crops for domestic consumption as in 1948.
Chile. Food production levels were maintained in 1949 but exports decreased, leaving more for homeconsumption. Industrial production continued to expand, but mining activity and construction fell sharply,while exports declined as a result of reduced U. S. demand, especially for copper. Bank credits continued toexpand, however, and prices, wages, and cost of living rose markedly through 1949. Despite the decreasedexport surplus and budget deficit, consumption and investment levels remained high, continuing an inflationarypressure and expanding the demand for food and other consumer goods.
65
Ecuador. Food production continued to increase, and food imports were substantially reduced. Domesticindustrial production expanded, and, with expanding buying power, farm products were readily sold. Ricesupplies accumulated, however; rice exports to the traditional markets were reduced, and over half of theexportable surplus was still on hand at the end of 1949. Food prices, which had risen sharply in previous years,fell during mid-1949, and ended the year lower than a year earlier. With higher real national income and demand,farmers' income increased, except that of rice producers. At che end of the year, a system of subsidizing ex-ports was adopted, with special subsidies for rice.
Argentina. Production of crops and livestock products for the domestic market continued to expand. Thearea planted and the production of grains for export contracted further and grain exports fell from 5.6 milliontons to 3.5 million. Meat production and export, however, continued to expand in 1949. Cost of living rosemore rapidly than wages.
Consumer subsidies and price ceilings on livestock products were abolished in mid-1949, followed bylarge increases in prices, public utility rates, and wages. A new price-freezing law was passed in October,but there was widespread doubt of its effectiveness. Major export products continued to be sold through theofficial monopoly, which late in 1949 lowered its export selling prices to levels fairly close to those of worldmarkets and to prices guaranteed to producers. The relaxation of government control over prices and distri-bution during 1949 was not, however, sufficient to encourage production for export. The difference betweenthe rate at which the Central Bank buys foreign exchange from the export monopoly and sells it to importerscontinued wide, and was one of the main sources of government revenue. In September 1949 a three-year planwas announced to place major emphasis on stimulating agriculture rather than industry, and in December it wasannounced that official prices to producers would be governed by production costs'rather than world markets.
Africa
Food production in 1949/50 was generally high in the Mediterranean regions, but output was ap-parently lower in tropical areas and in South Africa. Widespread and serious droughts reduced production,especially of maize and groundnuts, and required considerable grain imports in sections of British Africa. Inthese areas special drives have been instituted to increase food production, using guaranteed prices and othermeasures. Long-run schemes arz in operation to increase livestock production, but the animal population isnot growing fast enough to meet the increased demands from expanded employment of African farm people intowns and mines and the growth of immigration from Europe. The principal cereals and oils in French TropicalAfrica and in the Belgian Congo appear adequate, however, for local needs.
Devaluation has tended to drive up prices of some export crops not affected by marketing agreements,long-term contracts, and other price-fixing arrangements, to have an inflationary effect on food prices in towns,and to increase prices of imported manufactures.
Trade between the United Kingdom and its territories in Africa continued in 1949/50 at about the samelevels as a year earlier, the imports received from African territories running about one-quarter above the valueof exports sent. In the case of metropolitan France, however, the value of exports to African territories in-creased substantially while the value of imports received changed but little and fell behind the value of ex-ports.
Union of South Africa. 1949/50 crops were generally poor, livestock losses were heavy, and the physicalvolume of agricultural production declined about 10 percent. Employment, industrial and mining production,and national income during 1949 were higher than in the preceding year, producing a rising demand. Withappreciably higher farm prices, the fall in the gross value of agricultural production was slight, about 1 percent.Consumer expenditures appear to have increased more than supplies, and retail prices continued to rise moder-ately but steadily throughout 1949 and early 1950, with food prices rising at about the same rate as the averageof non-food items.
Following rather strict import regulations starting in January 1950, the Union of South Africa's foreigntrade position has improved substantially. Imports fell about one-third during the first four months of 1950,compared with a year earlier, while exports increased about one-third. In 1949, wool accounted for about 23percent of the total value of commodity exports.
Near East
Agricultural production in 1949 was generally larger than in 1948 except in Iran and Turkey,
66

where crop yields were cut by unfavorable weather. For 1949 as a whole, the volume of the region's industrialoutput was also larger, but declining economic activity and general deflationary conditions prevailed in mostcountries during the second half of the year. Slow exports and the contraction of internal demand resulted ina sharp drop in agricultural prices; industrial prices declined at a slower rate, leading to lower city and farmincome.
Inflationary pressures persisted in Egypt, Israel, and Turkey. In the rest of the region there was aslowing down of economic activity beginning with the second half of 1949 characterized by: (1) decliningprivate investment, accumulating inventories, and sales at distress prices; (2) sharp cuts in public expendi-tures, especially on-development projects, and a gradual contraction of note circulation; and (3) increasedtrade deficits despite strict controls over imports, plus (in some countries) new anti-inflationary programs.Unemployrment was on the increase. Agricultural prices and the cost of living dropped sharply, while prices
-nanufactured goods showed a less significant decline.Import values for the region as a whole totaled 9 percent higher than in 1948, while exports for the year
-lined slightly. The net trade deficit of the area increased to roughly 25 percent of the total value of im-ts. Exports from the Anglo-Egyptian Sudan, Iraq, Israel, and Syria-Lebanon increased. somewhat, but re-ined a fraction of prewar. Interregional trade, disrupted by the war, did not resume, and countries which-
Iran, Iraq, and Syria-Lebanondepend on regional export markets for their agricultural products wererticularly affected. Exports in 1949 went somewhat less to the United States and the United Kingdom and
I-are to continental Europe and Asia, but in 1949 the region imported 30 percent more from the United StatesLd 5 percent more from the United Kingdom than in 1948.
With a qua- rter o--f a million immigrants entering Israel in 1949, requirements for food and other consumer)ods expanded greatly; 60 percent of the food had to be imported. Farm income increased in 1949 despite lowitru.s yields and government-controlled prices (as a result of subsidies), more stable marketing conditions,
-ad increased crop areas as abandoned lands were again cultivated, while nutritional adequacy for bothatives and immigrants was assured by the new rationing program.
Responsibility for feeding the Arab refugees elsewhere was first assumed by three voluntary agencies,Lssisted financially by UN, and more recently by a new UN agency; their position is much improved, but the:urrent ration will hardly be adequate when winter comes. The presence of the refugees especially intensi-fied difficulties in Hashemite Jordan, whir:b depends to a considerable extent on imports. Jordan imposedrigid import controls late in 1949 to bridge the trade deficit, then amounting to 80 percent of import values.Although its scarce foreign exchange is now largely allocated to purchasing farrn implements and machineryfor economic development, its means are so small that international financing will be needed if any sub-stantial work-relief projects for refugees, such as that recommended by the UN Economic Survey Mission, areto be developed.
Far East
Asia shoxved less progress in 1949/50 than any other region, due to continued political andeconomic unrest in much of the region, open or guerrilla warfare in parts, and strained economic relationsbetween India and Pakistan until late in the spring. The production of rice and wheat was apparently slightlybelow the previous year, but that of other crops was slightly higher. The production level in general,however, was still somewhat below prewar. Reduced output and growing population continued to exert pressureon food supplies. Food rationing, strict control of food procurement, and large government food imports werecontinued in many countries.
Mineral and manufacturing output continued to grow, and so did handicraft production, but cotton textileproduction fell. with declining demand in many raw-material export markets, as shown by falling internationalprices and smaller quantities exported, total demand fell in most Asiatic countries up to devaluation.
With greatly increased urban populations and population dislocations, handicraft production may haveincreased more than the records show. Real wages of industrial workers, however, continued to run belowprewar levels, and their living conditions generally continued worse than prewar, with housing, sanitation,and other public utilities inadequate for the greatly increased numbers. Farmers, largely self-suppliers, wererelatively better off than these other gorups on the average, but in some regions they lost part of the previouseconomic advantage gained from black-market sales and prices.
67
Heavy expenditures on defense or military activity continued in many countries of Asia, with corres-ponding diversion of supplies from consumption or productive investment, and with corresponding budgetdeficits and inflationary pressures.
Trade developments were marked by a partial return of Japan to its prewar position and by continuedunfavorable trade balances in most countries. Rigid controls on the amount and composition of importshelped some countries to reduce their trade deficit, and helped India to achieve a net surplus since November.Dollar prices of some important export commodities increased, notably of tin and rubber, owing largely to thegreater demand from dollar countries; but, despite devaluation, prices of rice showed little change in thecurrencies of the exporting countries. Devaluation is tending to produce a closer integration of some countriesof the region into the sterling bloc and the British Commonwealth economy.
Exeept in South Korea and Hong Kong, wholesale prices generally leveled off during 1949, and in thePhilippines they declined. Retail food prices and the cost of living either stabilized or declined in mostcountries of the region in 1949, but food prices advanced in some countries after devaluation.
India. Although agricultural production was slightly larger in 1949, and food imports increased one-thi:over 1948, food supplies continued short. Some forms of rationing continued to be necessary for nearly one-third of the population. The dispute with Pakistan had a depressive effect on economic activity, especiallyafter devaluation. Industrial production declined about 3 percent, due mainly to reduced production of jute acotton textiles, and unemployment increased. Real wages were about the same as in 1948, but the economicposition of farmers improved slightly with relatively higher prices and heavy public investment in agriculture
Inflationary pressures persisted in 1949. Although agricultural production showed some improvement,large imports of foodstuffs were necessary, amounting to 3.7 million tons in 1949 as against 2.8 million tonsin 1948. At the end of the year, some 112 million people were supplied through various forms of rationing.
A budget deficit, owing mostly to large expenditures on defense and public works, also exerted an upwa-pressure on prices. The index of wholesale prices resumed its upward trend after March 1949, with industrialraw materials, particularly of cotton and jute, showing the greatest advances. The cost-of-living index inBombay, based on controlled items, was slightly higher in 1949, but its food component was up 5 percent. Atthe end of the year and during the first half of 195C, both wholesale prices and cost of living became morestable, partly because of increased output and supplies and partly because of disinflationary measures.
The import surplus declined after May 1949, and from November 1949 to Nlarch 1950 has turned into anexport surplus, reflecting stricter import controls, the export drive, and devaluation. The improvement wasparticularly striking in India's trade with North America. Imports from North America, both the United Statesand Canada, have been reduced continuously, while exports have been increasing to the United States andcontinued at a steady level to Canada. Tea exports increased sharply, both in quantity and value, in 1949/50,both to the United Kingdom and the United States, but ex-ports of jute and its manufactures declined as a resulof the disruption of raw jute imports from Pakistan after devaluation. The minorities agreement and the tradeagreement of April 1950 between the two countries contributed to a brighter economic situation. There wasa notable increase in India's share of Far Eastern trade with the rest of the world. In 1949 as a whole, thepercentages for India exceeded the prewar percentages for the entire Indian subcontinent (Chinese tradeexcluded in both cases).
P akistan. Food supplies increased in 1949/50 and rationing was lessened. Factory production de-clined sornev,,hat, but cottage and handicraft industries expanded, helping to sustain buying power for food.
The interruption of trade wi.th Iridia cut exports, and food prices declined slightly. With larger output, however,
farm income increased.An excellent spring wheat crop in 1949 resulted in a substantial exportable surplus, which more than
offset some reduction in rice production. Total food supplies increased, with grain production well aboveprewar. Food rationing in larger cities continued, partly because of the heavy concentration of refugees.
The earlier disruption in agricultural production in Western Pakistan, owing to the large exchange of
population, was for the most part made good. The jute industry in Eastern Pakistan r.vas cut off from jutemills in India after the Indian devaluation, and jure prices slumped. The new m'inimum jute price fixed bythe Pakistan Government, though one-fourth below mid-September, was still above the official maximum pricesin India. The new trade agreement with India in April 1950, however, provided for a limited resumption of
uacie.
68

The foreign trade balance was generally adverse through 1949, because of heavy imports and fallingexports. With sharp reductions in imports after September, however, the balance became favorable in De-cember, and remained so through the first quarter of 1950.
Prices were apparently lower at the end of 1949 than at its beginning. Food prices dropped slightlythrough the year and into 1950. Prices of cotton piece goods, the largest item in the family budget next tofood, lowered between March and September 1949. Declining prices of important export commodities afterdevaluation had a deflationary effect.
Burma. Political unrest in 1949 caused a sharp fall in agricultural and industrial production and in in-ternal and foreign trade. Prices, after reaching a postwar peak in mid-1949, began to decline. Rice productionin 1949/50 was about one-fifth lower than a year ago and about 40 percent lower than before the war (1934-38).The exportable surplus of rice may be larger than originally estimated - it may reach a million tons or more in1950. Per caput food supplies were below the levels of a year ago arrl much lower than before the war.
Owing to broken communications, the problem of distribution was particularly difficult. Controls werenot very effective and prices of food increased rapidly above the established ceilings until July 1949, butdeclined thereafter with improvements in transport. Other major export industries have been severely impairedon account of the general dislocation; work in the forests, mines, and plantations has remained entirely sus-pended or greatly reduced. The fall in the already small industrial production and the limitation of imports ofindustrial consumer goods resulted in low inventories and a greatly reduced volume of wholesale and retailtrade.
Despite reduced trade, Burma had a favorable balance of trade in 1949 and an export surplus vis-a-visthe United States and the United Kingdom, mostly because of reduced imports.
The economic situation became somewhat better in 1950 as a result of progress in restoring more peace-ful conditions and improvements in rail and water transport. By March 1950, Burma was granted financial as-sistance from some of the Commonwealth countries to the abount of £6 million, repayable in two y-ears.
Thailand. Total production in 1949, both agricultural ancl industrial, was higher than a year before, andapparently real farm income increased.
Rice crops reached a postwar peak, while rubber and some other minor crops were at about the 1948 level.Mining production, particularly of tin ore, increased materially-, and manufacturing production was up. Greatprogress was made in the rehabilitation of railways, following the importation of locomotives, freight cars,and passenger cars from japan in exchange for rice, tin ore, and other products. Wholesale and retail pricesbegan to decline after mid-1949 and the downward trend continued into 1950, despite the 20 percent devaluation,but internal prices of rice and rubber were maintained. The value of foreign trade reached record levels, withexports substantially exceeding imports. Rice exports to countries within the region wet-e about 50 percentabove the 1948 level. However, Thailand's dollar position was weaker than a year ago, mainly because of thecessation of ECA dollar purchases of rice for China. Prices of tin ore also declined after devaluation.
Indonesia. Agricultural production has not recovered from the destruction and dislocation of Japaneseoccupation and hostilities since, and farm incomes are still below prewar. Production of export commoditiessuch as rubber, palm oil, fibers, copra, sugar, tea, and coffee, although in some cases much higher than in1948, was far below prewar levels. Rubber export increased less, but rubber prices have advanced since latein 1949 to record levels in 1950. Nevertheless, income from exports was insufficient to pay for imports ofessential consumer goods such as foodstuffs and textiles, or for capital goods to be used in reconstructionand economic development. The reduced output of coffee and sugar was largely consumed within the country.Rice imports were nearly double those of 1948.
ECA aid, which had been suspended, was resumed in the months before the transfer of sovereignty, and asubstantial import of rice and textiles was financed in that period. Despite continued shortages of food andconsumer goods, budget deficit, and monetary expansion, wholesale prices declined in early 1949 and thenstabilized at a level well below the 1948 average, but advanced substantially after devaluation. In March1950, a currency reform was introduced with other measures to check inflation, and new exchange regulationswere established which caused very considerable increases in the price of imported products.
69

Philippine Republic. Agricultural and industrial production during 1949 was at higher levels than in194 and in some instances above the prewar levels, but the decline in value of exports caused a shrinkagein business activity and in farm incon.e. With lower prices for most crops, such as coconut oil, abaca, leaftobat-co, and maguey, farmers were on the whole worse off than during the previous year.
The foreign exchange situation became very bad in 1949, as less dollars were earned and increasinglymore were spent on consumer and nonproductive imports. ECA stopped offshore procurement of copra after1948, and Philippine exports of copra to non-dollar markets, very substantial in 1947 and 1948, almost ceasedin 1949. In spite of new import controls, the value of imports continued to increase while, because of reducedexport demand both in soft- and hard-currency countries, the value of exports declined. The disbursement bythe U.S. Government in 1949 of about $324 million largely offset the adverse balance of trade, but it is esti-mated that these disbursements will decline to about $275 million in 1950. The balance of trade may improvein 1950 because of still more drastic import controls and some recovery in export demand from the UnitedStates. Devaluation elsewhere threatened to damage the position of the Philippines versus competing exportersof copra and vegetable oils, but so far the strengthening U.S. demand and the restoration of a 2-cent increasein the U.S. tax on copra and coconut oil from non-Philippine sources have prevented this effect.
China. Food production was reduced possibly one-eighth in China (excluding Manchuria and Taiwan) in1949 by drought, flood, and military operations. Imports and exports were largely cut off ard famine conditionsprevailed over substantial areas. Industrial and mineral production were also sharply reduced, but began torevive in late 1949. Prices soared with hyper-inflation. Farmers' incomes gained from high prices and black-market sales until strict food controls were imposed in midwinter. In Taiwan (Formosa) production was better,with rice production up 10 percent, but prices rose sharply and continued upward, despite currency reform inJune 1949-
The greatest decline in mainland production was in legumes and cereals, while rice, reduced about 4percent, was one-tenth below prewar. Food imports were low because of short foreign exchange, blockadeof the mainland, and cessation of all ECA and relief shipments. In midwinter the mainland authorities intro-duced strict controls, with a large portion of food handled by state-operated organizations and by rural co-operatives. Besides making required deliveries, farmers were encouraged to consume more substitute foodssuch as potatoes, vegetables, and wild fruits in order to release more rice and wheat to the cities.
Industrial and mineral production in 1949 also declined sharply as shortages of coal and electric powercontinued. ECA shipments of raw cotton and gasoline stopped, and cotton yarn production fell 40 percent.During the winter and early spring, however, some revival in industrial activity was reported.
Wholesale and retail prices soared as a result of hyper-inflation, fed by constant currency issues tofinance military operations. Prices leveled off for a short time after the introduction of People's Bank notes,but by November they were increasing again in all local markets. The rapidly rising cost of living depressedreal wages of industrial workers and resulted in numerous labor disputes. Although no trade statistics areavailable, imports and exports were apparently much reduced, but some Chinese goods, such as raw furs andbristles, were exported to the U.S.A. via the U.S.S.R. late in 1949.
Japan. Food supplies improved, average prices received by farmers declined, and farm incomes wereapparently somewhat reduced. Inflationary pressures came to an end in 1949 and deflationary trends appeared,resulting mostly from a budget surplus, reduced public expenditure, and a generally tight monetary situation.Industrial producti,-.,n stabilized in 1949 at a level well above that of 1948, but still far below prewar. Theeffective demand dt-::lined and city and rural unemployment rose when industrial output leveled off.
Food supplies iElproved considerably over a year ago due to the rapid increase in the volume of foodr rice imports. Prices of food declined after the second half of 1949, and
the :;f7 the family budget spent on food decreased considerably. As a result, real wages of employedUnemployment rose, however, intensifying the difficulties of man-y industrial workers.
trds in the _Japanese economy produced a gradual decline in extra farm incorn. e frorn thee official pric.es for farm deliveries remained pegged at re.latively low levels.
public works declined by about 13 percent. Funds for farm credit and farma large number of urban unemployed to the countrysi..le aggravated farro
chronic surplus of unneeded workers on farms. er,;timated at 6.5 rnillion.

Although free-market prices of industrial products also declined sharply, this was insufficient to offset asubstantial decline in farro incorne from the levels of a year ago. In spite of these unfavorabie developments,farmers were still relatively more prosperous than other groups of the population.
O ceania
Australia. Econom;c activity continued at a high and expanding level in 1949/50. Agricultural andindustrial output increased. With larger output and higher prices, the value of agricultural production in1949/50 reached a record level, about 15 percent above 1948/49. Net farm income apparently also rosesignificantly, both in money and real terms.
With full employment conditions, the number of persons employ-ed continued to rise as rapidly as workersbecame available, aided by substantial immigration.
Real wage rates may have fallen slightly, but remain substantially above prewar. On the whole, consumerincomes rose, largely as a result of higher farm income. Consumer demand is at a high, if not inflationary,
'level.Exports benefited from the devaluation and from the high demand for wool. After declining until de-
valuation, ex-port values increased sharply and reached record heights at the end of the first quarter of 1950,at double the 1948 level. Volume increased 25 percent from the low point, and prices, especially of wool,rose sharply.
Imports also increased after devaluation, with volume up about 15 percent and prices about 20 percent inthe first quarter of 1950, compared with that of 1949. The sources of imports changed little, 70 percent stillcoming from the United Kingdom and other British countries. Terms of trade, which had deteriorated beforedeValuation, recovered thereafter, and were more favorable in the first quarter of 1950 than a year earlier.
Inflationary pressures accompanying the rising export prices have renewed discussion of a possible re-valuation of the Australian pound to par with the British pound (it is now 20 percent below) but a specialsession of the Australian cabinet at the end of June did not reach a decision on the issue.
New Zealarwl. Livestock numbers increased in 1949, and production of meat and dairy products expandedin 1949/50. With most export products controlled by long-term sales contracts, farmers' incomes increased onlyslightly after devaluation, but further price increases are being urged by the farmers' organization. Many foodsubsidies were abolished or reduced in May 1950, prices of many foods v,-ere allowed to increase, and rationingof butter was abolished in June.
71

APPENDIX
Note on Consumption and Nutritional Levels
Table A indicates the development of consumption levels in postwar years. Data on calories
available are accompanied by data on the total amount of protein and of animal protein, the latter
being of particular importance as an indicator of the quality of the diet.
The 1948/49 es published here show a number of revisions over the figures published in
the State of Food and Agriculture 1949, where provisional data was used. Since no full informa-
tion for 1949/50 is yet available, changes over 1948/49 have been indicated as percentages only.
73
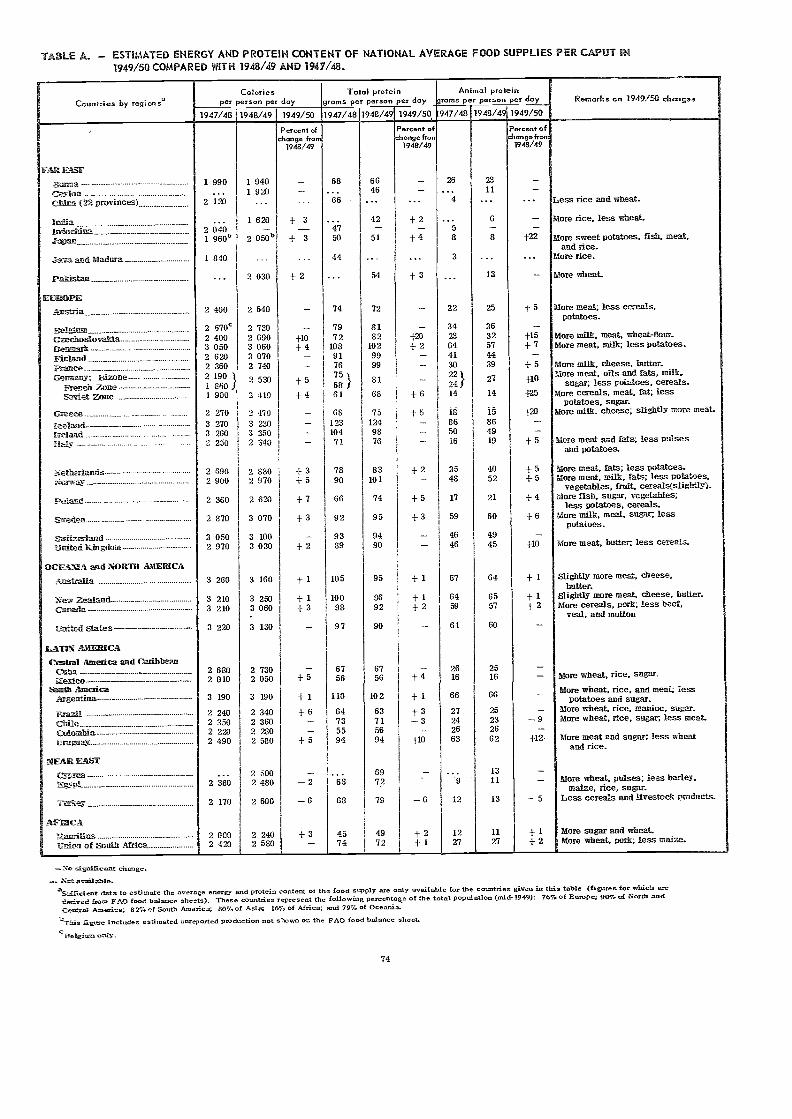
TABLE A. - ESTIMATED ENERGY AND PROTEIN CONTENT OF NATIONAL AVERAGE FOOD SUPPLIES PER CAPUT IN1949/50 COMPARED WITH 1948/49 AND 1947/48.
-.No significant chango..... Not available.
*Stlficient data to estimate the average energy and protein content of the food simply are only available for the countries given in this tab/e (figures for which orederived from FAO food balance sheets). These countries represent the following percentage of the total population (mid-1949)r 76% of Europe; 90% of North and
82% of South borrical 807. of Asia; 16% of Africa; and 79% of Oceania.bTlmis figure includes estimated unreported produc6on not shown on the FAO food balance sheet.
cReigium only_
74
Countries by regions°Calories
per person per day gramsTotal proteinper person per day grams
Animal proteinper person per doy Remarks on 1949/50 chmges
947/48 1948/49 949/50 947/48 1948/49 1949/50 1947/48 1948/4v 1949
, Percent of Percent of Percent ochange from change froo change fr. .
1948/49 1948/49 1948/49
EAR EASTI
Mx-a 1 990 1 940 68 66 26 28
CeFloc._ ... 1 920 ... 46 ... 11
Chin' a ;,22 pro es) 2 120 ... ... 66 ... 4 ... Less rice and wb.mi.
Iniia ... 1 620.
42 6 ore rice, less wheaLIniacairLa 2 040 - 47 - - 5 - -J3 1 9600 2 050° 3 50 51 -F 4 8 8 +22 More sweet potatoes. fish, meat,
and rice.Liza and Madura__ ....... ---- - i 840 ... ... 44 ... 3 ... ... More rice.
p,tristan. ... 2 030 + 2 54 + 3 13 More wheat.
LEE-OVE
Austria 2 400 2 640 74 72 - 22 25 + Mote meat; less cereals,potatoes.
BeWurn - ....... _... 2 6700 2 730 - 79 81 - 34 36
Czechosi&Vaia 2 400 2 690 +10 72 82 +20 28 32 +15 More miLk, steaL, wheat-flour.
Denmark 3 050 3 060 f4 108 102 + 2 64 57 f7 More meat, milk; less potatoes.
Finland 2 620 3 070 - 91 99 41 44
France 2 360 2 740 - 76 99 - 30 39 + 5 More milk, cheese, butter.
Germany: Bizone 2 190}1 8601 900 '
2 530
2 110
+ 5
+ 4
75 k68 i61
81
68
-+ 6
22 k
24/14
27
14
+10
+25
More meat, oils and fats, milk,
French ZoneSoviet zone
sugar, less potvirles, cereaLs.More cereals, meat. fat; less
potatoes, sugar.Greece 2 270 - 2-110 - 68 75 + 5 13 l. -1-20 More milk, cheese; slightly more meat.
Iceland- 3 270 3 230 - 123 124 - 86 86 -Ireland 3 260 3 350 I - 104 98 50 49 -IL-Ay 2 250 2 340 - 71 76 16 19 +5 iore meat and fats; less pulses
d potatoes.
-lands ..... --- ---- - .......... 2 690 2 880 ; +3 78 83 f2 35 40 f5 More meat, faLS; Jess potatces.
r-tay
_ d
2 900
2 360
2 970
2 620
i + 5
+ 7
90
66
101
74
-+ 5
48
17
52
21
+ 5
f4llore meat, milk, fats; less potatoes,
vegetables, fruit, cereals(sligW.y).More fish, sugar, vegetables;
less potatoes, cere.als.
Sweden 2 870 3 070 + 3 92 95 + 3 59 60 + 6 More milk, meat, sugar, lesspotatoes.
Switzerland 3 050 3 100 - 93 94 - 46 49 -United Kingdom 2 970 3 030 + 2 89 90 46 45 +10 More meat. butter; less cereals.
OCEANIA and NORTH AMERICA
Australia
New Zealar- id-
3 260
3 210
3 160
3 250
+ 1
+ 1
105
100
95
96
+ 1
+ 1
67
64
64
65
+ 1
+ 1
Slightly more meat, cheese,butter.
Slightly more meal; cheese, butter.
Oinada
United States 3 220
3 210 3 060
3 130
+ 3 98
97
92 + 2
90 -59
61
57
60
+ 2 More cereals, pork; less beef,veal, and mutton
LATEN AMERICA
Central America and CaribbeanOita -----____ ......_Mexico
2 6802 010
2 7302 050
-1- 5
6756
6756
-f4 2616
2516 - More wheat, rice, sugar:.
Stia AmaficaArzeatina. 3 190 3 190 + 1 110 102 + 1 66 66
More wheat. rice, and meat; lessPotatoes and sugar.
ilradi 2 240 2 340 + 6 64 63 + 3 27 25 More wheat, rice, manioc, sugar.
: Chile_ 2 350 2 360 - 73 71 -3 24 23 -9 More wheat, rice, sugar; less meat_
. Colombia- 2 22z) 2 280 - 55 56 - 26 26
L.:rag/ray_ 2 490 2 580 + 5 94 94 +10 63 62 fn. More meat and sugar; less wheatand rice.
. ....A.R. EAST2 500 - ... 69 13
r.'7,te.7
2 360
2 170
2 480
2 606
- 2
- 6
68
68
72
79 -69
12
11
13 - 5
More wheat, pulses; iess bar ley,maize, rice, sugar.
Less cereals and livestock products.
AFTL' CA
urifius 2 OGO 2 240 + 3 45 49 + 2 12 11 + 1 More sugar and wheat.
-Ca. 2 420 2 580 - 74 72 + 1 27 f2 More wheat, pork; less maize.

TABLE B. -INDEX OF VOLUME OF PRODUCTION FO CROPS ANDFOOD AND NATURAL FIBER CROPS
aIndex numbers are based on the production of wheat, rye, baley, oats, maize, rice, potatoes, sugar, and fats ami oils. Uniform priceweights are applied to total output without deduction for quantities fed to livestock.
Includes production of cotton, wool, jute, and hard fibers, plus coverage of food crops as indicated infootnote a.
TA3LE C. - INDEX OF VOLUME OF TRADE IN FOOD CROPS AND MEAT, ANDFOOD CROPS, MEAT, AND NATURAL FlaERS
Region
1948/49 I 1949/50Exports
Food crops and meat' Food crops, meat, and natural fibersb
1948/49mports Ex
86
75
or
alndex numbers are based on the trade of wheat, rye, barley, oats, maize, rice, potatoes, sugar, fats and oils, and meat. The trade datafor grains, except rice, refer to July-June 1948/49 and 1949/50, and represent shipments from principal exporters, to which known move-ments from other sources and reported exports of grain products from importing countries have been added. Rice trade excludes re-exports. Nleat exports relate only to 10 European noporters and the U.S.A. Uniform price weights are applied in calculating theseindexe s.
aIncludes trade of cotton, wool, jute, and hard fibers, plus coverage o f food crops and meat as indicated in footnote .
----- --
Region
-- - - -
Food crops' Food and natural fibersb1948/49 1 1949/50 948/49 I 1949/50
( Base: 1934-38 = 100..... ......... )
Far East 98 96 95 93
Europe (excl. U.S.S.R.) 93 91 93 91
North America 168 150 155 143
Latin America 114 110 113 112
Oceania 116 129 111 118
Africa and Near East 114 107 112 106
WORLD (excl. U.S.S.R.) 109 1105 108 104
Far East 33 36 84
Europe (excl. U.S.S.R.) 47 62 83
North America 290 248 91
Latin America 86 79 112
Oceania 120 114 146
Africa and Near East 81 95 132
WORLD (excl. U.S.S.R.) 88 85 88
1949/50 1948/49ase: 1934 - 38 = 100
81
82 48
90 157
125 95
122 131
121 86
35 65 65
61 80 85
163 126 104
82 123 134
133 162 115
96 134 129
86 86 87
949/50 1948/49 949/50

TABLE D. - INDEX OF VOLUME OF PRODUCTIONAND OF INTERNATIONAL TRADEOF ALL FIBERS COMBINED, NATURAL AND SYNTHETIC
alndex numbers on tonnage basis; includes cotton, wool (clean basis), raw silk, rayon, nylon, flax, hemp, jute, abaca, sisal, andhenequem
bIndex numbers on a tonnage basis include cotton, wool (clean basis), raw silk, rayon, jute, abaca, sisal, and henequen.
TABLE E. -1I'ADEX kAUMBERS OF VOLUME AND VALUE OF
WORLD EXPORTS OF ALL PROD'oCTS(1937:100)
Source: Statistical Office of the United Notions.
76
Period
VolumeValue
(in U. S. dollars)Average
unit valueIndexIncrease weer
preceding periodAnnual Quarterly Annual Quarterly Annual Quarterly Annual Quarterly
(..... Percent.... )
Total World
1947 90 21.6 186 206
1948 95 5.5 211 223
1949 103 8.4 216 211
1st quarter 101 - 1.0 226 2232nd quarter 103 2.0 227 219
3rd quarter 98 - 4.9 210 2164th quarter 109 11.2 202 186
1950 1st quarter 109 0 197 182
World (excl. U.S.A.)
1947 67 147 220
1948 80 16.2 187 234
1949 88 10.0 196 222
1st quarter 85 - 3.4 203 238
2nd quarter 86 1.2 202 2343rd quarter 85 - 1.2 194 229
1th quarter 98 15.3 185 190
1950 1st quarter 100 2.0 185 186
Region Production a Exportsb Importsb
1948/49 1949/50 1948/49 J 1949/50 I 1948/49 1949/50Base: 1934-38 z 100.
Far East. 63 66 44 40 53 52
Europe (excl. U.S.S.R.) 128 145 176 165 78 85
North America 129 137 84 94 147 122
atin America 118 133 114 135 197 185
Oceania 108 113 142 151 206 210
Africa and Near East 107 108 110 113 380 500
WORLD (excl. U.S.S.R.) 98 104 82 86 81

aExp
orts
f.o
.b.,
impo
rts
c.i.f
.
1937
TA
BLE
F. -
WO
RLD
TR
AD
E B
Y C
ON
TIN
EN
TS
'
(a -
mill
ions
of U
.S. d
olla
rs; b
- p
erce
nt o
f tot
al)
1948
1949
ist q
uart
era
Sour
ce: S
tatis
tical
Off
ice
of th
e U
nite
d N
atio
ns, W
orld
Tra
de S
umm
ary,
Fou
rth
quar
ter
1949
.
949
2nd
quar
ter
3rd
quar
ter
4th
guar
el
ab
a
Ann
ual r
ates
Afr
ica
Exp
.1
380
5.3
3 53
06.
43
740
8.6
4 00
06.
84
040
6.8
3 56
06.
43
360
6.4
Imp.
1 84
06.
35
340
8.7
5 26
08.
65
600
8.9
5 88
09.
05
440
8.9
4 12
07.
4B
al.
- 46
0-
1 81
0-
1 52
0-
1 60
0-1
840
-188
0-7
60
Nor
th A
mer
ica
Exp
.4
340
16.6
5 74
028
. 514
850
26.2
15 8
8026
.816
400
27.5
13 5
6024
.613
520
25.6
Imp.
4 23
014
.610
810
17.7
0 26
016
.70
760
17.1
10 2
8015
.79
520
15.6
10 4
4018
.8
Bal
.+
110
+4
930
-4 5
90+
5 12
0+
6 12
0+
4 04
0+
3 08
0
Lat
in A
m e
rica
Exp
.2
560
9.8
7 21
013
.06
370
1.2
6 20
010
.56
120
10.3
6 48
011
.76
600
12.5
Imp.
205
07.
17
100
11.6
6 38
00.
46
720
10.7
6 40
09.
86
160
10.1
6 20
011
.1
Bal
.+
510
+11
0-
10-5
20-2
80+
320
+40
0
Asi
aE
xp.
5 05
019
.36
280
11.4
6 77
01.
97
360
12.1
6 72
011
.36
760
12.2
6 24
011
.8
Imp.
4 62
015
.97
680
12.5
8 67
014
.18
920
14.2
9 72
014
.88
920
14.6
7 12
012
.8
Bal
.+
430
- 1
400
-190
0-
1 56
0-3
000
-216
0-8
80
Eur
ope
Exp
.11
980
45.7
20 3
5036
.822
700
40.0
23 1
6039
.123
600
39.6
22 7
6041
.221
240
40.2
Imp.
15 5
4053
.628
360
46.3
28 7
6046
.828
920
46.0
31 2
8047
.729
160
47.6
25 8
0046
.4
Bal
.-
3 56
0-8
010
-606
0-
5 76
0-7
680
-6 4
00-4
560
Oce
ania
Exp
.89
03.
32
220
4.0
2 23
03.
92
560
4.3
2 60
04.
42
000
3.6
1 80
03.
4
Imp.
700
2.4
1 88
03.
12
050
3.3
2 00
03.
22
080
3.2
2 16
03.
51
960
3.5
Bal
.+
190
+34
0+
180
+56
0+
520
-160
- 16
0
OR
LI)
TO
TA
LE
xp.
26 2
0010
0.0
55 3
0010
0.0
56 7
0000
.059
200
100.
039
600
100.
055
200
100.
052
800
100.
0
Imp.
29 0
0010
0.0,
61 2
0010
0.0
61 4
0000
.062
800
100.
065
600
100.
061
200
100.
055
600
100.
0
aa

TABLE G-1 - CHANGES C,J;7-",NCY VALUES BETWEEN 18 SEPTEMBER 1949 AND 31 MARCH 1950*
SOUrces: National Advisory Council on tnrem.tionet Monetary and Finandal Problems, Second Special Report to the President andto the Congress of the United States, (May 1950).Note on ilexico taken froto International Monetary Fund, lrzternationcl Financial Statistics.
aAll of the British territorial currencies, except that of British Honduras, were lilcewise devalued by 30.5 percent. The latter currencywas devalued 30.0 percent, effective 31 December 1949.
bRepresents two separate devaluations of the lucíaa.. The.first, occurring on 20,September 1949, represented a reduction of 30.5 percent(from 15.4 11 to 10.705 U.S. cents per króna). The seconddevaluation of 42.6 percent (effective 20 March 1950) brought the new parvalue of the Icrerta to 6.14 U.S. cents.
ern November- j949 the Austrian Government increased its basic rate to 14.40 schillings to the dollar, with a premium rate of 26schillings (used for invisibles and certain other transactions), and a "retention quota" of 60 percent for exports, yielding an effectiverate of 21.36 schillings for exports. Subsequently the reter.tion quotas ..verc modified for various classes of transactions.
dThe Belgian Congo franc remains at par with the Belgian frenc.eThe Finnish change shown here followed -closely an earlier devaluation ((roto 0.735 to 0.625 cents per knarkka) on 4 July 1949, andthus represents a total devalualion of 41 percent during recent months.
fThe old rate shol.vn is for hade transactions. Under the official free-market system used in France, the rates referred to here aretechnically flexible, though they may be held steady for relatively long periods. The new rate shown is as of 31 March 1950. Allcurrencies of French dependencies are_peggeu.to the French-franc, except: (1) the rupee of French possessions in India, which ismaintained at par with the Indian rupee; and (2) the Djibouti franc, which retains its old dollar parity of 0.47 cents.
gUnder the exchange certificate system used in Greece, the rates referred to here are technically flexible, but for over a year beforethe current devaluation, fluctuations in the old rete had been held to less than 1 percent in either direction.
hUnder the official free market system used in Italy, the rates referred to here are technically flexible, though they Inay be held steadyfor relatively long periods. The new rete shown is as of 3 1 March 1950.
i The change shown here followed closely a minor adjustment (froto 4.0 124 to 4,0 cents per escudo) on 3 August 1940. Portugal is nota member of the International Monetary Fumed and the escudo has no par value. Rates shown are mid-rates between the official buyingand selling rates.
¡Sweden is not a member of the Fruid and its krona has no par value. Rates shown are an average, between the official buying andselling retes.
kFree market rate for imports.1Effective 20 September 1949. However, on 13 March 1950, further devaluation of the guilder was effected by means of the introductionof the certificate type of exchange control in the flexible buying and selling rates. On 31 /larch 1950, the latter rates were quoted alone-half to one-third that of the official rate, which remained unchanged at 26.316 U. S. cents per guilder.
78
CountryMonetary
UnitCurren cy value Reduction in
01 d NI e w value
( U. S. cents per unit of currency) (» ercent)
TERLLNG AREA*United Kingdoma Pound 403.000 280. 000 30.5Iceland Króna 15. 411 6. 140 60. 2bIreland Pound 403. 000 280. 000 30. 5Burma Rupee 30. 225 21. 000 30.5CesIon Rupee 30. 225 21. 000 30. 5India Rupee 30. 225 21. 000 30. 5.Iraq Dinar 403. 000 280. 000 30. 5Australia Pound 322. 400 224. 000 30. 5New Zealand Pound 403. 000 280. 000 30. 5Union of South Africa Pound 403. 000 280. 000 30_5
ROPE*Austria` Schilling 10. 000 6. 944 306Belgium-Luxembouret F-ranc 2. 282 2. 000 12. 3Denmark Krone 20. 838 14. 478 30. 5,Finlande Markka 0. 625 0. 4348 30.4Francef Franc 0..3669 0. 0360 22. 9Germany (Western) Deutsche mark 30. 000 2&810-10 206Greeceg Drachma 0.01 0. 00 67 33. 3ItalYh Lira 0. 17 39 0. 160 1 7. 9Netherlands Guilder 37.695 26. 316 30. 2Norway Krone 20. 150 14. 000 30. 5Portugali Escudo 4: 000 3. 478 13. 0Swedeni Krona 27. 8 16 19. 33 30. 5
OTHER COUNTRIES*Canada Dollar 100. 000 90. 909 9. 1Egypt Pound 413. 300 287. 156 30. 5Israel Pound
Importsk 30 2. 000 1 of 7. 3Exports 40 3. 000 ) 280. 000
1 30. 5Jordan Pound 403.000 280. 000 30. 5Thailand Baht 10:075 8.000 20. 6Indonesia,- Guilder 37.695- 26. 316 30. 21

TABLE G-2 CHANGES IN CURRENCY VALUES BETWEEN 18 SEDTE 1949 AND 31 MARCH 1950
(REPRESENTATIVE EXCHANGE RATES)
In the months immediately following the currency devaluations by the other countries shown in this table, a number of Latirt Americancountries made changes in their exchange-rate systems. The extent of devaluation cannot exactly be determined, but the representa-tive old and new exchange rates give some indication of the order of magnitude involved. Specifically, the changes in individual coun-tries were as follows:Argentina: On 1 October 1949, Argentina announced extensive changes in the existing multiple exchange-rate system, but left un-changed the basic export rate in tenns of dollars. Argentina is not a member of the Fund and its peso has no par value. The basicbuying rate for the peso is 29.77 U. S. cents. Bolivia: In February 1950, two of the three existing rates were altered, but there wasno change in the par value of 2.38 U.S. cents per boliviano. On 8 April the 2.38 rate was abandoned. One of the remaining tworates, 1.667 U.S. cents per boliviano, became the new parity. Several additional effective rates result from the sale of varying propor-tions of export proceeds at the two specified rates. Chile: On 10 January 1950, the Ftvid announced that Chile had introduced a newtemporary rate of 1.667 U. S. cents per peso. Although this action, with Fund concurrence, did not constitute a formal revaluation ofthe peso, it was regarded as the first step in a program of unifying Chile's complex multiple-rate structure and of establishing a newpar value. Costa Rica: On 1 April 1950, without objeCtion by the Fund, Costa Rica modified its multiple exchange-rate system. Nochange was made in the par value (17.8 cents per colón) or in the official buying rate, but the was some effective depreciation ofti/e selling rates by requiring imports in the tInee least favored of the four import categories to be financed in the free market and byincreasing the exchange surcharges which apply at various rates. Four effective selling rates are thus established, and a fiftheffective rate may be established by the creation of a fifth import category to which a particularly high surcharge rate would apply.Ecuador: In December 1949, without the approval of the Fund, Ecuador discontinued the use of its establighed par value (7.4 1 U.S.cents per sucre), as a buying rate for export proceeds. The par value of the sucre was not formally revalued, although it is now usedonly for a few nontrade transactions. There exist three effective selling rates for merchandise knports, resulting from taxes appliedto the par value. Mexico: Because of its proximity in time to the period of general currency devaluations, the devaluation of the-.lexican peso on 17 June 1949 is listed here. On that date the par value of the peso was changed to 8.65 pesos per U. S. dollar. Theold par value of 4.855 pesos had technically been in existence until this time, but the Bank of I/lexica discontinued swport of thepeso at this rate on 22July 1948. Nicaragua: In December 1949, without the approval of the Fund, Nicaragua introduced changesin its exchange rate structure involving an indeterminate amount of effective devaluation and some increase in the degree of ratemultiplicity. These revisions did not amount to a formal revaluation of the córdoba, a.-hich remained at 20 U.S. cents per córdoba,Paraguay: On 7 November 1949, the Fund announced that Paraguay had introduced certain modifications in its multiple exchartge-ratesystem. These changes, although not representing a formal revaluation of the guarani' involve some simplification of a previouslyhighly complex structure of rates. The par value of the guaranl is 32.3625 U.S. cents per guarani. Peru: On 15 November 1949, theFund announced that Peru had suspended the former par value of the sol (15.335 U-S- cents). Peru has since permitted the exchangerate to be determined in an exchange certificate market. The step was taken as a temporary tueastne looking toward the establishmentof a mitary rate system at a new par value. Uruguay: On 6 October 1949, Uruguay-introduced modifications in its multiple exchange-rate system. The Fund expressed no objection to these temporary ne asures, with the understanding that consultation would continuefor the purpose of unifying the rate structure and ultimately agreeing on a par value. Probably the most important of Uruguay's threeofficial buying rates is 65.83 U. S. cents per peso.
CountryMonetary
UnitU. S. cents per unit of currency Type of
Old e exchange rate
LATIN AMERICAArgentina Peso 23.641 16. 420 Basic rate for goods not in
preferred categories.Bolivia Boliviano 2. 357 1.650 Official selling rate.Chile Peso 2. 326 1. 667 Old offi.cial rate and new
interim rate.Costa Rica Colón 10. 6 27 9. 276 Unweighted average of free
rates (old two, new five).Ecuador Sucre 7. 407 6. 142 Old offi.cial rate and new
average of 3 official rateswith varying taxes andsurcharges.
Mexico Peso 20. 576 ( 1948) 11.561 Official selling rate.12. 407 ( 19 49)
Nicaragua Córdoba 18.904 18.000 Old offi.cial rate plus tax,new 80% official rate and29% rate of exchangecertificates.
Paraguay Guarani 32. 041 17. 989 0 d official rate, new un-weighted average ofofficial and 2 specialimport rates.
Peru Sol 7. 806 6. 443 Old average of official andcertificate rate, newaverage of certificate andfree rate.
Uruguay Peso 58.823 48. 426 Average of three buyingrates.

BLE H. - UNITED STATES GENERAL IMPORTS AND EXPORTS FOR SIX MONTHS' PERIODS BEFORE AND AFTERDEVALUATION TO AND FROM VARIOUS REGIONS BY EXTENT OF DEVALUATION
80
Change betweer
Extent of devaluation Oct.'48-March 1949 April-Sept. 1949 Oct. '49-Mar. 1950 Oct.'48-t Oct.'49- Apr.'49- Oct.'iar.'49 ° Mar.'50
tSept.'49 ° Mar.'5
imports Exports Imports Exports Imports Exports Imports Exports Imports Exports
( Thousand dollars ( P ercent
ore than 30% - Total
ritish Commonwealth(excl. Canada, inchIreland
849 783 1 647 572
670 503 993 681
668 920 1 528 212
499 063 982 851
807 330 1 228 474
600 650 767 321
5.0 -25.5 ]-20. 7 -19. 6
;e1and 1 500 5 300 700 3 700 2 000 3 200ustria 6 300 85 815 4 400 63 715 5 400 76 369enmarlt 3 100 50 191 2 100 40 344 5 500 38 319inland 11 196 14 726 12 746 14 277 18 700 9 758reece 8 654 117 561 7 167 98 941 8 659 65 023etherlands 25 399 171 613 31 297 138 454 26 793 130 216orway 25 201 49 570 11 332 49 402 16 380 30 203weden 28 396, 46 114 25 121 45 333 37 510 42 135urma 1 600 2 300 200 600 100 700.aq 5 500 5 400 1 300 8 300 4 200 4 100gypt 1 731 28 660 7 894 25 495 24 858 15 507;rael. and Palestine (Imports) 2 600 3 500 3 0003rdan 1 400 900 600tdonesia 57 903 75 241 62 100 55 900 53 580 44 928
) - 30% - Total 109 864 790 357 77 640 732 507 100 169 561 515 - 8.8 -29.0 +29.0 -23. 3
rance and Possessions 53 702 349 034 37 035 314 299 54 200 254 500ermany 26 944 425 834 18 692 404 398 24 974 292 217hailand 29 218 15 489 21 913 13 810 20 995 14 798
3 - 29% - Total 100 051 221 159 55 944 212 335 77 380 180 890 -22. 7 -18. 2 +38. 3 -14. 8
.eigium-Luxembourg 70 521 160 971 35 839 160 911 51 013 143 573ortugal 8 327 34 797 5 700 24 809 7 918 17 434elgian Congo 21 203 25 391 14 405 25 615 18 449 19 883
ess than 10% - Total 890 252 1 257 010 762 719 1 303 605 885 108 1 072 670 -0.6 -14.7 +16.0 -17.7
aly 51 229 254 314 31 198 221 898 40 153 181 619anada 839 023 983 234 731 521 1 043 788 844 955 839 266>rael and Palestine(Exports) 19 462 37 919 51 785
Latin American countries 250 888 304 304 204 944 258 810 244 236 214 341 - 2.7 -29. 6 . -17. 2
7gentina. 57 288 99 799 36 219 63 225 86 961 66 357olivia 26 427 21 771 24 956 17 234 17 003 12 273hile 95 905 75 781 76 304 76 719 55 016 50 780osta Rica 11 500 15 506 11 400 12 900 12 900 12 600:cuador 10 500 15 900 7 400 16 200 10 000 14 700icaragua 2 200 9 600 4 400 7 000 6 300 9 600araguay 2 500 3 400 3 000 4 600 2 700 2 200eru 20 580 40 769 20 472 44 637 17 911 30 838ruguay 23 988 21 784 20 793 16 295 35 425 14 953
11 Other Countries 1 463 718 2 266 663 1 Ma 677 2 010 550 1528 354 1 751 996 + 4.4 -22.7 +16.8 -12.9
TOTAL 664 556 6 487 065 3078844 6 046 019 3642577 5 009 886 -0.6 -22.8 -17.2

TABLE I - INTERNATIONAL BANK FOR RECONSTRUCTION AND DEVELOPMENT LOANS,
SOURCE: I.B.R.D. Fi fth Annual Report , 1949/50
aThrough 30 June 1950.
bl. Materials and equipment for agricultural production (including flood control).Transportation and communication.Power.Equipment for other industries.
5 Agricultural raw materials for industry.6. Other raw materials for industry.
cThrough 31March 1950; disbursements in tne second quarter of 1950, for which a breakdown by recipients is not yet available,amounted to $19.2 million.
dlncludes loans to private industries under government guarantee.eIncludes $2.3 million for equipment for the food-processing industry.
fbifference accounted for by repayments and/or cancellations.5$10 million dcducted; to be refunded out of 1950 loan.
Loan net effective as of 30 June 1950
81
8.7 7.340.0
250.9
11.8f
207. 5f 8.3
518.0 15.6
31.4 58.6
4.9 11.1
0.9 4.1
1.3 13.5
26.7 35.8
12.8
10.2 39.9
1.6 1.1
12.5
'77.0 189.4
595.0 205.0
1947 to 1950, by Purpose
CountriesTotal s authorized Specified purpos
1947 1948 1949 a19 2 3 4 5 6
Million U. S. dollars
DEVELOPED:
Belgium 16. 0 - 5.7 10. 3
Denmark 40. 0 7.5 4.8 6. 8 4.0 16. 9
France 250. 0 2.3. 33.3 0.9 11. 0 28. 0 174. 5
Luxembourg 12. 0 4.5 7. 5
Netherlands 191.0 16. Od 15. 0 33. 1 78. 1 50. 8 60.0
TOTAL 493. 0 16. 0 31.0 42.9 120.7 6. 86. 4 32.0 251. 4
LESS DEVF_LOP ED:
Brazil 75. 0 15. 37.0 53. 0
Chile 16. 0 2. 5 13. 5
Colombia 5. 0 5. 0
Finland 14. 8 2. 8 2.0 10. 0
India 44. 0 18. 5h 28. 5 34.0
Iraq 12. 811 12. 8
Mexico 24. 1g 26. 0 50. 1
Yugoslavia 2.7 2. 7
El Salvador 12. 5h 12. 5
TOTAL 16. 0 178. 1 72. 3 54. 3 71.0 10.0
GRAND TOTAL .0 32. 0 209. 1 72. 3 97. 2 191 .7 7.7 96.4 32.0 251.4