Embed Size (px)
Citation preview

World Mortality 2017
United Nations
Data Booklet

World Mortality 2017
Worldwide, the number of years that a newborn is expected to live, if current mortality patterns remain constant in the future, exceeded 71 years in 2015 and the life expectancy at birth is still growing. The history of increasing life ex-pectancy at birth, however, is not long. In most countries, it started only after the Second World War. The fast increase of life expectancy at birth reflects the success of human development. Yet remarkable differences exist in mortality levels, age patterns and time trends between countries and regions. The so-cioeconomic implications of the diverse mortality levels and age patterns, their dramatic changes and their potential future trends are critical for understand-ing the implementations of the 2030 Agenda for Sustainable Development. Sustainable Development Goal 3, “Global Health and Well-Being”, comprises targets that contribute directly to rising life expectancy. However, progress to-wards each of the 17 Sustainable Development Goals contributes to longer and healthier lives by improving living conditions for all.
This data booklet presents selected findings drawn from the latest mortality es-timates and projections as published in World Population Prospects: The 2017 Revision. All information is available at www.unpopulation.org.
Suggested citation: United Nations, Department of Economic and Social
Affairs, Population Division (2017). World Mortality 2017 – Data Booklet (ST/
ESA/SER.A/412).Inside cover photo: Copyright © UN Photo/Stuart Price.

1 World Mortality 2017
Life expectancy at birth reached unprecedented high levels, but significant differences persist across regions
In 2015, the average life ex-pectancy at birth for Africa, where 16 per cent of the world’s population lived, was 61 years; and the average life expectancies for the other five regions, where 84 per cent of world’s population lived, var-ied between 70 and 80 years. Across regions, the highest life expectancy at birth was 80 years in Northern America, where 5 per cent of the world’s population lived, followed by Europe and Oceania with 78 years and 11 per cent of the world’s population, Latin America and the Caribbean with 75 years and 8 per cent of the world’s population, and Asia with 72 years and 60 per cent of the world’s population.
Life expectancy at birth (both sexes) and percentage of the world’s population by region, 2015
Data source: World Population Prospects: The 2017 Revision.
Africa, 16%
Asia, 60%
Latin America and the Caribbean, 8%
Europe, 10% Oceania, 1%
Northern America, 5%
55
60
65
70
75
80
85
Life
exp
ecta
ncy
at b
irth
(yea
rs),
2015
Note: bubble size is proportional to the size of the population in each
2 World Mortality 2017
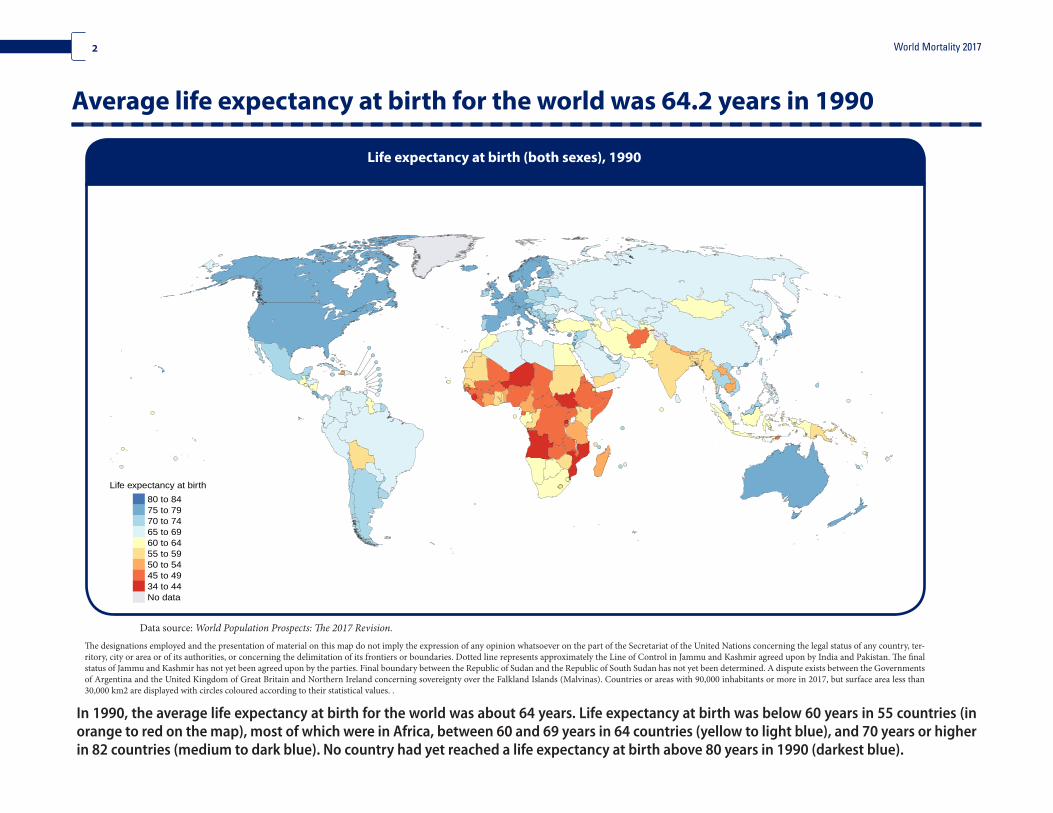
Average life expectancy at birth for the world was 64.2 years in 1990
In 1990, the average life expectancy at birth for the world was about 64 years. Life expectancy at birth was below 60 years in 55 countries (in orange to red on the map), most of which were in Africa, between 60 and 69 years in 64 countries (yellow to light blue), and 70 years or higher in 82 countries (medium to dark blue). No country had yet reached a life expectancy at birth above 80 years in 1990 (darkest blue).
Life expectancy at birth (both sexes), 1990
Data source: World Population Prospects: The 2017 Revision.
Life expectancy at birth80 to 8475 to 7970 to 7465 to 6960 to 6455 to 5950 to 5445 to 4934 to 44No data
The designations employed and the presentation of material on this map do not imply the expression of any opinion whatsoever on the part of the Secretariat of the United Nations concerning the legal status of any country, ter-ritory, city or area or of its authorities, or concerning the delimitation of its frontiers or boundaries. Dotted line represents approximately the Line of Control in Jammu and Kashmir agreed upon by India and Pakistan. The final status of Jammu and Kashmir has not yet been agreed upon by the parties. Final boundary between the Republic of Sudan and the Republic of South Sudan has not yet been determined. A dispute exists between the Governments of Argentina and the United Kingdom of Great Britain and Northern Ireland concerning sovereignty over the Falkland Islands (Malvinas). Countries or areas with 90,000 inhabitants or more in 2017, but surface area less than 30,000 km2 are displayed with circles coloured according to their statistical values. .

3World Mortality 2017
Average life expectancy at birth for the world reached 71.4 years in 2015
Life expectancy at birth (both sexes), 2015
Data source: World Population Prospects: The 2017 Revision.
Life expectancy at birth80 to 8475 to 7970 to 7465 to 6960 to 6455 to 5950 to 5445 to 4934 to 44No data
The designations employed and the presentation of material on this map do not imply the expression of any opinion whatsoever on the part of the Secretariat of the United Nations concerning the legal status of any country, ter-ritory, city or area or of its authorities, or concerning the delimitation of its frontiers or boundaries. Dotted line represents approximately the Line of Control in Jammu and Kashmir agreed upon by India and Pakistan. The final status of Jammu and Kashmir has not yet been agreed upon by the parties. Final boundary between the Republic of Sudan and the Republic of South Sudan has not yet been determined. A dispute exists between the Governments of Argentina and the United Kingdom of Great Britain and Northern Ireland concerning sovereignty over the Falkland Islands (Malvinas). Countries or areas with 90,000 inhabitants or more in 2017, but surface area less than 30,000 km2 are displayed with circles coloured according to their statistical values. .
In 2015, the average life expectancy at birth for the world had risen to more than 71 years. Life expectancy at birth was below 60 years in only 21 countries (in orange to red on the map), between 60 and 69 years in 49 countries (yellow to light blue), between 70 and 79 years in 97 countries (medium to dark blue) and 80 years or higher in 34 countries (darkest blue). Most countries with low life expectancy (yellow to orange) are in sub-Saharan Africa.

4 World Mortality 2017
Increases in life expectancy at birth between 1990 and 2015 were remarkable, but uneven between regions
In Africa, the life expectancy at birth increased by 9.7 years between 1990 (the tail of the red arrow on the vertical axis) and 2015 (the head of the red ar-row on the vertical axis). During the same period, Africa’s population grew from 635 million to 1.2 billion (tail and head of the red arrow on the hori-zontal axis). Africa’s increase of life expectancy was the largest among the six regions. Africa was fol-lowed by Asia, where the life expectancy at birth in-creased by 8.0 years between 1990 and 2015, while the population grew from 3.2 billion to 4.4 billion. The two regions were more influential than the oth-ers in driving the overall improvement in life expec-tancy for the world because their life expectancies increased rapidly and they contained a large share of the world’s population.
Compared to Africa and Asia, life expectancy at birth was higher and population growth was slower in Europe, Latin America and the Caribbean, North-ern America, and Oceania. The life expectancy at birth increased by 4.9 years between 1990 and 2015 in Europe and 4.1 years in Northern America. The increases in Latin America and the Caribbean, at 7.1 years, and Oceania, at 6.1 years, were consid-erably faster than in Europe and Northern America. Therefore, the disparities in life expectancy at birth among the four regions declined between 1990 and 2015 (the heads of the arrows are closer to each other than the tails).
Change in life expectancy at birth (both sexes)and total population by region between 1990 and 2015
Data source: World Population Prospects: The 2017 Revision.
0 1000 2000 3000 4000
5560
6570
7580
Population size (millions)
Life
exp
ecta
ncy
at b
irth
(yea
rs)
Africa
Asia
Europe
Latin Americaand the Caribbean
Northern America
Oceania
5World Mortality 2017
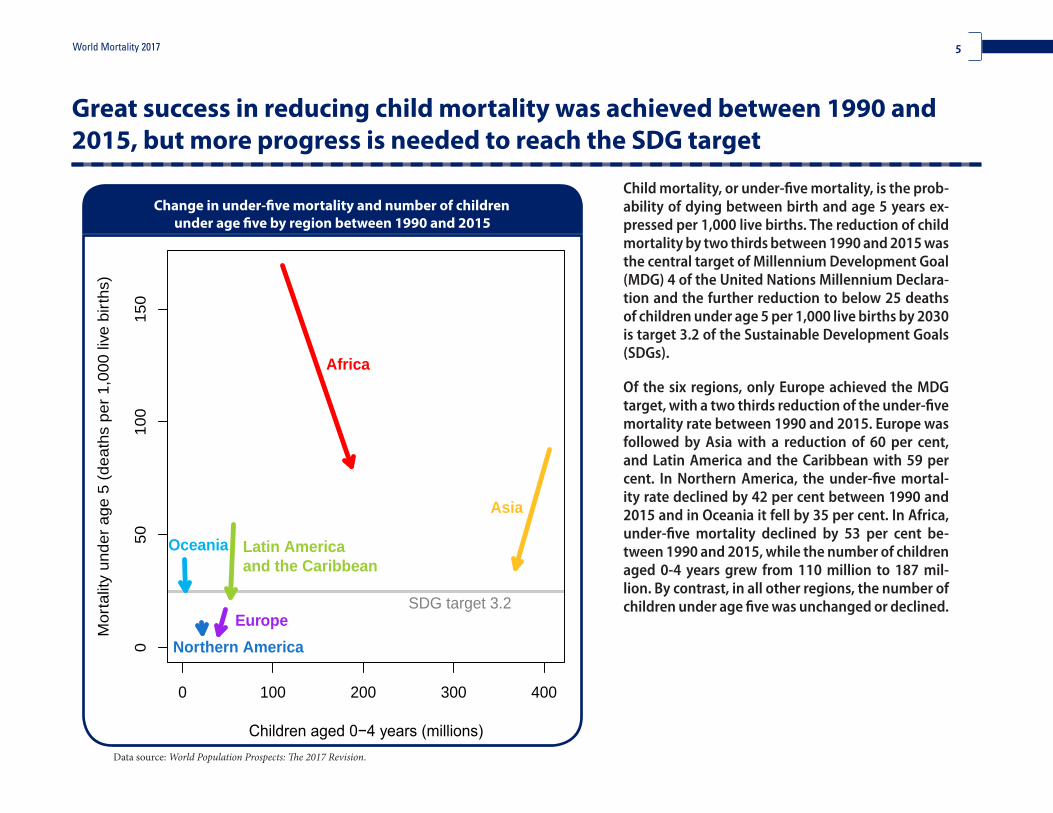
Great success in reducing child mortality was achieved between 1990 and 2015, but more progress is needed to reach the SDG target
Child mortality, or under-five mortality, is the prob-ability of dying between birth and age 5 years ex-pressed per 1,000 live births. The reduction of child mortality by two thirds between 1990 and 2015 was the central target of Millennium Development Goal (MDG) 4 of the United Nations Millennium Declara-tion and the further reduction to below 25 deaths of children under age 5 per 1,000 live births by 2030 is target 3.2 of the Sustainable Development Goals (SDGs).
Of the six regions, only Europe achieved the MDG target, with a two thirds reduction of the under-five mortality rate between 1990 and 2015. Europe was followed by Asia with a reduction of 60 per cent, and Latin America and the Caribbean with 59 per cent. In Northern America, the under-five mortal-ity rate declined by 42 per cent between 1990 and 2015 and in Oceania it fell by 35 per cent. In Africa, under-five mortality declined by 53 per cent be-tween 1990 and 2015, while the number of children aged 0-4 years grew from 110 million to 187 mil-lion. By contrast, in all other regions, the number of children under age five was unchanged or declined.
Change in under-five mortality and number of childrenunder age five by region between 1990 and 2015
Data source: World Population Prospects: The 2017 Revision.
0 100 200 300 400
050
100
150
Children aged 0−4 years (millions)
Mor
talit
y un
der a
ge 5
(dea
ths
per 1
,000
live
birt
hs)
SDG target 3.2
Africa
Asia
Europe
Latin Americaand the Caribbean
Northern America
Oceania
6 World Mortality 2017
Africa is unlikely to reach the SDG target for the reduction of child mortality by 2030
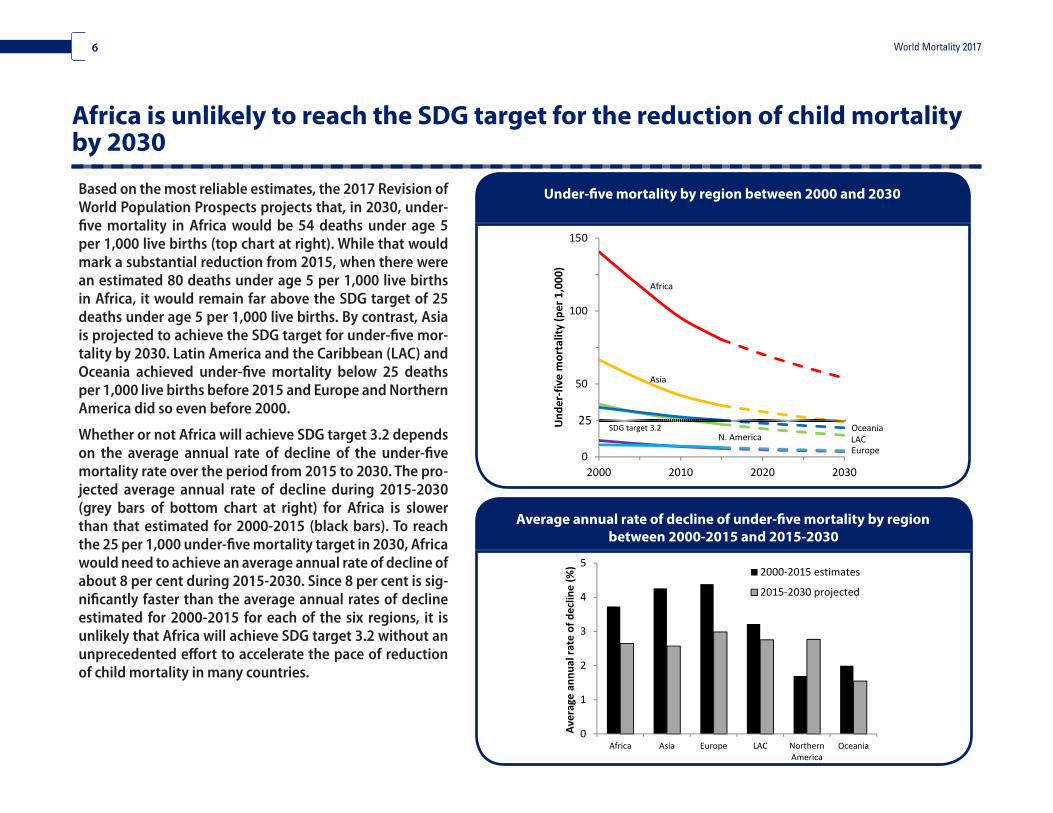
Based on the most reliable estimates, the 2017 Revision of World Population Prospects projects that, in 2030, under-five mortality in Africa would be 54 deaths under age 5 per 1,000 live births (top chart at right). While that would mark a substantial reduction from 2015, when there were an estimated 80 deaths under age 5 per 1,000 live births in Africa, it would remain far above the SDG target of 25 deaths under age 5 per 1,000 live births. By contrast, Asia is projected to achieve the SDG target for under-five mor-tality by 2030. Latin America and the Caribbean (LAC) and Oceania achieved under-five mortality below 25 deaths per 1,000 live births before 2015 and Europe and Northern America did so even before 2000.
Whether or not Africa will achieve SDG target 3.2 depends on the average annual rate of decline of the under-five mortality rate over the period from 2015 to 2030. The pro-jected average annual rate of decline during 2015-2030 (grey bars of bottom chart at right) for Africa is slower than that estimated for 2000-2015 (black bars). To reach the 25 per 1,000 under-five mortality target in 2030, Africa would need to achieve an average annual rate of decline of about 8 per cent during 2015-2030. Since 8 per cent is sig-nificantly faster than the average annual rates of decline estimated for 2000-2015 for each of the six regions, it is unlikely that Africa will achieve SDG target 3.2 without an unprecedented effort to accelerate the pace of reduction of child mortality in many countries.
Under-five mortality by region between 2000 and 2030
Average annual rate of decline of under-five mortality by regionbetween 2000-2015 and 2015-2030
Africa
Asia
EuropeLACN. AmericaOceania
0
50
100
150
2000 2010 2020 2030
Unde
r-fiv
e m
orta
lity
(per
1,0
00)
25SDG target 3.2
0
1
2
3
4
5
Africa Asia Europe LAC NorthernAmerica
Oceania
Aver
age
annu
al ra
te o
f dec
line
(%) 2000-2015 estimates
2015-2030 projected

7World Mortality 2017
Reductions of adult mortality between 1990 and 2015 were much slower than for child mortality
Adult mortality refers to the probability of dying be-tween exact ages 15 and 60 years, measured in deaths per 1,000 persons reaching age 15 years. Observed data on adult mortality are available for an increasing num-ber of countries. In the 2017 Revision of World Popula-tion Prospects, for about 80 per cent of countries, adult mortality was estimated on the basis of observed data.
In Africa, adult mortality declined by 23 per cent be-tween 1990 (the tail of the red arrow) and 2015 (the head of the red arrow), while the population aged 15-59 years increased from 319 million to 640 million. In Asia, adult mortality decreased even more, by 30 per cent be-tween 1990 and 2015 and the population aged 15-59 years grew from 1.9 billion to 2.8 billion. In Latin America and the Caribbean, a 33 per cent decline in adult mortal-ity was also accompanied by an increase of population in that age group. In Northern America, Oceania and Eu-rope, all with lower levels of adult mortality compared to the other regions, the number of people aged 15-59 years changed little between 1990 and 2015.
Change in adult mortality and population aged 15-59 yearsby region between 1990 and 2015
Data source: World Population Prospects: The 2017 Revision.
0 500 1000 1500 2000 2500
100
150
200
250
300
350
Population aged 15−59 years (millions)
Adu
lt m
orta
lity
(per
1,0
00 p
erso
ns a
ged
15 y
ears
)
Africa
Asia
Europe
Latin Americaand the Caribbean
Northern America
Oceania
8 World Mortality 2017
More than half of all deaths worldwide now occur at older ages
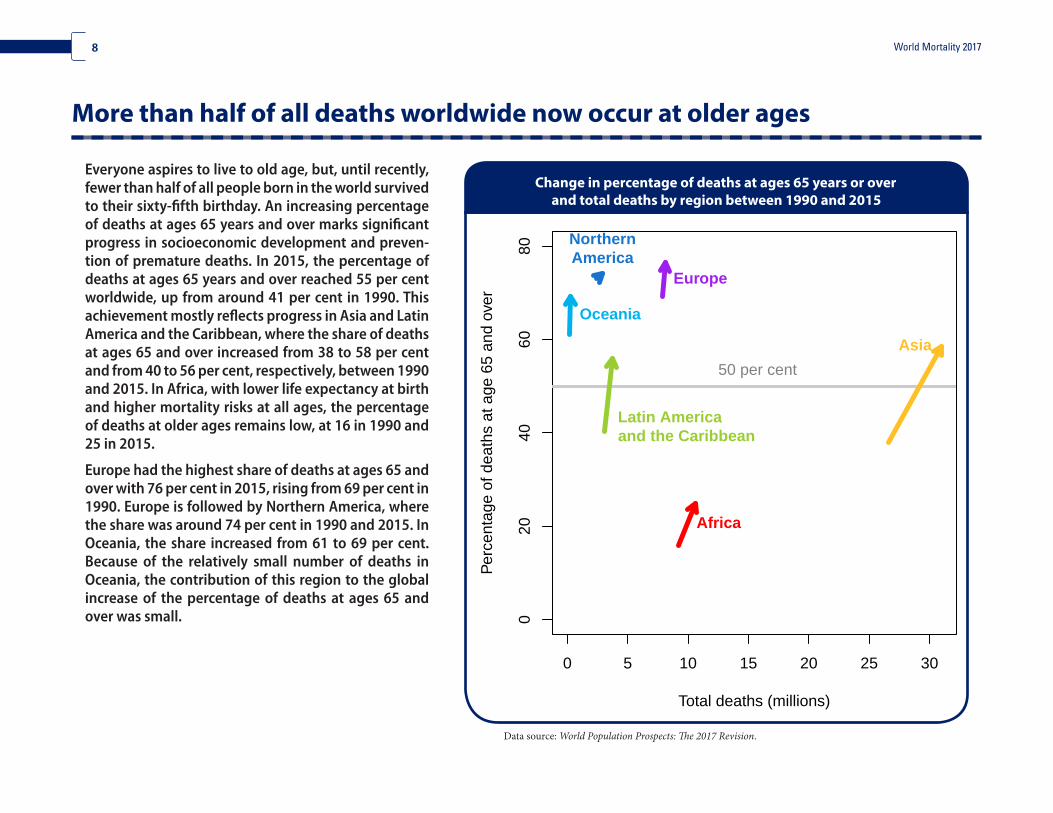
Everyone aspires to live to old age, but, until recently, fewer than half of all people born in the world survived to their sixty-fifth birthday. An increasing percentage of deaths at ages 65 years and over marks significant progress in socioeconomic development and preven-tion of premature deaths. In 2015, the percentage of deaths at ages 65 years and over reached 55 per cent worldwide, up from around 41 per cent in 1990. This achievement mostly reflects progress in Asia and Latin America and the Caribbean, where the share of deaths at ages 65 and over increased from 38 to 58 per cent and from 40 to 56 per cent, respectively, between 1990 and 2015. In Africa, with lower life expectancy at birth and higher mortality risks at all ages, the percentage of deaths at older ages remains low, at 16 in 1990 and 25 in 2015.
Europe had the highest share of deaths at ages 65 and over with 76 per cent in 2015, rising from 69 per cent in 1990. Europe is followed by Northern America, where the share was around 74 per cent in 1990 and 2015. In Oceania, the share increased from 61 to 69 per cent. Because of the relatively small number of deaths in Oceania, the contribution of this region to the global increase of the percentage of deaths at ages 65 and over was small.
Change in percentage of deaths at ages 65 years or over and total deaths by region between 1990 and 2015
0 5 10 15 20 25 30
020
4060
80
Total deaths (millions)
Perc
enta
ge o
f dea
ths
at a
ge 6
5 an
d ov
er
50 per cent
Africa
Asia
Europe
Latin Americaand the Caribbean
NorthernAmerica
Oceania
Data source: World Population Prospects: The 2017 Revision.

Annex table

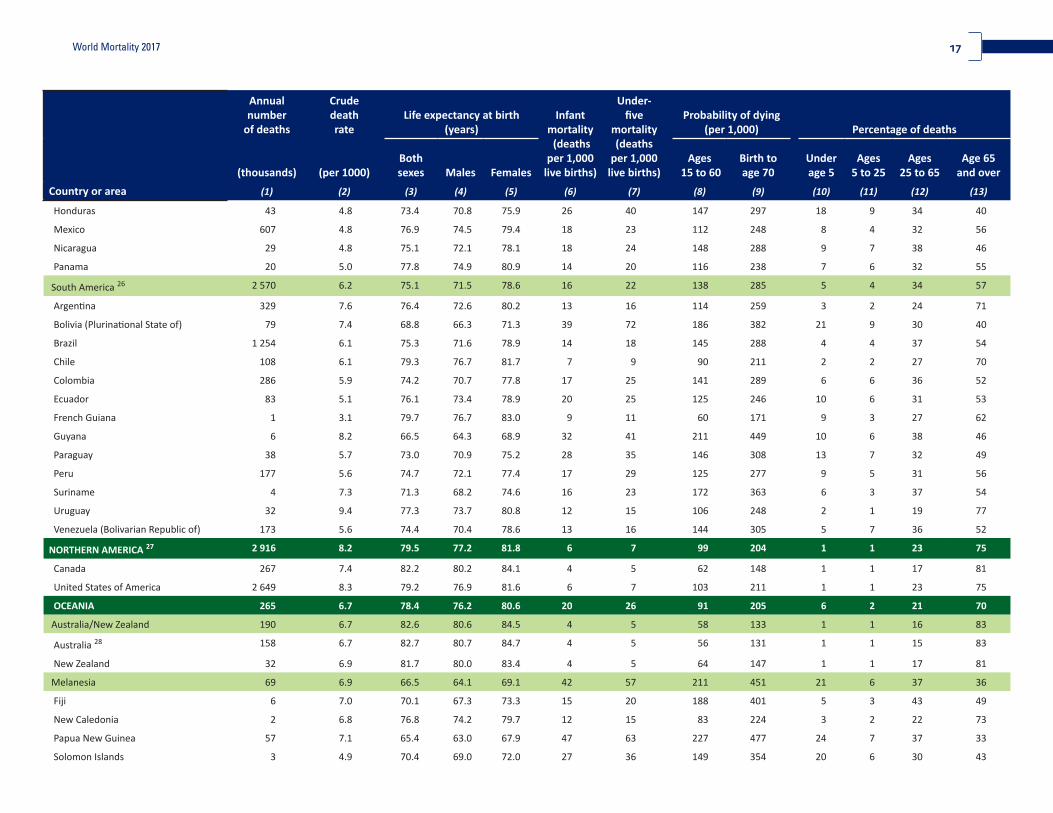
10 World Mortality 2017
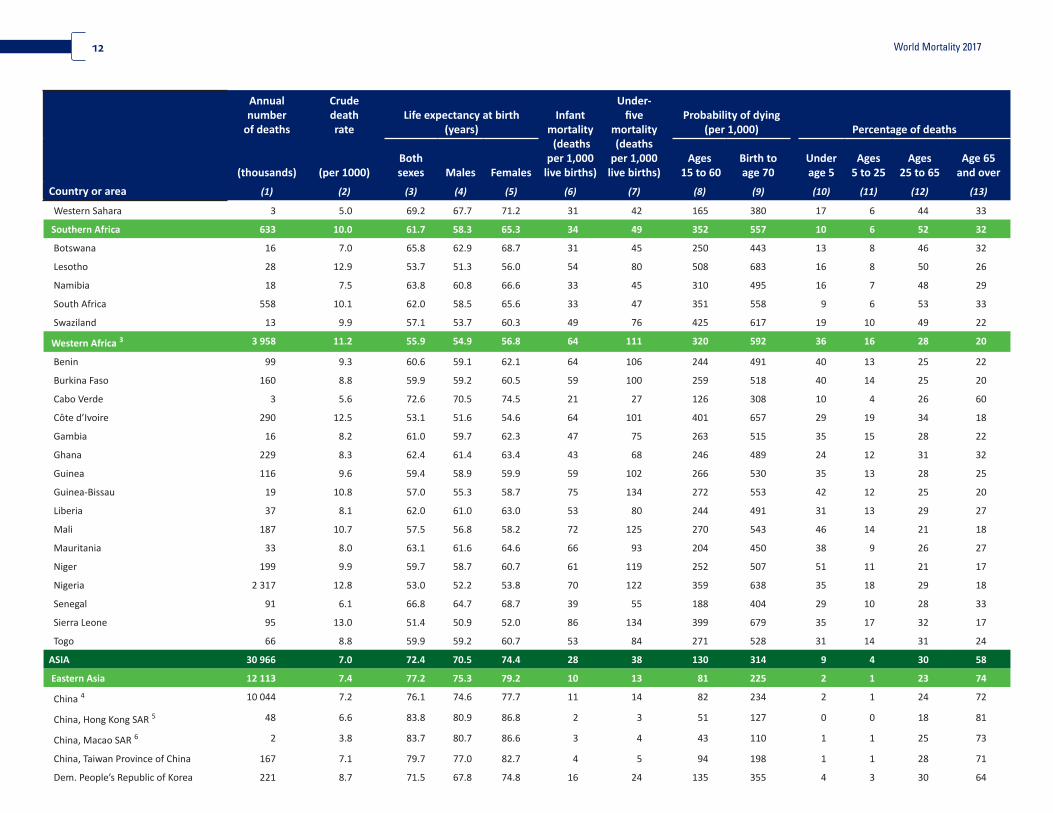
Selected mortality indicators in 2015
Country or area
Annualnumber
of deaths
Crude deathrate
Life expectancy at birth(years)
Infant mortality (deaths
per 1,000 live births)
Under-five
mortality (deaths
per 1,000 live births)
Probability of dying(per 1,000) Percentage of deaths
(thousands) (per 1000)Both sexes Males Females
Ages 15 to 60
Birth to age 70
Under age 5
Ages5 to 25
Ages25 to 65
Age 65 and over
(1) (2) (3) (4) (5) (6) (7) (8) (9) (10) (11) (12) (13)
WORLD 56 657 7.7 71.4 69.2 73.8 33 48 144 326 11 5 29 55
More developed regions a 12 598 10.1 78.9 75.8 82.0 5 6 105 216 1 1 21 78
Less developed regions b 44 060 7.2 69.8 67.9 71.8 36 53 152 352 14 6 31 49
Least developed countries c 7 510 7.8 63.7 62.0 65.4 52 83 223 459 32 12 29 28
Other less developed countries d 36 550 7.1 71.1 69.1 73.1 30 43 142 333 11 5 31 53
Less developed regions, excluding China 33 798 7.2 68.1 66.0 70.3 40 59 179 391 18 8 33 42
High-income countries e 10 166 8.6 80.8 78.2 83.4 5 6 80 176 1 1 18 80
Middle-income countries e 40 959 7.4 70.6 68.5 72.8 31 45 149 344 11 5 31 53
Upper-middle-income countries e 18 711 7.2 74.9 72.5 77.3 14 18 113 269 3 2 29 66
Lower-middle-income countries e 22 248 7.5 67.2 65.3 69.2 41 59 188 414 17 7 33 42
Low-income countries e 5 515 8.6 61.8 60.0 63.6 56 90 251 485 35 13 28 24
Sub-Saharan Africa f 9 270 9.5 59.3 57.6 61.0 57 95 295 537 34 14 30 22
AFRICA 10 596 8.9 61.5 59.8 63.2 53 87 260 495 32 13 30 25
Eastern Africa 3 104 7.7 62.9 60.9 64.9 49 78 259 471 33 13 31 23
Burundi 113 11.0 57.1 55.1 59.1 73 123 295 550 44 14 25 16
Comoros 6 7.5 63.5 61.8 65.2 55 78 228 476 33 10 31 27
Djibouti 8 8.4 62.3 60.6 63.9 53 83 252 475 23 12 37 29
Eritrea 34 7.1 64.6 62.5 66.8 40 57 258 495 24 8 34 34
Ethiopia 701 7.0 65.0 63.2 66.9 41 68 223 432 28 14 29 28
Kenya 277 5.8 66.7 64.3 69.1 37 55 219 409 28 12 35 25
Madagascar 157 6.5 65.5 64.0 67.1 33 55 220 445 25 13 33 29
Malawi 133 7.5 62.7 60.0 65.2 62 85 287 472 38 7 33 22
Mauritius 1 10 7.8 74.6 71.1 78.2 11 14 145 305 2 2 37 60
Mayotte 1 2.5 79.9 76.7 83.3 4 5 95 206 6 4 35 55
Mozambique 292 10.4 57.7 55.5 59.8 65 103 336 558 38 13 31 19

11World Mortality 2017
Country or area
Annualnumber
of deaths
Crude deathrate
Life expectancy at birth(years)
Infant mortality (deaths
per 1,000 live births)
Under-five
mortality (deaths
per 1,000 live births)
Probability of dying(per 1,000) Percentage of deaths
(thousands) (per 1000)Both sexes Males Females
Ages 15 to 60
Birth to age 70
Under age 5
Ages5 to 25
Ages25 to 65
Age 65 and over
(1) (2) (3) (4) (5) (6) (7) (8) (9) (10) (11) (12) (13)
Réunion 5 5.7 80.1 76.7 83.3 4 5 94 204 1 1 30 68
Rwanda 72 6.1 66.7 64.6 68.8 40 64 202 403 30 12 32 26
Seychelles 1 8.1 73.3 69.1 78.3 9 13 166 344 2 1 39 58
Somalia 162 11.6 55.9 54.3 57.6 74 131 311 573 45 15 24 16
South Sudan 134 11.2 56.3 55.3 57.3 72 122 329 571 37 14 30 20
Uganda 358 8.9 59.6 57.4 61.8 57 92 309 528 41 15 28 16
United Republic of Tanzania 2 379 7.0 65.0 63.1 66.8 41 63 243 439 32 12 31 25
Zambia 130 8.0 61.4 58.9 63.9 50 80 296 503 35 14 33 19
Zimbabwe 133 8.4 60.4 58.6 62.0 43 67 360 542 25 12 42 21
Middle Africa 1 575 10.2 58.6 56.9 60.2 68 113 286 531 42 14 25 18
Angola 243 8.7 61.2 58.4 64.1 61 101 242 484 46 14 24 17
Cameroon 237 10.3 57.6 56.4 58.8 63 105 345 566 34 13 33 20
Central African Republic 64 14.0 51.4 49.6 53.2 87 150 417 655 36 14 31 19
Chad 186 13.2 52.6 51.4 53.8 86 147 364 620 46 16 25 13
Congo 38 7.6 64.1 62.5 65.7 42 67 264 459 28 11 35 26
Democratic Republic of the Congo 779 10.2 59.2 57.7 60.7 69 115 262 516 45 14 23 19
Equatorial Guinea 12 10.3 57.4 56.1 58.9 65 109 331 559 33 12 37 18
Gabon 15 7.8 65.7 64.2 67.3 38 58 240 430 20 8 35 36
Sao Tome and Principe 1 6.8 66.5 64.3 68.6 43 63 192 400 31 12 25 32
Northern Africa 1 325 5.9 71.7 69.9 73.4 26 37 134 318 15 5 29 50
Algeria 190 4.8 75.9 74.7 77.1 26 32 96 234 15 4 27 54
Egypt 558 6.0 71.3 69.1 73.6 17 24 151 358 10 3 33 54
Libya 33 5.2 71.8 69.0 74.8 23 29 137 323 10 5 33 52
Morocco 179 5.1 75.6 74.4 76.7 25 33 70 199 12 3 20 65
Sudan 291 7.5 64.3 62.7 65.8 46 74 223 444 31 13 29 27
Tunisia 72 6.4 75.5 73.5 77.6 17 20 92 243 5 2 25 68
12 World Mortality 2017
Country or area
Annualnumber
of deaths
Crude deathrate
Life expectancy at birth(years)
Infant mortality (deaths
per 1,000 live births)
Under-five
mortality (deaths
per 1,000 live births)
Probability of dying(per 1,000) Percentage of deaths
(thousands) (per 1000)Both sexes Males Females
Ages 15 to 60
Birth to age 70
Under age 5
Ages5 to 25
Ages25 to 65
Age 65 and over
(1) (2) (3) (4) (5) (6) (7) (8) (9) (10) (11) (12) (13)
Western Sahara 3 5.0 69.2 67.7 71.2 31 42 165 380 17 6 44 33
Southern Africa 633 10.0 61.7 58.3 65.3 34 49 352 557 10 6 52 32
Botswana 16 7.0 65.8 62.9 68.7 31 45 250 443 13 8 46 32
Lesotho 28 12.9 53.7 51.3 56.0 54 80 508 683 16 8 50 26
Namibia 18 7.5 63.8 60.8 66.6 33 45 310 495 16 7 48 29
South Africa 558 10.1 62.0 58.5 65.6 33 47 351 558 9 6 53 33
Swaziland 13 9.9 57.1 53.7 60.3 49 76 425 617 19 10 49 22
Western Africa 3 3 958 11.2 55.9 54.9 56.8 64 111 320 592 36 16 28 20
Benin 99 9.3 60.6 59.1 62.1 64 106 244 491 40 13 25 22
Burkina Faso 160 8.8 59.9 59.2 60.5 59 100 259 518 40 14 25 20
Cabo Verde 3 5.6 72.6 70.5 74.5 21 27 126 308 10 4 26 60
Côte d’Ivoire 290 12.5 53.1 51.6 54.6 64 101 401 657 29 19 34 18
Gambia 16 8.2 61.0 59.7 62.3 47 75 263 515 35 15 28 22
Ghana 229 8.3 62.4 61.4 63.4 43 68 246 489 24 12 31 32
Guinea 116 9.6 59.4 58.9 59.9 59 102 266 530 35 13 28 25
Guinea-Bissau 19 10.8 57.0 55.3 58.7 75 134 272 553 42 12 25 20
Liberia 37 8.1 62.0 61.0 63.0 53 80 244 491 31 13 29 27
Mali 187 10.7 57.5 56.8 58.2 72 125 270 543 46 14 21 18
Mauritania 33 8.0 63.1 61.6 64.6 66 93 204 450 38 9 26 27
Niger 199 9.9 59.7 58.7 60.7 61 119 252 507 51 11 21 17
Nigeria 2 317 12.8 53.0 52.2 53.8 70 122 359 638 35 18 29 18
Senegal 91 6.1 66.8 64.7 68.7 39 55 188 404 29 10 28 33
Sierra Leone 95 13.0 51.4 50.9 52.0 86 134 399 679 35 17 32 17
Togo 66 8.8 59.9 59.2 60.7 53 84 271 528 31 14 31 24
ASIA 30 966 7.0 72.4 70.5 74.4 28 38 130 314 9 4 30 58
Eastern Asia 12 113 7.4 77.2 75.3 79.2 10 13 81 225 2 1 23 74
China 4 10 044 7.2 76.1 74.6 77.7 11 14 82 234 2 1 24 72
China, Hong Kong SAR 5 48 6.6 83.8 80.9 86.8 2 3 51 127 0 0 18 81
China, Macao SAR 6 2 3.8 83.7 80.7 86.6 3 4 43 110 1 1 25 73
China, Taiwan Province of China 167 7.1 79.7 77.0 82.7 4 5 94 198 1 1 28 71
Dem. People’s Republic of Korea 221 8.7 71.5 67.8 74.8 16 24 135 355 4 3 30 64

13World Mortality 2017
Country or area
Annualnumber
of deaths
Crude deathrate
Life expectancy at birth(years)
Infant mortality (deaths
per 1,000 live births)
Under-five
mortality (deaths
per 1,000 live births)
Probability of dying(per 1,000) Percentage of deaths
(thousands) (per 1000)Both sexes Males Females
Ages 15 to 60
Birth to age 70
Under age 5
Ages5 to 25
Ages25 to 65
Age 65 and over
(1) (2) (3) (4) (5) (6) (7) (8) (9) (10) (11) (12) (13)
Japan 1 322 10.3 83.6 80.4 86.8 2 3 57 132 0 0 11 88
Mongolia 19 6.3 69.1 65.1 73.3 20 28 214 420 10 3 48 39
Republic of Korea 290 5.7 81.9 78.7 85.0 3 4 64 141 1 1 23 75
South-Central Asia 7 13 189 7.0 68.7 67.1 70.3 40 55 170 392 15 5 34 46
Central Asia 457 6.7 70.3 66.8 73.8 27 34 167 378 11 3 37 49
Kazakhstan 155 8.8 69.7 64.9 74.4 12 18 207 400 4 2 39 54
Kyrgyzstan 37 6.3 70.8 66.9 74.8 18 23 178 361 8 3 39 50
Tajikistan 44 5.2 70.9 68.2 74.0 36 49 134 355 25 4 31 40
Turkmenistan 39 7.1 67.7 64.3 71.2 45 56 189 415 19 4 38 40
Uzbekistan 181 5.8 71.2 68.5 74.0 29 36 140 362 12 3 35 49
Southern Asia 12 732 7.0 68.6 67.1 70.2 41 55 170 393 15 6 34 46
Afghanistan 233 6.9 63.3 62.0 64.6 60 81 230 479 37 11 28 23
Bangladesh 856 5.3 72.2 70.6 73.9 30 41 131 340 14 6 31 49
Bhutan 5 6.0 69.8 69.6 70.0 27 37 210 391 11 9 44 36
India 9 563 7.3 68.3 66.9 69.9 38 53 181 404 13 5 36 46
Iran (Islamic Republic of) 360 4.5 75.7 74.7 76.9 13 17 80 214 6 4 26 65
Maldives 1 3.4 77.0 76.1 78.2 7 11 71 221 5 2 26 67
Nepal 181 6.3 69.9 68.3 71.5 29 40 156 364 12 5 30 53
Pakistan 1 391 7.3 66.3 65.4 67.3 67 87 160 397 32 6 25 38
Sri Lanka 141 6.8 75.1 71.7 78.4 7 10 137 278 2 3 33 61
South-Eastern Asia 4 314 6.8 71.0 68.1 74.0 22 30 166 361 8 4 38 50
Brunei Darussalam 1 3.5 77.0 75.5 78.8 6 8 90 220 3 3 39 54
Cambodia 95 6.1 68.6 66.5 70.6 25 35 175 388 13 9 37 42
Indonesia 1 831 7.1 69.0 67.0 71.2 23 30 177 401 8 5 38 50
Lao People’s Democratic Republic 45 6.8 66.3 64.8 67.8 43 61 197 428 20 8 33 39
Malaysia 8 149 4.9 75.1 73.0 77.5 6 8 125 276 3 3 37 57
Myanmar 425 8.1 66.5 64.1 68.8 43 58 195 425 13 6 37 45
Philippines 660 6.5 69.0 65.7 72.5 21 29 203 416 10 5 42 44
Singapore 27 4.9 82.8 80.7 84.9 2 3 52 135 0 1 24 75
Thailand 531 7.8 75.1 71.4 79.0 10 13 150 281 2 3 36 59

14 World Mortality 2017
Country or area
Annualnumber
of deaths
Crude deathrate
Life expectancy at birth(years)
Infant mortality (deaths
per 1,000 live births)
Under-five
mortality (deaths
per 1,000 live births)
Probability of dying(per 1,000) Percentage of deaths
(thousands) (per 1000)Both sexes Males Females
Ages 15 to 60
Birth to age 70
Under age 5
Ages5 to 25
Ages25 to 65
Age 65 and over
(1) (2) (3) (4) (5) (6) (7) (8) (9) (10) (11) (12) (13)
Timor-Leste 7 5.6 68.6 66.8 70.4 39 56 151 381 31 8 25 36
Viet Nam 543 5.8 76.1 71.3 80.7 18 24 126 273 7 4 34 56
Western Asia 1 350 5.2 73.3 70.7 76.2 21 29 123 285 11 6 30 53
Armenia 28 9.7 74.4 71.1 77.5 12 16 122 300 2 1 26 71
Azerbaijan 9 65 6.8 71.9 68.9 74.9 29 36 129 328 9 2 33 55
Bahrain 3 2.3 76.8 75.9 77.8 6 9 69 221 5 4 42 49
Cyprus 10 8 6.8 80.3 78.2 82.5 4 5 52 153 1 0 15 84
Georgia 11 53 13.3 73.1 68.8 77.3 10 13 154 321 1 1 23 75
Iraq 184 5.1 69.7 67.5 71.9 30 38 162 369 23 7 30 40
Israel 43 5.4 82.3 80.5 84.0 3 4 55 138 1 1 16 82
Jordan 34 3.8 74.2 72.5 75.9 16 20 111 277 13 5 30 52
Kuwait 10 2.7 74.6 73.7 75.8 8 11 80 248 6 4 45 45
Lebanon 26 4.6 79.4 77.8 81.3 9 11 62 172 4 2 20 75
Oman 11 2.6 76.8 75.1 79.3 9 11 98 259 8 6 44 42
Qatar 4 1.5 78.0 77.3 79.7 7 9 62 225 6 8 55 31
Saudi Arabia 111 3.5 74.4 73.1 76.1 12 15 90 271 8 6 35 50
State of Palestine 12 16 3.5 73.3 71.4 75.2 19 24 117 295 20 6 29 44
Syrian Arab Republic 108 5.6 69.9 64.0 76.8 17 21 198 354 8 13 38 42
Turkey 455 5.8 75.5 72.2 78.7 11 19 106 233 5 5 27 64
United Arab Emirates 14 1.6 77.1 76.4 78.6 6 7 75 234 4 6 63 27
Yemen 176 6.5 64.7 63.3 66.2 45 62 222 461 29 11 31 29
EUROPE 8 169 11.0 77.7 74.3 81.1 5 6 117 238 1 1 22 77
Eastern Europe 3 796 13.0 72.8 67.9 77.6 7 9 184 346 1 1 31 68
Belarus 126 13.3 72.7 67.2 78.2 3 5 186 362 0 1 31 68
Bulgaria 108 15.1 74.6 71.2 78.1 8 10 136 293 1 0 20 79
Czechia 111 10.5 78.6 75.6 81.5 2 3 87 215 0 0 19 80
Hungary 124 12.7 75.8 72.2 79.2 5 6 134 293 0 0 24 75
Poland 389 10.2 77.4 73.5 81.3 4 5 117 255 0 1 25 73
Republic of Moldova 13 46 11.4 71.5 67.2 75.8 13 17 168 370 1 1 33 64
Romania 252 12.7 75.3 71.8 78.8 8 10 134 287 1 1 23 76

15World Mortality 2017
Country or area
Annualnumber
of deaths
Crude deathrate
Life expectancy at birth(years)
Infant mortality (deaths
per 1,000 live births)
Under-five
mortality (deaths
per 1,000 live births)
Probability of dying(per 1,000) Percentage of deaths
(thousands) (per 1000)Both sexes Males Females
Ages 15 to 60
Birth to age 70
Under age 5
Ages5 to 25
Ages25 to 65
Age 65 and over
(1) (2) (3) (4) (5) (6) (7) (8) (9) (10) (11) (12) (13)
Russian Federation 1 923 13.4 70.9 65.3 76.5 8 10 219 390 1 1 35 63
Slovakia 53 9.8 76.7 73.1 80.2 5 7 111 254 1 1 25 74
Ukraine 14 662 14.8 71.8 66.8 76.6 8 10 191 369 1 1 28 70
Northern Europe 15 947 9.2 81.0 78.9 83.1 3 4 72 165 1 1 15 84
Channel Islands 16 1 9.0 81.0 79.2 82.7 8 9 52 147 1 0 13 86
Denmark 54 9.4 80.6 78.6 82.5 3 4 71 174 0 0 16 83
Estonia 16 11.8 77.4 72.6 81.7 3 4 120 254 0 1 21 78
Finland 17 53 9.7 81.1 78.3 84.0 2 3 75 166 0 1 16 83
Iceland 2 6.5 82.6 81.1 84.1 2 2 50 131 0 1 15 84
Ireland 30 6.4 81.3 79.3 83.3 3 4 60 150 1 1 17 81
Latvia 29 14.7 74.4 69.4 79.1 6 8 157 321 0 1 23 76
Lithuania 41 13.9 74.5 69.1 79.7 4 5 171 327 0 1 26 73
Norway 18 42 8.0 82.0 80.1 84.0 2 3 58 142 0 1 14 85
Sweden 90 9.3 82.3 80.5 84.1 2 3 54 136 0 1 11 88
United Kingdom 587 9.0 81.4 79.6 83.2 4 5 66 157 1 0 14 85
Southern Europe 19 1 535 10.1 81.6 79.0 84.1 4 5 64 154 0 0 14 86
Albania 21 7.2 78.2 76.2 80.3 14 16 65 184 3 1 18 78
Bosnia and Herzegovina 39 10.9 76.7 74.2 79.2 7 9 97 243 1 1 21 78
Croatia 53 12.6 77.5 74.1 80.7 4 5 95 231 0 0 17 82
Greece 119 10.5 81.0 78.5 83.7 3 4 69 157 0 0 13 86
Italy 619 10.4 82.8 80.5 85.0 3 4 52 130 0 0 11 88
Malta 4 8.8 80.7 79.0 82.3 4 6 55 149 1 0 14 85
Montenegro 6 9.8 76.9 74.5 79.3 3 7 95 232 1 1 21 78
Portugal 110 10.5 81.0 78.0 83.9 2 4 76 161 0 0 14 85
Serbia 20 111 12.6 75.1 72.2 77.9 9 12 114 277 1 1 21 78
Slovenia 20 9.5 80.8 77.9 83.6 2 3 72 173 0 0 18 82
Spain 21 411 8.8 83.0 80.2 85.7 3 4 58 135 0 0 14 86
TFYR Macedonia 22 20 9.7 75.5 73.6 77.6 9 10 98 251 1 1 22 76
Western Europe 23 1 891 9.9 81.5 79.0 84.0 3 4 71 160 0 0 15 84
Austria 82 9.5 81.4 78.9 83.8 3 4 66 161 0 1 15 84
16 World Mortality 2017
Country or area
Annualnumber
of deaths
Crude deathrate
Life expectancy at birth(years)
Infant mortality (deaths
per 1,000 live births)
Under-five
mortality (deaths
per 1,000 live births)
Probability of dying(per 1,000) Percentage of deaths
(thousands) (per 1000)Both sexes Males Females
Ages 15 to 60
Birth to age 70
Under age 5
Ages5 to 25
Ages25 to 65
Age 65 and over
(1) (2) (3) (4) (5) (6) (7) (8) (9) (10) (11) (12) (13)
Belgium 111 9.8 81.0 78.5 83.3 3 4 74 172 0 1 15 84
France 573 8.9 82.4 79.4 85.3 3 4 77 160 1 1 17 82
Germany 910 11.1 80.8 78.4 83.2 3 4 71 170 0 0 14 85
Luxembourg 4 7.3 81.6 79.4 83.8 3 4 63 156 1 1 18 81
Netherlands 143 8.5 81.7 79.9 83.5 3 4 58 145 0 0 15 84
Switzerland 67 8.0 83.1 81.1 85.1 4 4 50 127 1 0 13 86
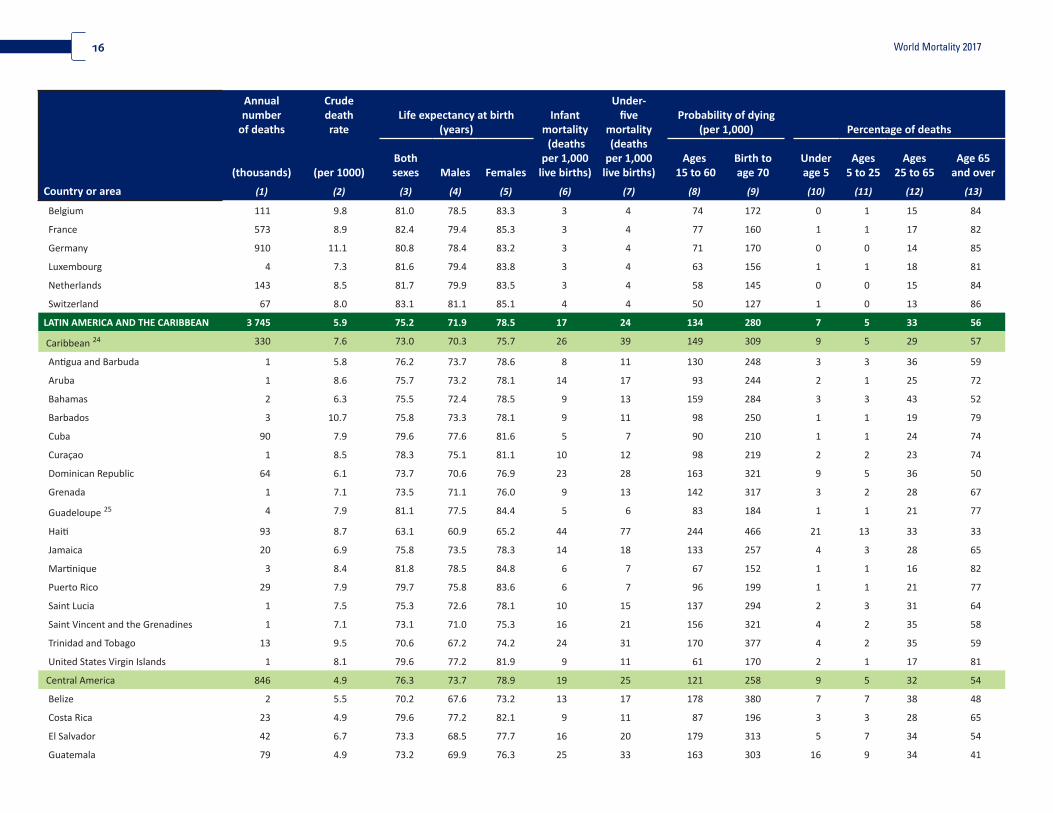
LATIN AMERICA AND THE CARIBBEAN 3 745 5.9 75.2 71.9 78.5 17 24 134 280 7 5 33 56
Caribbean 24 330 7.6 73.0 70.3 75.7 26 39 149 309 9 5 29 57
Antigua and Barbuda 1 5.8 76.2 73.7 78.6 8 11 130 248 3 3 36 59
Aruba 1 8.6 75.7 73.2 78.1 14 17 93 244 2 1 25 72
Bahamas 2 6.3 75.5 72.4 78.5 9 13 159 284 3 3 43 52
Barbados 3 10.7 75.8 73.3 78.1 9 11 98 250 1 1 19 79
Cuba 90 7.9 79.6 77.6 81.6 5 7 90 210 1 1 24 74
Curaçao 1 8.5 78.3 75.1 81.1 10 12 98 219 2 2 23 74
Dominican Republic 64 6.1 73.7 70.6 76.9 23 28 163 321 9 5 36 50
Grenada 1 7.1 73.5 71.1 76.0 9 13 142 317 3 2 28 67
Guadeloupe 25 4 7.9 81.1 77.5 84.4 5 6 83 184 1 1 21 77
Haiti 93 8.7 63.1 60.9 65.2 44 77 244 466 21 13 33 33
Jamaica 20 6.9 75.8 73.5 78.3 14 18 133 257 4 3 28 65
Martinique 3 8.4 81.8 78.5 84.8 6 7 67 152 1 1 16 82
Puerto Rico 29 7.9 79.7 75.8 83.6 6 7 96 199 1 1 21 77
Saint Lucia 1 7.5 75.3 72.6 78.1 10 15 137 294 2 3 31 64
Saint Vincent and the Grenadines 1 7.1 73.1 71.0 75.3 16 21 156 321 4 2 35 58
Trinidad and Tobago 13 9.5 70.6 67.2 74.2 24 31 170 377 4 2 35 59
United States Virgin Islands 1 8.1 79.6 77.2 81.9 9 11 61 170 2 1 17 81
Central America 846 4.9 76.3 73.7 78.9 19 25 121 258 9 5 32 54
Belize 2 5.5 70.2 67.6 73.2 13 17 178 380 7 7 38 48
Costa Rica 23 4.9 79.6 77.2 82.1 9 11 87 196 3 3 28 65
El Salvador 42 6.7 73.3 68.5 77.7 16 20 179 313 5 7 34 54
Guatemala 79 4.9 73.2 69.9 76.3 25 33 163 303 16 9 34 41
17World Mortality 2017
Country or area
Annualnumber
of deaths
Crude deathrate
Life expectancy at birth(years)
Infant mortality (deaths
per 1,000 live births)
Under-five
mortality (deaths
per 1,000 live births)
Probability of dying(per 1,000) Percentage of deaths
(thousands) (per 1000)Both sexes Males Females
Ages 15 to 60
Birth to age 70
Under age 5
Ages5 to 25
Ages25 to 65
Age 65 and over
(1) (2) (3) (4) (5) (6) (7) (8) (9) (10) (11) (12) (13)
Honduras 43 4.8 73.4 70.8 75.9 26 40 147 297 18 9 34 40
Mexico 607 4.8 76.9 74.5 79.4 18 23 112 248 8 4 32 56
Nicaragua 29 4.8 75.1 72.1 78.1 18 24 148 288 9 7 38 46
Panama 20 5.0 77.8 74.9 80.9 14 20 116 238 7 6 32 55
South America 26 2 570 6.2 75.1 71.5 78.6 16 22 138 285 5 4 34 57
Argentina 329 7.6 76.4 72.6 80.2 13 16 114 259 3 2 24 71
Bolivia (Plurinational State of) 79 7.4 68.8 66.3 71.3 39 72 186 382 21 9 30 40
Brazil 1 254 6.1 75.3 71.6 78.9 14 18 145 288 4 4 37 54
Chile 108 6.1 79.3 76.7 81.7 7 9 90 211 2 2 27 70
Colombia 286 5.9 74.2 70.7 77.8 17 25 141 289 6 6 36 52
Ecuador 83 5.1 76.1 73.4 78.9 20 25 125 246 10 6 31 53
French Guiana 1 3.1 79.7 76.7 83.0 9 11 60 171 9 3 27 62
Guyana 6 8.2 66.5 64.3 68.9 32 41 211 449 10 6 38 46
Paraguay 38 5.7 73.0 70.9 75.2 28 35 146 308 13 7 32 49
Peru 177 5.6 74.7 72.1 77.4 17 29 125 277 9 5 31 56
Suriname 4 7.3 71.3 68.2 74.6 16 23 172 363 6 3 37 54
Uruguay 32 9.4 77.3 73.7 80.8 12 15 106 248 2 1 19 77
Venezuela (Bolivarian Republic of) 173 5.6 74.4 70.4 78.6 13 16 144 305 5 7 36 52
NORTHERN AMERICA 27 2 916 8.2 79.5 77.2 81.8 6 7 99 204 1 1 23 75
Canada 267 7.4 82.2 80.2 84.1 4 5 62 148 1 1 17 81
United States of America 2 649 8.3 79.2 76.9 81.6 6 7 103 211 1 1 23 75
OCEANIA 265 6.7 78.4 76.2 80.6 20 26 91 205 6 2 21 70
Australia/New Zealand 190 6.7 82.6 80.6 84.5 4 5 58 133 1 1 16 83
Australia 28 158 6.7 82.7 80.7 84.7 4 5 56 131 1 1 15 83
New Zealand 32 6.9 81.7 80.0 83.4 4 5 64 147 1 1 17 81
Melanesia 69 6.9 66.5 64.1 69.1 42 57 211 451 21 6 37 36
Fiji 6 7.0 70.1 67.3 73.3 15 20 188 401 5 3 43 49
New Caledonia 2 6.8 76.8 74.2 79.7 12 15 83 224 3 2 22 73
Papua New Guinea 57 7.1 65.4 63.0 67.9 47 63 227 477 24 7 37 33
Solomon Islands 3 4.9 70.4 69.0 72.0 27 36 149 354 20 6 30 43
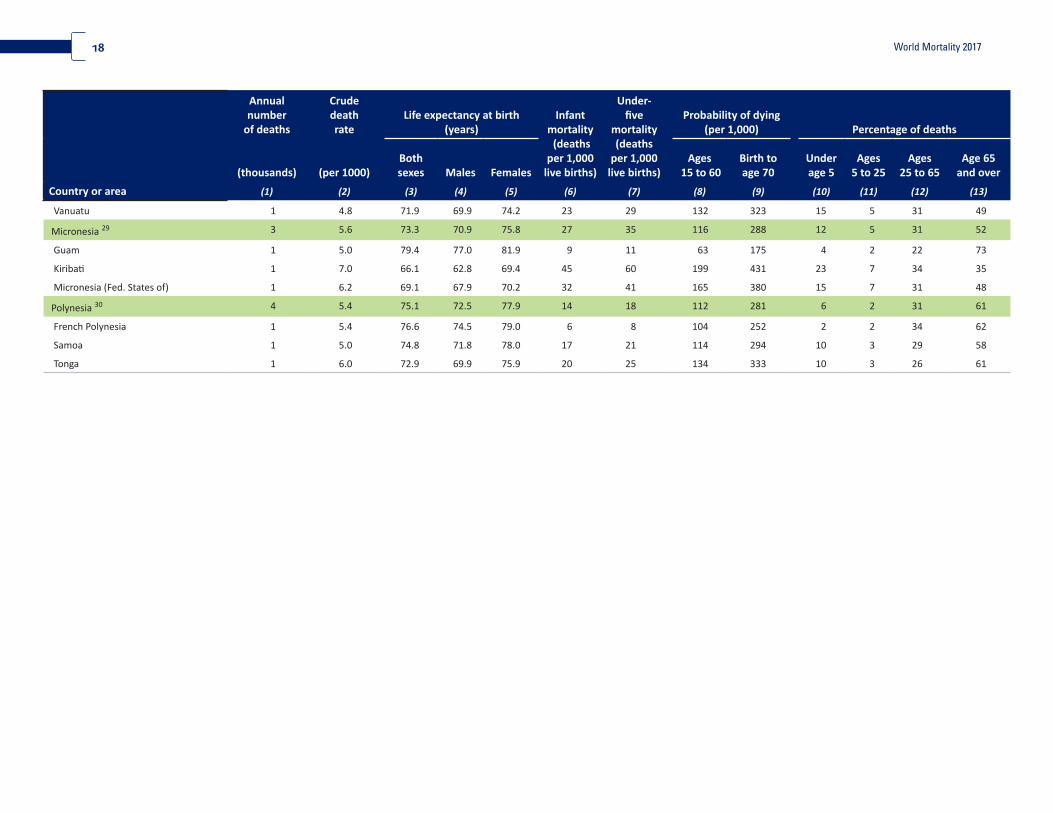
18 World Mortality 2017
Country or area
Annualnumber
of deaths
Crude deathrate
Life expectancy at birth(years)
Infant mortality (deaths
per 1,000 live births)
Under-five
mortality (deaths
per 1,000 live births)
Probability of dying(per 1,000) Percentage of deaths
(thousands) (per 1000)Both sexes Males Females
Ages 15 to 60
Birth to age 70
Under age 5
Ages5 to 25
Ages25 to 65
Age 65 and over
(1) (2) (3) (4) (5) (6) (7) (8) (9) (10) (11) (12) (13)
Vanuatu 1 4.8 71.9 69.9 74.2 23 29 132 323 15 5 31 49
Micronesia 29 3 5.6 73.3 70.9 75.8 27 35 116 288 12 5 31 52
Guam 1 5.0 79.4 77.0 81.9 9 11 63 175 4 2 22 73
Kiribati 1 7.0 66.1 62.8 69.4 45 60 199 431 23 7 34 35
Micronesia (Fed. States of) 1 6.2 69.1 67.9 70.2 32 41 165 380 15 7 31 48
Polynesia 30 4 5.4 75.1 72.5 77.9 14 18 112 281 6 2 31 61
French Polynesia 1 5.4 76.6 74.5 79.0 6 8 104 252 2 2 34 62
Samoa 1 5.0 74.8 71.8 78.0 17 21 114 294 10 3 29 58
Tonga 1 6.0 72.9 69.9 75.9 20 25 134 333 10 3 26 61
19World Mortality 2017
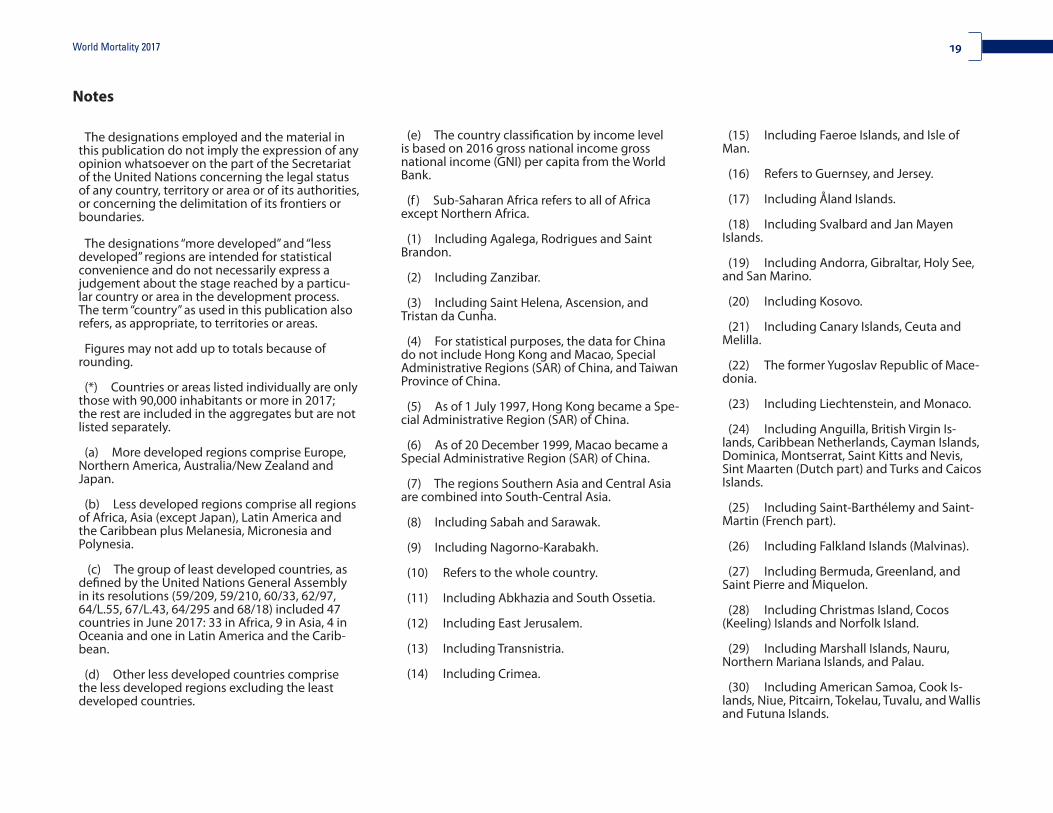
Notes
The designations employed and the material in this publication do not imply the expression of any opinion whatsoever on the part of the Secretariat of the United Nations concerning the legal status of any country, territory or area or of its authorities, or concerning the delimitation of its frontiers or boundaries.
The designations “more developed” and “less developed” regions are intended for statistical convenience and do not necessarily express a judgement about the stage reached by a particu-lar country or area in the development process. The term “country” as used in this publication also refers, as appropriate, to territories or areas.
Figures may not add up to totals because of rounding.
(*) Countries or areas listed individually are only those with 90,000 inhabitants or more in 2017; the rest are included in the aggregates but are not listed separately.
(a) More developed regions comprise Europe, Northern America, Australia/New Zealand and Japan.
(b) Less developed regions comprise all regions of Africa, Asia (except Japan), Latin America and the Caribbean plus Melanesia, Micronesia and Polynesia.
(c) The group of least developed countries, as defined by the United Nations General Assembly in its resolutions (59/209, 59/210, 60/33, 62/97, 64/L.55, 67/L.43, 64/295 and 68/18) included 47 countries in June 2017: 33 in Africa, 9 in Asia, 4 in Oceania and one in Latin America and the Carib-bean.
(d) Other less developed countries comprise the less developed regions excluding the least developed countries.
(e) The country classification by income level is based on 2016 gross national income gross national income (GNI) per capita from the World Bank.
(f ) Sub-Saharan Africa refers to all of Africa except Northern Africa.
(1) Including Agalega, Rodrigues and Saint Brandon.
(2) Including Zanzibar.
(3) Including Saint Helena, Ascension, and Tristan da Cunha.
(4) For statistical purposes, the data for China do not include Hong Kong and Macao, Special Administrative Regions (SAR) of China, and Taiwan Province of China.
(5) As of 1 July 1997, Hong Kong became a Spe-cial Administrative Region (SAR) of China.
(6) As of 20 December 1999, Macao became a Special Administrative Region (SAR) of China.
(7) The regions Southern Asia and Central Asia are combined into South-Central Asia.
(8) Including Sabah and Sarawak.
(9) Including Nagorno-Karabakh.
(10) Refers to the whole country.
(11) Including Abkhazia and South Ossetia.
(12) Including East Jerusalem.
(13) Including Transnistria.
(14) Including Crimea.
(15) Including Faeroe Islands, and Isle of Man.
(16) Refers to Guernsey, and Jersey.
(17) Including Åland Islands.
(18) Including Svalbard and Jan Mayen Islands.
(19) Including Andorra, Gibraltar, Holy See, and San Marino.
(20) Including Kosovo.
(21) Including Canary Islands, Ceuta and Melilla.
(22) The former Yugoslav Republic of Mace-donia.
(23) Including Liechtenstein, and Monaco.
(24) Including Anguilla, British Virgin Is-lands, Caribbean Netherlands, Cayman Islands, Dominica, Montserrat, Saint Kitts and Nevis, Sint Maarten (Dutch part) and Turks and Caicos Islands.
(25) Including Saint-Barthélemy and Saint-Martin (French part).
(26) Including Falkland Islands (Malvinas).
(27) Including Bermuda, Greenland, and Saint Pierre and Miquelon.
(28) Including Christmas Island, Cocos (Keeling) Islands and Norfolk Island.
(29) Including Marshall Islands, Nauru, Northern Mariana Islands, and Palau.
(30) Including American Samoa, Cook Is-lands, Niue, Pitcairn, Tokelau, Tuvalu, and Wallis and Futuna Islands.
20 World Mortality 2017
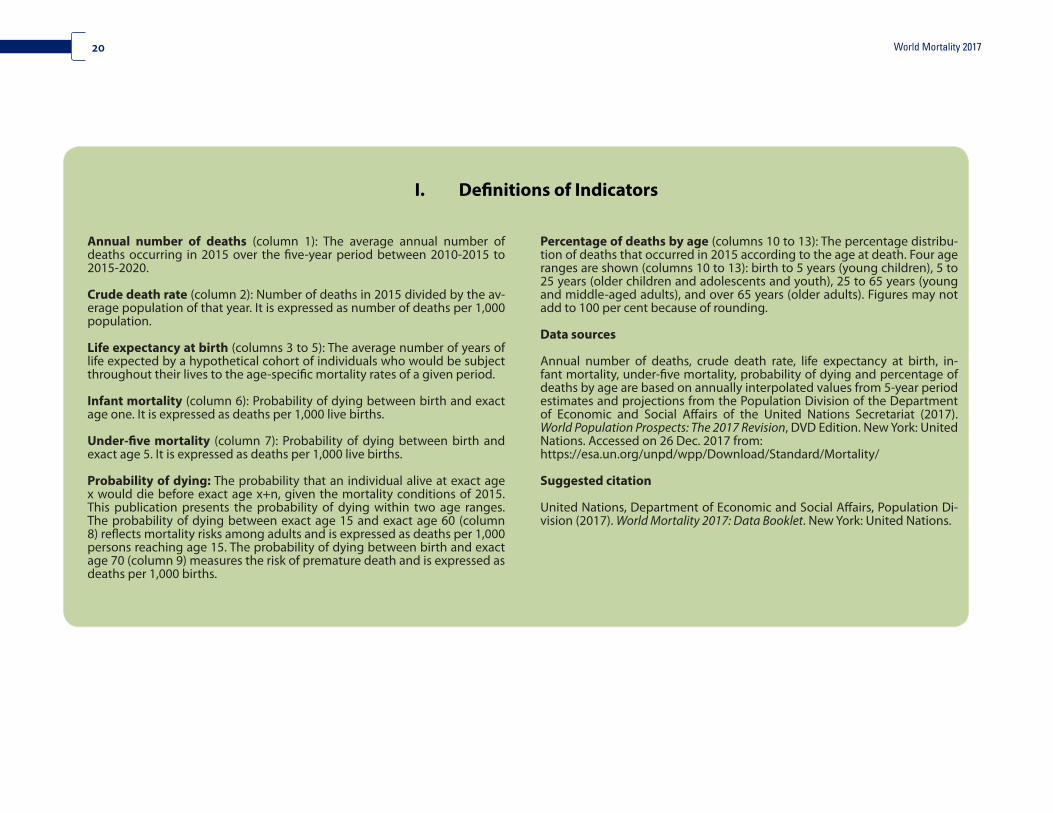
I. Definitions of Indicators
Percentage of deaths by age (columns 10 to 13): The percentage distribu-tion of deaths that occurred in 2015 according to the age at death. Four age ranges are shown (columns 10 to 13): birth to 5 years (young children), 5 to 25 years (older children and adolescents and youth), 25 to 65 years (young and middle-aged adults), and over 65 years (older adults). Figures may not add to 100 per cent because of rounding.
Data sources
Annual number of deaths, crude death rate, life expectancy at birth, in-fant mortality, under-five mortality, probability of dying and percentage of deaths by age are based on annually interpolated values from 5-year period estimates and projections from the Population Division of the Department of Economic and Social Affairs of the United Nations Secretariat (2017). World Population Prospects: The 2017 Revision, DVD Edition. New York: United Nations. Accessed on 26 Dec. 2017 from: https://esa.un.org/unpd/wpp/Download/Standard/Mortality/
Suggested citation
United Nations, Department of Economic and Social Affairs, Population Di-vision (2017). World Mortality 2017: Data Booklet. New York: United Nations.
Annual number of deaths (column 1): The average annual number of deaths occurring in 2015 over the five-year period between 2010-2015 to 2015-2020.
Crude death rate (column 2): Number of deaths in 2015 divided by the av-erage population of that year. It is expressed as number of deaths per 1,000 population.
Life expectancy at birth (columns 3 to 5): The average number of years of life expected by a hypothetical cohort of individuals who would be subject throughout their lives to the age-specific mortality rates of a given period.
Infant mortality (column 6): Probability of dying between birth and exact age one. It is expressed as deaths per 1,000 live births.
Under-five mortality (column 7): Probability of dying between birth and exact age 5. It is expressed as deaths per 1,000 live births.
Probability of dying: The probability that an individual alive at exact age x would die before exact age x+n, given the mortality conditions of 2015. This publication presents the probability of dying within two age ranges. The probability of dying between exact age 15 and exact age 60 (column 8) reflects mortality risks among adults and is expressed as deaths per 1,000 persons reaching age 15. The probability of dying between birth and exact age 70 (column 9) measures the risk of premature death and is expressed as deaths per 1,000 births.


![Basic Emergency Obstetric and Newborn Care (BEMONC) ob part [Compatibility Mode].pdf · Outline Emergency Obstetric and Newborn Care (EmONC) as a strategy in maternal mortality reduction](https://img.pdfslide.us/doc/110x75/5a73d29f7f8b9ad22a8b90e9/basic-emergency-obstetric-and-newborn-care-bemonc-ob-part-compatibility-modepdfaa.jpg)