Embed Size (px)
Citation preview

2006–2010
World Mineral Production


BRITISH GEOLOGICAL SURVEY
WORLD MINERAL PRODUCTION 2006–10
Authors: T J Brown, A S Walters, N E Idoine, R A Shaw, C E Wrighton, T Bide
Technical support: A C MacKenzie
Keyworth, Nottingham British Geological Survey 2012

ii
© NERC 2012 all rights reserved First Published 2012
BRITISH GEOLOGICAL SURVEY
Keyworth, Nottingham NG12 5GG 0115-936 3100
Murchison House, West Mains Road, Edinburgh EH9 3LA 0131-667 1000
London Information Office, Natural History Museum (Earth Galleries), Exhibition Road, London SW7 2DE 020-7589 4090 The full range of Survey publications is available from the BGS Sales Desks at Nottingham, Edinburgh and London; see contact details above or shop online at www.geologyshop.com
The London Information Office also maintains a reference collection of BGS publications, including maps, for consultation.
The Survey publishes an annual catalogue of its maps and other publications; this catalogue is available from any of the BGS Sales Desks.
The British Geological Survey carries out the geological survey of Great Britain and Northern Ireland (the latter as an agency service for the government of Northern Ireland), and of the surrounding continental shelf, as well as its basic research projects. It also undertakes programmes of British technical aid in geology in developing countries as arranged by the Department for International Development.
The British Geological Survey is a component body of the Natural Environment Research Council.
All communications regarding the content of this publication should be addressed to the Head of Science, Economic Minerals, British Geological Survey, Keyworth, Nottingham NG12 5GG 0115-936 3495 Fax 0115 936 3520 E-mail [email protected]
The compilations presented in this book are copyright and may not be reproduced in any form without the permission of the Director, British Geological Survey.
Bibliographical reference BRITISH GEOLOGICAL SURVEY. 2012. World mineral production 2006-10. (Keyworth, Nottingham: British Geological Survey.)
Cover photograph: Fusion machine at Talison Lithium’s laboratory, Greenbushes, Western Australia. Image © Talison Lithium Ltd ISBN 978-0-85272-696-9 (print version)
ISBN 978-0-85272-697-6 (website version)

iii
PREFACE
This volume is the latest in the series World Mineral Production, published by the British Geological Survey. It comprises the most recent addition to a continuous dataset on global mineral production which stretches back to 1913, which includes the preceding titles World Mineral Statistics and Statistical Summary of the Minerals Industry. This publication is compiled from a comprehensive database, maintained by the British Geological Survey, through which we aim to provide a reliable, comprehensive and continuous set of data covering most of the minerals that enter international trade. In this volume we have set out the production figures by country for more than 70 mineral commodities, over the five-year period from 2006 to 2010. The objective of this series remains to present the latest production information obtained from official bodies in individual countries, although other sources are also used to ensure completeness and accuracy. The cooperation afforded to the British Geological Survey by numerous national and international organisations is gratefully acknowledged. The reported statistics for 2010 reveal a mixed picture, with many commodities showing a clear recovery from the global recession while others do not. For example the world’s production of potash, lithium and bromine in 2010 was similar to the output levels from 2008 despite sharp falls in 2009. In contrast global production of bismuth, bentonite and graphite fell by a further five per cent each in 2010 compared to 2009, in addition to reductions of 20 per cent, nine per cent and eight per cent respectively in the previous year. For other commodities production increases in 2010 are much greater than the corresponding falls in output in 2009 resulting in overall production levels that are significantly higher than 2008. For example, the world’s production of chromium ores and manganese ores rose by 28 per cent and 26 per cent respectively, more than reversing the falls of one per cent and 11 per cent experienced in 2009. The security of supply of many minerals remained a concern during the year. The European Union issued an update to their
Raw Materials Initiative in February 2011 which attempts to move from identifying the critical minerals to proposing a series of actions intended to address the identified supply issues. In May 2011, the United Kingdom Government’s Science & Technology Committee published its report into Strategically Important Metals and concluded that although these metals are unlikely to run out over the coming decades there remain geopolitical risks surrounding the availability of supplies which may affect UK businesses. In December 2011 the United States’ Department of Energy updated their Critical Materials Strategy which identifies the risk of supply disruption for certain materials used in clean energy technologies. The interest generated by these documents has created many opportunities for new research, collaboration between agencies and co-ordination networks to underpin strategies to improve security of supply. These strategies are based on three main themes: the diversification of supply sources; substitution and improvements in resource efficiency; and recycling. The availability of data, such as provided by this volume, is a vital part of this ongoing work. In an attempt to improve data coverage for some of the rarer metals, which are so important for the latest technologies, this volume includes, for the first time, production data relating to indium and rhenium. We have also added some information relating to gallium. Accurate data for these metals are difficult to obtain and as a consequence many figures are estimated. We intend to seek opportunities to improve the accuracy of these data in future years. In addition to our regular publications, we are continuing to add to our Mineral Profile series with the addition of Tungsten and Tantalum and Niobium in 2011, together with updates to Fluorspar and Rare Earth Elements. I would welcome any criticisms and suggestions that might help us to meet your changing needs, particularly with respect to the coverage of statistics and the format in which they are made available. John N Ludden Executive Director British Geological Survey Keyworth Nottingham January 2012

iv
CONTENTS
Commodity Index
Alumina 3 Manganese 46 Aluminium 4 Mercury 47 Antimony 5 Mica 48 Arsenic 5 Molybdenum 49 Asbestos 6 Natural gas 55 Barytes 7 Natural sodium carbonate 65 Bauxite 2 Nepheline syenite 49 Bentonite 8 Nickel 50 Beryl 10 Niobium 69 Bismuth 11 Perlite 52 Borates 11 Petroleum 53 Bromine 12 Phosphates 57 Cadmium 12 Platinum 58 Chromium 13 Potash 59 Coal 14 Pyrites 66 Cobalt 17 Rare earths 59 Copper 19 Rhenium 60 Diamond 22 Salt 60 Diatomite 23 Selenium 63 Feldspar 23 Silicon 37 Ferro alloys 37 Sillimanite 63 Fluorspar 25 Silver 64 Fuller’s earth 8 Strontium 65 Gallium 26 Sulphur 66 Germanium 26 Talc 68 Gold 27 Tantalum 69 Graphite 29 Tellurium 70 Gypsum 30 Tin 70 Indium 32 Titanium 71 Iodine 32 Tungsten 73 Iron ore 33 Uranium 74 Iron and steel 34 Vanadium 74 Kaolin 40 Vermiculite 75 Lead 42 Wollastonite 75 Lithium 44 Zinc 76 Magnesite 45 Zirconium 78 Magnesium 45
EXPLANATORY NOTES
Coverage
World Mineral Production covers the majority of economically important mineral commodities. For each commodity constant efforts are made to ensure that as many producing countries as possible are reported. For some commodities, where statistics on production are not publicly available, estimates are made. Users of this compilation are advised that more statistical information than can be included in a publication of this nature is held in the British Geological Survey files and is available for consultation. Historical data (1913-1970) can be obtained from the predecessors to this series entitled World Mineral Statistics and the Statistical Summary of the Mineral Industry. Many copies of these publications are available in the World Archive section of the website: www.mineralsUK.com.
Arrangement of countries
Countries are ordered alphabetically in geographical groupings as follows:
Europe Africa North and Central America, including the Caribbean South America Asia Australasia, including the Pacific Islands
So far as possible the nomenclature follows the London Diplomatic List.
Metals
Mine production of many metals is expressed in terms of metal content. This is clearly indicated at the head of the table, adjacent to the unit used. For aluminium, cobalt, copper, iron, lead, nickel, tin and zinc, mine production and metal production are shown in separate tables. Unless otherwise specified, metal production statistics relate to metal recovered from both domestic and imported materials, whether primary or secondary, but exclude remelted material.
World totals
For certain minerals and metals no world total is shown due to the non-availability of certain individual country totals.
Exclusion of Warranty
Use by recipients of information provided by the BGS, is at the recipients' own risk. BGS has taken care to ensure that information provided is as free from error as is reasonably practical. In view of the disparate sources of information at BGS's disposal, including such material donated to BGS, that BGS accepts in good faith as being accurate, the Natural Environment Research Council (NERC) gives no warranty, expressed or implied, as to the quality, accuracy, performance, and merchantability of the information supplied, or to the information's suitability for any use whether made known to BGS or otherwise. NERC/BGS accepts no liability whatever in respect of loss, damage, injury or other occurrence however caused.
Acknowledgements
Compilation of this volume of mineral statistics has been possible only by obtaining information from a very large number of organisations throughout the world, chiefly home and overseas government departments and specialist national or international authorities concerned with particular sectors of the minerals or metals industries. To all these bodies the

v
British Geological Survey expresses its grateful acknowledgement for the information made available, whether in published form or provided by direct correspondence. Particular acknowledgement is made to the Mines Departments and other government agencies of many countries whose regular statements, yearbooks and other reports are worthy of direct consultations by readers in search of detail.
Specialist commodity organisations which have kindly allowed information to be reproduced include the International Copper Study Group, the International Lead and Zinc Study Group, the International Nickel Study Group, the Barytes Association and the International Fertilizer Industry Association Ltd. In a few instances, information on specific commodities has been obtained directly from company sources. The co-operation of other members of the International Consultative Group on Non-Ferrous Metal Statistics is also gratefully acknowledged.
Supplementary information is also obtained from publications dealing with a wider range of commodities such as Société de l'Industrie Minérale, Annuaire Statistique Mondial des Minerais et Métaux; World Bureau of Metal Statistics, World Metal Statistics and, Metallstatistik; publications of the Interstate Statistical Committee of the CIS, the United States Geological Survey, and UN agencies.
In addition, information has been obtained from the websites of the following organisations, companies, statistical offices and government departments: United Nations; Kaolin & Plastic Clays Europe; International Iron and Steel Institute; Kimberley Process; Eurofer; World Nuclear Association; Organisation of the Petroleum Exporting Countries; Eurostat; European Aggregates Association; Instituto Latinoamericano del Fierro y el Acero; RNC Gold; Glencairn Gold; Glamis Gold; Goldcorp; Break Water Resources; Inmet Mining; Stillwater Mining; Aluminium de Greece; New Boliden; Eurozinc Mining Corporation; Norilsk Nickel; Qatar Steel Company; Iamgold Corp, Lundin Mining; Norlisk Nickel; Xstrata; Anglo American; Rio Tinto; Aura Minerals Inc; Breakwater Resources; Institute of Argentinean Petroleum and Gas, Argentina; Institute of Argentinean Steel, Argentina; Acero Argentinos; Northern Territory Government, Australia; Department of Primary Industries Victoria, Australia; Mineral Resources Tasmania, Australia; Australian Bureau of Agricultural & Resource Economics; Vereinigung der Osterreichishen Zementindustrie, Austria; Energy Bangla, Bangladesh; Petrobangla, Bangladesh; Central Bank of Barbados; Federation de l'Industrie Cimentiere Belge, Belgium; Statistics Belgium; Instituto Nacional de Estatistica Boliva; Cámara Boliviana de Hidrocarburos, Bolivia; Ministry of Mining and Metallurgy, Bolivia; Republika Srpska Institute of Statistics, Bosnia & Herzegovina; Departamento Nacional De Producao Mineral, Brazil; Grupo Paranapanema, Brazil; Agencia Nacional do Petroleo, Brazil; Associação Brasileira do Alumínio, Brazil; Ministerio de Minas y Energia, Brazil; Sindicato da Indústria Carbonífera de Santa Catarina, Brazil; Natural Resources Canada; Statistics Canada; Canadian Association of Petroleum Producers; Mineral Resources of Quebec, Canada; Chilean Copper Commission; National Service for Geology and Mining, Chile; China Mining Association; National Bureau of Statistics, China; Ministerio De Minas Y Energia, Columbia; Unidad de Planeación Minero Energética, Columbia; Central National de la Statistique et des Etudes, Economiques, Republic of Congo; Oficina Nacional de Estadisticas, Cuba; Czech Republic Statistical Office; Statistics Denmark; Danish Energy Agency, Denmark; Banco Central de la Republica Dominicana,
Dominican Republic, Banco Central del Ecuador; Geological Survey of Finland; Federation des Minerais, Mineraux Industrielles et Metaux non Ferreux, France; Comite Professionel de Petrole, France; Ministere de l'Economie, des Finances et de l'Industrie, France; Unicem, France; Infociments, France; Statistisches Bundesamt Deutschland, Germany; National Statistical Service of Greece; National Bank of Guyana; Ministerio de Energia y Minas, Guatemala; Federacciai, Italy; Unione Petrolifera, Italy; Istituto Nazionale di Statistica, Italy; Salt Industry Centre, Japan; Statistics Agency of Kazkhstan; Korea Institute of Geoscience and Mineral Resources, Republic of Korea; Statistical Office of Kosovo; Statec, Luxembourg; Bank Negara Malaysia; Pemex, Mexico; Secteria de Economia, Mexico; Servicio Geologico de Mexico; Mineral Resources & Petroleum Authority of Mongolia; Statistics Office of Montenegro; Bank al Maghrib, Morocco; Ministry of Mines, Morocco; Ministry of Mines and Energy, Namibia; Centraal Bureau voor de Statistiek, Netherlands; Staatstoezicht op de Mijnen, Netherlands; Ministry of Economic Development, New Zealand; Central Bank, Nicaragua; National Burea of Statistics, Nigeria; Statistisk Sentralbyra, Norway; Geological Survey of Norway; Ministry of National Economy, Oman; Direccion de Estadistica y Censo, Panama; Chamber of Mines and Petroleum, Papua New Guinea; PeruPetro; Ministerio de Energia y Minas, Peru; Sociedad Nacional de Mineria Petroleo y Energia, Peru; Mines and Geosciences Bureau, Philippines; Instituto Nacional de Estatistica, Portugal; National Bank of Rwanda; Agence Nationale de la Statistique et de la Démographie, Senegal; Statistical Office of the Republic of Serbia; Central Bank of Sierra Leone; Statistical Office of the Republic of Slovenia; Unesid, Spain; Staatsolie Maatschappij, Suriname; Sveriges Geologiska Undersokning, Sweden; Jernkontoret, Sweden; Statistiska Centralbyran, Sweden; Bank of Thailand; Central Bank of Trinidad and Tobago; Department of Business, Innovation and Skills, United Kingdom; Office for National Statistics, United Kingdom; Energy Information Administration, United States of America; Direccion Nacional de Minería y Geología, Uruguay; General Statistics Office, Vietnam; Central Statistical Organisation, Republic of Yemen.
Units
The Statistics shown in this volume are expressed in metric units. The following factors are given for converting to non-metric units:
tonnes × 0.9842 = long tons tonnes × 1.1023 = short tons kilograms × 2.2046 = pounds kilograms × 32.1507 = troy ounces cubic metres × 35.3147 = cubic feet 1 tonne of crude petroleum equals on average 7 barrels of crude petroleum. 1 flask mercury = 34.5 kilograms 1 metric ton unit = 10 kilograms
Symbols
... figures not available 0 quantity less than half unit shown — nil * estimated BGS British Geological Survey


STATISTICAL INFORMATION

2
Production of bauxite tonnes (metric)
Country 2006 2007 2008 2009 2010 Bosnia & Herzegovina 854 047 866 933 1 018 333 555 820 827 909 France 160 000 160 000 — — — Greece 2 162 900 2 125 900 2 174 000 1 935 000 1 902 000 Hungary 538 258 546 310 511 337 317 000 365 000 Montenegro 659 370 667 053 671 811 45 779 61 205 Russia 6 399 200 6 053 900 5 675 000 5 300 000 5 000 000 Turkey 771 227 863 404 818 928 406 700 855 000 Ghana 841 775 1 033 368 796 000 440 000 512 208 Guinea 18 783 928 18 519 010 17 682 330 14 774 240 16 427 300 Mozambique 11 069 8 650 5 443 3 600 * 3 600 Sierra Leone 1 071 140 1 169 036 954 370 742 820 1 089 131 Tanzania 5 373 5 003 20 601 122 920 * 130 000 Jamaica 14 865 351 14 567 738 14 636 102 7 817 500 8 539 853 Mexico ... ... ... 20 000 21 250 USA (a) 361 047 141 914 98 796 30 240 59 143 Brazil (b) 23 236 300 25 460 700 28 097 500 26 074 400 32 028 000 Guyana 1 478 670 2 242 928 2 092 237 1 484 935 1 082 512 Suriname 4 945 353 5 273 195 5 333 031 3 388 419 3 096 650 Venezuela 5 928 000 5 593 308 4 192 014 3 610 859 3 126 242 China 18 981 600 20 446 000 25 176 900 29 213 100 * 30 000 000 India (c) 15 732 535 22 624 960 15 460 202 13 952 002 * 12 064 000 Indonesia * 9 000 000 * 16 000 000 * 18 000 000 * 15 000 000 * 27 000 000 Iran (d) * 500 000 520 800 * 520 000 522 018 * 525 000 Iraq — — 4 928 250 3 350 Kazakhstan 4 883 800 4 962 600 5 160 100 5 131 000 5 310 200 Malaysia 91 806 156 785 295 176 263 432 124 274 Pakistan (e) 7 831 18 082 35 635 13 618 9 031 Vietnam * 60 000 * 80 000 * 80 000 * 80 000 * 80 000 Australia 61 781 000 62 428 000 64 038 000 66 168 000 68 535 000 World Total 194 000 000 213 000 000 214 000 000 197 000 000 219 000 000
Note(s) (1) This table includes production of refractory bauxite (a) Data for Alabama only (b) Including beneficiated and direct shipping ore (c) Years ended 31 March following that stated (d) Years ended 20 March following that stated (e) Years ended 30 June of that stated

3
Production of alumina tonnes (Al2O3 content)
Country 2006 2007 2008 2009 2010
Azerbaijan 362 665 184 500 164 879 9 590 — Bosnia & Herzegovina 393 580 303 799 294 455 191 792 269 414 France * 636 000 * 600 000 630 000 348 000 481 000 Germany * 850 000 * 900 000 * 1 000 000 1 154 000 * 1 000 000 Greece 780 000 788 900 807 500 796 000 785 000 Hungary * 301 000 * 301 000 * 299 000 * 185 000 214 000 Ireland, Republic of 1 800 000 1 800 000 1 890 000 1 240 000 1 864 000 Italy 1 090 000 1 327 000 1 045 000 92 000 — Montenegro 236 740 240 186 220 426 58 528 — Romania 622 083 22 830 344 44 000 414 000 Russia 3 265 216 3 332 308 3 112 000 2 794 000 2 857 000 Spain * 1 400 000 1 300 000 1 300 000 1 300 000 * 1 300 000 Turkey 150 117 163 435 * 150 000 * 80 000 * 150 000 Ukraine 1 671 620 1 655 718 1 673 000 1 524 000 1 534 000 Guinea 529 200 542 100 593 000 530 000 597 000 Canada 1 476 959 1 454 390 1 491 523 1 232 604 1 416 600 Jamaica 4 099 548 3 940 589 3 995 358 1 773 600 1 590 658 USA 4 696 000 4 236 000 4 298 000 3 064 000 3 950 000 Brazil 6 735 000 7 077 600 7 822 300 8 708 800 9 431 000 Suriname 2 151 148 2 178 472 2 153 968 1 536 187 1 486 449 Venezuela 1 920 000 1 751 000 1 591 000 1 376 000 1 244 000 China 13 256 900 19 453 000 23 029 200 23 792 900 28 939 000 India 3 077 000 3 208 000 * 3 600 000 * 3 600 000 * 3 600 000 Iran (a) 167 783 220 000 * 220 000 * 200 000 * 300 000 Japan * 780 000 * 650 000 * 600 000 * 550 000 * 550 000 Kazakhstan 1 514 509 1 544 462 1 607 829 1 608 000 1 639 000 Australia 18 312 000 18 844 000 19 446 000 19 939 000 19 957 000 World Total 72 300 000 78 000 000 83 000 000 77 700 000 85 600 000
Note(s) (1) Where possible figures in this table show the alumina equivalent (Al2O3) of total hydrate produced, whether or not calcined (a) Years ended 20 March following that stated

4
Production of primary aluminium tonnes (metric)
Country 2006 2007 2008 2009 2010 Azerbaijan 31 852 39 241 61 604 10 145 — Bosnia & Herzegovina 136 190 147 193 155 909 130 042 150 488 France 442 879 430 159 389 000 345 000 356 000 Germany 515 539 551 000 605 880 291 750 402 480 Greece 164 500 167 937 162 339 134 737 137 000 Hungary 300 — — — — Iceland 328 424 446 297 761 204 804 605 812 980 Italy 194 200 179 500 186 400 165 800 129 500 Montenegro 121 762 135 151 111 513 63 960 82 043 Netherlands 285 317 296 900 317 000 306 000 * 300 000 Norway 1 383 000 1 362 000 1 368 000 1 090 000 1 400 000 Poland 42 000 43 000 31 000 — — Romania 262 056 283 449 288 156 228 630 241 000 Russia 3 117 249 3 955 417 4 190 000 3 815 000 3 947 000 Slovakia 158 289 160 461 162 995 149 604 163 000 Slovenia 118 100 111 016 83 300 35 148 40 177 Spain 367 400 405 100 405 800 334 600 335 000 Sweden 101 668 99 842 81 913 69 708 93 000 Switzerland 12 000 — — — — Turkey 60 000 63 400 61 100 30 000 60 000 Ukraine 112 952 113 437 88 800 50 000 25 000 United Kingdom 360 325 364 595 326 900 252 000 186 000 Cameroon 88 400 87 000 89 700 73 000 76 000 Egypt 252 300 258 300 259 200 245 400 281 100 Ghana 75 800 12 900 9 300 — — Mozambique 564 000 564 000 536 000 545 000 557 000 Nigeria — — 10 600 12 900 21 200 South Africa 895 000 899 000 811 000 809 000 807 000 Canada 3 051 128 3 082 625 3 120 148 3 030 269 2 963 200 USA 2 283 800 2 553 900 2 658 300 1 727 200 1 727 300 Argentina 277 800 292 744 399 714 405 779 410 947 Brazil 1 604 500 1 654 800 1 661 000 1 535 900 1 536 200 Venezuela 617 100 615 000 607 000 569 000 353 658 Bahrain 872 393 865 883 871 658 850 000 860 000 China 9 358 400 12 558 600 13 178 200 12 890 500 16 194 500 India (a) 1 113 849 1 239 581 1 347 127 1 480 568 * 1 610 000 Indonesia 250 300 242 100 242 500 257 600 253 300 Iran (b) 205 462 215 981 241 300 281 300 * 320 000 Japan 6 500 6 600 6 600 5 100 4 700 Kazakhstan — 12 000 106 000 128 000 227 000 Oman — — 49 000 351 000 367 000 Tajikistan 413 800 419 060 399 500 359 400 348 900 United Arab Emirates 789 341 889 548 891 723 1 009 800 * 1 400 000 Australia 1 929 000 1 957 000 1 974 000 1 943 000 1 928 000 New Zealand 335 300 351 100 315 500 271 000 344 000 World Total 33 300 000 38 100 000 39 600 000 37 100 000 41 500 000
Note(s) (a) Years ended 31 March following that stated (b) Years ended 20 March following that stated

5
Mine production of antimony tonnes (metal content)
Country 2006 2007 2008 2009 2010 Russia * 3 000 * 3 000 * 3 000 * 3 000 * 3 000 Turkey * 1 100 * 1 200 * 1 300 * 1 300 * 1 300 South Africa 4 443 3 436 3 674 2 090 * 2 250 Canada 269 193 132 64 69 Guatemala — 365 — — — Mexico 778 414 380 74 71 Bolivia 5 460 3 881 3 905 2 990 4 980 Peru (a) 691 590 531 145 — China 156 200 163 000 100 230 112 000 129 831 Kyrgyzstan * 250 * 250 * 250 918 * 900 Pakistan (b) 91 119 245 75 25 Tajikistan 3 480 3 500 3 400 2 447 3 341 Thailand 544 271 422 555 705 Australia (b) 230 767 1 688 1 794 675 World Total 177 000 181 000 119 000 127 000 147 000
Note(s) (1) This table includes antimony content of antimonial lead alloys (2) In addition, Hungary is believed to produce antimony (a) Including Sb content of antimonial lead plus Sb content of ores for export (b) Years ended 30 June of that stated
Production of white arsenic tonnes (metric)
Country 2006 2007 2008 2009 2010 Belgium * 1 000 * 1 000 * 1 000 * 1 000 * 1 000 Portugal * 15 * 15 * 15 * 15 * 15 Russia * 1 500 * 1 500 * 1 500 * 1 500 * 1 500 Namibia — 610 574 — — Mexico 2 106 677 — — — Bolivia 90 * 80 74 115 * 155 Chile (a) * 10 000 * 10 000 * 10 000 * 10 000 * 10 000 Peru 4 399 4 321 4 822 300 — China * 30 000 * 25 000 * 25 000 * 25 000 * 25 000 Iran (b) * 100 * 100 * 100 * 100 * 100 Japan * 40 * 40 * 40 * 40 * 40 Kazakhstan * 1 500 * 1 500 * 1 500 * 1 500 * 1 500
Note(s) (1) This table includes calculated trioxide equivalent of arsenic metal produced except where this would involve double counting (2) In addition to the countries listed, Austria, Finland, Hungary, Spain and the United Kingdom are believed to produce arsenic (a) Exports (b) Orpiment and realgar concentrates

6
Production of asbestos tonnes (metric)
Country 2006 2007 2008 2009 2010 Russia * 925 000 1 030 000 1 020 000 * 1 000 000 * 1 000 000 Serbia 4 500 — — — — Slovakia 1 000 400 200 — — Zimbabwe Chrysotile 96 956 84 520 11 489 4 971 2 437 Canada Chrysotile * 200 000 * 180 000 * 160 000 * 150 000 * 100 000 Argentina 299 282 298 322 * 320 Brazil 227 304 254 204 305 000 288 400 312 000 China * 360 000 * 390 000 * 380 000 * 440 000 * 400 000 India Amphibole (a) 390 269 315 233 * 280 Kazakhstan 314 700 292 600 230 100 230 000 214 100 World Total 2 100 000 2 200 000 2 100 000 2 100 000 2 000 000
Note(s) (1) In addition to the countries listed, Romania is believed to produce asbestos (a) Years ended 31 March following that stated

7
Production of barytes tonnes (metric)
Country 2006 2007 2008 2009 2010 Bosnia & Herzegovina 190 37 54 30 57 Bulgaria 74 500 50 900 40 100 14 300 500 France * 40 000 — — — — Germany 85 524 88 265 78 941 45 606 55 887 Italy * 7 000 * 5 000 * 5 000 * 3 500 * 3 500 Poland 2 034 2 000 308 300 300 Portugal 24 25 171 1 078 15 Russia * 63 000 * 64 000 * 64 000 * 64 000 * 64 000 Slovakia 57 000 58 000 20 000 30 000 17 000 Spain 45 001 26 770 11 100 5 212 2 050 Turkey 160 000 150 000 150 000 213 187 225 000 United Kingdom 48 000 53 000 43 000 36 000 33 000 Algeria 64 787 63 098 60 088 37 981 42 254 Egypt ... 50 1 080 1 100 6 100 Morocco 628 400 664 708 725 060 586 937 572 429 Nigeria 30 011 18 047 * 16 000 14 314 10 749 Canada 21 000 9 000 12 300 15 000 22 000 Guatemala — — — 13 11 Mexico 199 605 185 921 140 066 152 791 143 225 USA (a) 598 000 455 000 648 000 383 000 * 670 000 Argentina 6 276 3 798 3 170 3 416 3 200 Bolivia 8 943 8 245 10 900 1 900 7 800 Brazil (b) 47 611 37 000 42 000 38 550 * 40 000 Chile 375 77 — — — Colombia * 2 000 * 2 000 * 2 000 * 2 000 * 2 000 Peru 1 899 27 369 45 199 27 881 49 396 Afghanistan * 1 500 * 1 500 * 1 500 * 1 000 * 1 000 Burma (c) 4 023 5 918 7 000 7 120 14 346 China 4 600 000 4 300 000 5 000 000 2 900 000 3 900 000 India (c) 1 680 695 1 076 290 1 686 148 2 138 456 * 2 000 000 Iran (d) 226 032 249 495 226 590 361 217 * 200 000 Kazakhstan 120 000 130 000 170 000 170 000 200 000 Laos 29 000 29 000 29 000 29 000 29 000 Malaysia 910 — 4 372 22 390 1 000 Pakistan (e) 49 221 46 759 49 933 62 997 47 019 Saudi Arabia 31 000 30 000 30 000 30 000 * 30 000 Thailand 4 549 8 631 9 180 51 895 33 465 Vietnam 90 000 90 000 80 000 70 000 90 000 Australia * 18 000 12 576 22 189 16 634 16 529 World Total 9 000 000 8 000 000 9 400 000 7 500 000 8 500 000
Note(s) (1) This table may include small quantities of witherite (2) In addition to the countries listed, Cuba is believed to produce barytes (a) Sold or used by producers (b) Including beneficiated and directly shipped material (c) Years ended 31 March following that stated (d) Years ended 20 March following that stated (e) Years ended 30 June of that stated

8
Production of bentonite and fuller's earth tonnes (metric)
Country 2006 2007 2008 2009 2010 Armenia Bentonite 720 1 129 50 238 1 397 Azerbaijan Bentonite 40 600 50 459 40 683 10 581 18 100 Bosnia & Herzegovina Bentonite (a) 24 645 32 912 30 504 16 042 314 Bulgaria Bentonite 134 500 99 000 178 700 108 400 99 700 Croatia Bentonite 16 410 19 578 19 759 * 20 000 * 20 000 Cyprus Bentonite 150 620 154 655 155 125 152 722 162 969 Czech Republic Bentonite 267 000 335 000 235 000 177 000 183 000 Denmark Bentonite 19 211 20 093 22 458 24 040 23 832 France Bentonite ... ... ... 25 000 25 000 Georgia Bentonite 4 487 — — — — Germany Bentonite 363 998 384 709 414 336 326 461 362 623 Greece Bentonite 1 166 000 1 342 000 1 580 000 1 500 000 844 804 Hungary Bentonite 6 635 54 231 7 464 2 839 3 000 Italy Bentonite 469 654 599 735 281 119 292 318 * 150 000 Kosovo Bentonite — — 20 800 49 000 20 200 Macedonia Bentonite 20 353 22 509 13 689 9 033 * 9 000 Poland Bentonite — 1 300 3 000 2 800 2 200 Romania Bentonite 21 165 16 911 16 638 13 756 21 963 Russia Bentonite 456 000 * 460 000 * 460 000 * 460 000 * 460 000 Slovakia Bentonite 136 000 149 000 145 000 109 000 153 000 Slovenia Bentonite 130 130 160 104 135 Spain Bentonite 154 746 147 253 154 534 147 090 157 001 Attapulgite 20 933 24 615 27 348 21 110 27 841 Sepiolite 806 345 717 728 737 659 573 937 557 862 Turkey Bentonite * 600 000 748 170 683 253 753 155 718 260 Sepiolite * 10 000 * 10 000 * 10 000 * 10 000 * 10 000 Ukraine Bentonite * 200 000 314 000 200 000 195 000 185 000 Algeria Bentonite 27 110 32 600 30 595 31 612 34 126 Egypt Bentonite (b) * 19 000 19 200 28 320 35 384 27 000 Malawi Bentonite — 2 080 7 023 8 050 1 020 Morocco Bentonite 21 100 136 097 50 125 84 097 110 703 Fuller's earth (c) 29 400 121 737 140 875 132 110 82 570 Mozambique Bentonite 692 762 614 577 * 600 Senegal Attapulgite 140 000 * 150 000 166 900 180 900 204 300 South Africa Bentonite 32 878 45 778 44 067 40 340 54 311 Attapulgite 49 225 65 402 69 876 52 103 85 336
9
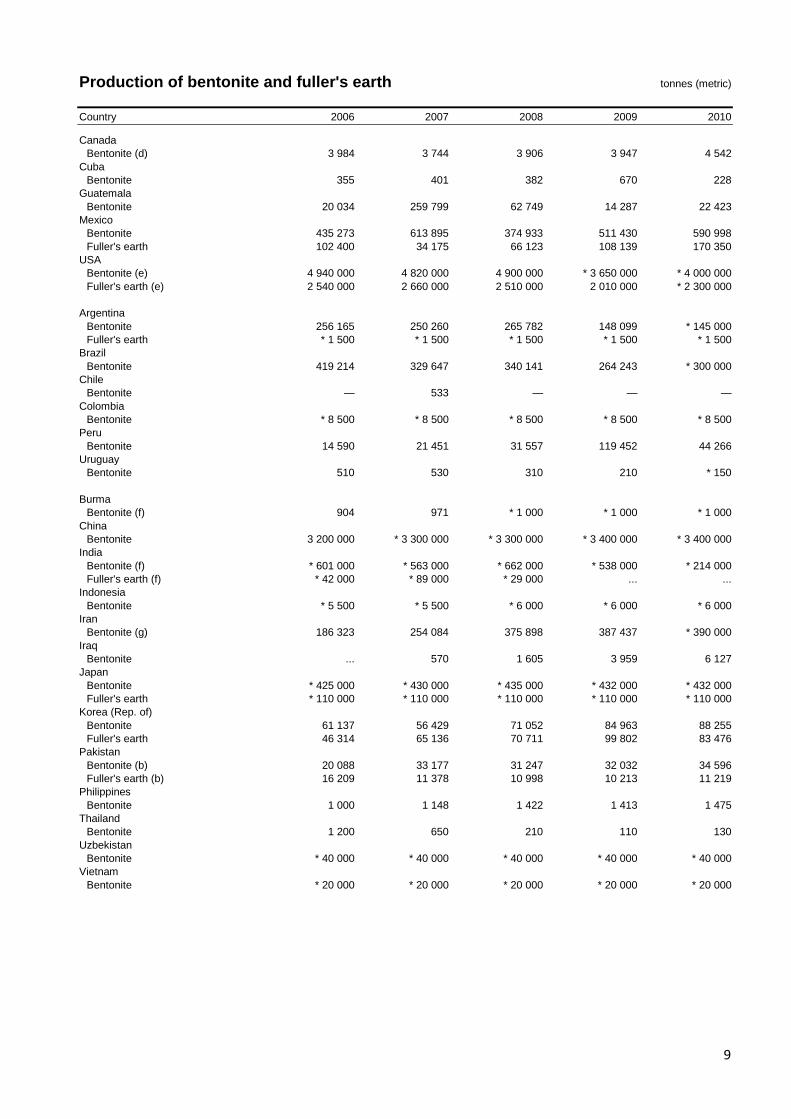
Production of bentonite and fuller's earth tonnes (metric)
Country 2006 2007 2008 2009 2010 Canada Bentonite (d) 3 984 3 744 3 906 3 947 4 542 Cuba Bentonite 355 401 382 670 228 Guatemala Bentonite 20 034 259 799 62 749 14 287 22 423 Mexico Bentonite 435 273 613 895 374 933 511 430 590 998 Fuller's earth 102 400 34 175 66 123 108 139 170 350 USA Bentonite (e) 4 940 000 4 820 000 4 900 000 * 3 650 000 * 4 000 000 Fuller's earth (e) 2 540 000 2 660 000 2 510 000 2 010 000 * 2 300 000 Argentina Bentonite 256 165 250 260 265 782 148 099 * 145 000 Fuller's earth * 1 500 * 1 500 * 1 500 * 1 500 * 1 500 Brazil Bentonite 419 214 329 647 340 141 264 243 * 300 000 Chile Bentonite — 533 — — — Colombia Bentonite * 8 500 * 8 500 * 8 500 * 8 500 * 8 500 Peru Bentonite 14 590 21 451 31 557 119 452 44 266 Uruguay Bentonite 510 530 310 210 * 150 Burma Bentonite (f) 904 971 * 1 000 * 1 000 * 1 000 China Bentonite 3 200 000 * 3 300 000 * 3 300 000 * 3 400 000 * 3 400 000 India Bentonite (f) * 601 000 * 563 000 * 662 000 * 538 000 * 214 000 Fuller's earth (f) * 42 000 * 89 000 * 29 000 ... ... Indonesia Bentonite * 5 500 * 5 500 * 6 000 * 6 000 * 6 000 Iran Bentonite (g) 186 323 254 084 375 898 387 437 * 390 000 Iraq Bentonite ... 570 1 605 3 959 6 127 Japan Bentonite * 425 000 * 430 000 * 435 000 * 432 000 * 432 000 Fuller's earth * 110 000 * 110 000 * 110 000 * 110 000 * 110 000 Korea (Rep. of) Bentonite 61 137 56 429 71 052 84 963 88 255 Fuller's earth 46 314 65 136 70 711 99 802 83 476 Pakistan Bentonite (b) 20 088 33 177 31 247 32 032 34 596 Fuller's earth (b) 16 209 11 378 10 998 10 213 11 219 Philippines Bentonite 1 000 1 148 1 422 1 413 1 475 Thailand Bentonite 1 200 650 210 110 130 Uzbekistan Bentonite * 40 000 * 40 000 * 40 000 * 40 000 * 40 000 Vietnam Bentonite * 20 000 * 20 000 * 20 000 * 20 000 * 20 000

10
Production of bentonite and fuller's earth tonnes (metric)
Country 2006 2007 2008 2009 2010 Australia Bentonite (b) * 125 600 * 116 300 * 85 800 * 124 400 * 131 300 Fuller's earth * 10 000 * 10 000 * 10 000 * 10 000 * 10 000 New Zealand Bentonite 3 028 6 154 753 880 1 216 World Total Bentonite 15 100 000 16 300 000 15 800 000 14 400 000 13 700 000 World Total Fuller’s Earth (a) 3 900 000 4 100 000 4 000 000 3 300 000 3 700 000
Note(s) (1) Bentonites consist of montmorillonite (one of the smectite group of clay minerals) and occur in two main varieties, calcium bentonite,
the most commonly occurring, and sodium bentonite, industrially the more important (2) Calcium bentonite can be converted to sodium bentonite by a sodium-exchange process (3) In some countries, such as the United Kingdom, calcium bentonite is known as fuller's earth, a term which is also used to refer
attapulgite, a mineralogically distinct clay mineral but exhibiting similar properties (4) In addition to the countries listed, Austria is believed to produce bentonite and France may produce fuller's earth (a) Including attapulgite and sepiolite (b) Years ended 30 June of that stated (c) Smectite (d) Sales (e) Sold or used by producers (f) Years ended 31 March following that stated (g) Years ended 20 March following that stated
Production of beryl tonnes (metric)
Country 2006 2007 2008 2009 2010 Madagascar (a) * 1 * 1 * 1 * 1 * 1 Mozambique 16 31 8 45 * 40 Uganda 2 2 — — — Zambia * 5 * 5 * 4 * 6 * 6 USA 3 830 3 810 4 410 3 030 * 3 000 China * 500 * 500 * 500 * 500 * 500
Note(s) (a) Includes ornamental and industrial products

11
Mine production of bismuth tonnes (metal content)
Country 2006 2007 2008 2009 2010 Bulgaria * 45 * 45 * 45 * 45 * 45 Romania * 40 * 40 * 40 * 40 * 40 Russia * 55 * 55 * 70 * 70 * 70 Canada 214 145 71 86 92 Mexico 1 186 1 170 1 132 854 982 Bolivia 155 147 28 54 87 Peru (a) 1 081 1 114 1 061 423 — China 1 515 1 363 1 453 1 460 1 465 Japan (a) 425 408 480 423 454 Kazakhstan * 140 * 145 * 150 * 140 * 140 Australia * 100 * 100 * 100 * 100 * 100 World Total 5 000 4 700 4 600 3 700 3 500
Note(s) (1) The figures in this table are in some instances derived from reported bismuth content of refined and impure metal plus recoverable in
ores and concentrates exported (2) Production for some countries may include bismuth produced from imported ores but it is thought that any resulting duplication is
insignificant in the countries shown (3) In addition to the countries listed, Brazil is believed to produce bismuth (a) Metal production
Production of borates tonnes (metric)
Country 2006 2007 2008 2009 2010 Russia * 400 000 * 400 000 * 400 000 * 400 000 * 400 000 Turkey 2 373 345 1 997 163 2 139 224 1 687 102 1 910 000 USA (a) * 1 150 000 * 1 150 000 * 1 150 000 * 1 200 000 * 1 200 000 Argentina 533 535 669 578 789 954 500 433 * 500 500 Bolivia 50 727 79 531 66 249 93 829 * 94 000 Chile 459 645 535 071 590 999 613 135 503 609 Peru — 233 991 349 891 187 221 292 855 China * 290 000 * 290 000 * 280 000 * 290 000 * 300 000 Iran (b) 1 974 1 603 1 020 388 * 500 Kazakhstan * 30 000 * 30 000 * 30 000 * 30 000 * 30 000
Note(s) (a) Sold or used by producers (b) Years ended 20 March following that stated

12
Production of bromine kilograms
Country 2006 2007 2008 2009 2010 Russia * 60 000 * 60 000 * 60 000 * 60 000 * 60 000 Spain * 100 000 * 100 000 * 100 000 * 100 000 * 100 000 Ukraine * 700 000 * 1 800 000 * 400 000 * 400 000 * 400 000 USA (a) 243 000 000 * 235 000 000 * 230 000 000 * 230 000 000 * 230 000 000 China * 124 000 000 * 137 000 000 * 135 000 000 * 140 000 000 * 150 000 000 India (b) 2 138 000 1 664 640 2 118 740 1 862 580 1 587 000 Israel 179 493 000 159 395 000 164 042 000 127 689 000 184 696 000 Japan * 20 000 000 * 20 000 000 * 20 000 000 * 20 000 000 * 20 000 000 Jordan 94 500 000 85 105 000 105 600 000 69 000 000 * 70 000 000 World Total 664 000 000 640 000 000 657 000 000 589 000 000 657 000 000
Note(s) (a) Elemental bromine sold as such or used in the preparation of bromine compounds by primary producers (b) Years ended 31 March following that stated
Production of cadmium tonnes (metric)
Country 2006 2007 2008 2009 2010 Bulgaria 320 318 376 413 * 440 France 90 50 — — — Germany * 490 * 475 * 420 * 250 * 300 Netherlands 524 495 530 * 490 * 580 Norway 125 269 178 249 300 Poland 373 421 603 534 451 Russia 690 810 * 800 * 700 * 700 Canada (a) 2 090 1 388 1 409 1 299 1 357 Mexico 1 399 1 605 1 550 1 510 1 464 USA (a) 723 735 777 633 637 Argentina 6 35 38 36 35 Brazil * 200 * 200 * 200 * 200 * 200 Peru 416 347 371 289 357 China 3 791 4 215 6 964 * 7 000 * 7 200 India (b) 481 589 507 553 * 550 Japan 2 286 1 939 2 126 1 824 2 053 Kazakhstan 1 140 * 1 000 * 1 000 * 1 000 * 1 000 Korea (Rep. of) 3 320 2 846 3 090 2 500 4 166 Korea, Dem. P.R. of * 200 * 200 * 200 * 200 * 200 Australia 329 351 * 350 * 370 * 350 World Total 19 000 18 300 21 500 20 100 22 300
Note(s) (1) Data in this table excludes secondary metal unless otherwise stated (a) Including cadmium sponge and/or secondary metal (b) Years ended 31 March following that stated

13
Production of chromium ores and concentrates tonnes (metric)
Country 2006 2007 2008 2009 2010 Albania 187 070 194 760 220 536 288 759 289 687 Finland 549 000 556 000 614 000 247 000 598 000 Kosovo — — — 2 000 ... Russia 966 095 776 681 913 000 416 194 ... Turkey 1 059 901 1 678 932 1 885 712 1 770 029 1 904 460 Madagascar 116 290 77 700 112 600 131 800 134 500 South Africa 7 418 326 9 646 958 9 682 640 6 864 938 10 871 095 Sudan 24 200 37 656 27 094 14 087 56 823 Zimbabwe 700 001 614 559 442 584 193 674 510 424 Cuba 5 047 — — — — Brazil 562 739 627 772 705 726 * 700 000 * 700 000 Afghanistan 7 273 6 491 6 491 6 000 * 6 000 China 220 000 220 000 220 000 * 220 000 * 220 000 India (a) 5 295 551 4 872 847 4 073 479 3 412 867 4 262 207 Iran (b)(c) 236 397 139 114 268 586 274 511 * 275 000 Kazakhstan 3 366 078 3 687 200 3 551 700 8 059 000 8 594 000 Oman 276 300 407 800 784 100 636 500 * 640 000 Pakistan (d) 64 572 104 141 114 884 89 739 257 148 Philippines (b) 46 728 31 593 15 268 14 322 14 807 United Arab Emirates — 19 000 34 350 23 770 ... Vietnam 3 400 2 800 * 1 300 * 400 ... Australia 107 103 118 093 56 881 72 813 73 618 World Total 21 200 000 23 800 000 23 700 000 23 400 000 30 000 000
Note(s) (1) In addition to the countries listed, Bulgaria is believed to produce chromite (a) Years ended 31 March following that stated (b) Including foundry sand and/or lumpy ore (c) Years ended 20 March following that stated (d) Years ended 30 June of that stated
14
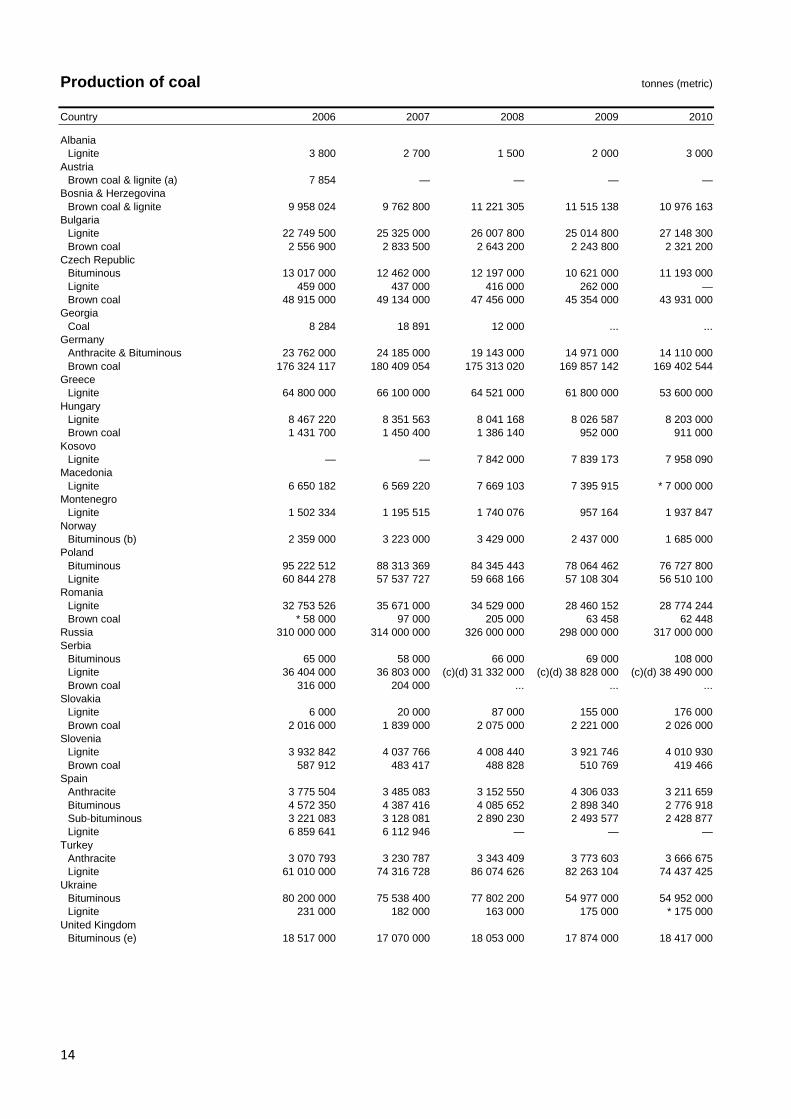
Production of coal tonnes (metric)
Country 2006 2007 2008 2009 2010 Albania Lignite 3 800 2 700 1 500 2 000 3 000 Austria Brown coal & lignite (a) 7 854 — — — — Bosnia & Herzegovina Brown coal & lignite 9 958 024 9 762 800 11 221 305 11 515 138 10 976 163 Bulgaria Lignite 22 749 500 25 325 000 26 007 800 25 014 800 27 148 300 Brown coal 2 556 900 2 833 500 2 643 200 2 243 800 2 321 200 Czech Republic Bituminous 13 017 000 12 462 000 12 197 000 10 621 000 11 193 000 Lignite 459 000 437 000 416 000 262 000 — Brown coal 48 915 000 49 134 000 47 456 000 45 354 000 43 931 000 Georgia Coal 8 284 18 891 12 000 ... ... Germany Anthracite & Bituminous 23 762 000 24 185 000 19 143 000 14 971 000 14 110 000 Brown coal 176 324 117 180 409 054 175 313 020 169 857 142 169 402 544 Greece Lignite 64 800 000 66 100 000 64 521 000 61 800 000 53 600 000 Hungary Lignite 8 467 220 8 351 563 8 041 168 8 026 587 8 203 000 Brown coal 1 431 700 1 450 400 1 386 140 952 000 911 000 Kosovo Lignite — — 7 842 000 7 839 173 7 958 090 Macedonia Lignite 6 650 182 6 569 220 7 669 103 7 395 915 * 7 000 000 Montenegro Lignite 1 502 334 1 195 515 1 740 076 957 164 1 937 847 Norway Bituminous (b) 2 359 000 3 223 000 3 429 000 2 437 000 1 685 000 Poland Bituminous 95 222 512 88 313 369 84 345 443 78 064 462 76 727 800 Lignite 60 844 278 57 537 727 59 668 166 57 108 304 56 510 100 Romania Lignite 32 753 526 35 671 000 34 529 000 28 460 152 28 774 244 Brown coal * 58 000 97 000 205 000 63 458 62 448 Russia 310 000 000 314 000 000 326 000 000 298 000 000 317 000 000 Serbia Bituminous 65 000 58 000 66 000 69 000 108 000 Lignite 36 404 000 36 803 000 (c)(d) 31 332 000 (c)(d) 38 828 000 (c)(d) 38 490 000 Brown coal 316 000 204 000 ... ... ... Slovakia Lignite 6 000 20 000 87 000 155 000 176 000 Brown coal 2 016 000 1 839 000 2 075 000 2 221 000 2 026 000 Slovenia Lignite 3 932 842 4 037 766 4 008 440 3 921 746 4 010 930 Brown coal 587 912 483 417 488 828 510 769 419 466 Spain Anthracite 3 775 504 3 485 083 3 152 550 4 306 033 3 211 659 Bituminous 4 572 350 4 387 416 4 085 652 2 898 340 2 776 918 Sub-bituminous 3 221 083 3 128 081 2 890 230 2 493 577 2 428 877 Lignite 6 859 641 6 112 946 — — — Turkey Anthracite 3 070 793 3 230 787 3 343 409 3 773 603 3 666 675 Lignite 61 010 000 74 316 728 86 074 626 82 263 104 74 437 425 Ukraine Bituminous 80 200 000 75 538 400 77 802 200 54 977 000 54 952 000 Lignite 231 000 182 000 163 000 175 000 * 175 000 United Kingdom Bituminous (e) 18 517 000 17 070 000 18 053 000 17 874 000 18 417 000

15
Production of coal tonnes (metric)
Country 2006 2007 2008 2009 2010 Botswana 962 427 828 164 909 511 737 798 894 720 Congo, Democratic Republic Bituminous 124 000 128 000 116 000 * 120 000 * 120 000 Egypt * 300 000 * 360 000 * 360 000 * 300 000 * 300 000 Malawi 60 408 58 550 57 477 59 201 79 186 Mozambique Bituminous 40 953 23 602 37 700 25 924 * 25 000 Niger 176 320 171 296 182 912 225 072 246 558 Nigeria Sub-bituminous * 20 000 * 20 000 * 30 000 * 40 000 44 148 South Africa Anthracite 1 584 424 2 348 955 2 207 304 1 657 860 2 073 889 Bituminous 243 197 975 245 251 281 250 006 054 248 923 814 252 448 056 Swaziland Anthracite 310 570 241 283 174 807 129 647 145 903 Tanzania Bituminous 17 940 27 198 15 242 16 500 * 16 000 Zambia Bituminous 64 849 14 058 * 14 000 * 14 000 * 14 000 Zimbabwe Bituminous 2 107 115 2 080 221 1 509 080 1 667 346 2 488 856 Canada Bituminous 29 301 000 32 325 000 32 839 000 27 959 000 33 704 000 Sub-bituminous 26 153 000 26 118 000 24 988 000 24 425 000 23 927 000 Lignite 10 440 000 10 541 000 9 921 000 10 550 000 10 264 000 Mexico Bituminous 10 882 685 11 886 757 15 894 060 12 955 055 16 015 216 USA Anthracite (f) 1 395 000 1 413 000 1 555 000 1 743 000 1 696 429 Bituminous (f) 509 512 000 482 428 000 507 488 000 450 089 285 454 464 285 Sub-bituminous 467 510 000 475 101 000 487 801 000 443 214 286 447 500 000 Lignite 76 430 000 71 305 900 68 675 000 65 751 000 65 357 143 Argentina Bituminous 295 333 250 000 207 983 181 474 * 150 000 Brazil Bituminous & lignite (g) 6 215 258 5 998 354 6 518 733 5 947 364 5 611 467 Chile Bituminous 98 673 184 122 212 375 118 305 106 018 Lignite 575 071 103 871 321 417 517 769 512 775 Colombia Bituminous 66 192 000 69 902 000 73 502 075 72 807 412 74 350 133 Peru Anthracite & Bituminous 107 091 100 594 136 435 156 372 91 960 Venezuela Bituminous 7 458 873 6 855 341 5 053 700 3 258 146 2 630 820 Afghanistan Bituminous ... ... 314 702 453 592 657 618 Bangladesh (h) 303 016 388 376 677 098 857 648 730 866 Bhutan 97 965 105 261 123 704 48 545 87 814 Burma (i) 351 559 282 655 245 172 233 983 240 527 China 2 529 000 000 2 692 000 000 2 802 000 000 2 973 000 000 3 240 000 000 India Bituminous (i) 430 832 000 457 082 000 492 757 000 532 062 000 * 498 727 000 Lignite (i) 31 285 000 33 980 000 32 421 000 34 080 000 * 35 181 000 Indonesia Anthracite & Bituminous 193 761 311 216 946 699 240 249 968 255 000 000 275 000 000 Iran Bituminous (j) 2 432 000 2 525 000 2 520 000 2 180 810 * 2 500 000 Japan Bituminous 1 341 000 * 1 340 000 * 1 300 000 * 1 100 000 * 1 100 000

16
Production of coal tonnes (metric)
Country 2006 2007 2008 2009 2010 Kazakhstan Bituminous * 91 500 000 94 013 800 106 295 600 86 881 082 90 069 836 Lignite 4 655 100 4 370 100 4 776 700 4 612 000 6 607 026 Korea (Rep. of) Anthracite 2 823 990 2 886 000 2 772 544 2 518 940 2 083 972 Korea, Dem. P.R. of (a) 23 000 000 24 100 000 25 060 000 25 000 000 * 25 000 000 Kyrgyzstan 300 000 400 000 436 678 546 971 * 550 000 Laos 319 200 681 700 379 200 466 100 * 500 000 Malaysia 901 801 1 063 078 1 166 525 2 138 390 2 397 340 Mongolia Anthracite & semi-bituminous ... 4 664 900 5 228 000 ... ... Brown coal & lignite (a) 8 074 100 4 572 700 4 843 900 (a) 14 365 500 (a) 25 596 530 Nepal Sub-bituminous (k) 11 963 16 374 13 845 14 819 * 16 000 Pakistan (h)(l) 3 880 604 3 702 162 4 066 409 3 679 185 3 523 272 Philippines Bituminous 2 300 341 3 401 136 3 609 316 4 687 277 6 650 357 Tajikistan 218 000 181 400 198 500 178 300 199 700 Thailand Lignite 19 070 608 18 239 176 18 095 335 16 360 261 17 906 894 Uzbekistan Bituminous 99 200 * 100 000 * 100 000 * 100 000 * 100 000 Lignite 2 720 000 * 2 700 000 * 3 000 000 * 3 000 000 * 3 000 000 Vietnam Anthracite 38 778 000 42 483 000 39 777 000 43 715 000 44 010 700 Australia Bituminous (m) 315 000 000 325 000 000 333 000 000 350 000 000 356 000 000 Brown coal (h) 67 737 000 65 613 000 66 033 000 68 252 000 68 751 000 New Zealand Bituminous 2 863 029 2 019 430 2 476 848 2 085 486 2 597 400 Sub-bituminous 2 653 516 2 555 830 2 179 081 2 218 143 2 438 200 Lignite 251 366 260 148 253 492 259 704 294 900 World Total 6 345 000 000 6 572 000 000 6 815 000 000 6 849 000 000 7 153 000 000
Note(s) (1) There is no international agreement as to the separate definition of lignite and brown coal. In some cases they are distinguished.
Elsewhere both may be aggregated under one or other term (a) Coal; all forms (b) Spitzbergen: not including production from mines controlled by Russia (c) Including brown coal (d) Excluding production in Kosovo (e) Including anthracite (f) Includes a small amount of refuse recovery (g) Including beneficiated and directly shipped material (h) Years ended 30 June of that stated (i) Years ended 31 March following that stated (j) Years ended 20 March following that stated (k) Years ended 15 July of that shown (l) Including lignite (m) Including sub-bituminous

17
Mine production of cobalt tonnes (metal content)
Country 2006 2007 2008 2009 2010 Finland * 100 * 120 * 100 * 27 * 30 Russia (a) 4 759 3 587 2 502 2 352 2 460 Botswana 303 242 337 342 295 Congo, Democratic Republic 27 100 25 400 32 300 35 500 * 70 000 Madagascar — — — — 700 Morocco (a) 1 405 1 573 1 791 1 600 1 582 South Africa (a) 267 307 244 238 840 Uganda (a) 674 698 663 673 624 Zambia (a) 4 665 4 335 3 841 1 535 5 134 Zimbabwe 26 29 28 39 57 Canada 7 115 8 692 8 953 3 919 4 568 Cuba 5 602 4 540 3 175 * 3 500 3 721 Brazil 1 100 1 311 1 215 * 1 200 * 1 200 China 1 840 6 100 6 630 6 000 6 500 Indonesia * 650 * 650 * 650 * 650 * 650 Australia (b) 5 736 5 325 5 770 5 365 4 819 New Caledonia 1 629 1 620 869 913 1 656 World Total 63 000 65 000 69 000 64 000 105 000
Note(s) (1) There is frequently a considerable disparity between the cobalt content of ore raised and cobalt actually recovered (2) Figures in this table relate where possible to cobalt recovered. The principal exceptions to this are Brazil and New Caledonia, the
figures for which relate to cobalt in ore raised (a) Metal (b) Years ended 30 June of that stated

18
Production of cobalt metal tonnes (metric)
Country 2006 2007 2008 2009 2010 Belgium (a) 2 840 2 825 3 020 2 150 2 600 Finland 8 582 9 173 9 645 8 962 9 413 France 256 305 311 368 302 Norway 4 927 3 939 3 719 3 510 3 208 Russia 4 759 3 587 2 502 2 352 2 460 Congo, Democratic Republic (b) 550 606 1 049 2 950 4 182 Morocco 1 405 1 591 1 711 1 600 1 545 South Africa (c) 267 307 244 238 836 Uganda 689 636 662 389 568 Zambia 4 665 4 435 3 841 1 535 5 134 Canada (d) 5 198 5 620 5 637 4 918 4 249 Brazil 902 1 148 994 1 012 1 369 China (a) * 12 700 13 245 18 239 23 138 32 930 India 1 184 980 858 1 001 1 187 Japan 920 1 085 1 071 1 332 1 935 Australia 3 696 3 684 3 617 4 050 4 117 World Total 53 500 53 200 57 100 59 500 76 000
Note(s) (1) In addition to the production listed above, several countries, including the United Kingdom, Finland and France, are known to produce
substantial amounts of cobalt compounds (a) Some metal production in China is recorded in Belgium (b) Excludes white alloy and matte which are believed to be further processed in Belgium and elsewhere (c) Includes metal and metal contained in sulphate (d) Including oxides

19
Mine production of copper tonnes (metal content)
Country 2006 2007 2008 2009 2010 Albania 1 140 2 980 2 980 2 788 3 359 Armenia 17 800 17 400 18 540 22 968 30 707 Bulgaria 123 571 116 157 107 195 110 652 112 904 Cyprus 900 2 900 3 000 2 500 2 600 Finland 13 000 13 600 13 300 14 600 14 700 Georgia 14 600 11 000 18 700 16 600 11 300 Macedonia 7 054 7 029 8 051 7 440 7 900 Poland 497 200 451 900 429 687 439 365 425 725 Portugal 78 576 90 182 89 026 86 462 74 011 Romania 12 535 2 213 308 3 129 5 127 Russia 675 000 690 000 705 000 675 700 702 700 Serbia 11 100 16 500 17 600 19 400 22 500 Spain 8 700 6 281 7 071 17 663 54 329 Sweden 86 746 62 905 57 688 55 414 76 514 Turkey 46 400 81 000 83 000 87 070 81 500 Botswana 24 255 19 996 23 146 24 382 25 000 Congo, Democratic Republic 142 300 148 400 242 900 293 000 377 900 Mauritania 5 031 28 755 33 073 36 608 36 969 Morocco 4 600 5 600 5 900 11 800 15 000 Namibia 6 262 5 800 8 800 — — South Africa 89 500 97 000 108 700 107 600 102 600 Tanzania 3 285 3 276 2 852 3 079 6 400 Zambia 497 169 510 917 600 033 697 860 819 159 Zimbabwe 2 581 2 681 2 827 3 572 4 676 Canada 603 295 596 249 607 957 484 605 525 129 Mexico 334 129 337 527 246 593 240 648 270 136 USA 1 197 000 1 169 000 1 307 900 1 204 000 1 129 300 Argentina 180 144 180 223 156 900 143 084 140 300 Bolivia 218 606 567 620 2 100 Brazil 147 836 205 728 222 000 217 000 213 000 Chile 5 360 800 5 557 000 5 327 600 5 394 400 5 418 900 Colombia 600 840 1 050 1 140 783 Peru 1 048 472 1 190 274 1 267 867 1 276 249 1 247 126 Burma 19 500 15 100 6 900 9 800 * 12 000 China 889 000 946 200 1 092 700 1 062 000 1 191 200 India (a) 30 051 32 726 30 189 27 072 * 29 200 Indonesia 817 796 796 899 655 046 988 530 878 376 Iran 216 200 244 200 248 100 262 500 * 275 000 Japan * 300 — — — — Kazakhstan 446 300 406 500 421 700 406 000 381 000 Korea, Dem. P.R. of * 12 000 * 12 000 * 12 000 * 12 000 * 12 000 Laos 60 803 62 541 89 004 121 581 132 047 Malaysia — — — 240 — Mongolia 129 675 130 165 126 980 129 800 125 000 Oman — 9 100 16 800 15 000 15 300 Pakistan 18 700 18 800 18 700 19 600 19 400 Philippines 17 161 22 862 21 235 49 060 58 412 Saudi Arabia 730 737 1 465 1 719 1 600 Uzbekistan * 80 000 * 80 000 * 80 000 * 80 000 * 80 000 Vietnam 11 400 12 500 11 000 * 11 300 * 11 300 Australia 878 000 871 000 886 000 856 000 870 000 Papua New Guinea 194 355 169 184 159 650 166 669 159 821 World Total 15 100 000 15 500 000 15 600 000 15 900 000 16 200 000
Note(s) (a) Years ended 31 March following that stated

20
Smelter production of copper tonnes (metric)
Country 2006 2007 2008 2009 2010 Armenia (a) 8 791 6 954 6 480 6 858 7 644 Bulgaria 217 000 217 600 257 100 256 200 265 000 Finland 164 306 118 911 142 154 110 479 112 687 Germany 273 800 270 200 295 000 251 000 378 700 Norway 39 700 34 200 37 000 33 900 36 200 Poland 555 907 518 303 492 942 457 510 469 656 Russia 635 000 650 000 627 000 579 600 590 000 Serbia 40 000 30 200 31 900 32 000 27 100 Spain 263 662 257 348 259 897 264 971 259 119 Sweden 129 951 148 835 136 409 125 398 135 125 Turkey 26 300 17 900 38 000 — — Botswana 29 700 27 000 25 000 24 700 23 400 Congo, Democratic Republic (a) 10 000 1 800 — — — Namibia 21 918 20 600 16 600 21 500 29 900 South Africa 98 900 111 900 94 800 86 900 75 700 Zambia (a) 289 700 224 000 232 000 334 000 487 000 Canada 484 675 470 713 443 710 316 510 318 006 Mexico 298 526 294 746 230 056 178 672 168 861 USA 501 300 617 000 573 800 597 400 601 200 Brazil 219 684 218 000 227 800 204 500 208 800 Chile 1 565 400 1 514 300 1 369 200 1 522 300 1 559 800 Peru 322 188 236 809 306 583 325 788 312 968 China 1 917 500 2 111 500 2 453 400 2 648 300 2 772 200 India 609 600 699 900 651 000 705 100 653 900 Indonesia 201 200 277 000 253 300 295 900 276 800 Iran 177 500 180 300 179 800 192 700 188 200 Japan 1 361 771 1 383 372 1 335 846 1 302 120 1 356 289 Kazakhstan 424 784 392 834 392 575 369 000 370 900 Korea (Rep. of) 449 200 470 000 502 000 455 400 475 900 Korea, Dem. P.R. of * 10 000 * 10 000 * 10 000 * 10 000 * 10 000 Oman 20 710 13 940 11 906 11 830 8 815 Pakistan 23 600 18 200 17 800 18 300 18 900 Philippines 239 600 219 900 239 700 230 100 216 200 Thailand 1 000 5 600 — — — Uzbekistan 93 000 90 200 90 100 90 000 90 000 Vietnam — — 2 200 6 000 8 000 Australia 377 000 399 000 449 000 422 000 410 000 World Total 12 100 000 12 300 000 12 400 000 12 500 000 12 900 000
Note(s) (1) This table shows primary metal in the form of blister and anode produced from concentrates, and may include copper produced from
scrap but this is excluded when it can be separately identified (a) Including leach cathodes

21
Production of refined copper tonnes (metric)
Country 2006 2007 2008 2009 2010 Austria 72 600 81 400 106 700 96 200 113 700 Belgium 378 600 394 000 395 800 373 700 389 000 Bulgaria 65 500 69 900 126 700 196 900 215 100 Cyprus 880 3 012 2 986 2 380 2 595 Finland 137 961 109 870 131 249 105 549 124 000 Germany 662 338 665 517 689 763 668 945 704 300 Italy 36 400 28 600 24 200 6 500 1 800 Norway 39 700 34 200 37 000 33 900 36 200 Poland 556 625 532 975 526 808 502 462 547 074 Romania 21 583 18 589 15 300 4 600 — Russia 951 400 949 000 862 000 874 000 910 000 Serbia 41 400 31 600 33 800 27 400 22 200 Spain 299 146 308 372 319 050 329 356 347 518 Sweden 229 241 213 894 227 774 205 759 190 497 Turkey 105 800 99 600 88 000 33 500 47 300 Ukraine 17 300 19 500 21 700 20 000 23 400 Congo, Democratic Republic 24 200 36 000 61 200 158 400 243 900 Egypt (a) * 1 500 1 719 2 664 2 842 * 3 000 South Africa 100 300 110 700 92 700 88 600 76 200 Zambia 497 200 523 400 575 000 697 900 681 600 Zimbabwe 6 700 6 800 3 100 * 3 000 * 5 000 Canada 500 463 453 453 442 050 335 052 319 200 Mexico 303 626 329 746 265 056 213 672 168 861 USA 1 250 300 1 310 800 1 280 300 1 161 200 1 093 400 Argentina * 16 000 * 16 000 * 16 000 * 16 000 * 16 000 Brazil 219 700 219 300 233 800 231 400 261 600 Chile 2 811 300 2 936 500 3 057 600 3 276 600 3 243 900 Peru 507 710 413 907 463 933 423 393 393 638 Burma 19 500 15 100 6 900 9 800 * 12 000 China 3 002 100 3 499 400 3 794 600 4 051 300 4 573 500 India (b) 510 623 501 485 513 640 532 865 * 480 000 Indonesia 217 600 256 900 253 400 284 800 277 500 Iran 200 900 204 300 210 000 210 000 221 100 Japan 1 532 055 1 576 818 1 539 957 1 439 843 1 548 688 Kazakhstan 429 729 408 026 400 270 346 000 323 400 Korea (Rep. of) 561 500 566 400 537 925 531 701 564 600 Korea, Dem. P.R. of * 15 000 * 15 000 * 12 000 * 12 000 * 12 000 Laos 60 803 62 541 64 075 67 562 64 241 Mongolia 2 618 3 007 2 587 2 470 2 746 Oman 20 710 13 940 11 906 11 830 8 815 Philippines 181 000 160 200 174 600 178 000 171 900 Thailand 27 050 12 714 438 490 529 Uzbekistan 92 800 89 600 70 400 82 500 * 82 500 Vietnam — — 2 200 6 000 8 000 Australia 429 000 442 000 503 000 446 000 424 000 World Total 17 200 000 17 700 000 18 200 000 18 300 000 19 000 000
Note(s) (1) Figures relate to both primary and secondary refined copper, whether electrolytic or fire refined. Metal recovered from secondary
materials by remelting alone is excluded (2) In addition to the countries listed, Albania and Colombia produce refined copper (a) Years ended 30 June of that stated (b) Years ended 31 March following that stated

22
Production of diamond carats
Country 2006 2007 2008 2009 2010 Russia 38 360 810 38 291 200 36 925 150 34 759 400 34 856 600 Angola 9 175 061 9 701 709 8 906 974 13 827 609 8 362 139 Botswana 34 293 401 33 639 000 32 595 000 17 734 000 27 556 000 Cameroon (a) * 12 000 * 12 000 * 12 000 * 12 000 * 12 000 Central African Republic 419 528 467 711 372 754 310 469 301 558 Congo ... 22 000 110 000 68 000 381 242 Congo, Democratic Republic 28 990 241 28 452 496 33 401 928 21 298 459 20 166 220 Ghana 959 405 839 235 598 042 354 443 308 679 Guinea 473 862 1 018 723 3 098 490 696 732 374 096 Ivory Coast * 300 000 * 300 000 * 300 000 * 300 000 * 300 000 Lesotho 231 325 229 077 253 054 91 816 108 827 Liberia 11 000 21 699 46 963 36 828 25 357 Namibia 2 356 285 2 266 100 2 435 195 939 916 1 475 610 Sierra Leone 582 324 603 698 371 290 400 480 437 552 South Africa 15 152 801 15 247 122 12 901 018 6 118 974 8 868 389 Tanzania 272 204 282 786 237 676 181 874 82 028 Togo 25 368 13 452 8 787 125 96 Zimbabwe 1 046 025 695 016 797 198 963 502 8 435 224 Canada 13 233 813 17 007 850 14 802 699 10 946 098 11 773 000 Brazil 181 350 182 031 80 226 21 153 25 394 Guyana 340 544 268 925 168 926 143 982 49 920 Venezuela 27 598 14 502 9 381 7 730 2 099 China * 1 065 000 * 1 070 000 * 1 100 000 * 1 100 000 * 1 100 000 India (b) 2 180 586 536 16 810 * 26 400 Indonesia 46 856 22 980 27 688 — — Australia 29 308 000 19 231 000 15 670 000 10 795 000 9 998 000 World Total 176 900 000 169 900 000 165 200 000 121 100 000 135 000 000
Note(s) (1) This table does not show production of synthetic diamond (2) So far as possible the amounts shown include estimates for illegal production (a) Including artisanal production (b) Years ended 31 March following that stated

23
Production of diatomite tonnes (metric)
Country 2006 2007 2008 2009 2010 Commonwealth of Independent States (a) * 80 000 * 80 000 * 80 000 * 80 000 * 80 000 Czech Republic 53 000 19 000 31 000 — 32 000 Denmark Moler (b) 196 000 201 000 210 000 168 000 166 000 France * 75 000 * 75 000 * 75 000 75 000 75 000 Hungary 495 1 424 — 1 277 1 200 Poland 600 600 600 670 500 Romania 1 719 2 057 — — — Spain (c) 52 123 45 480 46 192 29 194 64 346 Algeria 1 800 1 902 1 677 1 847 2 231 Ethiopia (d) — — — 4 104 4 000 Kenya 185 201 72 231 * 200 Mozambique ... 651 379 380 * 400 Costa Rica 26 000 25 000 24 000 24 500 23 500 Mexico 62 948 82 519 128 536 80 807 91 710 USA (e) 799 000 687 000 764 000 575 000 595 000 Argentina 38 543 49 604 36 996 62 270 * 50 000 Brazil 8 968 9 600 12 100 7 500 * 7 500 Chile 19 104 25 405 25 497 23 027 30 925 Peru * 35 000 21 603 12 200 9 946 18 886 China * 420 000 * 420 000 * 440 000 * 440 000 * 400 000 Iran (f) 13 400 300 2 000 — * — Japan * 130 000 * 120 000 * 115 000 * 110 000 * 110 000 Korea (Rep. of) 3 460 2 360 2 540 2 440 2 200 Saudi Arabia * 1 000 * 1 000 * 1 000 * 1 000 * 1 000 Thailand 1 344 1 260 4 075 5 600 7 100 Vietnam * 10 000 * 10 000 * 10 000 * 10 000 * 10 000 Australia (g) * 34 300 * 33 600 * 21 200 * 13 900 * 13 600 New Zealand — — — 10 95 World Total 2 064 000 1 917 000 2 044 000 1 727 000 1 787 000
Note(s) (1) In addition to the countries listed, Egypt and Turkey are believed to produce diatomite (a) Diatomite is produced in Armenia, Georgia and Russia but information is not available to provide estimates for individual countries (b) Moler is an impure diatomite containing a large proportion of clay (c) Including Tripoli (d) Years ended 7 July of that stated (e) Sold or used by producers (f) Years ended 20 March following that stated (g) Years ended 30 June of that stated
Production of feldspar tonnes (metric)
Country 2006 2007 2008 2009 2010 Bulgaria 93 091 * 90 000 * 90 000 * 80 000 * 80 000 Czech Republic 487 000 514 000 488 000 431 000 388 000 Finland 43 187 48 980 45 250 * 45 000 * 45 000 France * 650 000 * 650 000 * 650 000 650 000 650 000 Germany 167 332 171 303 161 416 140 000 * 150 000 Greece * 100 000 95 000 62 000 55 737 23 050 Italy 4 600 903 3 524 389 4 727 000 * 4 700 000 * 4 700 000 Macedonia 38 124 32 814 28 920 19 377 * 19 000 Norway 65 000 65 000 62 000 48 000 56 000

24
Production of feldspar tonnes (metric)
Country 2006 2007 2008 2009 2010 Poland 431 300 497 900 599 100 445 500 391 900 Portugal 257 570 371 952 230 426 362 392 121 827 Romania 33 100 41 477 22 995 14 317 6 049 Russia * 160 000 * 160 000 * 160 000 * 160 000 * 160 000 Serbia * 3 500 * 3 500 * 3 500 * 3 500 * 3 500 Slovakia 3 000 — 10 000 13 000 — Spain 696 912 683 134 690 256 597 496 691 894 Sweden 24 000 25 000 22 000 18 000 22 000 Turkey 5 500 000 6 000 000 6 500 000 4 000 000 5 200 000 Ukraine 67 313 76 305 83 420 84 757 146 016 United Kingdom (a)(b) 1 441 1 112 430 — — Algeria 65 615 83 208 115 938 131 046 163 939 Egypt * 360 000 135 290 168 673 353 700 405 600 Ethiopia 500 566 523 199 * 200 Morocco * 34 000 37 955 30 080 * 30 000 * 30 000 Nigeria 1 021 ... ... 13 631 1 616 South Africa 76 722 90 312 105 815 101 394 95 434 Sudan — — — — 923 720 Cuba 5 500 5 600 4 300 4 700 2 800 Guatemala 17 176 10 480 45 854 5 672 15 720 Mexico 459 209 438 696 445 519 347 510 398 849 USA 760 000 730 000 680 000 550 000 * 570 000 Argentina 170 728 291 562 220 234 213 671 * 220 000 Brazil 166 418 166 000 122 000 115 000 * 120 000 Chile 5 847 6 704 17 834 9 079 7 723 Colombia * 100 000 * 100 000 * 100 000 * 100 000 * 100 000 Ecuador 67 844 14 307 * 14 000 * 10 000 * 10 000 Peru 9 287 15 450 13 333 5 154 5 088 Uruguay 2 470 2 050 1 920 910 * 900 Venezuela * 200 000 222 000 96 783 100 451 57 760 China * 2 350 000 * 2 400 000 * 2 400 000 * 2 400 000 * 2 400 000 India (c) 479 715 488 458 531 689 455 549 * 445 000 Indonesia * 25 000 * 25 000 * 26 000 * 26 000 * 26 000 Iran (d) 411 807 512 261 501 821 634 503 * 635 000 Japan (b) * 800 000 * 750 000 * 700 000 * 700 000 * 700 000 Jordan 11 054 9 800 2 950 — — Korea (Rep. of) 427 378 398 513 344 257 622 770 496 511 Malaysia 142 358 358 585 457 377 410 053 438 846 Pakistan (e) 22 435 26 120 18 737 37 881 54 198 Philippines 15 176 14 837 15 838 16 394 15 882 Saudi Arabia 46 700 73 000 55 000 55 000 * 55 000 Sri Lanka 56 864 46 583 55 212 73 365 75 405 Taiwan — — 4 379 — 20 Thailand 1 067 684 684 668 670 618 718 692 641 900 Uzbekistan * 4 300 * 4 300 * 4 300 * 4 300 * 4 300 Vietnam * 200 000 * 200 000 * 200 000 * 200 000 * 200 000 Australia (e) * 100 000 * 105 000 * 102 000 * 100 000 * 103 000 World Total 22 086 000 21 499 000 22 910 000 20 415 000 22 275 000
Note(s) (1) In addition to the countries listed, Slovakia is believed to produce feldspar (a) China stone (b) Including weathered granite feldspar (c) Years ended 31 March following that stated (d) Years ended 20 March following that stated (e) Years ended 30 June of that stated
25
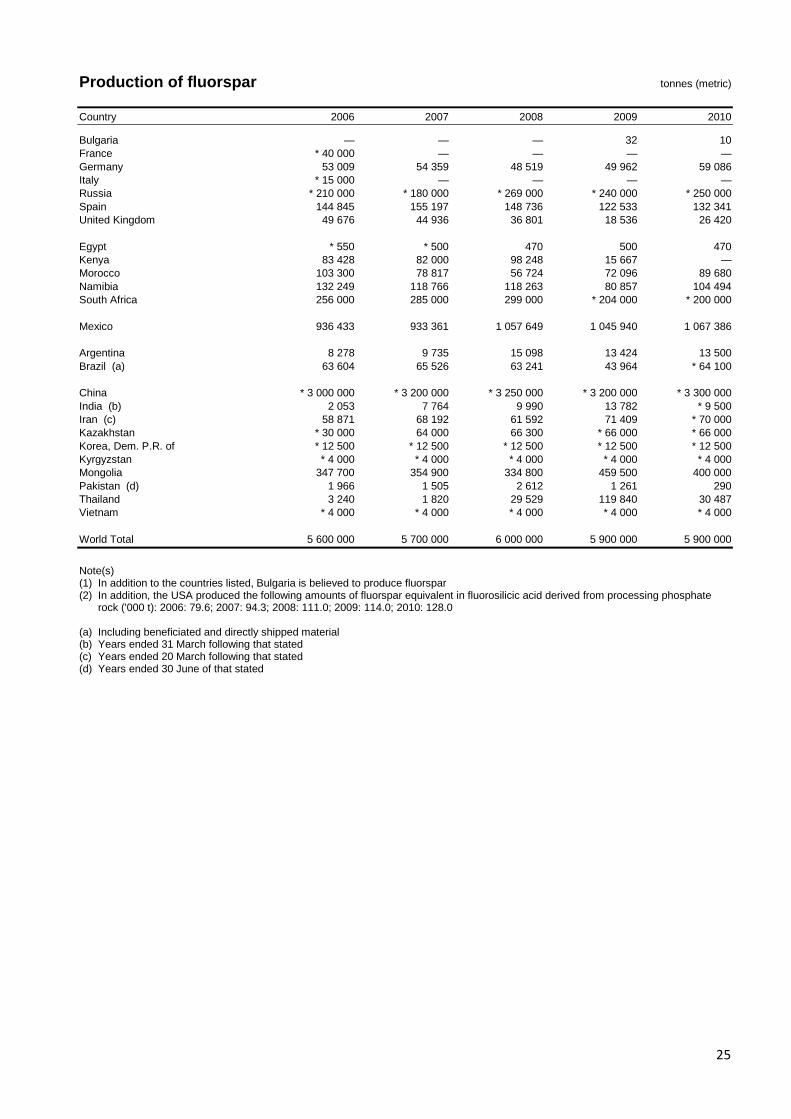
Production of fluorspar tonnes (metric)
Country 2006 2007 2008 2009 2010 Bulgaria — — — 32 10 France * 40 000 — — — — Germany 53 009 54 359 48 519 49 962 59 086 Italy * 15 000 — — — — Russia * 210 000 * 180 000 * 269 000 * 240 000 * 250 000 Spain 144 845 155 197 148 736 122 533 132 341 United Kingdom 49 676 44 936 36 801 18 536 26 420 Egypt * 550 * 500 470 500 470 Kenya 83 428 82 000 98 248 15 667 — Morocco 103 300 78 817 56 724 72 096 89 680 Namibia 132 249 118 766 118 263 80 857 104 494 South Africa 256 000 285 000 299 000 * 204 000 * 200 000 Mexico 936 433 933 361 1 057 649 1 045 940 1 067 386 Argentina 8 278 9 735 15 098 13 424 13 500 Brazil (a) 63 604 65 526 63 241 43 964 * 64 100 China * 3 000 000 * 3 200 000 * 3 250 000 * 3 200 000 * 3 300 000 India (b) 2 053 7 764 9 990 13 782 * 9 500 Iran (c) 58 871 68 192 61 592 71 409 * 70 000 Kazakhstan * 30 000 64 000 66 300 * 66 000 * 66 000 Korea, Dem. P.R. of * 12 500 * 12 500 * 12 500 * 12 500 * 12 500 Kyrgyzstan * 4 000 * 4 000 * 4 000 * 4 000 * 4 000 Mongolia 347 700 354 900 334 800 459 500 400 000 Pakistan (d) 1 966 1 505 2 612 1 261 290 Thailand 3 240 1 820 29 529 119 840 30 487 Vietnam * 4 000 * 4 000 * 4 000 * 4 000 * 4 000 World Total 5 600 000 5 700 000 6 000 000 5 900 000 5 900 000
Note(s) (1) In addition to the countries listed, Bulgaria is believed to produce fluorspar (2) In addition, the USA produced the following amounts of fluorspar equivalent in fluorosilicic acid derived from processing phosphate
rock ('000 t): 2006: 79.6; 2007: 94.3; 2008: 111.0; 2009: 114.0; 2010: 128.0 (a) Including beneficiated and directly shipped material (b) Years ended 31 March following that stated (c) Years ended 20 March following that stated (d) Years ended 30 June of that stated

26
Production of primary gallium
Accurate data for gallium is difficult to obtain because it is produced only as a by-product of bauxite or zinc processing using proprietary techniques and the few producers do not report production figures. The United States Geological Survey estimates total world primary production as: 2006, 80 tonnes; 2007, 80 tonnes; 2008, 95 tonnes; 2009, 78 tonnes and 2010, 106 tonnes. However, in the 8th edition of their report on Gallium, Roskill Information Services estimated 2010 world primary production to be between 206 and 209 tonnes. Producing countries, in decreasing order of production level, are believed to be China, Germany, Kazakhstan, Ukraine, Republic of Korea, Russia, Hungary and Japan.
Production of germanium metal tonnes (metric)
Country 2006 2007 2008 2009 2010 USA (a) 5 5 5 5 * 5 China * 100 * 100 * 100 * 100 * 100 Japan 2 1 ... ... ...
Other countries * 30 * 45 * 35 * 15 * 15
Note(s) (1) Germanium is also believed to be recovered from imported or domestic material in Belgium, Canada, Russia and Ukraine (a) Including production of secondary metal

27
Mine production of gold kilograms
Country 2006 2007 2008 2009 2010 Armenia 867 565 * 565 682 1 033 Azerbaijan — — — 333 2 093 Bulgaria 3 818 3 964 4 160 4 482 4 489 Finland 1 307 1 639 1 336 3 808 5 644 Georgia 2 400 3 100 * 3 100 * 3 100 * 3 100 Greenland 2 324 1 835 1 648 — — Poland (a) 1 700 883 902 814 784 Romania * 500 * 500 * 500 * 500 * 500 Russia 159 340 156 912 184 488 205 236 201 300 Serbia (a) * 330 * 330 * 330 * 450 722 Slovakia 84 92 198 346 534 Spain 1 565 — — — — Sweden 6 848 5 159 4 953 5 542 6 285 Turkey 8 040 9 920 11 120 14 450 16 400 United Kingdom — 88 163 187 177 Algeria 377 236 647 998 723 Botswana 3 020 2 722 3 176 1 626 1 773 Burkina Faso 1 571 2 250 7 633 13 181 22 504 Burundi 4 313 2 423 2 170 972 * 900 Cameroon * 600 * 600 * 600 * 600 * 600 Chad * 150 * 150 * 100 * 100 * 100 Congo, Democratic Republic 10 300 5 100 3 300 2 000 3 000 Egypt — — — — 4 363 Equatorial Guinea * 200 * 200 * 200 * 200 * 200 Ethiopia (b) 3 828 * 3 300 3 631 4 005 * 4 200 Gabon * 300 * 300 * 300 * 300 * 300 Ghana 72 323 83 558 80 503 91 143 92 380 Guinea 16 364 15 303 17 981 21 402 24 836 Ivory Coast 1 323 1 243 4 205 6 947 5 316 Kenya (c) 432 3 023 340 1 055 * 2 000 Liberia 9 311 624 524 800 Mali 58 382 52 753 41 160 42 364 38 524 Mauritania 322 2 332 5 528 6 773 8 328 Morocco (a) 1 300 771 587 470 650 Mozambique 85 97 298 511 520 Namibia 2 790 2 488 2 115 2 057 2 683 Niger 2 615 3 427 2 314 2 067 1 929 Nigeria 40 180 2 890 1 350 3 718 Senegal * 600 * 600 * 600 5 655 5 354 Sierra Leone 71 212 196 157 270 South Africa 272 128 252 345 212 744 197 628 188 701 Sudan 3 246 2 701 2 251 1 922 2 129 Tanzania 39 750 40 193 36 434 39 113 39 448 Togo 7 184 10 159 11 835 12 955 * 13 000 Uganda (c) 2 192 2 543 2 055 931 918 Zambia (d) 964 1 269 1 693 3 108 3 410 Zimbabwe 11 354 7 018 3 579 4 966 9 620 Canada 104 448 102 377 96 501 97 235 98 297 Costa Rica 1 850 1 221 * 154 * 205 * 300 Dominican Republic — — 44 375 473 Guatemala 5 036 7 100 7 448 8 484 9 213 Honduras 4 055 3 012 1 846 2 127 2 200 Mexico 35 899 39 355 50 365 62 439 79 376 Nicaragua 3 395 3 330 2 960 2 590 4 880 Panama — — — 800 * 1 300 USA 251 853 238 136 233 327 223 323 228 000 Argentina 44 131 42 021 42 046 46 588 58 079 Bolivia 9 628 8 818 8 431 7 217 6 400 Brazil 40 075 49 600 54 000 56 100 57 900 Chile 42 100 41 528 39 162 40 834 39 494 Colombia 15 683 15 483 34 321 47 838 53 606 Ecuador 5 338 3 186 840 * 840 369 French Guiana 3 083 2 844 1 941 1 250 * 1 250 Guyana 6 405 7 412 8 131 9 326 8 744

28
Mine production of gold kilograms
Country 2006 2007 2008 2009 2010 Peru 202 822 170 128 179 870 182 390 148 920 Suriname 10 426 8 585 10 290 12 800 12 933 Uruguay * 2 800 3 172 2 429 2 010 1 704 Venezuela 11 600 11 809 10 815 12 232 6 991 Burma (a) * 100 * 100 * 100 * 100 * 100 China (a) 247 500 275 000 285 000 313 980 340 880 India (e) 2 488 2 969 2 438 2 106 * 2 160 Indonesia 85 411 117 854 64 390 127 716 104 535 Iran (a) 850 850 * 850 * 850 * 850 Japan 8 904 8 869 6 868 7 708 8 544 Kazakhstan (a) 22 564 21 824 20 825 22 525 29 941 Korea (Rep. of) 277 162 175 274 235 Kyrgyzstan 10 301 10 559 18 132 17 130 18 464 Laos 6 068 4 161 4 333 5 021 5 138 Malaysia 3 496 2 913 2 490 2 794 3 765 Mongolia 21 267 17 473 15 184 9 803 6 037 Oman 358 248 118 93 82 Philippines 36 141 38 792 35 568 37 047 40 847 Saudi Arabia 5 182 4 438 4 527 4 857 4 477 Taiwan 2 3 4 34 111 Tajikistan 1 920 2 000 1 672 1 361 2 049 Thailand 3 470 3 401 2 721 5 400 5 300 Uzbekistan 76 620 72 850 * 73 000 * 73 000 * 73 000 Vietnam * 3 000 * 3 000 * 3 000 * 3 000 * 3 000 Australia 247 000 247 000 215 000 223 000 260 000 Fiji 1 403 29 700 1 091 1 903 New Zealand 10 618 8 833 13 403 13 442 13 469 Papua New Guinea 58 349 57 549 67 466 68 173 66 901 Solomon Islands 20 93 141 130 130 World Total 2 360 000 2 350 000 2 290 000 2 464 000 2 540 000
Note(s) (1) In several countries substantial amounts of gold produced in small operations are not recorded in the official statistics used when
compiling this table (2) In addition to the countries listed, Benin, Central African Republic, Congo, Eritrea, Madagascar and Rwanda produce less than 100 kg
gold per year (3) Greece and Norway are believed to produce gold (a) Metal production (b) Years ended 7 July of that stated (c) Exports (d) Contained in blister copper, refinery muds and electrolytic copper (e) Years ended 31 March following that stated

29
Production of graphite tonnes (metric)
Country 2006 2007 2008 2009 2010 Austria (a) — — 250 750 420 Bosnia & Herzegovina ... ... 272 084 133 819 45 079 Czech Republic 5 000 3 000 3 000 — — Norway 9 000 3 000 4 100 4 562 6 270 Romania — — — 24 352 6 633 Russia * 14 000 * 14 000 * 14 000 * 14 000 * 14 000 Turkey — — 3 236 2 400 * 2 000 Ukraine 5 800 * 8 000 * 8 000 * 8 000 * 8 000 Madagascar 5 500 5 400 4 900 3 400 3 800 Zimbabwe 6 588 5 418 5 134 2 463 988 Canada 15 000 15 000 20 000 * 7 000 * 20 000 Mexico 11 773 9 900 7 229 5 105 6 628 Brazil (b) 76 194 77 163 80 500 59 400 84 000 China (c) 1 730 000 1 800 000 * 1 800 000 * 1 800 000 * 1 800 000 India (a)(d) 162 293 170 813 117 767 108 606 * 98 800 Korea (Rep. of) 68 52 73 48 34 Korea, Dem. P.R. of * 30 000 * 30 000 * 30 000 * 30 000 * 30 000 Sri Lanka 5 756 9 593 6 615 3 171 3 437 World Total 2 100 000 2 200 000 2 400 000 2 200 000 2 100 000
Note(s) (1) This table includes all forms of amorphous and crystalline graphite but excludes synthetic material (2) In addition to the countries listed, Egypt, Namibia and the USA are believed to produce graphite (a) Crude (b) Including beneficiated and directly shipped material (c) Including flake graphite (d) Years ended 31 March following that stated

30
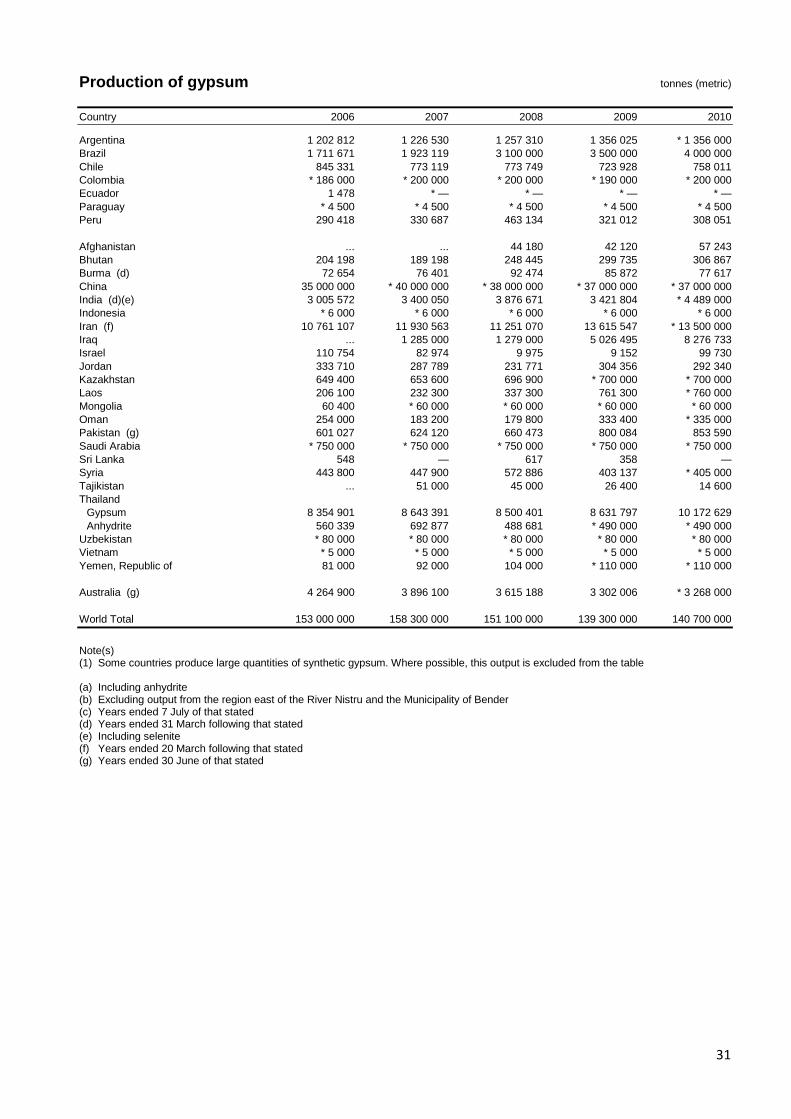
Production of gypsum tonnes (metric)
Country 2006 2007 2008 2009 2010 Armenia 43 700 54 600 45 900 40 100 * 40 000 Austria Gypsum 936 072 1 006 416 1 022 983 (a) 910 945 (a) 872 273 Anhydrite 135 380 57 428 64 276 ... ... Azerbaijan 35 034 22 037 27 898 44 413 48 887 Bosnia & Herzegovina (a) 131 936 154 294 150 039 74 302 64 570 Bulgaria 215 800 234 300 21 200 127 600 109 200 Croatia 170 351 170 721 * 250 000 318 139 248 675 Cyprus 270 000 330 000 412 000 317 000 333 000 Czech Republic 16 000 66 000 35 000 13 000 5 000 France (a) * 4 800 000 * 4 800 000 2 339 380 3 351 339 4 500 000 Georgia 123 ... — ... ... Germany (a) 1 771 000 1 898 000 2 112 000 1 898 000 1 822 000 Greece 900 000 836 967 (a) 1 000 000 (a) 730 000 (a)* 600 000 Hungary (a) 30 000 26 000 15 940 19 766 20 000 Ireland, Republic of * 700 000 * 700 000 * 600 000 * 400 000 * 300 000 Italy * 1 600 000 * 1 600 000 * 1 600 000 * 1 600 000 * 1 600 000 Latvia (a) 330 000 346 000 349 000 175 870 176 510 Macedonia 267 760 255 500 242 400 154 550 * 150 000 Moldova (b) 725 900 * 800 000 * 700 000 * 200 000 * 300 000 Poland Gypsum 1 172 000 1 298 000 1 283 000 1 119 000 (a) 1 398 492 Anhydrite 181 000 194 000 198 000 158 000 ... Portugal 366 599 418 035 372 731 335 189 256 177 Romania 615 072 1 004 150 832 248 720 713 639 010 Russia * 2 600 000 * 3 000 000 * 3 600 000 * 2 900 000 * 2 900 000 Serbia * 42 000 * 42 000 * 42 000 * 42 000 * 42 000 Slovakia (a) 126 200 151 000 152 000 131 000 87 000 Spain 14 596 559 14 535 422 11 955 753 8 181 315 * 6 000 000 Switzerland * 250 000 * 250 000 * 250 000 * 250 000 * 250 000 Turkey 4 369 771 3 241 177 7 338 127 4 369 589 * 4 400 000 Ukraine 375 900 741 580 1 160 910 711 490 678 610 United Kingdom * 1 700 000 * 1 700 000 * 1 700 000 * 1 700 000 * 1 700 000 Algeria 1 033 107 1 198 303 1 671 651 1 756 781 1 609 605 Angola — — — 120 000 200 000 Egypt (a) * 3 300 000 3 085 000 2 400 000 1 035 300 84 000 Eritrea 634 874 * 800 * 800 * 800 Ethiopia (c) 38 809 29 886 32 989 * 30 000 * 30 000 Kenya * 9 100 * 9 600 * 9 000 * 9 000 * 9 000 Libya * 200 000 * 240 000 * 260 000 * 300 000 * 300 000 Madagascar 500 500 * 500 156 127 Mauritania 45 222 49 229 44 428 36 928 65 245 Morocco * 600 000 * 600 000 * 600 000 * 600 000 * 600 000 Niger 13 043 4 615 8 661 19 737 7 559 Nigeria 169 370 579 000 * 380 000 * 160 000 — Somalia * 1 500 * 1 500 * 1 500 * 1 500 * 1 500 South Africa 554 020 643 630 571 343 597 571 513 310 Sudan 7 000 7 974 12 705 30 000 31 000 Tanzania 32 798 2 730 55 730 8 105 26 918 Tunisia 151 000 157 000 177 000 360 000 * 360 000 Uganda 121 168 84 * 100 * 100 Canada (a) 9 072 000 7 638 000 5 797 000 3 540 000 2 717 000 Cuba 72 500 80 200 110 000 77 800 111 300 Dominican Republic 354 241 320 683 369 592 77 201 * 77 000 El Salvador * 6 000 * 6 000 * 6 000 * 6 000 * 6 000 Guatemala 226 800 495 335 127 387 18 733 58 924 Honduras * 5 500 * 5 500 * 5 500 * 5 500 * 5 500 Jamaica 364 432 227 697 238 274 156 877 147 143 Mexico 6 075 893 6 918 973 6 933 279 7 542 721 6 477 590 Nicaragua 42 191 43 300 49 900 37 400 20 300 USA 21 100 000 17 900 000 14 400 000 9 400 000 * 9 000 000
31
Production of gypsum tonnes (metric)
Country 2006 2007 2008 2009 2010 Argentina 1 202 812 1 226 530 1 257 310 1 356 025 * 1 356 000 Brazil 1 711 671 1 923 119 3 100 000 3 500 000 4 000 000 Chile 845 331 773 119 773 749 723 928 758 011 Colombia * 186 000 * 200 000 * 200 000 * 190 000 * 200 000 Ecuador 1 478 * — * — * — * — Paraguay * 4 500 * 4 500 * 4 500 * 4 500 * 4 500 Peru 290 418 330 687 463 134 321 012 308 051 Afghanistan ... ... 44 180 42 120 57 243 Bhutan 204 198 189 198 248 445 299 735 306 867 Burma (d) 72 654 76 401 92 474 85 872 77 617 China 35 000 000 * 40 000 000 * 38 000 000 * 37 000 000 * 37 000 000 India (d)(e) 3 005 572 3 400 050 3 876 671 3 421 804 * 4 489 000 Indonesia * 6 000 * 6 000 * 6 000 * 6 000 * 6 000 Iran (f) 10 761 107 11 930 563 11 251 070 13 615 547 * 13 500 000 Iraq ... 1 285 000 1 279 000 5 026 495 8 276 733 Israel 110 754 82 974 9 975 9 152 99 730 Jordan 333 710 287 789 231 771 304 356 292 340 Kazakhstan 649 400 653 600 696 900 * 700 000 * 700 000 Laos 206 100 232 300 337 300 761 300 * 760 000 Mongolia 60 400 * 60 000 * 60 000 * 60 000 * 60 000 Oman 254 000 183 200 179 800 333 400 * 335 000 Pakistan (g) 601 027 624 120 660 473 800 084 853 590 Saudi Arabia * 750 000 * 750 000 * 750 000 * 750 000 * 750 000 Sri Lanka 548 — 617 358 — Syria 443 800 447 900 572 886 403 137 * 405 000 Tajikistan ... 51 000 45 000 26 400 14 600 Thailand Gypsum 8 354 901 8 643 391 8 500 401 8 631 797 10 172 629 Anhydrite 560 339 692 877 488 681 * 490 000 * 490 000 Uzbekistan * 80 000 * 80 000 * 80 000 * 80 000 * 80 000 Vietnam * 5 000 * 5 000 * 5 000 * 5 000 * 5 000 Yemen, Republic of 81 000 92 000 104 000 * 110 000 * 110 000 Australia (g) 4 264 900 3 896 100 3 615 188 3 302 006 * 3 268 000 World Total 153 000 000 158 300 000 151 100 000 139 300 000 140 700 000
Note(s) (1) Some countries produce large quantities of synthetic gypsum. Where possible, this output is excluded from the table (a) Including anhydrite (b) Excluding output from the region east of the River Nistru and the Municipality of Bender (c) Years ended 7 July of that stated (d) Years ended 31 March following that stated (e) Including selenite (f) Years ended 20 March following that stated (g) Years ended 30 June of that stated

32
Refinery production of indium tonnes (metric)
Country 2006 2007 2008 2009 2010 Belgium * 30 * 30 * 30 * 30 * 30 Germany * 10 * 10 * 10 * 10 * 10 Italy * 5 * 5 * 5 * 5 * 5 Netherlands * 5 * 5 5 * 5 * 5 Russia * 10 * 10 * 10 * 4 * 4 United Kingdom * 5 * 5 * 5 * 5 * 5 Canada * 50 * 50 * 45 * 40 * 35 Brazil ... ... ... * 5 * 5 Peru * 6 * 5 6 * 25 * 25 China * 400 * 370 * 340 * 280 * 300 Japan * 55 * 60 * 65 * 67 * 70 Korea (Rep. of) * 60 * 70 * 75 * 70 * 80
Production of iodine kilograms
Country 2006 2007 2008 2009 2010 Azerbaijan — 21 500 116 400 148 700 191 300 Russia * 105 000 * 105 000 * 105 000 * 105 000 * 105 000 USA * 1 220 000 * 1 200 000 * 1 200 000 * 1 250 000 * 1 250 000 Chile 16 494 000 15 473 000 15 503 000 17 399 000 15 793 000 China * 560 000 * 570 000 * 570 000 * 580 000 * 590 000 Indonesia * 75 000 * 75 000 * 75 000 * 75 000 * 75 000 Japan 8 724 000 9 282 000 9 500 000 8 232 000 9 216 000 Turkmenistan * 270 000 * 270 000 * 270 000 * 270 000 * 270 000 Uzbekistan * 2 000 * 2 000 * 2 000 * 2 000 * 2 000 World Total 27 500 000 27 000 000 27 300 000 28 100 000 27 500 000

33
Production of iron ore tonnes (metric)
Country 2006 2007 2008 2009 2010 Austria (a) 2 092 996 2 152 825 2 032 671 2 002 131 2 068 853 Azerbaijan 11 300 17 600 28 100 — 57 800 Bosnia & Herzegovina 3 439 587 2 943 963 2 667 359 2 727 452 1 401 000 Germany (b)(c) 416 000 421 711 455 100 363 699 390 353 Norway 620 000 630 000 746 000 896 000 3 105 000 Romania 122 684 8 157 — — — Russia 102 000 000 105 000 000 99 900 000 92 000 000 95 500 000 Slovakia 583 000 570 000 392 000 — — Sweden 23 302 000 24 714 000 23 888 000 17 677 000 25 292 000 Turkey 3 251 969 4 549 556 3 990 110 4 169 972 5 188 197 Ukraine 74 000 000 77 930 000 72 688 000 66 452 000 78 541 000 United Kingdom 341 * 300 145 — — Algeria 2 339 637 1 982 101 2 077 000 1 307 000 1 474 279 Egypt * 2 200 000 2 184 729 1 810 606 1 780 162 * 1 800 000 Mauritania 11 155 000 11 815 000 10 968 000 10 275 049 11 109 000 Morocco 35 500 47 958 22 878 30 523 44 665 Nigeria 88 180 57 900 62 000 99 424 50 000 South Africa (d) 41 326 036 42 100 887 48 982 537 55 313 053 58 709 330 Tunisia 217 300 180 600 108 300 151 200 162 300 Uganda — 366 1 740 972 3 795 Zimbabwe 104 459 79 109 2 919 — 37 Canada (e) 34 094 000 33 158 000 32 102 000 31 699 000 37 001 000 Cuba 7 800 3 300 — — — Guatemala 7 341 31 006 452 5 463 1 604 Mexico 14 568 000 16 540 000 17 709 000 17 693 000 21 210 000 USA 52 700 000 52 500 000 53 600 000 26 700 000 49 500 000 Brazil 317 800 229 354 674 378 351 200 000 331 000 000 372 300 000 Chile 8 629 000 8 817 700 9 315 580 8 242 300 9 129 500 Colombia 644 015 623 930 473 273 280 773 77 048 Peru 5 885 000 6 277 000 6 348 000 5 435 000 6 348 000 Venezuela 22 100 000 19 632 456 19 332 299 14 206 621 14 330 761 Bhutan * 5 300 — — — — China 588 171 400 707 073 000 824 011 100 880 171 400 1 071 555 000 India (f) 187 696 000 213 246 000 212 960 000 218 639 000 208 111 000 Indonesia 5 489 — — — — Iran (g) 31 537 545 35 195 000 * 38 200 000 34 034 476 * 34 500 000 Iraq ... 40 000 3 000 — * — Kazakhstan 18 254 900 19 582 200 21 486 300 46 248 000 50 190 000 Korea (Rep. of) 227 437 290 802 365 883 455 405 512 642 Korea, Dem. P.R. of 5 041 000 5 126 000 5 316 000 4 955 000 * 5 000 000 Malaysia (g) 667 082 802 030 981 932 1 470 186 3 465 895 Mongolia 180 000 265 100 1 387 400 1 379 000 3 203 200 Pakistan (h) 131 259 125 879 286 255 320 214 402 224 Thailand 264 289 1 554 860 1 709 750 616 399 976 937 Vietnam * 1 600 000 * 1 200 000 * 1 200 000 * 1 800 000 * 1 900 000 Australia 275 042 000 299 038 000 342 435 000 394 069 000 433 452 000 New Zealand 2 146 496 1 723 726 2 020 227 2 092 640 2 438 641 World Total 1 835 000 000 2 055 000 000 2 213 000 000 2 277 000 000 2 611 000 000
Note(s) (a) Including micaceous iron oxide (b) Including manganiferous iron ore (c) Used as aggregate in the construction industry (d) Including by-product magnetite (e) Including by-product iron ore (f) Years ended 31 March following that stated (g) Years ended 20 March following that stated (h) Years ended 30 June of that stated Production of iron ore
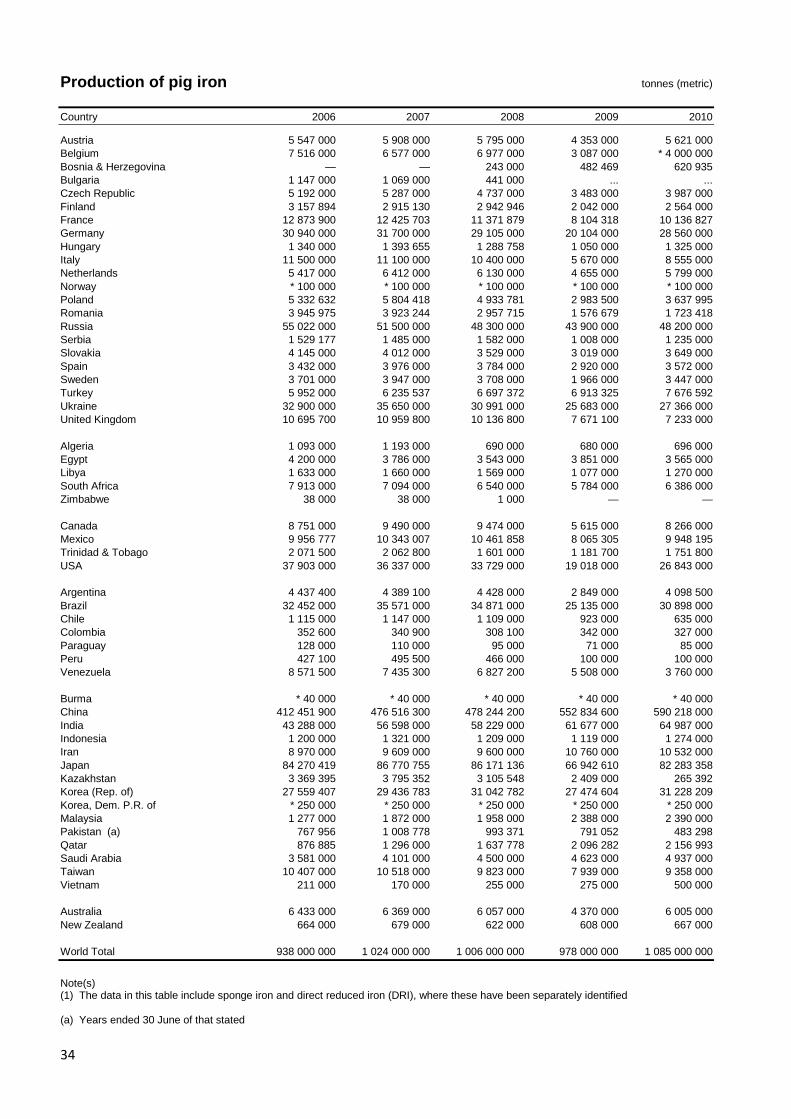
34
Production of pig iron tonnes (metric)
Country 2006 2007 2008 2009 2010 Austria 5 547 000 5 908 000 5 795 000 4 353 000 5 621 000 Belgium 7 516 000 6 577 000 6 977 000 3 087 000 * 4 000 000 Bosnia & Herzegovina — — 243 000 482 469 620 935 Bulgaria 1 147 000 1 069 000 441 000 ... ... Czech Republic 5 192 000 5 287 000 4 737 000 3 483 000 3 987 000 Finland 3 157 894 2 915 130 2 942 946 2 042 000 2 564 000 France 12 873 900 12 425 703 11 371 879 8 104 318 10 136 827 Germany 30 940 000 31 700 000 29 105 000 20 104 000 28 560 000 Hungary 1 340 000 1 393 655 1 288 758 1 050 000 1 325 000 Italy 11 500 000 11 100 000 10 400 000 5 670 000 8 555 000 Netherlands 5 417 000 6 412 000 6 130 000 4 655 000 5 799 000 Norway * 100 000 * 100 000 * 100 000 * 100 000 * 100 000 Poland 5 332 632 5 804 418 4 933 781 2 983 500 3 637 995 Romania 3 945 975 3 923 244 2 957 715 1 576 679 1 723 418 Russia 55 022 000 51 500 000 48 300 000 43 900 000 48 200 000 Serbia 1 529 177 1 485 000 1 582 000 1 008 000 1 235 000 Slovakia 4 145 000 4 012 000 3 529 000 3 019 000 3 649 000 Spain 3 432 000 3 976 000 3 784 000 2 920 000 3 572 000 Sweden 3 701 000 3 947 000 3 708 000 1 966 000 3 447 000 Turkey 5 952 000 6 235 537 6 697 372 6 913 325 7 676 592 Ukraine 32 900 000 35 650 000 30 991 000 25 683 000 27 366 000 United Kingdom 10 695 700 10 959 800 10 136 800 7 671 100 7 233 000 Algeria 1 093 000 1 193 000 690 000 680 000 696 000 Egypt 4 200 000 3 786 000 3 543 000 3 851 000 3 565 000 Libya 1 633 000 1 660 000 1 569 000 1 077 000 1 270 000 South Africa 7 913 000 7 094 000 6 540 000 5 784 000 6 386 000 Zimbabwe 38 000 38 000 1 000 — — Canada 8 751 000 9 490 000 9 474 000 5 615 000 8 266 000 Mexico 9 956 777 10 343 007 10 461 858 8 065 305 9 948 195 Trinidad & Tobago 2 071 500 2 062 800 1 601 000 1 181 700 1 751 800 USA 37 903 000 36 337 000 33 729 000 19 018 000 26 843 000 Argentina 4 437 400 4 389 100 4 428 000 2 849 000 4 098 500 Brazil 32 452 000 35 571 000 34 871 000 25 135 000 30 898 000 Chile 1 115 000 1 147 000 1 109 000 923 000 635 000 Colombia 352 600 340 900 308 100 342 000 327 000 Paraguay 128 000 110 000 95 000 71 000 85 000 Peru 427 100 495 500 466 000 100 000 100 000 Venezuela 8 571 500 7 435 300 6 827 200 5 508 000 3 760 000 Burma * 40 000 * 40 000 * 40 000 * 40 000 * 40 000 China 412 451 900 476 516 300 478 244 200 552 834 600 590 218 000 India 43 288 000 56 598 000 58 229 000 61 677 000 64 987 000 Indonesia 1 200 000 1 321 000 1 209 000 1 119 000 1 274 000 Iran 8 970 000 9 609 000 9 600 000 10 760 000 10 532 000 Japan 84 270 419 86 770 755 86 171 136 66 942 610 82 283 358 Kazakhstan 3 369 395 3 795 352 3 105 548 2 409 000 265 392 Korea (Rep. of) 27 559 407 29 436 783 31 042 782 27 474 604 31 228 209 Korea, Dem. P.R. of * 250 000 * 250 000 * 250 000 * 250 000 * 250 000 Malaysia 1 277 000 1 872 000 1 958 000 2 388 000 2 390 000 Pakistan (a) 767 956 1 008 778 993 371 791 052 483 298 Qatar 876 885 1 296 000 1 637 778 2 096 282 2 156 993 Saudi Arabia 3 581 000 4 101 000 4 500 000 4 623 000 4 937 000 Taiwan 10 407 000 10 518 000 9 823 000 7 939 000 9 358 000 Vietnam 211 000 170 000 255 000 275 000 500 000 Australia 6 433 000 6 369 000 6 057 000 4 370 000 6 005 000 New Zealand 664 000 679 000 622 000 608 000 667 000 World Total 938 000 000 1 024 000 000 1 006 000 000 978 000 000 1 085 000 000
Note(s) (1) The data in this table include sponge iron and direct reduced iron (DRI), where these have been separately identified (a) Years ended 30 June of that stated

35
Production of crude steel tonnes (metric)
Country 2006 2007 2008 2009 2010 Albania 205 534 263 271 300 000 250 000 250 000 Austria 7 129 000 7 577 000 7 594 000 5 662 000 7 206 000 Azerbaijan 335 300 468 000 278 100 150 300 306 500 Belarus 2 135 651 2 214 019 2 478 131 2 329 694 2 530 829 Belgium 11 631 000 10 692 000 10 673 000 5 635 000 7 973 000 Bosnia & Herzegovina 469 122 513 867 587 878 495 150 590 757 Bulgaria 2 102 000 1 909 000 1 330 000 726 000 744 000 Croatia 80 516 76 252 121 759 54 266 103 429 Czech Republic 6 862 000 7 059 000 6 387 000 4 594 000 5 180 000 Finland 5 053 714 4 430 726 4 416 792 3 066 000 4 030 000 France 19 852 125 19 249 862 17 879 161 12 840 108 15 413 577 Germany 47 223 000 48 550 000 45 832 000 32 670 000 43 830 000 Greece 2 416 000 2 554 000 2 477 000 2 000 000 1 821 000 Hungary 2 084 000 2 227 000 2 097 000 1 403 000 1 678 000 Italy 31 624 000 31 506 000 30 590 000 19 848 000 25 750 000 Latvia * 690 000 * 696 000 * 635 000 * 692 000 * 655 000 Luxembourg 2 802 000 2 858 000 2 582 000 2 141 000 2 548 000 Macedonia 326 484 370 317 344 866 299 332 291 000 Moldova (a) 784 000 965 000 885 000 380 000 240 000 Montenegro 193 165 173 849 201 623 90 404 48 272 Netherlands 6 372 000 7 368 000 6 853 000 5 193 000 6 651 000 Norway 684 000 708 000 560 000 595 000 520 000 Poland 9 991 638 10 630 716 9 727 325 7 128 482 7 993 025 Portugal 1 338 000 1 847 000 1 630 000 1 587 000 1 351 000 Romania 6 266 036 6 269 486 5 035 164 2 772 679 3 720 775 Russia 70 800 000 72 400 000 68 700 000 59 200 000 66 300 000 Serbia 1 630 000 1 478 000 1 662 000 1 061 000 1 254 000 Slovakia 5 093 000 5 082 000 4 489 000 3 747 000 4 580 000 Slovenia 628 000 638 000 642 000 430 000 606 000 Spain 18 391 000 18 998 000 18 640 000 14 358 000 16 343 000 Sweden 5 466 100 5 672 900 5 197 600 2 803 700 4 845 600 Switzerland 1 252 000 1 264 000 1 312 000 934 000 1 320 000 Turkey 23 307 523 25 760 889 26 809 050 25 303 741 29 029 789 Ukraine 40 892 000 43 646 655 38 136 117 30 301 844 33 345 586 United Kingdom 13 904 600 14 392 300 13 520 500 10 074 500 9 708 000 Algeria 1 158 000 1 278 000 646 000 543 000 688 000 Egypt 6 045 000 6 224 000 6 198 000 5 541 000 6 676 000 Libya 1 151 000 1 250 000 1 137 000 914 000 825 000 Morocco 314 000 512 000 478 000 479 000 455 000 Nigeria * 100 000 * 100 000 * 100 000 * 100 000 * 100 000 South Africa 9 721 000 9 098 000 8 550 000 7 484 000 7 617 000 Tunisia 67 700 60 900 82 000 155 000 * 150 000 Zimbabwe 24 000 23 000 — — — Canada 15 493 000 15 572 000 14 845 000 9 286 000 13 013 000 Cuba 258 206 263 568 275 584 267 752 279 040 Dominican Republic * 81 000 * 75 000 * 68 000 * 67 000 * 66 000 El Salvador 72 000 73 000 71 000 56 000 51 000 Guatemala 292 000 349 000 250 000 224 000 272 000 Mexico 16 446 939 17 572 676 17 209 020 14 131 810 16 710 184 Trinidad & Tobago 673 000 694 600 489 600 417 000 571 600 USA 98 557 000 98 102 000 91 350 000 58 196 000 80 495 000 Argentina 5 532 700 5 387 600 5 541 400 4 013 000 5 138 500 Brazil 30 901 000 33 782 000 33 716 000 26 506 000 32 928 000 Chile 1 607 000 1 678 000 1 549 000 1 308 000 1 011 000 Colombia 1 211 000 1 245 000 1 053 000 1 053 000 1 213 000 Ecuador 86 400 87 100 128 000 259 000 372 000 Paraguay 115 000 95 000 82 800 54 000 59 000 Peru 896 000 881 000 1 001 000 718 000 880 000 Uruguay 56 700 71 100 85 700 57 000 65 000 Venezuela 4 692 800 5 005 300 4 224 500 3 808 000 2 207 000 Burma * 25 000 * 25 000 * 25 000 * 25 000 * 25 000 China 419 148 500 489 288 000 503 057 500 572 182 300 626 959 000 India 49 450 000 53 468 000 57 791 000 63 527 000 68 321 000 Indonesia 3 759 000 4 160 000 3 915 000 3 501 000 3 664 000

36
Production of crude steel tonnes (metric)
Country 2006 2007 2008 2009 2010 Iran 9 789 000 10 051 000 9 964 000 10 873 000 11 995 000 Israel * 300 000 * 300 000 * 300 000 * 300 000 * 300 000 Japan 116 226 201 120 202 937 118 739 328 87 534 137 109 598 507 Jordan * 150 000 * 150 000 * 150 000 * 150 000 * 150 000 Kazakhstan 4 244 521 4 784 105 4 243 582 4 146 000 4 220 000 Korea (Rep. of) 48 455 454 51 517 309 53 322 000 48 572 000 58 912 000 Korea, Dem. P.R. of * 300 000 * 300 000 * 300 000 * 250 000 * 250 000 Kuwait * 500 000 * 500 000 * 500 000 * 500 000 * 500 000 Malaysia 5 834 000 6 895 000 6 423 000 5 354 000 5 694 000 Mongolia * 35 000 * 35 000 * 35 000 * 35 000 * 35 000 Pakistan 1 040 000 1 090 000 1 000 000 * 800 000 * 800 000 Philippines 558 000 718 000 711 000 824 000 825 000 Qatar 1 039 220 1 174 917 1 434 652 1 472 612 1 974 937 Saudi Arabia 3 974 000 4 644 000 4 667 000 4 690 000 5 015 000 Singapore 607 000 640 000 764 000 664 000 728 000 Syria * 70 000 * 70 000 * 70 000 * 70 000 * 70 000 Taiwan 20 000 000 20 903 000 19 882 000 15 873 000 19 755 000 Thailand 4 914 000 5 565 000 5 211 000 3 646 000 4 145 000 United Arab Emirates * 90 000 * 90 000 * 90 000 * 90 000 * 90 000 Uzbekistan 730 000 649 000 682 000 716 000 716 000 Vietnam 1 869 000 2 024 000 2 250 000 2 700 000 4 314 000 Australia 7 937 000 8 057 000 7 724 000 5 135 000 7 296 000 New Zealand 810 000 845 000 799 000 765 000 853 000 World Total 1 247 000 000 1 348 000 000 1 334 000 000 1 231 000 000 1 418 000 000
Note(s) (1) Unless otherwise indicated, these figures include production from scrap (2) Small amounts of steel are believed to be produced in DR Congo, Estonia, Ghana, Kenya, Mauritania, Sri Lanka and Uganda (a) Production from the region east of the River Nistru

37
Production of ferro-alloys tonnes (metric)
Country 2006 2007 2008 2009 2010 Albania Ferro-chrome 13 230 920 16 310 14 000 17 000 Armenia Ferro-molybdenum * 4 900 5 977 5 323 5 154 5 126 Austria Ferro-molybdenum 5 000 5 000 4 500 4 000 4 000 Ferro-nickel 2 500 3 000 2 000 2 500 2 500 Ferro-vanadium 6 250 6 500 6 300 6 200 8 000 Bulgaria Ferro-silicon * 10 000 * 10 000 6 260 * 2 600 * 2 000 Czech Republic Ferro-vanadium * 2 800 * 1 700 * 2 800 * 1 900 * 3 400 Finland Ferro-chrome 243 350 241 760 233 550 123 310 238 000 France Ferro-manganese & spiegeleisen 139 533 98 066 * 100 000 * 100 000 * 100 000 Ferro-silico-manganese 63 300 * 65 400 * 60 200 * 54 100 * 54 000 Ferro-silicon * 67 000 * 71 000 * 25 000 * 25 000 * 25 000 Silicon metal * 85 000 * 85 000 * 85 000 * 51 000 * 51 000 Georgia Ferro-manganese 5 130 * 5 000 * 5 000 * 4 500 * 4 500 Ferro-silico-manganese 116 945 107 986 123 468 112 016 203 464 Germany Ferro-chrome 26 710 22 030 26 960 13 667 ... Other ferro-alloys * 24 100 * 5 000 * 5 000 — — Silicon metal 29 865 29 379 29 092 27 620 30 105 Greece Ferro-nickel * 89 000 93 300 83 200 41 300 * 40 000 Iceland Ferro-silicon 113 798 114 886 107 882 112 992 114 230 Italy Ferro-manganese * 30 000 * 30 000 * 30 000 * 20 000 * 25 000 Ferro-silico-manganese 96 600 87 000 87 000 56 000 108 000 Macedonia Ferro-nickel 10 942 15 321 15 026 12 000 * 11 000 Ferro-silicon 59 023 78 892 97 605 7 657 ... Norway Ferro-manganese * 130 000 * 130 000 * 130 000 * 130 000 * 130 000 Ferro-silico-manganese 325 708 293 699 273 485 * 250 000 * 250 000 Ferro-silicon 123 819 170 024 185 344 233 974 * 235 000 Other ferro-alloys * 60 000 * 62 000 * 60 000 * 60 000 * 60 000 Silicon metal * 150 000 * 140 000 * 155 000 * 150 000 * 150 000 Poland Ferro-manganese 4 089 2 093 8 475 1 736 762 Ferro-silico-manganese 3 310 15 590 25 061 72 112 Ferro-silicon 13 034 58 538 56 031 9 673 53 206 Other ferro-alloys 4 488 6 255 2 948 4 190 197 Romania Ferro-chrome — — 6 179 15 377 14 353 Ferro-manganese 3 777 — — — — Ferro-silico-manganese 66 476 26 868 9 979 — 20 605 Russia Pig iron & spiegeleisen 7 500 7 136 7 000 5 000 * 6 000 Spiegeleisen * 7 000 * 7 000 * 7 000 * 7 000 * 7 000 Ferro-chrome 500 837 564 474 475 686 235 600 ... Ferro-silico-chrome 92 404 97 915 72 050 8 285 ... Ferro-manganese * 130 000 * 120 000 * 110 000 * 110 000 * 110 000 Ferro-silico-manganese * 40 000 * 40 000 * 40 000 * 40 000 * 40 000 Ferro-nickel * 29 085 * 26 031 * 39 503 * 40 000 * 40 000 Ferro-silicon 882 300 896 100 * 850 000 * 850 000 * 850 000 Other ferro-alloys * 33 000 * 34 000 * 34 000 * 34 000 * 34 000 Silicon metal * 58 000 * 54 500 * 54 000 * 54 000 * 54 000 Slovakia Ferro-chrome 19 — — — — Ferro-silico-manganese 59 128 71 587 59 940 32 000 ... Ferro-silicon 16 155 8 583 10 844 4 600 ... Other ferro-alloys 65 498 74 065 61 194 22 250 ...

38
Production of ferro-alloys tonnes (metric)
Country 2006 2007 2008 2009 2010 Slovenia Ferro-silicon 12 550 * 6 000 * — * — * — Spain Ferro-manganese * 35 000 * 35 000 * 35 000 * 35 000 * 35 000 Ferro-silico-manganese * 100 000 * 100 000 * 30 000 * 30 000 * 30 000 Ferro-silicon * 60 000 * 60 000 * 60 000 * 60 000 * 60 000 Silicon metal * 25 000 * 25 000 * 25 000 * 25 000 * 25 000 Sweden Ferro-chrome 136 400 124 400 118 700 31 100 64 400 Ferro-silicon 4 600 4 300 — — — Turkey Ferro-chrome 67 975 69 730 75 840 41 028 ... Ferro-silico-chrome 7 310 6 624 6 094 2 903 ... Ukraine Spiegeleisen * 5 000 — — — — Pig iron & spiegeleisen 35 000 35 000 35 000 35 000 35 000 Ferro-manganese 373 000 368 321 361 501 135 339 285 643 Ferro-silico-manganese 1 168 000 1 281 073 958 667 771 950 1 000 329 Ferro-nickel * 90 000 95 619 97 848 76 487 102 940 Ferro-silicon 169 000 218 485 201 706 193 034 253 801 Other ferro-alloys 133 402 53 174 43 127 23 882 28 546 Egypt Ferro-silicon (a) 50 000 48 464 59 192 78 355 * 70 000 Other ferro-alloys (a) * 30 000 * 30 000 * 30 000 * 30 000 * 30 000 Gambia Pig iron & spiegeleisen 410 355 — — — Madagascar Pig iron & spiegeleisen — — — * 8 000 * 8 000 Mozambique Pig iron & spiegeleisen ... 26 347 32 985 21 100 37 100 South Africa Pig iron & spiegeleisen 414 400 388 800 404 000 392 000 381 000 Ferro-chrome 2 893 400 3 551 983 3 268 659 2 341 754 2 346 132 Ferro-manganese * 600 000 * 672 000 * 498 000 * 265 000 * 517 000 Ferro-silico-manganese * 350 000 * 355 000 * 263 000 * 140 000 * 273 000 Ferro-silicon * 140 000 * 140 000 * 137 000 * 110 000 * 128 000 Ferro-vanadium * 18 000 * 19 000 * 19 000 * 13 000 * 19 000 Silicon metal * 50 000 * 50 108 * 49 146 * 39 000 * 46 000 Zimbabwe Ferro-chrome 200 673 187 327 145 430 72 223 146 378 Ferro-silicon 1 024 3 097 1 612 603 — Canada Ferro-niobium 6 298 6 571 6 644 * 6 000 * 6 000 Ferro-silicon * 70 000 * 70 000 * 70 000 * 70 000 * 70 000 Silicon metal * 30 000 * 30 000 * 30 000 * 53 000 * 59 000 Dominican Republic Ferro-nickel 76 659 75 069 47 408 — * — Mexico Ferro-manganese 64 318 74 578 97 366 42 492 81 019 Ferro-silico-manganese 97 457 109 286 114 320 85 065 134 470 USA Pig iron & spiegeleisen 143 000 121 000 122 000 100 000 110 000 Ferro-silicon 253 000 271 000 287 000 245 000 280 000 Silicon metal * 148 000 * 150 000 * 150 000 * 150 000 * 150 000

39
Production of ferro-alloys tonnes (metric)
Country 2006 2007 2008 2009 2010 Argentina Ferro-silico-manganese 9 268 8 917 9 172 6 644 * 6 600 Ferro-silicon * 24 400 * 15 000 * 10 400 * 11 300 * 11 300 Brazil Pig iron & spiegeleisen 25 120 26 739 25 300 34 200 * 37 000 Ferro-chrome 158 585 177 656 209 273 108 893 ... Ferro-silico-chrome 8 221 12 943 13 674 1 750 13 100 Ferro-silico-magnesium 31 314 30 221 30 800 18 300 33 600 Ferro-manganese 61 434 135 757 149 900 44 600 87 150 Ferro-silico-manganese 198 753 225 373 238 000 109 500 218 650 Ferro-nickel 27 600 28 900 26 300 31 600 23 850 Ferro-niobium 60 826 71 676 81 600 48 900 77 250 Ferro-silicon 196 814 196 403 183 000 175 000 247 300 Other ferro-alloys 44 280 45 330 47 800 21 200 36 650 Silicon metal 226 380 225 120 219 600 154 000 184 150 Colombia Ferro-nickel 154 420 145 282 126 638 153 628 145 239 Venezuela Ferro-manganese * 15 000 * 15 000 * 15 000 * 15 000 * 15 000 Ferro-silico-manganese * 35 000 * 35 000 * 35 000 * 35 000 * 35 000 Ferro-nickel 75 313 68 506 42 300 40 113 * 39 000 Ferro-silicon * 92 000 * 92 000 * 92 000 * 83 000 * 83 000 Bhutan Ferro-silicon * 20 000 * 21 000 * 36 600 * 34 000 * 34 000 China Pig iron & spiegeleisen 135 000 140 000 140 000 130 000 140 000 Ferro-chrome 1 042 500 1 296 000 1 505 800 1 813 000 ... Ferro-silico-chrome 35 000 38 700 72 300 116 000 ... Other ferro-alloys 13 223 000 16 165 000 16 722 000 20 171 000 ... Silicon metal * 900 000 * 950 000 * 980 000 * 950 000 * 950 000 India Pig iron & spiegeleisen 20 535 35 977 29 158 * 29 000 * 29 000 Ferro-aluminium (b) 9 947 9 377 8 170 7 017 7 600 Ferro-chrome (b) 801 368 948 601 817 239 892 923 1 032 000 Ferro-silico-magnesium (b) 11 387 13 525 13 400 17 132 18 500 Ferro-manganese (b) 296 726 391 210 384 577 356 123 404 000 Ferro-silico-manganese (b) 782 962 911 402 891 458 1 116 047 1 299 000 Ferro-molybdenum (b) 3 120 2 899 2 162 2 822 3 050 Ferro-silicon (b) 92 632 83 716 99 595 97 682 117 000 Ferro-titanium (b) 1 761 1 937 1 661 1 929 2 100 Ferro-vanadium (b) 1 139 1 585 1 501 1 389 1 500 Other ferro-alloys (b) 409 362 541 569 610 Indonesia Pig iron & spiegeleisen 65 000 111 000 65 000 63 000 50 000 Ferro-manganese * 12 000 * 12 000 * 12 000 * 12 000 * 12 000 Ferro-silico-manganese * 5 000 * 6 000 * 7 000 * 7 000 * 7 000 Ferro-nickel 14 774 18 532 17 566 12 550 18 688 Iran Ferro-chrome (c) * 8 000 * 8 000 * 8 000 * 8 000 * 8 000 Ferro-silicon (c) * 50 000 * 50 000 * 50 000 * 50 000 * 50 000 Japan Ferro-chrome 13 056 12 016 13 888 7 698 16 208 Ferro-manganese 406 162 420 151 431 181 361 375 453 265 Ferro-silico-manganese 59 424 52 901 58 884 49 205 49 865 Ferro-molybdenum 4 229 4 573 4 554 3 598 4 615 Ferro-nickel 335 884 351 503 301 361 284 884 348 420 Ferro-vanadium 2 042 3 205 3 477 2 560 4 190 Other ferro-alloys 13 123 13 982 14 478 12 957 16 374 Kazakhstan Ferro-chrome 1 190 673 1 307 536 1 220 315 977 235 1 189 593 Ferro-silico-chrome 117 607 145 685 133 828 51 576 144 936 Ferro-silico-manganese 218 323 188 445 179 939 181 776 203 778 Ferro-silicon 85 924 59 886 54 964 30 028 4 456 Other ferro-alloys 1 787 1 222 1 473 1 205 1 283 Korea (Rep. of) Ferro-manganese 169 202 209 321 251 125 ... ... Ferro-silico-manganese 94 119 105 607 76 184 ... ...

40
Production of ferro-alloys tonnes (metric)
Country 2006 2007 2008 2009 2010 Korea, Dem. P.R. of Ferro-alloys * 10 000 * 10 000 * 10 000 * 10 000 * 10 000 Malaysia Pig iron & spiegeleisen 1 690 7 393 984 1 145 1 261 Sri Lanka Pig iron & spiegeleisen 8 321 381 1 447 10 267 9 200 Thailand Pig iron & spiegeleisen — 1 023 — — — Vietnam Pig iron & spiegeleisen * 27 000 * 22 000 * 24 000 * 8 000 * 8 000 Australia Pig iron & spiegeleisen 491 000 600 000 528 000 431 000 540 000 Ferro-manganese (a) 114 715 133 816 128 000 ... ... Ferro-silico-manganese (a) 103 207 105 800 126 000 ... ... Ferro-manganese & ferro-silico-manganese (a) .. ... ... 212 000 219 000 Silicon metal * 33 000 * 33 000 * 33 000 * 33 000 * 33 000 New Caledonia Ferro-nickel 180 724 170 870 148 960 156 553 165 506
Note(s) (a) Years ended 30 June of that stated (b) Years ended 31 March following that stated (c) Years ended 20 March following that stated
Production of kaolin tonnes (metric)
Country 2006 2007 2008 2009 2010 Albania 579 200 1 097 000 648 760 796 241 730 900 Austria 17 431 16 929 16 460 18 148 18 914 Belgium * 300 000 * 300 000 * 300 000 * 300 000 * 300 000 Bosnia & Herzegovina 69 643 188 033 259 325 148 384 41 808 Bulgaria * 240 000 * 240 000 * 220 000 * 140 000 * 190 000 Czech Republic (a) 673 000 682 000 664 000 488 000 636 000 France * 300 000 307 253 335 520 350 000 350 000 Germany (b) 3 815 173 3 842 514 3 622 159 4 513 753 4 578 097 Greece * 40 000 30 000 4 360 — — Hungary 1 350 2 136 — — — Italy * 180 000 * 180 000 * 180 000 * 180 000 * 180 000 Poland (c) 148 579 153 670 165 615 136 561 126 810 Portugal 167 792 183 598 217 434 274 925 284 715 Romania 11 063 7 576 3 060 651 326 Russia * 45 000 * 45 000 * 45 000 * 45 000 * 45 000 Serbia 214 735 97 432 398 917 163 616 156 672 Slovakia 58 000 46 000 44 000 10 000 — Spain (c) 476 327 489 428 355 739 270 298 250 820 Turkey * 600 000 456 238 232 746 234 614 711 493 Ukraine (a) 251 000 244 000 240 000 * 100 000 * 100 000 United Kingdom 1 762 328 1 671 426 1 355 365 1 059 848 * 1 000 000 Algeria 32 523 106 567 50 788 87 766 71 065 Egypt * 400 000 331 671 523 327 523 300 304 200 Eritrea 129 183 * 200 * 175 * 175 Ethiopia (d) 1 641 4 000 1 300 1 613 * 1 500 Kenya 810 910 940 * 1 000 * 1 000 Madagascar ... ... ... 90 259 Nigeria 96 590 * 100 000 * 100 000 * 100 000 * 100 000
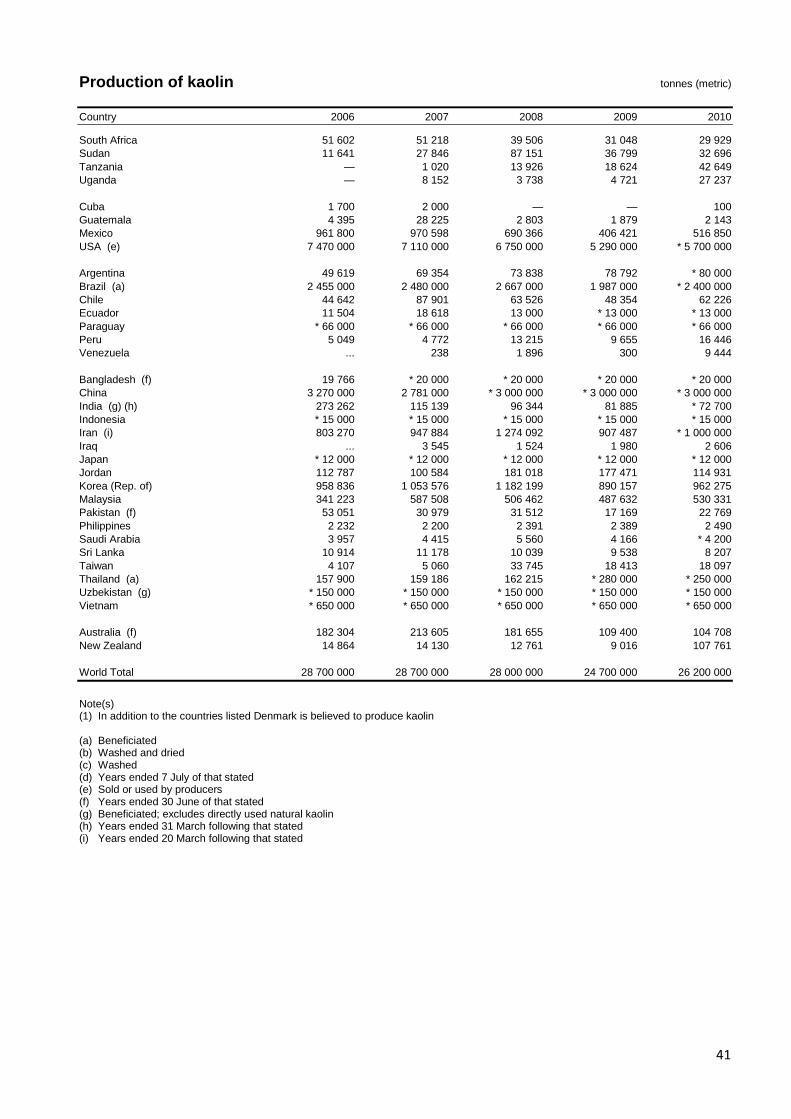
41
Production of kaolin tonnes (metric)
Country 2006 2007 2008 2009 2010 South Africa 51 602 51 218 39 506 31 048 29 929 Sudan 11 641 27 846 87 151 36 799 32 696 Tanzania — 1 020 13 926 18 624 42 649 Uganda — 8 152 3 738 4 721 27 237 Cuba 1 700 2 000 — — 100 Guatemala 4 395 28 225 2 803 1 879 2 143 Mexico 961 800 970 598 690 366 406 421 516 850 USA (e) 7 470 000 7 110 000 6 750 000 5 290 000 * 5 700 000 Argentina 49 619 69 354 73 838 78 792 * 80 000 Brazil (a) 2 455 000 2 480 000 2 667 000 1 987 000 * 2 400 000 Chile 44 642 87 901 63 526 48 354 62 226 Ecuador 11 504 18 618 13 000 * 13 000 * 13 000 Paraguay * 66 000 * 66 000 * 66 000 * 66 000 * 66 000 Peru 5 049 4 772 13 215 9 655 16 446 Venezuela ... 238 1 896 300 9 444 Bangladesh (f) 19 766 * 20 000 * 20 000 * 20 000 * 20 000 China 3 270 000 2 781 000 * 3 000 000 * 3 000 000 * 3 000 000 India (g) (h) 273 262 115 139 96 344 81 885 * 72 700 Indonesia * 15 000 * 15 000 * 15 000 * 15 000 * 15 000 Iran (i) 803 270 947 884 1 274 092 907 487 * 1 000 000 Iraq ... 3 545 1 524 1 980 2 606 Japan * 12 000 * 12 000 * 12 000 * 12 000 * 12 000 Jordan 112 787 100 584 181 018 177 471 114 931 Korea (Rep. of) 958 836 1 053 576 1 182 199 890 157 962 275 Malaysia 341 223 587 508 506 462 487 632 530 331 Pakistan (f) 53 051 30 979 31 512 17 169 22 769 Philippines 2 232 2 200 2 391 2 389 2 490 Saudi Arabia 3 957 4 415 5 560 4 166 * 4 200 Sri Lanka 10 914 11 178 10 039 9 538 8 207 Taiwan 4 107 5 060 33 745 18 413 18 097 Thailand (a) 157 900 159 186 162 215 * 280 000 * 250 000 Uzbekistan (g) * 150 000 * 150 000 * 150 000 * 150 000 * 150 000 Vietnam * 650 000 * 650 000 * 650 000 * 650 000 * 650 000 Australia (f) 182 304 213 605 181 655 109 400 104 708 New Zealand 14 864 14 130 12 761 9 016 107 761 World Total 28 700 000 28 700 000 28 000 000 24 700 000 26 200 000
Note(s) (1) In addition to the countries listed Denmark is believed to produce kaolin (a) Beneficiated (b) Washed and dried (c) Washed (d) Years ended 7 July of that stated (e) Sold or used by producers (f) Years ended 30 June of that stated (g) Beneficiated; excludes directly used natural kaolin (h) Years ended 31 March following that stated (i) Years ended 20 March following that stated

42
Mine production of lead tonnes (metal content)
Country 2006 2007 2008 2009 2010 Bosnia & Herzegovina 1 152 4 633 6 029 3 781 5 811 Bulgaria (a) 19 571 17 768 14 577 12 981 12 705 Greece 11 400 13 400 14 000 10 000 12 200 Ireland, Republic of 61 800 56 800 50 200 * 49 500 39 100 Italy 6 000 3 000 3 000 2 000 3 000 Kosovo (a) — — 6 076 6 737 7 657 Macedonia 11 531 36 039 49 877 46 788 41 300 Poland 77 450 61 330 67 070 62 910 44 200 Romania 6 269 784 — — — Russia 34 000 48 000 60 000 72 000 97 000 Serbia 1 400 1 600 1 600 1 800 1 800 Spain — — — 1 000 300 Sweden 55 644 63 224 63 489 69 293 67 697 Turkey 11 000 20 800 31 800 21 600 39 000 United Kingdom * 400 * 300 * 300 243 251 Morocco 41 300 42 200 33 477 34 500 32 700 Namibia 11 830 10 543 14 062 10 129 10 140 Nigeria 1 300 4 500 6 000 5 200 3 300 South Africa 48 273 41 857 46 440 49 149 50 625 Canada 83 096 75 135 99 810 68 839 64 859 Guatemala 28 363 — — — Honduras 11 775 10 215 12 545 14 471 16 954 Mexico 135 025 137 133 141 173 143 838 192 062 USA 429 300 444 300 410 100 405 800 369 000 Argentina 12 064 17 045 20 788 24 753 22 600 Bolivia 11 955 22 798 81 602 84 538 72 803 Brazil 16 007 15 522 15 000 9 000 * 10 000 Chile 672 1 305 3 985 1 511 695 Peru 313 332 329 154 345 109 302 459 261 978 Burma * 2 000 * 1 000 * 1 000 * 5 000 * 6 000 China 1 331 000 1 402 000 1 402 700 1 604 100 1 851 000 India (b) 67 363 77 717 80 756 84 025 * 83 900 Iran (c) 30 000 31 864 26 905 39 254 * 40 000 Japan 800 — — — — Kazakhstan 48 100 40 200 38 800 34 000 35 000 Korea (Rep. of) 17 12 225 1 032 584 Korea, Dem. P.R. of * 25 000 * 35 000 * 33 000 * 25 000 * 26 000 Saudi Arabia ... 123 347 685 500 Thailand — — * 5 000 * 3 000 — Vietnam * 9 500 * 4 400 * — 6 000 3 700 Australia 668 000 641 000 650 000 566 000 712 000 World Total 3 600 000 3 700 000 3 800 000 3 900 000 4 200 000
Note(s) (a) Metal content of ore (b) Years ended 31 March following that stated (c) Years ended 20 March following that stated

43
Production of refined lead tonnes (metric)
Country 2006 2007 2008 2009 2010 Austria * 22 000 * 22 000 * 22 000 * 22 000 * 22 000 Belgium 101 000 117 000 104 000 109 000 121 000 Bulgaria 76 000 87 000 90 900 83 100 80 600 Czech Republic 29 000 34 000 36 000 29 000 30 000 Estonia 9 000 10 000 10 000 10 000 * 10 000 France 88 000 * 88 000 82 100 62 000 71 000 Germany 379 000 355 000 415 100 781 200 405 400 Greece 6 000 11 000 11 000 * 11 000 * 11 000 Ireland, Republic of 21 700 22 500 20 000 19 000 19 000 Italy 190 500 211 800 199 900 149 000 150 000 Kosovo — — — 4 250 4 300 Netherlands * 16 000 * 16 000 * 16 000 * 17 000 * 16 000 Poland 82 200 104 200 108 300 100 400 120 300 Portugal 3 000 5 000 5 000 4 000 4 000 Romania 34 133 39 369 39 596 8 687 11 263 Russia 80 000 103 000 112 000 90 000 89 000 Slovenia 15 000 15 000 15 000 14 000 14 000 Spain 129 000 128 000 145 000 138 000 163 000 Sweden 70 239 69 730 56 812 51 574 59 179 Switzerland * 9 000 * 9 000 * 8 000 800 — Turkey * 6 000 * 6 000 * 6 000 * 6 000 * 6 000 Ukraine 56 300 62 100 54 700 60 600 71 500 United Kingdom 318 703 263 391 283 000 301 865 297 453 Algeria 5 000 6 000 6 000 6 000 9 000 Kenya * 1 000 * 1 000 * 1 000 * 1 000 * 1 000 Morocco 45 000 45 000 37 400 20 100 38 200 Nigeria * 5 000 * 8 000 * 8 000 * 8 000 * 8 000 South Africa 67 000 59 000 62 000 58 000 58 000 Zambia 500 500 500 500 500 Canada 250 464 236 688 259 074 258 854 272 878 El Salvador 10 000 10 000 11 000 12 000 11 000 Mexico 232 300 198 293 206 364 200 410 225 980 USA (a) 1 303 000 1 303 000 1 280 500 1 214 100 1 256 000 Argentina 49 064 60 600 62 500 83 000 89 700 Brazil (b) 142 653 142 450 95 704 104 000 112 000 Colombia 10 000 10 000 10 000 10 000 10 000 Peru 120 311 116 774 114 259 26 082 * — Venezuela * 36 000 * 36 000 * 37 000 * 36 000 * 36 000 Burma 500 200 200 * 200 * 200 China 2 714 900 2 788 300 3 451 800 3 772 900 4 199 400 India 114 000 239 000 274 000 307 000 325 000 Indonesia 18 000 18 000 18 000 18 000 18 000 Iran 74 000 78 000 75 000 72 000 75 000 Israel 25 000 25 000 27 000 26 000 27 000 Japan 280 000 276 300 279 500 247 700 267 200 Kazakhstan 115 974 117 641 105 766 73 480 93 800 Korea (Rep. of) 240 000 260 000 273 000 297 000 321 000 Korea, Dem. P.R. of 8 000 7 000 6 000 5 000 5 000 Malaysia 44 000 17 000 39 000 54 000 26 000 Pakistan * 2 000 * 2 000 * 2 000 * 2 000 * 2 000 Philippines * 30 000 * 34 000 * 34 000 * 32 000 * 30 000 Saudi Arabia 38 000 37 000 38 000 37 000 38 000 Taiwan 42 000 36 000 38 000 36 000 35 000 Thailand 61 160 73 159 73 303 55 504 71 020 United Arab Emirates * 2 000 * 2 000 * 2 000 * 2 000 * 2 000
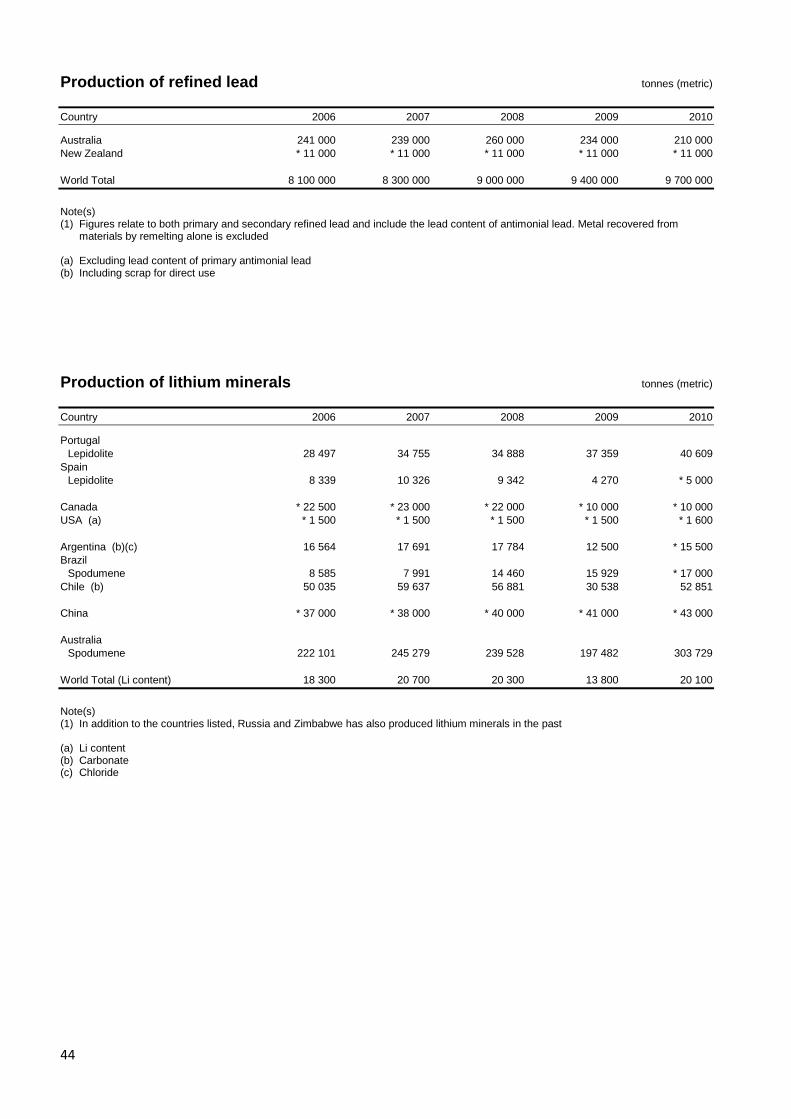
44
Production of refined lead tonnes (metric)
Country 2006 2007 2008 2009 2010 Australia 241 000 239 000 260 000 234 000 210 000 New Zealand * 11 000 * 11 000 * 11 000 * 11 000 * 11 000 World Total 8 100 000 8 300 000 9 000 000 9 400 000 9 700 000
Note(s) (1) Figures relate to both primary and secondary refined lead and include the lead content of antimonial lead. Metal recovered from
materials by remelting alone is excluded (a) Excluding lead content of primary antimonial lead (b) Including scrap for direct use
Production of lithium minerals tonnes (metric)
Country 2006 2007 2008 2009 2010 Portugal Lepidolite 28 497 34 755 34 888 37 359 40 609 Spain Lepidolite 8 339 10 326 9 342 4 270 * 5 000 Canada * 22 500 * 23 000 * 22 000 * 10 000 * 10 000 USA (a) * 1 500 * 1 500 * 1 500 * 1 500 * 1 600 Argentina (b)(c) 16 564 17 691 17 784 12 500 * 15 500 Brazil Spodumene 8 585 7 991 14 460 15 929 * 17 000 Chile (b) 50 035 59 637 56 881 30 538 52 851 China * 37 000 * 38 000 * 40 000 * 41 000 * 43 000 Australia Spodumene 222 101 245 279 239 528 197 482 303 729 World Total (Li content) 18 300 20 700 20 300 13 800 20 100
Note(s) (1) In addition to the countries listed, Russia and Zimbabwe has also produced lithium minerals in the past (a) Li content (b) Carbonate (c) Chloride

45
Production of magnesite tonnes (metric)
Country 2006 2007 2008 2009 2010 Austria 769 188 811 556 837 476 544 716 757 063 Greece 463 277 351 414 361 165 380 834 396 497 Netherlands (a) 293 006 * 245 000 316 264 183 256 236 053 Poland 62 500 65 000 60 000 47 000 63 000 Russia * 2 600 000 * 2 600 000 * 2 600 000 * 2 600 000 * 2 600 000 Slovakia 941 100 957 000 806 500 477 600 650 100 Spain 520 646 463 850 * 440 700 * 434 000 * 460 000 Turkey 2 088 033 1 984 908 2 143 047 861 180 * 1 000 000 South Africa 73 300 80 700 83 900 * 80 000 * 80 000 Zimbabwe 939 1 814 2 549 449 — Canada (b) * 140 000 * 140 000 * 140 000 * 140 000 * 150 000 Guatemala 1 084 7 612 11 757 17 247 — Brazil (c) 382 718 399 314 421 300 410 000 439 500 Colombia 40 000 42 000 38 000 * — * — China 13 640 000 * 14 000 000 * 15 600 000 * 13 000 000 * 14 000 000 India (d) 238 981 252 849 252 880 286 383 * 239 000 Iran (e) 187 764 112 229 115 987 130 575 * 130 000 Israel ... (g) 103 023 (g) 108 852 (g) 132 636 (g) 135 930 Korea, Dem. P.R. of * 60 000 * 55 000 * 150 000 * 150 000 * 150 000 Pakistan (f) 2 446 3 445 3 940 2 639 4 409 Philippines 3 630 3 600 3 976 3 872 4 186 Australia (f) 482 027 343 424 147 698 366 188 * 295 000 World Total 23 100 000 23 000 000 24 600 000 20 000 000 21 800 000
Note(s) (1) In addition to the countries listed, Bulgaria is believed to produce magnesite (a) Chloride produced from solution mining (b) Officially described as magnesitic dolomite and brucite (c) Including beneficiated and directly shipped material (d) Years ended 31 March following that stated (e) Years ended 20 March following that stated (f) Years ended 30 June of that stated (g) Magnesium chloride
Production of primary magnesium metal tonnes (metric)
Country 2006 2007 2008 2009 2010 Russia * 35 000 * 33 000 * 30 000 * 30 000 * 30 000 Ukraine 2 000 2 000 * 2 000 * 2 000 * 2 000 Canada * 45 000 * 8 000 — — — USA * 40 000 * 40 000 * 40 000 * 40 000 * 40 000 Brazil * 5 000 * 5 000 * 5 000 * 5 000 * 5 000 China 525 600 659 300 630 700 501 800 653 800 India * 200 * 200 * 200 * 200 * 200 Israel 24 581 29 168 32 051 19 405 23 309 Kazakhstan (a) 21 000 * 21 000 * 21 000 * 21 000 * 21 000
Note(s) (a) Not marketed as metal but used in titanium production

46
Production of manganese ore tonnes (metric)
Country 2006 2007 2008 2009 2010 Bulgaria 20 500 27 900 39 100 28 300 106 000 Georgia (a) 328 643 368 394 ... ... ... Hungary 50 000 51 000 49 579 43 000 55 000 Romania 60 107 49 350 43 590 20 304 13 120 Ukraine (a) 1 606 000 1 720 000 1 447 000 * 1 000 000 * 1 450 000 Egypt 16 500 13 000 7 320 3 300 11 490 Gabon 2 978 972 3 333 800 3 250 000 2 000 000 3 200 000 Ghana 1 658 701 1 167 339 1 089 025 1 012 941 1 194 074 Ivory Coast 56 829 80 402 148 120 * 150 000 * 150 000 Morocco 2 500 41 628 102 285 51 788 75 614 Namibia 18 918 47 620 28 237 51 471 35 728 South Africa Metallurgical 5 201 162 5 982 190 6 798 187 4 564 855 7 156 338 Chemical 12 176 12 950 9 327 10 911 15 407 Sudan — 400 — 500 378 990 Mexico 344 662 418 342 477 147 330 328 466 649 Brazil 3 128 000 1 866 000 2 400 000 2 300 000 2 600 000 Chile 37 169 26 808 5 096 1 642 — China * 8 000 000 * 10 000 000 * 11 000 000 * 12 000 000 * 14 000 000 India (b) 2 115 507 2 696 980 2 789 025 2 439 899 2 890 753 Iran (c) 70 471 103 441 115 199 125 506 * 125 000 Kazakhstan 2 531 100 2 482 000 2 485 000 2 457 400 1 094 000 Malaysia 6 500 56 500 536 675 468 963 899 703 Thailand 1 000 9 500 111 000 64 930 50 450 Australia 4 567 000 5 289 000 4 819 000 4 444 000 6 470 000 World Total 32 800 000 35 800 000 38 100 000 33 900 000 42 800 000
Note(s) (1) In addition to the countries listed, Colombia, Cuba and Vietnam are believed to produce manganese ore (a) Marketable (b) Years ended 31 March following that stated (c) Years ended 20 March following that stated

47
Production of mercury kilograms
Country 2006 2007 2008 2009 2010 Finland 22 820 45 195 33 120 6 210 9 000 Russia * 50 000 * 50 000 * 50 000 * 50 000 * 50 000 Morocco 18 800 17 900 17 400 * 18 000 * 20 000 Mexico * 8 000 21 355 58 482 36 696 25 519 USA * 15 000 * 15 000 * 15 000 * 15 000 * 15 000 Argentina — 3 483 1 027 9 468 * 1 000 Chile (a) * 50 000 * 50 000 * 50 000 * 88 000 * 176 000 China 759 000 798 000 1 333 000 1 424 000 1 585 000 Kyrgyzstan * 250 000 * 250 000 * 250 000 * 250 000 * 250 000 Tajikistan * 30 000 * 30 000 * 30 000 19 100 * 15 000 World Total 1 200 000 1 300 000 1 800 000 1 900 000 2 100 000
Note(s) (1) Several countries are believed to have unrecorded production of mercury from copper electrowinning processes and by recovery from
effluents (a) From copper solvent extraction and electrowinning processes

48
Production of mica tonnes (metric)
Country 2006 2007 2008 2009 2010 Finland 8 097 11 449 10 706 * 10 000 * 10 000 France (a) * 20 000 * 20 000 * 20 000 8 000 8 000 Russia * 11 000 * 12 000 * 10 000 * 9 000 * 9 000 Serbia * 140 * 140 * 140 * 140 * 140 Spain (a) 4 496 5 569 4 254 * 3 655 * 6 800 Turkey — 3 313 8 392 4 172 ... Egypt ... 200 50 * 50 * 50 Madagascar 1 071 1 349 1 233 358 * 400 South Africa 828 419 393 299 904 Sudan ... ... 66 100 10 Canada * 17 500 * 18 000 * 17 000 * 15 000 * 15 500 Mexico 150 9 600 5 000 5 000 160 USA (a)(b) 110 000 97 000 84 000 * 90 000 * 90 000 Argentina 6 223 10 171 8 790 8 668 * 8 500 Brazil 4 000 4 000 4 000 4 200 * 4 200 China (c) * 94 000 * 93 000 * 139 000 * 91 000 * 126 000 India (d) 1 411 1 242 1 462 1 213 * 1 220 Iran (e) 4 440 1 800 1 510 6 797 * 7 000 Korea (Rep. of) (f) 30 356 42 385 49 474 27 078 36 486 Malaysia (g) 5 152 6 118 5 593 4 324 4 415 Sri Lanka 2 600 3 224 2 364 2 347 2 095 Taiwan 4 841 3 387 3 179 557 — World Total 330 000 340 000 380 000 290 000 330 000
Note(s) (1) In addition to the countries listed, Romania is believed to produce mica (a) Including mica recovered from mica schists and/or kaolin beneficiation (b) Sold or used by producers (c) Conservative BGS estimates, based on exports (d) Years ended 31 March following that stated (e) Years ended 20 March following that stated (f) Mainly sericite (g) Sericite

49
Mine production of molybdenum tonnes (metal content)
Country 2006 2007 2008 2009 2010 Armenia 4 090 4 385 4 472 4 365 4 377 Russia * 4 800 * 4 800 * 4 800 * 4 800 * 4 800 Canada 7 723 6 681 8 602 8 721 8 261 Mexico 2 519 6 491 7 812 10 167 10 849 USA 59 800 57 000 55 900 47 800 * 56 000 Argentina — — 228 1 148 468 Chile 43 158 44 775 33 639 34 786 37 044 Peru 17 209 16 787 16 721 12 297 16 963 China * 43 900 * 67 700 * 81 000 * 93 500 * 100 000 Iran (a) 3 574 8 933 6 597 7 058 * 7 000 Kazakhstan 400 800 * 800 * 800 * 800 Kyrgyzstan * 250 * 250 * 250 * 250 * 250 Mongolia 1 404 1 978 1 900 2 410 2 198 Uzbekistan * 600 * 600 * 500 * 550 * 550 World Total 189 000 221 000 223 000 229 000 250 000
Note(s) (1) In addition to the countries listed, Australia, Georgia, India, Democratic P.R. of Korea, Romania and Tajikistan are believed to produce
molybdenum (a) Years ended 20 March following that stated
Production of nepheline syenite tonnes (metric)
Country 2006 2007 2008 2009 2010 Norway 312 000 312 000 346 000 270 000 327 000 Russia (a) * 1 000 000 * 1 000 000 * 1 000 000 4 400 000 4 900 000 Canada 719 000 690 000 646 000 513 000 581 000 Iran 4 000 75 000 ... ... ...
Note(s) (a) Nepheline concentrates
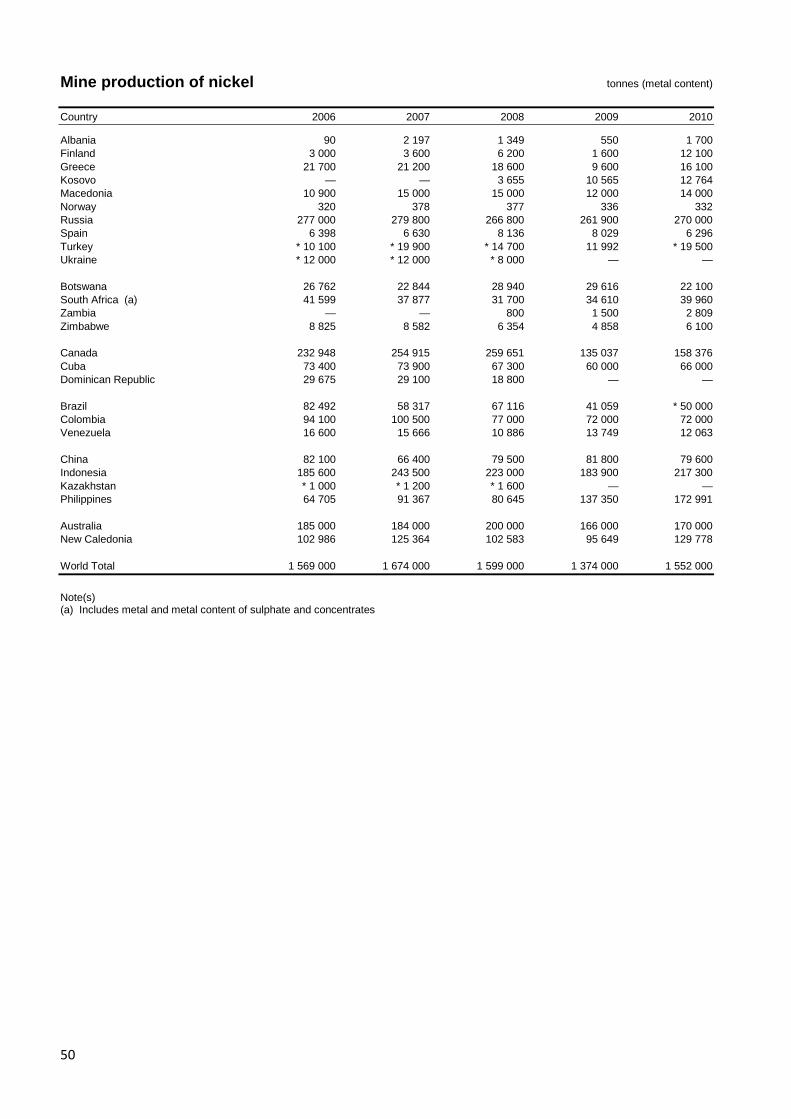
50
Mine production of nickel tonnes (metal content)
Country 2006 2007 2008 2009 2010 Albania 90 2 197 1 349 550 1 700 Finland 3 000 3 600 6 200 1 600 12 100 Greece 21 700 21 200 18 600 9 600 16 100 Kosovo — — 3 655 10 565 12 764 Macedonia 10 900 15 000 15 000 12 000 14 000 Norway 320 378 377 336 332 Russia 277 000 279 800 266 800 261 900 270 000 Spain 6 398 6 630 8 136 8 029 6 296 Turkey * 10 100 * 19 900 * 14 700 11 992 * 19 500 Ukraine * 12 000 * 12 000 * 8 000 — — Botswana 26 762 22 844 28 940 29 616 22 100 South Africa (a) 41 599 37 877 31 700 34 610 39 960 Zambia — — 800 1 500 2 809 Zimbabwe 8 825 8 582 6 354 4 858 6 100 Canada 232 948 254 915 259 651 135 037 158 376 Cuba 73 400 73 900 67 300 60 000 66 000 Dominican Republic 29 675 29 100 18 800 — — Brazil 82 492 58 317 67 116 41 059 * 50 000 Colombia 94 100 100 500 77 000 72 000 72 000 Venezuela 16 600 15 666 10 886 13 749 12 063 China 82 100 66 400 79 500 81 800 79 600 Indonesia 185 600 243 500 223 000 183 900 217 300 Kazakhstan * 1 000 * 1 200 * 1 600 — — Philippines 64 705 91 367 80 645 137 350 172 991 Australia 185 000 184 000 200 000 166 000 170 000 New Caledonia 102 986 125 364 102 583 95 649 129 778 World Total 1 569 000 1 674 000 1 599 000 1 374 000 1 552 000
Note(s) (a) Includes metal and metal content of sulphate and concentrates

51
Smelter/refinery production of nickel tonnes (metric)
Country 2006 2007 2008 2009 2010 Austria 900 900 500 700 * 700 Finland 47 469 55 000 51 963 40 800 49 200 France 13 700 14 800 13 700 13 900 14 400 Greece 17 700 18 668 16 640 8 269 13 960 Kosovo — — 5 777 6 365 7 000 Macedonia 10 942 15 300 15 000 12 000 * 14 000 Norway 82 257 87 600 88 700 88 577 92 185 Russia 280 200 273 500 266 400 260 700 * 265 000 Serbia — 1 000 — — — Ukraine 15 900 20 600 24 700 15 800 21 900 United Kingdom 36 750 34 050 40 800 17 800 28 900 South Africa 41 600 37 900 31 700 34 400 39 960 Zimbabwe 13 200 14 000 11 300 9 200 4 400 Canada 146 899 153 647 167 732 116 909 105 413 Cuba * 42 000 * 41 500 35 600 33 000 33 000 Dominican Republic 29 675 29 130 18 742 — — Brazil 36 569 34 954 36 000 32 800 41 900 Colombia 51 137 49 312 41 638 51 802 49 443 Venezuela 18 200 17 200 11 900 11 400 12 800 China 136 600 199 300 200 300 253 800 332 300 Indonesia 14 474 18 532 17 566 12 550 18 688 Japan 149 954 161 200 156 500 143 500 166 100 Korea (Rep. of) — — 2 500 20 042 23 440 Australia 116 000 114 000 108 000 131 000 102 000 New Caledonia 48 723 44 954 37 467 38 230 39 802 World Total 1 351 000 1 437 000 1 401 000 1 354 000 1 476 000
Note(s) (1) Data relate to refined nickel plus the nickel content of ferro-nickel, nickel oxide and nickel salts

52
Production of perlite tonnes (metric)
Country 2006 2007 2008 2009 2010 Armenia * 35 000 * 35 000 * 35 000 * 35 000 * 35 000 Bulgaria 4 500 13 900 7 400 14 800 — Georgia * 5 000 — — — — Greece 1 049 000 1 100 000 1 000 000 862 935 760 000 Hungary 71 019 67 542 132 000 82 058 80 000 Italy * 60 000 * 60 000 * 60 000 * 60 000 * 60 000 Russia * 45 000 * 45 000 * 45 000 * 45 000 * 45 000 Slovakia 10 560 20 000 25 000 25 000 23 000 Turkey * 160 000 * 160 000 * 160 000 * 160 000 * 160 000 Ukraine 36 400 * 36 000 * 36 000 * 36 000 * 36 000 South Africa * 400 * 400 * 400 * 400 * 400 Mexico 81 719 54 405 43 180 51 395 31 779 USA 454 000 409 000 434 000 348 000 * 375 000 Argentina 25 146 35 838 26 545 21 802 * 15 000 China * 700 000 * 700 000 * 700 000 * 700 000 * 700 000 India (a) 68 — — — — Iran (b) 30 050 47 422 * 47 000 753 183 * 750 000 Japan * 240 000 * 230 000 * 230 000 * 220 000 * 210 000 Philippines 9 600 9 900 10 100 10 100 10 500 Thailand 22 000 6 400 7 000 13 500 14 700 Australia (c) 12 057 8 546 6 942 7 649 6 616 New Zealand 3 552 7 873 — 8 848 5 088
Note(s) (1) In addition to the countries listed, Algeria, Canada, Iceland, Mozambique and former Yugoslavia are believed to produce perlite (a) Years ended 31 March following that stated (b) Years ended 20 March following that stated (c) Years ended 30 June of that stated

53
Production of crude petroleum tonnes (metric)
Country 2006 2007 2008 2009 2010 Albania 518 686 563 189 577 301 576 739 742 002 Austria 856 270 853 548 861 639 905 031 875 369 Azerbaijan 32 185 900 42 523 200 42 074 700 48 353 700 48 580 900 Belarus 1 780 040 1 760 020 1 740 020 1 720 010 1 700 140 Bulgaria 27 500 25 700 23 000 23 800 22 400 Croatia 950 859 911 207 867 027 807 424 748 791 Czech Republic 259 000 240 000 236 000 217 000 173 000 Denmark 17 068 000 15 552 000 14 338 000 13 045 000 12 090 000 Estonia (a) 1 624 000 1 901 600 1 869 500 1 733 000 2 080 000 France 1 100 000 1 013 000 975 000 899 000 * 800 000 Georgia 63 506 63 850 51 660 52 731 51 050 Germany 3 515 401 3 415 374 3 053 998 2 800 063 2 511 174 Greece 93 000 80 000 66 000 87 000 86 000 Hungary 886 000 838 672 811 000 796 000 790 000 Italy 5 800 000 5 800 000 5 200 000 4 600 000 5 100 000 Lithuania 180 894 154 449 127 658 114 956 114 464 Netherlands 2 022 475 2 576 222 2 163 000 1 312 000 1 020 000 Norway 136 695 000 125 763 000 121 101 700 115 000 000 104 881 356 Poland 795 742 720 603 754 907 686 992 686 487 Romania 4 777 000 4 837 000 4 528 000 4 388 940 4 172 411 Russia 481 000 000 491 000 000 488 000 000 494 000 000 505 000 000 Serbia 654 288 639 089 636 383 663 005 865 499 Slovakia 30 520 23 000 21 000 19 000 16 000 Slovenia 284 344 174 138 233 Spain 143 432 142 879 127 542 106 817 11 528 Turkey 2 175 353 2 131 288 2 222 594 2 489 914 2 602 114 Ukraine 4 506 000 4 459 000 4 328 000 3 960 000 3 549 000 United Kingdom 69 665 000 70 357 000 66 745 000 64 001 000 58 988 000 Algeria 85 036 000 86 100 000 85 600 000 77 900 000 77 700 000 Angola 69 700 000 84 300 000 92 200 000 87 400 000 90 700 000 Cameroon 4 400 000 4 200 000 4 300 000 3 700 000 3 200 000 Chad 8 000 000 7 500 000 6 700 000 6 200 000 6 400 000 Congo 13 402 300 11 091 800 11 768 000 13 900 000 15 400 000 Congo, Democratic Republic 1 230 000 1 105 000 995 000 1 100 000 1 050 000 Egypt 33 700 000 34 100 000 34 600 000 35 300 000 35 000 000 Equatorial Guinea 17 700 000 18 200 000 17 400 000 15 200 000 13 600 000 Gabon 11 700 000 11 500 000 11 800 000 11 500 000 12 200 000 Ghana 301 000 301 000 301 000 301 000 360 200 Ivory Coast 3 106 000 2 423 000 2 965 000 2 897 000 2 196 000 Libya 84 900 000 85 000 000 85 300 000 77 100 000 77 500 000 Mauritania 1 523 000 739 507 592 679 550 143 412 465 Morocco 11 200 11 100 9 000 9 300 7 400 Nigeria 120 000 000 114 200 000 103 100 000 99 100 000 115 200 000 Senegal 52 400 42 900 13 400 33 600 53 800 South Africa 721 000 502 000 403 000 270 000 316 000 Sudan 16 300 000 23 100 000 23 700 000 23 600 000 23 900 000 Tunisia 3 261 300 4 546 000 4 146 000 3 902 000 3 731 400 Barbados 47 133 40 253 39 760 38 030 42 069 Canada 131 400 000 137 300 000 135 700 000 134 300 000 141 200 000 Cuba 2 900 000 2 905 000 3 003 100 2 731 300 3 024 800 Guatemala 816 000 774 500 715 400 523 700 605 100 Mexico 190 410 000 179 450 000 163 220 000 153 600 000 152 670 000 Trinidad & Tobago 7 355 280 6 183 900 5 904 500 5 056 600 5 061 410 USA 315 576 700 314 746 780 309 706 456 334 637 399 345 381 255 Argentina 33 806 223 32 959 940 32 365 564 31 930 560 31 170 941 Bolivia 1 888 000 1 907 000 1 806 400 1 565 000 * 1 500 000 Brazil 93 600 000 94 800 000 98 500 000 105 000 000 110 600 000 Chile 150 000 132 000 137 000 192 000 217 750 Colombia 26 180 600 26 357 800 29 236 400 33 288 500 38 990 438 Ecuador 27 291 000 26 021 000 25 767 000 24 747 000 25 200 000 Peru 5 696 000 5 612 000 5 916 000 7 169 000 7 746 000 Suriname 774 000 877 500 951 000 945 300 951 770 Venezuela 144 200 000 133 900 000 131 600 000 124 800 000 126 600 000

54
Production of crude petroleum tonnes (metric)
Country 2006 2007 2008 2009 2010 Afghanistan ... * 3 000 * 3 000 * 3 000 * 3 000 Bahrain 1 790 000 1 721 000 1 636 000 1 603 000 1 646 984 Brunei 10 903 000 9 639 000 8 680 000 8 291 000 8 400 000 Burma (b) 1 088 000 1 076 000 973 000 984 000 959 000 China (c) 184 765 700 186 318 200 190 430 600 189 489 600 203 000 000 East Timor (f) 3 492 000 (f) 3 001 000 (g)* 3 000 000 (g) 3 066 000 (g) 2 760 000 India (b) 33 988 000 34 118 000 33 506 000 33 691 000 * 37 559 000 Indonesia 50 281 000 47 719 000 48 973 000 47 440 000 46 744 000 Iran 208 000 000 209 700 000 209 800 000 202 400 000 203 200 000 Iraq 98 100 000 102 688 000 115 411 000 117 533 000 120 400 000 Israel 3 500 11 700 2 200 2 010 1 791 Japan 818 000 876 000 899 000 840 000 796 000 Jordan 1 400 1 200 2 200 1 300 1 300 Kazakhstan 65 003 100 67 125 300 70 671 000 76 482 000 79 684 000 Kuwait (d) 132 700 000 129 900 000 137 300 000 121 300 000 122 500 000 Kyrgyzstan 100 000 100 000 71 000 77 300 50 000 Malaysia 31 900 000 32 600 000 32 900 000 31 500 000 30 400 000 Mongolia 52 000 117 000 162 000 257 000 300 000 Oman 36 750 000 35 350 000 37 700 000 40 500 000 43 100 000 Pakistan (e) 3 191 000 3 282 000 3 414 000 3 204 400 3 160 800 Philippines 728 000 815 000 902 000 1 150 000 1 092 000 Qatar 50 900 000 53 600 000 60 800 000 57 900 000 65 700 000 Saudi Arabia (d) 514 300 000 494 200 000 515 300 000 459 500 000 467 800 000 Syria 19 427 500 18 600 000 18 900 559 18 853 258 19 100 000 Taiwan 23 564 17 778 16 134 15 995 14 477 Tajikistan 23 700 25 900 25 800 26 200 27 000 Thailand 11 300 000 11 500 000 12 400 000 12 900 000 13 000 000 Turkmenistan 9 200 000 9 800 000 10 200 000 10 200 000 10 700 000 United Arab Emirates 145 500 000 140 700 000 142 900 000 126 300 000 130 800 000 Uzbekistan 5 400 000 4 900 000 4 800 000 4 500 000 3 700 000 Vietnam 16 800 000 15 920 000 14 904 000 16 300 300 14 967 000 Yemen, Republic of 17 429 000 15 300 000 14 100 000 13 104 442 12 500 000 Australia 20 605 000 21 567 000 21 569 000 22 527 000 24 844 000 New Zealand (f) 835 400 1 890 500 2 724 600 2 522 200 2 421 800 Papua New Guinea 2 290 000 2 153 000 1 950 000 1 813 000 1 685 000 World Total 3 904 000 000 3 888 000 000 3 911 000 000 3 810 000 000 3 901 000 000
Note(s) (1) The figures shown in this table include natural gas liquids (a) From oil shale (b) Years ended 31 March following that stated (c) Including oil from shale and coal (d) Including shares of production from the Neutral Zone (e) Years ended 30 June of that stated (f) Including natural gas liquids (g) Entirely natural gas liquids

55
Production of natural gas million cubic metres
Country 2006 2007 2008 2009 2010 Albania 11 10 12 9 2 Austria 1 765 1 835 1 544 1 559 1 713 Azerbaijan 6 080 10 832 16 337 16 325 16 673 Belarus 219 201 203 205 213 Bulgaria 519 295 218 15 74 Croatia 2 714 2 892 2 729 2 591 2 727 Czech Republic 148 148 168 180 201 Denmark 9 862 8 757 9 562 7 980 7 792 France 1 167 1 023 925 813 * 800 Georgia 21 18 14 12 8 Germany 19 798 18 075 16 547 15 554 13 666 Greece * 16 21 14 11 * 10 Hungary 3 254 2 653 2 703 2 748 2 600 Ireland, Republic of (a) 500 519 506 414 402 Italy 11 000 9 700 9 300 7 900 7 600 Netherlands 73 300 72 431 79 325 74 659 83 944 Norway 87 600 89 700 99 200 103 500 106 430 Poland 5 651 5 653 5 382 5 537 5 671 Romania 12 422 11 981 11 520 11 273 11 138 Russia 656 000 653 000 664 000 584 000 649 000 Serbia 280 274 282 283 427 Slovakia 135 195 111 114 100 Slovenia 4 3 3 3 7 Spain 118 42 46 19 58 Turkey 307 839 894 660 626 Ukraine 21 094 21 104 21 444 24 189 20 382 United Kingdom 84 748 76 970 74 937 63 022 59 674 Algeria 88 209 84 827 86 505 79 600 80 400 Angola 680 830 680 690 733 Congo 7 512 7 276 7 351 * 7 000 * 7 000 Egypt 54 700 55 700 58 900 62 700 61 300 Equatorial Guinea 1 300 2 920 6 670 5 900 6 136 Gabon 155 167 * 160 * 160 * 160 Ivory Coast 2 200 1 574 1 300 1 300 1 352 Libya 14 800 15 300 15 900 15 900 15 800 Morocco 56 61 50 41 50 Mozambique 2 700 2 800 3 100 3 600 3 744 Nigeria 28 400 35 000 35 000 24 800 33 600 South Africa 1 700 1 600 1 500 1 200 1 600 Tunisia 2 394 2 285 2 970 2 970 3 293 Barbados 23 * 21 * 21 * 21 * 21 Canada 176 808 174 334 167 515 156 046 151 023 Cuba 1 091 1 218 1 161 1 155 1 073 Mexico 51 500 53 600 54 200 54 900 55 300 Trinidad & Tobago 40 082 42 259 41 842 43 221 44 624 USA (b) 524 000 545 000 571 000 583 000 611 000 Argentina 51 778 51 007 50 509 48 416 47 097 Bolivia 13 433 14 301 14 895 12 786 * 14 900 Brazil 12 700 12 710 15 510 13 370 15 948 Chile 2 199 2 015 1 828 1 889 1 792 Colombia 7 000 7 500 9 100 10 378 10 599 Ecuador 283 310 255 * 300 * 300 Peru 1 772 2 671 3 386 3 470 7 149 Venezuela 31 500 29 500 30 000 28 700 28 500 Afghanistan * 50 * 50 155 142 142 Bahrain 13 436 11 433 12 320 12 475 12 785 Bangladesh (c) 14 921 15 920 17 015 18 511 19 919 Brunei 12 135 11 718 11 665 10 733 12 200 Burma (d) 13 032 13 385 11 304 12 120 12 509 China 58 553 69 240 80 299 85 269 96 800 East Timor 4 132 4 826 5 986 5 063 4 717 India (d) 31 747 32 417 32 849 47 510 * 51 900 Indonesia 80 501 76 703 74 128 86 699 93 255 Iran 108 600 111 900 116 300 131 200 138 500

56
Production of natural gas million cubic metres
Country 2006 2007 2008 2009 2010 Iraq 13 390 13 596 14 681 16 577 16 885 Israel 2 313 2 758 3 436 2 825 3 234 Japan 3 302 3 708 3 735 3 539 3 396 Jordan 251 220 250 220 185 Kazakhstan 26 382 29 562 32 889 35 942 37 406 Kuwait (e) 12 410 12 060 12 700 11 200 11 600 Kyrgyzstan 20 10 17 15 * 15 Malaysia 59 640 60 780 60 820 59 970 62 650 Oman 25 657 26 107 25 968 24 800 29 279 Pakistan (c) 39 645 40 028 41 178 41 362 41 990 Philippines 3 077 3 689 3 883 3 910 3 683 Qatar 50 700 63 200 76 600 89 300 85 430 Saudi Arabia (e) 73 461 74 420 80 440 77 500 83 900 Syria 8 272 7 825 7 574 7 948 7 800 Taiwan 463 417 357 351 290 Tajikistan 18 17 16 20 23 Thailand 24 302 25 812 27 559 26 347 29 565 Turkmenistan 60 400 65 400 66 100 36 400 42 400 United Arab Emirates 48 790 50 290 50 240 59 100 60 500 Uzbekistan 55 400 59 100 63 800 61 400 60 111 Vietnam 7 000 7 080 7 499 8 010 9 240 Australia 38 885 39 955 38 256 42 813 44 986 New Zealand 3 983 4 310 3 995 4 113 4 434 Papua New Guinea 145 136 151 156 151 World Total 3 013 000 3 074 000 3 183 000 3 111 000 3 278 000
Note(s) (1) So far as possible the figures in this table exclude flared or reinjected gas (a) Sales (b) Dry gas (c) Years ended 30 June of that stated (d) Years ended 31 March following that stated (e) Including one-half of the output of the Neutral Zone

57
Production of phosphate rock tonnes (metric)
Country 2006 2007 2008 2009 2010 Finland 857 922 830 989 780 000 660 405 * 820 000 Russia 10 812 800 10 936 500 9 810 200 9 537 800 10 843 500 Algeria 1 510 233 1 800 025 1 805 000 1 017 000 1 525 234 Burkina Faso * 2 400 * 2 400 * 2 400 * 2 400 * 2 400 Egypt 2 176 900 2 504 000 3 178 900 3 708 200 3 434 500 Morocco 27 097 000 27 834 000 24 861 000 18 307 000 26 603 000 Senegal 584 000 691 300 645 000 948 600 976 200 South Africa 2 628 714 2 555 723 2 286 794 2 237 128 2 493 904 Tanzania 2 881 8 261 28 684 18 000 17 000 Togo 1 156 500 750 100 842 508 725 547 726 200 Tunisia 7 838 000 8 002 000 7 691 700 7 409 000 8 148 500 Zimbabwe 65 838 46 106 21 051 32 100 62 928 Canada 530 000 682 000 983 000 901 388 907 600 Mexico 7 500 47 721 969 094 1 421 823 1 507 402 USA 30 100 000 29 700 000 30 200 000 26 400 000 * 26 100 000 Brazil (a) 5 932 000 6 185 000 6 730 000 6 100 000 6 300 000 Chile 13 836 25 073 41 186 13 292 50 528 Colombia * 43 000 * 24 000 * 48 000 * 48 000 * 50 000 Venezuela 400 000 371 000 213 981 362 753 85 240 China 38 959 500 45 417 000 50 740 600 60 208 900 68 070 000 Christmas Island (b)(c)(d) 724 278 703 719 * 700 000 563 000 566 645 India (e) 1 586 843 1 849 188 1 803 954 1 546 742 * 1 976 000 Iran 351 656 252 903 * 250 000 61 231 * 62 000 Iraq — — — 45 000 55 000 Israel 2 949 000 3 069 000 3 088 000 2 697 000 2 777 200 Jordan 5 804 991 5 552 000 6 266 000 5 280 693 6 528 708 Kazakhstan 1 059 300 1 044 900 2 470 600 1 204 700 1 755 000 Korea, Dem. P.R. of * 100 000 * 100 000 * 100 000 * 100 000 * 100 000 Pakistan (d) 2 996 3 350 * 3 000 * 3 000 * 3 000 Philippines Phosphate rock 1 963 1 961 2 271 2 257 2 308 Guano 213 209 254 251 272 Sri Lanka 42 159 40 128 41 947 36 347 47 778 Syria 3 664 000 3 678 000 3 221 379 2 466 150 3 764 900 Thailand 900 3 550 3 675 658 35 783 Uzbekistan 573 000 599 500 700 000 700 000 700 000 Vietnam 1 232 400 1 522 700 2 100 700 2 047 400 2 267 600 Australia 2 083 454 2 131 045 2 156 848 1 962 893 2 135 801 Nauru (b) * 84 000 * 200 000 497 469 146 816 407 654 World Total 151 000 000 159 000 000 165 000 000 159 000 000 182 000 000
Note(s) (1) In addition to the countries listed, Indonesia and Nigeria are believed to produce phosphate rock (a) Including beneficiated and directly shipped material (b) Exports (c) Including phosphate dust (d) Years ended 30 June of that stated (e) Years ended 31 March following that stated
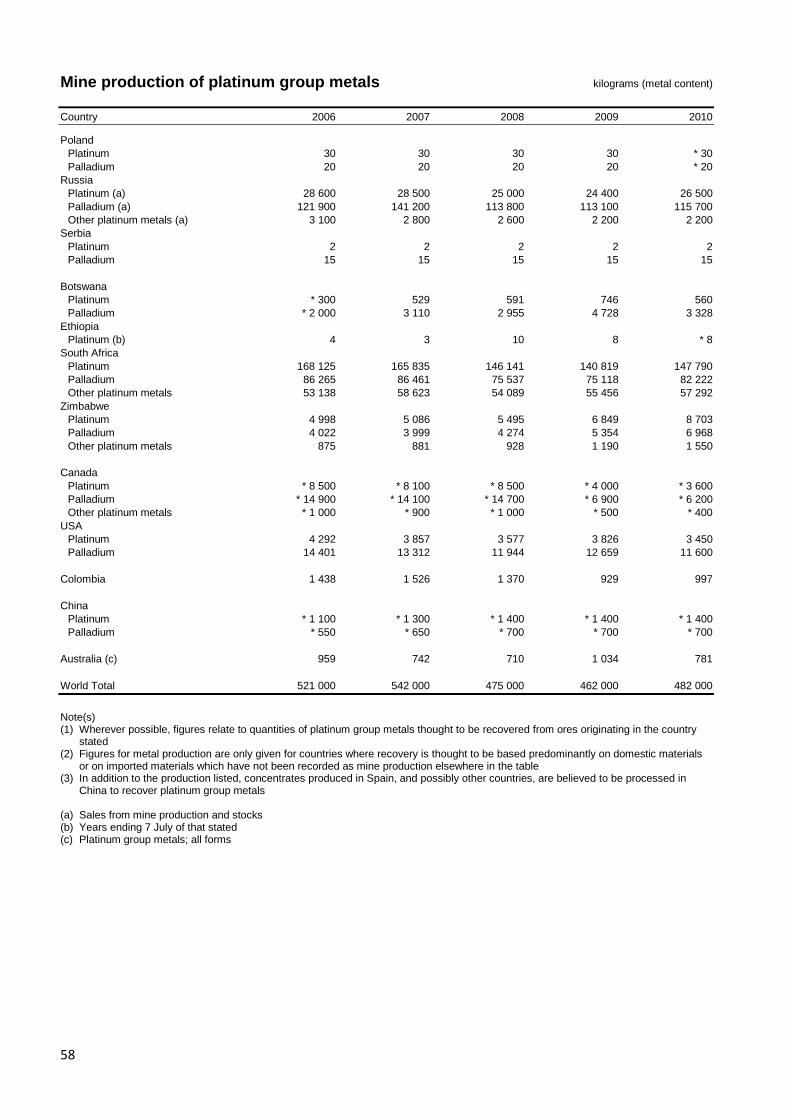
58
Mine production of platinum group metals kilograms (metal content)
Country 2006 2007 2008 2009 2010 Poland Platinum 30 30 30 30 * 30 Palladium 20 20 20 20 * 20 Russia Platinum (a) 28 600 28 500 25 000 24 400 26 500 Palladium (a) 121 900 141 200 113 800 113 100 115 700 Other platinum metals (a) 3 100 2 800 2 600 2 200 2 200 Serbia Platinum 2 2 2 2 2 Palladium 15 15 15 15 15 Botswana Platinum * 300 529 591 746 560 Palladium * 2 000 3 110 2 955 4 728 3 328 Ethiopia Platinum (b) 4 3 10 8 * 8 South Africa Platinum 168 125 165 835 146 141 140 819 147 790 Palladium 86 265 86 461 75 537 75 118 82 222 Other platinum metals 53 138 58 623 54 089 55 456 57 292 Zimbabwe Platinum 4 998 5 086 5 495 6 849 8 703 Palladium 4 022 3 999 4 274 5 354 6 968 Other platinum metals 875 881 928 1 190 1 550 Canada Platinum * 8 500 * 8 100 * 8 500 * 4 000 * 3 600 Palladium * 14 900 * 14 100 * 14 700 * 6 900 * 6 200 Other platinum metals * 1 000 * 900 * 1 000 * 500 * 400 USA Platinum 4 292 3 857 3 577 3 826 3 450 Palladium 14 401 13 312 11 944 12 659 11 600 Colombia 1 438 1 526 1 370 929 997 China Platinum * 1 100 * 1 300 * 1 400 * 1 400 * 1 400 Palladium * 550 * 650 * 700 * 700 * 700 Australia (c) 959 742 710 1 034 781 World Total 521 000 542 000 475 000 462 000 482 000
Note(s) (1) Wherever possible, figures relate to quantities of platinum group metals thought to be recovered from ores originating in the country
stated (2) Figures for metal production are only given for countries where recovery is thought to be based predominantly on domestic materials
or on imported materials which have not been recorded as mine production elsewhere in the table (3) In addition to the production listed, concentrates produced in Spain, and possibly other countries, are believed to be processed in
China to recover platinum group metals (a) Sales from mine production and stocks (b) Years ending 7 July of that stated (c) Platinum group metals; all forms

59
Production of potash tonnes (K2O content)
Country 2006 2007 2008 2009 2010 Belarus 4 605 300 4 971 600 4 967 000 2 485 400 5 222 600 Germany Potassic salts 3 624 977 3 636 504 3 280 467 1 825 139 3 023 941 Russia 5 274 100 6 373 100 5 935 400 3 690 900 6 128 100 Spain Chloride 493 189 531 739 472 952 481 455 418 778 Ukraine 8 000 12 000 11 000 12 000 * 12 000 United Kingdom Chloride 427 000 430 000 403 800 * 403 800 * 403 800 Canada Chloride 8 528 000 11 426 000 10 379 000 4 318 000 9 788 000 USA Potassic salts 1 100 000 1 100 000 1 100 000 700 000 * 900 000 Brazil Chloride 403 080 471 333 383 000 453 000 417 000 Chile Chloride 515 000 533 000 578 000 594 000 * 759 000 China 1 571 900 1 822 600 1 980 000 2 062 000 2 345 000 Israel Chloride 2 187 000 2 146 000 2 134 000 2 446 200 2 041 342 Jordan 1 020 000 1 090 000 1 200 000 1 199 400 2 141 319 World Total 29 800 000 34 500 000 32 800 000 20 700 000 33 600 000
Production of rare earth oxides tonnes (metric)
Country 2006 2007 2008 2009 2010 Russia 2 935 2 711 2 470 * 2 500 * 2 500 Brazil 620 760 540 200 * 200 China (a) * 133 000 * 120 800 * 124 500 * 129 400 * 118 900 India (b)(c) 45 35 22 * 20 * 20 Malaysia 580 440 150 20 480
Note(s) (1) All the figures in this table are either reported as rare earth oxides or are calculated to rare earth oxide equivalent (2) Prior to the 2005-2009 edition of this book, a table for the production of 'rare earth minerals' was included rather than the current 'rare
earth oxides'. Users should exercise caution when comparing statistics over longer time periods (3) Although rare earth minerals are believed to be extracted in other countries, there is insufficient evidence to suggest that rare earth
oxides are produced in those countries (4) In addition to the countries listed, the USA are known to be producing rare earth oxides from existing stockpiles. Best available
estimates suggest this is in the order of 2000 tonnes per year (a) Includes production from iron ore extraction, bastnasite concentrates and ion absorption clays (b) Years ending 31 March following that stated (c) May include small quantities of other rare earth compounds

60
Production of rhenium tonnes (metric)
Country 2006 2007 2008 2009 2010 Armenia * 1 * 0 * 0 * 0 * 0 Poland 2 4 5 4 6 Russia * 1 * 2 * 2 * 2 * 2 Canada * 1 * 1 * 2 * 2 * 2 USA 8 7 8 6 * 6 Chile * 28 * 28 * 28 * 25 * 25 Peru * 5 * 5 * 5 * 5 * 5 China * 2 * 1 * 1 * 1 * 1 Kazakhstan * 8 * 6 * 6 * 3 * 3 Uzbekistan * 1 * 1 * 1 * 0 * 0
Production of salt tonnes (metric)
Country 2006 2007 2008 2009 2010 Albania (a) * 47 000 * 47 000 * 47 000 * 47 000 * 47 000 Armenia 37 000 34 800 37 334 29 402 29 440 Austria Rock salt 1 336 1 172 503 50 95 Salt in brine 764 103 735 724 866 674 1 035 044 1 071 842 Azerbaijan 12 000 7 126 7 527 5 466 4 449 Belarus 2 075 693 1 665 350 1 866 499 2 089 282 2 411 683 Bosnia & Herzegovina 416 305 502 487 538 357 556 089 662 631 Bulgaria 2 000 000 2 000 000 2 100 000 1 300 000 1 900 000 Croatia 29 589 32 536 54 937 57 186 66 835 Denmark 608 282 557 917 496 593 511 063 601 046 France (b) 9 371 000 6 139 840 * 6 000 000 6 100 000 * 6 000 000 Germany Rock salt 9 280 000 4 826 000 5 545 438 7 709 844 9 992 156 Brine salt 1 001 000 1 010 000 989 208 1 862 630 2 118 484 Salt in brine 7 189 000 7 558 000 7 306 745 * 7 300 000 * 4 500 000 Greece * 200 000 212 000 * 220 000 * 189 000 * 190 000 Italy Rock salt & brine salt 2 823 960 2 214 133 2 334 315 3 471 206 4 973 533 Montenegro (a) 5 000 20 000 25 200 17 000 11 200 Netherlands 6 056 000 6 177 000 6 200 000 5 967 000 5 982 000 Poland Rock salt 1 129 875 591 240 618 111 988 545 1 235 533 Brine salt 2 899 076 2 930 726 2 783 198 2 533 413 2 464 363 Other salt 808 247 785 694 706 618 763 385 763 515 Portugal Rock salt 586 190 590 588 606 545 594 578 618 961 Sea salt 76 858 64 048 69 249 72 325 44 574 Romania 2 621 129 2 475 349 2 526 774 2 072 744 2 388 357 Russia 2 800 000 2 200 000 1 800 000 1 600 000 * 2 000 000 Serbia 29 847 30 023 30 115 28 783 30 816 Slovakia 122 500 117 000 109 510 41 000 — Slovenia 1 624 3 029 535 2 924 59 Spain Rock salt 2 809 046 2 709 545 2 909 907 2 763 081 2 650 940 Sea salt 1 506 343 1 332 360 1 290 672 1 338 789 1 242 718 Other salt 115 826 102 524 102 149 99 853 92 644 Switzerland 525 000 353 000 368 000 554 000 643 000 Turkey Sea salt * 500 000 * 500 000 * 500 000 * 500 000 * 500 000 Other salt * 1 200 000 1 385 822 1 367 981 * 1 300 000 * 1 300 000

61
Production of salt tonnes (metric)
Country 2006 2007 2008 2009 2010 Ukraine 5 996 000 5 547 852 4 425 317 5 394 512 4 908 186 United Kingdom Rock salt * 2 000 000 * 2 000 000 * 2 000 000 * 2 000 000 * 2 000 000 Brine salt * 1 000 000 * 1 000 000 * 1 000 000 * 1 000 000 * 1 000 000 Salt in brine (c) * 2 800 000 * 2 800 000 * 2 800 000 * 2 800 000 * 2 800 000 Algeria Brine salt & sea salt 259 596 183 189 201 603 269 255 187 160 Angola 35 000 * 35 000 * 35 000 * 35 000 * 35 000 Benin (a) * 15 000 * 15 000 * 15 000 * 15 000 * 15 000 Botswana 151 595 165 710 170 994 241 114 * 250 000 Burkina Faso * 5 000 * 5 000 * 5 000 * 5 000 * 5 000 Cape Verde * 1 600 * 1 600 — — — Egypt (d) * 1 000 000 1 213 643 1 879 351 2 951 636 * 3 000 000 Eritrea 9 737 7 448 26 071 * 26 000 * 26 000 Ethiopia Rock salt (e) 19 271 12 899 30 414 41 847 * 40 000 Other salt (f) ... ... 31 971 70 541 * 70 000 Ghana 250 000 * 250 000 238 727 * 250 000 * 250 000 Guinea * 15 000 * 15 000 * 15 000 * 15 000 * 15 000 Kenya (f) 35 024 11 596 24 345 24 125 * 24 000 Libya * 40 000 * 40 000 * 40 000 * 40 000 * 40 000 Madagascar 70 000 70 000 * 70 000 * 70 000 * 70 000 Mali * 6 000 * 6 000 * 6 000 * 6 000 * 6 000 Mauritania 310 420 570 455 391 Mauritius (a) 7 408 6 650 5 042 2 301 * 2 000 Morocco 319 900 215 754 219 187 310 376 503 351 Mozambique (a) * 80 000 * 80 000 * 80 000 * 80 000 * 80 000 Namibia 590 556 810 942 732 000 807 348 783 036 Niger * 1 300 * 1 300 * 1 300 * 1 300 * 1 300 Senegal 198 600 212 300 240 600 222 500 231 400 Somalia * 1 000 * 1 000 * 1 000 * 1 000 * 1 000 South Africa 464 909 407 079 415 996 408 422 394 493 Sudan 11 638 22 922 10 581 35 793 141 840 Tanzania 34 798 35 224 25 897 27 393 34 455 Tunisia (a) 1 127 000 933 000 1 063 500 1 260 100 1 692 800 Bahamas 1 143 000 578 000 10 244 10 430 11 833 Canada Rock salt 11 504 207 * 10 175 000 * 12 090 000 * 12 381 000 * 9 197 000 Other salt (g) 1 901 453 * 1 796 000 * 2 134 000 * 2 185 000 * 1 623 000 Costa Rica * 20 000 * 20 000 * — * — * — Cuba 266 000 141 300 157 300 265 700 271 800 Dominican Republic (a) * 50 000 * 50 000 * 50 000 * 50 000 * 50 000 El Salvador (a) * 31 000 * 31 000 * 31 000 * 31 000 * — Guatemala (a) * 60 000 * 60 000 * 60 000 * 50 000 * 50 000 Honduras * 40 000 * 40 000 * 40 000 * 40 000 * 40 000 Mexico 8 371 353 8 032 273 8 808 714 7 445 025 8 634 098 Netherlands Antilles 343 110 403 961 343 457 303 565 337 321 Nicaragua (a) * 30 000 * 30 000 * 30 000 * 30 000 * 30 000 Panama (a) 19 080 20 315 21 053 19 548 27 587 USA Rock salt (h) 16 500 000 16 800 000 19 800 000 20 700 000 * 19 800 000 Salt in brine (h) 19 900 000 19 700 000 18 900 000 17 480 000 * 17 100 000 Evaporated salt (h) 8 090 000 7 990 000 8 580 000 8 280 000 * 8 100 000 Argentina 1 917 656 2 357 674 1 681 313 1 477 532 * 1 500 000 Brazil Rock salt 1 622 000 1 621 000 1 528 000 1 443 000 * 1 300 000 Sea salt 5 122 197 5 365 091 5 200 000 4 462 000 5 000 000 Chile 4 580 471 4 403 743 6 431 029 8 382 215 7 694 879 Colombia Rock salt 248 245 266 941 245 170 255 332 288 676 Sea salt 389 630 309 557 386 461 356 797 139 810 Ecuador * 75 000 * 75 000 * 75 000 * 75 000 * 75 000 Peru 971 710 1 185 273 1 276 274 1 567 279 1 228 900 Venezuela (a) * 350 000 * 350 000 * 350 000 * 350 000 * 350 000

62
Production of salt tonnes (metric)
Country 2006 2007 2008 2009 2010 Afghanistan ... ... 145 532 163 641 168 827 Bangladesh (d) * 880 000 * 1 100 000 1 349 000 1 368 000 1 389 000 Burma (i)(j) 83 276 61 475 101 083 127 169 79 187 Cambodia (k) 59 000 76 651 * 78 000 * 30 000 * 170 000 China 56 631 300 61 669 700 66 644 300 66 627 900 62 748 000 India Rock salt (j) 1 753 1 200 2 100 2 300 1 200 Sea salt (j) 13 268 500 12 328 000 13 970 500 17 478 600 14 202 300 Other salt (j) 4 628 100 5 516 000 5 178 600 6 470 400 4 406 600 Indonesia * 700 000 * 700 000 * 700 000 * 720 000 * 720 000 Iran (l) 2 617 902 2 534 871 2 158 280 2 816 235 * 2 800 000 Iraq ... 153 140 108 870 113 130 102 000 Israel (a) * 640 000 399 904 420 809 356 889 420 749 Japan (j) 1 166 000 1 138 000 1 132 000 1 095 000 1 122 000 Jordan 28 800 17 000 25 400 2 500 32 542 Kazakhstan 416 680 227 643 504 100 222 942 276 131 Korea (Rep. of) 285 568 249 515 384 304 382 270 222 509 Korea, Dem. P.R. of * 500 000 * 500 000 * 500 000 * 500 000 * 500 000 Kuwait * 50 000 * 50 000 * 50 000 * 50 000 * 50 000 Laos * 35 000 * 35 000 * 35 000 * 35 000 * 35 000 Lebanon * 15 000 * 15 000 * 15 000 * 15 000 * 15 000 Mongolia 167 4 115 5 ... Oman 26 300 10 400 10 400 30 600 * 31 000 Pakistan Rock salt (d) 1 858 931 1 872 664 1 849 199 1 917 486 1 943 527 Sea salt (d) 15 249 10 616 * 11 000 * 11 000 * 11 000 Philippines (a) 418 210 437 689 510 059 516 066 557 644 Saudi Arabia Rock salt & brine salt 1 611 992 1 507 000 1 600 000 1 600 000 * 1 600 000 Sri Lanka 87 560 70 208 65 972 102 500 104 000 Syria 133 000 81 000 88 600 78 263 * 80 000 Taiwan 107 713 107 720 118 046 171 583 262 594 Tajikistan 51 956 47 462 47 446 49 772 50 365 Thailand Rock salt 1 008 251 1 134 931 1 211 581 * 1 200 000 * 1 200 000 Other salt * 100 000 * 100 000 * 100 000 * 100 000 * 100 000 Turkmenistan * 215 000 * 215 000 * 215 000 * 215 000 * 215 000 Uzbekistan * 60 000 * 60 000 * 60 000 * 60 000 * 60 000 Vietnam 842 000 857 000 717 000 718 000 * 718 000 Yemen, Republic of 53 000 61 000 69 000 * 80 000 * 80 000 Australia (m) 11 364 000 10 801 000 11 160 000 10 316 000 11 968 000 New Zealand 83 000 102 000 67 000 67 000 60 000 World Total 259 800 000 252 100 000 265 900 000 275 400 000 266 500 000
Note(s) (1) This table does not include production of refined salt (2) Salt is known to be produced in many countries for which statistics are not available (a) Sea salt (b) Salt; all forms (c) Used for purposes other than salt-making (d) Years ended 30 June of that stated (e) Years ended 7 July of that stated (f) Lake salt (g) Including salt in brine (h) Sold or used by producers (i) Brine salt (j) Years ended 31 March following that stated (k) Seasons beginning in November and ending in May of the year stated (l) Years ended 20 March following that stated (m) Excluding Victoria and the Northern Territory

63
Production of selenium metal tonnes (metric)
Country 2006 2007 2008 2009 2010 Belgium * 200 * 200 * 200 * 200 * 200 Finland 70 52 65 66 * 66 Germany * 250 * 250 * 250 * 230 * 250 Poland 87 85 82 80 80 Russia * 145 * 130 * 170 * 160 * 170 Sweden 135 126 139 129 * 130 Canada 117 144 191 173 * 79 Peru 75 59 60 61 59 China * 65 * 65 * 65 * 65 * 65 Japan 730 806 754 709 754 Kazakhstan * 70 155 * 130 * 120 * 130 Philippines * 65 * 65 * 65 * 65 * 65 Uzbekistan * 20 * 20 * 20 * 20 * 20
Note(s) (1) In addition to the countries listed, Australia, Chile, the Republic of Korea and Zimbabwe are believed to produce selenium metal
Production of sillimanite minerals tonnes (metric)
Country 2006 2007 2008 2009 2010 France Andalusite * 65 000 * 65 000 * 65 000 * 65 000 * 65 000 South Africa Andalusite 230 000 264 645 216 667 * 245 000 * 245 000 USA Kyanite (a) 102 000 118 000 97 200 71 000 93 000 Brazil Kyanite (b) * 200 * 200 * 200 * 200 * 200 India Kyanite (c) 8 059 5 102 4 620 5 553 * 5 650 Sillimanite (c) 26 366 40 537 33 702 30 690 * 30 000 Nepal Kyanite (d) 21 18 15 10 * 10
Note(s) (1) A number of other countries produce sillimanite minerals but details of output are not reported (2) In addition to the countries listed above as producing sillimanite minerals, synthetic mullite is believed to be produced in Germany and
Hungary (3) Production capacity for synthetic mullite also exists in China, India, Japan, USA and United Kingdom but output is believed to be zero (a) Including related minerals (b) Including beneficiated and directly shipped material (c) Years ended 31 March following that stated (d) Years ending 15 July of that stated

64
Mine production of silver kilograms (metal content)
Country 2006 2007 2008 2009 2010 Armenia * 4 000 6 900 9 200 9 000 16 400 Bulgaria * 65 000 * 55 000 * 55 000 * 55 000 * 55 000 Finland 50 843 44 895 69 906 69 600 69 600 Greece 24 700 38 300 33 500 27 500 29 000 Ireland, Republic of 12 900 9 650 7 172 5 267 4 061 Macedonia * 10 000 * 30 000 * 40 000 * 35 000 * 32 000 Poland 1 265 100 1 199 500 1 161 000 1 150 000 1 175 000 Portugal 20 078 26 514 26 273 20 483 20 561 Romania * 18 000 * 18 000 * 18 000 * 18 000 * 18 000 Russia (a) 973 500 911 300 1 132 200 1 312 600 1 144 600 Serbia (a) * 2 200 * 2 300 * 2 300 * 2 500 * 4 800 Slovakia 74 50 198 201 320 Spain 2 369 — — 2 200 20 800 Sweden 292 255 323 171 293 068 288 590 302 145 Turkey * 266 000 * 315 000 * 294 000 351 600 348 000 United Kingdom — 212 398 514 506 Algeria 500 500 114 200 147 Congo, Democratic Republic 67 600 76 200 34 100 — * 6 500 Ethiopia (b) 902 900 2 714 771 * 1 000 Ghana 3 142 3 300 3 200 3 928 * 3 900 Morocco 202 300 177 712 201 195 210 000 243 000 Namibia (a) 31 307 7 902 7 700 700 — Niger * 100 139 289 256 326 South Africa 86 951 70 089 75 199 77 780 79 315 Sudan 2 437 2 405 — 413 631 Tanzania 14 906 12 381 10 388 8 231 12 040 Zimbabwe * 1 000 * 1 100 500 — — Canada 995 024 860 449 755 103 617 777 596 061 Costa Rica 486 331 — — — Dominican Republic — — — 18 973 20 300 Guatemala 49 780 88 247 99 131 127 836 190 973 Honduras 55 036 53 894 58 936 57 698 58 158 Mexico 3 028 395 3 135 430 3 236 312 3 553 841 4 410 749 Nicaragua 2 929 3 420 3 720 4 491 6 995 USA 1 155 300 1 281 000 1 250 000 1 245 000 1 280 000 Argentina 245 124 255 567 355 596 415 235 693 600 Bolivia 472 210 525 000 1 114 000 1 325 730 1 259 000 Brazil 10 000 18 620 17 000 15 000 * 15 000 Chile 1 607 164 1 936 465 1 405 020 1 301 018 1 286 688 Colombia 8 399 9 766 9 162 10 827 15 300 Peru 3 470 661 3 493 090 3 685 931 3 922 708 3 637 396 Burma (a)(c) * 700 * 200 — — — China * 2 600 000 * 2 700 000 * 2 800 000 * 2 900 000 * 3 500 000 India (c) 53 271 80 697 105 284 138 768 * 99 500 Indonesia 261 398 268 967 226 051 326 773 271 534 Iran * 30 000 * 40 000 * 40 000 * 40 000 * 40 000 Japan 11 500 — — — — Kazakhstan (a) 806 083 722 927 645 627 613 544 548 990 Korea (Rep. of) 1 500 1 400 1 500 1 700 2 187 Korea, Dem. P.R. of * 50 000 * 50 000 * 50 000 * 50 000 * 50 000 Laos 6 331 4 499 6 706 14 726 17 234 Malaysia 410 296 349 366 353 Mongolia 20 378 20 455 19 954 20 397 19 641 Oman 4 404 3 863 2 140 2 162 1 290 Philippines 23 502 27 754 14 224 33 808 41 004 Saudi Arabia 9 103 9 028 8 233 8 527 * 8 500 Thailand 11 240 7 727 5 465 15 300 15 500 Uzbekistan 62 200 77 800 74 600 52 900 59 100

65
Mine production of silver kilograms (metal content)
Country 2006 2007 2008 2009 2010 Australia 1 727 000 1 880 000 1 926 000 1 631 000 1 880 000 Fiji 494 — 265 313 328 New Zealand 27 221 8 553 18 269 14 264 16 095 Papua New Guinea 51 098 48 677 48 062 55 082 83 957 World Total 20 277 000 20 948 000 21 460 000 22 186 000 23 713 000
Note(s) (a) Smelter and/or refinery production (b) Years ended 7 July of that stated (c) Years ended 31 March following that stated
Production of natural sodium carbonate tonnes (metric)
Country 2006 2007 2008 2009 2010 Botswana 255 677 279 625 263 566 215 188 240 898 Ethiopia (a) 2 389 * 3 000 3 707 4 046 * 4 000 Kenya 374 210 386 578 502 846 404 904 473 689 USA 11 000 000 11 000 000 11 300 000 9 310 000 10 600 000
Note(s) (a) Years ended 7 July of that stated
Production of strontium minerals tonnes (metric)
Country 2006 2007 2008 2009 2010 Spain 280 195 142 512 138 590 57 466 83 035 Turkey * 6 300 * 4 200 * 1 600 — — Morocco * 2 700 * 2 700 * 2 700 * 2 700 * 2 700 Mexico 128 321 96 902 29 621 36 127 31 429 Argentina (a) 19 822 4 904 14 910 8 169 * 7 000 China * 700 000 * 700 000 * 700 000 * 700 000 * 700 000 Iran 17 170 — — 15 396 * 15 500 Pakistan (b) 1 290 1 641 1 310 470 160
Note(s) (1) In addition to the countries listed, Germany and Poland are believed to produce strontium minerals (a) May contain unbeneficiated material (b) Years ended 30 June of that stated
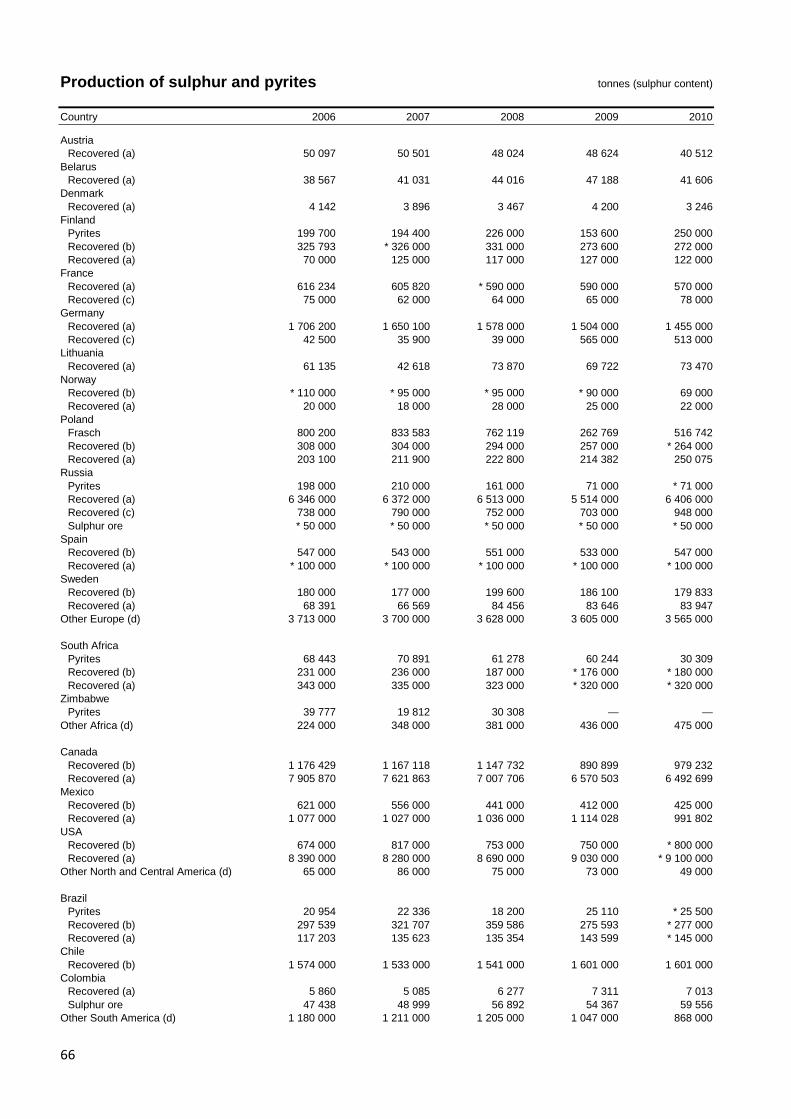
66
Production of sulphur and pyrites tonnes (sulphur content)
Country 2006 2007 2008 2009 2010 Austria Recovered (a) 50 097 50 501 48 024 48 624 40 512 Belarus Recovered (a) 38 567 41 031 44 016 47 188 41 606 Denmark Recovered (a) 4 142 3 896 3 467 4 200 3 246 Finland Pyrites 199 700 194 400 226 000 153 600 250 000 Recovered (b) 325 793 * 326 000 331 000 273 600 272 000 Recovered (a) 70 000 125 000 117 000 127 000 122 000 France Recovered (a) 616 234 605 820 * 590 000 590 000 570 000 Recovered (c) 75 000 62 000 64 000 65 000 78 000 Germany Recovered (a) 1 706 200 1 650 100 1 578 000 1 504 000 1 455 000 Recovered (c) 42 500 35 900 39 000 565 000 513 000 Lithuania Recovered (a) 61 135 42 618 73 870 69 722 73 470 Norway Recovered (b) * 110 000 * 95 000 * 95 000 * 90 000 69 000 Recovered (a) 20 000 18 000 28 000 25 000 22 000 Poland Frasch 800 200 833 583 762 119 262 769 516 742 Recovered (b) 308 000 304 000 294 000 257 000 * 264 000 Recovered (a) 203 100 211 900 222 800 214 382 250 075 Russia Pyrites 198 000 210 000 161 000 71 000 * 71 000 Recovered (a) 6 346 000 6 372 000 6 513 000 5 514 000 6 406 000 Recovered (c) 738 000 790 000 752 000 703 000 948 000 Sulphur ore * 50 000 * 50 000 * 50 000 * 50 000 * 50 000 Spain Recovered (b) 547 000 543 000 551 000 533 000 547 000 Recovered (a) * 100 000 * 100 000 * 100 000 * 100 000 * 100 000 Sweden Recovered (b) 180 000 177 000 199 600 186 100 179 833 Recovered (a) 68 391 66 569 84 456 83 646 83 947 Other Europe (d) 3 713 000 3 700 000 3 628 000 3 605 000 3 565 000 South Africa Pyrites 68 443 70 891 61 278 60 244 30 309 Recovered (b) 231 000 236 000 187 000 * 176 000 * 180 000 Recovered (a) 343 000 335 000 323 000 * 320 000 * 320 000 Zimbabwe Pyrites 39 777 19 812 30 308 — — Other Africa (d) 224 000 348 000 381 000 436 000 475 000 Canada Recovered (b) 1 176 429 1 167 118 1 147 732 890 899 979 232 Recovered (a) 7 905 870 7 621 863 7 007 706 6 570 503 6 492 699 Mexico Recovered (b) 621 000 556 000 441 000 412 000 425 000 Recovered (a) 1 077 000 1 027 000 1 036 000 1 114 028 991 802 USA Recovered (b) 674 000 817 000 753 000 750 000 * 800 000 Recovered (a) 8 390 000 8 280 000 8 690 000 9 030 000 * 9 100 000 Other North and Central America (d) 65 000 86 000 75 000 73 000 49 000 Brazil Pyrites 20 954 22 336 18 200 25 110 * 25 500 Recovered (b) 297 539 321 707 359 586 275 593 * 277 000 Recovered (a) 117 203 135 623 135 354 143 599 * 145 000 Chile Recovered (b) 1 574 000 1 533 000 1 541 000 1 601 000 1 601 000 Colombia Recovered (a) 5 860 5 085 6 277 7 311 7 013 Sulphur ore 47 438 48 999 56 892 54 367 59 556 Other South America (d) 1 180 000 1 211 000 1 205 000 1 047 000 868 000

67
Production of sulphur and pyrites tonnes (sulphur content)
Country 2006 2007 2008 2009 2010 Abu Dhabi Recovered (a) 2 045 000 2 183 000 1 900 000 1 760 000 1 800 000 Bahrain Recovered (a) 64 565 71 771 80 000 108 439 138 477 China Pyrites 4 663 000 6 082 000 6 022 000 4 946 000 5 643 000 Recovered 3 588 000 4 485 000 5 268 000 5 843 000 6 569 000 Sulphur ore 1 000 000 1 200 000 1 537 000 1 700 000 3 120 000 India Recovered (b) 801 000 955 000 1 103 000 1 078 000 1 144 000 Recovered (a)(c) 801 000 951 000 1 101 000 1 451 000 1 600 000 Iran Recovered (a) 1 440 000 1 456 000 1 629 000 1 429 000 1 454 000 Japan Recovered (b)(e) 1 679 000 1 747 000 1 797 000 1 675 000 1 819 000 Recovered (a) 1 950 000 1 967 000 2 034 000 1 863 596 1 891 875 Jordan Recovered (a) 357 000 334 000 * 310 000 * 310 000 * 310 000 Kazakhstan Recovered (b) * 235 000 * 235 000 392 000 490 000 670 000 Recovered (a) 1 586 600 1 660 700 1 732 600 2 250 000 2 350 000 Korea (Rep. of) Recovered (b) 899 000 912 000 990 000 899 000 1 029 000 Recovered (a) 660 000 * 670 000 * 660 000 * 660 000 * 660 000 Oman Recovered (a) * 30 000 * 30 000 * 30 000 * 30 000 * 30 000 Pakistan Recovered (f) 24 730 27 710 29 485 25 784 26 641 Qatar Recovered (a) 395 000 503 000 526 666 702 193 1 181 809 Saudi Arabia Recovered (a) 2 900 000 3 100 000 3 100 000 3 214 000 3 200 000 Syria Recovered (a) 43 000 40 650 40 491 40 000 40 000 Taiwan Recovered 245 789 249 156 211 869 252 392 231 700 Other Asia (d) 2 420 000 2 533 000 2 576 000 2 495 000 2 628 000 Australasia (d) 1 004 000 1 007 000 964 000 1 024 000 1 026 000 World Total Pyrites 5 300 000 6 700 000 6 600 000 5 400 000 6 100 000 Frasch 800 000 800 000 800 000 300 000 500 000 Recovered 61 500 000 63 200 000 64 200 000 64 200 000 67 300 000 Sulphur ore 1 200 000 1 400 000 1 800 000 1 900 000 3 300 000
Note(s) (1) Other Europe includes: Belgium, Bulgaria, Croatia, Czech Republic, France, Greece, Hungary, Italy, Netherlands, Portugal, Romania,
Serbia, Slovakia, Turkey, Ukraine and the United Kingdom (2) Other Africa includes: Algeria, Egypt, Libya and Zambia (3) Other North and Central America includes: Cuba, Netherlands Antilles and Trinidad and Tobago (4) Other South America includes: Argentina, Ecuador, Peru and Venezuela (5) Other Asia includes: Indonesia, Iraq, Israel, Korea (Dem. P.R. of), Kuwait, Philippines, Singapore, Thailand and Uzbekistan (6) Australasia includes: Australia and New Zealand (a) From petroleum refining and/or natural gas (b) From metal sulphide processing (c) Other (d) Sulphur; all forms (e) Including S content of sulphur ore (f) Years ended 30 June of that stated

68
Production of talc tonnes (metric)
Country 2006 2007 2008 2009 2010 Austria 159 447 153 409 154 577 111 388 138 367 Finland 547 146 535 882 527 686 * 500 000 * 500 000 France * 420 000 * 420 000 * 420 000 * 420 000 * 420 000 Greece * 250 200 * 200 * 200 * 200 Italy 130 714 117 643 * 110 000 * 110 000 * 110 000 Macedonia 1 025 1 775 977 — — Norway * 34 000 * 34 000 * 30 000 23 350 6 392 Portugal 5 517 12 367 11 657 11 567 11 951 Romania 2 967 1 513 1 843 570 296 Russia * 150 000 * 150 000 * 150 000 * 150 000 * 150 000 Slovakia — — — — 7 000 Spain 83 502 78 042 59 299 47 218 51 897 Sweden 6 000 7 000 4 000 4 000 4 000 United Kingdom 4 325 2 850 2 410 2 861 * 2 800 Egypt * 40 000 40 572 43 990 44 000 48 400 Morocco Talc 1 400 944 220 — — Pyrophyllite 12 900 26 072 25 782 33 442 27 066 South Africa Talc 10 966 14 281 5 145 4 718 3 150 Pyrophyllite 74 886 123 666 80 704 114 666 122 511 Sudan 216 2 620 4 667 1 167 — Canada 68 000 67 000 64 000 44 000 96 000 Guatemala 526 6 456 1 030 6 355 2 175 Mexico 40 535 32 410 16 405 33 421 870 USA 895 000 769 000 706 000 511 000 * 530 000 Argentina Talc 13 773 14 956 21 222 18 267 * 18 000 Pyrophyllite 9 340 9 880 9 230 * 10 000 * 10 000 Brazil (a) 389 391 485 641 513 433 577 935 * 600 000 Chile 704 764 961 790 238 Peru Talc 14 618 23 096 17 984 13 359 19 767 Pyrophyllite 14 500 — — 19 379 19 185 Uruguay 1 544 848 890 1 070 * 1 100 Bhutan 54 208 62 015 56 077 64 948 26 302 China 2 500 000 * 2 000 000 * 2 200 000 * 2 300 000 * 2 000 000 India Pyrophyllite (b) 147 807 203 707 255 699 242 397 * 204 000 Steatite (b) 739 849 922 505 888 470 835 119 * 829 000 Iran (c) 69 050 90 889 89 110 66 383 * 67 000 Japan Talc * 25 500 * 26 000 * 26 000 * 25 000 * 24 000 Pyrophyllite * 350 000 * 345 000 * 350 000 * 340 000 * 340 000 Korea (Rep. of) Talc 64 118 9 557 6 438 5 997 5 729 Pyrophyllite 677 465 798 054 892 625 617 411 673 936 Korea, Dem. P.R. of * 50 000 * 50 000 * 50 000 * 50 000 * 50 000 Nepal (d) 6 648 9 043 7 996 6 601 * 9 000 Pakistan (e) 21 065 44 886 37 999 13 923 53 991 Thailand Talc 4 373 3 508 3 264 504 672 Pyrophyllite 131 843 415 420 106 600 * 100 000 * 100 000 Vietnam Pyrophyllite * 14 000 * 16 000 * 16 000 * 16 000 * 16 000
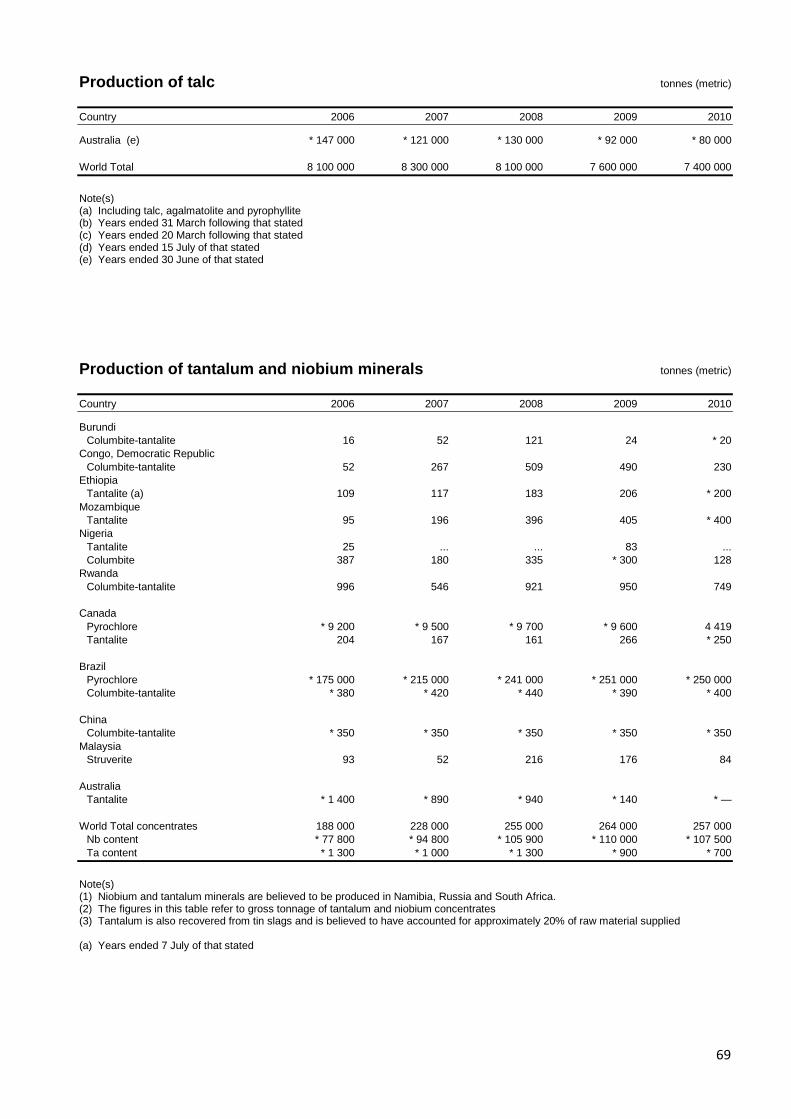
69
Production of talc tonnes (metric)
Country 2006 2007 2008 2009 2010 Australia (e) * 147 000 * 121 000 * 130 000 * 92 000 * 80 000 World Total 8 100 000 8 300 000 8 100 000 7 600 000 7 400 000
Note(s) (a) Including talc, agalmatolite and pyrophyllite (b) Years ended 31 March following that stated (c) Years ended 20 March following that stated (d) Years ended 15 July of that stated (e) Years ended 30 June of that stated
Production of tantalum and niobium minerals tonnes (metric)
Country 2006 2007 2008 2009 2010 Burundi Columbite-tantalite 16 52 121 24 * 20 Congo, Democratic Republic Columbite-tantalite 52 267 509 490 230 Ethiopia Tantalite (a) 109 117 183 206 * 200 Mozambique Tantalite 95 196 396 405 * 400 Nigeria Tantalite 25 ... ... 83 ... Columbite 387 180 335 * 300 128 Rwanda Columbite-tantalite 996 546 921 950 749 Canada Pyrochlore * 9 200 * 9 500 * 9 700 * 9 600 4 419 Tantalite 204 167 161 266 * 250 Brazil Pyrochlore * 175 000 * 215 000 * 241 000 * 251 000 * 250 000 Columbite-tantalite * 380 * 420 * 440 * 390 * 400 China Columbite-tantalite * 350 * 350 * 350 * 350 * 350 Malaysia Struverite 93 52 216 176 84 Australia Tantalite * 1 400 * 890 * 940 * 140 * — World Total concentrates 188 000 228 000 255 000 264 000 257 000 Nb content * 77 800 * 94 800 * 105 900 * 110 000 * 107 500 Ta content * 1 300 * 1 000 * 1 300 * 900 * 700
Note(s) (1) Niobium and tantalum minerals are believed to be produced in Namibia, Russia and South Africa. (2) The figures in this table refer to gross tonnage of tantalum and niobium concentrates (3) Tantalum is also recovered from tin slags and is believed to have accounted for approximately 20% of raw material supplied (a) Years ended 7 July of that stated

70
Production of tellerium metal tonnes (metric)
Country 2006 2007 2008 2009 2010 Canada 11 14 20 16 8 USA 50 50 50 50 50 Peru 37 35 28 7 — Japan 24 41 * 47 * 49 * 51
Note(s) (1) In addition to the countries listed, Germany is believed to produce tellurium metal
Mine production of tin tonnes (metal content)
Country 2006 2007 2008 2009 2010 Portugal 25 41 29 34 22 Russia (a) 2 600 2 500 1 500 1 200 * 1 000 Burundi 44 28 21 12 10 Congo, Democratic Republic 5 485 9 551 12 817 10 083 6 203 Niger 13 11 * 10 6 6 Nigeria 1 400 2 500 1 800 1 800 1 300 Rwanda 3 013 2 685 2 135 3 202 2 906 Uganda — 24 40 — 24 Bolivia 17 669 15 972 17 320 19 575 20 190 Brazil 9 528 12 596 13 899 9 500 9 600 Peru (b) 38 470 39 019 39 037 37 503 33 848 Burma * 900 * 500 * 500 * 600 * 400 China 126 300 145 900 121 200 * 128 000 129 700 Indonesia 80 933 66 137 53 228 46 078 43 258 Laos * 600 * 700 551 490 800 Malaysia 2 398 2 263 2 605 2 410 2 668 Mongolia — 14 45 8 7 Thailand 225 149 235 166 291 Vietnam * 5 400 * 5 400 * 5 400 * 5 400 * 5 400 Australia 2 783 2 071 1 783 13 269 18 646 World Total 298 000 308 000 274 000 279 000 276 000
Note(s) (a) Metal (b) Recoverable

71
Smelter production of tin tonnes (metric)
Country 2006 2007 2008 2009 2010 Belgium 8 000 8 400 9 200 8 700 9 900 Russia 3 700 3 300 1 700 1 300 * 1 800 Bolivia (a) 14 089 12 251 12 666 14 715 15 000 Brazil 8 780 9 987 11 020 8 311 10 500 Peru 40 495 36 004 38 865 34 388 36 451 China 132 100 148 800 139 900 140 400 149 400 Indonesia 65 357 64 127 53 471 51 418 43 832 Japan 854 879 956 757 841 Malaysia 22 850 25 563 31 691 35 443 38 771 Thailand 27 540 23 104 21 860 19 423 23 551 Vietnam 2 665 3 369 3 583 3 046 * 3 000 Australia 572 118 — — — World Total 327 000 336 000 325 000 318 000 333 000
Note(s) (1) Figures relate to both primary and secondary metal (2) In addition to the countries listed, many countries produce small amounts of secondary metal (a) Refined, including alloys
Production of titanium minerals tonnes (metric)
Country 2006 2007 2008 2009 2010 Norway Ilmenite 850 000 882 000 915 000 671 000 864 000 Ukraine Ilmenite * 600 000 * 600 000 * 600 000 * 600 000 * 600 000 Rutile * 100 000 * 100 000 * 100 000 * 100 000 * 100 000 Egypt Ilmenite * 120 000 108 000 88 000 88 000 11 000 Gambia Ilmenite — 672 — 54 655 69 940 Madagascar Ilmenite — — — * 240 000 * 240 000 Rutile — — — * 5 000 * 5 000 Mozambique Ilmenite — 140 515 328 875 471 524 678 400 Rutile — 8 782 6 552 1 800 4 700 Sierra Leone Ilmenite 13 819 15 750 17 260 15 200 18 206 Rutile 73 600 82 805 78 910 63 860 68 198 South Africa Ilmenite (a) * 1 330 500 * 1 402 500 * 1 360 000 * 1 445 000 * 1 200 000 Rutile 125 200 111 500 132 000 134 000 135 000 Canada Ilmenite (a)(b) * 2 400 000 * 2 500 000 * 2 600 000 * 2 000 000 * 2 400 000 USA * 300 000 * 300 000 * 200 000 * 200 000 * 200 000 Brazil Ilmenite * 130 000 130 000 110 000 39 000 * 50 000 Rutile * 3 000 3 000 3 000 3 000 * 3 000

72
Production of titanium minerals tonnes (metric)
Country 2006 2007 2008 2009 2010 China Ilmenite * 1 260 000 * 1 260 000 * 1 080 000 * 900 000 * 1 000 000 India Ilmenite (c) 692 906 678 772 676 003 * 680 000 * 680 000 Rutile (c) 16 157 20 518 19 498 * 20 000 * 20 000 Kazakhstan 13 500 15 700 * 16 000 * 17 000 * 17 000 Korea (Rep. of) Ilmenite 179 982 193 953 226 069 120 236 ... Malaysia Ilmenite 45 649 59 310 36 779 15 983 19 064 Rutile 16 921 1 450 1 834 1 502 7 567 Sri Lanka Ilmenite 57 033 70 728 56 824 122 424 52 637 Rutile 2 280 4 607 3 405 2 276 2 568 Vietnam Ilmenite (d) * 605 000 * 653 000 * 710 000 * 700 000 * 881 000 Rutile 437 574 681 620 * 620 Australia Ilmenite 2 378 000 2 339 000 2 060 000 1 626 000 1 313 000 Rutile 232 000 312 000 318 000 302 000 430 000 Leucoxene 135 000 164 000 126 000 137 000 160 000 World Total Ilmenite (wt of concs) 11 000 000 11 300 000 11 100 000 10 000 000 10 300 000 Rutile (wt of concs) 600 000 600 000 700 000 600 000 800 000 All forms (TiO2 content) * 5 800 000 * 6 100 000 * 5 900 000 * 5 400 000 * 5 700 000
Note(s) (1) The figures in this table refer to gross tonnage of titanium concentrates (2) Some ilmenite is converted to synthetic rutile in Australia, India, Japan, Taiwan and USA (3) In 2010 South Africa produced an estimated 1 400 000 tonnes of slag (85% TiO2) and Canada produced an estimated 1 000 000
tonnes of slag (80-95% TiO2) (a) It is believed that the majority of this is processed into slag (b) Canada produces some ilmenite which is sold as such and not processed into slag, but tonnages are small (c) Years ended 31 March following that stated (d) BGS estimates, based on known imports into certain countries

73
Mine production of tungsten tonnes (metal content)
Country 2006 2007 2008 2009 2010 Austria 1 153 1 117 1 122 887 975 Portugal (a) 780 846 981 823 799 Russia * 4 800 * 4 700 * 4 000 * 5 500 * 3 000 Spain — — 194 284 303 Burundi 238 163 230 100 * 100 Congo, Democratic Republic 500 580 380 360 * 360 Rwanda 1 559 1 412 1 037 693 669 Uganda 75 86 48 7 44 Canada 2 561 2 700 2 795 2 501 — Bolivia 1 094 2 501 1 448 1 290 * 1 300 Brazil (b) 533 537 408 208 * 300 Peru 50 366 456 634 716 Burma (c) 197 183 136 87 * 60 China 45 000 41 000 50 000 51 000 52 000 Kazakhstan 50 100 ... ... ... Korea, Dem. P.R. of * 900 * 250 * 350 * 350 * 350 Kyrgyzstan * 100 * 100 * 100 * 100 * 100 Mongolia 124 166 97 27 14 Thailand (a) 546 823 582 200 326 Uzbekistan * 300 * 300 * 300 * 300 * 300 Australia (d)(e) 13 30 11 17 11 World Total 60 600 58 000 64 700 65 400 61 700
Note(s) (a) Wolframite and scheelite (b) Mainly scheelite (c) Including tungsten content of tin-wolframite concentrates (d) Scheelite (e) Years ended 30 June of that stated

74
Mine production of uranium tonnes (metal content)
Country 2006 2007 2008 2009 2010 Czech Republic 383 322 290 286 259 Germany 65 41 — — * 8 Romania * 90 * 77 * 77 * 75 * 77 Russia 3 262 3 413 3 521 3 564 3 562 Ukraine * 800 846 * 800 840 850 Malawi — — — 90 671 Namibia 2 782 3 680 5 074 5 080 4 965 Niger 3 431 3 153 2 993 3 241 4 198 South Africa 542 525 654 629 583 Canada 9 862 9 475 9 001 10 176 9 684 USA 1 581 1 746 1 503 1 428 1 628 Brazil 190 299 330 345 148 China * 750 * 712 * 769 * 750 * 827 India * 230 * 270 * 271 * 290 * 400 Kazakhstan 5 279 6 637 8 521 13 900 17 803 Pakistan * 45 * 45 * 45 * 50 * 45 Uzbekistan 2 270 2 320 2 338 2 429 2 400 Australia 7 606 8 603 8 471 7 942 6 085 World Total 39 200 42 200 44 700 51 100 54 200 World Total (U3O8 equivalent) 46 300 49 800 52 700 60 300 63 900
Note(s) (1) Excluding uranium production from decommissioning operations in France, Germany and Spain
Mine production of vanadium tonnes (metal content)
Country 2006 2007 2008 2009 2010 Russia * 24 000 * 23 000 * 23 000 * 22 000 * 21 000 South Africa 23 800 23 486 20 295 14 353 22 606 China * 17 000 * 18 000 * 18 500 * 20 800 * 22 000 Kazakhstan * 1 000 * 1 000 * 1 000 * 1 000 * 1 000 World Total 66 000 65 000 63 000 58 000 67 000
Note(s) (1) This table includes vanadium in slag products but excludes vanadium recovered as a by-product of the refining and burning of heavy
oils

75
Production of vermiculite tonnes (metric)
Country 2006 2007 2008 2009 2010 Russia * 30 000 * 30 000 * 30 000 * 30 000 * 30 000 Egypt * 6 700 5 770 7 560 4 650 — South Africa 197 765 199 664 199 764 193 334 199 285 Uganda 3 512 3 269 — — 1 121 Zimbabwe 13 421 17 395 16 123 3 211 — USA (a) * 100 000 * 100 000 * 100 000 * 110 000 * 100 000 Argentina 1 585 1 726 1 813 2 150 2 200 Brazil 19 279 18 952 29 000 22 700 * 23 000 China * 110 000 * 110 000 * 120 000 * 120 000 * 130 000 India (b) 11 827 8 910 12 647 12 847 * 20 300 Japan * 6 000 * 6 000 * 6 000 * 6 000 * 6 000 Australia (c) 9 392 8 900 8 319 6 548 7 922
Note(s) (1) In addition to the countries listed Malawi is believed to produce vermiculite (a) Sold or used by producers (b) Years ended 31 March following that stated (c) Years ended 30 June of that stated
Production of wollastonite tonnes (metric)
Country 2006 2007 2008 2009 2010 Finland 16 200 16 364 15 600 * 16 000 * 16 000 Spain ... 10 918 10 100 7 000 6 000 Namibia 55 * 55 * 55 — — Mexico 44 280 50 809 46 844 29 728 46 548 USA * 125 000 * 125 000 * 90 000 * 65 000 * 67 000 China 350 000 * 350 000 * 325 000 * 300 000 * 300 000 India (a) 131 572 118 666 111 581 132 385 * 171 000
Note(s) (1) In addition to the countries listed, Turkey is believed to produce wollastonite (a) Years ended 31 March following that stated

76
Mine production of zinc tonnes (metal content)
Country 2006 2007 2008 2009 2010 Armenia 2 270 2 560 3 880 3 564 7 468 Bosnia & Herzegovina 902 4 799 8 595 6 228 10 025 Bulgaria (a) 16 108 14 453 12 819 9 339 9 904 Finland 35 700 38 900 27 800 30 233 55 562 Greece 16 000 20 700 24 200 17 800 18 400 Ireland, Republic of 425 800 400 900 398 200 * 385 700 342 500 Kosovo — — (a) 4 902 (a) 5 582 (a) 6 449 Macedonia 10 836 30 957 38 737 38 648 32 900 Poland 126 600 129 600 132 400 115 500 107 700 Portugal 7 505 24 380 37 900 501 6 422 Romania 8 052 849 14 — — Russia 178 000 177 000 204 000 225 000 269 000 Serbia 2 100 1 200 2 400 2 700 2 600 Spain — — — 5 900 17 600 Sweden 210 029 214 576 187 987 192 502 198 687 Turkey 122 300 140 500 126 800 135 800 195 500 Algeria 303 — — — — Congo, Democratic Republic 16 800 18 500 15 465 19 696 9 223 Morocco 74 400 54 353 80 747 44 800 44 300 Namibia 208 000 196 000 204 000 244 400 236 500 South Africa 34 444 31 062 29 002 28 200 36 142 Canada 637 956 630 485 750 502 699 145 648 905 Honduras 37 646 29 211 28 462 36 370 33 839 Mexico 479 400 452 012 453 588 489 766 570 004 USA 727 100 803 300 778 100 735 700 748 000 Argentina 29 808 27 025 30 349 31 869 32 600 Bolivia 172 747 214 053 383 618 430 879 411 409 Brazil 185 211 193 899 173 933 172 688 * 192 000 Chile 36 238 36 453 40 519 27 801 27 662 Peru 1 203 364 1 444 354 1 602 597 1 512 931 1 470 510 Burma * 8 000 * 10 000 * 7 000 * 6 000 * 8 600 China 2 844 200 3 047 700 3 342 600 3 324 400 3 699 600 India (b) 504 863 551 268 647 659 679 534 * 737 000 Iran 166 000 75 000 86 000 72 048 * 72 000 Japan 7 200 — — — — Kazakhstan 404 600 386 000 387 400 398 400 405 300 Korea (Rep. of) 16 2 034 1 836 2 221 355 Korea, Dem. P.R. of * 75 000 * 78 000 * 48 000 * 29 000 * 36 000 Laos 4 000 3 000 2 200 3 400 3 000 Mongolia 54 950 77 350 71 800 70 750 56 300 Pakistan — — — 1 000 10 000 Philippines 3 000 7 400 1 619 10 035 9 268 Saudi Arabia 983 716 3 663 4 952 5 000 Thailand 32 103 26 406 17 811 27 493 21 971 Vietnam 45 000 45 000 42 000 38 000 36 000 Australia 1 362 000 1 514 000 1 519 000 1 290 000 1 480 000 World Total 10 500 000 11 200 000 12 000 000 11 600 000 12 300 000
Note(s) (a) Metal content of ore (b) Years ended 31 March following that stated

77
Production of slab zinc tonnes (metric)
Country 2006 2007 2008 2009 2010 Belgium 238 000 254 000 251 000 137 000 281 000 Bulgaria 85 900 98 100 101 700 92 700 92 300 Finland 282 238 305 543 297 722 295 049 307 144 France 120 000 129 000 118 000 161 000 162 000 Germany 342 566 294 735 292 284 * 153 000 165 000 Italy 109 200 102 100 107 100 103 400 104 700 Kosovo — — — 5 487 * 5 500 Netherlands 238 274 234 000 250 000 224 000 264 000 Norway 160 670 157 027 145 469 138 973 148 862 Poland 133 900 141 900 142 500 139 100 135 100 Romania 43 705 58 342 61 978 1 000 — Russia 248 000 263 000 263 000 208 000 264 000 Serbia 15 000 2 000 — — — Spain 507 300 509 000 466 000 515 000 517 100 Ukraine 1 700 2 600 3 800 8 800 7 600 Algeria 32 854 27 249 30 752 33 000 36 000 Namibia 129 897 150 100 145 400 153 815 151 688 South Africa 90 000 101 000 82 000 87 000 90 000 Zambia — 1 000 2 000 — — Canada 824 464 802 103 764 310 685 504 691 222 Mexico 279 734 321 932 305 188 313 044 322 508 USA 268 900 278 000 286 000 203 500 248 000 Argentina 45 991 46 300 42 600 35 600 * 41 000 Brazil 279 000 265 126 248 874 242 000 288 100 Peru 175 250 162 575 190 324 149 494 223 112 China 3 162 700 3 742 600 4 042 300 4 286 300 5 164 200 India 415 000 441 000 589 000 640 000 735 000 Iran (a) 139 000 125 000 * 110 000 115 200 112 000 Japan 614 331 597 650 615 533 540 604 574 008 Kazakhstan 364 821 358 226 365 572 327 900 318 800 Korea (Rep. of) 667 000 691 000 739 000 722 000 750 000 Korea, Dem. P.R. of * 51 000 * 36 000 * 41 000 * 26 000 * 42 000 Thailand 94 779 99 337 107 753 104 695 95 219 Uzbekistan 46 000 71 800 70 400 19 000 * 56 000 Vietnam * 10 000 * 10 000 * 16 000 * 17 000 * 16 000 Australia 464 000 502 000 500 000 525 000 498 000 World Total 10 700 000 11 400 000 11 800 000 11 400 000 12 900 000
Note(s) (a) Years ended 20 March following that stated

78
Production of zirconium minerals tonnes (metric)
Country 2006 2007 2008 2009 2010 Russia (a) * 7 500 7 136 * 7 000 * 5 000 * 6 000 Ukraine * 35 000 * 35 000 * 35 000 * 35 000 * 35 000 Gambia 410 355 — — — Madagascar — — — * 8 000 * 8 000 Mozambique ... 26 347 32 985 21 100 37 100 South Africa 414 400 388 800 404 000 392 000 381 000 USA 143 000 121 000 122 000 * 100 000 * 110 000 Brazil (a) 25 120 26 739 25 300 34 200 * 37 000 China * 135 000 * 140 000 * 140 000 * 130 000 * 140 000 India 20 535 35 977 29 158 * 29 000 * 29 000 Indonesia * 65 000 * 111 000 * 65 000 * 63 000 * 50 000 Malaysia 1 690 7 393 984 1 145 1 261 Sri Lanka 8 321 381 1 447 10 267 9 200 Thailand — 1 023 — — — Vietnam (b) * 27 000 * 22 000 * 24 000 * 8 000 * 8 000 Australia 491 000 600 000 528 000 431 000 540 000 World Total 1 374 000 1 523 000 1 415 000 1 268 000 1 392 000
Note(s) (1) In this table the term 'zirconium minerals' is understood to mean zircon, unless otherwise stated (a) Including caldasite rock containing zircon and baddeleyite (b) Conservative BGS estimates, based on exports

Price £30