Embed Size (px)
Citation preview

WORLD METEOROLOGICAL ORGANIZATION
COMMISSION FOR AGRICULTURAL METEOROLOGY
CAgM Report No. 94
CONTRIBUTIONS FROM MEMBERS ON
OPERATIONAL APPLICATIONS IN AGROMETEOROLOGY AND FROM DISCUSSANTS OF THE PAPERS
PRESENTED AT THE INTERNATIONAL WORKSHOP: “REDUCING VULNERABILITY OF AGRICULTURE AND FORESTRY
TO CLIMATE VARIABLITY AND CLIMATE CHANGE”
WMO/TD No. 1213
Geneva, Switzerland August 2004

ii
“This report has been produced without editorial revision by the WMO Secretariat. It is not an official publication and its distribution in this form does not imply endorsement by the organization of the ideas expressed.”

iii
WORLD METEOROLOGICAL ORGANIZATION
COMMISSION FOR AGRICULTURAL METEOROLOGY
CAgM Report No. 94
CONTRIBUTIONS FROM MEMBERS ON
OPERATIONAL APPLICATIONS IN AGROMETEOROLOGY AND FROM DISCUSSANTS OF THE PAPERS
PRESENTED AT THE INTERNATIONAL WORKSHOP: “REDUCING VULNERABILITY OF AGRICULTURE AND FORESTRY TO
CLIMATE VARIABLITY AND CLIMATE CHANGE”
WMO/TD No. 1213
Geneva, Switzerland August 2004


CONTENTS Introduction ................................................................................................................................1 SECTION 1: CONTRIBUTIONS FROM MEMBERS ON OPERATIONAL
APPLICATIONS IN AGROMETEOROLOGY Abdalla, H. Contributions to the Impacts of Present and Future Climate Variability on Agriculture and Forestry in the Arid and Semi-Arid Tropics.......................................................................................................3 Abdullaev, A. & On Agrometeorological Servicing of the Agricutlure in Uzbekistan L. Grom in the Beginning of XXI Century................................................................5 Abdullaev, A. About the Future Possible Climate Changes and Proposals on
the Adaptation strategy of the Cotton Growing on the Territory of Uzbekistan.............................................................................................6
Alexandrov, V. Climate Variation and Crop Production in Georgia, USA, During
the Twentieth Century...............................................................................8 Bockari, A. Impact of Present and Future Cliamte Variability on Agricutlure
and Forestry in Sub-humid and Humid Tropics........................................10 Carvajal, M. Operational Aspects of Agrometeorology.................................................12 Chinese Meteo - The Current Status of Climate Operations in National Climate rological Admin. ServiceCenter...........................................................................................15 Dobesberger, E. Climate Based Modeling of Pest Establishment and Survival in et. al Support of Pest Risk Assessment............................................................16
El-Rhman, A. D. & M. A. El-Rafy River Nile Floods and Droughts in Relation to Jet Streams and
SSTs..........................................................................................................19
Gualterio, H. Effects of Climate Variability and Global Climate Change in Chile ..........19 Hyera, T. M. Examples of Adaptation Strategies for Climate Variability and
Climate Change in Tanzania.....................................................................21 Kifle, B. Urban Heat Island Features in the Horn of Africa City of Central
Ethiopia......................................................................................................22 Komuscu, A. U. Climatic Variability in Turkey in Relation to Air Pressure Systems
and North Atlantic Oscillation (NAO)........................................................23
Komuscu, A. U. & A. Erkan Implications of Climate Change for Soil-Water Availability in the
South Eastern Anatolia Project (GAP) Region .........................................27 Korecha, D. Why Does Climate Conflict with Agricultural Activities in Ethiopia?.........32
ii
Kozhakhmetov, P. & E. Antipova Information on Experience of Kazhydromet on Reducing of
Vulnerability of Crops and Forecasting of Climate Changes...................33 Kozyra, J. Climatic Conditions for Millet Cultivation in Poland..................................34 MIMH, Mongolia Climate Change Impacts on Animal Husbandry in Mongolia...................36 Prokopenko, A. et al Effect of Climate Change on Food Production in Ukraine........................39 Tourmanidze, T. Estimation of Vulnerability of Agriculture to the Climate Variability and Climate Change in Georgia...............................................39 Vento, D. CLIMAGRI: A Research Project of the Italian Ministry of Agriculture on the Influence of Climate Change on Agriculture...............43 Zhao, Y. Examples in Operational Aspects of Agrometeorology on Climate Variability and Climate Change..............................................44 Zorba, P. Agrometeorological Information Used in Agriculture and Forestry Economy in Albania.............................................................45 SECTION 2: CONTRIBUTIONS FROM DISCUSSANTS OF THE PAPERS PRESENTED AT
THE INTERNATIONAL WORKSHOP: “REDUCING VULNERABILITY OF AGRICULTURE AND FORESTRY TO CLIMATE VARIABLITY AND CLIMATE CHANGE”
Overview – Climate Variability and Climate Change: Past, Present and Future Bandara, K. R. A. The Expected Effects of Climate Change on Agriculture ........................50 Seng, T. L. Discussion by Tan Lee Seng-Malaysian Met. Service..............................51 Impacts of Present and Future Climate Variability on Agriculture and Forestry in the Sub-Humid and Humid Tropics Kashasha, D. Discussion by Deusdedit Kashasha – Tanzania Met. Agency .................52 Van Viet, N. Climate Change and Variability in Viet Nam and Strategies of Sustainable Development on Agriculture. ...........................52 Wigmore, W. Discussion by William Wigmore, Ministry of Agriculture...........................66 Impacts of Present and Future Climate Variability on Agriculture and Forestry in the Temperate Regions: Europe Susnik, A. Vulnerability Assessment of Slovenian Agriculture to Climate Variability and Potential Impacts of Climate Change................................68

iii
Impacts of Present and Future Climate Variability on Agriculture and Forestry in the Temperate Regions: North America Guerreiro, R. Climate Variability in Mainland Portugal Impacts on Agriculture..............69 Assessing the Consequences of Climate Change for Food and Forest Resources: View from the IPCC Pintar, M. Climate Change: A Field Scale Study......................................................69 Azzaya, D. Climate Change Impacts on Pasture and Animal Husbandry in Mongolia ................................................................................................70 Achieving Adequate Adaptation in Agriculture Banovec, P. Development of Registry of Irrigation and Drainage Schemes in Slovenia . ...............................................................................................71 Seng, T. L. Malaysian Strategies for Adaptation . .......................................................71 Popova, Z. Case Study of Bulgaria..............................................................................72 The Development of Seasonal and Inter-annual Climate Forecasting Van Viet, N. Using ENSO Forecasts for Anticipating Potencial Impacts on Agricultural Sector in the Socialist Republic of Viet Nam .........................73
Seasonal and Inter-annual Climate Forecasting: The New Tool for Increasing Preparedness to Climate Variability and Change in Agricultural Planning and Operations Porteous, A. Discussion by Alan Porteous, NIWA .........................................................84 Climate, Communications and Innovative Technologies: Potential Impacts and Sustainability of New Radio and Internet Linkages in Rural African Communities Maiga, D. Discussion of Djibrilla Maiga, National Directorate of Met........................85 Using Traditional Methods and Indigenous Technologies for Coping with Climate Variability Das, H. P. Potential of Water Harvesting in Semi-Arid and Arid Zones by Tradicional Methods with Particular Reference to India ...........................86 Regmi, R. K. Discussion by Ramesh Regmi, Dept. of Hydrology & Met. ......................88 Management Strategies with Particular Emphasis on Carbon Sequestration to Mitigate Greenhouse Gas Emissions from Agroecosystems Das, H. P. Management Strategies on Carbon Sequestration from Agro-................88 Ecosystem with Particular Reference to India

iv
Role of Education and Training in Agricultural Meteorology to Reduce Vulnerability to Climate Variability Lee, B-L. Discussion by Byong -Lyol Lee, Korea Met. Administration......................91 Agrometeorological Research and Applications Needed to Prepare Agriculture and Forestry Adapt to the 21st Century Climate Change Zhao, Y. Discussion by Yanxia Zhao, Chinese Met. Administration.......................92 Kajfez-Bogataj, L. Agrometeorological Research and Mountain Agriculture in the 21st Century................................................................................................92 Shami, S. Discussion by Saifullah Shami, Pakistan ..................................................95

1
INTRODUCTION
This volume is published as a companion publication to the Special Isssue of Climatic
Change (2004) edited by Drs M. J. Sallinger, M. V. K. Sivakumar and R. M. Motha based on the papers presented at the International Workshop on “Reducing Vulnerability of Agriculture and Forestry to Climate Variability and Climate Change”, held in Ljublijana, Slovenia, from 7 to 9 October 2002.
The organizers had distributed drafts of the papers to be presented at the workshop by
invited authors well in advance to all the CAgM members. Simultaneously, we had requested contributions from the CAgM members on operational applications in agrometeorology, related to the subjects of the papers. Later we had also invited several members and non -members of CAgM to be discussants for these papers.
These contributions from CAgM members on operational applications in agrometeorology
and discussants complement the Special Issue of Clima tic Change published this year. It was felt that this process increased the participation and enhanced the discussion on the workshop issues by as many members of CAgM as possible.

2
SECTION 1
CONTRIBUTIONS FROM MEMBERS ON OPERATIONAL APPLICATIONS IN AGROMETEOROLOGY

3
CONTRIBUTION TO THE IMPACTS OF PRESENT AND FUTURE CLIMATE VARIABILITY ON AGRICULTURE AND FORESTRY
IN THE ARID AND SEMI-ARID TROPICS
(Haroun Abdalla, Sudan, Meteorological Authority)
The general circulation over the glo be determines the nature and extent of distribution of the meteorological variables such as rainfall, temperature etc. The living environment over our planet is essentially governed by the temporal and special variability of these variables. It is rather a question of how vulnerable is an area to climate change iterated by the ongoing changes in the behaviour of the meteorological variables.
In the arid and semi-arid regions of the tropics the most important meteorological elements
influencing the living environment are rainfall and temperature. Rainfall and temperature are in turn extremely affected by the randomness and the sequences of weather patterns determined by the distribution of atmospheric pressure in association with the distribution of thermal energy over the globe. High temperatures generally reduce production of many animal breeds by reducing their food intake. Cattle will normally graze more in shade than in the sun (Starr, 1988). Dairy cows produce less milk under high temperatures and hens produce smaller eggs. Fat and flesh production are also minimal and are slowly built up. It is, therefore, evident that exposure of livestock to increasing temperatures in the arid and semi-arid tropics lowers productivity. It is also evident that the on-going increase in temperature shall interfere with the economy of the residence and agricultural practice can only provided limited unsatisfactory income.
Heavy showers in the tropics many fall irrespective of the time of the day (Barry, 1987).
Light rains may also fall in the form of drizzle or dew. In the arid areas with 100-200 mm of rain on average, nomadic camel herding with some sheep is the only possible use of land, such as is found in Sahara where one livestock unit requires thirty hectares of land (Noordwijk, 1984). The nomads of the Sahara live mainly by grazing camels on pasture that receive less than 150 mm of rain a year. In summer they migrate southwards, following the rainfall, and in autumn they go northward, camping at watering points. As the rains get less the style of life shall change. The question is how much such change is likely to occur.
In the semi-arid regions of the tropics, with 200-400 mm of rain, cattle herding becomes
possible, provided there are watering points. With less rain, which is becoming a natural phenomenon, drinking water and fodder become hazardous especially as the watering points become less available.
The growth rate of annual vegetation is strongly influenced by the pattern and amount of
seasonal rainfall. According to Hiernaux (1993), The Sahelian pastoralism, for example, has been in deep crisis for decades. This crisis hits the subsistence economy, which is dependant on animal production associated with cereal cropping and harvesting of natural products. The decline in feed availability follows a long series of low rainfall and drought years such as that began in Mali in the late 1960s. Hiernaux continued to say that the reduction in the productivity of the rangelands and the associated structural and floristic changes can be explained by this drying of the climate.
Sudan experienced several drought incidences during last century. These incidences
occurred during 1933/39, 1951/53, 1968/73 and 1983/84. The later was the most severe one. During the 1990s, drought symptoms were observed more frequent in the arid regions of the country (Table 1). Crop season in El Fasher area begins in July and last for three months. It is clear from the table that crop failure was imminent as the occurrence of dry years was more frequent during 1984-96 in contrast to the previous years when dry years were observed 1 in 15 at the earliest. Animal rearing was also risky because grazing land and watering points were diminishing. The semi-arid areas of the Sudan witnessed repeatedly far below normal rainfall in recent year. El Geneina (Table 2) is an example for an area where rainfall could hardly support

4
growing the traditional annual crops in seven years out of thirteen years. Such irregularity was uncommon and it may indicate a case of an induced climate variability.
Table 1. Dry years at El Fasher (Lat. 13° 38N, Long. 25° 20E, Alt. 730m) during 1984-96
Average
rainfall (mm) 1971-2000
1984 1987 1989 1990 1991 1993 1996
May 7 1 21 39 0 1 24 8 June 10 0 19 15 3 0 4 23 July 55 35 13 11 74 27 20 49 Aug 81 31 91 49 22 181 58 62 Sept 33 40 58 44 25 3 22 7 Oct 5 0 10 0 0 0 8 1
Annual 193 107 214 158 125 213 150 150
Table 2. Dry years at El Geneina (lat. 13° 29N, Long 22° 27E, Alt 805m) during 1984-96
Ave rage
rainfall (mm) 1971-2000
1984 1987 1989 1990 1991 1993 1996
May 9 0 6 0 0 19 6 15 June 35 8 20 51 34 18 47 24 July 143 23 78 50 284 194 78 82 Aug 143 36 122 153 76 182 227 87 Sept 53 49 2 78 22 2 25 47 Oct 10 8 9 51 7 0 4 19
Annual 397 124 238 384 424 426 395 274
Source: Sudan Meteorological Authority.
It is desirable to combine information on rainfall with that on the NDVI in order to monitor the extent of drought impact in the arid and semi-arid tropics and also to define the desert margin. The area of such margin varies from time to time depending on rainfall and vegetation conditions. For planning purposes, probability and risk maps can be used to assess broad regional areas most likely to suffer from drought (Salih, 1996). These areas would, effectively, be the first to suffer in the event of poor rains in any one year as the case in arid and semi-arid tropics. However, it remains of vital importance to develop mechanisms and implement plans of action to mitigate drought in these areas that are characterized by marginal agriculture. Artificial rain could be looked upon as an operational plan of action. Nevertheless, top-level decisions to restore the natural healthy environment would be anticipated.
References
Barry, R.G., 1987: Atmosphere, weather and climate. Methuen & Co. Ltd. Baselines of vulnerable sectors, Sudan country report, Ministry of Environment and Tourism,
1999. Hiernaux, P., 1993; The crisis of Sahelian pastoralism ILCA, Ethiopia. Noordwijk, M.V., 1984: Ecology textbook for the Sudan. Khartoum University Press. Report of the soil conservation committee, Sudan Government, 1944

5
Salih, E.M., 1996: The geographical extent of desertification in Sudan. Albuhuth Scientific Journal, National Centre for Research, volume 5.(1), 18-40
Starr, J.R., 1988: Weather, climate and animal performance. WMO-No. 684, Tech. Note. No.
190, WMO, Geneva.
ON AGROMETEOROLOGICAL SERVICING OF THE AGRICULTURE IN UZBEKISTAN IN THE BEGINNING OF THE XXI CENTURY
(A. Abdullaev and L. Grom, Uzbekistan Hydrometeorological Service, Glavgidromet)
At present the agrometeorological service means the operational provision for all kinds of
agricultural production with the different agro- and hydrometeorological information.
In Uzbekistan, the agrometeorological service is carried out on the base of the existing guiding and regulatory documents which specifes the address of the customer, the amount and dates of the presentation of information. In accordance with the agreed plans-schemes the hydrometeorological servicing is carried out for more than 200 bodies of the agricultural sector of the republic. In the beginning of the 21 century, the following organizations are involved into the agrometeorological servicing of the agriculture sector of Uzbekistan: Hydrometcentre of Glavgidromet of Uzbekistan, 13 regional hydrometeorological sub -divisions, 89 stations and hydrological gauging stations.
The operational sub-divisions of Glavgidromet present the following information for the
agricultural and governmental bodies: weather forecasts for the month, 5 days, 24 hours, storm warnings about severe weather phenomena and natural disasters; long - and short-term hydrological forecasting for the river basins and big water storages; agrometeorological forecasts; special information for the request and consulting on hydrometeorological regime; regime and reference (monthly- and yearbooks, references) and other materials (daily, decade and monthly bulletins, reviews, etc.).
The use of new techniques for weather forecasting with the account of the regional specific
features, makes it possible to achieve a high reliability of the forecast in the middle of 1990’s: 90 to 92% of meteorological forecasting and 91 to 92% of hydrological and 94% of agrometeorological ones. For the storm warnings the reliability was 94 to 95% and for the natural disasters – 100%.
Agrometeorological information is presented as the daily, 5 and 10-day reviews (bulletins),
seasonal reviews and as the special reports. The experts and administrators of the agriculture use this information for the fixing the dates for starting the necessary field practices with the account of the existing and expected agrometeorological conditions for the most effective use of the agricultural facilities and planning the seeding and harvest activities, etc.
On the base of the results of observations, received from the network, the evaluation is
made for the state of the forthcoming amount and quality of the agricultural yield, wintering of the winter kinds of crops, seeding and harvesting conditions, cattle grazing on the pastures.
At present, the following types of agrometeorological forecasts are made: • Forecast of the development period of agricultural crops: (cotton, spike cereals,
fruits, grapes, mulberries, perennial and seeded grasses, vegetables and melons and water melons). They contain the information about the beginning of the blossom of gardens, opening of the first leaves of mulberry tree, the beginning of the vegetation and maturing of the pastures, beginning of the ear-formation and maturing of the spike cereals, blossom and opening of the first cotton bolls, etc.

6
These dates are compared with the mean-longterm and past year dates, which provides for the assessment of the conditions of the yield -formation;
• Forecast of the yield and gross value of the spike cereals, of the cotton, rice and
maize for 1-3 months in advance, developed at SANIGMI and based on the quantitative relationships between the agricultural crops. The forecasts are made for the oblasts and regions of the republic;
• Forecasts of the state of the winter spike cereals to the beginning of the spring
vegetation with the indication of the areas with the unfavourable wintering conditions. Two-month forecasting is made for the expected areas with the bad conditions of the sowings where the additional sowing or repeated sowing of the spring crops is needed.
The results of the car-surveys of the state of the seeded crops and of the air-surveys of the
pastures and the spike cereals are widely used.
The developed forecasting techniques with the account of the objective assessment of the crop state using the results of agrometeorological observations provided for the high reliability (%) forecasts available for the users in 2001.
Table 1. The reliability of the agricultural forecasts in 2001
NN Type of the Forecast Reliability (%)
1.0 Yield capacity and gross value of:
1.1 Raw cotton 99
1.2 Spike cereals 97
2.0 State of the winter crops at the moment of the spring vegetation 100
3.0 Rate of the crop development
3.1 Cotton 93
3.2 Spike cereals 97
3.3 Fruits 98
3.4 Grapes 95
3.5 Mulberry 97
3.6 Pasture vegetation 100
3.7 Alfalfa 93
ABOUT THE FUTURE POSSIBLE CLIMATE CHANGES AND PROPOSALS ON THE ADAPTATION STRATEGY OF THE COTTON GROWING
ON THE TERRITORY OF UZBEKISTAN
(A. Abdullaev, Uzbekistan Hydrometeorological Service,Glavgidrome))
The on-going climate changes are the issue of the worldwide concern. In this regard, the scientists of the Bugaev’s SANIGMI carried out the studies of the climate change and variations in the Central Asia related to the global climate changes. During this studies the certain trend was found out in the variations of the climate parameters (temperature, precipitation) with 70-, 35-, 22- and 17 years periods Kim I, (1996).

7
Usmanov V., Nikulina S. and Chub V. used the results of the model estimations of the greenhouse gases impact on the climate changes. It was found, that in case of realization of IPCC IS92a and IS92b scenarios of the greenhouse gas emission it is forecasted, that in the Republic of Uzbekistan the mean-year temperature will increase in 0.8 -3.4°C, for IS92c and IS92b in 0.6-2.4°C and for IS92e and IS92f, the range is 0.9 -3.7°C.
The author made the adjustment of the air temperature changes to the periods of the
cotton development for the scenarios of IPCC IS92a –IS92f greenhouse gases emissions.
The analyses of the obtained results has shown, that the territory of the Republic of Uzbekistan can be sub-divided into three groups. The first one included the Republic of Karakalpakstan, where the most substantial temperature rise is expected (up to 2.8°C in average). The second one includes Kashkadarja, Navoii, Samarkand, Surkhandarja and Tashkent oblasts. The warming in 1.5-2.5°C is expected. The rest oblasts are in the third group, where the temperature rise will not exceed 1.5°C.
In the scientific works of Abdullaev A., Usmanov V., Nikulins S. and Chub V. (1999-2000) it
is indicated that the main direct climate effects will be manifested in the temperature rise, precipitation enhancement, and duration of vegetation period.
Our studies show that the dates of the stable, 10°-change of the mean daily air temperature
in spring will be 5 -10 days earlier and 5 -15 days later in autumn, while the sums of the effective air temperature required for the plants will increase in 9 -10%.
In Uzbekistan the whole development and vegetation of cotton depend on the timely first
irrigation. That is why we estimated the relationship between the water reserves in the beginning of spring (till the cotton seeding) in 0-30 cm soil layer (WB) in the end of the autumn period of the previous agricultural year (WO) and precipitation total in December-February. The following equation was derived:
WB = 0.74 WO + 0.03R + 16.6, r = 0.75 (1)
Basing on this equation, the author calculated the changes of the water reserves in relation
to the possible change of precipitation total in December – February. It was shown that the change is negligible.
In general, it is expected that the conditions necessary for the increase of the number of
the developed, opened and matured cotton bolls will be improved in Uzbekistan. This will provide both for the increase of the raw cotton yield, and improvement of its quality (only with the condition of the necessary water supply to the cotton seedlings).
The results of the studies carried out by the author, the analysis of the IPCC reports and
other scientific papers where used in the proposals made for the adaptation of the cotton growing practices to the climate changes in Uzbekistan.
1. In common, there is the thermal deficit in the cotton growing on the territory of Uzbekistan.
It is expected, that 15-20 years are needed for the plants adaptation, and there is no need in re-consideration of the structure of the locations of agricultural crops planting in the conditions of the climate warming.
2. It is necessary to optimize the proper use of the land and water resources, conduct the
relevant practices for the formation of the stable cotton yield and improvement of its quality meeting the requirements of the world textile industry.
3. The possible prolongation of the period with the warm and dry weather will provide for
improvement of the field practices necessary for the next-year yield.

8
4. It is necessary to use spring precipitation more effectively, and with the fixed optimum dates of the cotton seeding to use the thermal resources of that period more rationally.
5. To introduce more flexible system of the cotton growing technology and to improve the soil
treatment using the modern achievements of the related sciences (including agrometeorology).
6. Carrying out step-by-step preliminary measures for the re -orientation and restructuring of
the cotton growing practices including differe nt regimes and norms of irrigation with the account of soil salinization, structure, depth of the ground water layer and using irrigation without waste water.
7. Special attention should be paid to the improvement of the seedlings water supply, using
the regulation of moisture in the root-layer. To use the old and newly developed irrigated lands more rationally.
8. To introduce inner soil irrigation, mechanical and automated sub -soil irrigation and irrigation
in the shortened rows more extensively. To facilitate the overall improvement of the irrigation regime of land used for the cotton growing, to conduct the soil puffing using the local substances and with the account of the land used. To carry out the night irrigation for reduction of the evaporation from the fields.
9. To take a special care for the dates and norms of the cotton irrigation and the technology of
the crops growing with the increased air temperature (more than 40° during the formation of balls). For the reduction of damage caused by the unfavorab le weather phenomena first of all it is necessary to specify the agroclimatically unfavorable regions.
10. For the rational use of the power resources it is necessary to make a proper planning of
fields location and to keep the west-eastern direction of the rows which provides for the yield increase up to 10% in average.
11. To intensify the agroclimatic studies on the plants adaptation to the possible climate
changes to 2003. To disseminate the agroclimatic information among the farmers.
CLIMATE VARIATION AND CROP PRODUCTION IN GEORGIA, USA, DURING THE TWENTIETH CENTURY
(Vesselin Alexandrov, Bulgarian Meteorological Service)
Daily historical weather data for 85 weather stations were analyzed for the period 1901–
1997. Annual air temperature for the century showed a statistically significant negative trend. A similar tendency was found for both the warm- and cold-half of the year, as well as the individual winter, spring and summer seasons. Georgia has experienced several drought episodes during the 20th century, especially during the 1930s, 1950s and 1980s. Drought was most severe in 1954 across central and south Georgia, with precipitation less than 35% of the normal (1961–1990) climatic values. A decrease in precipitation during the warm-half of the year from the end of 1970s until present was found. Although there was an increase in summer precipitation from the beginning of the 1980s, the overall trend showed a decrease in summer precipitation. Most El Niño episodes during the cold -half of the year featured an increased frequency of occurrences of above normal precipitation. During the autumn El Niño events, Georgia has tended to be warmer than the normal climatic conditions. However, almost all classified winter El Niños were connected by lower mean air temperature during the winter season. This lower temperature during the winter resulted in an increase in winter wheat yield. Higher air temperatures during the growing season resulted in a shorter growing duration, causing a reduction in yield. The spring and summer crops used in this study were affected by both precipitation deficits and higher air temperatures during the warm-half of the year. Since 1961, maize yield was higher in most years

9
when El Niño events occurred during the warm-half of the year. The statistical linear yield models that were developed in this study can be used for assessments of expected anomalies of mean winter wheat, maize, soybean, peanut and cotton yield in Georgia for a particular year (Alexandrov and Hoogenboom, 2001)
Vulnerability and Adaptation Assessments of Agricultural Crops Under Climate Change in the South -Eastern U.S.A.
Daily weather data for a 30 -year period were obtained for more than 500 sites,
representing the south -eastern region of the USA. Climate change scenarios, using transient and equilibrium global circulation models (GCM), were defined, created and applied to the daily historical weather data. The modified temperature, precipitation and solar radiation databases corresponding to each of the climate change scenarios were used to run the CERES v.3.5 simulation model for maize and winter wheat and the CROPGRO v.3.5 model for soybean and peanut. The GCM scenarios projected a shorter duration of the crop-growing season. Under the current level of CO2, the GCM scenarios projected a decrease of crop yields in the 2020s. When the direct effects of CO2 were assumed, the scenarios resulted in an increase in soybean and peanut yield. Under equilibrium 2 x CO2, the GCM climate change scenarios projected a decrease of maize and winter wheat yield. The indirect effects of climate change also tended to decrease soybean and peanut yield. However, when the direct effects of CO2 were included, most of the scenarios resulted in an increase in legume yields. Possible changes in sowing data, hybrids and cultivar selection, and fertilization were considered as adaptation options to mitigate the potential negative impact of potential warming (Alexandrov and Hoogenboom, 2000a).
Potential Impact of Climate Change on Selected Agricultural Crops in North-Eastern Austria
The vulnerability and adaptation of major agricultural crops to different soils in north -eastern Austria under a changing climate were investigated by Alexandrov et al. (2002). The CERES crop model for winter wheat and the CROPGRO model for soybean were validated for the agrometeorological conditions in the selected region. The simulated winter wheat and soybean yields in most cases agreed with the measured data. Several incremental and transient GCM climate change scenarios were created and used in the study. In these scenarios, annual temperatures in the selected region are expected to rise between 0.9 and 4.8°C from the 2020s to the 2080s. The results show that warming will decrease the crop -growing duration of the selected crops. For winter wheat, a gradual increase in air temperature resulted in a yield decrease. Incremental warming, especially in combination with an increase in precipitation, leads to higher soybean yield. A drier climate will reduce soybean yield, especially on soils with low water storage capacity. All transient GCM climate change scenarios for the 21st century, including the adjustment for only air temperature, precipitation and solar radiation, projected reductions of winter wheat yield. However, when the direct effect of increased levels of CO2 concentration was assumed, all GCM climate change scenarios projected an increase in winter wheat yield in the region. The increase in simulated soybean yield for the 21st century was primarily due to the positive impact of warming and especially to the beneficial influence of the direct CO2 effect. Changes in climate variability were found to affect winter wheat and soybean yield in different ways. Results from the adaptation assessments suggest that changes in sowing date, winter wheat and soybean cultivar selection in Austria could significantly affect crop production in the country in the 21st century (Alexandrov et al., 2002).
The Impact of Climate Variability and Change on Crop Yield in Bulgaria
The objective of a study carried out by Alexandrov and Hoogenboom (2000b) was to
investigate climate variability in Bulgaria during the 20th century and to determine the overall impact on agriculture. There was no significant change in the mean annual air temperature in the country. In general, there was a decrease in total precipitation amount during the warm-half of the year, starting at the end of the 1970s. Statistical multiple regression models, describing the relationship between crop yield, precipitation, and air temperature were also developed. Several transient climate change scenarios, using global climate model (GCM) outputs, were created.

10
The Decision Support System for Agrotechnology Transfer (DSSAT) Version 3.5 was used to assess the influence of projected climate change on grain yield of maize and winter wheat in Bulgaria. Under a current level of CO2 (330 ppm), the GCM scenarios projected a decrease in yield of winter wheat and especially maize, caused by a shorter crop growing season due to higher temperatures and a precipitation deficit. When the direct effects of CO2 were included in the study, all GCM scenarios resulted in an increase in winter wheat yield. Adaptation measures to mitigate the potential impact of climate change on maize crop production in Bulgaria included possible changes in sowing date and hybrid selection of maize. References
Alexandrov, V., J. Eitzinger, V. Caijc and M. Oberfoster, 2002. Potential Climate Change Impacts
on Selected Agricultural Crops in Northeast Austria. Global Change Biology (Accepted).
Alexandrov, V. and G. Hoogenboom, 2001. Climate Variations and Agricultural Crop Production in Georgia, USA. Climate Research , Vol. 17(1), pp. 33-43.
Alexandrov, V. and G. Hoogenboom, 2000a. Vulnerability and Adaptation Assessments of Agricultural Crops under Climate Change in the Southeastern USA. Theoretical and Applied Climatology, Vol. 67(1-2), pp. 45-63.
Alexandrov, V. and G. Hoogenboom, 2000b. The Impact of Climate Variability and Change on Crop Yield in Bulgaria. Agricultural and Forest Meteorology, Vol 104(4), pp. 315-327.
IMPACT OF PRESENT AND FUTURE CLIMATE VARIABILITY ON AGRICULTURE AND FORESTRY IN SUB-HUMID AND HUMID TROPICS
(Alpha Bockari, Sierre Leone Meteorological Department)
Sierra Leone being a typical humid tropical country that is bounded by nearly half by the
Atlantic Ocean is equally prone to impact of climate variability and charge.
The ten (10) or so years of the just concluded rebel war which the country experienced caused mass movement of people from the interior to the coastal towns and cities with much strained on the meger resources of these areas.
National climate inhibiting or retaining materials such as forest reserves, green house gas
additives, coastal sand deposit etc. suffered greater degradation or regeneration as the forest around the Freetown Peninsular and other coastal settlements quickly disappeared to fuel wood or make shift hill side structures. Fishing activities increased as well as constructions and other agricultural activities such as food crop cultivation.
The global average sea-level rise of the last 1000 years and the consequent warming of
the atmosphere, though minimal in most parts of the tropics, had visible manifestation along the northern half of the coastal settlement of the country. This was discovered by the assessment that I personally headed and directed of some four (4) coastal towns of Conakry-Dee, Euraka, Adonkia and Lungi with respect to human effect, observable changes and strained on climate variable resources of populated coastal settlements.
Of the four villages selected, two were densely populated and great commercial fishing
centres, while the other two were mainly food crop production towns for the city of Freetown. One of the first two villages (Euroka) had tourist hotel facilities the Euraka hotel services, while the other town Conakry-Dee used to have the presidential resort complex for Foreign VIP Meetings. These buildings were constructed some twenty (20) years ago on dry land with some distances away from the sea.

11
However, being low tying coastal areas, the last El Niño activities possibly coupled with global warming caused the gradual extension of the sea to cover the site where these structures were constructed. Today, they have all being destro yed as can be seen from picture of the dilapidated structures.
Daily and monthly tidal wave high measurement around these areas produced interesting
results especially when correlated with the calculated values of the astronomical almanac. At the moment, most of these structures have been destroyed including the first market of Conakry-Dee by the invading sea level rise.
The effected river basins and agricultural areas have been equally accessed, the result of
which were forwarded to the relevant authorities for necessary actions that will tend to mitigate the present effect at least to within the human and resource capability. I will just highlight key findings in this brief write-up by presenting two or three pictures taken during the cause of my work. The rest of sequential pictures and data will be presented to delegates as postal of the work done in the assessment and sensitisation activities of my programme.
The following were the key assignments done in the above programme:
1. Topic: Assessment of the impact of climate variability on the
agricultural activities of selected coastal settlements along the Freetown environs after ten years of rebel war
2. Towns Selected: Conakry-Dee, Euraka, Lungi and Adonkia 3. Duration of Study: Six months (1 st May – 31 October, 2001)
Mode of Assessment: a) Wave height measurement b) Measurement of distance from sea at high tide to selected reference points. c) Interviews of people. d) Questionnaire. e) Analysis of Results.
4. Findings:
a) The economic activities of the area have greatly affected the forested regions of these places.
b) There is visible sea level rise which have caused extensive damages to properties
but with no loss of human life.
c) The wave height measurement, showed increase or positive correlation compared to the calculated value.
d) This increase may be attributed to either increase settlementation of coastal sluge or
global warming.
e) Agricultural low-lying areas are also affected by the sea extend.
5. Recommendations:
a) Movement of structures to high elevaton. b) Halting constructions in Conakry-Dee and Euraka especially along the western parts
of the town.

12
c) The reforestation of those areas affected especially along the hills and low lying areas of the coast.
d) The government to under take land -fill activities.
e) The continuous monitoring and collection of data of these areas and extension to
other regions with subsequent analyses and reporting to authorities for necessary action.
OPERATIONAL ASPECTS OF AGROMETEOROLOGY
(Manuel Carvajal, National Institute of Meteorology and Hydrology of Ecuador (INAMHI)) Impacts of Present and Future Climate Variability on Agriculture and Forestry in the Temperate Regions / Sub-Humid and Humid Tropics
The natural and current variation of the climate, well-known as Climatic Variability, plus the
Climatic Change caused by human activity, however we don't need to point out culprits, it is more important to recognize that a Climate Change exists and their impact affect all the countries and regions of the world.
Evidences of Climate Change have forced the international and national communities to
take measures in politic, scientific and institutional fields. The world answer is given with the adoption of the UNFCCC in 1992 and of the Kyoto Protocol in 1997.
Ecuador in its efforts to know about Climate Change, with vision on national requirement
and international commitments, began in 1993 the Study of Climate Change Process with the following objectives:
§ To install a basic institutional capacity to confront the Climate Change problem § To analyze the Climatic Change in Ecuador and the possible impact in strategic
areas § To define alternatives to confront Climate Change for decision making § To execute international commitments assumed
These objectives are been completed in dependence of international support and
cooperation, and have permitted to apply 22 specific studies about Climate Change were presented in the "Primera Comunicación del Ecuador" to UNFCCC in November/2000 in The Hague, supported by GEF-PNUD ECU/99/G31 Climatic Change Project.
A summary of the benefits achieved in Climate Change Scenarios in forests and
agricultural sector is exposed.
Climatic Change Scenarios in Ecuador With the purpose to maintain vulnerability evaluations and adaptation in Ecuador, the "Instituto Nacional de Meteorología e Hidrologia" INAMHI, developed a study that finished with 4 Climate Change Scenarios defined (ECC), like a result of run General Circulation Models, in accord to international experience and the climate condition of the country.
The ECC considers fundamental the tendency to increase temperature and the possibility
of more and/or less rainfall.
The defined Scenarios of Climatic Change are:

13
ECC1: temperature + 1.0 °C and rainfall - 15% ECC2: temperature + 1.0 °C and rainfall + 20% ECC3: temperature + 2.0 °C and rainfall - 15% ECC2: temperature + 2.0 °C and rainfall + 20%
Vulnerability of the Forest Ecosystems
Using Holdridge Classification and forest characteristics, the analyses gave five Climate
Change Scenarios. Applying the Climate Change Scenarios to Holdridge classification, the main results were:
• Humid and very humid cold forest (highland), decrease 1% under all the Scenarios, with
ECC3 treatment practically disappears and the area would be occupied by the warm temperate dry forest.
• Temperate dry forest (highland), increases more than twice under all the scenarios,
especially under ECC3. • Temperate humid forest (highland), decreases with less rainfall and increases with more
rainfall. • Thorny subtropical bush, under the four scenarios decreases to less than 1%, the area
would be occupied by tropical very dry forest and tropical thorny bush. • Subtropical humid forest (amazon), decreases under all the scenarios, its area would be
occupied by the tropical dry and very dry forest and tropical humid forest. • Tropical dry forest (coast and amazon), increased with ECC1 and ECC2, and decrease
with ECC3 and ECC4. • Tropical very humid forest (coast and amazon) decrease under ECC1 and ECC2, and
increase under ECC3.
With the results obtained, the study marks 3 critical areas for Climate Change impact: the greatest changes would be under ECC3, with this condition the arid and semiarid zones increase in 75%.
To affront the vulnerability, the "Ministerio de Ambiente" and "Centro de Levantamientos
Integrados de Recursos Naturales con Sensores Remotos" CLIRSEN, defined 9 project profiles to implement the adaptation measures shown by the study. Vulnerability and Adaptation (V/A) in Agricultural Sector
Ecuador is an agricultural country. The contribution of agricultural sector to "PIB" is around
18%. The 60% of agricultural areas have transitory crops. Rice, corn, potato and soybean are important for population's feeding. The study was centered on the Guayas and Guayllabamba rivers basins. Corn, potato, rice and soyben crops were selected and analyzed by DSSAT (Decision Support System for Agrotechnical Transfer) a simulation model.
The evaluation was in the feeding security context for 2010 and 2030 years, in actual
climate conditions, and under two Climate Change Scenarios (ECC2 and ECC3).
The main conclusions are shown in table N° 1 with the following data:

14
Under ECC2, the offer of rice, corn, soybean and potato would exceed in different amounts the inhabitants requirements in 2010. Under ECC3, the offer of rice and potato would be above the demand, the opposite condition would happen with soybean and corn.
For 2030 under Climate Change scenarios ECC2 and ECC3, the demand would overpass
in several levels the offer in rice, potato and soybean. In the case of corn, the condition would be opposite.
The "Ministerio de Agricultura y Ganadería" defined 5 projects profiles to apply adapting
measures suggested by the study. The projects profiles are:
• Agroecological zonification and appropriate seeding and harvesting calendar. • Use of better yields varieties • Installation of irrigation systems. • Appropriate use of fertilizers. • Application of different systems to control plagues and diseases
Table 1. Impact of Climate Change in feeding security (%)
2010
2030
WITHOUT CLIMATIC
CHANGE ECC2 ECC3
WITHOUT CLIMATIC
CHANGE ECC2 ECC3
PRODUCT
Area Prod. Prod. Prod. Area Prod. Prod. Prod.
RICE 61 107 23 -49 104 162 -3 -60
CORN 20 96 417 199 35 114 309 137
SOYBEAN 41 42 23 20 62 80 -3 -5
POTATO 56 56 178 -17 62 97 120 -34
Source: - National communication of Ecuador before the Convención Marco of the United Nations
about Climatic Change (UNFCCC), 2000. - Study of Climatic Change in Ecuador. General summary, 1998
Management of Strategies with Particular Emphasis on Carbon Sequestration to Mitigate Greenhouse Gas Emissions from Agroecosystems
The more representative program in Ecuador about carbon sequestration is going by
PROFAFOR of Ecuador (Programa Face de Forestación), it is supported by FACE (Forest Absorbing Carbondioxide Emission) from Netherlands, this program born in 1990 by SEP (Society of Energy Producers) an agree among 4 energy enterprises, they have plants that working with fossil combustibles (coal), produce a high emission of carbon dioxide to atmosphere that produce an increase of global temperature.
FACE is carrying out seven projects around the world, with a total of 150 000 ha of
reforesting, in Ecuador since 1993, they are trying to get 75 000 ha (reforest) in the highland and in the cost, specially with native species, nowadays they have more tan 19 000 ha only in the highland, the project is in execution, and give loans to farmers, associations of producers, and natural owner with more than 50 ha to be reforest, with a leasing by 99 years, so the owner cannot sell the properties without the approval of FACE and they cannot cut the trees until FACE approve it.
Reference: PROFAFOR del Ecuador, "Manual de Contratos", Octubre 1999

15
THE CURRENT STATUS OF CLIMATE OPERATIONS IN NATIONAL CLIMATE CENTER
(Chinese Meteorological Administration)
The National Climate Center (NCC) is a national operation center responsible for both the
operation and research of climate, with a weighted focus on operation . NCC operation system aims at satisfying the need of the sustainable, fast and steady development of the national economy, strengthening the modernization of climate operation system, supporting the operation system through scientific researches, and developing multi-level climate information service system, trying to be one of international climate operation centers and the Asian centers in the global regional climate operation center web. The operation mainly include the follows:
1. Short-term climate prediction
NCC periodically or irregularly publishes climate trend prediction on various time scales ranging from one month to one year over the country. By use of weather and climate correlation and analogy analysis, statistical methods, physical factor analysis and dynamical numerical forecast, etc, short-term climate prediction is carried out and the nation-wide monthly, seasonal and annual climate prediction is published periodically. The special focus lies on the prediction of serious disaster climate, such as drought, flood and low temperature . A special emphasis on analysizing the relationship between circulation system of East Asian monsoon, atmospheric active centers, underlying surface thermodynamic anomaly and Chinese climate. In addition, predictions on special issues are also provided.
2. Global climate monitoring and diagnosis operation
Its staple operation includes the monitoring and diagnosis of global climate change, global climate condition, atmosphere and ocean condition and important climate events (such as ENSO), collection of information on significant domestic and overseas weather and climate disasters, and providing non-periodic report on climate condition. The operation products include Monthly Climate Monitoring Bulletin, Annual Climate Monitoring Bulletin, ENSO Monitoring Bulletin and World Weather and Climate Briefings.
3. Climate impact assessment
It aims at designing climate impact assessment model, striving to make objective, quantitative and scientific assessment so as to improve the capability of climate service. Climate Impact Assessment provides the society with such products as Monthly Climate Impact Assessment, Annual Climate Impact assessment, China Climate Bulletin, Annals of China Major Climate Disasters and irregular product serving the Chinese government.
4. Climate application and service
It offers climate parameters, climate information and advisory service for the use of national economic sectors. Its primary service covers the follows: building climate, urban meteorology, energy meteorology, reservoir management, transportation meteorology, ocean resource exploitation, forest fire protection, environment protection, medical treatment, tourism and compilation of climate atlas.

16
CLIMATE BASED MODELING OF PEST ESTABLISHMENT AND SURVIVAL IN SUPPORT OF PEST RISK ASSESSMENT
E. Dobesberger1, Alejandra Elizalde2, E. Imai3, I. MacLatchy1, E. Podleckis3,
S. Redlin 4, M. H. Royer3, R. Sequeira4, and D. Watler1
Climate impacts significantly on the population dynamics of pests and diseases, and host plant distribution, and therefore, is useful as a predictor of potential pest and disease establishment, survival and spread, particularly in new areas (France 1991; Cammell and Knight 1992). Disease epidemiology in plants (Coakley 1988), population dynamics of many insects (Sutherst 1991; Venette and Hutchison 1999), and vegetation patterns (France 1991) and global ecoregions (Bailey 1998) are largely influenced by climate near the ground. Recently, a plethora of worldwide environmental databases at the landscape level and numerous mathematically based ecological models have evolved at various scales. Global eco-climatic models of vegetation, climatic and edaphic themes can be readily mapped in 2 or 3 dimensional Geographic Information System (GIS) form to identify suitable areas for pest and disease establishment (1EPA -Global Ecosystems Database - Disc B). These themes can be employed to match climates for quarantine pest establishment in a new environment or also to verify and validate the results of model predictions of pest or disease activity in an area (Dobesberger and MacDonald 1993).
Various expert systems such as CLIMEX, BIOCLIM/BIOMAP part of ANUCLIM (McKenney
et al. 1998), BioSIM (Régnière and Sharov 1997) or process oriented models (Sequeira 1999) can be used to forecast pest and disease population dynamics in terms of climate based risk forecasting or to develop other phytosanitary decision rules. Identification of ecological areas or sites which may have suitable climate or edaphic conditions for pest infestation would strengthen and enhance the pest risk assessment process (Hopper 1991). This identification may be achieved by comparing sites where the pest already occurs with sites where the pest is not known to occur (Sutherst et al. 1991).
The expert system, CLIMEX, has been developed to compare climates between
geographic areas in support of pest risk assessments (Sutherst and Maywald 1991; Sutherst et al. 1991). CLIMEX is a computerised system which describes the suitability of the climate for any poikilothermic organism and its potential for growth at any geographical location and/or time (Sutherst and Maywald 1985). The system has been used to forecast the incidence of the Queensland fruitfly, Dacus tryoni (Froggatt), in Australia (Sutherst and Maywald 1991; Yonow and Sutherst 1998), to describe the potential distribution of ticks of cattle worldwide (Sutherst and Maywald 1985), to determine the suitability of the Australian environment to the Russian wheat aphid, Diuraphis noxia Mordvilko (Hughes and Maywald 1990), and to evaluate the risk of various cattle diseases in Africa (Lessard et al. 1990). Worner (1988) calibrated CLIMEX to evaluate the potential distribution of the Colorado potato beetle, Leptinotarsa decemineata (Say) in Europe and Asia and the Mediterranean fruitfly, Ceratitis capitata (Wiedemann) in New Zealand. Others have recently adapted CLIMEX to form the basis of an expert system to support the pest risk assessment process (Sutherst et al. 1991). CLIMEX provides quick, easily accessible data for “broad brush” climate matching estimates analogous to small scale GIS mapping of climatic themes.
Analysis of climatic surface data of geographically referenced information in conjunction
1 Animal & plant Health Risk Assessment Nework, Canadian Food Inspection agency, 3851 Fallowfield Road, Nepean, Ontario
K2H 8P9, Canada 2 Departamento de Analisis de Riesgo, Direccion General de Sanidad Vegetal, Guillermo Perez Valenzuela No. 127, Col. Del
Carmen Coyoacan, Mexico D.F., C.P.04100 3 U. S. Department of Agriculture, Animal and Plant Health Inspection Service, Riverdale, Maryland 20737-1236, U.S.A., 4 U. S. Department of Agriculture, Animal and Plant Health Inspection Service, Center for Plant Health Science and technology,
Raleigh, North Carolina 27606, U. S. A

17
with digital elevation models also has been extensively developed to evaluate the potential distribution of various organisms (McKenney et al. 1998). Bioclimatic and spatial analysis to 100 meter grid precision has the potential for very detailed interpretation of risk of pest or disease establishment at a very fine scale. Integration of phenological models with geospatial data incorporated into an expert system called BioSIM also allows for similar analyses to forecast insect population development in new areas (Régnière and Sharov 1997).
Climate matching and identification of areas at risk also can be accomplished through the
development of models based on multivariate techniques such as logistic regression, discriminant function analysis and many more. Venette and Hutchison (1999) predicted the potential for establishment of the pink bollworm, Pectinophora gossypiella (Saunders), in the southeastern United States based on logistic regression of output parameters from the CLIMEX model. Logistic regression is a powerful analytical tool because it provides a clear probability statement about an event occurring based on biologically relevant explanatory variables. Analogous modeling methodologies can be used based on discriminant function analysis. Global classification of Ascochyta blight occurrence on chickpea (Diekmann 1992) and potential establishment of the blueberry maggot, Rhagoletis mendax Curran, in Canada have been successfully modeled based on discriminant function analysis of climatic parameters (Dobesberger and MacDonald 1993). The severity of disease of soybean caused by the soybean rust, Phakopsora pachyrhizi (Sydow) was assessed based on a multiple linear regression model (Royer and Yang 1991). The risk of disease severity was mapped to determine the daily spatial distribution of disease occurrence, and the weekly and maximum seasonal progression of aerial rust.
Many of these modeling techniques can be integrated with GIS and expert systems to
provide detailed analytical solutions to science based pest risk assessment problems and to better communicate risk scenarios. GIS technology can assist in the process of forecasting the potential distribution of a quarantine pest by providing a convenient and rapid procedure for organizing, managing and updating data. The results of mathematical models predicting pest introduction and spread can be readily displayed spatially and can be easily combined with other ecological data such as host distribution or known climatic factors which limit pest survival. The development of mathematical models in conjunction with non-statistical GIS overlay analyses should provide for a systematic procedure for supporting quarantine, survey and eradication programs or other regulatory decisions, even when data are disparate, anecdotal or incomplete (Stahevitch and Blangez 1990). By using such decision-support modeling tools national plant protection organizations have more transparent justification for phytosanitary measures proposed to protect crops and control pests or diseases. This leads to better understanding between trading nations, as they strive towards common standards for phytosanitary regulation under the auspices of the International Plant Protection Convention (IPPC).
References Bailey, R.G. 1998. Ecoregions - The ecosystem geography of the oceans and continents.
Springer, 176 pp. Cammell, M.E. and Knight, J.D. 1992. Effects of climatic change on the population dynamics of
crop pests. Advances in ecological research 22:117-162. Coakley, S.M. 1988. Variation in climate and prediction of disease in plants. Ann. Rev.
Phytopathol. 26:163-181. Diekmann, M. 1992. Use of climatic parameters to predict the global distribution of Ascochyta
blight on chickpea. Plant Disease 76:409-412. Dobesberger, E.J. and MacDonald, K.B. 1993. An application of Geographic Information
Systems and Discriminant Analysis to forecast the potential occurrence of pest infestation: An example using blueberry maggot (Diptera:Tephritidae). Proceedings of Joint

18
WMO/DINAC-DMH/NAPPO Symposium on the Practical Applications of Agrometeorology in Plant Protection, Asuncion, Paraguay, 1992-04-1/10, NAPPO Bulletin 9:233-246.
Environmental Protection Agency Global Ecosystems Database - Disc B United States -,
National Environmental Satellite, Data and Information Center, Boulder, Colorado 80303 U.S.A.
France, R.L. 1991. Empirical methodology for predicting changes in species range extension and
richness associated with climate warming. Int. J. Biometeorol. 34:211-216. Hopper, B.E. 1991. Ecological aspects of pest risk assessment. OEPP/EPPO Bulletin 21:587 -
594. Hopper, B.E. and Campbell, W.P. 1989. Crop protection information needs: a NAPPO
perspective. In: Crop Protection Information - An International Perspective (eds., Harris, K.M. and Scott, P.R.), pp.225-233. CAB International, Wallingford (GB).
Hughes, R.D. and G.F. Maywald 1990. Forecasting the favourableness of the Australian
environment for the Russian wheat aphid, Diuraphis noxia (Homoptera: Aphididae), and its potential impact on Australian wheat yields. Bull. Ent. Res. 80:165-175.
Lessard, P., L'Eplattenier, R., Norval, R.A.I., Kundert, K., Dolan, T.T, Croze, H., Walker, J.B.,
Irvin, A.D. and Perry, B.D. 1990. Geographical information systems for studying the epidemiology of cattle diseases caused by Theileria parva . The Veterinary Record:126:255-262.
McKenney, D.W., Mackey, B.G., Bogart, J.P., McKee, J.E., Oldham, M.J. and Chek, A. 1998.
Bioclimatic and spatial analysis of Ontario reptiles and amphibians. Ecoscience 5:18-30. Régnière, J. and Sharov, A. 1997. Forecasting Gypsy moth flight in the northeastern US with
BioSIM. Eleventh Annual Symposium on Geographic Information Systems, GIS-97, Vancouver, B.C., Canada. pp. 99-103.
Royer, M.H. and Yang, X.B. 1991. Application of high-resolution weather data to pest risk
assessment. OEPP/EPPO Bulletin 21:609-614. Sequeira, R. 1999. Safeguarding production agriculture and natural ecosystems against
biological terrorism - A U.S. Department of Agriculture Emergency Response Framework. In: Food and Agricultural Security - Guarding against natural threats and terrorist attacks affecting health, national food supplies, and agricultural economics. Annals of the New York Academy of Sciences, Volume 894:48-67.
Stahevitch, A. and Blangez, B. 1990. The contribution of pest risk assessment (PRA) to
phytosanitary regulation. NAPPO Bulletin 7:47 -65. Sutherst, R.W. and Maywald, G.F. 1985. A computerised system for matching climates in
ecology. Agriculture, Ecosystems and Environment 13:281-299. Sutherst, R.W. and Maywald, G.F. 1991. Climate-matching for quarantine, using CLIMEX. Plant
Protection Quarterly 6:3-7. Sutherst, R.W., Maywald, G.F. and Bottomley, W. 1991. From CLIMEX to PESKY, a generic
expert system for pest risk assessment. OEPP/EPPO Bulletin 21:595-608. Venette, R.C. and Hutchison, W.D. 1999. Assessing the risk of establishment by pink bollworm
(Lepidoptera: Gelechiiidae) in the southeastern United States. Environmental Entomology 28:445-455.

19
Worner, S.P. 1988. Ecoclimatic assessment of potential establishment of exotic pests. J. Econ. Entomol. 973-983.
Yonow, T. and Sutherst, R.W. 1998. The geographical distribution of the Queensland fruitfly,
Bactrocera (Dacus) tryoni, in relation to climate. Aust. J. Agric. Res. 49:935-953.
RIVER NILE FLOODS AND DROUGHTS
IN RELATION TO JET STREAMS AND SSTs
(M. A. EL-Rhman Aly Dawod2 and M.A.El-Rafy3 )
Studies on climate history indicate that extreme weather anomalies such as droughts and flood have been recurrent over many African locations. This work includes further studies for better understanding of atmospheric variations in the tropical region, notably over Africa. This is of great importance to Egypt since these climatic variabilities are the controlling factors causing variation of Nile floods. Season of high flood 1988/1989 and season of drought condition 1984/1985 have been investigated in this study. June and July months of 1988 and 1984 years were studied using data of Sea Surface Temperature, zonal wind from 1000 hPa up to 10 hPa. It has been concluded that the Appearance of cold pools of the sea surface temperature over the equatorial region of Pacific ocean during July are good signs for above normal rainfall season over Africa notably over eastern part. The appearance of relatively cold pools over the equatorial regions of Indian Ocean during July months could be considered as one of the main signals of rainy seasons. While the appearance of warm pools during July months may be considered as one of the main signals of drought condition over Africa.
Investigation of zonal wind component in the upper troposphere lead to the following
results:
1. The characteristics of the tropical easterly jet and sub-tropical jet stream during June month could be used to forecast season of rainfall over Africa notably over eastern part.
2. Eastward movements of tropical easterly jet and sub-tropical jet stream at northern
hemisphere during June month are signs of blow normal rainfall season over eastern parts of Africa.
3. Westward movements of Tropical Easterly jet and Sub-Tropical Jet stream at Northern
Hemisphere during June month are signs for above normal rainfall season over eastern parts of Africa.
EFFECTS OF CLIMATE VARIABLITY
AND GLOBAL CLIMATE CHANGE IN CHILE
(Hugo Gualterio, Chilean Meteorological Service, Direccion Meteorologica de Chile)
During the past few decades, the international community has become increasingly interested in learning about and studying problems related to the environment, especially climate change, which have been observed on our planet over the past two centuries. Current evidence leaves no doubt that since the Industrial Revolution there has been an increase in greenhouse gases such as carbon dioxide, methane and others that are products of industrialization and human activities. In Chile, it is estimated that there has been an increase in temperature ranging between a few tenths of a degree and 1.5 degrees over the past 100 years, except in the southern part of Chile where no significant increase of air temperature has been recorded. This
2 Meteorological Authority, Egypt 3 Cairo University, Faculty of Science, Meteorology & Astronomy Dept

20
warming is considered to cause a change in precipitation patterns, which show a slight negative trend over the past century, especially in southern Chile, namely around the city of Valdivia. The advance of desertification towards the south that has been observed in central Chile is due partly to a decrease in precipitation and increase in temperature (other factors are human activities). Widespread retreat of glaciers in Chile, with a decrease in the continental ice mass and an increase in icebergs breaking off from the Antarctic shelves are additional evidence of an increase in temperature.
According to a group of Chilean scientists who are members of the Nationa l Committee for
the International Geosphere-Biosphere Programme (IGBP), it is predicted that widespread warming will occur throughout Chile by 2030. The impact of this warming will be significant south of Chiloé (43°S), while closer to the Antarctic continent the impact should be even greater.
Impacts on Agricultural Activities
In the case of agriculture, increases in temperature will occur as a favourable result of the
reduction of the period of cold spells, but this will likewise attenuate patterns of winter cold, an important aspect for several species of fruit trees. A decrease in precipitation in the Central-South area will negatively affect the productivity of the coastal and inland dry areas, decreasing yields for cereals and legumes and lowering the productivity of natural grasslands. In addition, soil humidity could become insufficient for agriculture in the summer. Although this aspect is very difficult to predict, it is estimated that the frequency of forest fires could increase because of a rise in temperature and a decrease in soil humidity. In the case of water resources, an increase of 3°C would result in a rise of 500 metres of the snowline in the main water basins of central Chile, with a resulting decrease in seasonal reserves. In Northern Chico and Central Chile, an increase in temperature would accelerate the thawing of snow, thus increasing winter and spring surface water runoff and producing a decline of summer and autumn surface water flows. An increase in temperature will also lead to a rise in the evapotranspiration rate, with a corresponding decrease in precipitation that contributes to runoff.
Climatic Change
According to M.J. Salinger, the Southern Oscillation is one of the main causes of the
variability of the natural climate, especially in the tropical Pacific and in the low and middle latitudes of the Southern Hemisphere. Because of the effect of the Southern Oscillation in these regions, there is high variability in rainfall that has considerable significant effects on agricultural production. The El Niño phase produces a fall in yields and important alterations in forests. On the other hand, the La Niña phase can lead to increases in agricultural yields. In this regard, a very clear relationship has been found in Chile between the annual level of precipitation in the central part of the country (Regions III to VIII) and the oceanographic and atmospheric situation of the Pacific, corresponding to greater than normal precipitation when ocean surface temperatures are abnormally warm, which also occurs with lower than normal atmospheric pressures along the northern and central coasts of Chile. This indicates a movement of the Pacific anticyclone towards the west. This situation is known as an El Niño event. This relationship is inverted south of Region IX, where annual levels of precipitation decrease during an El Niño event. This is explained by the displacement of the anticyclone towards the west, which allows frontal systems to reach the central area of Chile (Regions III to VIII) more frequently and, therefore, with a lower frequency in the southern area (Region X in the south).
As a result of the damage caused to agriculture by the 1997 El Niño event in the Central-
North area of Chile, the fruit industry suffered a decrease in the production of several species, especially fruit with stones. Losses were especially serious in cherries (an average of 57.6 per cent) with losses of up to 80 per cent in several cases. Because of an increase in late precipitation, lateness in the sowing of traditional crops resulted in lower yields. An increase in rainfall brought with it a significant increase in problems of plant hygiene, which led to greater use of pesticides and a resulting increase in costs and decrease in production margins, finally resulting in lower profitability. A noticeable abnormality in precipitation patterns occurred in the

21
area under study because of the presence of the El Niño phenomenon. The rainy season was extended considerably into spring, and many daily records were above normal values, reaching levels of 100 to 150 millimetres.
EXAMPLES OF ADAPTATION STRATEGIES FOR CLIMATE VARIABILITY AND CLIMATE CHANGE IN THE UNITED REPUBLIC OF TANZANIA
(T.M. Hyera, Tanzania Meteorological Agency)
Climate Variability
The study of rainfall variability and its effect on agriculture in the United Republic of
Tanzania have enabled the delineation of the country into dependable onset and cessation dates of rainfall, types of growing seasons and agro -climatic zones. This has been of immense usefulness in national agricultural planning and in the formulation of the National Agricultural Policy.
Four major types of zones are identified on the basis of likely maize and sorghum yields,
assuming an acceptable risk of crop failure of about one in five. Maize and sorghum are the most important subsistence crops in the country.
Zone I - Reliable for maize
This zone lies above 1500 m and covers the southern highlands regions, western parts of
Lake Victoria basin and north eastern highlands.
Due to high elevations, the southern highlands benefit from the most reliable rains in the United Republic of Tanzania. The growing season whose onset and cessation dates can be relied upon during at least 80% of the years starts mid-November. The end of the growing season is by mid-April, thus its length is130 to 160 days. The climate is ideal for water demanding crops such as maize, finger millet, and bananas and also for wheat and beans due to the lower temperatures. The western Lake Victoria basin exhibits a rather long growing season of 230 days from early October to late May. Due to the Lake Victoria influence on the thunderstorm activity, both the first rains and the long rains are reliable. Maize and rice will grow satisfactorily during both the seasons but the field drying of the crops planted early will be difficult since the short “dry season” in January and February will record more than 160 mm during 80% of the years.
Zone II - Marginally reliable for maize but reliable for sorghum
This zone covers some districts in the northeastern, western, southern, and eastern regions. In some districts in the south the rainfall reliability increases towards the west. The growing season lasts from early December to the first half of April. Maize can be grown successfully during almost 60% of the years. In the eastern districts, the growing season lasts between 130 and 160 days and the onset falls between November and January, being usually later in the south. Rainfall in these districts is unreliable throughout the seasons with peaks appearing at end of November, early December and in April. During the northeastern monsoon generally referred to as first or short rains, maize will yield properly during only 20% of the years. The probability increases to about 60% during the long rains and the probability of dry spells decreases significantly only during April. Maize is discouraged at least during the short rains and very short cycled, drought resistant crops are recommend.

22
Zone III – Reliable for sorghum only. In this zone are included some districts from the central, southern coastal, and northern/northeastern regions.
Unreliable rainfall throughout the growing season characterizes this type of zone that
extends over a wide part of central of the United Republic of Tanzania and the other districts. It is unsuited for water demanding crops with a very high risk of dry spells in mid season, around February. The growing season shows a clear break in February during about 70% of the years. The climate is favourable only for sorghum and bulrush millet and drought resistant roots such as sweet potatoes and cassava. Zone IV -Marginally reliable for sorghum and reliable for grazing. This zone covers some districts in northern/northeastern and central regions
The climate is similar to that of zone IV but the risk of dry spells in mid -season is worse
than 70% of the years. Grazing is the best agricultural system to recommend for this zone. There is overwhelming evidence in the United Republic of Tanzania that interseasonal and interannual rainfall variability plays the major part in the agricultural output. Insufficient moisture appears to be the major cause of food shortages in 50 to 70% of recorded cases.
Climate Change
Recent climate change studies have shown that in the United Republic of Tanzania the
effect of climate change on maize, coffee and cotton could be negative leading to decreases in their yields as a result of both moisture and heat stresses. Some zones currently classified as suitable for growth of these crops would become unsuitable or marginally suitable. Among the adaptation measures for combating adverse effects of climate change include irrigation as a means of reducing moisture stress. The United Republic of Tanzania is endowed with many sources of irrigation water that include the great lakes, rivers and groundwater. Rainwater harvesting is already being implemented by farmers in the semiarid areas such as in northeastern highlands where rainwater from slopes of hills is channeled into cropped areas down slope. The breeding and adoption of early maturing and drought resistant varieties is also recommended coupled with a package of good management techniques including microclimatic manipulation. The government is advised to encouraging farmers in less suitable areas to grow drought tolerant crops and to practice cattle grazing.
URBAN HEAT ISLAND FEATURES IN THE HORN OF AFRICA CITY OF CENTRAL ETHIOPIA (ADDIS ABABA)
(B. Kifle, National Meteorological Services Agency of E thiopia)
The urban heat island (UHI) effect in a large city, with a population of 2.42 million,
examines the influence of temperature on a city that is located in central Ethiopia (Addis Ababa). The main objective is the existence on any anomaly on the temperature influence of the UHI effect on the historical temperature record is discussed in a qualitative nature. A comparison of temperature records and population is made from independent sites. The maximum UHI effect at the center of town related to population by comparison of both population and mean annual maximum temperature trend. The rapid urban growth resulted in a tremendous land cover change dynamics within the metropolitan region, wherein urbanization has consumed vast acreages of land adjacent to the city particularly within 15 years, had made Addis Ababa one of the fastest growing metropolitan areas in Ethiopia. The data used in this study was dry bulb temperatures measured at a height of 1.5 meters, maximum temperatures, population parameters and altitude of the station Addis Ababa bole, observatory, and ILRI (Shola). The data was then subjected toa simple statistical analysis. The results show that on a selected clear sky day of the maximum UHI effect is seen at the observatory station was found. A positive trend was

23
seen on both population and annual mean maximum temperature. It is therefore evident from the result that there is a feature of UHI of central Ethiopia.
CLIMATIC VARIABILITY IN TURKEY IN RELATION TO AIR PRESSURE SYSTEMS AND NORTH ATLANTIC OSCILLATION (NAO)
(Dr Ali Umran Komuscu, Turkish State Meteorological Service)
Drought commonly is perceived to be a prolonged period without precipitation. Low precipitation is one of the climatological factors that causes precipitation deficiencies, but droughts also are associated with weather systems that result in shift in precipitation producing mechanisms. Namias (1985) argues that drought is associated with persistent or persistently recurring atmospheric circulation patterns. For example, North Atlantic Oscillation (NAO) has a major role in controlling European climate and appears to exert a strong influence in modulating the North Atlantic ecosystems. During the positive phases of NAO, the North Atlantic westerlies which provide much of the atmospheric moisture to north Africa and Europe shift northward. This, in turn, results in drier conditions over Southern Europe, the Mediterranean Sea, and northern Africa (Hurrell, 1995; and Hurrell and Van Loon, 1997).
Turkey is situated in Mediterranean macroclimatic region of subtropical zone. Due to its
complex topographic features, its proximity to water, and being a transition zone for different pressure systems and air masses originating from polar and tropical zones, several climatic sub-regions appear to be dominant over the country. Amount and distribution of rainfall in the coastal parts are determined by troughs and frontal type mid latitude cyclones that are associated with the prevailing upper level westerly flows. The Mediterranean Sea acts as a primary source of region for moist air masses that produce high rainfall over the windward slopes of the coastal mountain ranges. Frontal Mediterranean cyclones associated with the southwesterly air flows create favorable conditions for heavy rainfall and thunderstorms in the southern and western coastal parts of the country in late autumn and early winter. Annual average rainfall in Turkey is around 630 mm and 67 % of the annual average rainfall occurs during the winter and spring when the Eastern Mediterranean Basin and Balkans are influenced by eastward propagating mid-latitude cyclones and Mediterranean depressions (Türkes, 1996).
Drought is recurrent phenomenon in Turkey for the last several decades. A warming trend
began in early 1990s have continued in recent years despite some cooling. The annual mean temperatures remained above average in the last 5 years. A significant drought is observed during years of 1999 and 2000, which were associated with a lack of precipitation during the winter and spring, which normally are the wettest seasons. Almost two thirds of the country, mainly the Southeastern and the Central Anatolia experienced severe drought in 1999, and the drought continued in the year 2000 with slight differences in areal coverage (Figure 1). While the central parts recovered slightly from the drought conditions, the effects were felt more dramatically in the eastern and western parts. Moreover, the drought even shifted toward north extending further into parts of the Black-Sea region, normally wettest in the country.
An analysis of the pressure systems in relation to prolonged dry periods indicates several
main changes and shifts in the circulation patterns that affect precipitation conditions in Turkey (Figure 2). These changes can be summarized as a) Weakening of Siberia anticyclone, especially after 1980s (winter droughts), b) Penetration of Azor Anticyclone ridge to the Eastern Mediterranean, c) Decrease in frequency of frontal systems in Mediterranean, d) Penetration of Basra low into further north (summer droughts), and e) Strengthening of Basra low (summer droughts).
Another important factor that control rainfall variability in Turkey is changes in the North
Atlantic Oscillation (NAO). During the positive phases of NAO, the North Atlantic westerlies which provide much of the atmospheric moisture to North Africa and Europe shift northward, resulting in

24
drier conditions over Southern Europe and the Mediterranean Sea.(Hurrell, 1995). Jansa (1992) argues that the heaviest rainfall in the Mediterranean region is observed from the end of autumn to the beginning of spring when significant cyclogenetic activity fundamentally determines the maximum rainfall. Since these winter cyclones are the dominant source of Middle Eastern rainfall and river runoff, NAO-related changes in Atlantic westerly heat/moisture transport and Atlantic/Mediterranean SSTs influence Middle Eastern climate.
It has been observed that during positive NAO years Turkey becomes significantly cooler
and drier. (Cullen and deMonecal, 1999). The figure 3 shows a correlation between annual rainfall and NAO indices over the last three decades. It has been shown that the dry periods correspond well with the positive phases of the NAO, and similarly humid conditions prevail during the negative phases of the NAO. Considering the country receives most of its rainfall in winter and spring, winter droughts in Turkey can be attributed to positive NAO anomalies. On the other hand, summer droughts experienced especially in eastern and southeastern parts of the country is usually associated with strengthening and penetration of Basra low pressure to further north.
In conclusion, drought conditions that prevailed over the last two-three decades in Turkey
are related to changes in the weather patterns in the Atlantic region, specifically variations in North Atlantic Oscillation. Furthermore, penetration Basra low further into the north and weakening of Siberia anticyclone contributed to the summer and winter droughts to a great extent.
References
Cullen, H.M. and deMonecal, P.B. 1999, North Atlantic Influence on Tigris-Euphrates Streamflow. Lamont Doherty Earth Observatory of Columbia University, New York.
Jansa, A.,1992, Severe weather and cyclogenesis, a Western Mediterranean look,
ICS/ICTP/WMO International Workshop on Mediterranean Cyclones Studies, Trieste (Italy), 51-56.
Jansa, A., D. Radinovic, P. Albert, A. Genoves, J. Campins and M.A. Picornell, 1994.
Mediterranean Cyclones: Subject of a WMO Project, International Symposium on the Life Cycyle of Extratropical Cyclones, Bergen, Vol II, 26-31
Hurrell, J. W.1995, Decadal trends in the North Atlantic Oscillation: Regional temperatures and
precipitation. Science, 269, 676 -679. Hurrell, J.W. and Van Loon, H. 1997. Decadal variations in climate associated with North Atlantic
Oscillation. Climate Change, 36(3-4):301-326 Namias, Jerome, 1985, Hydrologic aspects of drought, in Beran, M.A., and Rodier, J.A., eds.,
UNESCO-World Meteorological Organization, A Contribution to the International Hydrologic Programme, Paris, France, p. 27-64.
Türkes, M. 1996. Spatial and temporal analysis of annual rainfall variations in Turkey, Int. Journal
of Climatology, 16, 1057 -1076. Correspondence
Dr. Ali Umran Komuscu Turkish State Meteorological Service Research Department, Kalaba , 06120 Ankara, Tu rkey Tel.: (90312) 3022690 Fax: (90312) 3612040 e-mail:[email protected]

25
Figure 1. Precipitation conditions in 1999 and 2000 in Turkey with respect to the climatic normals

26
Slide
Atlantic(Iceland) Low
Weakening of Siberia High
Penetration of Basra Low to further north
Penetration of Azor Anticyclone ridge to E.Mediterranean
Figure 2. Changes in circulation patterns and pressure systems in relation to drought
conditions in Turkey
Figure 3. Relationship between annual rainfall of Turkey and NAO Index (1970-2000)

27
IMPLICATIONS OF CLIMATE CHANGE FOR SOIL-WATER AVAILABILITY IN THE SOUTH-EASTERN ANATOLIA PROJECT (GAP) REGION
(Dr Ali Umran Komuscu and Ayhan Erkan, Turkish State Meteorological Service)
Introduction
In this study, vulnerability of soil-water availability in the Southeastern Anatolia Project (GAP) Region has been investigated with respect to projected changes in temperature and precipitation. The Southeast Anatolia Development Project (known as GAP) is a multi-faceted development project for agriculture and water resources within the Turkish portions of the Euphrates and Tigers River Basins and seeks a viable development for the Southeast Anatolia. The GAP project aims to irrigate 8.5 million hectares of land in the Southeast Anatolia, which is 19 % of the total economically irrigable lands in Turkey). (GAP Regional Development Administration, 1997). A project of such magnitude inevitably carries a major importance with respect to future of the region's water resources and agricultural potential. In this respect, future climate change could critically undermine efforts for sustainable development in the GAP region.
Model results for southern Europe and Turkey show an overall reduction in summer
moisture availability in response to rising concentrations of greenhouse gases (Kattenberg and others, 1996). Results from three equilibrium experiments run for southern Europe and Turkey suggest a soil moisture decrease over the whole region by 15 to 25% during the summer (IPCC,1992). The reduction of moisture availability anticipated in the climate change scenarios would inevitably add to the problem of water scarcity throughout the region. A prolonged deficiency of soil moisture may retard the growth of the plant and lead the incidence of agricultural drought. This, in turn, means enhancing the water supplies in the region and preventing crops from being subjected to extended period of drought and resulting crop failures. It is of particular importance to establish reasonable expectations of water use in the GAP area as large areas are being irrigated and also planned to be irrigated. But, irrigation will be the first activity affected in the GAP region if water availability decreases in summer due to the lower precipitation. As a result, the demand for irrigation will increase, and this, in turn, means extraction of more water from surface and ground water sources in the region.
Climatic Impact Assessment
The implications of climatic change on the selected soil-water parameters are evaluated in 13 major agricultural and water resources project regions by using hypothetical scenarios and GCM results. The scenarios include ten hypothetical cases involving combinations of plus 2 and plus 4 degrees Celsius (°C) and plus and minus 0, 10, and 20% precipitation changes. However, only results of plus 2 degrees °C increase in temperatures and GCM outputs were presented here.
Although significant uncertainties surround predictions of regional climate changes, model
simulations point warming in the Mediterranean region (Palutikof and others, 1992). The General Circulation Models estimate a warming of 2°C in winter and 2-3°C in summer months for Southeastern Europe and most parts of Turkey where Mediterranean climate predominates (IPCC, 1990). The estimated changes by the IPCC are based on “business-as-usual” emissions and generated by the high-resolution models, scaled to be consistent with an estimate of global warming of 1.8°C by 2030. The models also predict a slight increase in winter precipitation, but in summer, precipitation decreases by 5% -15 % and soil moisture by 15% -25% in the region if the predicted warming takes place. Results from more recent studies from nine transient models for southern Europe and Turkey suggest temperature increases of 1 to 4.5°C (with a mid-point of about 2.5°C) during the winter and summer by the latter half of the 21st century (Kattenberg and others, 1996). One transient experiment, however, indicates that aerosols may reduce warming over the Mediterranean region by 1-2°C (Mitchell and others, 1995). Models studies present conflicting evidence over how precipitation may change on average over the Mediterranean region. Two out of three equilibrium experiments run in one study suggest an overall increase in

28
precipitation across the region (Rosenzwieg and Tubiello, 1997). On the other hand, recent transient model runs for the 2020s concludes an overall decrease of between 1.5 and 7.3% (Rosenzwieg and Tubiello, 1997). An average of four equilibrium model results for the whole Mediterranean region suggests an increase in winter precipitation of 10% and a decrease in summer precipitation of 10% until 2100 (Palutikof and others, 1992). This finding is supported by a more recent comparison of nine transient model runs for southern Europe and Turkey (Kattenberg and others, 1996). In this case, most models suggest increases in winter precipitation of up to 10% and reductions in summer precipitation of 5 to 15% by the latter half of the 21st century. This study uses GCM estimate of warming and precipitation changes predicted for Southeastern Europe and most parts of Turkey where Mediterranean climate predominates (IPCC, 1990). As the sub-regions within the GAP region are too small to be accurately represented by the GCM data, the results were treated as one scenario for the whole region.
A computerised version of the original Thornthwaite water balance model, which was
developed by Willmot (1977) was employed in this study. The model requires data on precipitation, temperature, soil-water holding capacity, heat index, and latitude of a given station and computes potential and actual evapotranspiration, soil moisture deficits, and soil moisture surplus for a predetermined time period. There are 28 climate stations within and nearby the study area. A grouping of the stations was made within the each individual project area. Using the Thiessen method, representative values of precipitation, temperature and of moisture field capacity were constructed for the each project area and thus, each project area was treated as a single unit of a study site. Climate -Impact Assessment Results
The results of the model runs for the hypothetical scenarios were plotted as differences from the soil moisture deficit. In Figure 1, changes in the soil moisture deficit (D) from the present are presented for the 2°C warming and prescribed precipitation changes. A general behaviour observed is that part of the spring and entire summer in the region will be affected from severe soil-water shortage. Enhancement in the soil-water deficit even extends over early autumn in most cases. The severity of the dryness increases during this period since the moisture demand is not satisfied by precipitation. The extent of the drought also varies geographically. The effect of warming in summer deficit is most evident in Cizre sub -region. The timing of the deficit period shifts in one month ahead in the southeastern parts and starts in April. June is the month in which the demand for moisture peaks in all the sub-regions. It is possible to conclude that in areas where summers are very dry, additional precipitation increases would not eliminate the adverse impact of warming on the soil-water content.
Changes in the water-balance components from the present with the GCM estimates
exhibit marked differences as compared to the changes observed with the hypothetical scenarios (Table 1). Regardless of increase in precipitation, a 2°C warming will be sufficient to cause an extended period of drought throughout the year in the region. In all the sub-regions, 2°C of warming coupled with 20 percent decrease in precipitation causes a major soil-water deficit in the region. It is interesting to note that soil moisture surplus increased nearly by 10 percent on annual basis. By contrast with the hypothetical scenarios, changes in precipitation had a considerable impact on the soil moisture changes. The summer deficit enhanced 15 percent, but this was not mainly because of the increased temperatures in summer, but rather decrease in the already low precipitation had lesser effect on summer soil moisture in the region. Similarly, the effect of slight increase in winter precipitation is also reflected in soil moisture surplus in the first few months. A 10 percent increase in the soil moisture surplus was observed in the January-April period for the whole region. The GCM results indicate that actual water use by peaks in May and continues to peak in June, thus there is a slight shift in the timing of peak of actual water use. Another significant difference with both timing and magnitude of the actual water use with this scenario is seen in the spring. While the GCM results indicate less water use in the spring, the hypothetical scenarios exhibit a rising demand for water in the spring. It is likely that 5 percent increase in winter precipitation meets the moisture demands of crops to some degree and supplies some moisture for use by crops, causing lower actual

29
evapotranspiration rates. It also should be reminded that the GCM-derived IPCC estimates do not project a continuous temperature decrease throughout the year by contrast to the other scenarios.
Results of this study suggest that the projected climate change can have major impacts on timing and magnitude of soil moisture availability in agricultural areas of the GAP region. Among the most significant results obtained in this study are decreases in soil moisture during the growing season across the region. The severity of enhancement of the soil moisture deficit increases in the south -central and south-eastern parts which already suffer from low precipitation. As the region receives most of its precipitation during the winter, increase in pre cipitation in other months will not eliminate the adverse impact of the warming on the soil moisture.
Concluding Remarks
The results reached here may have significant implications for future of the GAP as the present project assessments do not incorporate climate change concerns into resource-use and development decisions significantly. The projected soil moisture variations points a certain degree of vulnerability of the region to possible changes in climate. Even 2°C warming alone indicates certain degree of impact on the soil moisture conditions in all the sub-regions. Intensification of dryness during growing season in the region means higher demand for water by crops.
Adaptation to climate change by introducing new crops and crop varieties, applying more advanced dry farming methods, improved water management, developing more efficient irrigation systems, and changes in planting will be important in limiting negative effects of the projected warming and associated decrease in soil moisture availability (Reilly, 1996). It would be necessary to investigate response of crops, such as wheat, barley, and cereals, already are being sown in the region, to even drier conditions. Another solution to mitigate the adverse impacts of drought on crops would be to switch to more heat- and drought resistant crop varieties. Farmers also may try to plant two crops during a growing season, and plant and harvest earlier. Irrigation will be where water availability diminishes as a result of decreased summer precipitation and soil moisture. Higher temperatures and enhancement in the summer soil moisture deficit certainly will boost the demand for irrigation. As a result, the demand for irrigation will increase, and this, in turn, means extraction of more water from surface and ground water sources in the region. Eventually, problem of optimum water use may rise as the demand for water by other sectors is anticipated as well. It is our conclusion that an improved water management in the GAP that integrates future changes in climate may protect water user at minimal cost. Correspondence Dr Ali Umran Komuscu Turkish State Meteorological Service Research Department Kalaba Ankara 06120, Turkey e-mail: [email protected] References GAP Regional Development Administration. 1997. Southeastern Anatolia Project, Turkey, Prime
Ministry, Southeastern Anatolia Project (GAP), Regional Development Administration, Ankara, Turkey, 69 pp.
Gleick, P.H.1987. Regional Hydrologic Consequences of Increases in Atmospheric CO 2 and
other Trace Gases’, Climatic Change (10)137-161.

30
Kattenberg, A. and others, 1996. Climate models - projections of future climate. In: Houghton, J. T., and others (eds). Climate Change 1995: The Science of Climate Change. Report of IPCC Working Group I, pp. 289-357. Cambridge, Cambridge University Press.
IPCC.: 1990, Climate Change: The IPCC Scientific Assessment, WMO/UNEP/IPCC. Cambridge
University Press. 365 pp. IPCC, 1992. Climate Change: The 1990 and 1992 IPCC Assessments. IPCC First Assessment
Report. Overview and Policymakers Summaries and 1992 IPCC Supplement. WMO/UNEP. IPCC.: 1995, Climate Change 1995 - Impacts, Adaptations and Mitigation of Climate Change:
Scientific-Technical Analyses. Contribution of Working Group II to the Second Assessment Report of the Intergovernmental Panel on Climate Change., WMO/UNEP/IPCC. Cambridge University Press. 878 pp.
Mitchell, J.F.B. and others, 1995. On surface temperatures, greenhouse gases and
aerosols:models and observations. J. Climate, 10, 2364-2386. Cited in: Kattenberg and others, 1996.
Palutikof, J. P. and others, 1992. Regional Changes in Climate in the Mediterranean Basin Due
to Global Greenhouse Gas Warming. MAP Technical Report Series. Athens: UNEP. Palutikof, J. P., Goodess, C. and Guo, X., 1994. Climate change, potential evapotranspiration
and moisture availability in the Mediterranean Basin. Int. J. Climatol.,14. Reilly, J., 1996. Agriculture in a changing climate. In: Watson, R. T., and others (eds). Climate
Change 1995: Adaptations and Mitigation of Climate Change, Scientific-Technical Analyses of Impacts. Report of IPCC Working Group II, pp. 429-167. Cambridge, Cambridge University Press.
Rosenzwieg, C. and Tubiello, F. N., 1997. Impacts of global climate change on Mediterranean
agriculture: current methodologies and future directions. An introductory essay. Mitigation and Adaptation Strategies for Global Change, 1 (3), pp. 219-232.
Willmott, C.J. 1977. Watbug: A Fortran Algorithm for Calculating the Climatic Water Budget.
Water Resources Center, University of Delaware, Newark.55 pp.

31

32
Table 1. Changes in Water Balance with GCM Runs for pre- and post climate change conditions
Baseline
Month Temp UPE APE PREC DIFF ST DST AE DEF SURP
1 3.7 4 3 82 78 162 57 3 0 22 2 5.2 7 6 74 68 162 0 6 0 68 3 9.5 21 21 75 53 162 0 21 0 53 4 14.5 45 49 70 21 162 0 49 0 21 5 20.2 82 99 43 -56 106 -56 99 0 0 6 26.2 131 161 5 -155 26 -80 85 75 0 7 30.1 163 202 1 -201 4 -22 23 179 0 8 29.4 158 184 1 -183 1 -3 4 180 0 9 24.9 119 123 2 -121 0 -1 2 120 0
10 17.9 66 63 28 -35 0 0 28 35 0 11 11.0 27 23 58 35 35 35 23 0 0 12 5.7 8 7 77 70 105 70 7 0 0
Total 941 515 351 590 165
Changes After IPCC Estimates Month Temp UPE APE PREC DIFF ST DST AE DEF SURP
1 5.7 6 5 86 80 162 52 5 0 28 2 7.2 10 8 78 69 162 0 8 0 69 3 9.5 17 18 75 57 162 0 18 0 57 4 14.5 40 44 70 26 162 0 44 0 26 5 20.2 78 95 43 -52 110 -52 95 0 0 6 29.2 157 192 5 -187 20 -90 95 97 0 7 33.1 177 221 1 -220 3 -17 18 202 0 8 32.4 175 204 1 -203 0 -2 3 201 0 9 24.9 118 121 2 -119 0 0 2 119 0
10 17.9 62 59 28 -31 0 0 28 31 0 11 11.0 23 20 58 38 39 38 20 0 0 12 7.7 11 9 81 71 110 71 9 0 0
Total 996 526 346 650 180
WHY DOES CLIMATE CONFLICT WITH AGRICULTURAL ACTIVITIES IN ETHIOPIA?
(Diriba Korecha, National Meteorological Services Agency of Ethiopia)
Abstract
We live in an unsustainable world. Particularly in the less developed world, there is high
vulnerability to the social, economic and environmental impacts of climate variability and change. Hence, there is a need to increase sustainability and reduce vulnerability through sustainable development.

33
The climate is determined by the workings of the climate system, which is composed of the atmosphere, oceans, ice sheets, land, and the plants, animals and people that inhabit them. It varies not only from year to year and decade-to-decade but also on time scales of centuries or longer.
Countries are usually unprepared to cope with climatic anomalies and variability in an
effective way. Governments typically react to climate extreme events through crisis management rather than through the formulation and implementation of anticipatory measures commonly referred to as risk management. A typical reason mentioned by decision-makers for the lack of such risk management policies has been the lack of means to predict climate conditions with sufficient skill and lead-time. In selected regions of the world, this situation has changed dramatically due to recent advances in the capacity to predict climate anomalies linked to the onset and intensity of a warm or cold event as part of the ENSO phenomenon. ENSO is the main source of inter-annual climate variability in many parts of the world.
Although the advances in ENSO prediction are significant scientific achievements, there
are still limitations in our ability to establish effective risk management policies or, in general, to take advantage of the improved forecasting ca pabilities. It is our recent memory that the impact of ENSO phenomena certainly inhibits the natural economic growth of East African sub-regions. It also alters the natural faces of regional climate that induce burden on the ecosystems. This indicates that climate is among a large number of variables that stakeholders need to consider in the planning and decision-making processes. Therefore, the author of this paper is intended to propose that effective applications of climate forecasts must frame the climate information in broader decision support tools that also include data on prices, land use feasibility, evaluation of the economical and environmental impact of technology.
After a review of the major concepts of interactive behavior of climate and development,
the paper illustrates some evidence of the linkage between climate vulnerability and sustainable development in agricultue. A methodology for climate prediction and its application schemes in the role of sustainable agricultural practices, planning and implementation that highlights the role of climate is then presented. At the later stage, an attempt is made to explore the half-century trend of Ethiopian rainfall climatology and its teleconnection linkages with the global El Niño/La Niña phenomena.
INFORMATION ON EXPERIENCE OF KAZHYDROMET ON REDUCING
OF VULNERABILITY OF CROPS AND FORECASTING OF CLIMATE CHANGES
(Paiyzshan Kozhakhmetov and Elena Antipova, Kazakhstan Meteorological Service (Kazhydromet))
At the present time the issue of global warming in the 21th Century and its impact on ecosystems is widely put. The operational practice of agrometeorological service in Kazakhstan shows that gloal warming does not greatly effect the yield of spring grain crops (a major agricultural crop of the country). The analysis of dynamics of the basic factors, which influence the growth, development and productivity of the major crop, allows making the following conclusions: - In the last five-year period of the 20th Century, the tendency of rise if the yield was marked
in a grain sowing zone of Kazakhstan. The productivity mainly prevailed above the average long-term values, and two of five years were with the maximal productivity. The 2001 yield was a record.
- For the last 20 years, the seasonal and ann ual varaiations of the basic parameters for yield
were within the frameworks of admissible climatic characteristics of sowed territory of the country and the sharp deviations, overlapping extreme values, were not generally marked.

34
- Weather and climatic conditions and especially the seasonal variations of weather in the most important plants interphase periods of the vegetative year play the determinative role on the productivity of grain crops. Besides conditions of heat-moistur provision of the vegetative period the conditions of autumn-winter water accumulation are of great importance for getting a large crop. Usually a large crop is obtained in the years with a high level of water accumulation in the winter period; when in the period prior to sowing there are no droughts (atmospheric and soil)or on the vegetation alternate with droughty periodsthat allows soil to dry out. In the second vegetation period, weather conditions also play an important role, when the deficit of air humidty and other parameters that determine the conditions of harvesting and reduction of crop losses get a particular mean.
The condtions of the winter period with a steady and plentiful snow cover favorably
promote the overwintering of crop pests. During such years, there is a high percentage of crop losses from crop pests and diseases. Long thaws in the cold period are adverse for desert-pasture vegetation, and and also for growing fruit.
However, the issue of global warming still remains on the agenda. The research in this
direction should be continued and developed. Development of modeling is also topical (global and regional models) which helps in the operational practice of providing the users with the agricultural information.
Education and training plays a significant role to attract the attention of various ministries to
matters of agrometeorology, and also for the popularization of agrometeorological production. This direction of activity also requires activation.
CLIMATIC CONDITIONS FOR MILLET CULTIVATION IN POLAND
(Jerzy Kozyra, Instituite of Soil Science and Plant Cultivation)
Millet (Panicum miliaceum L.) has been cultivated in Poland at least since the middle ages. However, climatic conditions have significantly limited the range of this crop, especially in northern part of the country. Because millet belongs to the thermophytes, its development at low temperatures is very slow. When sown early in spring, the yield is usually poor due to the overgrowing by weeds. If sown too late, the kernel may not reach the proper maturity before the winter. Usually after harvest the whole plants become dry during several days in the sun; the artificial drying may be economically not suitable. If harvested in late September, the millet usually does not become dry in the field, because of short days, low sun angle, frequent fog and dew.
The farmer’s experience, as well as the results of strict experiments, bring about a
conclusion that the proper date of sowing coincides with the day when the normal temperature of air exceeds 14oC (mostly in the second half of May). The probability of ripening and drying before September is then quite high on the greater part of the country.
For the evaluation of mean dates of ripening, as well as for calculation of the risk, the degree-day method may be successfully used, especially that the Polish cultivars are photoperiodically insensitive and temperature is the only important factor controlling their rate of development. It was stated that the degree -day sum after sowing of 760 above 9oC gives the best approximation of ripeness. Using the values of “normal” temperatures (calculated as means of historical series), the probability of ripening before September exceeds 75% only in some selected regions; in northern Poland it drops below 25% (Figure 2a).

35
F i g u r e 2 . P r o b a b i l i t y o f m i l l e t r i p e n i n g b e f o r e 1 S e p t e m b e r a ) b a s e d o n t h e 1 9 4 1 - 1 9 9 0 n o r m a l t e m p e r a t u r e b ) b a s e d o n t h e f o r e c a s t e d 2 0 0 1 - 2 0 1 0 t e m p e r a t u r e
a
b
However, the last decades gave strict evidence that the temperature rises, as it was anticipated by climatologists as an effect of “glasshouse gases” in the atmosphere. The mean temperature as measured at Pulawy increased from the sixties by 0,25oC for a decade (Figure 1). It seems to be reasonable that the proper calculations of risk should be based on actual, not past temperatures.
Using the temperatures extrapolated for 2005, the new digital maps showing probability of
millet ripening were constructed (Figure 2b). The assessed risk is essentially lesser, also in regions considered thus far as unsuitable. Besides, similar maps were made for several GCM scenarios for the years 2010-2039. The results obtained from particular scenarios are only slightly differed.
- Annual temperature - 20 years moving average
Figure 1. Mean annual temperatures at Pulawy in 1871 - 2001
Smoothed Time Series Plot for m
1870 1890 1910 1930 1950 1970 1990 20105
6
7
8
9
10° C
Year

36
CLIMATE CHANGE IMPACTS ON ANIMAL HUSBANDRY IN MONGOLIA
(Mongolian Institute of Meteorology and Hydrology, Ulann Baatar, Mongolia) Method
EKZNJTZ and EKU1KJTZ dynamic models of ewe and younger lamb weight were developed in Mongolia to predict sheep weight changes, taking into account the pasture resources and their dynamics, both in terms of quantity and quality, and weather conditions (i.e. temperature, wind speed, snow cover, etc.). Results
Average weight gain during the summer-autumn period in 2039 is estimated to be 1.0-2.3 kilogram lower than the current level, and under 2069 climate conditions will be even lower. The reduction in ewe weight gain increases from south to north.
The expected higher temperatures have a slightly positive effect in the high mountain
region, resulting in reduced weight loss in the winter-spring period, but because of the higher snowfall in the forest-steppe and steppe regions, grazing time will be shorter, (an average 0.2-0.4 hour per day), with stronger negative consequences. Average daily weight loss could increase by 4-8 grams, leading to an estimated increase in total weight loss over the winter-spring period of 0.3 -0.4 kg.
Fodder production increase and supplementary feed for livestock should be introduced to
detain the weight loss in winter spring seasons. If consider that total livestock head will be at current level then it requires 30-40 thousand tons of supplemental fodder every year.
Animal productivity strongly depends on animal body condition. Hence, it may be expected
that this lower weight at the end of the winter-spring period will also negatively affect production of milk, wool, etc. Moreover, since ewe weight is going to be less the birth rate is possibly to be lower than the current climate condition because ewe birth directly depends on its straitening. Consequently, the lamb weight can be also less, which can result in increase of mortality rate. However, weaning weight and growth of lamb can be more since the warming will be earlier in spring, which can result in earlier grass growth.
Livestock milk production is also likely to be lower, because of the reduced daily intake in
the hot period of summer. Moreover, pasture quality will decline earlier than under current climate conditions. Shortening of the cold period may also negatively affect both wool and cashmere production. The expected decline in animal production will have a negative impact on the national economy, since animal husbandry is one of the major economic activities.
Expansion of the Gobi desert and the semi desert steppe areas toward the north will
possibly reduce the pasture for horses and cattle since the mountain and forest steppe would be less which is more suitable for these animals.
All results discussed in this subsection suggest that under present pasture and livestock
management animal production will be lower under future climate conditions. To ensure sustainable development of livestock production in the future and adapt the livestock sector to modified conditions in conjunction with climate change, the possible adaptation measures are elaborated based on studies.

37
Impact on crop in Mongolia
Method
Two different models are used to describe the climate change impact to crop productivity in Mongolia. The production of potato is evaluated running the dynamic-statistical model (DSM) that has been developed in IMH. The Decision Support System Agrotechnology Transfer (DSSAT) is used for estimating the spring wheat production under changed climate.
Results Three different options of crop yield have been studied under impact assessment. These
options are: - potential yields of wheat and potato - water limited yields of wheat and potato - nutrient limited yields of wheat and potato
Impacts on spring wheat
Actual yield of wheat: It is found from the result of impact assessment the spring wheat
yield would increase in 2040 from the current actual yield. Wheat yield increases by 10-130% and the maximum yield would occur in western cropland region while the minimum will be in Central region. The yield of spring wheat would be still higher in western and eastern region when it decreases by 11-22% in central region by 2070.
Potential yield of wheat: The potential wheat yield would increase by 8-58% in 2040. The
maximum increase would occur in western region (15 -58%) and minimum in the eastern region (8-19%). The scenarios ECHAM (19-53%) and HADLEY (12-58%) gave higher increase than others.
In 2069 wheat potential yield in most of the parts of the central cropland region would decrease by 5-35%. Nevertheless, wheat potential yield will be higher by 8-22% in the western and north-western part of the central region, 8-16% in the Dornod region, and the Western region. The maximum decrease of wheat potential yield from current level was found in GFDL (30%), CCCM(35%) and the minimum in CSIRO (5%).
Water limited yield of wheat: The water limited yield would increase by 9-28% in 2040.
The maximum yield would occur in the Western cropland region getting by 16-28% and 13-28% and 13-24% increase can be in the Dornod, 9-22% in the Central region. The ECHAM4 (22-26%) and HADLEY2 (12-28%) predict higher yield.
However the water limited yield of wheat would much less than the level of 2040 but will be
higher by 0-9% than the current yield. The maximum would observe in the Dornod region (2-9%) while the minimum in the central region (0-1%). Also the ECHAM4 and HADLEY2 gave higher yield than others.
Nutrient limited yield of wheat: According to the re sult of impact assessment the limited
yield of wheat is going to be increased by 12-52 percent. The maximum yield will be in the western with 20-52% increase and minimum in the Dornod region with 12-21% increase than the current yield. The results of the ECHAM4 and HADLEY2 are the greatest given 21-50% and 15-52% increase of nutrient limited yield of wheat than the present yield.
In 2070 the nutrient limited yield of wheat in the central cropland region would be 15 -45%
lower than the yield of current climate condition. In spite of this the nutrient limited yield of wheat would increase by 12-20 in western and west-northern part of the central region, by 18 -30% in the Western region and 10-16% in the Dornod region.

38
The maximum drop of the nutrient limited yield of wheat in the Central cropland region found in the CCCM and GFDL which are 22% and 20% respectively. The others gave about 15-30% decrease.
Impacts on Potato Yield
Actual yield: According to the results of CGM’s scenarios in period of 2040 the potato yield would increase by 4-75% in all cropland regions. The maximum increase observed in Dornod and the minimum in the Central region.
It is also found that the potato yield would be higher by 3-23% in periods of 2040-2070 as
compared to the current yield. However it should be kept in mind that potato yield in central and eastern part of the central cropland region is going to be at least 2-12% lower than the current actual yield. Even though the potato yield would be greater in 2070 than the current yield but that is quite lower than the yield found in 2040.
Potato potential yield: The study results show that the potato yield would be increased by
about 2 -26% in 2040 as compared to the current possible potential yield. The maximum rise of potato yield would occur in western (13-26%) and the minimum in the central cropland region (2 -8%).
Maximum increase observed in ECHAM4 (8 -26%) and HADLEY2 (4 -22%). In 2070 the
potential potato yield will be still a little higher (0-14%) than the current level in eastern and cropland regions but it is much less than the 2040 yield. Nevertheless, potential potato yield in central cropland region would decrease by 1-18%.
The maximum decrease of potential yield in central region found in the GFDL (11%) and
CCCM (7%), the minimum in the ECHAM4 (1%). The maximum increase of potato yield would be in the western region in 2070 but this yield is still less by 18% that predicted in 2040.
The water limited yield of potato would increase 0-24% in 2040, particularly, 14-24% in the
Western region, 9-22% in the Dornod region and 0-5% in the central region. The scenario ECHAM relatively high increase of yield (5 -24%).
In 2070 the water limited yield of potato will also increase (0 -14%) but would be less than
that found in 2040 i.e. increases by 5-14% in the Western while it can be only 0 -3% in the Central region. The maximum increase found in ECHAM (3-14%) and in HADLEY (3-14%).
Nutrient limited yield of potato: In 2040 the nutrient limited yield of potato is going to be
increased by 5-28% in the with maximum increase of 17-28% in the Western and minimum of 5-11% in the Central region. In 2070 the nutrient limited yield of potato would increase by 0-10% and 5-13% in the Dornod and western region respectively but will be less than the yield that predict 10% and 13% decrease of potato yield in Central region. The drop of crop yield in Central region is more risky than in other two regions. Because this region is more populated i.e. 50% of total population live in this region. Secondly this cropland regions accounts as mush as 70% of total cropland area and produces 64% of grain crops, 60% of vegetables.
Bibliography
1. Climate change and its impacts in Mongolia, edited by Batima.P and Dagvadorj.D.2000.
Reports of studies of potential impacts natural resource components and economic sectors, National Agency for Meteorology, Hydrology and Environment Monitoring and JENR Publishing, 223 p.
2. Mongolia’s Initial National Communication, 2001. Prepared within the GEF Climate Change
Enabling Activity, National Agency for Meteorology, Hydrology and Environment Monitoring, 130 p.

39
EFFECT OF CLIMATE CHANGE ON FOOD PRODUCTION IN UKRAINE
Anatoliy Prokopenko, Tetyana Adamenko, and Aleksey Kryvobok, Ukrainian Hydrometeorological Center
and Ukrainian Hydrometeorological Research Institute In the Ukrainian Hydrometeorological Center are carrying out research on climate change
and it’s effect on agrometeorological condition of crop growing and food production in Ukraine. Analysis of climate change fo r last 60 years is shown that from 40 th to 60 th years of the 20th
century in Ukraine was very favorable weather condition, especially, for growing of agricultural crops. From the 60th years the weather condition have been changed due to human activity. The number of severe meteorological phenomena, droughts, flooding heavy rains and tornadoes are increased in last forty years.
On the last forty years the winters in Ukraine were warm and snowless. The winter period
has been decreased on one month. Nevetheless in some years (1984-1985, 1986-1987,1996-1997) winters were very cold and snowless, which have led to damage of winter crops and as a result to reducing of food production.
In spite of global warming long spring frost has been observed in Ukraine in the last years
(1999-2001). In 1999 at first in the history of Ukraine was observed the situation when almost all winter crops were damaged after spring frost.
The droughts in Ukraine have been observed every 10 -12 years. The dynamic of climate change in Ukraine repeats the dynamics of global climate change,
which is confirmed synchronous behavior of anomalies of global and regional temperatures. As a result of global warming in Ukraine was observed decreasing the amount of
precipitation and decreasing its amplitude from year to year. The probability of heavy precipitation in some months is increased in the last years.
The changing of temperature and precipitation regimes and increasing of severe
meteorological phenomena are agreed with the chang ing of the atmospheric circulation in Euro -Atlantic region, and close connected with increasing of probability of positive anomalies of temperature in Ukraine.
The changing of climate, which has been done, affected on agricultural crops. The climate
change has a positive effect on agriculture in Ukraine. In the last decade of twenty- century oscillation of crop yield depending on meteorological condition is decreased.
ESTIMATION OF VULNERABILITY OF AGRICULTURE TO THE CLIMATE
VARIABILITY AND CLIMATE CHANGE IN GEORGIA
(T. Tourmanidze, State Department of Hydrometeorology of Georgia, Tbilisi, Georgia)
Introduction Agriculture is most sensitive system toward the climate variability and climate change. Extreme agro-meteorological events – droughts, hails, floods and other climate related natural hazards have a direct influence on the quantity and quality of agricultural production. Main objectives of this research are as follows: – Estimation of greenhouse gases emissions from farm production sector of Georgia;

40
– To develop of quantitative estimation probability of parameters calculation of the most significant natural hazard for agriculture – drought and its influence on maize and vine yield and their quality; and
– To show necessity for development adaptation strategies to climate variability and climate
change. Georgian Parliament ratified the UN Framework Convention on Climate Change in 1994, thus taking responsibility to fulfill commitments on recording greenhouse gas emission in the atmosphere and it’s limiting, conducting those measures which provide for the abatement of emission. Methods
In 1996 Georgian government approved National Climate Change Program and appropriate funds have been allocated for its implementation. This program envisaged carrying out research on a regional level. Preliminary data base has been created to conduct greenhouse gas inventory, analyses of the change of main climate elements –air temperature and precipitation has been conducted during last century, respective trends have been considered in different regions of Georgia, preliminary assessment of vulnerability in agriculture, water resources, coastal zone and natural ecosystems has been carried out. For implementation of the project attraction of a wide range of scientists from a number of institutions become possible. Among them there were invited Agro-ecological Institute of Georgian Academy of Agricultural Sciences and Agro-ecological Society “Eco -valley”. On the basis of assessment of vulnerability of agricu lture to climate change, main directions of adaptation strategy have been worked out, which served as a basis along with the climate change mitigation measures for the creation of agro -ecological monitoring system. Results Agriculture is one of the important branches of country’s economy. Share of Agriculture in the Gross Domestic Product in 1990 – 2000 was 30-40%. Total area of agricultural lands in 2000 was 3 million ha. Total arable land was used in 2000 under following crops: tea crops – 66000 ha, vineyard – 100000 ha, orchards – 100000 ha, vegetables and potatoes – 42000 ha, hey – 16100 ha, cereals – 760000 ha. Number of domestic animals was distributed between the groups as follows: cattle –1.03 million, sheep and gouts – 600000, pigs – 330000, horses – 28000, poultry – 14 mln Energy generation ratio of agriculture among the total energy generation in 1992 – 2000 was 84%. Energy generation TG in agriculture in 1990 was 0.902 TG and in 1997 was decreased up to 0.696 TG. Relevant CO2 emission in 1990 was 2.302 Gg and in 1997 – only 392.4. CO2 emission from agriculture module is connected mainly with the field burning of agricultural usage.
Table 1. CO2 emission from agriculture module (Gg)
Source of Categories 1980 1985 1990 1995 1997
Field burning of wastes 840.0 820.1 901.5 547.4 1008.5
Agricultural soils –480.8 –490.0 –494.8 –497.0 –500.0
Energy generation (transport) 21080 1925.0 2302.9 356.7 392.4
Total 2468.0 2255.1 2709.6 407.1 900.9

41
Emissions of methane have considerably decreased in 1992-1997, namely from 113,1 Gg to 74.0 Gg. Share of Agriculture in total methane emission is 36-45.8%. Predominant role in CH4 emission belongs to animal enteric fermentation and system of manure processing share of which in this sector is approximately 97.9%. Main share in N2O emission belongs to agriculture.
Table 2. N 2O atmospheric emission from agriculture (Gg)
SOURCE OF CATEGORIES 1980 1985 1990 1995 1997
Animal premises 3.128 3.328 2.804 1.665 1.832
Field burning of wastes 0.042 0.042 0.044 0.030 0.052
Energy production (transport) 0.023 0.021 0.025 0.004 0.004
Fertilizers 3.993 3.119 3.042 0.950 1.065
Total 7.186 6.510 5.915 2.649 2.953
The assessment of Georgia’s present soil and climate potential from the position of market economy makes it necessary to consider the possible transformation of agricultural production for various conditions of its conservation under the impact of climate change. One of the most substantial aspects will be the climate change impact upon the hydrological cycle and reasonable utilization of water resources. Frequency of extreme natural events (droughts, floods) will increase resulting in increase of natural disasters. In Eastern Georgia under the shortage of water by the droughts resulted by droughts the crop yield losses are expected. In western Georgia the situation will be quite opposite. Results of our investigations, connected with the expected climate change, showed that agriculture development would have serious social, economic and ecological impact in Georgia both at regional and national level. Degree of vulnerability depends upon ecological, technological and socio-economic factors. Decisive importance here will have both the sensitivity of separate agro-ecosystems to a changing environment their adaptivity and sustainability of the whole Agriculture. Climate change in agriculture would have both positive and negative impact. Negative effects may be formulated as the following types of vulnerability: 1. Increase of the area affected by drought, moisture deficit at the expense of evaporation and
the related loss of yields; 2. Intensification of soil solemnization as a result of the increase of evaporation: 3. Rapid mineralization and exhaustion of soil organic matter; 4. Increase of the intensity and frequency of frosts in some regions as a result of humidity
decrease; 5. Stimulation of wider spreading of crop decreases and pests, as a result of winter warming
and multi generation because of short incubation periods in summer time; 6. Intensification of erosion processes due to the increase of intensity and frequency of
precipitation. Possible positive effects may be revealed in the following way:

42
1. Wide spreading of the southern origin (heat-loving) plants, like tea, citrus, grapes and others, rising their productivity and quality;
2. Possibility to grow two and more harvests on the same field during a year. Increase of a
number of grass cutting and biomass yield; 3. Increase duration of grassing and used the meadows; 4. Energy saving in greenhouses and cattle’s stable heating. To establish the degree of vulnerability in Georgian agriculture, the expected impact of climate variability and climate change on main crops and possibility of their adaptation have been studied for tea, vine, cereals, maize. According to the results of investigations, degree of vulnerability of main agricultural crops spread in Georgia, was determined and is summarized in the Table 3.
Table 3. Indices of Agricultural Crops Vulnerability
No Crops Type of
Vulnerability
No Crops Type of
Vulnerability
1 Vine – (East Georgia)
0 (West Georgia)
6 Maize + (East Georgia)
2 Tea 0 7 Vegetables +
3 Citrus 0 8 Sunflower +
4 Winter Wheat + 9 Tobacco + (East Georgia)
5 Potato + (South Georgia) 10 Fodder crops + (East Georgia)
Note: +, vulnerable; –, less vulnerable; 0, not vulnerable.
Analyzing the fore, we can conclude, that under the conditions of considerable climate change basic transformation of the management of Georgian agriculture is necessary. This implies agro-climatic vertical shift, increase of vegetation period. As to productivity, due to the increase of aridity in Eastern Georgia, it will slightly decrease, however, it will be compensated by increase of productivity in Western Georgia. At the same time, it should be noted that the improvement of soil fertility will mainly overshadow negative impact of climate change. It should be also considered that probability of hazardous phenomena would increase, that is mainly associated with the increase of the recurrence of drought and floods. Conclusion On the basis of the assessment of vulnerability degree, we have the opportunity to work out timely adaptation measures, determine correct strategy at state level. This will provide conduction of measures, which will prevent and neutralize expected negative consequences of climate change in agriculture.

43
CLIMAGRI: A RESEARCH PROJECT OF THE ITALIAN MINISTRY OF AGRICULTURE ON THE INFLUENCE OF CLIMATE CHANGE ON AGRICULTURE
Domenico Vento, Anna Tritto, and Stanisloa Esposito,
Uffico C entrale di Ecologia Agaria (UCEA), Italy
At a meeting of the Commission for Agricultural Meteorology (CAgM) working group held in Geneva on 6 July 2001 on the impact of management strategies in agriculture and forestry to mitigate greenhouse gas emissions and to adapt to climate variability and climate change, CLIMAGRI, a research project of the Italian Ministry of Agriculture on the connexions between climate variations and agriculture was described. This is the only project being carried out in Italy in overall defence of climate in an entire sector, namely agriculture. We feel that this project can become part of the agro-meteorological research and applications needed to prepare agriculture and forestry for adaptation to twenty-first century climate change.
CLIMAGRI is a project that seeks to establish operational aspects of agro -meteorology
over three years beginning in February 2001. Activities are grouped under four sub-projects: provision of information on climate variation in Italy on the basis of 52 meteorological series over more than one hundred years; of determining how to deal with problems in the field of agriculture that will become important in the near future because of climate variations; dealing with problems of drought, desertification and management of water resources in Italy; and disseminating as widely as possible the data and results obtained in collaboration with FAO. The project has 19 lines of research, and roughly 50 Italian public institutions participate directly or indirectly. From the point of view of operational aspects, the following lines of research are being pursued:
• The study of the consequences of climate variation on meteorological anomalies or
adversities that influence agricultural production, for example frosts, and establishment of means for attenuating or even eliminating eventual negative consequences;
• Proposals for integrated management of certain types of land, first, in the specific case of
hills using various hypotheses of climate variation. Currently, this is being done for the Marches Region.
• Establishment of appropriate indicators in order to monitor constantly the regions in Italy
subject to problems of drought; • Provision of conclusive results on an experiment with artificial rain in southern Italy and, as
a result, provision of behavioural information to those who need to know the truth about the effectiveness of that activity of artificially changing weather;
• Close focus on the weather forecasts of the Data Assimilation Limited Area Model
(DALAM) of the Italian Ministry of Agriculture applicable to the needs of agriculture, in order to provide forecasts at the national level; for example forecasts on meteorological anomalies, excessive wind, high temperatures, frosts and storms;
• Provision of seasonal forecasts of the European Centre for Medium-Range Weather
Forecasts at Reading (ECMWF) at the level of the Italian territories in order to organise activities linked to agriculture rapidly;
• Successful use of a living physical sensor, namely several species of zooplankton, in order
to predict changes in climate.
At the same time, CLIMAGRI aspires to organise the national agro-meteorological databank better and more completely, providing maximum standardisation of the meteorological, agronomic and phonological data and information on farming techniques. It will also study problems of variation in land use under the influence of climate change, using various technologies and methodologies, such as remote sensing and concentrations of isotopes. The

44
first year of the project will finish in March–April 2002, allowing presentation of data and results to the workshop, although with the caveat that a useful and complete picture will be available only after the full three years planned for the project.
EXAMPLES IN OPERATIONAL ASPECTS OF AGROMETEOROLOGY ON CLIMATE VARIABILITY AND CLIMATE CHANGE
(Yanxia Zhao, Chinese Meteorological Administration, Beijing, China)
Agriculture is the most important and fundamental sector in China. However, agricultural
production is largely dependent on weather conditions due to natural and economic restrictions; therefore, it is quite vulnerable to climate variability and climate change. Since 1950s, meteorology services on agriculture have been carried out in China. From then on, National agrometeorological service network was established and improved gradually and has been playing a key role in providing services to government at all levels and general public. Examples in operational aspects of agrometeorology on climate va riability and climate change are summarized as follows:
Crop Yield Forecast
It is of great importance to provide government with crop yield prediction in advance at different temporal and spatial scales. The prediction of the trend and fluctuation of crop yield is usually produced by utilizing related forecast models, considering the weather and crop information over the previous period delivered by agrometeorological monitoring networks and remote sensing, especially taking the possible impacts of agrometeorological disasters caused by climate variability and climate change on crops into account.
Prevention and Mitigation of Disasters
Disaster prevention and mitigation is an effective way to reduce vulnerability of agricultural production to climate variability and climate change. Analyses show that Climate in North China is getting drier and warmer in recent 40 years. Drought has been the most severe agrometeorological disaster. In addition, the increase of extreme weather and climate events caused by climate variability leads to increase of flood and low temperature hazards etc.. As far as the drought is concerned, we usually forecast the soil moisture and whether drought will happen in the next ten days or much longer time based on previous soil moisture conditions and weather prediction, as well as crop development stage and associated water demand. On the basis of these forecast, we then put forward proposals in support of disaster prevention and mitigation, such as suitable seeding date, irrigation time and amount, flooding and draining management for rice etc.. In addition, forest fire, crop diseases and insects are also closely related to climate variability. Agrometeorological service unit also pays much attention in this regard and provides services in the regular and timely manner.
As mentioned above, the timely prediction of the possibility of agrometeorological disasters
is essential to reduce vulnerability to agriculture production. For those agrometeorological disasters already happened due to extreme climate or weather events, the mitigation of their negative effects is an important way to reduce or avoid the losses of agriculture production. Under such cases we act in two ways. On one hand, the information on disasters reported by monitoring networks is released timely and objectively. On the other hand, the impacts of disasters on agriculture, forestry and husbandry are assessed, and then agometeorological advisories are put forward accordingly. Agroclimatic Resources Utilization and Ecosystem Environment
In the past two years, Agrometeorological service unit carried out the third zonation of climatic resources in order to meet the agricultural restructuring demand. One of the focuses is

45
the evaluation of current climate situation and history evolution in which agricultural vulnerabilities to climate variability and climate change is carefully considered. The plan plays a positive role in rational development of resources and protection of ecosystem environment, especially for the regions that are vulnerable and sensitive to climate variability and climate change, such as loess plateau in northwestern China where loss of water and erosion of soil are severe, and interlock area of farming-pastoral region in northern China. Its significance is highly recognized by the government authorities at all levels.
All of the above-said operational agrometeorological services provided both regularly and
irregularly are delivered to users through various ways, which include dedicated reports specialized network for agricultural information, newspapers, telephone and television. The major users include concerned governmental departments and institutions such as the Ministry of Agriculture, State Development Planing Commission, Ministry of Finance, Disaster-monitoring Centers, and general public in particular farmers as well as other special users.
AGROMETEOROLOGICAL INFORMATION USED IN AGRICULTURE AND FORESTRY ECONOMY IN ALBANIA
(Dr Petrit Zorba, Albanian Hydrometeorological Institute, Tirana, Alb ania)
Abstract
The presentation will be focused about some results and information regarding the following topics: • Climate change in Albania by phenological observations and the respective impact to the
agriculture and forestry. • Communication of agrometeorological information to the network of agricultural
institutions and farmers. • Forest fires risk possibilities in Albanian territory.
Climate Changes
Climate changes are recently an objective of study from different point of view. In parallel
with meteorological observations, one important and relevant point is the conclusions sorted by phenological observations.
The phenological network in Albania has about 12 active stations and the respective
archive disposes pheno-data from 1967 in some cases. The following graphs present in summary what are telling the phenological observations in
Albania and what is happening with climate in our areas.
Actually in Albania is clear and well noted the fact of climate change, because a diminution of rainfall and an early long spring season are frequently on the last times; as a hot summer is followed by a long autumn - characterized by missing of precipitation and relatively high temperatures. Different graphs with respective trend line will be presented for around the country in a more detailed and informative map of Albania, giving a well-defined tendency line, which converted in other terms means the clear evidence of climate change in our territory.
The flowering observations generally are the most sensitive - regarding the environmental
conditions and reflect each year the going of meteorological conditions. During the years on long time period are observed the changes, that are a reflection or not of climatic conditions on that particular area.

46
In our study we will tray to evidence what happen about the initiation process of flowering
at some agricultural plants. As can see at the following graphic the phenological data for a long data serie from 1973 up to 2000 presents a moderate tendency of advancing in time, regarding that particular phase for the maize plants in a phenological station (Pogradec) on southeast of Albania.
The same tendency (trend line) is observed also to the phenological data of the first date of
flowering (10% of plants observed) at the potato plants in Puke phenological station
Agrometeorological Information
Shortly will be presented the content of agrometeorological bulletin and related elaborated information.
Forest Fires
As regards the forest fires, will be analyzed and presented for the period June - September
(as the most dangerous period) the climatic conditions of Albanian territory that as can be seen, present a potential risk.
The analysis is based to the principal index used and applied in different Mediterranean
countries in prevention policies and forecast models.
Wheat - Start of spike phenological phaseSheqeras - Korce - Phenological station
30-Mar09-Apr19-Apr29-Apr
09-May19-May29-May08-Jun
1967
1969
1971
1973
1975
1977
1979
1981
1983
1985
1987
1989
1991
1993
1995
1997
YEARS
DA
TE
First flowering - Potato - Puke Phenological Station
19-Apr29-Apr09-May19-May29-May08-Jun18-Jun28-Jun08-Jul
1982
1983
1984
1985
1986
1987
1988
1989
1990
1991
1992
1993
1994
1995
1996
1997
Years
Dat
e o
f Fir
st F
low
erin
g
(10%
)

47
Taking into account these criteria, regarding the temperature, air humidity, wind direction and speed and other important meteorological elements, are elaborated the respective information and the results graphically or in other convenient forms will be presented step by step in this paper.
Preliminary, as can be imagined, because Albania like the other Mediterranean countries
has the same climatic conditions, from the study has been carrying out some scientific important conclusions. They confirm the existence of natural risk and the necessity to undertake initiatives and to implement projects that will help the protection of forest areas.
Just to have an idea about the going of meteorological elements during the period analyzed
presented by the graph above, that clearly tell us for high temperature that over pass the threshold 30-33ºC used generally in the forest fires input models.
MAIS - First flowering Pogradec Phenological Station
19-May29-May08-Jun18-Jun28-Jun08-Jul18-Jul28-Jul
07-Aug17-Aug
1973
1975
1977
1979
1981
1983
1985
1987
1989
1991
1993
1995
1997
1999
Years
Dat
e of
firs
t flo
wer
ing
Apple - First Flowering phenophasePogradec Phenological station
10-Mar
20-Mar
30-Mar
09-Apr
19-Apr
29-Apr09-May
19-May
1970
1972
1974
1976
1978
1980
1982
1984
1986
1988
1990
1992
1994
1996
1998
2000
YEARS
DA
TE

48
M a x i m u m T e m p e r a t u r e i n ºC
05
10
15
2025
30
35
4045
50
B. Curr
i
Shkod
erLe
zhe
Kukes
Tiran
e Fier
Korce Vlo
re
Gjiroka
ster
Saran
de
Meteo S ta t i ons
Air
Tem
pera
ture
in ºC
J u n e J u l y A u g u s t S e p t e m b e r
Fire forest - Threshold of Air Temperature > - º C

49
SECTION 2
CONTRIBUTIONS FROM DISCUSSANTS OF THE PAPERS PRESENTED AT THE INTERNATIONAL WORKSHOP:
“REDUCING VULNERABILITY OF AGRICULTURE AND FORESTRY TO CLIMATE VARIABLITY AND CLIMATE CHANGE”

50
OVERVIEW - CLIMATE VARIABILITY AND CLIM ATE CHANGE: PAST, PRESENT AND FUTURE
(M.J. Salinger)
Discussion by K.R.A. Bandara, Sri Lanka
The expected effects of climate change on agriculture in Sri Lanka
Sri Lanka, geographically situated in the Indian Ocean between latitudes 5N and 10N and longitudes 79E and 82E experiences Asian monsoon weather. Since the topography of the landmass is such that it consists of a central high ground surrounded by low-lying land in all the direction. Topography has to be accounted in discussing the area -spread of the rains over the island on which the division of the country into three zones wet, intermediate and dry is based. Sri Lanka is predominantly an agricultural country. Among the major agricultural land uses, paddy occupies 27% (under three different categories depending on the source of water, namely, major irrigation, minor irrigation and rain fed) of the arable lands while nearly similar acreage (24%) is under the plantation crops such as tea, rubber and coconut. Cultivating of sugarcane is largely confined to the eastern part of the intermediate zone. A range of annual crops under rain -fed condition is also grown in all parts of the country. These crops include coarse grains, pulses, oil seed crops, vegetables and condiments. Irrigated annual crops are also part of Sri Lankan agriculture wherever water is available for Irrigation from canals, streams and even ground water. High return crops such as chilies, onion and vegetables are common in this system. Perennial crops such as coffee, cocoa, pepper, cardamom, cinnamon, cloves, nutmeg are also grown as mix crops with other local tree species. This type of land -use is mainly found in the Wet and intermediate zones as an export oriented extensive agricultural system.
Abrupt changes of weather and enhanced environmental temperature regime are very
crucial to agricultural production process. More over agricultural sector in the coastal regions is very vulnerable to the inevitable sea level rise in a changing climate. Although positive impacts of increasing level of atmospheric CO2 on the agricultural productivity is well documented there is less certainty as to how Sri Lankan agriculture will respond to such a situation. In general, the effect of climate change on agriculture in Sri Lanka may be varied. Productivity is expected to decrees in some areas for some crops and increase in others. Increase in average temperature across the country during recent past is largely due to the increase in nighttime minimum temperature than that of the day-time maximum temperature which is similar to the global trend of temperature rise during last century. Hence if this trend continues it may limit the high value vegetable and potato cultivation in the upcountry region and cool season potato cultivation in Jaffna peninsula. Also increased nighttime temperature increase the rate of respiration in plants while affecting distribution of photosynthates among different parts of the plant favoring those that are not useful. Therefore economic yields of high value crops grown in up country regions may decline with the anticipated climate change.
Rice is very sensitive to high temperature stress during anthesis. At anthesis, if daytime
temperature is in excess of 35C and night-time temperature is above 30C it causes high spike sterility. Increasing temperature results in reducing the total duration of the crop by inducing early flowering and shortening grain filling period. When ambient temperature increases the atmospheric water demand also increases with a subsequent increase in potential evapotranspiration. Hence both rain-fed and irrigated crops will require more water in the future to compensate the increased water demand. This water may not be available through the anticipated rainfall increase in a changing climate.
Moreover, increasing temperature is likely to cause a positive impact on the tea yields in
the up country at the expense of the quality whereas quality of low grown tea may continue to deteriorate along with yield reduction.

51
All the weather changes will manifest in the rainfall regime as shifts in means along with an increased spatial and temporal variability causing intensified droughts and floods which affect crop production making serious impacts on the agricultural production in every climatic region of the country.
Discussion by Tan Lee Seng, Agrometeorological Division, Malaysian Meteorological Service, Malaysia
Climate affects the crop yields in a significant way. Climate change, therefore, can affect
the agricultural sector in Malaysia. The main concern will be the potential threat to national food production and export earnings from crop plantations.
Is there other ways in adapting to the climate variability and climate change like bio
technology apart from the traditional methods. Like many countries in the world, temperature records in Malaysia in the last 50 years have
shown warming trends (Figure 1). Climate change may bring about an increase in the frequency and intensity of extreme weather events, such as, droughts, storms and floods. There is still, however, insufficient data to determine whether the frequency of extreme events has indeed increased. It has been observed that, since 1977, there have been more frequent El Niño Southern Oscillation (ENSO) warm phase episodes. This behaviour, especially the persistent warm phase from 1990 to mid-1995, was unusual in the last 120 years and significantly influenced rainfall in Malaysia.
Slope of Regression Line : 0.2 °C/decade
25 .4
25 .6
25 .8
26 .0
26 .2
26 .4
26 .6
26 .8
27 .0
27 .2
27 .4
27 .6
27 .8
28 .0
28 .2
28 .4
51 53 55 57 5 9 6 1 63 65 67 69 71 73 75 77 79 8 1 83 85 87 89 91 93 95 97 99 01year
Tem
pera
ture
°c
Mean Temp Linear Regression Line
Figure 1. Time Series of Mean Annual Temperature. Source: MMS
Ñ = Alt - 164

52
IMPACTS OF PRESENT AND FUTURE CLIMATE VARIABILITY ON AGRICULTURE AND FORESTRY IN THE SUB-HUMID AND HUMID TROPICS
(Yanxia Zhao, Chunyi Wang, Shili Wang and Lourdes Tibig)
Discussion by Deusdedit Kashasha, Research and Applied Meteorology Division,
Tanzania Meteorological Agency, United Republic of Tanzania
The United Republic of Tanzania lies just south of the Equator. It has a bimodal rainfall season in the north and unimodal rainfall regime in the southern part of the country. Semi – arid conditions prevail in the midsections of the country.
More than 90% of the population are subsistence farmers who depend on rain fed
agriculture. Rainfall has become increasingly erratic, onset is delayed more frequently, and growing seasons have become shorter.
Agroforestry needs to be enhanced with “Lucena” trees which fix atmospheric Nitrogen
being popularised. The National Tree Planting campaign meant to restore environmental conservation and afforestation programmes should be enhanced.
Traditional and modern soil water conservation along with rainwater harvesting techniques
will greatly help improve agricultural production.
Climate Change and Variability in the Socialist Republic of Viet Nam and Strategies of Sustainable Development on Agriculture
Discussion by Nguyen Van Viet, Agrometeorologycal Research Centre,
Socialist Republic of Viet Nam
Introduction
- The Socialist Republic of Viet Nam is a penisula in the tropical northern hemisphere with a coastline about 3000 km. Most socio-economic activities are concentrated on the Red River and Mekong River deltas and other narrow plains.
- Studies of climate change and variability in the Socialist Republic of Viet Nam and
strategies of sustainable development on Agriculture we have analyzed the following fluctuations: (1) Analyzed some mains of climate elements related with agriculture production such as:
+ Air temperature + Precipitation + Sunshine duration + Typhoon
(2) Impact of climate change and variability on rice crop yield.
(3) Strategies of sustainable development on Agriculture

53
Methodology of Data
We used methods of statistical analyze in climate and Agrometeorology. Meteorological data have been collected in some main stations in 7 Ago-economic regions of the Socialist Republic of Viet Nam such as: in the North mountain and midland - red river delta, North central, south central, central plateau, north east south, Mekong river delta since 1960 up to 1998. Assessment Climate Change and Variability in the Socialist Republic of Viet Nam
1. Air average temperature.
Long-term variation and trend of temperature in January, July and annual over last 35 years are increased about 0.2 -1oC. (Table 1, Figures 1,2 and 3) 2. The dates of beginning and ending temperatures through 20oC, 25oC.
The dates of beginning and ending temperatures through 20oC, 25 oC are very important for defining the crop calendar and crop rotation, especially for defining the growing period for Agriculture in the North and in the mountain regions. Result of calculation show that the winter period is shortest than normal and summer period is longest than normal (Tables 2 and 3).
Table 1. Variation and trend of average temperature in Viet Nam (1960-1998)
Station in January in July Annual
Bac Giang -0.3 -0.2 0
Ha Noi +0.4 +0.4 +0.4 Hai duong 0 0 0 Namdinh 0 0 +0.5 Vinh +0.4 +0.3 +0.3 Danang +0.8 +0.3 +0.5 Nha Trang 0 0 0 Playku +1 +0.9 +1 Buonmathuot +0.9 +0.4 +0.5 Saigon 0 0 +0.2 Can tho +0.5 +0.5 +0.5 Baclieu +0.2 -0.2 0
Table 2. Trend change of dates of beginning and ending temperature through 20oC
Station The dates of beginning
The dates of ending Duration of winter
Ha noi early 1 day later 6 days shorter Nam dinh later 10 days later 13 days shorter Da Nang early 10 days later 5 days shorter Playku early 9 days later 3 days shorter Banmethuot early 10 days later 5 days shorter

54
Table 3. Trend change of dates of beginning and ending temperature through 25oC
The dates of beginning
The dates of ending Station
Duration of summer
Ha noi 0 later 6 day no change Nam dinh early 3 days later 2 days Longest Da Nang later 2 day early 1 day no change Playku later 13 days early 12 days no change Banmethuot early 1 day later 10 days Longest
3. Absolute minimum temperature
Absolute minimum temperature is very important for distribution of perennial plant such as industrial crop coffee, rubber, tea and fruit trees such as lemon, orange, banana, longan, litchi. The variation and trend change of absolute minimum temperature is increased in the whole country (see table 4 and fig 4, 5, 6.)
Table 4. Trend and variation of absolute minimum temperature
Region Station Variation (oC)
Lai Chau +1.5 Sapa +1 North west Van Chan +2 Cao Bang +2 North east Lang Son +1.8 Phu Tho +1 Mid land Bac Giang +1 Ha Noi +1 Red river delta Hai Duong +0.4
North central Vinh +0.4 South central Nha Trang +0.5 North eat south Sai gon +0.8
Playku +0.2 Plateau Taynguyen Buonmathuot +1.2 Soctrang +0.5 Mekong river delta Rach Gia +1.2
If absolute minimum temperature continue increased as present a tropical crop will be
migrate in the north latitude and in the high mountain about the 50-100m.
4. Sunshine duration In the whole country sunshine duration are decrease excepts the south central region and
high mountain in central region (see Table 5) 5. Rainfall
The situation of rainfall is somewhat complex depending on locations and seasons. In annual and summer season (May - October) small decreasing trend is found at station Hai duong, Ha noi (Red river delta region), Vinh (North central region), Can tho and Bac Lieu (Mekong river delta). On the other hand, in winter-spring season rainfall is increasing trend which observed at Bac Giang, Ha noi, Nam dinh, Vinh, Playku, Saigon (see Table 6, Figs. 7, 8, 9)

55
Table 5. The trend of change of sunshine duration
Station January (h) July(h) Annual(h) Summer season(h)
Winter-spring season (h)
Bac giang - 20h - 10h - 50h - 10h - 40h Ha Noi - 20h - 30h - 200h - 100h - 100h Nam dinh - 10h - 60h - 250h - 160h - 100h Vinh - 8h - 20h no change - 5h - 15h Banmathuot
+ 15h + 10h no change - 40h + 10h
Bac lieu - 15h - 20h - 140h - 60h - 100h
Table 6. The trend of change of rainfall
Station January (mm) July (mm) Annual (mm) Summer season (mm)
Winter-spring season (mm)
Bac giang 0 +60 +150 +110 +15 Ha Noi +12 +20 0 -10 +60 Hai duong +12 -20 -180 -180 +10 Nam dinh +5 +50 -50 0 +50 Vinh -20 -50 -40 -100 +10 Da nang 0 -10 +200 +180 -20 Playku -2 -10 0 0 +60 Sai gon -5 0 0 -50 +50 Can tho -1 +30 0 -20 0 Bac lieu -30 +125 -100 -50 -20
6. Typhoon visit in the Socialist Republic of Viet Nam
Annual number of typhoon visit in the Socialist Republic of Viet Nam the period from 1950-1999 is show in table 7. Number of typhoon visit in the Socialits Republic of Viet Nam shown increasing trend from the 1950-1980. While it shows some decreasing trend in the 1990. Also noted is a clear shift of typhoon visit season in Vietnam. The peak month in the 1950 is August while it is in September in both the 1960 and the 1970. It shifts to October in the 1980 and even to November in the 1990. There fore clear delay trend of the typhoon visit season can be found during the latter half of the 20th century; of which season should be investigated in future.
Table 7. Monthly and annual frequent of typhoon visit in the Socialist Republic of Viet Nam for 1950-1999.
Month 1 2 3 4 5 6 7 8 9 10 11 12 Year 1950-1959 0 0 0 1 1 4 5 11 9 9 7 3 50 1960-1969 0 1 0 1 1 5 11 13 19 12 8 1 72 1970-1979 0 0 0 0 2 9 7 13 18 15 10 4 78 1980-1989 0 0 2 0 1 9 10 9 9 24 11 2 77 1990-1999 0 0 0 1 0 6 8 10 12 14 15 5 71
Total frequent per year
0 0.02 0.04 0.06 0.1 0.66 0.82 1.12 1.34 1.48 1.02 0.3 6.96
Impact of Climate Change and Variability on Agriculture
In order to study impacts of climate change and variability or extreme climate event (El Niño, La Niña) on rice yields in different agro-economic regions were under taken analysis data series of rice yield of winter – spring and summer crop season. As well as calculate differences of

56
rice yield and differences of climate element between this year with the year before from 1960-1998. After that calculate correlation coefficient between differences of rice yields with differences of climate elements in growing period (see Table 8, 9)
Table 8. Correlation coefficients between winter/ spring rice yield with
climate - element in growing period.
Month Region XI XII I II III IV
Temperature Platter Bacbo +0.05 +0.24 -0.16 -0.28 -0.52 +0.04 Red river delta +0.11 +0.31 -0.23 -0.45 -0.66 -0.24 Mekong river delta - 0.22 - 0.1 -0.03 +0.36 +0.28 +0.06
Rainfall Platter Bacbo -0.04 -0.09 +0.14 +0.64 +0.13 +0.14 Red river delta -0.18 +0.14 +0.24 +0.36 +0.34 +0.01 Mekong river delta -0.09 +0.02 -0.06 -0.25 -0.05 +0.02
Sunshine duration Platter Bacbo +0.08 -0.29 +0.22 -0.15 -0.24 +0.43 Red river delta +0.24 -0.15 -0.01 -0.31 -0.04 +0.2 Mekong river delta -0.07 -0.24 -0.15 -0.04 -0.2 +0.19
Table 9. Correlation coefficients between summer rice yield with climate – element
Month
Region V VI VII VIII IX X
Temperature Platter Bacbo +0.09 +0.14 +0.4 -0.48 -0.33 -0.01 Red river delta -0.08 +0.32 +0.64 -0.05 +0.22 +0.48 Mekong river delta +0.12 -0.12 -0.27 -0.03 -0.03 +0.04
Rainfall Platter Bacbo +0.38 +0.1 -0.25 -0.08 +0.10 -0.46 Red river delta -0.09 +0.03 -0.44 -0.07 -0.08 -0.35 Mekong river delta -0.27 -0.16 +0.31 +0.1 -0.33 -0.12
Sunshine duration Platter Bacbo +0.21 -0.2 +0.39 -0.24 -0.12 +0.33 Red river delta -0.1 +0.06 +0.36 +0.07 +0.03 +0.18 Mekong river delta +0.24 -0.59 -0.42 +0.11 +0.15 +0.01
In order to predict rice yield before harvest time we use equal:
Yt+1 = Yt + ∆Y
where: Yt+1 - Prediction rice yield in this year Yt - rice yield in the year before ∆Y - difference of winter - spring or summer rice yield can find in
following equations:
For Winter-Spring Rice
In midland Bacbo: ∆Y= 0.451 - 1.156∆T 3 + 0.095∆R2 + 0.041∆S4
In red river delta: ∆Y = 0.714 - 2.422∆T3 + 0.024∆R2 + 0.02∆S11

57
In the Mekong river delta: ∆Y = 0.708 + 1.095∆T2 + 0.296∆R2 - 0.042∆S12
where : ∆T 2, ∆T 3, ∆R2, ∆S4, ∆S11, ∆S12 - differences of temperature, rainfall and sunshine duration
in February , March, April, November, December. For Summer Rice Yield In midland Bacbo: ∆Y= 0.397 - 2.034∆T 8 + 0.01∆R10 + 0.008∆S7
In red river delta: ∆Y = 0.159 + 3.406∆T7 - 0.002∆R7 + 0.002∆S5
In the Mekong river delta: ∆Y = 0.851- 0.613∆T 7 + 0.011∆R7 - 0.106∆S6
where: ∆T7, ∆T8, ∆R7, ∆R10, ∆S5, ∆S6, ∆S7 - differences of temperature, rainfall are sunshine
duration in May, June, July, August, October. The impact of ENSO on winter spring rice yields (see Table 10,11, 12, 13)
Table 10. Difference of winter - spring rice yield between this year with the year before (in El Niño year)
Winter-
spring crop
Northern
mountain
North
midland
North
delta
Northern
central
coastal
Southern
central
coastal
North East
South
Southern
delta
1976-1977 -1.6 -5.6 -9.0 -4.6 -4.3 -3.3 -3.2
1977-1978 +0.5 +1.8 +2.5 +1.7 +3.3 -3.9 -5.4
1979-1980 +0.7 +1.6 -3.2 -1.0 -3.1 -3.8 -3.0
1982-1983 +4.4 +4.8 +3.1 +2.3 +0.5 +2.6 +3.6
1986-1987 -4.4 -7.6 -8.0 -7.8 +3.3 -0.9 +1.9
1987-1988 +4.7 +11.9 +17.
9 +5.1 +4.6 -1.4 -1.1
1990-1991 -13.7 -18.9 -18.1 -4.3 +0.8 +0.8 -0.5
1992-1993 +2.6 +0.6 +6.7 +1.5 -4.1 +1.2 -7.6
1994-1995 -0.1 -0.1 -2.8 +4.7 +11.0 +2.4 +1.0
1997-1998 -1.4 -3.8 -1.0 -1.7 -2.1 -3.4 -0.3
Total -8.3 -15.3 -11.9 -4.2 +9.9 -9.7 -14.6
Average -0.83 -1.53 -1.19 -0.42 +0.99 -0.97 -1.46

58
Table 11. Difference of summer rice yield between this year with the year before (in El Niño year)
Summer crop
Northern mountain
North midland
North delta
Northern central coastal
Southern central coastal
North East South
Southern delta
1976 +0.35 +0.06 +1.27 -2.15 1977 -0.35 -1.3 -1.67 +1.24 -1.43 -0.13 -2.89 1979 -0.61 -0.55 +4.28 +6.82 -3.28 -9.72 +5.51 1982 +2.67 +3.7 +4.32 +1.39 +4.44 +2.08 +3.8 1986 -0.2 +6.1 +5.1 +0.3 -1.6 +0.8 0.0 1987 +1.3 +4.0 +7.7 +3.8 +0.5 -0.9 -2.2 1991 +3.7 +4.8 +7.5 +2.6 +2.5 +1.3 +1.2 1993 +4.0 +2.6 +6.9 +6.4 -3.3 +5.1 +0.6 1994 -1.8 -3.7 -15.7 -2.0 +3.0 -0.4 +3.5 1997 +5.5 +1.2 +3.3 +8.6 -2.8 +8.1 -4.1 Total +14.56 +16.68 +23.0 +27.0 -1.97 +6.23 +5.42
Average +1.46 +1.67 +2.3 +2.7 -0.22 +0.69 +0.6
Table 12. Difference of winter - spring rice yield between this year with the year before (in La Niña year)
Winter-spring crop
Northern mountain
North midland
North delta
Northern central coastal
Southern central coastal
North East South
Southern delta
1975-1976 +2.25 -2.39 +8.53 -3.5 1984-1985 +3.10 +5.8 +4.70 -3.5 +2.8 +0.9 -1.3 1988-1989 +2.9 -0.5 -1.9 +1.6 -7.3 +4.8 -3.4 1995-1996 +5.7 +5.5 +9.2 +2.2 +4.4 +4.1 +0.3 1998-1999 +3.0 +2.8 +1.6 +3.6 +3.4 +4.5 -0.2
Total +16.95 +11.21 +22.13 +0.4 +3.3 +14.3 +2.2 Average +3.39 +2.24 +4.43 +0.08 +0.83 +3.58 +0.55
Table 13. Difference of summer rice yield between this year with the year
before (in La Niña year)
Summer crop
Northern mountain
North midland
North delta
Northern central coastal
Southern central coastal
North East South
Southern delta
1984 +0.2 +0.4 -1.0 +2.0 -0.14 -0.7 +0.28 1988 -1.6 -4.9 -7.8 -6.6 -4.4 +1.2 +3.7 1995 +1.2 +3.7 +11.0 +1.6 -2.7 +1.3 -3.3 1998 +1.7 +7.3 +6.2 +0.3 +15.1 +8.1 +23.8 Total +1.5 +6.50 +8.4 -2.7 +7.86 +9.9 +24.48
Average +0.38 +1.63 +2.1 -0.68 +1.97 +2.48 +6.12
Relationship between rice yields with MEI, SOI On base analysis concerning relationship between rice yields with MEI, SOI at difference regions from the North to South of Viet Nam would be concluded as following: - Rice yields have very good relationship with MEI, SOI

59
- MEI and SOI would be used as criteria for yield forecasting in the Socialist Republic of Viet Nam especially in years with ENSO.
- In general, rice yield has more close relation with MEI than SOI. Strategies of Sustainable Development on Agriculture
1. Some adaptation strategies.
In order to cope with climate change and variability and ENSO phenomena for sustainable development on Agriculture in the Socialist Republic of Viet Nam were recommended some adaptation and mitigation action for every Agro-ecological regions such as following.
- Selection of plants that can better utilize carbohydrates which are produced when plant are
grown at elevated CO2. - Search for germplases that are adapted to higher day and night temperatures and
incorporate those traits into desirable crop production cultivates to improve flowering and seed set.
- Change planting dates and other crop management procedures to optimize yield under
new climatic conditions and select for cultivates that are adapted to these changed agricultural practices.
- Shift to species that have more stable production under high temperature or drought. - Determine whether more favorable N:C rations can be attained in forage cultivates adapter
to elevated CO2. - Where needed and where possible, develop irrigation systems for crops. 2. Technological option for adaptation. - Seasonal change and sowing dates: for short season crops such as rice maize, sweet
potato, soybean, groundnut and many vegetable crops extension of growing season may allow more crops per year.
- Different crop variety or species: for most major crops, varieties exist with a wide range of
maturity periods and climatic tolerance. - New crop varieties: the genetic base is broad for most crops but limited for some explore
how hypothetical new varieties would respond to climate change. - Water supply and irrigation systems: irrigated agriculture as is known in general is less
negatively affective than dry land agriculture. - Other inputs and management adjustments – added nitrogen and other fertilizers would be
necessary to take full advantage of the enhanced CO2 effect. - Tillage – studies also have considered a wider range of adjustments in tillage, grain drying
and other fields operation. - Improved long term and short term climate prediction for example application of ENSO
forecast for changing crop calendar in winter - spring, su mmer rice such as:

60
• In El Niño Years
- The change of crop season in winter spring rice in year with El Niño. - Use some necessary measures in rice production are:
+ Having good irrigation system, especially in central coastal and southern delta
regions. + Having, keeping measures young seedling from old and setting flowering in
period from late of April to early May in the North regions.
+ Should use drought tolerant thermoplastic varieties of rice. • In La Niña years in the North Viet Nam should pay attention to
- Having measure for preventing chilling for seeding. - Using late maturity and chilling tolerant varieties.
- Having priority to early and leading crops in designing rice cropping pattern in delta
region. • The change crop rotation pattern for every regions
- At the North region: + Winter - spring rice + Summer rice + winter dry land crop
- At the central coastal region. + Winter - spring rice + Summer-Autumn rice + autumn-winter dry land crop
- At the southern delta region. + Winter - spring rice + spring-Autumn rice + autumn-summer rice or: + Winter - spring rice + spring-summer dry land crops + autumn-summer rice.
Use technical measure preventing ENSO impact
• For year with El Niño: - The winter-spring crop season in the Northern regions usually are warm and with drought
so it is need to keep water to combat drought for winter-spring rice in the late period of the season and early summer rice.
- In the regions, where water supply is difficult, have to seed dry land food crops as maize,
sweet potato soybean, groundnut. - In the central coastal and the southern delta regions the preventing drought for rice and dry
land food crops is need especially preventing typhoon, floods and water logging in the central coastal regions.
• For year with La Niña: - In the winter-spring crop season the weather is colder than usually. So it is need the
preventing seedling and young rice from chilling injury.

61
- In the summer crop season it is necessary to prevent typhoon, flood and water logging in whole country especially in the central coastal regions.
- Should be used new and short day rice varieties in appropriate crop-season. CONCLUSIONS AND RECOMMENDATIONS
From the primary research result of climate change and variability and strategies of sustainable development on agriculture may be concluded and given some recommendation as following: Conclusions
The Socialist Republic of Viet Nam climate change and variability are a part of global climate change, if it occurs will definitely effect agriculture. In Vietnam the change and variability of climate elements in every Agro -ecological regions are difference. In general temperature is increasing sunshine duration is decreasing typhoon is moving in the South, the change of rainfall is not clear for every regions. The effect of climate change and variability and ENSO phenomena on agriculture are not similar in difference agro -ecological region of the Socialist Republic of Viet Nam. For sustainable development on agriculture to cope with climate change will have to change the cropping calendar , cropping pattern, cropping rotation for every agro-ecological regions. To select adaptation crop, varieties for every agro-ecological regions and for every crop season. At present and near future should be use climate index and ENSO index in early agrometeological monitoring and forecasting crop yield especially for rice and food crops, for conserving with food security in the Socialist Republic of Viet Nam and South East Asia region. Recommendations
1. In order to establish above mentioned strategies and tactics as well as to improve the
application of those results in agricultural practices should be continued research project on impact of climate change, extreme climate event (ENSO phenomena), climate disaster on agriculture and measures to cope with them for every agro -ecological zones in Vietnam and South East Asia region.
2. Enhance capability agrometeorological application of climate and ENSO forecast and
information for end users, farmers in Vietnam and South East Asia region. Especially we have to continue study:
- The impact of climate change and variability on agriculture, forestry and food security
in South East Asia and strategies to cope with them. - Strengthening capability agrometeorological networking and monitoring and advisory
for agriculture on sustainable development in South East Asia Reference 1. Vu Nang Dung; Impacts of climate change on agriculture in the Socialist Republic of
Viet Nam. Vol 2 p 81-91. Hanoi 11 -1996 2. Nguyen Duc Ngu, Nguyen Trong Hieu; Climate change and its impacts on agriculture in
Vietnam near by 100 year. Vol. 1, P.1-9. Hanoi 11-1996 3. Nguyen Van Viet, Nguyen Van Liem, Ngo Tien Giang; Study evolve of climate disasters
and changing cropping pattern in central regions of Vietnam. Scientific report 157 p. Hanoi – 1998

62
4. Nguyen Van Viet, Ngo Sy Giai, Ngo Tien Giang, Nguyen Van Liem; Impact of ENSO on climate and agriculture in Vietnam and measure to cope with them. Scientific report 170p, Hanoi 2000
5. Nguyen Van Viet; The influence of climatic variation on the production of winter-spring rice
in the North delta of Vietnam and the measure to cope with it. Vol 1. p 36-44. Hanoi – 1996 6. Nguyen Van Viet; The possible effect of agriculture on climate-Report on R.A.II working
group on agrometeorology 4-6 Sep. 1999. Tehran I.R of IRAN-49p 7. H.P. Da ; Strategies to be adopted in agriculture to cope with the impacts of climate change
and climate variability on agriculture. Report on R.A.II Working group on agrometeorology 4-6 Sep 1999, Tehran. I.R. of IRAN. 95p
Figure1. Trend and variation of annual average temperature (station Hanoi)
-1.0
-0.5
0.0
0.5
1.0
1.5
2.0
1961 1966 1971 1976 1981 1986 1991 1996
∆T

63
Figure 3. Trend and variation of annual average temperature (station Ho Chi Minh)
-0.6
-0.4
-0.2
0.0
0.2
0.4
0.6
0.8
1.0
1961 1966 1971 1976 1981 1986 1991 1996
∆T
Figure 2. Trend and variation of annual average temperature (station Da Nang)
-1.0
-0.5
0.0
0.5
1.0
1.5
1961 1966 1971 1976 1981 1986 1991 1996
∆T
64
Figure 4. Trend and variation of absolute minimumtemperature (station Hanoi)
-4.0
-3.0
-2.0
-1.0
0.0
1.0
2.0
3.0
4.0
5.0
1960 1965 1970 1975 1980 1985 1990 1995
∆T
Figure 5. Trend and variation of absolute minimum temperature (station Danang)
-5.0
-4.0
-3.0
-2.0
-1.0
0.0
1.0
2.0
3.0
1960 1965 1970 1975 1980 1985 1990 1995
∆T

65
F i g u r e 6 . T r e n d a n d v a r i a t i o n o f a b s o l u t e m i n i m u m t e m p e r a t u r e (s t a t i o n H o C h i M i n h )
- 4 .0
-3 .0
-2 .0
-1 .0
0 .0
1 .0
2 .0
3 .0
4 .0
1 9 6 0 1 9 6 5 1 9 7 0 1 9 7 5 1 9 8 0 1 9 8 5 1 9 9 0 1 9 9 5
∆T
Figure 7. Trend and variation of annual total rainfall (station Hanoi)
-800.0
-600.0
-400.0
-200.0
0.0
200.0
400.0
600.0
800.0
1000.0
1961 1966 1971 1976 1981 1986 1991 1996
∆T

66
Discussion by William Wigmore, Ministry of Agriculture, Rarotonga, Cook Islands
Background
The Cook Islands consist of 15 islands scattered over 2 million km2 of South Pacific Ocean, between 156 o – 167o West and 8o –23o South. The islands are split geographically in to the Northern Islands and the Southern Islands. Total land area is 237km2.
Features of Agriculture and Forestry in the Cook Islands
For the Cook Islands as a whole, agriculture contribute an estimated 5-6% (at average 1990 prices) of the country’s Gross Domestic Product (GDP) in 2000. There is very minimal contribution from Forestry. There are approximately 470 acres in total of cultivated conifer (caribbean pine) forest on a few islands in the Southern Cook Islands, and the rest are natural forest which are mainly used for construction of local artefacts, housing, and for medicinal purposes.
Root crops such as Colocasia, Cassava, and Sweet Potatoes are very important both for
human consumption and as animal feed. The more climate sensitive crops: Citrus, Papaya, and Vegetables are also important not only for cash income, but as well for daily consumption. Tropical cyclones pose the major risk to agriculture in the Cook Islands and can cause total destruction of crops especially fruit trees and vegetables and root crops to a lesser extent. Prolonged drought periods and heavy rainfall can also major reductions in crop production and agricultura l activities.
Systems of Agriculture in Cook Islands
Traditionally, mixed type agriculture was practised in the Cook Islands. These are often classified as mixed subsistence, mixed semi-subsistence, and agro-pastoral where the latter
Figure 8. Trend and variation of annual total rainfall (station Da Nang)
-800.0
-400.0
0.0
400.0
800.0
1200.0
1961 1966 1971 1976 1981 1986 1991 1996
∆T

67
involves the cultivation of a mixture of root/tuber, leafy, and fruit crops, medicinal plants including the raising of animals adjacent to the homestead.
However, monoculture practices have been introduced as a result of changes in social
wellbeing and economic significance of agricultural produce for export and local sales.
a. Agro pastoral or Subsistence System
The practice of raising plants and animals (pigs, chickens, and goats) is still very much practised in a majority of the islands in the Cooks. Fruit crops (coconuts, breadfruit, bananas, papaya), root crops (colocasia, cassava, sweet potatoes) and leafy vegetables are cultivated in close proximity to the household. This system is mainly to provide for the family and to some extend the community.
b. Intensive of Co mmercial System
Crops of high economic value such as citrus, papaya, morinda citrifolia, and vegetables are
cultivated intensively. As also discussed by Zhao, Y. et al. this system is also concentrated on lands with adequate water, high natural fertility, low to modest slope, and other factors conducive to high agricultural productivity such as low pest populations and disease incidences.
Impacts Of Climate Variability On Agriculture
The possible changes in climate parameters could affect some species/cultivars of crops more than others. Crops such as papaya, citrus, and vegetables, which are more climate sensitive, may be more affected by such factors as increase in temperature and rainfall.
Increase in sea level can dramatically affect the Northern Islands. These islands are low-
lying with the highest point only a few metres above sea level. They may experience greater flooding of the island by seawater and can cause major damage of agricultural production.
Conclusion
Tropical cyclones, prolonged drought periods, increased precipitation, and flooding of low-lying atoll islands most probably pose the greatest risk to agriculture and forestry in the Cook Islands as a result of climate change. These extreme events can cause major damage to agriculture and forestry, and may enhance the development and seriousness of certain plant pests (insects and disease) through the provision of favourable environments for their survival such as increased temperature and precipitation.

68
IMPACTS OF PRESENT AND FUTURE CLIMATE VARIABILITY ON AGRICULTURE AND FORESTRY IN THE TEMPERATE REGIONS: EUROPE
(G. Maracchi, O. Sirotenko, and M. Bindi)
Discussion by Andreja Susnik, Environmental Agency of the Republic of Slovenia,
Agrometeorology Department Slovenia
Vulnerability Assesment of Slovenian Agriculture to Climate Variability and Potential Impacts of Climate Change
Slovenia is in a spite of relatively small area (20.273 km2) climatologicaly very
heterogeneous. Its geographical position in 46°N is placed among mid -latitude’s countries. In a short distance of 300 km in the direction SW-NE three climatic belts are met: a sub-Mediterranean climate in the coastal region, a continental climate in the northeast and a severe climate in the mountainous regions and there is a strong interaction among them all over the Slovenian territory. The territory of Slovenia is characterized by 34% of arable land (field crops, grassland, orchards, vineyards and vegetable crops) and 60% of forest ecosystems. The climate is the primary determinant of these ecosystems, impacting e.g. soil water resources and agricultural and forestry productivity.
Due to its orographic and climatic features, Slovenia fall within the group of countries
vulnerable to climate change. Any modifications of climate due to the impact of climate variability and change will affect all economic sectors to some degree, but agricultural production is perhaps the most sensitive and vulnerable. Regarding Slovenian climate heterogeneity the prediction of climate change at regional level is very uncertain, although even without that is climate the most critical factor determining the sustainability of agricultural production in Slovenia.
The Slovenian First Country Study of expected impacts of climate change and vulnerability
assessment results indicate what we currently know of possible impact as a consequence of projected climate change. The study is partly based on the review of existing scientific and technical literature and the other results are obtained by impact analyses established on the scenarios of future climate change in Slovenia. The identified impacts should not be seen as predictions but, rather as indications of sensitivities and vulnerabilities associated with the projected change in climate.
Construction of climate change scenarios for an impact assessment in Slovenia was based
on GCM validity and selection. Incremental scenarios for temperature and precipitation changes in Slovenia are based on the combination of changes prescribed by various models and on trend analysis of several observed meteorological parameters and are as follows: for the year 2025 temperature increase is +1°C ± 0.5°C, with 0 ± 10 % change in precipitation amount. For the period of doubling of 2xCO2 tempera ture increase of +2,5°C ± 1.0°C, with 0 ± 10% change in precipitation amount is assumed. All global climate changes scenarios and studies predict warming for most of the territory of Slovenia. The temperature increase will be accompanied by the precipitation reduction, especially in the summer period. The expected changes in the total amount of precipitation and its frequency and intensity directly affect the timing and the intensity of droughts; however, at present, specific regional effects are more uncertain than temperature change impact. Although the annual amount of precipitation in Slovenia is relatively high in global climate change on the reduction of precipitation will together with the effects on increased evapotranspiration and soil moisture result in relatively large changes in water resources. In the last decade several agricultural droughts were recorded on the territory of Slovenia and most of scale there is a significant variation of the distribution pattern of precipitation in the growing season across space and time, especially in the regions with shallow, light soils. Impact of non-irrigated crops were damaged due to lack of water in the major part of agricultural areas. According to the present results of the analyses 15 % of total area of Slovenia suffers because of soil moisture deficit in the growing period. The predictions show that due to increased

69
evapotranspiration and water shortage potentially more Slovenian regions will be affected (e.g. central part of Slovenia and SE Slovenia). The severest situations is anticipated for NE and coastal part of Slovenia, which are already to any additional reduction in water supplies the most vulnerable regions. The conditions for agricultural cultivation my be worsening also by the probability of extreme weather events such as intense rainfall, runoff, floods, landslides and mudslides which affect agricultural land in mountains, hail and frosts, reduced yield by extreme temperature sensitive plants, change in the frequency and intensity of attacks by pests and diseases, changes of overwinter conditions (vernalisation). Besides negative also some expected positive effects of climate change can be predicted such as: prolonged growing season in some areas (several sowing, stubble crops), expansion of the range of agricultural cultivation at higher altitude regions, more appropriate temperature conditions for the cultivation of temperature -sensitive plants (increased grain production in the central Slovenia). It has been assessed that the expected negative impacts will be more pronounced that the positive ones.
IMPACTS OF PRESENT AND FUTURE CLIMATE VARIABILITY ON AGRICULTURE AND FORESTRY IN THE TEMPERATE REGIONS: NORTH AMERICA
(R. P. Motha and W. Baier)
Discussion by Rita Guerreiro, Portugal
Climate Variability In Mainland Portugal Impacts On Agriculture
A brief description of the climate in mainland Portugal and trends in the last decades is presented. A warming trend is verified since 1976. Since this year there is also a significant difference in precipitation trends between seasons, with a systematic reduction of spring precipitation all over the country. Climate data shows an increase in the frequency or intensity of extreme events: heavy precipitation events and severe and extreme droughts, particularly in the southern regions. Climate change scenarios for mainland Portugal project a significant warming in the 21 st century that leads to a faster phenological development of crops, an increase in water demand and a higher incidence of pests an d deseases. A projected decrease in spring precipitation will increase irrigation requirements and cause water stress in dryland crops. A lengthening of the forest fires season is expected. Adaptation strategies and mitigation measures are presented.
ASSESSING THE CONSEQUENCES OF CLIMATE CHANGE FOR FOOD AND
FOREST RESOURCES: VIEW FROM THE IPCC
(W. Easterling and M. Apps)
Discussion by Marina Pintar, Slovenia (WMO has abstract)
Climate Change: A Field Scale Study Vesna Zupanc1, Klemen Bergant2, Marina Pintar3, and Lucka Kajfež-Bogataj4
All global climate change scenarios and studies suggest warming for most of Slovenia. Our
study scenarios of future climate which were designed based on numerical model results of
1 M.Sc., Biotechnical faculty, Department for Agronomy, Center for agricultural land management and agrohydrology, Jamnikarjeva 101, 1000 Ljubljana, Slovenia 2 M.Sc., Biotechnical faculty, Department for Agronomy, Center for agrometeorology, Jamnikarjeva 101, 1000 Ljubljana, Slovenia 3 Asist. Prof., Biotechnical Faculty, Department of Agronomy, Center for agricultural land management and agrohydrology; Jamnikarjeva 101, 1000 Ljubljana, Slovenia 4 Prof., Biotechnical Faculty, Department of Agronomy, Center for agromet eorology; Jamnikarjeva 101, 1000 Ljubljana, Slovenia

70
general air circulation and climate parameter trend analysis in Slovenia. Anticipated air temperature raise by the year 2025 is +1ºC±0,5ºC, taking into the consideration 0±10% of change in annual precipitation amount suggests earlier start of vegetation period for one week in springtime and one week extension in fall. Comparing the present state and predictions, some conclusions for the possible impact of climate change on soil moisture deficit areas in Slovenia were made: the total area of potential water depletion areas will grow for about 100 % or even more in case when the increase of temperature would be 2ºC and reduction of precipitation 10% in summer.
Based on scenario study for Slovenia temperature and precipitation data were evaluated by
existing data analysis. Study area Savinja valley in eastern part of central Slovenia is flat, with homogenous land use, surrounded with hills. The area is agricultural area with very intensive hop production. For simulation of climate change impact on agricultural areas the study implemented the use computer models SWAP and GLEAMS. Set of the 1961 -1990 for Celje in estern part of central Slovenia was taken for baseline data. Annual average rainfall over the period considered is 1155 mm and ranged from 825 mm in 1968 to 1443 mm in 1962. Used were combinations of increased temperature and unchanged precipitation, unchanged temperature and decreased precipitation, and severe scenario with increased temperature and decreased precipitation. Temperature data set was modified by adding 1,5ºC. Daily precipitation values were modified by subtracting of 10% of daily precipitation value.
The greatest influence on the different response of climate scenarios to the computer
model simulation results had predicted rise of daily temperature. Results tell us that the precipitation occurred in bigger rainfall events – thus sufficiently filling the gaps of water storage capacity. The 10% decrease in precipitation had little or none influence on the water balance of the soil profile. It would suggest, however, that climate scenarios with the 10% decrease in precipitation would have a long term effect to the decreased level of groundwater. This assumption should be tested with model that enables simulation of the total hydrological circle.
The average irrigation demand in the 1961 – 1990 period was 238 mm per year, simulation
results with increased temperature and/or decreased precipitation showed increase of irrigation demand of 42 mm, 4mm and 51 mm per year. Increased temperature and/or decreased precipitation increased the number of days when irrigation was needed from average 0.3 days per year (decrease of precipitation) to 2.9 days per year (increased temperature and decreased precipitation).
Detailed analysis of influence of climate scenarios on actual and potential transpiration showed little change for studied years 1967, 1971 and 1983, it showed however that the increased temperatures with combination of decreased precipitation shift irrigation period forward. Results comparison of computer simulation of baseline data and severe scenario (T+1,5ºC, P – 10%) showed that the water depletion occurs sooner and therefore the irrigation period starts sooner.
Discussion by Doldorsuren Azzaya, Mongolia
Climate change impacts on pasture and animal husbandry in Mongolia
In this presentation shown the climate change in Mongolia, the temperature and precipitation change from 1940 to 2000. The annual temperature has changed by 1.56 degrees in Mongolia, in winter temperature is increased by 3.61, in summer decreased by -0.3. We have studied the Natural zones change and fodder resources. Using the models as the Century 4.0, EKZNJTZ, EKU1KJTZ we have estimated grassland change in 2040 and 2070 in Mongolia, grazing time and daily weight of sheep. The results show that grassland is increasing in 2040 and decreasing in 2070. The grazing time will decrease by 0.7-2.0 hours and the daily weight of sheep will decrease by 4-20 grams.

71
ACHIEVING ADEQUATE ADAPTATION IN AGRICULTURE
(I. Burton and B. Lim)
Discussion by Primož Banovec, University of Ljubljana, Slovenia
Development of registry of irrigation and drainage schemes in Slovenia
In Slovenia from the total of estimated 250.000 ha of arable land, on some 70.000 ha
drainage works were performed and some 10.000 ha were equipped with irrigation systems. The 10 years long transitional period has to large extent dismantled the complete organizational structure (vertical as well as horizontal) that was before 1991 in charge for the development and maintenance of those systems. Therefore majority of this infrastructure has remained unmanaged to the extent that in the year 2001 only little information remained on where are those systems located, not to mention that the maintenance and operation of those sch emes remained more or less ad -hoc in operation.
To overcome this situation the Ministry of Agriculture, Forestry and Food has launched a
project to develop a registry of all large irrigation and drainage schemes in Slovenia that will in future serve as an administrative registry enabling efficient management of those schemes.
In the discussion some key features of the established registry of the irrigation and
drainage schemes will be presented as well as some basic concepts that were developed. Initial aim to get an overview of existing schemes was achieved with the identification, data scoping and classification for about 620 schemes. The creation of the data warehouse is based on the data facts that exist on paper documents which were later on classified, and put into digital data warehouse that enables GIS features. This has led to the development of a data warehouse that functionally supports life -cycle management of the irrigation and drainage schemes, and will additional interfaces perform a function of the decision-support system (DSS).
The development of this DSS is custom-fit to the needs of different institutions involved in
management of the irrigation and drainage schemes as well as individual users of the schemes. The core use of the DSS fo r the ministry will soon be expanded to other users which will add to the data warehouse (i.e. appointed managers of the schemes, inspectorate services) and use the data (i.e. other sectors). It important feature is also that it is based on the external, maintained classifications which enables connectivy of feature types with other users and other infrastructure systems.
Efficient management of the existent irrigation and drainage schemes as well as new
development of feasible schemes is already supported with this DSS. Irrigation and drainage facilities are one of the key mechanisms for the agriculture to cope with changing climatic conditions in order to ensure marketable agricultural production in Slovenia.
Discussion by Tan Lee Seng, Agrometeorological Division, Malaysian Meteorological Service, Malaysia
Mr. Tan discussed the paper by asking whether there are positive effects to climate change/variability instead of just negative effects. He then went on to share how Malaysis intends to adapt to the potential climate change/variability.
Malaysian strategies for adaptation
• Develop plant varieties that are resilient to high temperatures and high water use efficiency. • Develop the means to maximize efficient usage of water and nutrient input.

72
• Preserve permanent forest reserves and water catchment areas to ensure adequate water
supply for agriculture. • Develop appropriate management practices for post-harvest handling to prevent spoilage
of agricultural produce. • Carry out research on the impact of environment on the physiology of animals so that the
animals can be more comfortable and, in turn, perform optimally, for instance, develop more effective designs of animal housing structures to ameliorate stress.
• Establish semi-controlled plant and anima l housing. • Implement microclimatic modification through landscaping and agro-forestry. • Formulate appropriate strategies in response to land use change, taking into account
socio-economic dimensions.
Discussion by Zornitsa Popova, Poushkarov Institute of Soil Science, Bulgaria
Case Study of Bulgaria
Vulnerabilities in maize and wheat agrosystems to climate variablitily were assessed over 30 years at the local level (Sofia region) by CERES models.
Model Test and Adaptation at Local Level
The procedure of stepwise calibration and validation, consisting of comparing models output to data observed in plots at two fields of constrastive soil conditions (Chromic Luvisol and Vertisol were used. The stepwise calibration procedure starting with physical transport of water in the soil, followed by crop evapotranspiration and growth and nitrogen contents improved the models prediction about soil disposal and biological response of the crops in the situations under study. Overall models performance evaluation was provided by graphical methods applied in all steps of the test. In addition, three -year lysimeter observations under vulnerable Chromic Luvisol enabled to justify in details the prediction capacity of the CERES-Maize model about water and nitrogen fluxes in and at the boundaries of the “soil-crop-climate” system. Simulation outputs (after calibration) about water and nitrogen uptake, drainage and nitrogen leaching, in addition to soil contents and dry weights, proved to be accurate enough over a comparatively long period (May 1, 1997 to October 1, 1999).
Tactical Ways to Reduce Vulnerability to Climate Variability Under Maize
These integrated strategies included maize fertilization and irrigation under limited water resources and environmental pressure. An adjusted CERES-maize model was used to evaluate the effect of different water and fertilizer application scenarios on the environment over a series of thirty independent growing seasons. One rainfed scenario and other three with varied irrigation application were considered. Water application in initial, development, and mid -season growthstages was triggered at any day that soil water content fell to 75% of field capacity (FC) with one irrigation scenario and 85% of FC with another one. The third drainage-controlling scenario was developed on the basis of 75% of the required irrigation depth by satisfying predominantly the most sensible phases of maize development. Each irrigation treatment was simulated with three different N-application scenario: on ewith a single fertilizer application (200 kg N/ha) in the spring; one with partial equal application at sowing and just before the period of maximum crop uptake and one with adjusted application (1/3 at sowing and 2/3 in the middle of development stage).
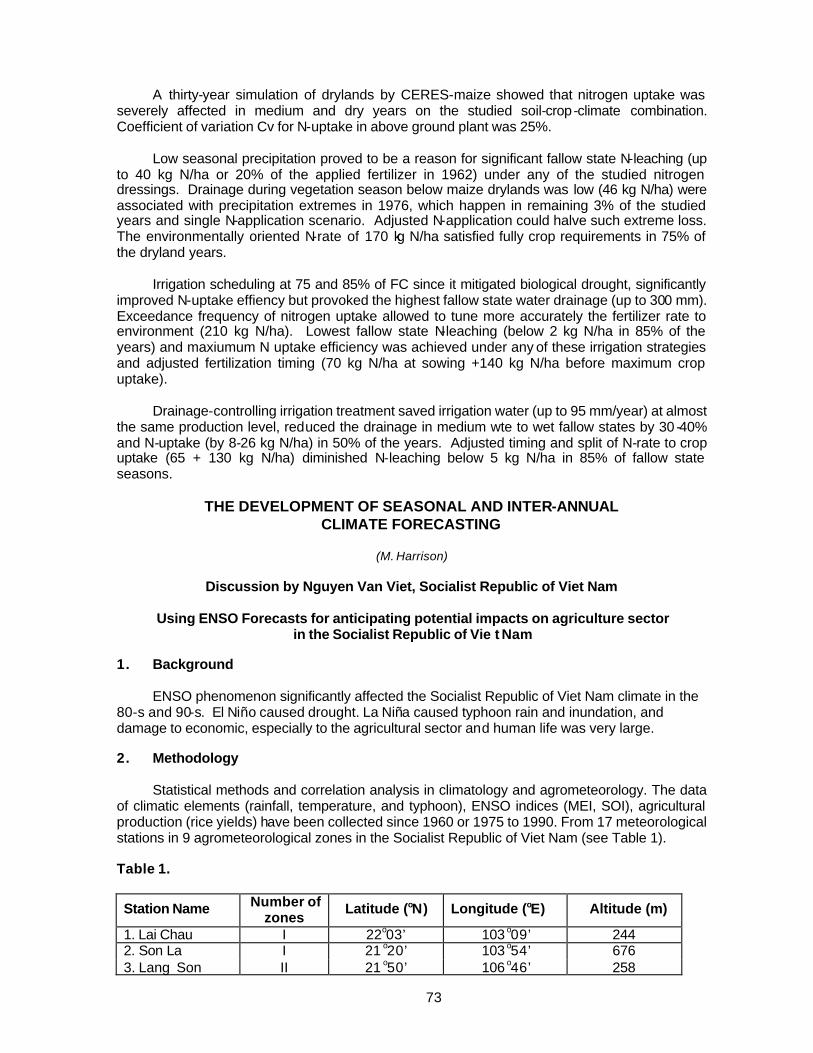
73
A thirty-year simulation of drylands by CERES-maize showed that nitrogen uptake was severely affected in medium and dry years on the studied soil-crop-climate combination. Coefficient of variation Cv for N-uptake in above ground plant was 25%. Low seasonal precipitation proved to be a reason for significant fallow state N-leaching (up to 40 kg N/ha or 20% of the applied fertilizer in 1962) under any of the studied nitrogen dressings. Drainage during vegetation season below maize drylands was low (46 kg N/ha) were associated with precipitation extremes in 1976, which happen in remaining 3% of the studied years and single N-application scenario. Adjusted N-application could halve such extreme loss. The environmentally oriented N-rate of 170 kg N/ha satisfied fully crop requirements in 75% of the dryland years. Irrigation scheduling at 75 and 85% of FC since it mitigated biological drought, significantly improved N-uptake effiency but provoked the highest fallow state water drainage (up to 300 mm). Exceedance frequency of nitrogen uptake allowed to tune more accurately the fertilizer rate to environment (210 kg N/ha). Lowest fallow state N-leaching (below 2 kg N/ha in 85% of the years) and maxiumum N uptake efficiency was achieved under any of these irrigation strategies and adjusted fertilization timing (70 kg N/ha at sowing +140 kg N/ha before maximum crop uptake). Drainage-controlling irrigation treatment saved irrigation water (up to 95 mm/year) at almost the same production level, reduced the drainage in medium wte to wet fallow states by 30 -40% and N-uptake (by 8-26 kg N/ha) in 50% of the years. Adjusted timing and split of N-rate to crop uptake (65 + 130 kg N/ha) diminished N-leaching below 5 kg N/ha in 85% of fallow state seasons.
THE DEVELOPMENT OF SEASONAL AND INTER-ANNUAL
CLIMATE FORECASTING
(M. Harrison)
Discussion by Nguyen Van Viet, Socialist Republic of Viet Nam
Using ENSO Forecasts for anticipating potential impacts on agriculture sector in the Socialist Republic of Vie t Nam
1. Background
ENSO phenomenon significantly affected the Socialist Republic of Viet Nam climate in the 80-s and 90-s. El Niño caused drought. La Niña caused typhoon rain and inundation, and damage to economic, especially to the agricultural sector and human life was very large. 2. Methodology
Statistical methods and correlation analysis in climatology and agrometeorology. The data of climatic elements (rainfall, temperature, and typhoon), ENSO indices (MEI, SOI), agricultural production (rice yields) have been collected since 1960 or 1975 to 1990. From 17 meteorological stations in 9 agrometeorological zones in the Socialist Republic of Viet Nam (see Table 1). Table 1.
Station Name Number of zones
Latitude (oN) Longitude (oE) Altitude (m)
1. Lai Chau I 22o03’ 103 o09’ 244 2. Son La I 21 o20’ 103 o54’ 676 3. Lang Son II 21 o50’ 106 o46’ 258

74
Station Name Number of zones Latitude (oN) Longitude (oE) Altitude (m)
4. Hon Gai II 20 o57’ 107 o04’ 87 5. Phu Ho III 21 o27’ 105 o14’ 36 6. Bac Giang III 21 o17’ 106 o12’ 7 7. Hanoi IV 21 o01’ 105 o51’ 5 8. Nam Dinh IV 20 o26’ 106 o10’ 3 9. Vinh V 18 o40’ 105 o40’ 6 10. Dong Ha V 16 o50’ 107 o05’ 4 11. Da Nang VI 16 o02’ 108 o11’ 6 12. Nha Trang VI 12 o15’ 109 o12’ 5 13. Playku VII 13 o59’ 108 o00’ 800 14. Banmethuot VII 12 o41’ 108 o03’ 490 15. HoChiMinh VIII 10 o49’ 106 o40’ 9 16. Can Tho IX 10 o02’ 105 o47’ 3 17. Bac Lieu IX 9 o17’ 105 o43’ 1
Impact of ENSO on Climate of the Socialist Republic of Viet Nam Impact of ENSO on temperature - The variation of monthly temperature with ENSO years are much stronger than in non
ENSO years - The variation temperature in winter season much stronger than summer season, - For the country as a whole El Niño year are warmer than normal; - In La Niña years the Northern part of the Socialist Republic of Viet Nam is cooler than
normal, the southern part is warmer than normal. Impact of ENSO on Rainfall - The variation of rainfall in ENSO years are much stronger than in non ENSO year - The annual, seasonal rainfall vary most strongly in the north central region, especially for
the seasonal rainfall - In El Niño years in North Central region the summer rainfall decreases seriously. This
region is under high of droughts in summer season of El Niño years and in winter season of La Niña years
- The South central region is under of risk of droughts in El Niño years and under a risk of
flood in La niña years
Table 3.1 Departure of rainfall
Station Dong Ha Station Nha Trang Scenario
Annual V-X XI-IV Annual V-X XI-IV
General years -21.6 -12.5 -9.1 38.2 16.1 22.1 El Niño years 167.5 -90.0 257.5 -317.1 -80.8 -236.3 La Niña years -203.9 115.1 -319.0 370.3 45.6 324.7

75
Impact of ENSO on dates of beginning and ending of temperature and rainfall seasons - One of the important parameters for studying of changing rice-cropping pattern is dates of
beginning and ending of temperatures pass 20 and 25OC. - When temperature is lower 20OC it's cold on winter season. Duration of this season from
October to March about 90-215 days. In El Niño years duration of winter is shorter than normal about 4 -18 days, in La Niña year it's longer than normal about 5 -16 days.
- When the temperature more than 25OC it is hot season, it usual beginning in April and
ending in middle of September or October Duration of hot season about 140 -185 days except Southern Viet Nam. In El Niño year duration of hot season longer than normal, its duration is bout 149-309 days. In La Niña years duration of hot season is shorter than normal and shorter than El Niño year too.
For calculating, the dates of beginning and ending of rainfall season we have used FAO
method. Result of calculating of this can see in Table 3.2 and 3.3
- In the El Niño year, the dates of beginning rainfall season is lattes than normal and ending is later than normal
- In La Niña years the dates of beginning are early than normal and the dates of ending are
later than normal. (see Table 3.4)
Table 3.2 Dates of beginning and the ending of temperature ≤ 20 0 C in scenarios
General El Niño La Niña Categories
Begin. End. Duration (days)
Begin. End. Duration (days)
Begin. End. Duration (days)
1. LaiChau
Average 15/XI 3/III 108 15/XI 2/III 107 18/XI 1/III 103 Latest 26/XII 12/III 23/XI 9/III 29/XI 6/III Soonest 1/X 25/II 9/XI 28/II 10/XI 25/III
2. PhuHo
Average 10/XI 14/III 124 24/XI 12/III 108 29/XI 13/III 104 Latest 30/XII 5/IV 29/XII 27/III 24/XII 1/IV Soonest 1/I 13/II 2/XI 15/II 7/XI 12/II

76
Table 3.3 The date of beginning and in the ending of temperature ≥ 25OC in scenarios
General El Niño La Niña Station
Begin. End. Duration (days) Beg in. End. Duration
(days) Begin. End. Duration (days)
1.LaiChau Average 29/IV 16/IX 140 26/IV 22/IX 149 28/IV 22/IX 147 Latest 17/VI 31/X 12/V 27/X 9/V 28/ X Soonest 9/IV 16/VI 13/IV 2/IX 13/IV 17/VIII
3.BacGiang Average 26/IV 18/X 175 26/IV 18/X 175 25/IV 20/X 178 Latest 7/V 31/X 5/V 27/X 1/V 31/ X Soonest 12/IV 1/IX 15/IV 10/X 17/IV 9/X
4. HaNoi Average 23/IV 18/X 178 24/IV 18/X 177 20/IV 18/X 181 Latest 4/V 29/X 3/V 29/IX 30/IV 30/ X Soonest 8/IV 4/IX 14/IV 7/X 8/IV 4/X Table 3.4 The probability of the accumulating rainfall before and after the rainfall season with guarantee 80%
Tr¹m Accumulating before rainfall season Accumulating after rainfall season
75mm 200mm 500mm 300mm 100mm G E L G E L G E L G E L G E L
LaiChau 23/IV 23/IV 20/IV 24/V 23/V 19/V 5/VIII 9/VIII 6/VIII 27/VIII 10/IX 23/VIII 10/X 10/X 16/X HaNoi 25/IV 28/IV 27/IV 2/VI 4/VI 2/VI 28/VIII 21/VIII 27/VIII 14/IX 10/IX 17/IX 16/IX 22/X 21/X
BacGiang 1/V 28/IV 28/IV 7/VI 9/VI 9/VI 10/VIII 12/VIII 12/VIII 1/IX 5/IX 26/VIII 29/IX 1/X 22/IX DongHa 23/IV 23/IV 2/V 15/VI 15/VI 12/VI 24/X 30/X 28/X 2/XI 5/XI 3/XI 25/XI 1/XII 22/XI
B.MaThuat 27/IV 30/IV 28/V 18/VI 19/VI 23/VI 22/VIII 3/VIII 10/IX 8/IX 20/VIII 25/IX 9/X 26/IX 15/X
The impact of ENSO on trop ical cyclone
- Annual average tropical cyclone in the Socialist Republic of Viet Nam are 5.9 - In El Niño years annual average are 5.3 tropical cyclone - In La Niña years annual average are 8.3 tropical cyclone
Impact of ENSO to Rice Production
Assessment of ENSO impact to rice yield in Vietnam
In order to assess the impact of ENSO to rice yield in different economic- agricultural regions were undertaken analysis data series of rice yield of winter- spring and summer crop seasons, as well as calculate rice yield differences of winter- spring and summer crop seasons between the year and last years based on yield data from 1976 up to 1998 followed El Niño and La Niña scenarios.
- In El Niño years all most agroecological zone winter spring rice decreased. The biggest
decrease is in northern midland and in South delta (-1.53and -1.47 quitter/ha) except in Southern central zone, winter spring rice yields are increase about 1 quitter/ha. (Table 4.1). In summer rice yields the picture is other, all most agricultural regions the summer rice yields are increased (Table 4.2)

77
- In La Niña years winter - spring rice yields as summer rice yields almost agricultural
zones are increased except in the Northern central zone summer rice yield is decreased about -0.68 quitter/ha
Table 4.1 Difference of winter - spring rice yield between this year with the year
before (in El Niño years)
Winter - Spring crop
Northern mountain
Northern midland
Northern delta
Northern Central coastal
Southern Central coastal
Eastern Southern Central coastal
Southern delta
1976-1977 -1.62 -5.61 -9.00 -4.65 -4.31 -3.33 -3.24 1977-1978 +0.47 +1.77 +2.50 +1.66 +3.33 -3.94 -5.44 1979-1980 +0.72 +1.61 -3.15 -1.01 -3.12 -3.82 -2.96 1982-1983 +4.40 +4.80 +3.10 +2.30 +0.46 +2.55 +3.55 1986-1987 -4.40 -7.60 -8.00 -7.80 +3.30 -0.90 +1.90 1987-1988 +4.70 +11.9 +17.9 +5.10 +4.60 -1.40 -1.10 1990-1991 -13.7 -18.9 -18.1 -4.30 +0.80 +0.80 -0.50 1992-1993 +2.60 +0.60 +6.70 +1.50 -4.10 +1.20 -7.60 1994-1995 -0.10 -0.10 -2.80 +4.70 +11.0 +2.40 +1.00 1997-1998 -1.40 -3.80 -1.00 +1.70 -2.1 -3.40 -0.30
Total -8.33 -15.33 -11.85 -2.50 +9.86 -9.84 -14.69
Average -0.83 -1.53 -1.19 -0.28 +0.99 -0.98 -1.47
Table 4.2. Difference of summer rice yield between this year with the year before (in El Niño years)
Summer crop
Northern mountain
Northern midland
Northern delta
Northern Central coastal
Southern Central coastal
Eastern Southern Central coastal
Southern delta
1976 +0.35 +0.06 +1.27 -2.15 1977 -0.35 -1.53 -1.67 +1.24 -1.43 -0.13 -2.89 1979 -0.61 -0.55 +4.28 +6.82 -3.28 -9.72 +5.51 1982 +2.67 +3.70 +4.32 +1.39 +4.44 +2.08 +3.80 1986 -0.20 +6.10 +5.10 +0.30 -1.60 +0.80 +0.00 1987 +1.30 +4.00 +7.70 +3.80 +0.50 -0.90 -2.20 1991 +3.70 +4.80 +7.50 +2.60 +2.5 +1.30 +1.20 1993 +4.00 +2.60 +6.90 +6.40 -3.30 +5.10 +0.60 1994 -1.80 -3.70 -15.7 -2.00 +3.00 -0.40 +3.50 1997 +5.50 +1.20 +3.30 +8.60 -2.80 +8.10 -4.10 Total +14.56 +16.68 +23.00 +27.0 -1.97 +6.23 +5.42
Average +1.46 +1.67 +2.30 +2.70 -0.22 +0.69 +0.60

78
Table 4.3. Difference of winter - spring rice yield between this year with the year before (in La Niña year)
Winter - Spring Northern mountain
Northern midland
Northern delta
Northern Central coastal
Southern Central coastal
Eastern Southern
Central coastal
Southern delta
9/1974-4/1976
1974-1975 1975-1976 +2.25 -2.39 +8.53 -3.50 1984-1985 +3.10 +5.80 +4.70 -3.50 +2.80 +0.90 -1.30 1988-1989 +2.90 -0.50 -1.90 +1.60 -7.30 +4.80 +3.40 1995-1996 +5.70 +5.50 +9.20 +2.20 +4.40 +4.10 +0.30 1998-1999 +3.00 +2.80 +1.60 +3.60 +3.40 +4.50 -0.20
Total +16.95 +11.21 +22.13 +0.40 +3.30 +14.30 +2.20 Average +3.39 +2.24 +4.43 +0.08 +0.83 +3.58 +0.55
Table 4.4. Difference of summer rice yield between this year with the year before (in La Niña years)
Summer crop season
Northern mounta in
Northern midland
Northern delta
Northern Central coastal
Southern Central coastal
Eastern Southern Central coastal
Southern delta
1984 +0.20 +0.40 -1.00 +2.00 -0.14 -0.70 +0.28 1988 -1.60 -4.90 -7.80 -6.60 -4.40 +1.20 +3.70 1995 +1.20 +3.70 +11.0 +1.60 -2.70 +1.30 -3.30 1998 +1.70 +7.30 +6.20 +0.30 +15.1 +8.10 +23.8 Total +1.50 +6.50 +8.40 -2.70 +7.86 +9.90 +24.48
Average +0.38 +1.63 +2.10 -0.68 +1.97 +2.48 +6.12 Relationship between MEI, SOI with rice production On base of analysis concerning relationship between rice yields (winter spring rice and summer rice) with MEI, SOI at difference regions from the North to South of Viet Nam would be concluded as following: - Rice yields have very good relationship with MEI, SOI - MEI and SOI would be used as criteria for yield forecasting in the Socialist Republic of
Viet Nam, especially in years with ENSO, - In general, rice yield has more close relation with MEI than SOI,
Using of ENSO Forecasts ror Agriculture in the Socialits Republic of Viet Nam
The change crop calendar in winter - spring rice In El Niño years
The crop season in winter - spring rice in years with EL Niño for whole country are determined in Table 5.1 as following:
In those years some necessary measures in rice production are: - Having good irrigation system, especially in Central coastal and Southern delta
regions,

79
- Having keeping measures young seedling from old and setting flowering in period from late of April to early May in the Northern regions,
- Keeping informed MEI and SOI in order to consider behavior of temperature in this
season, as well as using those indexes in monitoring yield and gross output of rice, - Should use drought tolerant and thermophilic varieties of rice,
Table 5.1 winter - spring rice crop season in years with El Niño
Region Group of variety (growing duration, days)
Sowing date Flowering Date of
maturity LaiChau 160 days 25/XII 6/V 5/VI PhuHo 160 days 20/XII 2/V 3/VI
BacGiang 160 days 19/XII 1/V 2/VI HaNoi 160 days 18/XII 30/IV 30/V Vinh 160 days 17/XII 29/IV 18/V
DongHa 150 days 12/XII 17/IV 17/V NhaTrang 135 days 5/XI 28/II 25/III CanTho 110 days 21/XII 10/III 10/IV BacLieu 110 days 25/XII 15/III 15/IV
In La Niña years
The crop seasons in winter - spring rice in years with La Niña for whole country are determined in table 5.2 as following:
Table 5.2. Winter - spring rice crop season in years with La Niña
Region Sowing date Flowering Date of maturity Lai Chau 5/ XII 6/V 4/VI Phu Ho 10/ XII 30/IV 26/V Bac Giang 9/ XII 29/ IV 27/V Ha Noi 11/ XII 28/ IV 26/V Vinh 20/XII 28/ IV 24/V
For the Southern - central coastal, Eastern - Southern regions and other provinces of
the Southern delta crop season of rice are similar in the years with El Niño and La Niña, In years with La Niña in th e North provinces should pay attention to: - Having measure for preventing chilling for seedlings, - Using late maturity and chilling tolerant varieties, - Having priority to early and leading crops in designing rice cropping pattern in delta
regions, - In the Eastern - Northern mountain regions should use early varieties sowing in the
late of February, - Setting rice flowering in optimum crops as shown in Table 5.2, Summer rice crop season
The summer rice crop season for whole country are determined in Tables 5.3 and 5.4 as following:

80
Table 5.3. Crop season for early summer rice (summer - autumn) in Central coastal provinces avoiding climatic disaster (typhoon and floods)
Regions Varieties (growing duration, days)
Sowing date
Flowering date
Maturity date
Dong Hoi 115-120 25/IV 31/VII 24/VIII Dong Ha 115-120 23/IV 28/VII 21/VIII Da Nang 100-110 20/IV 10/VII 5/VIII Nha Trang 100-110 5/IV 20/VI 10/VII
Table 5.4. Crop season for summer rice in the northern provinces (from Ha_Tinh province to the North) followed ENSO scenarios
Regions Scenarios Sowing date Flowering date Maturity date El Niño 28/V 13/IX 13/X Lai Chau La Niña 24/V 9/IX 9/X El Niño 17/V 30/VIII 27/IX Lang S¬n La Niña 20/V 2/IX 30/IX El Niño 2/VI 18/IX 17/X Phu Ho La Niña 4/VI 20/IX 19/X El Niño 11/VI 16/IX 14/X Bac Giang La Niña 12/VI 17/IX 15/X El Niño 8/VI 23/IX 21/X Ha Noi La Niña 6/VI 21/IX 19/X El Niño 1/VI 17/IX 16/X Vinh La Niña 4/VI 20/IX 19/X
The summer crop seasons based on rainfall for high-drained land are presented in Table 5.5.
Table 5.5. Crop seeding of summer rice in rain feed land
Region Varieties (Growing
duration, days) Scenarios Sowing
date Flowering
date Maturing
date
El Niño 23/V 25/VIII 23/IX Western - Northern
110-120 La Niña 19/V 21/VIII 19/IX El Niño 28/V 28/VIII 28/IX Eastern -
Northern 110-120 La Niña 30/V 30/VIII 30/IX
Northern Midland El Niño 9/VI 10/IX 9/X Bacgiang La Niña 9/VI 10/IX 9/X El Niño 2/VI 4/IX 2/X Phutho
110-120
La Niña 4/VI 6/IX 4/X North Central
El Niño 9/VI 31/VIII 29/IX Vinh La Niña 2/VI 24/VIII 22/IX El Niño 15/VI 10/IX 7/X DongHa
100-110
La Niña 12/VI 6/IX 3/X El Niño 4/VIII 18/X 14/XI South Central
(NhaTrang) 100-110 La Niña 8/VIII 22/X 18/XI El Niño 22/VI 12/IX 10/X Mekong Delta
(Can Tho) 100-110 La Niña 25/VI 15/IX 13/X El Niño 19/VI 9/IX 7/X Central highland
TayNguyen 100-110
La Niña 23/VI 13/IX 11/X

81
The change crops rotation pattern for every region - At the North region (delta and midland) Winter - spring rice + summer rice + winter dry-land crops - At the Northern - Central coastal region: Winter - spring rice + summer - autumn rice + autumn - winter dry-land crops - At the Southern - Central coastal region:
Winter - spring rice + spring - summer rice + summer - autumn rice (or winter dry-land crops)
- At the Southern delta region: -Winter - spring rice + Spring - summer rice + Summer - autumn rice, or -Winter - spring rice + Spring - summer dry- land crops + Summer - autumn rice
Use technical measures preventing ENSO impact
As analyzed above, the impact of ENSO are not similar in different regions. So it need not the same preventing strategies and tactics. For years with El Niño
The winter - spring crop season in the Northern regions usually are warm and with drought so it is need to keep water to combat drought for winter - spring rice in the late period of the season and early summer rice,
In the regions, where water supply is difficult, dry land - food crops as maize, sweet potato, soybean, groundnut, etc. should be cultivated in order to conserve cultivation area.
In the Central coastal and the Southern delta regions the preventing drought for rice and dry-land food crops is need, especially preventing typhoon, floods and water logging in the Central coastal regions.
For years with La Niña
In the winter - spring crop season the weather is colder than usually. So it is need preventing seedling and young rice from chilling injury. In the summer crop season it is necessary to prevent typhoon, flood and water logging in whole country, especially in the Central coastal regions.
In addition should be used MEI and SOI in winter - spring months for early warning
thermal and rainy regions in the next summer crop season in order preparation measures to cope with it. Should be used new and short - day rice varieties in appropriate crop seasons. Should be changed cropping pattern in lowland regions as well as combined fish farming, duck - farming in rice field. Should use MEI, SOI in agrometeorological monitoring as well as early crop warning and forecasting serving agricultural production and national food security. CONCLUSIONS AND RECOMMENDATIONS
From the primary research results on impacts of ENSO to climate and agricultural production in 9 agro - ecological regions of the Socialist Republic of Viet Nam may be concluded and given some recommendations as following:

82
CONCLUSIONS - There is variation and disturbance of climate in years with ENSO (either EL Niño or La
Niña). The most varied climatic elements are temperature, rainfall, sunshine duration and typhoon.
- The impact of ENSO is not similar in different ecological regions. - In the years with El Niño number of typhoons and tropical cyclones landed to the
Socialist Republic of Viet Nam are less than normal. But in those yeas intensity of typhoons and floods are very strong and vulnerable area also very large.
- In the years with La Niña in the Central coastal region (The Northern - Central and
Southern - Central coastal regions) number of typhoons and floods are more th an normal.
- The disturbance of climate elements in years with ENSO is more magnitudinous than
in years with non- - ENSO. The variation of rainfall is greater than temperature. The relation between climatic elements and MEI higher than SOI. Among them the relation between temperature and MEI higher than rainfall and MEI. In this years the variation of annual rainfall total are strongest in the Northern - Central, Southern - Central coastal and TayNguyen highland regions.
- There is impact of ENSO to agricu ltural production, yield and gross output of rice in 9
agro -ecological regions of the Socialist Republic of Viet Nam. - Agroclimatic elements are considered are annual absolute minimum temperature,
number of days with temperature < 20 0 C, days of beginning and ending rainy as well as thermal seasons, frequencies of drought, waterlogging.
- It is found that:
+ Impact of ENSO to agricultural production as well as to crop yield, gross and cultivated area in the Socialist Republic of Viet Nam is evident.
+ At present and in near future should be used MEI and SOI in early
agrometeorological monitoring and forecasting crop yield, especially rice, for conserving national food security in the Socialist Republic of Viet Nam.
- Primary research results on impact assessments of ENSO show that it is necessary to
establish various and appropriate strategies and tactics in agricultural production for every agro-ecological regions.
RECOMMENDATIONS In order to establish above mentioned strategies and tactics, as well as to improve the application of those results in agricultural production practices should be continued research project on extreme climate event, disaster and agroclimatology concerning of ENSO impacts and measures to cope with them for 9 agro-ecological regions in the Socialist Republic of Viet Nam. Enhance capability agrometeorological application from climate and ENSO forecasts and information for end users and farmers in the Socialist Republic of Viet Nam and South East Asia region. Especially we have to study:
- Impact of ENSO on climate, disaster to Agricultural production and food security in South East Asian and strategies and tactics to cope with them.

83
- Strengening disaster management and agrometeorological monitoring and advisory for agriculture on South East Asia and South Central zone of the Socialist Republic of Viet Nam.
- Establishment of the communication network for national climate, agroclimate and
ENSO forecast from the central level down to the provincial and then district levels for some main agro-ecological zones and receiving the feedback requests for end users (see Figure 1)
AGROMETEOROLOGICAL INFORMATION NETWORK FOR USING OF CLIMATE AND ENSO FORECAST
District Level and End-user
Provincial Agricultural Extension Department Provincial Hydrometeorological Forecast Centre
Climatic and Disaster
Information in the Past
Times and Real Times
International Meteorological D ata
Climatic Outlook and ENSO Forecast from IRI, NOAA...
Regional Centre
In Country Meteorological Data
National Centre Forecast (NCHMS) National Disaster Management
Agrometeorological Research Centre
Agrometeorological Advisory for Changing Cropping Patern and Prediction Crop Yields
Agricultural
and Agroclimatic
Data and Information
Agricultural and Forestry Extension Department of Ministry ARD

84
SEASONAL AND INTER-ANNUAL CLIMATE FORECASTING:
THE NEW TOOL FOR INCREASING PREPAREDNESS TO CLIMATE VARIABILITY AND CHANGE IN AGRICULTURAL PLANNING AND OPERATIONS
(H. Meinke and R. Stone)
Discussion by Alan Porteous, Agricultural climatologist,
National Instititute of Water and Atmospheric Research Ltd (NIWA) Wellington, New Zealand
The importance of contextualised climate related information, raised in this paper, is
strongly supported in the New Zealand experience. As in Australia, the New Zealand horticultural industry has for many years used contextualized climate information. Traditionally this has been for strategic planning and risk analysis as part of assessing land use options, while now this information is increasingly used for tactical decision making, from spray forecasting to seasonal crop management.
In the livestock sector, New Zealand farmers have become much more innovative and
adaptable in the last decade, motivated by:
• Maxising the climate resource • Economic imperatives (often dominated offshore) • Reducing climate related risk, e.g. facial eczema, pasture pests • Traditional drive for innovation and excellence • Search for niche climates – high value crops • Environmental concerns (resource management processes)
These developments, resulting in diversification, large financial investments, property
amalgamations, and movement of operations often from one part of the country to another, have lead to heightened demand for climate information. However there is still a low expectation for value stemming from seasonal forecasting. Much more credibility is held for climate factor risk analysis, and related information such as climate hazard studies.
New Zealand climate is maritime and notoriously hard to predict on the seasonal time
scale. So far seasonal forecasting has achieved only modest success. However, when seasonal outlook information is placed in context, much more value is
derived. Successful (gauged by relative interest and demand) provision of seasonal forecasts is generally encompassed within data the shows how seasons are developing to date, compared to last year and to the historical average, and couched in scenarios of future developments (‘if, then, otherwise”), including climate variability on different time scales. This includes farmers and horticultural growers in the ‘thinking’ process, and allows them to agree with, disagree with, or further develop the information, based on their increasing knowledge and experience. The process must be highly interactive.
Farmers also rely on information being interpreted by regionally based, specialist advisors,
who are in touch with day-to-day developments at regional level. Few farmers pay for seasonal forecasts directly, and rely on agencies like NIWA, and regional authorities, to provide services. Some specialist producers, such as wheat growers, do pay for direct services, such as production forecasts.
85
CLIMATE, COMMUNICATIONS AND INNOVATIVE TECHNOLOGIES: POTENTIAL IMPACTS AND SUSTAINABILITY OF NEW RADIO AND INTERNET
LINKAGES IN RURAL AFRICAN COMMUNITIES
(M.S. Boulahya, M.S. Cerda, M. Pratt, and K. Sponberg)
Discussion by Djibrilla Maiga, National Directorate of Meteorology, Mali
Introduction
Food availability in the Sahel depends to a large extent on agricultural production, which is itself subject to considerable climatic variability, in particular to variable and random rainfall during the growing season. The socio-economic consequences of this are enormous, this constituting a major risk to the socio-economic development and the food security of our countries.
Consequently, any strategy to adapt or mitigate this climatic risk should take account of
agro- and hydrometeorological information in agricultural planning and production.
With this in mind, an experiment aiming to assist the rural world (crop-growers, livestock-farmers, fishermen and rural women) was developed at the beginning of the 1980s to enable it to face up to climatic hazards.
Agrometeorological assistance in Mali
This is based on the effective involvement of farmer organizations, rural advice structures and those NGOs responsible for transferring the technological package, including agrometeorological information to farmers.
A multidisciplinary agrometeorological working group (MGWG), composed of
representatives from public services, food security projects/programmes and non-governmental organizations, meets every ten days from May to October to draw up notices and advice for farmers and authorities.
This operational assistance has two main aims: • To contribute to food security: data are collected and processed every ten days during
overwintering, agro - and hydrometeorological information is processed by the MGWG and disseminated to the authorities responsible for food security in order to enable them to make timely decisions;
• To contribute to increasing production and productivity for which notices and advice are
given to the rural world, including women, in order to enable them to plan and carry out their daily activities.
Production and dissemination of agrometeorological information
The products developed mainly concern: the provisional calendar, notices and agrometeorological advice for the rural world enabling the optimum sowing dates to be determined from the onset of the wet season and enabling crop operations to be correctly carried out; daily weather forecasts for the general public and the rural world enabling daily activities to be carried out such as the use of pesticides and fertilizers in the rural environment; experimental seasonal forecasts for weather service professionals, enabling them to plan agricultural activities and adapt agrometeorological notices and advice; the agro- and hydrometeorological information bulletin for the government and those authorities responsible for food security enabling the evolution and prospects of the crop year to be monitored.

86
All meteorological and agrometeorological products and information are regularly disseminated in French and in the national languages via radio and on the television and more and more often via local, private radio stations.
The agro - and hydrometeorological ten-day information bulletin and daily meteorological
forecasts are disseminated in the daily newspaper "l'Essor" and other local newspapers, while the 10-day bulletin is distributed by post and by the internet to different users.
The dissemination and effective use of all this information has enabled a 25-30% increase
in yield to be observed for dry cereals (timothy, sorghum and maize) and 23% for cotton since 1982. This contributes to the increase in revenue for rural and urban women thanks to the use of this information in drying food, dying and other such activities.
USING TRADITIONAL METHODS AND INDIGENOUS TECHNOLOGIES
FOR COPING WITH CLIMATE VARIABILITY
(C. Stigter, Z. Dawei, M. Xurong, and L. Onyewoto)
Discussion by H. P. Das, Agricultural Meteorology Division India Meteorological Department, Pune, India
Potential of Water Harvesting in Semi-Arid And Arid Zones by Traditional Methods
with Particular Reference to India
Potential Advantageous of Rain Water Harvesting
Water availability in arid and semi-arid zones throughout the world remains very often uncertain due to the large variability of rainfall in those regions. Harvesting rainwater can provide water for these regions where other sources are too distant or too costly, or whe re wells are not practical because of unfavourable geology or excessive drilling costs. The livestock-carrying capacity of many arid rangelands is limited more by a lack of drinking water than by lack of feed and water harvesting can play a major role in this regard.
History of Water Harvesting
The first water-harvesting facility was in all likelihood nothing more than a depression in a rock surface that trapped rainwater. The collected water served as a drinking water supply for man and animals. These water depression storages are still found in many parts of the world and serve as a drinking water supply for many forms of wildlife. It is highly probable that the first constructed water-harvesting facility was simply an excavated pit or other water storage container placed at the outfall of a rocky ledge to catch runoff water during a rainstorm. The next evolutionary step might have been to construct a rock diversion wall or gutter to provide a larger collection area. Researchers have found signs of early water harvesting structures believed to have been constructed over 9000 years ago in the Edom mountains in southern Jordan. There is evidence in Iraq that simple forms of water harvesting were practiced in the Ur area in 4500 BC. along desert roads. From the Arabian Gulf to Mecca, there still exist water-harvesting systems that were constructed to supply water for trade caravans (Noohi, 1999).
One of the earliest documented complete runoff farming installation is located in the Negev
desert of Israel. These installations, believed to have been built about 4000 years ago, were described and partially reconstructed by Evanari et al.(1982). The runoff area for these systems were upland hillsides which were cleared of vegetation and the soil smoothed to increase precipitation run-off. Contour ditches conveyed the collected water for irrigating low-lying fields. These systems provided an irrigated agriculture to an area that today has an average annual precipitation of approximately 100 mm. There is evidence that similar systems were used 500 years ago by the native Americans in the Southwestern region of the U.S.A. Evidence of other

87
ancient water-harvesting systems have been uncovered in Northern Africa. There is an uncertainty as to why most of these systems were abandoned. May be the conveyance systems became clogged with slit or possibly the soils in the crop growing areas became infertile due to increased salinity. Others have speculated that some form of political instability or may be a climate change in the areas forced the abandonment of the systems.
Potential of water harvest in India by traditional methods
One of the primary factors affecting water availability is the variability of rainfall in the semi-
arid and arid zones of India. Thus our recent problems on water scarcity in arid/semi-arid areas make it necessary to appreciate the potential of rainwater harvesting. On a national scale, with the current population, if we assume that the average requirement per person is 100 litres per day and the average rainfall across the country is about 1,100 mm, the annual demand will be 34,675 billion litres. Each hectare can yield about 11 million litres of rainwater and, therefore, if we harvested only 3.15 million hectares which is about one percent of India’s land area, all household needs can be met.
As early as the third millennium BC, farming communities in Baluchistan (now part of
Pakistan) impounded rainwater and used it for irrigation. Dams built of stone rubble have been found in Baluchistan and Kutch. Dholavira, a major site of the Indus Valley civilisation had several reservoirs to collect monsoon run-off and also excellent drainage systems.
Some of the answers to the water crisis in arid and semi-arid areas may lie in the lack of
reliance on our own traditions by our communities. Indians, over centuries, developed a range of techniques to harvest every possible form of water, from rainwater, stream and river water as well as floodwater. They have tapped water from hill streams of springs known as kuhls carrying a discharge of 15-100 litres per second. In Meghalaya, a state of India, a 200 year-old system of tapping stream and spring water for irrigating plants by using bamboos still exists.
Credit must go to the people of the villages of Rajasthan and Gujarat, states of India, where
old water systems still exist and where the traditional system was maintained even after the advent of piped water. Villages that neglected their traditional systems and relied solely on piped water sources faced scarcity under drought conditions. An ironic contrast of water management is that between Jaisalmer in Rajasthan and Cherrapunji in Meghalaya which get 100 mm and 15,000 mm of rainfall respectively; Jaisalmer had enough water for itself until recent years, while Cherrapunji, the wettest place on earth faces a drinking water shortage. Alwar district, also in the state of Rajasthan, has been successful in harvesting water thereby bringing prosperity to its villages.
Shallow wells are a very common way of using groundwater. In India a common design is
a stone-lined circular well up to 10 or 15 metres in diameter and similar depth or rectangular wells of similar capacity. This large capacity is required because both the clay soil and the underlying rock have a low hydraulic conductivity. The well is emptied each day by domestic use, stock watering and small-scale irrigation and is replenished overnight. This traditional method has been successfully operated for centuries when the water was lifted by hand or ox-power, but in some districts the widespread introduction of the first diesel-engined pumps and more recently electric motors has meant that the water can be removed much more quickly.
Future challenge and needs
(i) Extension of the concept of water harvesting and conserving – even in micro scale should
be considered as the first step and aim in planning programme. This can be achieved only by transferring the useful results of rainwater harvesting operations to the people of rural areas close to the deserts and arid regions.

88
(ii) Developing traditional systems of collecting rainwater as efficient tools that have simple technology, should be encouraged. Farmers and rural people should be involved in all stages of planning and execution of water harvesting projects.
(iii) With respect to possible occurrence of climate change that leads to increasing of
temperature and evaporation from water resources, extension of artificial recharge systems may be facilitated.
References Evanari, M., Shanan, L. and Tadmor, N., 1982. The Negev, The challenge of a desert. 2nd
Edition, Harvard University Press, Cambridge, Mass. Noohi, K., 1999. Water harvesting and optimum use of water in arid areas. Report presented in
RA II Working Group meeting of WMO on Agrometeorology. Tehran, I. R. of Iran.
Discussion by Ramesh Kumar Regmi, Meteorologist, Department of Hydrology & Meteorology, Babar Mahal, Kathmandu, Nepal
The traditional methods and indigenous technologies used in cropping systems to cope
with climate variability are use of alternative crops, germination of seeds in the weather control room, suitable mixed cropping systems. In addition, making ponds, ditches, shelterbelts, wind break and mulching are also traditionally used to make favorable weather condition.
MANAGEMENT STRATEGIES WITH PARTICULAR EMPHASIS ON CARBON SEQUESTRATION TO MITIGATE GREENHOUSE GAS
EMISSIONS FROM AGROECOSYSTEMS
(R. Desjardins, W. Smith, B. Grant, C. Campbell, H. Janzen, and R. Riznek)
Discussion by H. P. Das, Agricultural Meteorology Division, India Meteorological Department, Shivajinagar, Pune, India
Management Strategies on Carbon Sequestration from
Agro-Ecosystem with Particular Reference to India
Introduction
Changes in land-use over the past two centuries have caused a significant release of CO2
to the atmosphere from the terrestrial biota and soils resulting in changes in species composition and vegetation structure. This may lead to altered carbon storage/flux relationship and therefore will have implication for sustainable agriculture. The release of carbon or its accumulation depends on the standing stock of carbon in vegetation and soils and on the rates of deforestation and reforestation.
Carbon sequestration in agro -ecosystems
The reversion of marginal agricultural land to forests (including shelterbelts and
plantations), grasslands and wetlands represents a potential for C sequestration. Rates of C accumulation in reverted agricultural soils vary greatly depending on climate and soil conditions, the vegetation type established and the degree of the management. In carbon sequestration, grasslands and abandonment to forest appear to be a major source of soil carbon accumulation ranging from 50 to 100 g/m2. Upon release from agricultural production, C sequestration continue only until soils reached new equilibrium level, most of which gets released over a 50 -100 year period.

89
Based on field experiments, net C increases in soils reclaimed for agriculture are on the
order of 2.4 kg C/m2 over 10 year period, which represents a net C sink of 92 Mt C. Higher increases could be obtained for the large area suitable for reforestation. In India, more than 100 Mha are classified as degraded and greatly depleted in soil C. Nearly 63 % of deforested area in the country is under agriculture and nearly 21 % under pastures. Experiments have shown that salt-and alkali-affected soils have a relatively high potential for C sequestration if suitable tree and grass species and water management measures are used (Gupta and Rao, 1994).
Soil C levels are closely tied to the rate of C return from crop residues and other sources.
Numerous long-term field experiments demonstrate that for many soils, organic C levels are directly proportional to the annual rate of C input (Paustian et al., 1995). Greater use of perennial forage crops significantly increase soil C levels, due to high root C production, lack of tillage disturbance, and protection from erosion. Where climate permits, winter cover crops decrease erosion and provides additional input of C, thereby increasing soil organic carbon (SOC).
Carbon flow from Indian forests
Studies of carbon flows must take into consideration factors like carbon sequestration from
regrowth in degraded forests and in afforested patches, soil carbon, and the nature of the end uses of timber. It may be mentioned here that the timber may be used as structural members in buildings or as furniture where carbon is stored for long periods. Potential C emission from vegetation of deforested area seems largest from tropical moist deciduous forests.
Carbon storage - Forest Vegetation 4,178.95 Soil 5,399.33 - Plantation - - Perennials - - Natural regeneration -
TOTAL 9,578.28 Carbon emissions - Shifting cultivation 1.56 - Combustion 31.97 - Past long-term use 1.38 - Past short-term use 3.10 - Current short-term use 2.84 - Release from soil 3.91 - Biomass decomposition 18.82
TOTAL 63.58 Carbon uptake - Forests 68.87 - Natural regeneration - - Afforestation - - Reforestation -
TOTAL 68.87
Table 1. Carbon flux in India (106 t)
Carbon storage in vegetation and soil for India is given in Table 1. Carbon storage in forests has been estimated by taking 50 % of the biomass as carbon. Carbon storage in forest soil is considered based on the soil organic carbon content in the top 30 cm soil in different forest types from published studies. Total carbon stored in Indian forests is estimated at 9578 Χ 10 6 t C

90
(Table 1), of which vegetation and soil account for 44 % and 56 % respectively (Ravindranath et al., 1997).
When considering net carbon release, carbon uptake and storage in forests, and tree plantations should be considered. It is natural that at different stages of forest succession, there would be net addition to the standing biomass leading to carbon storage. The carbon accumulation is estimated using data on standing biomass data and % of standing biomass accumulating as wood in trunk and main branches. Thus the net carbon accumulation in Indian forests is estimated to be 69 Χ 10 6 t for the year 1986 (Table 1).
Carbon Emissions from forests can be from deforested areas as well as from degradation in existing forest areas. Carbon emission values are given in mid portion of the Table 1. A net emission of 1.56 Χ 10 6 t C is estimated after accounting for cutting of secondary forests in fallow areas, uptake in fallow, and degradation or burning of new areas. In addition to carbon release from deforestation or clear cutting, degradation of existing forests also contributes to carbon release. Degradation can result from grazing, fire, death due to pests and diseases, illegal removal of timber, non -sustainable harvest of fire wood and timber etc (Das, 2000). The gross annual emission from all natural and anthropogenic factors in the forest is estimated to be 64 Χ 10 6 t C.
Management Strategies on Carbon Sequestration
Improved management is capable of increasing C levels on present agricultural soils and reducing losses from newly cultivated soils. In sub-humid and humid zones, the inherent physical conditions of these soils are generally good but can be degraded with intensive tillage. Reduced tillage, mulch farming and other agroforestry practices can contribute to maintenance of soil and reduction of erosion and can provide increased organic matter inputs and reduced decomposition rates (by reducing soil temperatures and soil disturbance). Improved management of drained croplands, through conversion to conservation tillage and/or management of sub-surface drainage to keep soil moisture levels high, can increase soil organic carbon. Soil carbon sequestration can be further increased when cover crops are used in combination with conservation tillage. Cover cropping shares some of the environmental benefits of no -tillage, such as reduced soil erosion and a resulting decrease in surface water runoff. The use of cover crops can also aid in reducing the use of herbicides. The magnitude of carbon sequestration from the use of cover crops can be greater than that of conservation tillage. In addition to conservation tillage, another strategy to sequestrate carbon by reducing erosion is to plant perennial grasses and legumes, either as a regular phase in an arable farming system or in permanent “set-aside” lands. Not only do these practices reduce erosion, they also favor carbon storage because of reduced soil disturbance and greater allocation of carbon below ground. In wetland soils, especially paddy fields, low aeration slows decomposition and leads to high C contents, especially in continuously wet soils or mangroves. Higher C stocks in wetland soils generally increase CH4 emissions. When soils dry up during part of the cropping cycle, C contents decreases unless green manures or large amounts of crop residues (e.g. wheat) are produced in the dry season. The widespread burning of rice straw reduces organic C inputs to the soil.
Reduction in fossil C consumption by agriculture and the production of biofuels are also mitigation options that can, in principle, be maintained indefinitely.
References
Das, H. P., 2000. Land degradation and desertification in relation to climate change and adaptation strategies. Proc. Challenge in the management of water resources and environment in the next millennium, New Delhi.
Gupta, R. K. and D. L. N. Rao, 1994. Potential of wastelands for sequestering carbon by
reforestation. Current Science, 66, 378 -380.

91
Paustian, K., H. P. Collins and E. A. Paul, 1995. Management controls on soil carbon. In: Soil Organic Matter in Temperature Agroecosystems. Long-Term Experiments of North America [Paul, E. A., K. Paustian, E. T. Elliott and C. V. Cole (eds.)].
Ravindranath, N. H., Somashekhar, B. S. and Madhav Gadgil, 1997. Carbon Flow In India
Forests. Climate change, 35, 297 -320.
ROLE OF EDUCATION AND TRAINING IN AGRICULTURAL METEOROLOGY TO REDUCE VULNERABILITY TO CLIMATE VARIABILITY
(S. Walker)
Discussion by Byong-Lyol Lee, National Center for AgroMeteorology,
Korea Meteorological Administration, Republic of Korea
Dr. Walker pro posed two approaching methods in dealing with the reduction of vulnerability to climate variability in the discipline of AgroMeteorology: a) Strategy development to form a Network and b) for gap-filling between State-of-art and Operational level in the education and training in AgroMeteorology, then recommended to establish a) problem-based curriculum into formal education and b) computer-aided learning modules or/and Internet. How to implement such a strategy and gap-filling will be a critical issue in many member countries, particularly in the countries of a) limited domestic resources including human resources, b) poor formal education / training systems for AgroMeteorology, c) serious cross-boundary conflicts either domestically or internationally. Various types of boundaries have been existing in enhancing AgroMeteorological services in the member countries as follows: 1) Spatial boundary at local, national, regional, global levels, 2) Disciplinary boundary in monitoring, archiving, analysis, interpretation, forecasts, measures, operation, assessment, feedback, etc., and 3) Bureaucratic boundary in financing, planning, operating, etc. In particular, the above boundary problems have become more and more serious gaps in novel technologies like Information Technology (IT) among countries. The importance of IT is attracting better recognition ever before by the member countries in its wide applications to monitoring, communication, service interfaces, etc. in AgroMeteorology. Well-established national AgroMeteorological service requires balanced relationships among human resources, infrastructures and technologies to meet diverse demands from the users such as policy-maker, researcher, extension service, farmers, and publics, by delivering data, information, product, applications to the users’ sites in an appropriate time. Because increasing demands on climate and agronomic data for climate analysis at regional scale, inevitable use of computer technologies such as simulation models, GIS, RS for regional impact assessment on AgroEcosystem, and AgroMeteorological information sharing among countries is the most critical and dynamic aspect in Sustainable Agriculture. IT can, thus, be efficiently used to share AgroMeteorological information through regional collaborations to solve global problems. By integrating existing regional and global collaborations in climate information (APCN), user interface (AFITA), tools and servers (RAMINS), portal service and cyber education (WAMIS), local coordination (NCAM) will be an important fundamental for better communications regional AgroMeteorological societies. To cope with all these requirements, transferable skills in AgroMeteorology can be improved through traditional training , while professional skills can be advanced by recently developed programs being offered by regional training center or programs. Nevertheless, IT skills on models, database, tools, servers, network, and interfaces requires additional training and education programs because existing regional centers are not so specialized in their infrastructures for IT application development in AgroMeteorology. New IT training program has
92
to cover on-site practices with special pilot projects targeting on impending IT barriers in AgroMeteorological applications. As a conclusion, an efficient sharing of AgroInformatics including data, tools, models, networks, and other resources will be essential at regional scales, in helping AgroMeteorologists to improve their IT skills as well as strategy, experience and know-how, regarding regional food security problems under climate change and climate variability. It is recommended that since training center for IT skills is critical, in particular, at regional level, the e stablishment of RMTC for AgroMeteorology-oriented IT should be considered by WMO in the near future.
AGROMETEOROLOGICAL RESEARCH AND APPLICATIONS NEEDED TO PREPARE AGRICULTURE AND FORESTRY
ADAPT TO THE 21ST CENTURY CLIMATE CHANGE
(V. Pérarnaud, B. Seguin, E. Malezieux, M. Deque, and D. Loustau)
Discussion by Yanxia Zhao, Chinese Meteorological Adminstration, China
This is indeed a big topic and not easy to cover. What do you think if we divide it into two parts: research topics and service topics? Then come up with respective priorities in line with certain standard such as urgent or strategic?
As far as research work needed to prepare for 21 st Century climate change, much is mentioned in the paper. However, preparation of operational aspects is not involved. How we can transform the research achievements into operational technologies or services and make them effectively act in adapting to climate change or mitigating its negative impacts on agriculture and forestry is very significant. So we need to prepare in these aspects as well. As a matter of fact, agriculture, in many countries particularly in developing countries, is an important and fundamental sector. However, agricultural production is largely dependant on weather conditions due to natural and economic restrictions. Therefore it is quite vulnerable to climate change. If agrometeorologists can provide farmers or policymakers with effective services to deal with impacts of climate change, that would be a great contribution.
Regarding the research topics, one thing is to be mentioned here. That is remote sensing research of application in agriculture, a hot research topic which should be included in the paper.
Discussion By Lucka Kajfež-Bogataj, University of Ljubljana Biotechnical Faculty, Slovenia
Agrometeorological Research and Mountain Agriculture in 21st Century
Mountain regions occupy about one fourth of the Earth’s surface, they are home to one
tenth of the global population and provide goods and services to about half of humanity. Accordingly, mountain agriculture merits special consideration in research and development policy. Apart from food and wood production, it has considerable significance for nature conservation, protection of the landscape amenity, tourism, as well as other areas. While mountainous areas in the middle and high latitudes are often marginal for agricultural production compared with lowland areas, they can in indirect way significantly contribute to gross national product. The opposite is true at lower latitudes, where highland zones offer more temperate climate.
Mountain agriculture calls for the attention of the agrometeorologists for several reasons.
Some of them are mentioned in a number of chapters in Agenda 21. The programme areas in Chapter 13 (Sustainable Mountain Development), Chapter 14 (Sustainable Agriculture and Rural Development) and Chapter 18 (Protection of the Quality and Supply of Freshwater Resources)

93
are closely linked to 21st century climate change. Mountain agriculture potential is highly dependent on weather and climatic conditions, and thus it is among the areas affected most by climate change. Often delicate agricultural balance with fragile mountain environment would be disrupted by climate changes, creating the potential for complete disruption of life pattern of mountain communities, especially in developing world.
Given the wide range of microclimates already existing in mountain areas improving and
strengthening agrometeorological networks in mountain regions is essential. A worldwide policy of maintenance of sufficiently dense agrometeorological networks in mountain areas is needed together with national meteorological services policies of servicing these areas using also automatic weather station in representative locations and of promoting remote sensing techniques. National policy how to generate and maintain mountain soil, forest, water use, etc database for direct use in agrometeorological studies is essential.
Changes in climate of mountain areas depend on changes in the global climate and on local phenomena. The intricate topography of mountain environments complicates weather patterns and confuses general circulation models, making it more difficult to project the specific impact of climate change on these regions. Especially high mountain ranges act as physical barriers to atmospheric circulation and often introduce large temperature and precipitation gradients within small regions. So there is much need for improvement of techniques used for downscaling in mountain areas, using knowledge of regional climate processes to obtain reliable climate scenarios for the future.
Mountain agriculture needs to adapt to existent and to increasing climate variability. Even if crop yields would not be affected by climate change increases in the number of extreme events may offset any potential benefits. Agrometeorologists and other scientists should play a guiding role in identification of hazard-prone mounta in areas that are most vulnerable to erosion, landslides, snow avalanches and other natural hazards. Agrometeorologists should actively contribute to research on adaptation of mountain rural communities for the climatic changes by providing new environmental management practices suited to the new climate and also suited to the economic and social situation. Such practices include not only development of alternative cropping strategies but also protection and sustainable management of mountain forests. Agrometeorological modelling can have a function here, but fine tuning of the models is of special importance in mountain areas. The models need to successfully simulate the properties of interest along altitudinal gradients and should be designed similarly across different mountain regions. Adaptation of mountain agriculture to climatic change cannot be achieved without some human intervention. There is a danger that adaptation strategies could reduce rich mountain biological diversity, which is partly due to the compression of ‘life zones’. The research is required to verify that in practice the reverse should occur: systems based on high levels of biodiversity (crop and cultivar diversity both inter- and intra -population, crop rotation and association, agroforestry, etc.) should be adopted as a response in the face of variability and climatic change. Mountains are often the primary source for major rivers and any climate change impacts on mountain hydrological cycle would be felt far beyond the mountainous regions themselves. The research in direction to protect the quality and supply of freshwater resources and to detect potential changes in runoff extremes is important, as well. Development of integrated approaches to the development, management and u se of mountain water resources requires special attention of agrometeorologists.
Mountains are distributed all over the globe, from the equator almost to the poles and from
oceanic to highly continental climates. This is a reason more for international research cooperation which should contribute not only to the scientific understanding of the ongoing processes of climate change, but in the end to suggestions for action to preserve the ability of

94
mountain agriculture to sustainably provide the goods and services on which humanity has come dependent.
Discussion by Saifullah Shami, Quetta, Pakistan
Growth of the plant and crops are extremely vulnerable to weather & climate variability. Beside Various Meteorological parameters needs to be examined and knowledge of climatology based on Scientific method, heat unit plays an important effect on the growth of plant and crops and cases depending upon the variety of crops that heat unit values may be different, because of responses in their growth.
In between the phases from sowing to maturity the sensitivity of heat unit in cumulative
terms are favourable if it is according to requirement of certain phases, if not then the growth of the plant and crop will not be normal and ultimately the yield will be less. Taking into account the meteorological factors along with the heat unit requirements during the phases of particular variety of plant and crops a strategic decision in long range planning of agriculture system can be achieved in designing of irrigation schemes, choice of land use and farming patterns, also to meet the hazard of diseases. Out look with regard to the water management for coming days can be schedule accordingly to the requirement of crops. Heat unit data may constitute objective criteria when introducing new crops or new breed of livestock.
Frost as an environmental factor affect crop growth. It can cause partial or total destruction
of crops, as well as retardation or termination of crop formation. To judge the best growth of crop chilling degree hours should be taken into account. Further, a close collaboration should exist between plant physiologist and Agrometeorologist to exchange their research on the physiology of plant and agro meteorological forecast of phonological events.