Embed Size (px)
Citation preview
*Corresponding Author Address: Omar Mady, Ph.D., Depart. of Pharm. Technology, Faculty of Pharmacy, Tanta University, Egypt; E-
mail: [email protected]
World Journal of Pharmaceutical Sciences ISSN (Print): 2321-3310; ISSN (Online): 2321-3086
Published by Atom and Cell Publishers © All Rights Reserved
Available online at: http://www.wjpsonline.org/
Original Article
Studying the Effect of Dispersed Drug Crystal in the Organic Phase on the
Encapsulation by Solvent Evaporation Technique; (4) Dependent models as tools for
studying the drug release
Omar Mady
Department of Pharmaceutical Technology, Faculty of Pharmacy, Tanta University, Egypt
Received: 11-04-2014 / Revised: 02-05-2014 / Accepted: 26-05-2014
ABSTRACT
Different dependent models (kinetics and mechanisms) were used to study the Aspirin release from different
particle size ranges of Eudragit RS100 microcapsules prepared with the same or different theoretical drug
content in relation to the method of drug entrapment. The drug release kinetic obeys zero order kinetic and
Higuchi model. Higuchi model had a large application in the polymeric matrix systems but zero order is an ideal
to coated dosage forms. Both two forms are found to be the structure of Eudragit RS100 microcapsules
entrapped drug. The good fitting of the drug release to Korsmeyer-Peppas model, which can be used as a
decision parameter between the above two models, indicates the mechanism of the drug release in every case is
either Case II or supper Case II. The above results are also supported by the good fitting of the dissolution data
to Hixson-Crowel model since Eudragit RS100 is a swellable and non soluble polymer. The application of
Weibull model again support the above results since the value of b ˃ 1 in every case which indicating that the
drug release mechanism is case II. Application of first order equation to the whole release data showed no fitting
but the graphic representation showed bi-phase release data with one point transition time between the two
phases which is after 2 hrs. There is no good fitting between Baker-Lansodale model and drug release data in
every case but good fitting in every case was found with Hopfenberg model.
Key words: Dependent models, drug release, division mechanism, drug entrapment, Aspirin crystal, Eudragit
RS100, Solvent evaporation technique.
INTRODUCTION
The methods of approach to investigate the kinetics
of drug release from controlled release formulation
can be classified into 3 categories: Statistic
methods, Model independent methods and Model
dependant methods [1]. The model dependant
methods can be classified into kinetics models and
mechanisms models. The drug dissolution from
solid dosage forms has been described by some
kinetic models which include zero-order kinetics,
first order kinetics, Higuchi model and Hixson-
Crowel model. The mechanisms of drug release
from a solid dosage form can be interpreted using
these models: Weibull model, Baker-Lansodale
model, Korsmeyer-Peppas & Ritger-Peppas model
and Hopfenberg model [2-5]. Zero order is the
ideal method of drug release in order to achieve a
prolonged pharmacological action. It describes the
systems where the drug release rate is independent
on its concentration. Zero order is expressed as:
C = k0 t where C is the amount of drug release at time t , K0
is zero-order rate constant. A plot of the amount of
drug released versus time will be linear for zero-
order kinetic [2]. On the opposite of that, the first
order describes the release of drug from system
where release rate is concentration dependent. The
drug release is first order if it obeys the equation:
Log C0 – Log Ct = k1 t / 2.303
where, Ct is the amount of drug released in time t,
C0 is the initial concentration of drug and K1 is first
order constant. The graphical representation of the
log cumulative percent of the drug remaining
versus time will be linear with a negative slope [6].
Higuchi describes drug release as a diffusion
process based in the Fick’s law, square root time
dependent. Higuchi model was simplified as,
Q = KH t1/2
where KH is the Higuchi dissolution constant. For
diffusion controlled process, plotting the amount of

Omar et al., World J Pharm Sci 2014; 2(6): 549-564
550
drug released in time per unit area versus square
root of time is linear [2-3].
On the opposite of Higuchi model, Hixson-Crowel
cube root law is used by assuming that the drug
release rate is limited by the drug particles
dissolution rate and not by the diffusion [2]. It
describes the release from systems where there is a
change in surface area and diameter of particles or
tablets [7-8]. Hixson-Crowel equation is:
(Q0)1/3
– (Qt)1/3
= KHC t
where, Qt is the remaining amount of drug in the
dosage form at time t, Q0 is the initial amount of
the drug in tablet and KHC is the rate constant of
Hixson-Crowell rate equation. A graphical
representation of the cube root of the amount of
drug remaining versus time will be linear if the
equilibrium condition is not reached and if the
geometrical shape of the dosage form diminishes
proportionally overtime [9].
An empirical equation to analyze both Fickian and
non-Fickian release of drug from swelling as well
as non- swelling polymeric delivery systems was
developed by Ritger and Peppas and Korsmeyer
and Peppas [10-14]. The equation is represented as:
Mt / M∝ = K t n
The logarithm form of the equation could be
written as:
Log (Mt / M∝) = Log k + n Log t
where Mt / M∝ is fraction of drug released at time t,
n is diffusion exponent indicative of the transport
mechanism of drug through the polymer, K is
kinetic constant (having units of t-n
) incorporating
structural and geometric characteristics of the
delivery system. The release exponent n = 0.5 and
1.0 for Fickian and non-Fickian diffusion from slab
and n = 0.45 and 0.89 for Fickian and non-Fickian
diffusion from cylinders, respectively. A value of n
= 1 actually means that, the drug release is
independent of time regardless of the geometry.
This equation can be used to analyze only first 60%
of release, regardless of geometric shapes. The
value of n = 0.5 is for (time)1/2
kinetics and n = 1
for zero-order release [14].
The Weibull model expresses the accumulated
fraction of drug m in solution at time t. The
equation can be rearranged as:
Log [ ln - ( 1 – m )] = b Log ( t – Ti ) - log a
where m is accumulated fraction of drug in solution
at time t, a is the scale parameter which defines the
time scale of the process. Ti is the location
parameter, represents the lag time before the onset
of the dissolution or release process and in most of
the cases will be zero. The shape parameter b
characterizes the curves as either exponential
(b=1), s - shaped (b>1) or parabolic (b<1) [15]. A
graphic representation of link side versus time t
gives a linear relation. Shape parameter (b) is
obtained from the shape of the line and the scale
parameter (a) can be estimated from the ordinate
value (1/a) at time t =1[15].
Baker-Lonsdale developed a model from the
Higuchi model which describes the controlled
release of drug from a spherical matrix [16].
Baker-Lonsdale model could be redefined as:
3/2 [1- (1- Mt / M∞) 2 / 3] - Mt / M0 = k t
where Mt is the amount of drug released at time t
and M∞ is the amount of drug released at an infinite
time and k is the release constant corresponds to
the slope. The graphic representation of the left
side of the equation versus time will be linear if the
established conditions were fulfilled. This equation
can be used to the linearization of the release data
from several formulations of microcapsules [17].
Hopfenberg and Katzhendler et al developed a
general mathematical equation describing drug
release from slabs, spheres and infinite cylinders
displaying heterogeneous erosions as:
Mt / M∞ = 1 – [1- k 0 t / C0 a0 ] n
where Mt is the amount of drug dissolved in time t,
M∞ is the total amount of drug dissolved when the
dosage form is exhausted, Mt / M∞ is the fraction of
drug dissolved, k0 is the erosion rate constant, C0 is
the initial concentration of drug in the matrix and
a0 is the initial radius for sphere or cylinder or the
half-thickness for a slab. The value of n is 1, 2, and
3 for a slab, cylinder and sphere respectively [18,
19].
The selection of a suitable model for fitting
dissolution data is essential, not only for
quantitative evaluation of drug release
characteristics but also for comparison of
dissolution profiles using model-dependent
approaches. DDSolver is a menu-driven add-in
program for Microsoft Excel written and is capable
of performing most existing techniques for
comparing drug release data. DDSolver provides a
number of statistical criteria for evaluating the
goodness of fit of a model, including the correlation
coefficient (R_obs–pre), the coefficient of
determination (Rsqr, R2, or COD), the adjusted
coefficient of determination (Rsqr_adj or R2adjusted),
the mean square error (MSE), the standard
deviation of the residuals (MSE_root or Sy.x), SS,
WSS, the Akaike Information Criterion (AIC), and
the Model Selection Criterion (MSC). Among these
criteria, the most popular ones in the field of
dissolution model identification are the R2adjusted,
the AIC and the MSC [20]. For release models with
the same number of parameters, the coefficient of
determination (R2) can be used to discriminate the
most appropriate model [20-22]. Singh et al
reported that the SSR/R2
is better than relying only

Omar et al., World J Pharm Sci 2014; 2(6): 549-564
551
on R2 as goodness of fit value and this shall also
not be considered that equation having best R2
value always have best SSR value. These both if
used in some relationship may give more genuine
justification about choice of equations, but
individually these may be misleading in
formulation development [13]. However, when
comparing models with different numbers of
parameters, the adjusted coefficient of
determination should be used:
where n is the number of data points and p is the
number of parameters in the model. This is because
R2 will always increase as more parameters are
included, whereas R2 adjusted may decrease when
over-fitting has occurred. Therefore, the best model
should be the one with the highest R2 adjusted,
rather than that with the highest R2 [15]. The
Akaike information Criterion has been used for
selecting optimal models for more than 35 years
[23]. Its general applicability and simplicity make
it an excellent and popular criterion for various
purposes, including drug dissolution data analysis
[24]. The AIC as defined below is dependent on the
magnitude of the data as well as the number of data
points:
where n is the number of data points, WSS is the
weighted sum of squares, and p is the number of
parameters in the model. When comparing two
models with different numbers of parameters, the
model with a lower AIC value can be considered to
be the better model, but how much lower the value
needs to be to make the difference between the
models statistically significant cannot be
determined because the distribution of the AIC
values is unknown. It should be noted that when a
comparison is made, the weighting scheme used in
each model must be the same [20].
The MSC provided by MicroMath Corporation
[20] is another statistical criterion for model
selection which is attracting increasing attention in
the field of dissolution data modelling [25, 26]; it is
defined as:
where wi is the weighting factor, which is usually
equal to 1 for fitting dissolution data, yi_obs is the ith
observed y value, yi_pre is the ith predicted y value, y
obs is the mean of all observed y-data points, p is the
number of parameters in the model, and n is the
number of data points. The MSC is a modified
reciprocal form of the AIC and has been
normalized so that it is independent of the scaling
of the data points. When comparing different
models, the most appropriate model will be that
with the largest MSC. It is, therefore, quite easy to
develop a feeling for what the MSC means in terms
of how well the model fits the data. Generally, a
MSC value of more than two to three indicates a
good fit [27]. Although all the criteria mentioned
above can be calculated by DDSolver to assess the
goodness of fit of dissolution models, it should be
noted that when mechanistic models are evaluated,
model selection should be based, not only on the
goodness of fit but also on the mechanistic
plausibility of the model.
The aim of this work is to apply different
dependent models (kinetics and mechanisms) to
study the drug release from different particle ranges
Eudragit RS100 microcapsules prepared by using
different or the same TDC (theoretical drug
content). The selection of the most suitable model
for fitting dissolution data would be based on the
calculating values of R2, R
2 adje, AIC and MSC
using DDSolver soft ware. The drug release study
has also to be in relation to the physco-chemical
drug entrapment mechanism which occurred as a
result of the division mechanism suggested by the
author.
MATERIALS AND METHODS
Materials and methods are the same in reference
[28].
RESULTS AND DISCUSSION
The kinetic and mechanism of drug released was
studied using different dependent models. The
models were transformed into straight-line
equations and the best fitness of the model was
chosen on the bases of the values of R2, R
2adj. , AIC
and MSC. Table (1A) shows goodness of fitness of
the drug dissolution data of all different particle
size microcapsules prepared with the same or
different theoretical drug content (TDC) to zero
order kinetic since the values of R2 and R
2 adjust. are
high enough to consider good fitting. Also closing
the values of MIC and the values of MSC which is
between 2 and 4 support also the fitting of the
dissolution profiled to zero order kinetic. From
table (1B) it can be noticed the closest of zero order
dissolution rate constant from all products which is
in agreement with the similarity of the dissolution
profiles [28]. The alternative negative values
between Tlag (lag time of drug release) and F0
(initial drug release which is the intercept with the

Omar et al., World J Pharm Sci 2014; 2(6): 549-564
552
y axis) interpretate each other because if there is a
lag time of drug release then F0 should has negative
sign and vice versa. The lag time of the dissolution
profile is related to the drug solubility in the
dissolution media and the method of drug
entrapment. The presence of lag time in the
dissolution profile of particle size ranges 500-400
µm and 315-80 µm of microcapsules prepared by
using 20 % and 33.33% TDC may be due to the
molecular dispersion and minute drug crystal
entrapment mechanisms [29]. At the same time the
absence of lag time from the dissolution profile of
particle size range 800-500 µm microcapsules
prepared by 33.33% TDC may be due to the size of
the microcapsules which need long time till
complete evaporation of the organic phase
(dichloromethane). This led to molecular
dispersion of the drug in interior the microcapsule
structure as a result of using 0.1N HCL as an
aqueous phase which has the minimal solubility of
the drug. This method was used as a tool to
increase the amount of drug entrapment in the
microcapsules prepared by solvent evaporation
technique [30, 31]. The dissolution profile of 800-
500 µm particle size range of microcapsules
prepared by using 50% TDC showed double lag
time than that from 500-400 µm particle size range
of the same product. That is may be due to the
amount of drug crystal in the first is more than the
second one [29]. The absence of lag time from the
dissolution profile of 315-80 µm particle size range
may be due to increase the surface area as a result
of the smallest microcapsules and the high
concentration of molecular dispersed drug in the
microcapsule structure [29]. At the same time
increase the drug crystal in the microcapsule as a
result of increasing TDC used and also the particle
size range may led to decrease the thickness the
polymer film. This led to increase the lag time 50%
in case 800-500 µm particle size range of
microcapsules prepared on using 66.66% than that
from product prepared on using 80% TDC of the
same size range which has the opposite effect on
the value of F0.
Table (1C) shows the secondary parameters of zero
order kinetics which are the time required to release
25%, 50%, 75%, 80% and 90% of drug. From the
table it can be notice the closest of data to each
other’s which again in agreement with the
similarity of the different dissolution profiles [28].
This could be also noticed from the values of
standard deviation at each time. Table (2A) shows
the first order kinetic data which indicates the
values of R2 and R
2adjested are not high enough to
consider a good fitting with first order kinetics on
application the whole release data all-over the
dissolution time. In addition the values of AIC look
high although the values of MSC are between 2 and
3 in most cases. At the same time the graphic
representation of the dissolution data according to
the first order equation (figure 1A-D) shows bi-
phase dissolution profile for every particle size
ranges prepared with same or different TDC [32,
33]. Accordingly, the extend of the two phase was
determined according the value of calculated
correlation coefficient R2. It was found (table 2b)
that the first phase is between 0-2 hrs and the
second one is between 2- 8 hrs. Also there is a
together rate change point which is the point at
which the drug dissolution rate changed from one
rate to another i.e. there is no phase transition state.
It is at 2hr. From table (2B) it can be noticed that
the first phase dissolution rate constant from
products can be arranged in the following order
20% < 33.33% < 50% ˃ 66.66 % ˃ 80%TDC. That
is may be due to the molecular dispersion of the
drug in the product prepared on using 20% TDC
which decreased with increasing TDC [29].
Decreasing the drug crystal content and increasing
the polymer content in the product prepared on
using 66.66% TDC than that of 80TDC[ 28] may
be responsible about increasing the release rate
constant on using 66.66% TDC than that on using
80% TDC. That is may be due to prolongation of
the diffusion route of the drug [34, 35]. At the same
time, table (2B) shows the closest of the dissolution
rate constant of the drug in the second phase from
all different particle size ranges microcapsules
prepared on using the same or different TDC with
nearly the same intercept. That is may be due to
that, after 2 hrs dissolution time the drug release
occurred mainly from the drug crystal entrapped in
the microcapsule structure.
Higuchi model was also applied to the dissolution
data (Table 3a). Goodness of fit of dissolution data
by Higuchi model (R2& R
2adje) is high enough to
evaluate the dissolution behaviour. Also the values
of AIC are nearly similar and the values of MSC
are between 2-3 which indicating better fitting [27].
The mean Higuchi rate constants of different
particle size ranges prepared by using 20%, 33.33%
and 50% TDC are equal while that from
microcapsules prepared on using 66.66% TDC are
lower than that from 80% TDC (able 3b). That is
may be due the mechanism of drug entrapment in
the microcapsules prepared on using 20%, 33.33%
and 50% TDC which are combination of molecular
dispersion, drug crystal and another form of
interaction between the drug and the polymer [29].
Increasing the drug crystal in the microcapsule
structure prepared on using 80% TDC more than
that in 60% TDC may be responsible about
decreasing the Higuchi dissolution rate. Using the
two functions (Tlag & F0) which are automatically
calculated and provided by DDSolver (table 3b), it
can be noticed that, the mean Tlag of products

Omar et al., World J Pharm Sci 2014; 2(6): 549-564
553
prepared by using 20% TDC is equal to that of
33.33% TDC and both are higher than that of 50%
and 66.66% TDC which are also equal. The mean
Tlag of the product prepared on using 80%TDC is
the lowest one. This observed finding from the
dissolution data is completely against the fact that
decrease the drug particle size and the drug
molecular dispersion have high dissolution rate
than the form of drug bigger particle size one. That
is in agreement with what is reported by the author
about the presence some kind of interaction
between the molecular dispersed drug and the
polymer which may be responsible about the above
result. The author also reported that this interacted
form needs further IR explanation [29].
Hixson-Crowel model was also applied since
Eudragit RS100 is water insoluble but water
swellable polymer. Accordingly, it can be
concluded that the change in total microcapsule
surface will be regularly and occurred only as a
result of swelling of the polymer especially there is
no drug crystal observed attached to the
microcapsule surface [36]. Then it can be expected
that the drug release will depend on the drug
particles dissolution rate [2 9] and the method of
drug entrapment in the microcapsule structure.
Table (4) shows the goodness of fit of the
dissolution data to the Hixson-Crowel model which
support the hyposis before. Also from the same
table the best-fit values show the closest of the
Hixson-Crowel dissolution rate constant (KHC) as a
general to each other which again supports the
presences of certain interaction between the drug
dispersed molecule and the polymer. This is
because the presence of the drug in the molecular
dispersed form (in products prepared by using
20%, 33% and 50% TDC) should release the drug
faster than that when the drug present as a crystal
form (in products prepared by using 66% and 80%
TDC) [29] in case of there is no interaction
between the drug and the polymer.
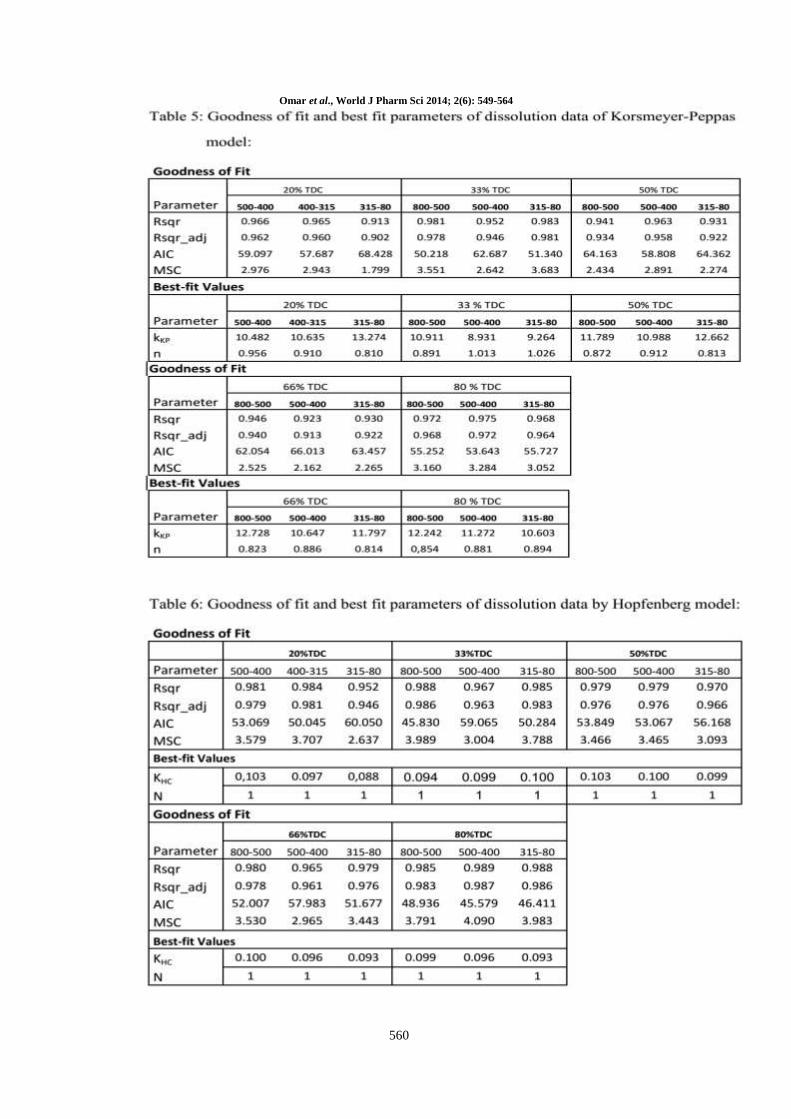
Korsmeyer – Peppas model was also applied to the
dissolution data from different particle size ranges
microcapsules prepared by using the same or
different TDC. Although the fitting data are not
ideal but it can be consider as good fitting specially
there is no value for either R2 or R
2adj lower than
0.9 (table 5). Also from the table it can be noticed
there are some variability in the values of the
model kinetics constant (KKP). That is may be due
to its incorporation in the structural and geometric
characterization of the delivery system which could
be expected to change during the dissolution
process [5]. The release exponent (n) is an
indicative of the mechanism of release because it
indicates relative rates of diffusion and polymer
relaxation. For spherical particles, a Fickian-
diffusion controlled release is implied when n is
0.43 (Case I in which the rate of diffusion is much
smaller than the rate of relaxation). Accordingly,
0.43 < n < 0.85 is an indication of both diffusion
controlled release and swelling controlled release
(also known as anomalous transport), while a value
of n equal to 0.85 indicates case-II transport where
the diffusion process is much faster than the
relaxation process, system controlled by relaxation[
37, 38]. Occasionally, values of n > 1 have been
observed, which are regarded as Super Case II
kinetics [39, 40]. From table (5) it can be noticed
that, the values of n of all different particle size
microcapsules prepared by using the same or
different TDC indicating that the drug release
mechanism is case II or super case II. That is
means the drug release rate does not change over
the time and the drug is released according to zero
order mechanism which is in agreement with what
stated before about the zero order release kinetics.
This phenomenon can generally attributed to
structure changes induced in the polymer by the
penetrate [41].
Cox et al [42] and Saki et al [43] stated that super
case-II transport mechanism is a relaxation release
by which the drug transport mechanism associated
with stresses and state transition in hydrophilic
glassy polymers which swell in water or biological
fluids. This process also involves polymer
disentanglement and erosion.
Peppas et al. [44, 45], reported that the dynamic
swelling behaviour of hydrogels is dependent on
the relative contribution of penetrate diffusion and
polymer relaxation. In the ionic hydrogels, the
polymer relaxation is affected by the ionisation of
functional groups. An increase in the degree of
ionization results in the electrostatic repulsion
between ionized functional groups, leading to chain
expansion, which in turn affects macromolecular
chain relaxation. Thus, the swelling mechanism
becomes more relaxation-controlled when the
ionization of hydrogel increases. Also Gierszewska
et al [46] reported that the swelling of chitosan,
chitosan- and chitosan-sodium alginate depend on
the pH of the dissolution media. Increasing the pH
of swelling solution from 3.5 to 9.0 cause a
decrease of protonation of chitosan amine groups
and simultaneously a deprotonation of alginate
carboxylic acid groups or increase of degree of
ionization of low-molecular pentasodium
tripolyphosphate. Therefore, the swelling
mechanism becomes more relaxation-controlled as
ionization of sodium alginate and pentasodium
tripolyphosphate becomes prominent. As a result
the values of n values increased.

Omar et al., World J Pharm Sci 2014; 2(6): 549-564
554
Eudragit® RS 100 is a copolymer of ethyl acrylate,
methyl methacrylate and a low content of
methacrylic acid ester with quaternary ammonium
groups. The ammonium groups are present as
chloride salts and make the polymers permeable. In
basic dissolution medium the polarity of the
ammonium groups will be increased which
associated with stresses and state transition in
hydrophilic glassy of the polymer. As a result the
swelling mechanism becomes more relaxation-
controlled as ionization of the quaternary
ammonium groups prominent. As a result the
values of n increased. The molecular dispersion of
aspirin may be led to increase the polarity in the
microcapsule structure as a result of certain of
interaction [47, 48] with polymer which led to
increase the value on n. This theoretical
explanation can be supported with the n values of
particle size ranges 500-400, 400-315 and 315-80
which are 0.956, 0910 and 0.810 respectively
where in the bigger particle size ranges
microcapsules the drug entrapped as solid solution
form with certain interaction with the polymer. On
decreasing the microcapsules particle size ranges, it
was found that the drug entrapped, in addition to
solid solution with certain drug polymer
interaction, also minute drug crystal [29].
Hopfenberg model was also applied on the drug
release data of all different particle size Eudragit
RS100 microcapsules prepared by using different
TDC (Table 6). From the table it can be concluded
that the value of R2 in every case is high enough to
apply the Hopfenberg model for the release data.
The other values like R2
adj, AIC and MSC also
support the same conclusion. From the table it can
be noticed that the initial curves fitting using
Hopfenberg model over range of 0 to 80% drug
release, yielded values for n are 1 in every case.
Accordingly the model for slab was therefore used.
On trying to use (n=3) manually because the
products are microcapsule, the value of R2, R
2adj,
AIC and MSC are markedly decreased.
It was reported that, Hoffenberg’s model can be
applied to surface eroding polymer matrices where
a zero-order surface detachment of the drug is the
rate limiting release step. The equation is valid for
spheres, cylinders and slabs [49]. Eudragit RS 100
microcapsules containing Aspirin as model drug
are spherical in shape which may be in some cases
irregular due to high drug crystal content [36].
Accordingly, the value of n should be 3 and not 1
as calculated by DDSolver soft ware. The same
result had Pillay and Fassihi [50] who proposed
negligible erosion for calcium alginate pellets
based on the low erosion constant values obtained
in their study using the Hopfenberg model. The
value of n was 3 in the Hopfenberg equation, the
data in the present study also demonstrated poor
linearity (r2 =0.8596). The author explained the
finding as a result of the absence of perfectly
spherical shape of the pellets which is a
prerequisite for obtaining best –fit for this equation.
At the same time Arschia et at [50] found that a
gradual erosion of the micropellets was observed
during dissolution. Also Hixson-Crowell Cube
Root Law indicates a change in surface area with
progressive dissolution of the matrix with time with
poor fit (R2 =0.8937) which was again
contradicting our observation. The author, as a trial
to explain the result, used the same equation in two
parts i.e., 0-4 hrs study and 4-8hrs study since
alginate is insoluble in acidic pH and more soluble
in pH > 7.0 As assumed, best fit with R2 = 0.9976
(Khc = 0.0134) and 0.9490 (Khc = 0.0038). In this
study, application of Hixson-Crowel model showed
good fitting for the dissolution data from different
particle size Eudragit RS100 prepared by using the
same or different TDC.
It was also reported that, Hopfenberg [15] is an
empirical mathematical erosion models of the
system; assumed that the rate of drug release from
the erodible system is proportional to the surface
area of the device which is allowed to change with
time. All mass transfer processes involved in
controlling drug release are assumed to add up to a
single zero-order process (characterized by a rate
constant, k0) confined to the surface area of the
system. This zero-order process can correspond to
a single physical or chemical phenomenon, but it
can also result from the superposition of several
processes, such dissolution, swelling, and polymer
chain cleavage. A good example for systems
Hoffenberg’s model can be applied to surface
eroding polymer matrices where a zero-order
surface detachment of the drug is the rate limiting
release step. Hopfenberg derived the following,
general equation, which is valid for spheres,
cylinders and slabs:
Mt and M ͚ are the cumulative amounts of drug
released at time t and at infinite time, respectively;
C0 denotes the uniform initial drug concentration
within a is the radius of a cylinder or sphere or the
half-thickness of a slab; n is a ‘shape factor’
representing spherical (n=3), cylindrical (n=2) or
slab geometry (n=1). The model ignores edge and
erodible end effects. From the above Hopfenberg
model it is clear that slabs lead zero-order drug
release kinetics, whereas spheres and cylinders
exhibit declining release rates with time [51, 52].
Again, it was also reported that the release models
with major applications and best describing drug
release phenomenon are the Higuchi model, zero

Omar et al., World J Pharm Sci 2014; 2(6): 549-564
555
order kinetics, Weibull model and Korsmeyer-
Peppas model. The Higuchi and zero order models
represent two limit cases in the transport and drug
release phenomena and the Korsmeyer-Peppas
model can be a decision parameter between these
two models. While the Higuchi model had a large
application in the polymeric matrix systems, the
zero order models becomes the ideal to describe
coated dosage forms or membrane controlled
dosage forms [53]. Mady O., reported that the
Aspirin was entrapped in the microcapsule
structure as solid solution form, minute drug crystal
and pure crystal form which again in agreement
with the above reported [29]. Accordingly, from
above it can concluded that, since it was found that
the drug release obey zero order kinetics and also
the application of Korsmeyer-model indicated the
drug release mechanism is super case II, it can be
concluded that the above finding about the value of
(n = 1) is due to the drug release zero order kinetics
which lead to, on application of Hopfenberg model,
that value of n is 1 although the products are
microcapsules. Also from table (6) it can be noticed
the value of Hopfenberg rate constant (kHC) is
nearly equal one which is in agreement with the
similarity of the drug dissolution profile from
different particle size microcapsules prepared with
different or the same TDC [28] specially it was
reported that the rate constants values for
Hopfenberg model decreased as the content of guar
gum increased in matrix granules which indicated
that the differing proportion of gum granules mixed
with matrix granules could control and modulate
the drug release[54].
Baker-Lonsdale is usually used to linearization of
the release data from several formulations of
microcapsules and microspheres [55, 56]. On
application of Baker-Lonsdale model on the
Aspirin release data from different particle size of
Eudragit RS100 microcapsules prepared with the
same or different TDC, from table (7), it can be
noticed that there is no liner fitting between the
release data and the model. It was reported that a
linear relationship is found with the application of
diffusion based Baker-Lonsdale kinetic models.
This is indicating that the drug release behaviour is
mainly governed by diffusion mechanism [57-60].
That is may explain the reason by which the failure
on application of Baker-Lonsdale model on the
dissolution data of Aspirin from different Eudragit
RS100 microcapsules prepared on using the same
or different TDC. At the same time that is support
with what stated before about the drug release
mechanism.
The general empirical equation described by
Weibull was adapted to the dissolution/ release
process. It is successfully applied to almost all kind
of dissolution curves. The results of Weibull model
are listed in table (8). The values of R2, R
2adj, AIC
and MSC are indicating the good fitting of the drug
release data from different particle size Eudragit
RS100 microcapsules prepared by using the same
or different TDC with Weibull model. Also from
the table it can be noticed that the value of b ˃ 1 in
every case which indicating that the drug release
mechanism is case II and the dissolution curve is S-
shaped with upward curvature followed by a
turning point [15]. The parameter, a, can be
replaced by the more informative dissolution time,
Td, that is defined by a = (Td)b and is read from the
graph as the time value corresponding to the
ordinate -ln (1-m)=1. Since -ln (1-m)=1 is
equivalent to m = 0.632, Td represents the time
interval necessary to dissolve or release 63.2% of
the drug present in the pharmaceutical dosage form
[15]. From the table (8) it was also concluded that
the time necessary to dissolve 63.2% of the drug
entrapped in different particles size Eudragit
RS100 microcapsule structure is nearly equal.
These results again supported what stated before
about the similarity of the drug dissolution profile
from all products [28] and also support the effect of
the drug crystal dispersed in the organic phase on
the microcapsules formation which occurred as a
result of division mechanism suggested the author
[36].
CONCLUSION
From above it can be concluded that, the different
dependent models can be applied as tools to study
the drug release kinetics as well as the drug release
mechanism. At the same time it well better to
correlate the release both kinetics and mechanism
to the physiochemical structure of the
microcapsules. Since the outcomes of the drug
release models may be, at sometimes, are not in
agreement with the actual entrapment method it is
recommended that the outcome of all models
should be interpretate in relation to the method of
drug entrapment in the microcapsule structure.

Omar et al., World J Pharm Sci 2014; 2(6): 549-564
556

Omar et al., World J Pharm Sci 2014; 2(6): 549-564
557

Omar et al., World J Pharm Sci 2014; 2(6): 549-564
558

Omar et al., World J Pharm Sci 2014; 2(6): 549-564
559
Omar et al., World J Pharm Sci 2014; 2(6): 549-564
560

Omar et al., World J Pharm Sci 2014; 2(6): 549-564
561

Omar et al., World J Pharm Sci 2014; 2(6): 549-564
562

Omar et al., World J Pharm Sci 2014; 2(6): 549-564
563
REFERANCES
1. Dash S. et al, Kinetic modelling on drug release from controlled drug delivery systems, Acta Poloniae Pharmaceutica-Drug
research 2010; 67:( 3)217-223. 2. Kalam M. et al, Continental J. Pharm Sci 2007; 1: 30-35.
3. Ofoefule S. and Chukwu A., Sustained release dosage forms: design and evaluation of oral products, Enterprises, Lagos 2002;
91-120. 4. Shah S. et al, Pak. J., Pharm. Sci. 2011; 24(2): 183-192.
5. Chime S. et al, Kinetics mechanisms of drug release from swellable and non swellable matrix, RJPBCS 2013; 4(2): 97-103.
6. Kabir A. Et al, Dhaka Univ J Pharm Sci 2009; 8(1): 23-30. 7. Hixson A. and Crowell J. Ind Eng Chem 1931; 23:923-931.
8. Shoaib H. Et al, Pak J Pharm Sci 2006; 19(2): 119- 124.
9. Rahman M. et al, Int J Pharm Biomed Res 2011; 2(1): 7-12. 10. Korsmeyer R. and Peppas N. J Control Rel 1983; 1:89-98.
11. Ritger P. and Peppas N. J Cont Rel 1987; 5:23-36.
12. Ritger P. and Peppas N. J Cont Rel 1987; 5: 37-42. 13. Singh J. et al, Prediction of in vitro Drug Release Mechanisms from Extended Release Matrix Tablets using SSR/R2 Technique.
Trends in Applied Sciences Research 2011; 6: 400-409.
14. Ford J. et al, Importance of drug type, tablet shape and added diluents on drug release kinetics from hydroxypropyl methyl celluloce matrix tablets. Int. J. Pharm. 1987; 40: 223-234.
15. Costa P. And Sousa L., Modeling and comparison of dissolution profiles and Eur J Pharm Sci 2001; 13:123-133.
16. Baker R. And Lonsdale H., Controlled release: mechanisms and rates. In: Taquary AC, Lacey RE. (Eds.), Controlled Release of Biologically Active Agents. New York: Plenum Press 1974; 15-71.
17. Shukla A, and Price C., Pharm Res 1991; 8:1369-1400.
18. Hopfenberg H., In: Paul DR, Haris FW. (Eds.). Controlled Release Polymeric Formulations. ACS Symposium Series. 33. Washington. DC: American Chemical Society 1991; 26-31.
19. Katzhendler I et al. J Pharm Sci; 1997, 86:110-115. 20. Zhang Y. et al, An introduction to the approaches used by DDSolver, Electronic supplementary material (doi: 10.1208/s12248-
010-9185-1).
21. Syed A. et al, Modulating the release behaviour and kinetic evaluation of diclofenac sodium from natural polymers, international journal oc ChemTech research 2010; 2(2):834-841.
22. Jovita K. et al, Optimaization of methods for the preparation of famotidine floating microspheres, Der Pharmazie letter 2011;
3(6): 68-76: 23. Aaike H. A new look at the statistical model identification, IEEE Trans Automat Control. 1974; 19:716–23
24. Costa F. O, Sousa JJ, Pais AA, Formosinho SJ. Comparison of dissolution profiles of Ibuprofen pellets. J Control Release,
2003;89:199–212. 25. Koizumia T, Ritthidej GC, Phaechamud T. Mechanistic modelling of drug release from chitosan coated tablets. J Control
Release. 2001;70:277–84
26. Mollo AR, Corrigan OI. Effect of poly-hydroxy aliphatic ester polymer type on amoxycillin release from cylindrical
compacts.Int J Pharm. 2003;268:71–9.
27. Mayer B. et al., Pharmacokinetic-pharmacodynamic profile of systemic nitric oxide-synthase inhibition with L-NMMA in
humans. Br J Clin Pharmacol. 1999;47:539–44 28. Mady O., Studying the effect of dispersed drug crystal in the organic phase on the encapsulation by solvent evaporation
technique (3) Independent models as tools for studying the drug release profiles, World J Pharm Sci 2014; 2(4): 409-421.
29. Mady O., Studying the Effect of Dispersed Drug Crystal in the Organic Phase on the Encapsulation by Solvent Evaporation Technique. (2) X-ray diffraction and DSC as tools to study the microcapsule structure in relation to the suggested division
mechanism, accepted for publication in international journal of Pharmaceutical sciences and Research, 2014; 5(07)July.
30. Korsatko B. et al, Third European congress of bio pharmaceutics and pharmacokinetics, proceeding volume 1, bio pharmaceutics 1987; 243-251.
31. Mady O., The effect of surfactant and plasticizer on Eudragit RS100 microspheres prepared by solvent evaporation technique,
Journal of Global Pharmaceutical Sciences 2013; 1,01-11 32. Dredan J. et al, Evaluation of mathematical models describing drug release from lipophilic matrices, Int. J. of Pharmaceutics
1996; 145: 61-64.
33. Mady O., Contribution of waxes on granulation and compression of non-comprisable drug: Tableting, drug release and physic-chemical structure, Int. Res J Pharm. App Sci. 2013; 3(5):94-104.
34. Sinha V. et al, Chitosan microspheres a a potential carrier for drugs, int. J. Pharm. 2004; 274(1-2):1-33.
35. Ghulam M. et al, Evaluation of cefixime loaded chitosan microsphere: Analysis of dissolution data using DDSolver, Dissolution technologies, may 2012.
36. Mady O., Studying the Effect of Dispersed Drug Crystal in the Organic Phase on the Encapsulation by Solvent Evaporation
Technique. (I) Effect of Drug Loading Extent on the Product Size Analysis, Morphology and Drug content, Accepted for publication in international journal of Pharmaceutical sciences and Research 2014; 5(07)July.
37. Winston W. et al, On spray drying of uniform silica-based microencapsulates for controlled release, Soft Matter 2011; 7.
38. Drużyńska M. and Czubenko J, Mechanism of water diffusion into non crosslinked and ionically crosslinked chitosan membranes, Progress on Chemistry and Application of Chitin and Its ..., 2012, volume XVII.
39. Ranga R. et al, Cellulose matrices for zero‑ order release of soluble drugs. Drug Dev Ind Pharm, 1988; 14: 2299‑ 2320. 40. Munday D. and Cox P, Compressed xanthan and karaya gum matrices: hydration, erosion and drug release mechanisms. Int J
Pharm 2000; 203: 179‑ 192. 41. Patel J. et al, Formulation and evolution of transdermal path of meloxicam, Pharma science monitor 2011;2(4): 89-102.
42. Cox P. et al, Development and evaluation of multiple unit oral sustained releases dosage form for S (+)-ibuprofen: preparation and release kinetics. Int.J.Pharm. 1999; 193: 73-84.
43. Saki Sultana, Development and evaluation of in-vitro release kinetics of sustained release pellets of gliclazide using
combinations of cellulose polymers, J Pharm Educ Res 2012; 3(1):1-9.
44. Khare A. and Peppas N., Swelling/deswelling of anionic copolymer gels. Biomaterials 1995; 16: 559‑ 567.

Omar et al., World J Pharm Sci 2014; 2(6): 549-564
564
45. Kim B. et al, Dynamic swelling behavior of pH‑ sensitive anionic hydrogels used for protein delivery. J Appl Polym Sci
2003;89:1606‑ 1613. 46. Gierszewska-Drużyńska M. and Ostrowska-Czubenko J., Progress on Chemistry and Application of Chitin and Its ..., 2012,
Volume XVII, 66. 47. Mady O., Ph.D. 1994, Thiesis, Faculty of pharmacy, Tanta University, Tanta, Egypt.
48. Mady, O.Y. and Mabrouk, M., Studying the Effect of Surfactant on Eudragit RS100 Microspheres Prepared by Solvent
Evaporation Technique, Mansura Journal of Pharmaceutical Sciences 1997; 13 (1): 30. 49. Yao F. and Weiyuan K., Drug Release Kinetics and Transport Mechanisms of Non-degradable and Degradable Polymeric
Delivery Systems, Drug Deliv. 2010; 7(4): 429–444
50. Arshia S. et al, Entrapment of andrographolide in cross-linked alginate pellets: 1. Formulation and evaluation of associated release kinetics; Pak. J. Pharm. Sci. 2007; 20(1), 1-9.
51. Siepmann J. and Gopferich A., Mathematical modeling of bioerodible, polymeric drug delivery systems, Advanced Drug
Delivery Reviews 2001; 48: 229–247. 52. Gopferich A. and Tessmar J., Polyanhydride degradation and erosion, Advanced Drug Delivery Reviews 2002; 54: 911–931.
53. Kalam A. et al, Release kinetics of modified pharmaceutical dosage forms: a review, continental J. Pharmaceutical Sciences
2007; 1: 30 – 35. 54. Chavda H. et al, Preparation and in vitro evaluation of guar gum based triple-layer matrix tablet of diclofenac sodium , Research
in Pharmaceutical Sciences, February 2012; 7(1): 57-64.
55. Polleto F., et al, Int. J. Pharm 2007; 345: 70. 56. Fuentes G., Lat. Am. Appl. Res. 2005; 35: 9.
57. Celebi N. et al, The preparation and evaluation of salbutamol sulphate containing poly(lactic acid-co-glycolic acid) microspheres
with factorial design-based studies, Int. J. Pharm.1996; 13689–100. 58. Pardakhty A., In vitro study of polyoxyethylene alkyl ether niosomes for delivery of insulin, Int. J. Pharm. 2007; 328: 130–141.
59. Shifeng Y. et al, Layer-by-layer assembly of poly(L-glutamic acid)/chitosan microcapsules for high loading and sustained release of 5-fluorouracil; European Journal of Pharmaceutics and Biopharmaceutics 2011 ;78:336–345.
60. Shifeng Y. et al, Nanoporous multilayer poly(l-glutamic acid)/chitosan microcapsules for drug delivery, International
Journal of Pharmaceutics 2012; 427: 443– 451.