Embed Size (px)
Citation preview

John et al. World Journal of Engineering Research and Technology
www.wjert.org
406
ESTIMATION OF BARE HULL RESISTANCE OF A ROPAX VESSEL
USING THE ITTC-57 METHOD AND GERTLER SERIES DATA
CHART
Chuku, Azubuike John*1, Ukeh, Michael Edwin
2 and Mkpa, Ante
3
1,2
Department of Marine Engineering, Rivers State University, Port Harcourt, Nigeria.
3Department of Marine Engineering, Maritime Academy of Nigeria, Oron, Akwa Ibom State.
Article Received on 09/10/2017 Article Revised on 30/10/2017 Article Accepted on 20/11/2017
ABSTRACT
Bare hull resistance estimation is critical in the initial design and
subsequent analysis of a vessel’s total resistance. Using the ITTC-57
method and Gertler Series Data Chart, this study therefore, predicts the
bare hull resistance of BRODOSPLIT ROPAX Vessel with a dead-
weight of 9,000 tonnes, 3560 lanes in meters (LIMs) and 400-
passengers carrying capacity. The research considers a case study of the Gulf of Guinea
which is the intended region of vessel’s operational route. The region under review has dry
season (November-April) and wet season (May-October) with sea surface temperature of
31.50C and 26
0C respectively. Analysis was done in the Matlab R2015A environment to
simulate the bare hull resistance at varying speed in relation to the wetted surface area.
Results show that for vessels of similar hydrodynamic particulars, and at average and
economic speed range of 24 Knots, the bare hull resistance was estimated to be 2495.6 KN
and 2518.3KN for Dry and Wet season respectively. Further analysis for the effective power
required shows that an estimated 30,820kW is required by the vessel when running at the
design economic speed of 24 knots in dry season and with an effective power increment of
about 0.99% in wet season.
KEYWORDS: Bare Hull, Resistance, ROPAX, and Gulf of Guinea.
wjert, 2017, Vol. 3, Issue 6, 406-422.
World Journal of Engineering Research and Technology
WJERT
www.wjert.org
ISSN 2454-695X Original Article
SJIF Impact Factor: 4.326
*Corresponding Author
Chuku, Azubuike John
Department of Marine
Engineering, Rivers State
University, Port Harcourt,
Nigeria.
John et al. World Journal of Engineering Research and Technology
www.wjert.org
407
1. INTRODUCTION
The ability of a vessel to maintain its smooth operations through-life depends largely on
accurate analysis of its hydrodynamic characteristics especially its resisting factors. Hull
based resistance is an important parameter that influences ship performance and economic
effect on ship operation. The predictive estimation of the various resisting factors on the hull
form is paramount to optimize ship performance and operation (Journee, 1976).
The ROPAX which means Roll-on/roll-off passenger vessel is generally used for freight
vehicle transport along with passenger accommodations. ROPAX vessel uses lanes in meters
(LIMs) as the unit for measurement of her cargo. LIM is calculated by multiplying cargo
length in meters by the number of decks and by its width in lanes. The lane width will differ
from vessel to vessel and there are a number of industry standards. It is a commercial ship
usually of displacement hull form and block coefficient range of 0.50-0.70 to compensate for
its high speed (Marine-Insight, 2017).
1.1 General Concept of Bare Hull Resistance
Bare hull resistance is the resistance of a hull without appendages or penetrations under tow.
This resistance comes from a number of components such as energy expended forming waves
and friction between the hull and water. It is the summation of both the frictional resistance
of the hull which is influenced by the size of the hull’s wetted area below the waterline as the
ship moves through water and the residuary resistance of the ship which comprises wave
resistance caused by waves created by the vessel during its propulsion through water and
eddy resistance caused by flow separation which creates eddies particularly at the aft end of
the ship. Bare hull resistance is often regarded as the total resistance of a ship when the air
resistance and appendage resistance of the ship is not considered. The amount of power
required to overcome this resistance can be determined by multiplying the total bare hull
resistance by the velocity of the ship. This is referred to as the effective power, PE (Narciki,
2010).
1.2 Statement of Problem
During the initial design and construction of a ROPAX Ship, the vessel is designed for
specific operational route taking into account peculiar environmental conditions, and special
consideration is given to the sea surface temperature, kinematic viscosity and mass density of
the sea route in other to estimate the design bare hull resistance. Previous research efforts on
John et al. World Journal of Engineering Research and Technology
www.wjert.org
408
bare hull resistance estimation were on general basis. They failed consider in particular
consider the Gulf of Guinea region.
In addition, previous research work did not also employ the use of simulation tool to analyze
and validate Bare-hull resistance and effective power at different speed range.
2. METHODOLOGY
2.1. Theoretical Framework
According to the Bernoulli’s Law; water with a speed of V and a density of ρ has a dynamic
pressure of P= , Eqn 2.1
Thus, if water is completely stopped by a body, the water will react on the surface of the body
with a dynamic pressure, resulting in a dynamic force on the body.
This relationship is used as the basis when estimating or measuring the source resistance (R)
of a ship hull by means of dimensionless resistance coefficient (c). Thus, C is related to the
reference force K, defined as the force which the dynamics of water with the ship’s speed V
exerts on a surface which is equal to the hull’s wetted surface area (Ss) (Charles, 1999).
The general data for resistance calculations is thus;
Eqn 2.2
And,
Eqn 2.3
Where; ρw = mass density of water at a given water temperature (kg/m3)
Vs = ship speed (m/s)
Ss = ship surface wetted (m2)
C = resistance coefficient
K = reference force in Kilo Newton (KN)
R = source resistance in Kilonewton (KN)
The wetted surface area is calculated as by Debby’s Formula
(m2) Eqn 2.4
Where; B= breadth or beam in meters
Volume displacement of ship in m3
Lwl = ship waterline length in meters
D = draught in meters
John et al. World Journal of Engineering Research and Technology
www.wjert.org
409
The vessel waterline length is calculated as;
(m) Eqn 2.5
Where; Lpp = length between perpendicular of the vessel.
The vessel volume displacement is calculated as;
(m3) Eqn 2.6
Where; CB = block coefficient of the ship
2.1.1 Total Bare Hull Resistance (RTBHS)
Energy expended forming waves as a result of ship speed and friction between the hull and
water are the major source components of ship bare hull resistance. Bare hull resistance is the
summation of the frictional resistance and the residuary resistance of a ship. It represents a
considerable part of the total ship resistance when air and appendages resistance are not
considered (Harvald, 1983)
For a ship moving in still water, the total bare hull resistance can therefore be calculated as
(KN) Eqn 2.7
Where;
Using International Towing Tank Conference – 57 Method (ITTC -57 Method) the total
bare hull resistance coefficient is computed as;
Eqn 2.8
Where;
Note; = 0.0004 (i.e. a reasonable default value)
2.1.2 Frictional Resistance of Ship (RFS)
The frictional resistance of a ship depends on the size of the hull’s wetted surface area and on
the specific frictional resistance coefficient. The friction increases with fouling of the hull and
also when the ship is propelled through water, the frictional resistance increases at a rate that
is virtually equal to the square of the ship speed. Frictional resistance represents a
John et al. World Journal of Engineering Research and Technology
www.wjert.org
410
considerable part of the ship resistance, practically 70 – 90% of the ship total resistance for
low-speed ships and less than 40% for high-speed ships (Harvald, 1983).
Using International Towing Tank Conference – 57 Method (ITTC -57 Method) the
frictional resistance is computed as;
(KN) Eqn 2.9
Where;
Using ITTC-57 method the frictional resistance coefficient is calculated as thus
Eqn 2.10
Where; is calculated thus;
Eqn 2.11
Where;
2.1.3 Residuary Resistance of Ship (RRS)
Residuary resistance comprises wave resistance and eddy resistance. Wave resistance refers
to energy loss caused by waves created by the ship during her propulsion through water,
while eddy resistance refers to the loss caused by flow separation which creates eddies
particularly at the aft end of the ship. The residuary resistance practically represents 8—25%
of the total ship resistance for low-speed ships and up to 40—60% for high-speed ships
(Harvald, 1983).
The residuary resistance is calculated thus;
(KN) Eqn 2.12
Where;
Note: The procedure used in calculating the residuary resistance coefficient includes but not
limited to the one stated below.
Using Gertler series data (CR contour) Charts
Calculate for the Froude number of the ship using the formula below
Eqn 2.13
Where;
g = 9.87m/s2 i.e. acceleration due to gravity

John et al. World Journal of Engineering Research and Technology
www.wjert.org
411
Calculate for the volume displacement : length ratio
i.e. Eqn 2.14
Calculate for the Beam : Draught ratio
i.e. (Molland and e t’al.2011) Eqn 2.15
Calculate for the longitudinal prismatic coefficient (Cp)
i.e. Eqn 2.16
But; (m2) Eqn 2.17
Where;
(Harvald, 1983)
Choose a Gertler series data chart that corresponds in value with the calculated and
Cp.
Enter into the Gertler Series Data chart using the calculated values of , at the
point of interception between these value lines, trace out a horizontal line to the right
hand side of the chart to get the value for CRS ,(i.e. the residuary resistance coefficient).
2.1.4 Effective Power (PE)
Effective power is the power required to tow the ship at a required speed. It is the total bare
hull resistance multiplied by the ship speed when appendages and air resistance is not
considered.
The effective power is calculated thus;
(kW) Eqn 2.18
2.1.5 Bare-Hull Resistance Estimation Method Adopted
The ITTC and Taylor Gertler series chart method for estimation of Bare-Hull resistance is
adopted for this analysis because it is observed that the ITTC lines method has proven to be
more accurate and precisely used for the estimation of the total resistance of a ship as it
considers the incremental resistance coefficient which accounts for surface roughness of the
ship.
John et al. World Journal of Engineering Research and Technology
www.wjert.org
412
2.2 Materials
Therefore, using the Gulf of the Guinea and the BRODOSPLIT ROPAX as a case study, this
study will estimate the total bare hull resistance and prescribe the most economically viable
operational speed and amount of power that will increase the power delivered to the
propulsion systems in other to achieve an economical running cost and voyage time
2.2.1 Particulars of Basis Ship;
Dead weight at design draught 9000 Tonnes
Delivered power 38000Kw
Lane length/ lanes meter 3500
Passengers 400
Length between perpendiculars (Lpp) 184.60m
Breadth (B) 29.80m
Draught (D) 7.40m
Source: (Shipyard BRODOSPLIT Project No.: 987D)
2.2.2 Software Program
Matlab (Matrix Laboratory) software program will be used to write the algorithm for the
above mathematical models because of its integration of computation, visualization and
programming in an easy to use environment where problems and solutions are expressed in a
familiar mathematical notation (Mathsworks, 2005). This will be in conducting several
iterations to enhance optimum result.
2.2.3 Nigerian Institute of Oceanography and Marine Research Lagos. Technical Paper
No.59
This paper provides the experimental values of the sea surface temperature of the Gulf of
Guinea.
2.2.4 Table of Values for Kinematics Viscosity and Mass Density for Sea Water As
Adopted By ITTC In 1963
This table will provide the values of kinematic viscosity and mass density at specific
temperatures.
John et al. World Journal of Engineering Research and Technology
www.wjert.org
413
2.2.5 Hydrodynamics in Ship Design Data (The Typical Set of Cr Contour from Gertler
Reworking of The Taylor Standard Series) Chart.
This chart will provide the contours of volumetric coefficients used to trace the value of
Residuary Resistance coefficient (Cr).
3. RESULTS AND DISCUSSIONS
3.1 Theoretical Analysis of Basic Parameters
The ship length on waterline,
=
3.2 Sea State of the Gulf of Guinea in Dry Season (Environmental Conditions of the
intended Service Route)
Sea Surface Temperature (ToC) 31.5
oC
Mass Density (ρsw) in Kg/m3 and Kinematic viscosity (υsw) in (m
2/sec x 10
-6) of Sea Water at
31.5oC is thus below
By interpolating respectively from table of Values for mass density and kinematic viscosity
for Sea Water as adopted by ITTC.
Table 3.1: Showing Temperature, Density and Viscosity adopted by ITTC
Temp (ToC) Density (ρsw) Viscosity (υsw)
29 1022.0 0.86671
30 1021.7 0.84931
31.5 Y x
= i.e the mass density
for sea water at 31.5oC.
∴ i.e the
kinematic viscosity for sea water at 31.5oC.
The block coefficient (CB) of the ROPAX vessel with speed of 24Knots is calculated by
interpolating from Table 3.1 ferry boat.
John et al. World Journal of Engineering Research and Technology
www.wjert.org
414
Table 3.2: Showing Block Coefficient and Speed.
CB Speed (Knots)
0.50 15
Y 24
0.70 26
∴ = 0.66 of the Ropax Vessel with 24Knots.
Thus, Ship’s volume displacement
The ship’s wetted surface area
The Reynolds number of the ship at 31.50C is thus
3.2.1 Calculating the Ship’s Frictional Resistance Coefficient ( ) by ITTC-59 Method
3.2.2 Calculating the Ship’s Residuary Resistance Coefficient by Gertler’s Series Data
Line Method
The Froude number of the ship is thus
The Volume Displacement to Length ratio ( ) of the Ropax Vessel is thus
The Breath to Draught ratio ( ) of the ship is thus
And assuming that Cp = 0.64, entering Gertler (Contours of Volumetric Coefficient) Series
Chart of and Cp = 0.64 with the following variables;
along .

John et al. World Journal of Engineering Research and Technology
www.wjert.org
415
Thus the residuary resistance coefficient ( ) as traced from the chart.
3.2.3 The Total bare hull resistance coefficient by ITTC-57 method
3.2.4 The Total bare hull Resistance of the Ropax Vessel plying the Gulf of Guinea
during dry season with temperature 31.50C and mass density of 1021.3 kg/m
3 using
ITTC-57 method
3.2.5 The Effective Power (PE) required by the Ropax Vessel to overcome the Total Bare
Hull Resistance above thus
3.2.6 Results of Matlab Simulation at Varying Speed of the Ropax Vessel during Dry
Season
Matlab software was used to simulate the behavioral resistance characteristics of the ROPAX
in dry season in the gulf of guinea as shown in table 3.3 below.
Table 3.3: Table of Total Resistance, Speed and Effective Power during Dry.
Speed (Knots) Speed (m/sec) CTBHs RTBHs (KN) PE (KW)
15 7.71 0.0025 1006.1 7757
18 9.252 0.0024 1430.9 13239
20 10.28 0.0024 1754.1 18032
22 11.308 0.0024 2109 23849
24 12.336 0.0024 2495.6 30820.7
26 13.364 0.0024 2913.6 38937
Season
The table above represents the values of total bare hull resistance coefficient (CTBHS), Total
Bare hull resistance (RTBHS) and the effective power (PE) of the Ropax Vessel at varying
speed in knots and meters per seconds during Dry Season for the Gulf of Guinea.
John et al. World Journal of Engineering Research and Technology
www.wjert.org
416
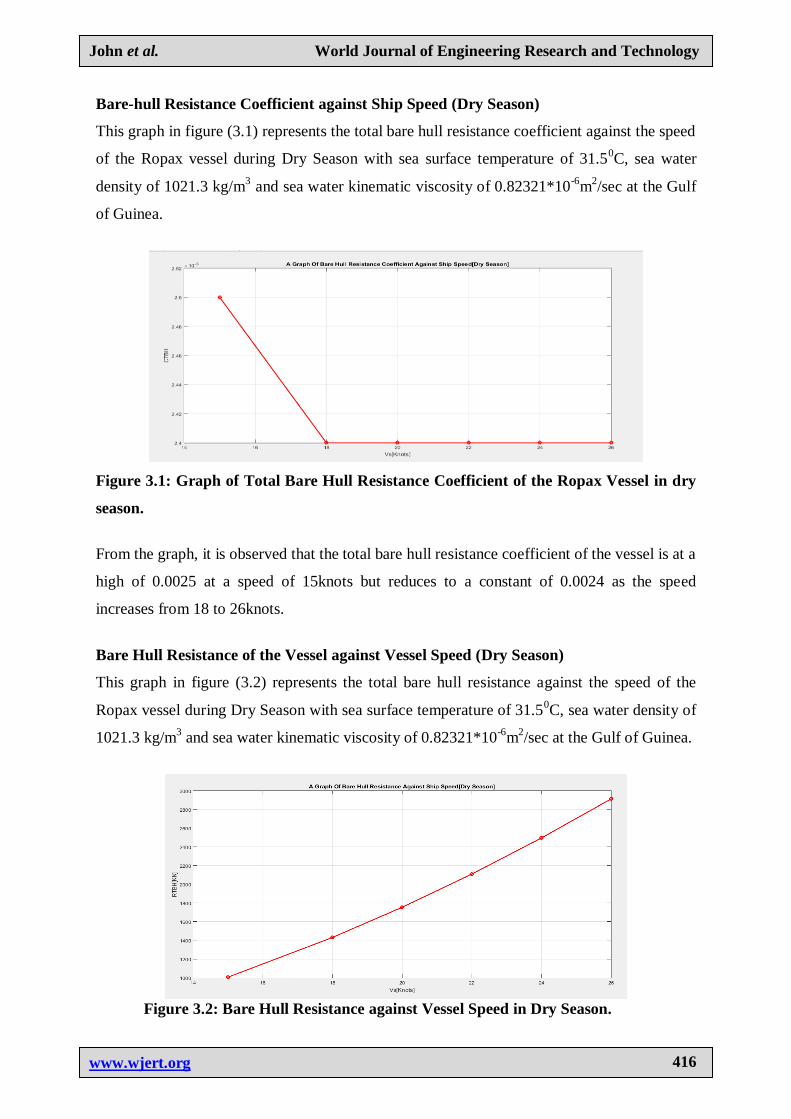
Bare-hull Resistance Coefficient against Ship Speed (Dry Season)
This graph in figure (3.1) represents the total bare hull resistance coefficient against the speed
of the Ropax vessel during Dry Season with sea surface temperature of 31.50C, sea water
density of 1021.3 kg/m3 and sea water kinematic viscosity of 0.82321*10
-6m
2/sec at the Gulf
of Guinea.
Figure 3.1: Graph of Total Bare Hull Resistance Coefficient of the Ropax Vessel in dry
season.
From the graph, it is observed that the total bare hull resistance coefficient of the vessel is at a
high of 0.0025 at a speed of 15knots but reduces to a constant of 0.0024 as the speed
increases from 18 to 26knots.
Bare Hull Resistance of the Vessel against Vessel Speed (Dry Season)
This graph in figure (3.2) represents the total bare hull resistance against the speed of the
Ropax vessel during Dry Season with sea surface temperature of 31.50C, sea water density of
1021.3 kg/m3 and sea water kinematic viscosity of 0.82321*10
-6m
2/sec at the Gulf of Guinea.
Figure 3.2: Bare Hull Resistance against Vessel Speed in Dry Season.

John et al. World Journal of Engineering Research and Technology
www.wjert.org
417
From the graph, it is noticed that the bare hull resistance of the Ropax vessel increases
linearly as the speed of the vessel increases. The bare hull resistance encountered by the
vessel running at its design speed of 24knot is 2495.6KN as shown above.
Effective Power against Bare Hull Resistance by the Ropax Vessel (Dry Season)
This graph in figure (3.3) represents the effective power against the bare hull resistance of the
Ropax vessel during Dry Season with sea surface temperature of 31.50C, sea water density of
1021.3 kg/m3 and sea water kinematic viscosity of 0.82321*10
-6m
2/sec at the Gulf of Guinea.
Figure 3.3: Effective Power against Bare Hull Resistance during Dry Season.
From the graph, it is observed that the effective power required by the vessel increases
continuously as the bare hull resistance of the vessel increases.
The Effective Power required by the ROPAX Vessel against Vessel Speed (Dry Season)
This graph in figure (3.4) represents the effective power against the speed of the Ropax vessel
during Dry Season with sea surface temperature of 31.50C, sea water density of 1021.3 kg/m
3
and sea water kinematic viscosity of 0.82321*10-6
m2/sec at the Gulf of Guinea.
Figure 3.4: The Effective Power required by the ROPAX Vessel during Dry Season.
John et al. World Journal of Engineering Research and Technology
www.wjert.org
418
From the graph, it is observed that the effective power required by the vessel increases
continuously as the speed of the vessel increases. The effective power required by the vessel
running at its design speed of 24knot is 30786KW as shown above.
3.3 Sea State of the Gulf of Guinea in Wet Season (Environmental Conditions of the
intended Service Route)
Sea Surface Temperature (ToC) 26
oC
Mass Density of Sea Water (ρsw) in Kg/m3 at 26
oC 1022.9
Kinematic viscosity of sea water (υsw) in (m2/sec x 10
-6) at 26
oC 0.92255
3.3.1 Results of Matlab Simulation at Varying Speed of the Ropax Vessel during Wet
Season
Matlab software was used to simulate the behavioral resistance characteristics of the ROPAX
in wet season in the gulf of guinea.
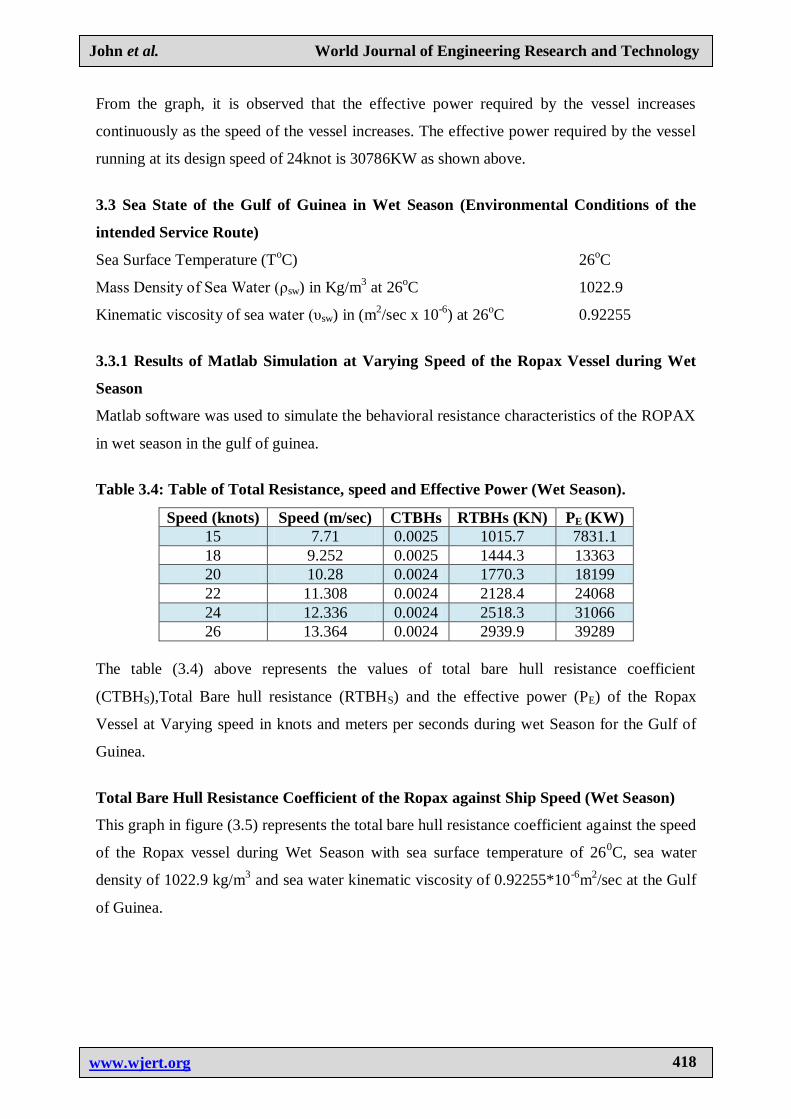
Table 3.4: Table of Total Resistance, speed and Effective Power (Wet Season).
Speed (knots) Speed (m/sec) CTBHs RTBHs (KN) PE (KW)
15 7.71 0.0025 1015.7 7831.1
18 9.252 0.0025 1444.3 13363
20 10.28 0.0024 1770.3 18199
22 11.308 0.0024 2128.4 24068
24 12.336 0.0024 2518.3 31066
26 13.364 0.0024 2939.9 39289
The table (3.4) above represents the values of total bare hull resistance coefficient
(CTBHS),Total Bare hull resistance (RTBHS) and the effective power (PE) of the Ropax
Vessel at Varying speed in knots and meters per seconds during wet Season for the Gulf of
Guinea.
Total Bare Hull Resistance Coefficient of the Ropax against Ship Speed (Wet Season)
This graph in figure (3.5) represents the total bare hull resistance coefficient against the speed
of the Ropax vessel during Wet Season with sea surface temperature of 260C, sea water
density of 1022.9 kg/m3 and sea water kinematic viscosity of 0.92255*10
-6m
2/sec at the Gulf
of Guinea.

John et al. World Journal of Engineering Research and Technology
www.wjert.org
419
Fig 3.5: Total Bare-hull Resistance Coefficient against Ship Speed.
From the graph, it is observed that the total bare hull resistance coefficient of the vessel is at a
high of 0.0025 at a speed of 15-18knots but reduces to a constant of 0.0024 as the speed
increases from 20 to 26knots.
Total Bare Hull Resistance of the Ropax Vessel against Ship Speed (Wet Season)
This graph in figure (3.6) represents the total bare hull resistance against the speed of the
Ropax vessel during Wet Season with sea surface temperature of 260C, sea water density of
1022.9 kg/m3 and sea water kinematic viscosity of 0.92255*10
-6m
2/sec at the Gulf of Guinea.
Fig 3.6: Total Bare Hull Resistance against Ship Speed.
From the graph, it is noticed that the bare hull resistance of the Ropax vessel increases
linearly as the speed of the vessel increases. The bare hull resistance encountered by the
vessel running at its design speed of 24knot is 2518.3KN as shown above.
John et al. World Journal of Engineering Research and Technology
www.wjert.org
420
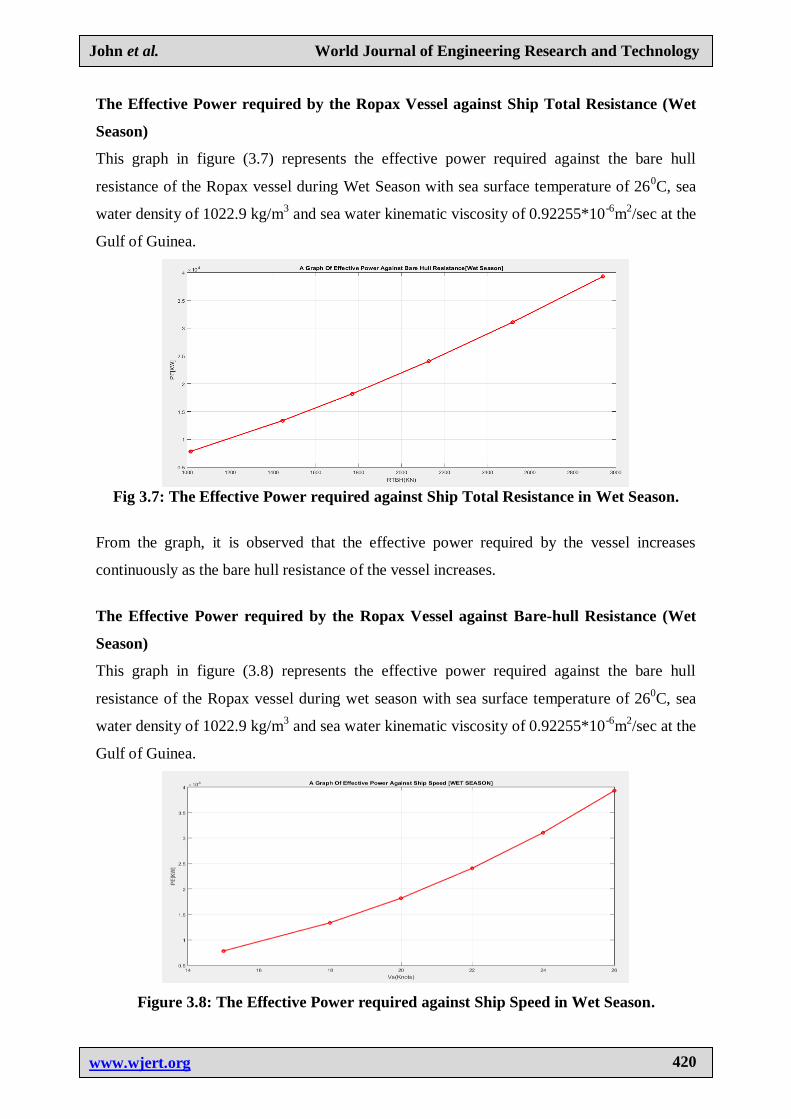
The Effective Power required by the Ropax Vessel against Ship Total Resistance (Wet
Season)
This graph in figure (3.7) represents the effective power required against the bare hull
resistance of the Ropax vessel during Wet Season with sea surface temperature of 260C, sea
water density of 1022.9 kg/m3 and sea water kinematic viscosity of 0.92255*10
-6m
2/sec at the
Gulf of Guinea.
Fig 3.7: The Effective Power required against Ship Total Resistance in Wet Season.
From the graph, it is observed that the effective power required by the vessel increases
continuously as the bare hull resistance of the vessel increases.
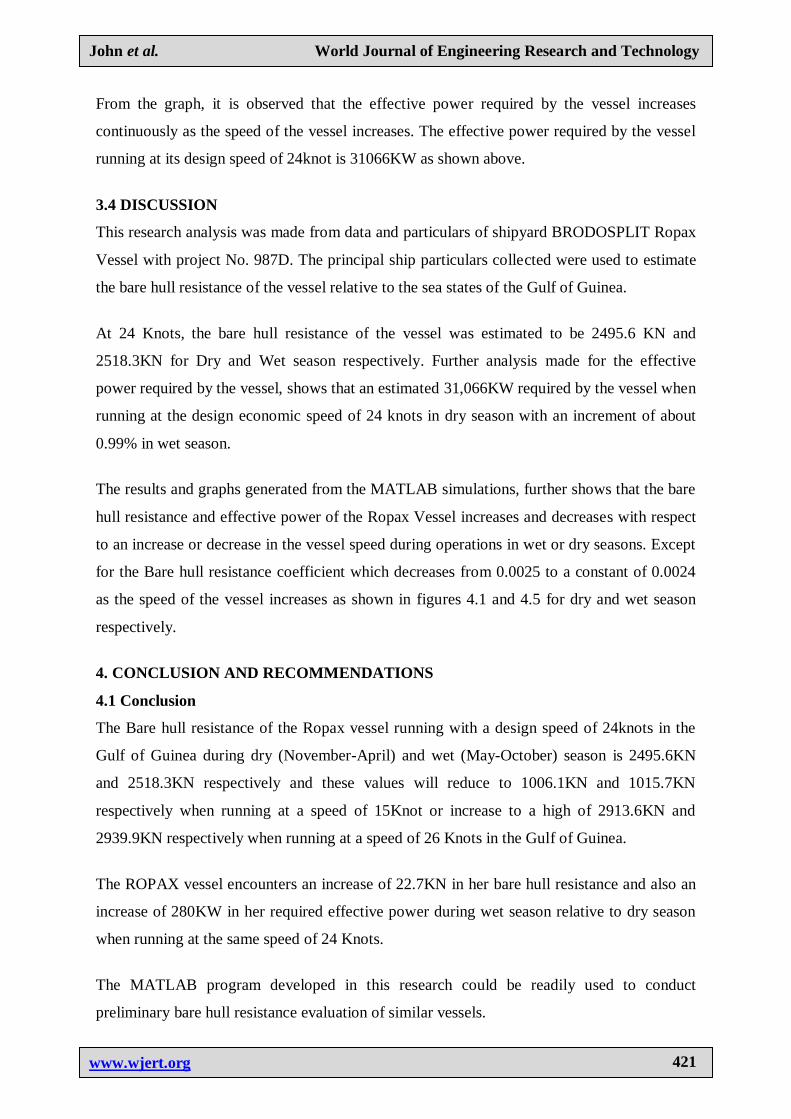
The Effective Power required by the Ropax Vessel against Bare-hull Resistance (Wet
Season)
This graph in figure (3.8) represents the effective power required against the bare hull
resistance of the Ropax vessel during wet season with sea surface temperature of 260C, sea
water density of 1022.9 kg/m3 and sea water kinematic viscosity of 0.92255*10
-6m
2/sec at the
Gulf of Guinea.
Figure 3.8: The Effective Power required against Ship Speed in Wet Season.
John et al. World Journal of Engineering Research and Technology
www.wjert.org
421
From the graph, it is observed that the effective power required by the vessel increases
continuously as the speed of the vessel increases. The effective power required by the vessel
running at its design speed of 24knot is 31066KW as shown above.
3.4 DISCUSSION
This research analysis was made from data and particulars of shipyard BRODOSPLIT Ropax
Vessel with project No. 987D. The principal ship particulars collected were used to estimate
the bare hull resistance of the vessel relative to the sea states of the Gulf of Guinea.
At 24 Knots, the bare hull resistance of the vessel was estimated to be 2495.6 KN and
2518.3KN for Dry and Wet season respectively. Further analysis made for the effective
power required by the vessel, shows that an estimated 31,066KW required by the vessel when
running at the design economic speed of 24 knots in dry season with an increment of about
0.99% in wet season.
The results and graphs generated from the MATLAB simulations, further shows that the bare
hull resistance and effective power of the Ropax Vessel increases and decreases with respect
to an increase or decrease in the vessel speed during operations in wet or dry seasons. Except
for the Bare hull resistance coefficient which decreases from 0.0025 to a constant of 0.0024
as the speed of the vessel increases as shown in figures 4.1 and 4.5 for dry and wet season
respectively.
4. CONCLUSION AND RECOMMENDATIONS
4.1 Conclusion
The Bare hull resistance of the Ropax vessel running with a design speed of 24knots in the
Gulf of Guinea during dry (November-April) and wet (May-October) season is 2495.6KN
and 2518.3KN respectively and these values will reduce to 1006.1KN and 1015.7KN
respectively when running at a speed of 15Knot or increase to a high of 2913.6KN and
2939.9KN respectively when running at a speed of 26 Knots in the Gulf of Guinea.
The ROPAX vessel encounters an increase of 22.7KN in her bare hull resistance and also an
increase of 280KW in her required effective power during wet season relative to dry season
when running at the same speed of 24 Knots.
The MATLAB program developed in this research could be readily used to conduct
preliminary bare hull resistance evaluation of similar vessels.

John et al. World Journal of Engineering Research and Technology
www.wjert.org
422
4.2 Recommendations
The following recommendations are made for optimal performance and operation of the
BRODOSPLIT ROPAX Vessel with delivered power of 38000KW in the Gulf of Guinea at
any season of the year and also for anyone willing to further on this research.
1. For economic and optimal performance implications, the maximum speed of operation of
the ROPAX should be in the range of 20Knots for both dry season (November-April) and
wet season (May-October) in the Gulf of Guinea.
2. To operate at a speed greater than 20 Knots in the Gulf of Guinea, the delivered power of
the vessel should be increased.
3. For further research, the resistance of the ROPAX vessel due to air, appendages, fouling
and other hydrodynamic factors (waves) should be considered.
4. The algorithm and codes should also be made more flexible with the use of other
programming languages.
REFERENCE
1. Charles O.O. (1999) ―Estimation of the Bare Hull Resistance of an Ocean Going Ship; Case
Study of 2500 Dwt Tanker‖, Final Year Marine Engineering Project, Faculty of Engineering
Rivers State University of Science and Technology, Port Harcourt, Nigeria.
2. Egberipou T P (2000) ―Application Of Ship Resistance Theories To The Design Of Full Hull
Forms‖. Final Year Marine Engineering Project, Faculty of Engineering, Rivers State University
of Science and Technology, Port Harcourt. Nigeria.
3. Harvald S.A. (1983) ―Resistance and Propulsion of Ships‖, Wiley, 1983.
4. Journee J M J (1976) ―Motion, Resistance and Propulsion of Ship in Regular Head Waves‖, Delft
University of Technology, Report 0428.
5. Marine Mega Store Limited (2011) Shipyard BRODOSPLIT Project No.: 987D
(https://www.brodosplit.hr) accessed on 24/06/2017.
6. Marine-Insight (2017) what are Ro-Ro Ships, https://www.marininsight.com/types-of-ships/what-
are-ro-ro-ships (Retrieved 26th January, 2017).
7. Mathworks (2017) Mathworks: Retrieved 2017, January 26 from:
https://www.mathworks.com/matlabcentral.
8. Molland F., Turnock S.R., & Hudson D.A. (2011) ―Ship Resistance and Propulsion‖ 2nd
Edition.
9. Narcik R (2010) ―Hull Resistance‖,
https://www.neely-chaulk.com/narciki/Hull_Resistance (Retrieved 26 December, 2016).
10. Nigerian Institute of Oceanography and Marine Research Lagos (2017): Technical Paper No.59.