Embed Size (px)
Citation preview
www.wjert.org
Chillal et al. World Journal of Engineering Research and Technology
270
HOT SPOT STRESS ASSESSMENT AT FILLET WELDED JOINT
USING DIFFERENT FINITE ELEMENT WELD MODELING
TECHNIQUES AND ITS VALIDATION
*Rahul Chillal1 and Nitin Pagar
2
1PG Student, Mechanical Dept., RMD Sinhgad School of Engineering, Pune University,
Pune.
2Asst Professor, Mechanical Dept., RMD Sinhgad School of Engineering, Pune University,
Pune.
Article Received on 10/08/2016 Article Revised on 01/09/2016 Article Accepted on 20/09/2016
ABSTRACT
Welded structures like compressor structure are mostly subjected to
static loads as they support the compressor and its mountings. Stresses
at hot spot (weld toe) are very important to ensure structural integrity
and safety. Structural hot spot stress approach is preferred in this paper
for stress analysis of weld region due to its accuracy and simplicity.
Due to complexity, Finite element analysis of welded connections has become difficult. For
representation of local stress distribution around weld and welded joint stiffness, accurate
weld modeling technique along with structural stress calculation methods needed. This
methodology should be accurate with minimum modeling and computation efforts. Fillet
welded joints are studied in this paper as it is widely used in structures. Various weld
modeling techniques with shell elements are studied. The structural hot spot stresses at weld
toe are calculated using extrapolation method. The experimental testing is performed using
strain gauges and FEA results are validated. From analysis of FEA and experimental results a
modeling technique is proposed which is accurate with minimum modeling efforts. Increased
thickness model is an effective weld modeling technique for fillet welded joint.
KEYWORDS: Welded fillet joints, structural hot spot stress, weld modeling techniques,
strain gauges, experimental stress analysis.
*Corresponding Author
Rahul Chillal
PG Student, Mechanical
Dept, RMD Sinhgad
School of Engineering,
Pune University, Pune.
wjert, 2016, Vol. 2, Issue 5, 270 -290
World Journal of Engineering Research and Technology
WJERT
www.wjert.org
ISSN 2454-695X Original Article
SJIF Impact Factor: 3.419
www.wjert.org
Chillal et al. World Journal of Engineering Research and Technology
271
INTRODUCTION
Compressor structure is a cage structure, generally manufactured by combinations standard
tube sections, bended C sections and plates. Its purpose is to provide safety to the
components which are mounted inside it. Compressor and its accessories are mounted inside
this Structure; hence it is called as "Compressor Structure". Fillet welded connections are
mostly used in fabrication of Compressor structure. Compressor structure is subjected to
different loads due to running conditions, transportation and environmental loading (wind and
seismic). These loads are generally considered as a static during design and analysis phase.
These loads can cause very high stresses on structure, especially in region of weld
connections. So, strength analysis is required to be done in design phase for strength
verification as per standard codes. This strength analysis in design phase can be possible by
Finite element analysis.
Routine Finite Element analysis for different weld connections has been facing the challenges
due to its complexity. To represent joint stiffness and accurate local stress distribution around
weld, suitable modeling technique is needed. When weld connections are modeled without
considering Finite Element analysis, high stresses are observed near connections. If stresses
predicted in weld region are less than actual, it will be risky to rely on these estimations. If
stresses are higher than actual, it will lead to overdesign. So, the motivation of this study is to
find an effective, optimized and economical Finite Element modeling technique which can
predict stresses in fillet weld connections more realistically. There are four common stress
assessment methods for fabricated structures. These methods may be mainly categorized in
two groups: the global and local methods. The simplest and most common method is nominal
stress method (global). Local methods are categorized like effective notch stress method, the
crack propagation approach and hot spot method. Out of these methods, hot spot stress
method is selected considering its advantages over other methods in terms of accuracy and
simplicity. Accuracy of nominal stress method is less for complex structures like compressor
frames. Notch stress is more accurate than hot spot approach, but it is very complex,
uneconomical. There are various stress measurement methods for Structural hot spot
approach like Surface Stress extrapolation and nodal force method. So another objective
behind the study is to find effective and economical hot spot stress calculation method.[2]
www.wjert.org
Chillal et al. World Journal of Engineering Research and Technology
272
LITERATURE REVIEW
[1] Chattopadhyay, G. Glinka, R. Formas.
The method proposed by Glinka and others model stiffness and geometry of weld in shell
modeling. Glinka model suggests placing inclined shell at some distance before the actual toe
so that error in stresses due to shell intersection can be avoided at toe.
[2] International Institute of Welding standard IIW-1823-07, 2009.
This standard explains various stress assessment theories foe welded components. IIW
mentioned surface stress extrapolation method for structural hot spot stress calculation.
[3] British Standard BS-7608:2014, 2014.
The BS 7608:2014 standard gives two methods for weld modeling. Inclined shell method
joins the toe points at weld by shell elements. Another method suggested by BS 7608:2014 is
increased thickness approach where thickness of elements at weld is increased by throat
thickness.
[4] AWS D1.1:2000, 17th edition, 1999.
AWS D1.1 standard gives guidelines for specimen.
[5] Wood J.
In NAFEMS benchmark study, J. Wood proposed two other modeling approaches. In first
approach the base plate shells are joined without modeling weld region. Second approach
models the weld profile and base plates with solid elements.
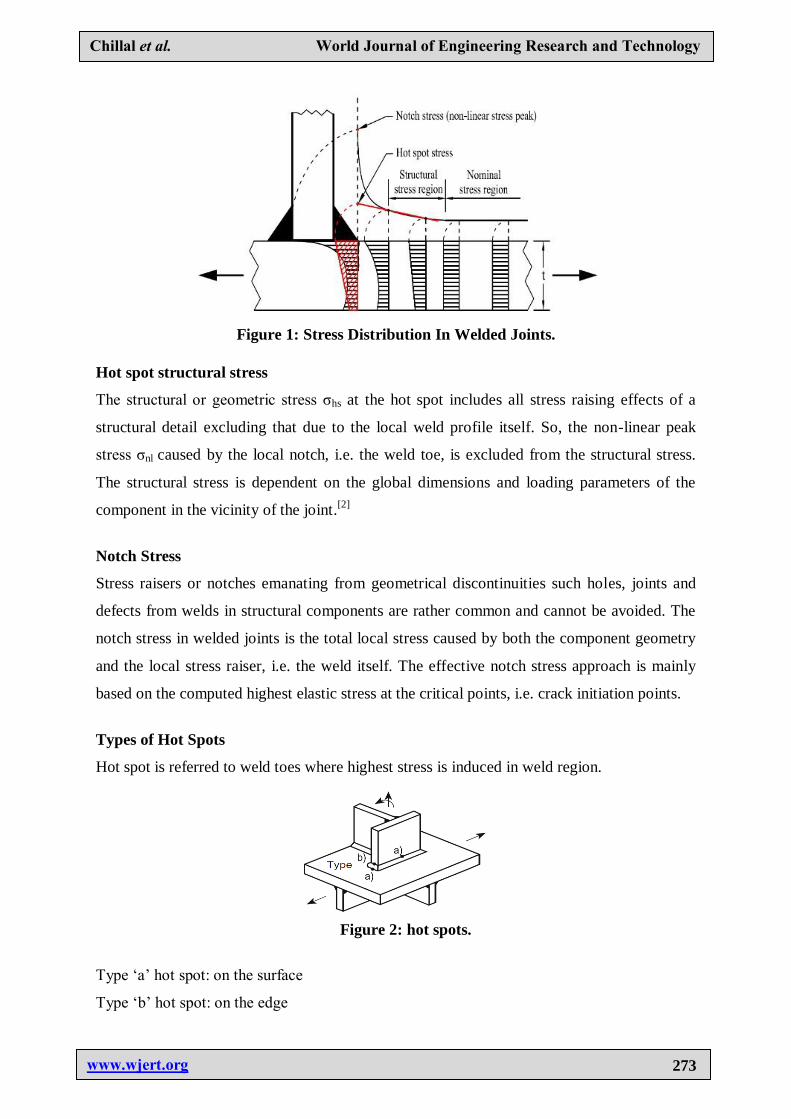
STRUCTURAL HOT SPOT STRESS
A. Stress distribution in welded joints
As we move away from the weld toe, different types of stresses become dominant. There are
mainly three types of stresses namely Nominal Stress, Hot Spot Stress and Notch Stress.
These three stresses can be explained in brief as below.
Nominal Stress
The nominal stress approach is the simplest and the most common applied method for
estimating the stresses of steel structures. This method is mainly based on the average stress
in the studied cross section considering the overall linear elastic beam behavior. The local
stress raising effects of the welds and the attached plates are disregarded in the stress
calculations.
www.wjert.org
Chillal et al. World Journal of Engineering Research and Technology
273
Figure 1: Stress Distribution In Welded Joints.
Hot spot structural stress
The structural or geometric stress σhs at the hot spot includes all stress raising effects of a
structural detail excluding that due to the local weld profile itself. So, the non-linear peak
stress σnl caused by the local notch, i.e. the weld toe, is excluded from the structural stress.
The structural stress is dependent on the global dimensions and loading parameters of the
component in the vicinity of the joint.[2]
Notch Stress
Stress raisers or notches emanating from geometrical discontinuities such holes, joints and
defects from welds in structural components are rather common and cannot be avoided. The
notch stress in welded joints is the total local stress caused by both the component geometry
and the local stress raiser, i.e. the weld itself. The effective notch stress approach is mainly
based on the computed highest elastic stress at the critical points, i.e. crack initiation points.
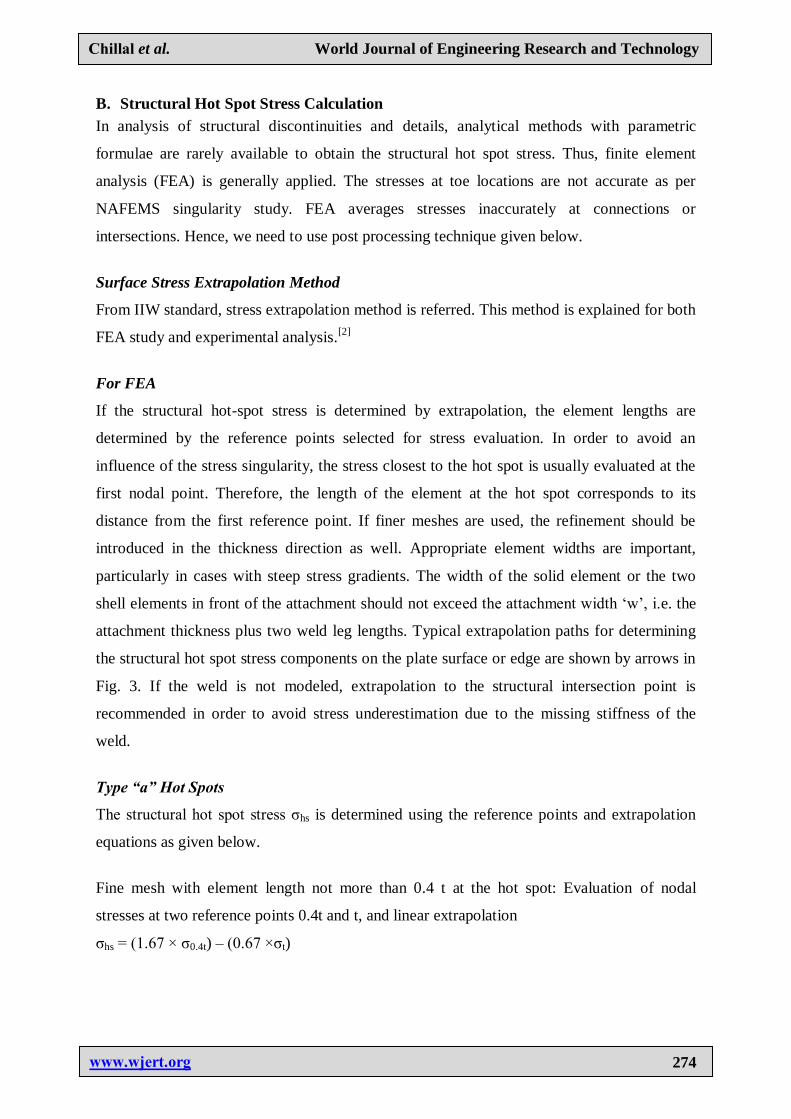
Types of Hot Spots
Hot spot is referred to weld toes where highest stress is induced in weld region.
Figure 2: hot spots.
Type „a‟ hot spot: on the surface
Type „b‟ hot spot: on the edge
www.wjert.org
Chillal et al. World Journal of Engineering Research and Technology
274
B. Structural Hot Spot Stress Calculation
In analysis of structural discontinuities and details, analytical methods with parametric
formulae are rarely available to obtain the structural hot spot stress. Thus, finite element
analysis (FEA) is generally applied. The stresses at toe locations are not accurate as per
NAFEMS singularity study. FEA averages stresses inaccurately at connections or
intersections. Hence, we need to use post processing technique given below.
Surface Stress Extrapolation Method
From IIW standard, stress extrapolation method is referred. This method is explained for both
FEA study and experimental analysis.[2]
For FEA
If the structural hot-spot stress is determined by extrapolation, the element lengths are
determined by the reference points selected for stress evaluation. In order to avoid an
influence of the stress singularity, the stress closest to the hot spot is usually evaluated at the
first nodal point. Therefore, the length of the element at the hot spot corresponds to its
distance from the first reference point. If finer meshes are used, the refinement should be
introduced in the thickness direction as well. Appropriate element widths are important,
particularly in cases with steep stress gradients. The width of the solid element or the two
shell elements in front of the attachment should not exceed the attachment width „w‟, i.e. the
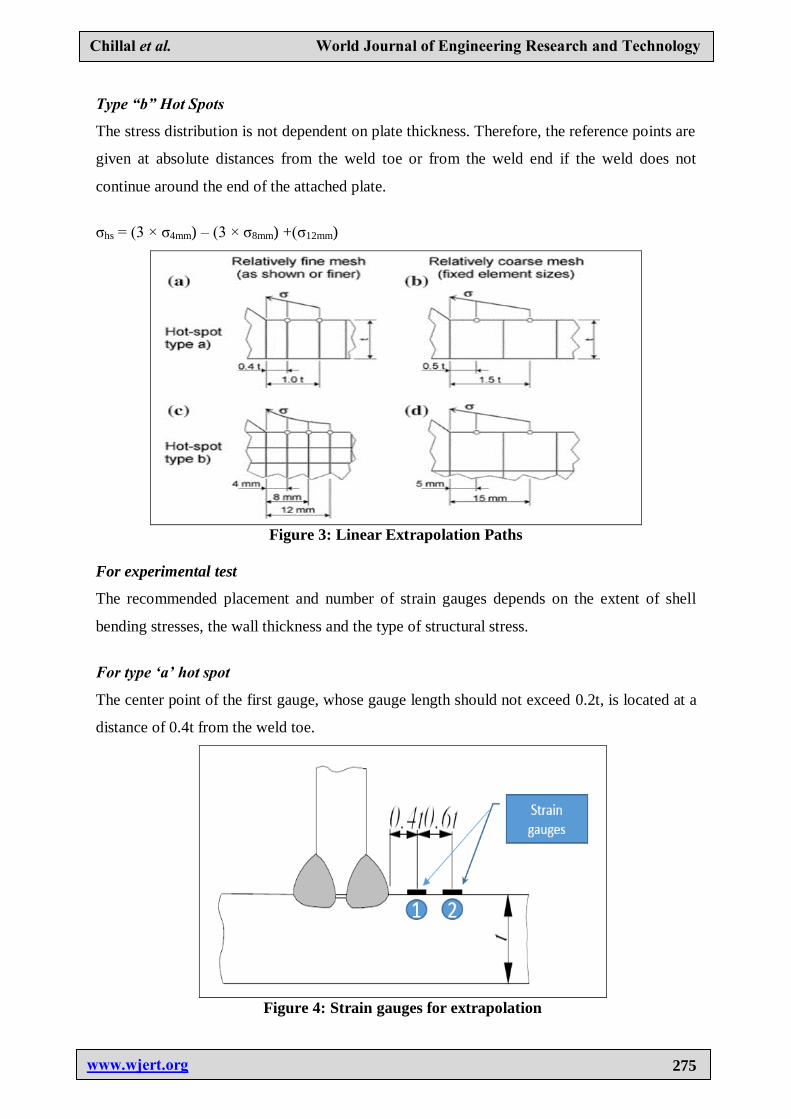
attachment thickness plus two weld leg lengths. Typical extrapolation paths for determining
the structural hot spot stress components on the plate surface or edge are shown by arrows in
Fig. 3. If the weld is not modeled, extrapolation to the structural intersection point is
recommended in order to avoid stress underestimation due to the missing stiffness of the
weld.
Type “a” Hot Spots
The structural hot spot stress σhs is determined using the reference points and extrapolation
equations as given below.
Fine mesh with element length not more than 0.4 t at the hot spot: Evaluation of nodal
stresses at two reference points 0.4t and t, and linear extrapolation
σhs = (1.67 × σ0.4t) – (0.67 ×σt)
www.wjert.org
Chillal et al. World Journal of Engineering Research and Technology
275
Type “b” Hot Spots
The stress distribution is not dependent on plate thickness. Therefore, the reference points are
given at absolute distances from the weld toe or from the weld end if the weld does not
continue around the end of the attached plate.
σhs = (3 × σ4mm) – (3 × σ8mm) +(σ12mm)
Figure 3: Linear Extrapolation Paths
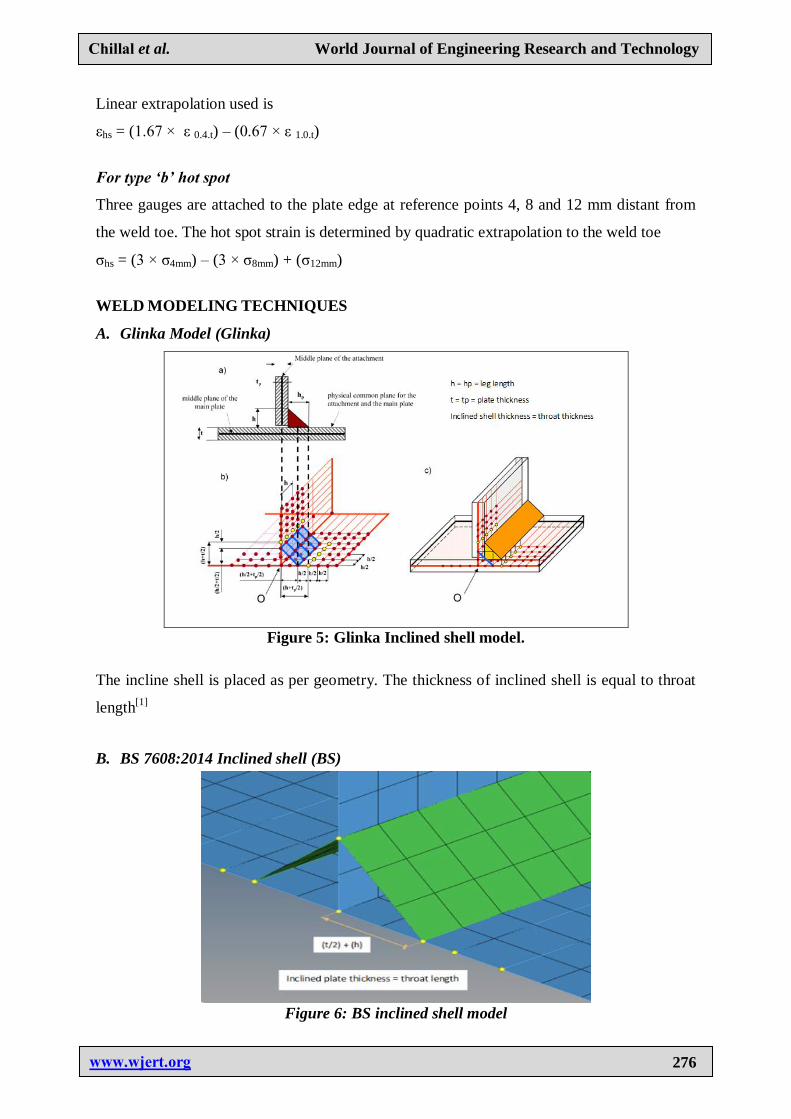
For experimental test
The recommended placement and number of strain gauges depends on the extent of shell
bending stresses, the wall thickness and the type of structural stress.
For type „a‟ hot spot
The center point of the first gauge, whose gauge length should not exceed 0.2t, is located at a
distance of 0.4t from the weld toe.
Figure 4: Strain gauges for extrapolation
www.wjert.org
Chillal et al. World Journal of Engineering Research and Technology
276
Linear extrapolation used is
εhs = (1.67 × ε 0.4.t) – (0.67 × ε 1.0.t)
For type „b‟ hot spot
Three gauges are attached to the plate edge at reference points 4, 8 and 12 mm distant from
the weld toe. The hot spot strain is determined by quadratic extrapolation to the weld toe
σhs = (3 × σ4mm) – (3 × σ8mm) + (σ12mm)
WELD MODELING TECHNIQUES
A. Glinka Model (Glinka)
Figure 5: Glinka Inclined shell model.
The incline shell is placed as per geometry. The thickness of inclined shell is equal to throat
length[1]
B. BS 7608:2014 Inclined shell (BS)
Figure 6: BS inclined shell model
www.wjert.org
Chillal et al. World Journal of Engineering Research and Technology
277
Inclined shell is placed by joining toes. The thickness of inclined shell is equal to throat
length.[3]
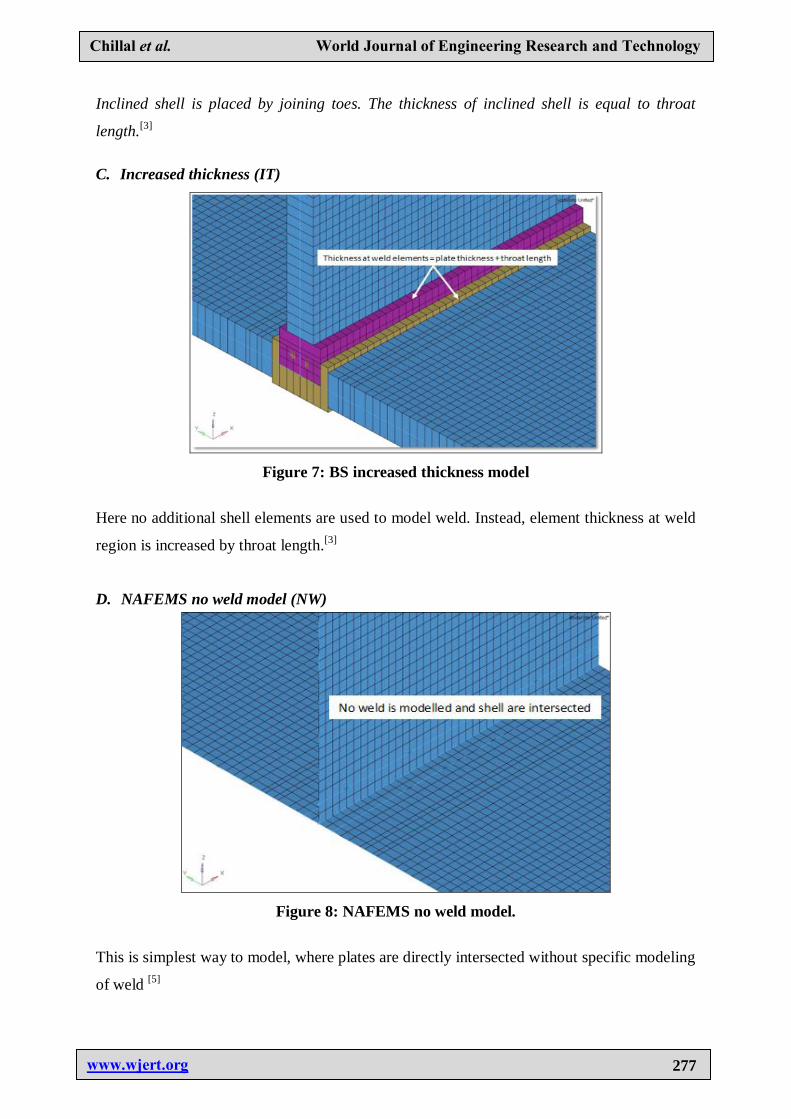
C. Increased thickness (IT)
Figure 7: BS increased thickness model
Here no additional shell elements are used to model weld. Instead, element thickness at weld
region is increased by throat length.[3]
D. NAFEMS no weld model (NW)
Figure 8: NAFEMS no weld model.
This is simplest way to model, where plates are directly intersected without specific modeling
of weld [5]
www.wjert.org
Chillal et al. World Journal of Engineering Research and Technology
278
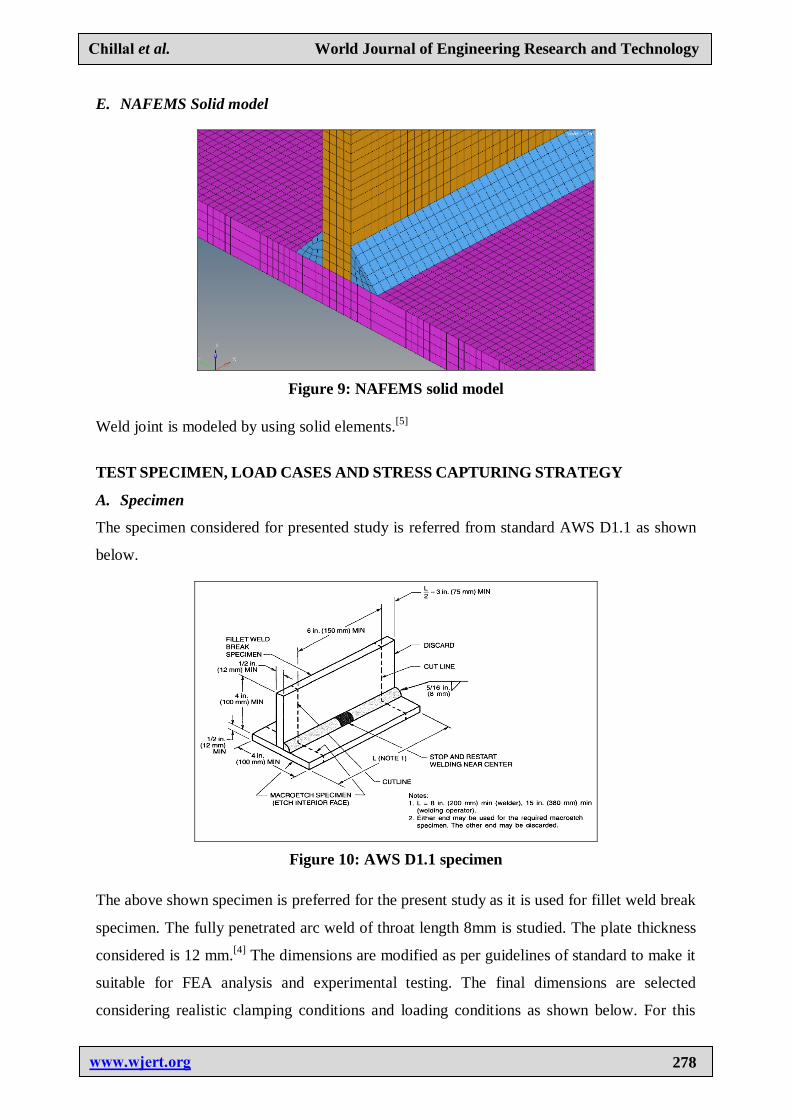
E. NAFEMS Solid model
Figure 9: NAFEMS solid model
Weld joint is modeled by using solid elements.[5]
TEST SPECIMEN, LOAD CASES AND STRESS CAPTURING STRATEGY
A. Specimen
The specimen considered for presented study is referred from standard AWS D1.1 as shown
below.
Figure 10: AWS D1.1 specimen
The above shown specimen is preferred for the present study as it is used for fillet weld break
specimen. The fully penetrated arc weld of throat length 8mm is studied. The plate thickness
considered is 12 mm.[4]
The dimensions are modified as per guidelines of standard to make it
suitable for FEA analysis and experimental testing. The final dimensions are selected
considering realistic clamping conditions and loading conditions as shown below. For this
www.wjert.org
Chillal et al. World Journal of Engineering Research and Technology
279
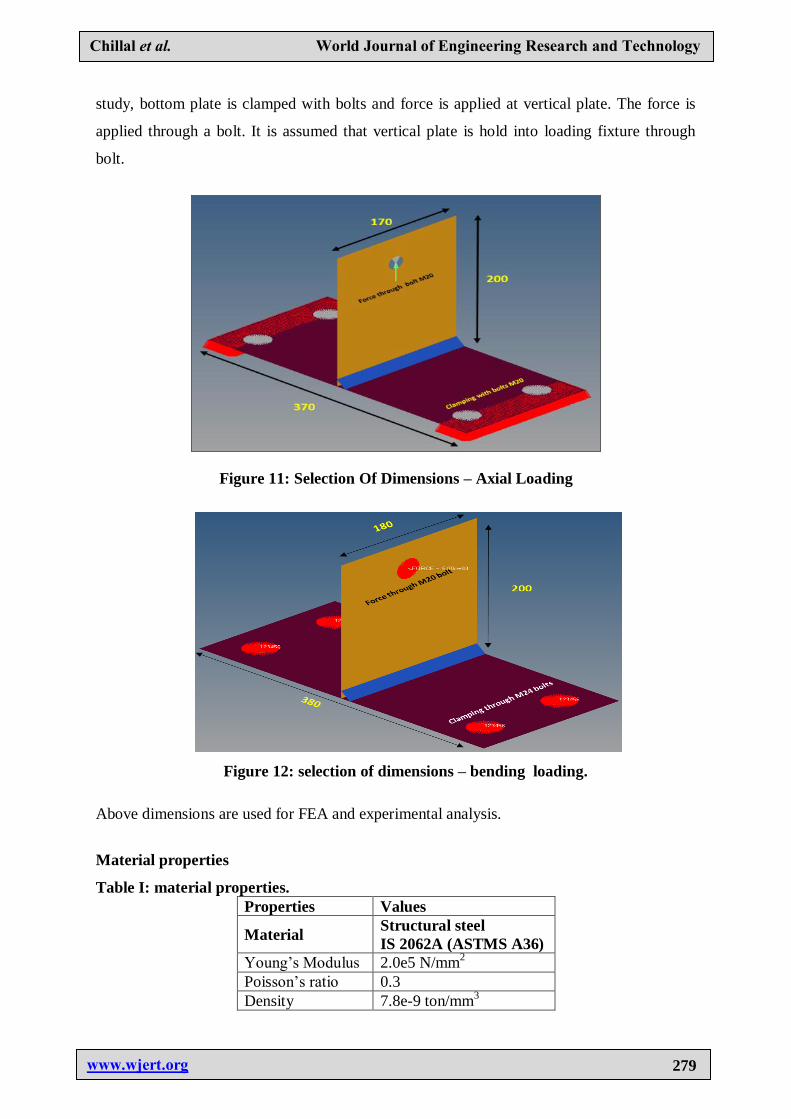
study, bottom plate is clamped with bolts and force is applied at vertical plate. The force is
applied through a bolt. It is assumed that vertical plate is hold into loading fixture through
bolt.
Figure 11: Selection Of Dimensions – Axial Loading
Figure 12: selection of dimensions – bending loading.
Above dimensions are used for FEA and experimental analysis.
Material properties
Table I: material properties.
Properties Values
Material Structural steel
IS 2062A (ASTMS A36)
Young‟s Modulus 2.0e5 N/mm2
Poisson‟s ratio 0.3
Density 7.8e-9 ton/mm3
www.wjert.org
Chillal et al. World Journal of Engineering Research and Technology
280
B. Load cases
The study is performed for two load cases viz., axial tensile loading and bending loading for
vertical plate whereas bottom plate is fixed with proper constraints.
Axial tensile loading
In this load case, the vertical plate is pulled axially through M20 bolt. Distributed load is
applied over 60 degrees of bolt periphery. This arrangement is done considering the contact
area of bolt and plate. 20KN load is applied.
Bending loading
In this load case, bending load is applied perpendicular to vertical plate surface through M20
bolt. The force at bolt is distributed equally over bolt head area.
C. Stress capturing strategy
As per IIW recommendations for type „a‟ hot spot, Stress capturing strategy is given below:
For axial load case, stress is captured at 0.4t and t distance
For Bending load case, stress is captured at 0.4t and t distance from toe on „vertical plate‟.
5KN load is applied.
Number of bolts, their position and plate dimension are decided such that stress concentration
of bolts should not affect the interested area near weld.
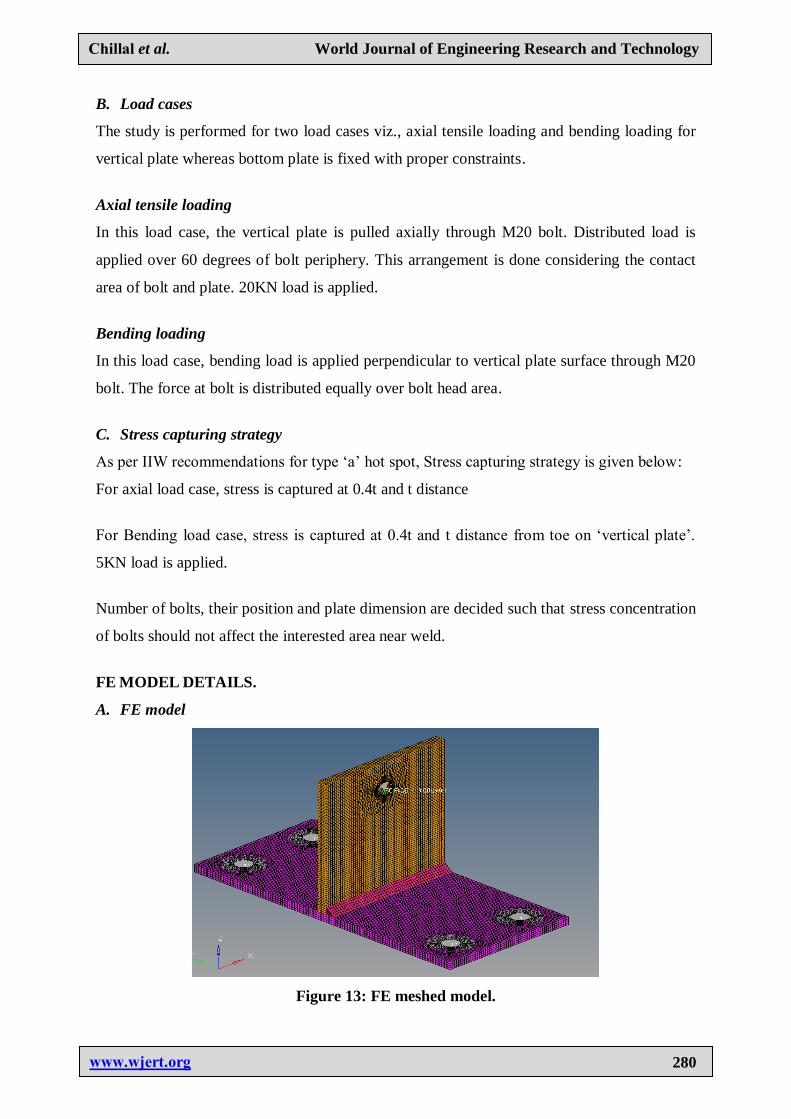
FE MODEL DETAILS.
A. FE model
Figure 13: FE meshed model.
www.wjert.org
Chillal et al. World Journal of Engineering Research and Technology
281
Solid FE model is shown here. Various other models are meshed using different weld
modeling techniques.
B. IIW recommendations for mesh size.
Table II: IIW recommendations for mesh size.
Type of
mesh
Element
Size
Extrapolation
Points
Shell ≤ 0.4t × t or
≤ 0.4t × w/2
0.4t and t from
toe
Solid ≤ 0.4t × t or
≤ 0.4t × w/2
0.4t and t from
toe
C. Mesh types and sizes used.
Table III: mesh types and sizes used.
Type of mesh Type of element Element size
Solid HEX8, PENTA6 ≤ 0.4t × t
Shell QUAD4, TRIA3 ≤ 0.4t × t
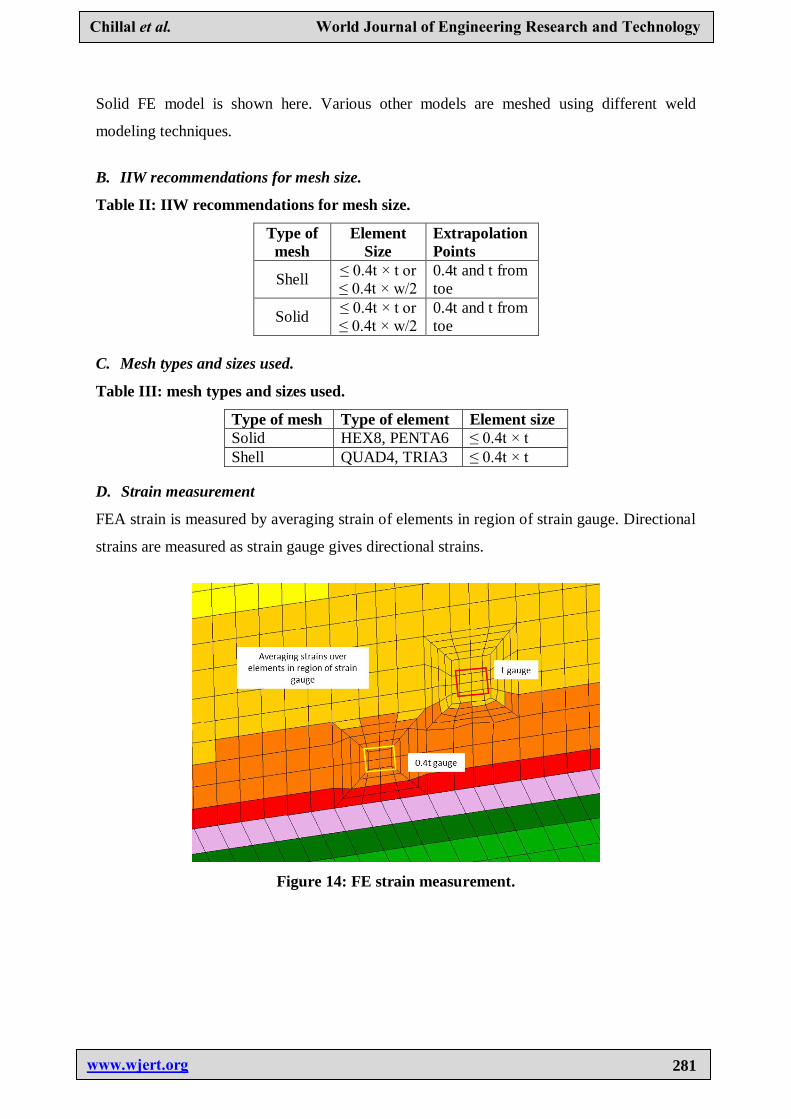
D. Strain measurement
FEA strain is measured by averaging strain of elements in region of strain gauge. Directional
strains are measured as strain gauge gives directional strains.
Figure 14: FE strain measurement.
www.wjert.org
Chillal et al. World Journal of Engineering Research and Technology
282
TEST SPECIMEN AND SETUP
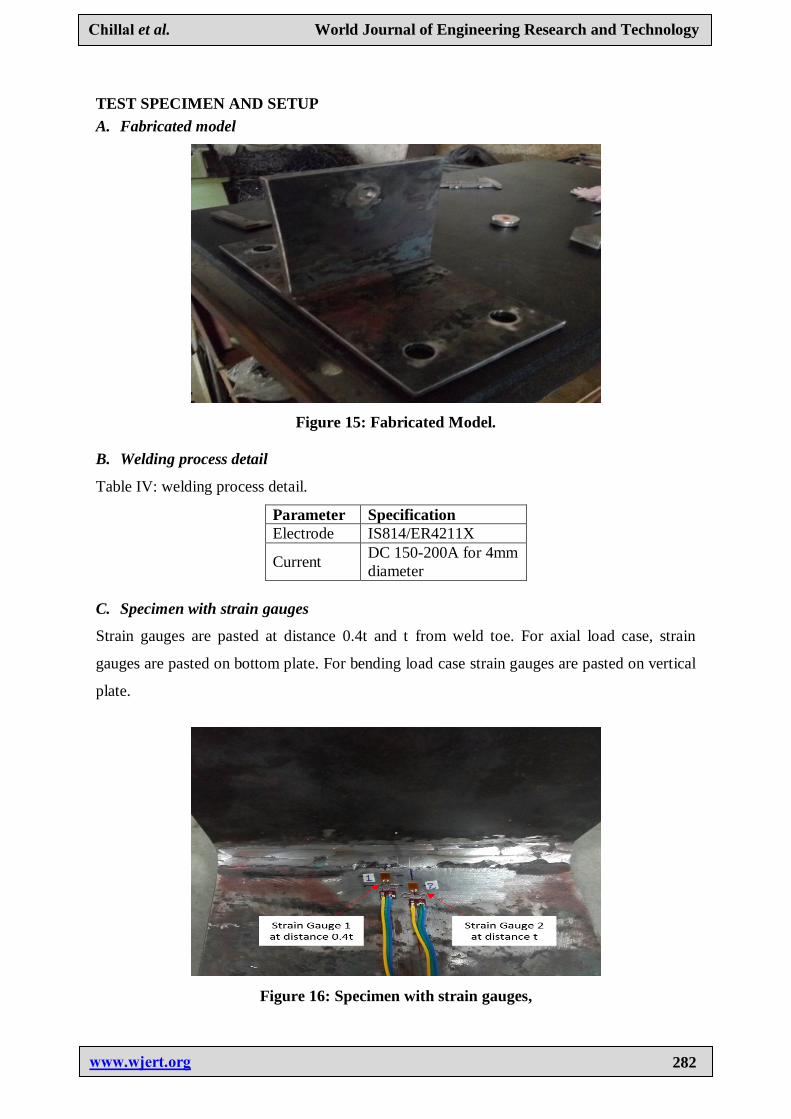
A. Fabricated model
Figure 15: Fabricated Model.
B. Welding process detail
Table IV: welding process detail.
Parameter Specification
Electrode IS814/ER4211X
Current DC 150-200A for 4mm
diameter
C. Specimen with strain gauges
Strain gauges are pasted at distance 0.4t and t from weld toe. For axial load case, strain
gauges are pasted on bottom plate. For bending load case strain gauges are pasted on vertical
plate.
Figure 16: Specimen with strain gauges,
www.wjert.org
Chillal et al. World Journal of Engineering Research and Technology
283
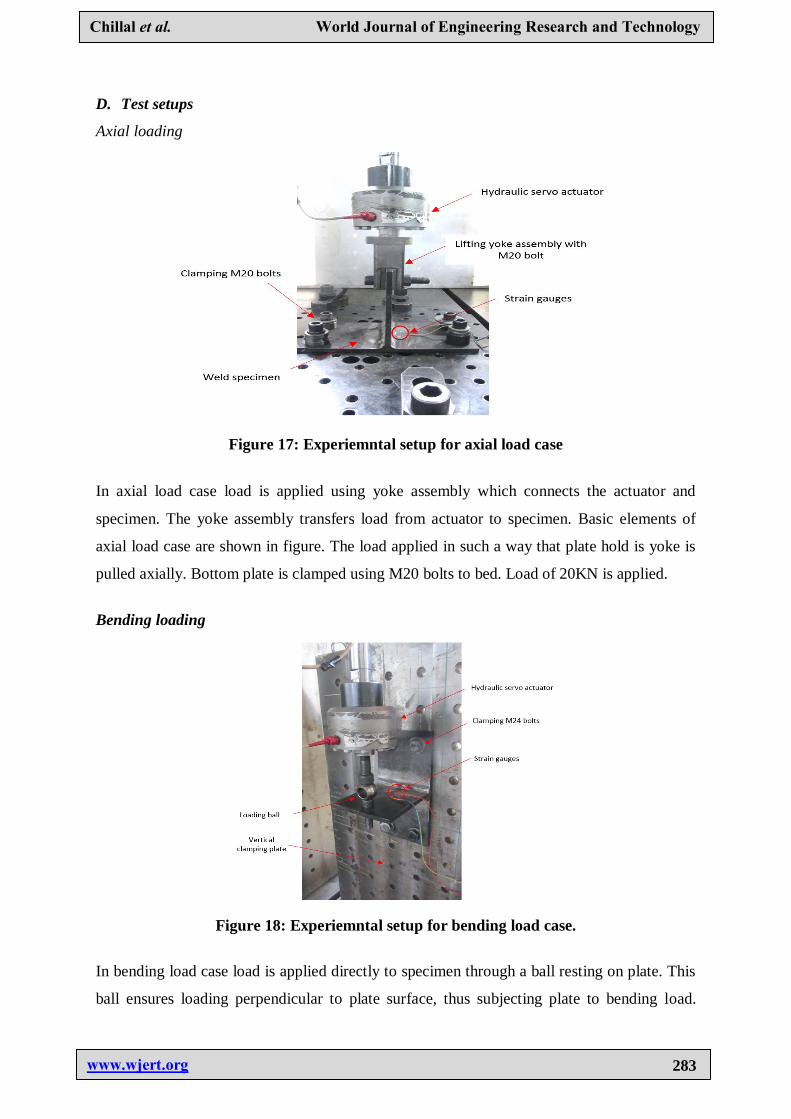
D. Test setups
Axial loading
Figure 17: Experiemntal setup for axial load case
In axial load case load is applied using yoke assembly which connects the actuator and
specimen. The yoke assembly transfers load from actuator to specimen. Basic elements of
axial load case are shown in figure. The load applied in such a way that plate hold is yoke is
pulled axially. Bottom plate is clamped using M20 bolts to bed. Load of 20KN is applied.
Bending loading
Figure 18: Experiemntal setup for bending load case.
In bending load case load is applied directly to specimen through a ball resting on plate. This
ball ensures loading perpendicular to plate surface, thus subjecting plate to bending load.
www.wjert.org
Chillal et al. World Journal of Engineering Research and Technology
284
Basic elements of bending load case are shown in figure. Bottom plate is clamped using M20
bolts to vertical clamping plate. 5KN load is applied.
RESULTS AND ANALYSIS
A. FEA results
FEA results of solid model
For this study, HYPERMESH is used for modeling and meshing. MSC NASTRAN is used as
Solver. By extrapolating stresses in FEA models at 0.4t and t distance from weld toe, hot pot
stress is calculated by extrapolation method.
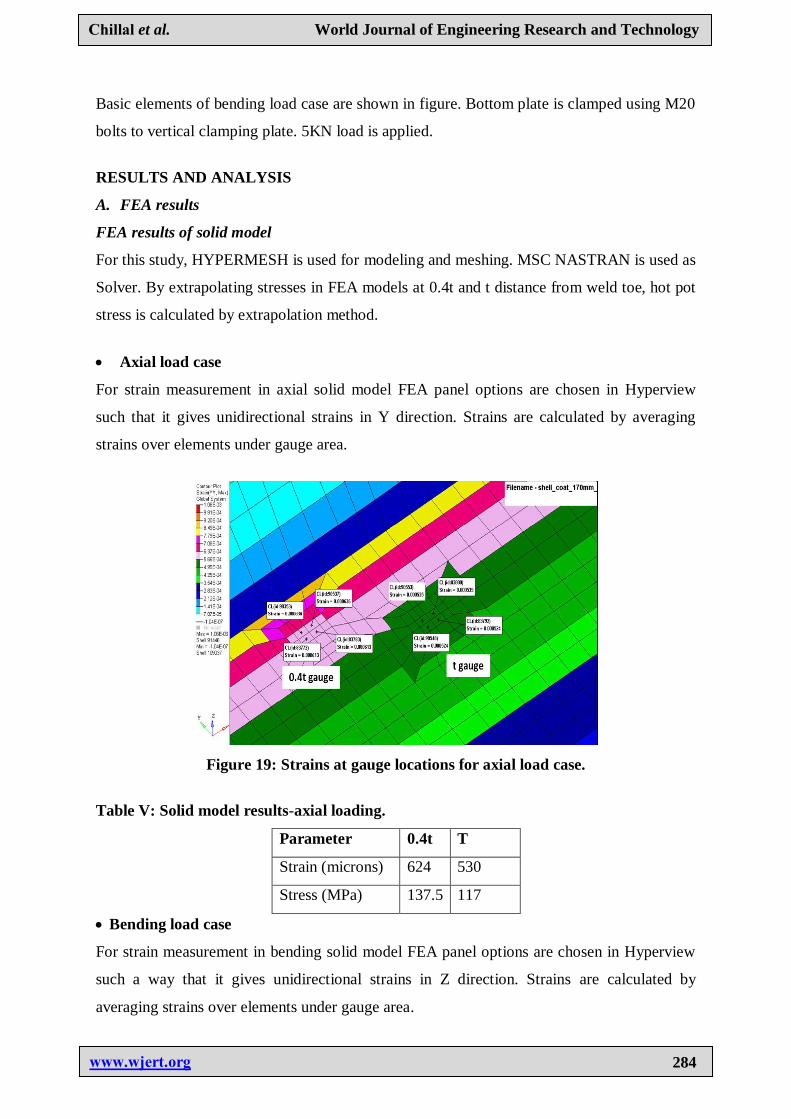
Axial load case
For strain measurement in axial solid model FEA panel options are chosen in Hyperview
such that it gives unidirectional strains in Y direction. Strains are calculated by averaging
strains over elements under gauge area.
Figure 19: Strains at gauge locations for axial load case.
Table V: Solid model results-axial loading.
Parameter 0.4t T
Strain (microns) 624 530
Stress (MPa) 137.5 117
Bending load case
For strain measurement in bending solid model FEA panel options are chosen in Hyperview
such a way that it gives unidirectional strains in Z direction. Strains are calculated by
averaging strains over elements under gauge area.
www.wjert.org
Chillal et al. World Journal of Engineering Research and Technology
285
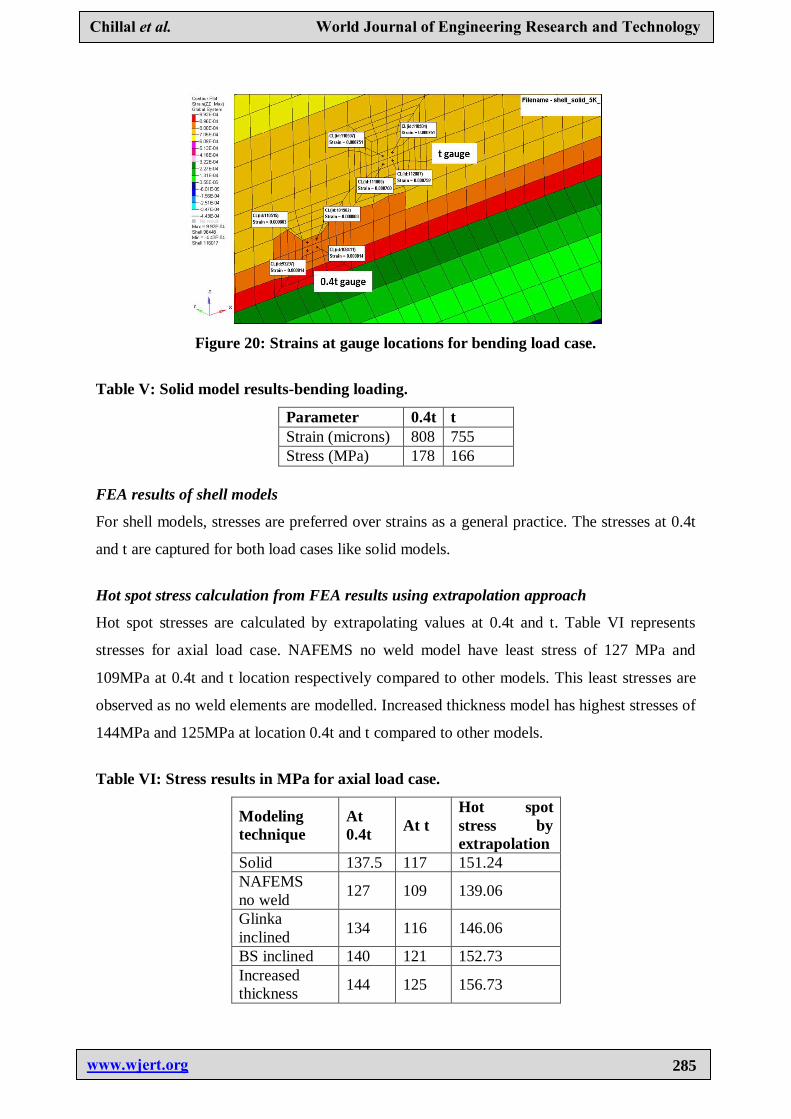
Figure 20: Strains at gauge locations for bending load case.
Table V: Solid model results-bending loading.
Parameter 0.4t t
Strain (microns) 808 755
Stress (MPa) 178 166
FEA results of shell models
For shell models, stresses are preferred over strains as a general practice. The stresses at 0.4t
and t are captured for both load cases like solid models.
Hot spot stress calculation from FEA results using extrapolation approach
Hot spot stresses are calculated by extrapolating values at 0.4t and t. Table VI represents
stresses for axial load case. NAFEMS no weld model have least stress of 127 MPa and
109MPa at 0.4t and t location respectively compared to other models. This least stresses are
observed as no weld elements are modelled. Increased thickness model has highest stresses of
144MPa and 125MPa at location 0.4t and t compared to other models.
Table VI: Stress results in MPa for axial load case.
Modeling
technique
At
0.4t At t
Hot spot
stress by
extrapolation
Solid 137.5 117 151.24
NAFEMS
no weld 127 109 139.06
Glinka
inclined 134 116 146.06
BS inclined 140 121 152.73
Increased
thickness 144 125 156.73
www.wjert.org
Chillal et al. World Journal of Engineering Research and Technology
286
Table VII represents stresses for bending load case. Almost all models give similar
results.
Table VII: Stress results in MPa for bending load case.
Modeling
technique
At
0.4t At t
Hot spot
stress by
extrapolation
Solid 178 166.5 185.71
NAFEMS no weld 173 162 180.37
Glinka inclined 175 164 182.37
BS inclined 177 166 184.37
Increased thickness 178 167 185.37
B. Experimental test results
In experimental testing, strains are captured in the vicinity of weld using unidirectional strain
gauges. Static loads are applied by precise hydraulic-servo actuator. Respective strains
induced with application of loads are captured by strain gauges. Output of strain gauges is in
the form analogue signals. These signals are processed in data acquisition center to calculate
mechanical strain from electric signals. The loads are increased in steps and strains are
recorded in elastic region. The strains are converted to stresses using Hooke‟s law. These
stresses are extrapolated to get hot spot stress as per IIW.
Conversion of strains into stresses
Stress = Young‟s Modulus x Strain
For 1 MPa stress,
Strain = = 0.000005 = 5 micron
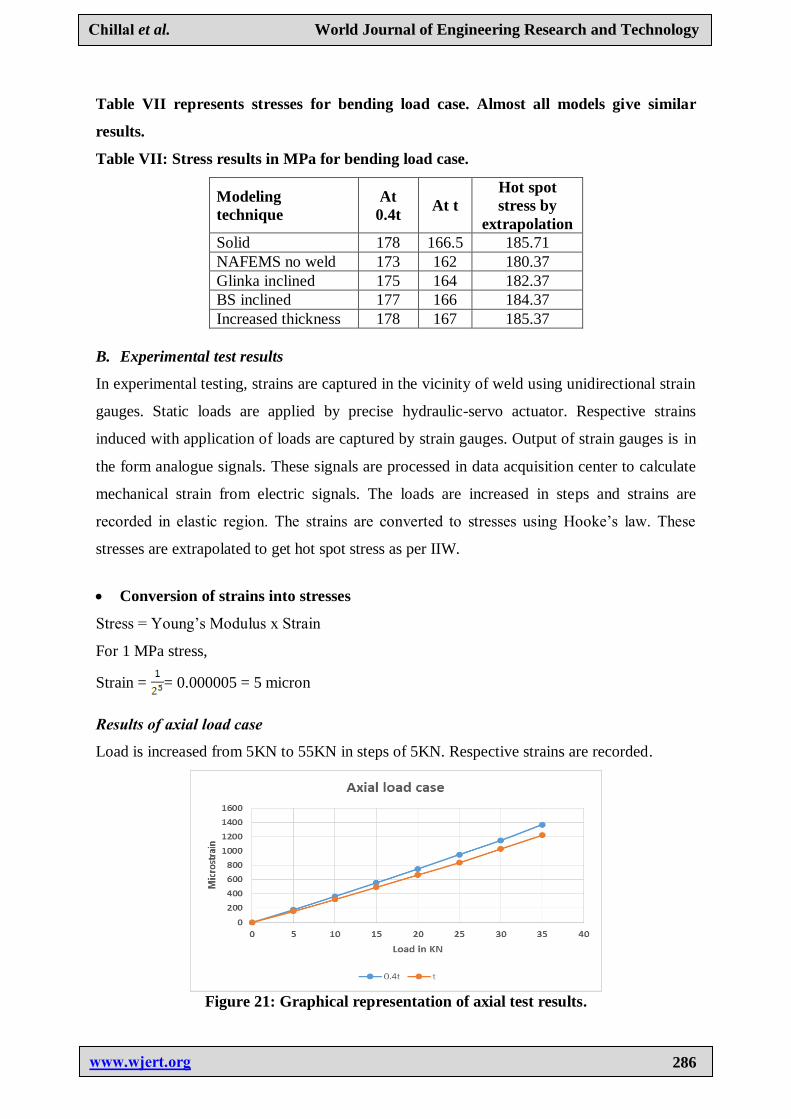
Results of axial load case
Load is increased from 5KN to 55KN in steps of 5KN. Respective strains are recorded.
Figure 21: Graphical representation of axial test results.
www.wjert.org
Chillal et al. World Journal of Engineering Research and Technology
287
Table VIII: Test results at 20KN for validation.
Location Strain in
microns
Stress in
MPa
0.4t 750 150
t 665 133
Hot Spot 806.95 161.39
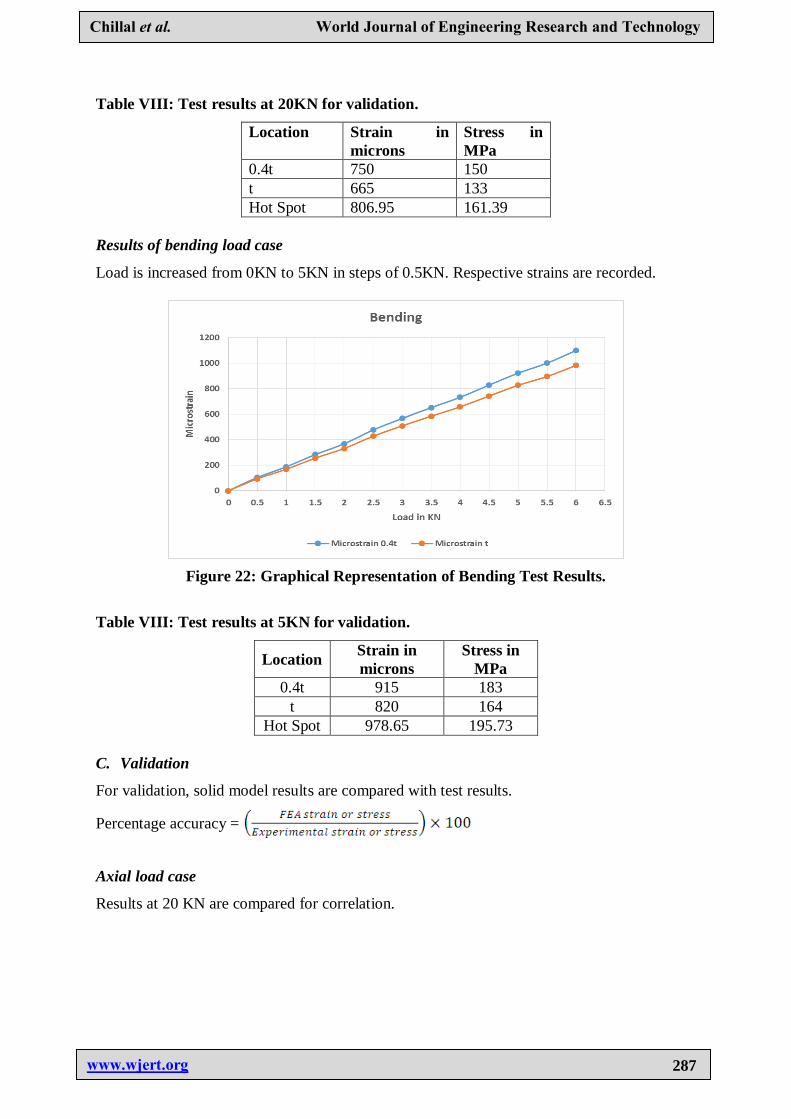
Results of bending load case
Load is increased from 0KN to 5KN in steps of 0.5KN. Respective strains are recorded.
Figure 22: Graphical Representation of Bending Test Results.
Table VIII: Test results at 5KN for validation.
Location Strain in
microns
Stress in
MPa
0.4t 915 183
t 820 164
Hot Spot 978.65 195.73
C. Validation
For validation, solid model results are compared with test results.
Percentage accuracy =
Axial load case
Results at 20 KN are compared for correlation.
www.wjert.org
Chillal et al. World Journal of Engineering Research and Technology
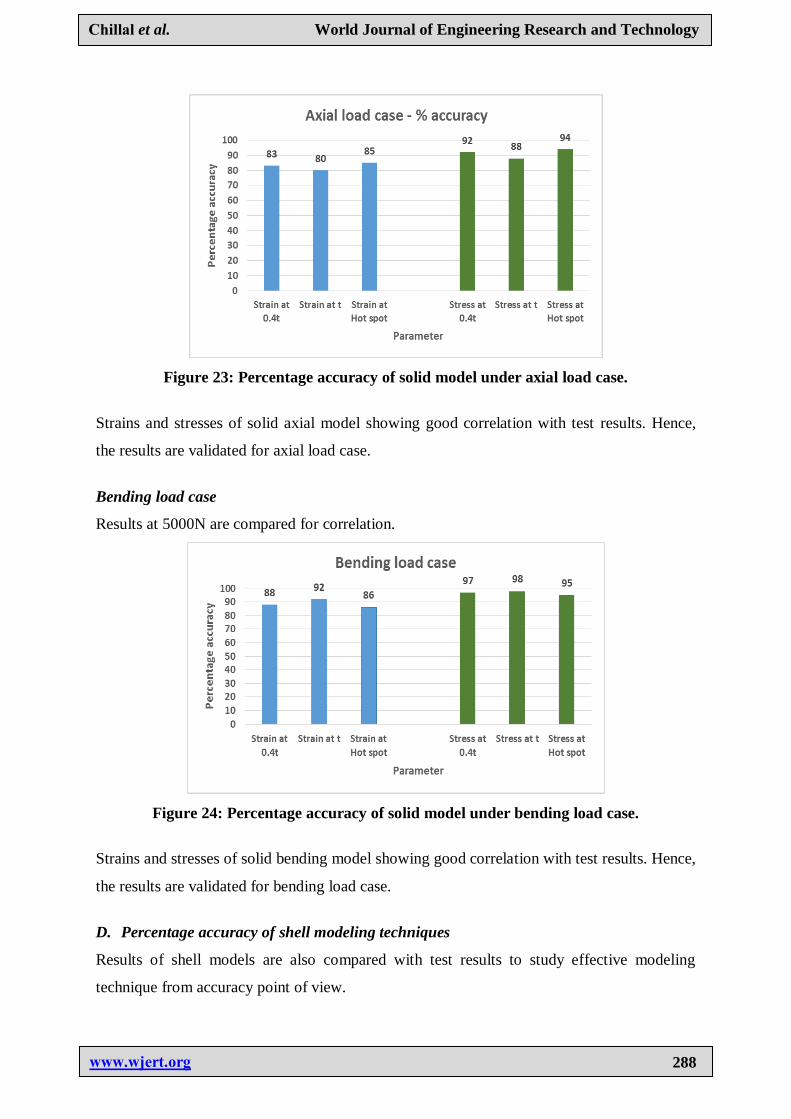
288
Figure 23: Percentage accuracy of solid model under axial load case.
Strains and stresses of solid axial model showing good correlation with test results. Hence,
the results are validated for axial load case.
Bending load case
Results at 5000N are compared for correlation.
Figure 24: Percentage accuracy of solid model under bending load case.
Strains and stresses of solid bending model showing good correlation with test results. Hence,
the results are validated for bending load case.
D. Percentage accuracy of shell modeling techniques
Results of shell models are also compared with test results to study effective modeling
technique from accuracy point of view.
www.wjert.org
Chillal et al. World Journal of Engineering Research and Technology
289
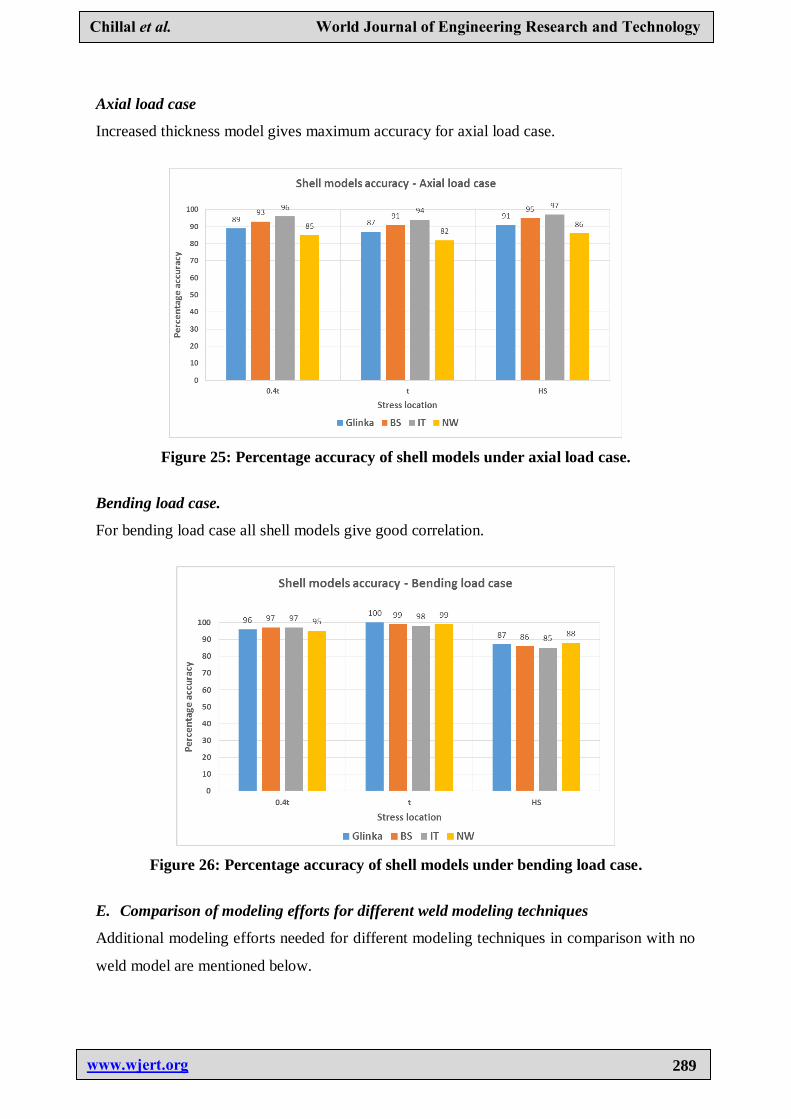
Axial load case
Increased thickness model gives maximum accuracy for axial load case.
Figure 25: Percentage accuracy of shell models under axial load case.
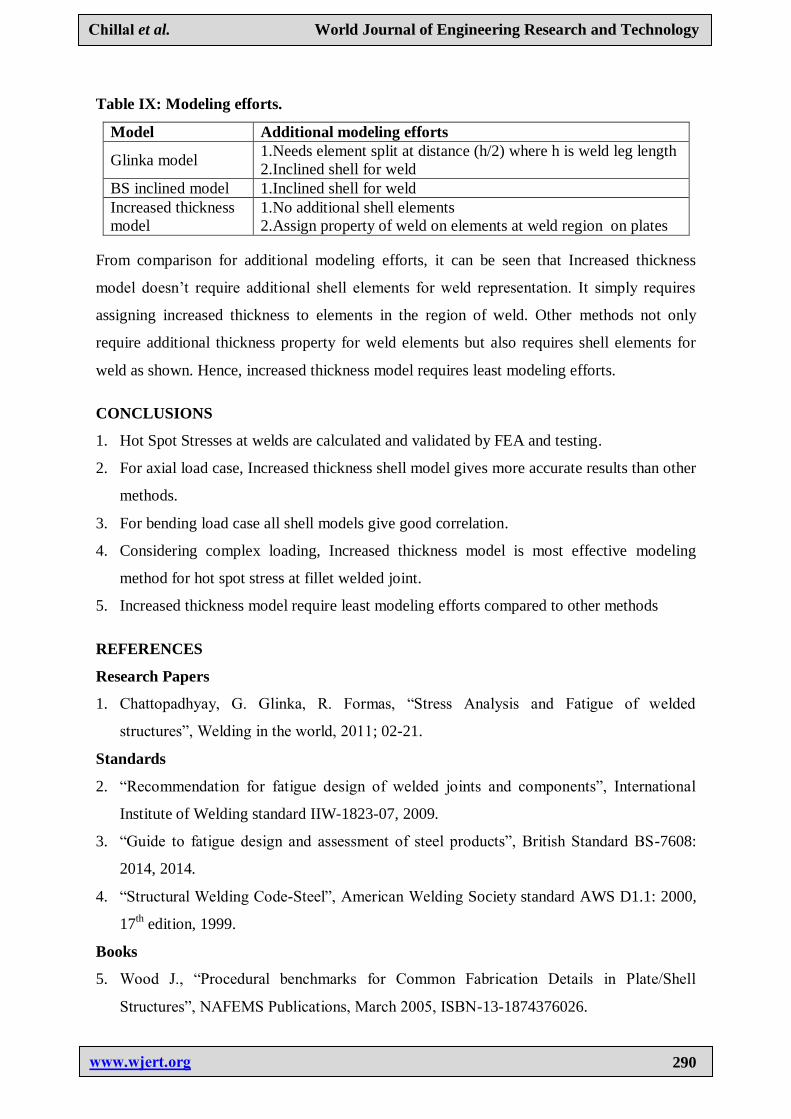
Bending load case.
For bending load case all shell models give good correlation.
Figure 26: Percentage accuracy of shell models under bending load case.
E. Comparison of modeling efforts for different weld modeling techniques
Additional modeling efforts needed for different modeling techniques in comparison with no
weld model are mentioned below.
www.wjert.org
Chillal et al. World Journal of Engineering Research and Technology
290
Table IX: Modeling efforts.
Model Additional modeling efforts
Glinka model 1.Needs element split at distance (h/2) where h is weld leg length
2.Inclined shell for weld
BS inclined model 1.Inclined shell for weld
Increased thickness
model
1.No additional shell elements
2.Assign property of weld on elements at weld region on plates
From comparison for additional modeling efforts, it can be seen that Increased thickness
model doesn‟t require additional shell elements for weld representation. It simply requires
assigning increased thickness to elements in the region of weld. Other methods not only
require additional thickness property for weld elements but also requires shell elements for
weld as shown. Hence, increased thickness model requires least modeling efforts.
CONCLUSIONS
1. Hot Spot Stresses at welds are calculated and validated by FEA and testing.
2. For axial load case, Increased thickness shell model gives more accurate results than other
methods.
3. For bending load case all shell models give good correlation.
4. Considering complex loading, Increased thickness model is most effective modeling
method for hot spot stress at fillet welded joint.
5. Increased thickness model require least modeling efforts compared to other methods
REFERENCES
Research Papers
1. Chattopadhyay, G. Glinka, R. Formas, “Stress Analysis and Fatigue of welded
structures”, Welding in the world, 2011; 02-21.
Standards
2. “Recommendation for fatigue design of welded joints and components”, International
Institute of Welding standard IIW-1823-07, 2009.
3. “Guide to fatigue design and assessment of steel products”, British Standard BS-7608:
2014, 2014.
4. “Structural Welding Code-Steel”, American Welding Society standard AWS D1.1: 2000,
17th edition, 1999.
Books
5. Wood J., “Procedural benchmarks for Common Fabrication Details in Plate/Shell
Structures”, NAFEMS Publications, March 2005, ISBN-13-1874376026.