Embed Size (px)
Citation preview
ANNEX TABLES A1
ANNEX TABLES
Table 1. FDI flows, by region and economy, 2009−2014 . . . . . . . . . . . . . . . . . . . . . . . . . . . . . . . . . . . . . . A3
Table 2. FDI stock, by region and economy, 1990, 2000, 2014 . . . . . . . . . . . . . . . . . . . . . . . . . . . . . . . . A7
Table 3. Value of cross-border M&As, by region/economy of seller/purchaser, 2008−2014 . . . . . . . . . . . . . A11
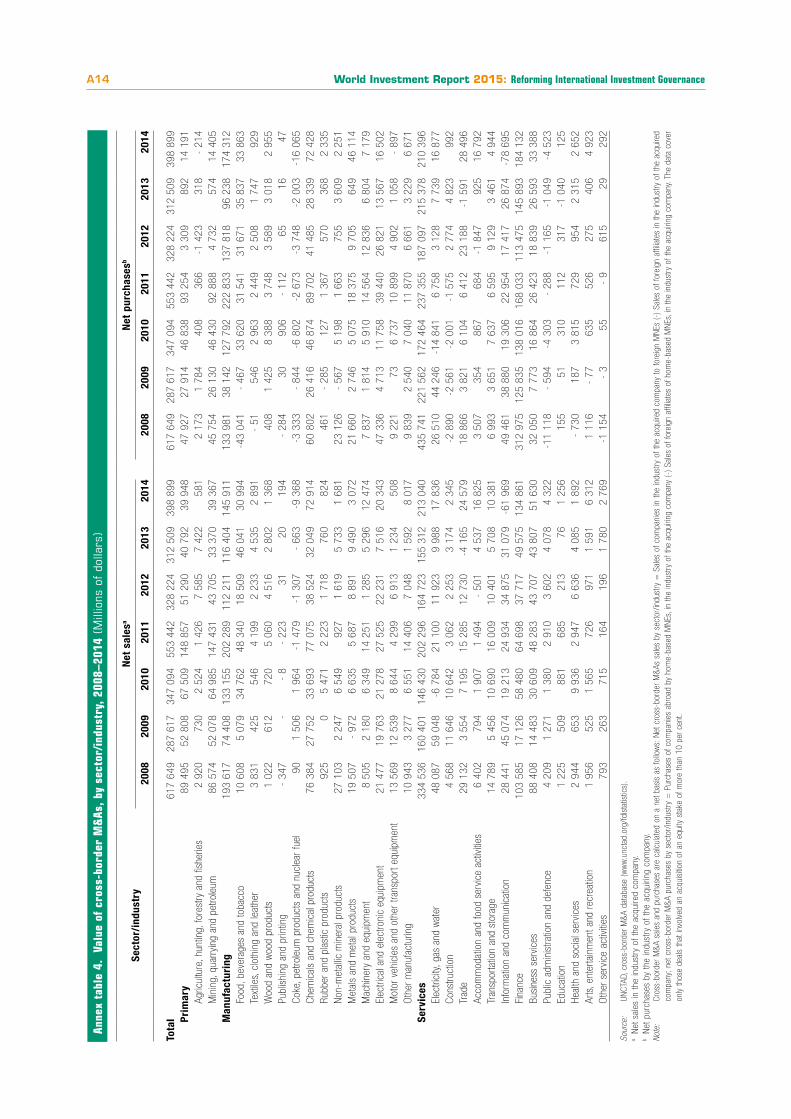
Table 4. Value of cross-border M&As, by sector/industry, 2008−2014 . . . . . . . . . . . . . . . . . . . . . . . . . . A14
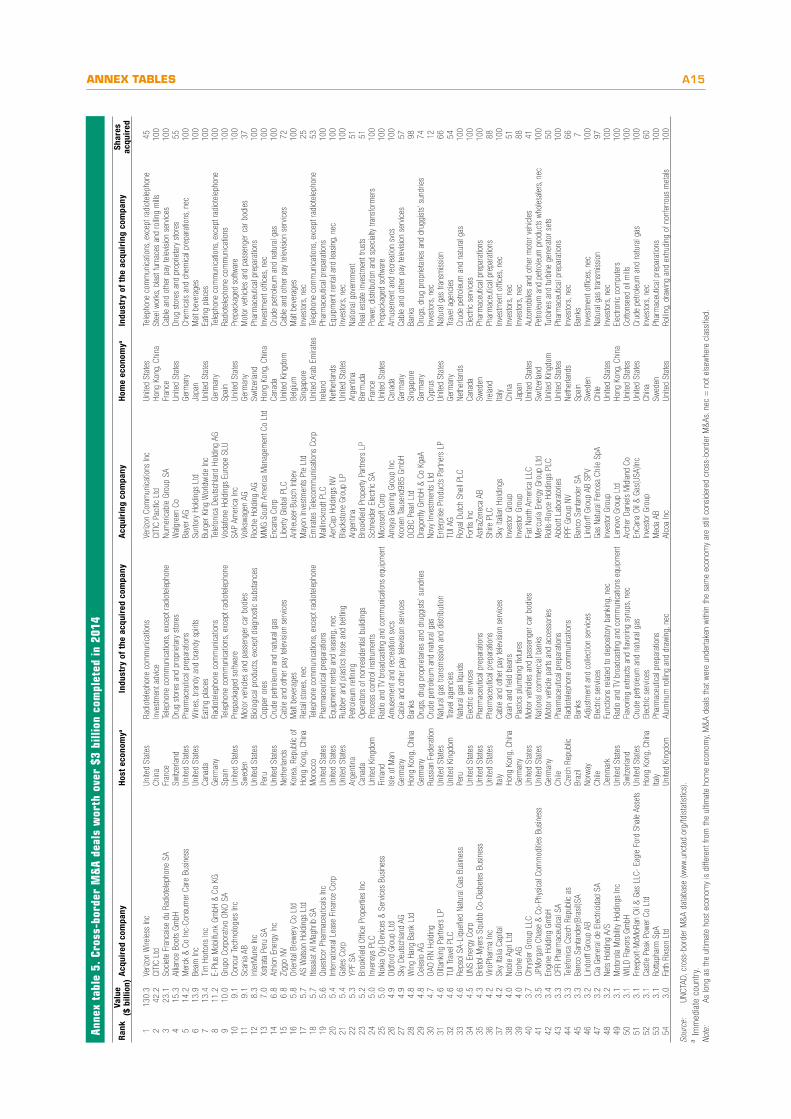
Table 5. Cross-border M&A deals worth over $3 billion completed in 2014 . . . . . . . . . . . . . . . . . . . . . . . A15
Table 6. Value of announced greenfield FDI projects, by source/destination, 2008−2014 . . . . . . . . . . . . . . A16
World Investment Report 2015: Reforming International Investment GovernanceA2
List of annex tables available on the UNCTAD site, www.unctad.org/wir, and on the CD-ROM
1. FDI inflows, by region and economy, 1990–2014
2. FDI outflows, by region and economy, 1990–2014
3. FDI inward stock, by region and economy, 1990, 2000, 2014
4. FDI outward stock, by region and economy, 1990, 2000, 2014
5. FDI inflows as a percentage of gross fixed capital formation, 1990–2014
6. FDI outflows as a percentage of gross fixed capital formation, 1990–2014
7. FDI inward stock as percentage of gross domestic products, by region and economy, 1990–2014
8. FDI outward stock as percentage of gross domestic products, by region and economy, 1990–2014
9. Value of cross-border M&A sales, by region/economy of seller, 1990–2014
10. Value of cross-border M&A purchases, by region/economy of purchaser, 1990–2014
11. Number of cross-border M&A sales, by region/economy of seller, 1990–2014
12. Number of cross-border M&A purchases, by region/economy of purchaser, 1990–2014
13. Value of cross-border M&A sales, by sector/industry, 1990–2014
14. Value of cross-border M&A purchases, by sector/industry, 1990–2014
15. Number of cross-border M&A sales, by sector/industry, 1990–2014
16. Number of cross-border M&A purchases, by sector/industry, 1990–2014
17. Cross-border M&A deals worth over $1 billion completed in 2014
18. Value of announced greenfield FDI projects, by source, 2003–2014
19. Value of announced greenfield FDI projects, by destination, 2003–2014
20. Value of announced greenfield FDI projects, by sector/industry, 2003–2014
21. Number of announced greenfield FDI projects, by source, 2003–2014
22. Number of announced greenfield FDI projects, by destination, 2003–2014
23. Number of announced greenfield FDI projects, by sector/industry, 2003–2014
ANNEX TABLES A3
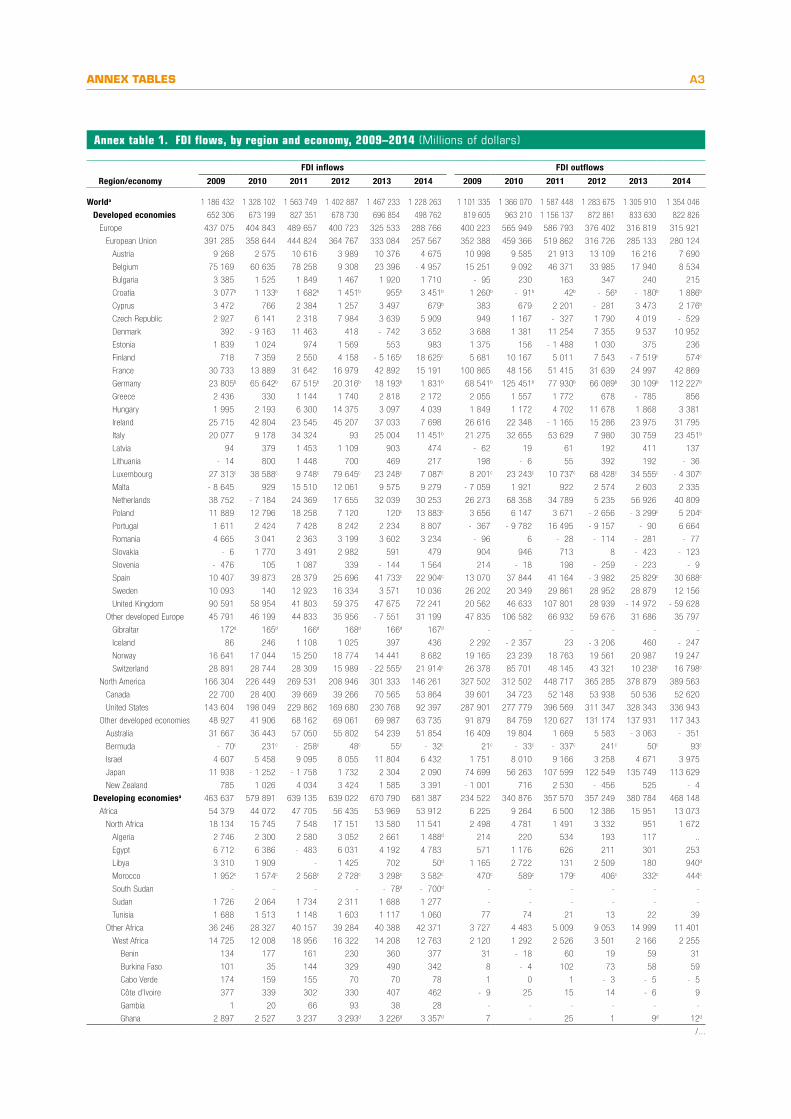
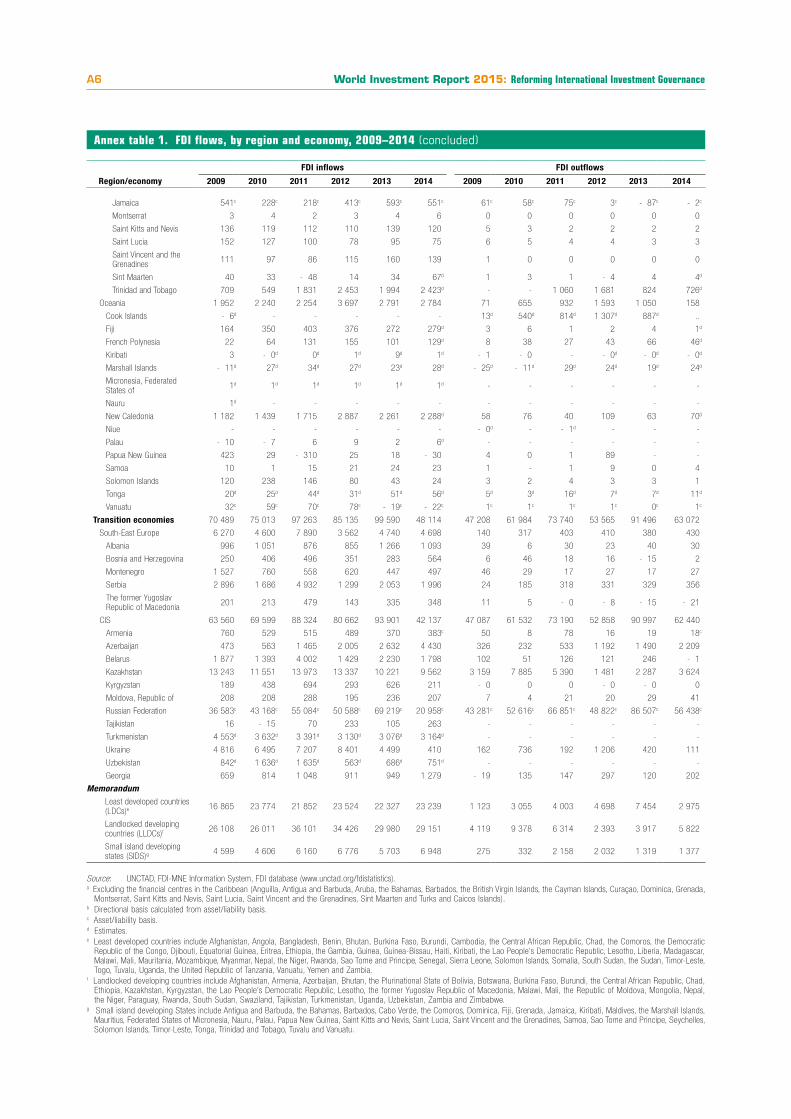
Annex table 1. FDI flows, by region and economy, 2009–2014 (Millions of dollars)
FDI inflows FDI outflows
Region/economy 2009 2010 2011 2012 2013 2014 2009 2010 2011 2012 2013 2014
Worlda 1 186 432 1 328 102 1 563 749 1 402 887 1 467 233 1 228 263 1 101 335 1 366 070 1 587 448 1 283 675 1 305 910 1 354 046
Developed economies 652 306 673 199 827 351 678 730 696 854 498 762 819 605 963 210 1 156 137 872 861 833 630 822 826
Europe 437 075 404 843 489 657 400 723 325 533 288 766 400 223 565 949 586 793 376 402 316 819 315 921
European Union 391 285 358 644 444 824 364 767 333 084 257 567 352 388 459 366 519 862 316 726 285 133 280 124
Austria 9 268 2 575 10 616 3 989 10 376 4 675 10 998 9 585 21 913 13 109 16 216 7 690
Belgium 75 169 60 635 78 258 9 308 23 396 - 4 957 15 251 9 092 46 371 33 985 17 940 8 534
Bulgaria 3 385 1 525 1 849 1 467 1 920 1 710 - 95 230 163 347 240 215
Croatia 3 077b 1 133b 1 682b 1 451b 955b 3 451b 1 260b - 91b 42b - 56b - 180b 1 886b
Cyprus 3 472 766 2 384 1 257 3 497 679b 383 679 2 201 - 281 3 473 2 176b
Czech Republic 2 927 6 141 2 318 7 984 3 639 5 909 949 1 167 - 327 1 790 4 019 - 529
Denmark 392 - 9 163 11 463 418 - 742 3 652 3 688 1 381 11 254 7 355 9 537 10 952
Estonia 1 839 1 024 974 1 569 553 983 1 375 156 - 1 488 1 030 375 236
Finland 718 7 359 2 550 4 158 - 5 165c 18 625c 5 681 10 167 5 011 7 543 - 7 519c 574c
France 30 733 13 889 31 642 16 979 42 892 15 191 100 865 48 156 51 415 31 639 24 997 42 869
Germany 23 805b 65 642b 67 515b 20 316b 18 193b 1 831b 68 541b 125 451b 77 930b 66 089b 30 109b 112 227b
Greece 2 436 330 1 144 1 740 2 818 2 172 2 055 1 557 1 772 678 - 785 856
Hungary 1 995 2 193 6 300 14 375 3 097 4 039 1 849 1 172 4 702 11 678 1 868 3 381
Ireland 25 715 42 804 23 545 45 207 37 033 7 698 26 616 22 348 - 1 165 15 286 23 975 31 795
Italy 20 077 9 178 34 324 93 25 004 11 451b 21 275 32 655 53 629 7 980 30 759 23 451b
Latvia 94 379 1 453 1 109 903 474 - 62 19 61 192 411 137
Lithuania - 14 800 1 448 700 469 217 198 - 6 55 392 192 - 36
Luxembourg 27 313c 38 588c 9 748c 79 645c 23 248c 7 087c 8 201c 23 243c 10 737c 68 428c 34 555c - 4 307c
Malta - 8 645 929 15 510 12 061 9 575 9 279 - 7 059 1 921 922 2 574 2 603 2 335
Netherlands 38 752 - 7 184 24 369 17 655 32 039 30 253 26 273 68 358 34 789 5 235 56 926 40 809
Poland 11 889 12 796 18 258 7 120 120c 13 883c 3 656 6 147 3 671 - 2 656 - 3 299c 5 204c
Portugal 1 611 2 424 7 428 8 242 2 234 8 807 - 367 - 9 782 16 495 - 9 157 - 90 6 664
Romania 4 665 3 041 2 363 3 199 3 602 3 234 - 96 6 - 28 - 114 - 281 - 77
Slovakia - 6 1 770 3 491 2 982 591 479 904 946 713 8 - 423 - 123
Slovenia - 476 105 1 087 339 - 144 1 564 214 - 18 198 - 259 - 223 - 9
Spain 10 407 39 873 28 379 25 696 41 733c 22 904c 13 070 37 844 41 164 - 3 982 25 829c 30 688c
Sweden 10 093 140 12 923 16 334 3 571 10 036 26 202 20 349 29 861 28 952 28 879 12 156
United Kingdom 90 591 58 954 41 803 59 375 47 675 72 241 20 562 46 633 107 801 28 939 - 14 972 - 59 628
Other developed Europe 45 791 46 199 44 833 35 956 - 7 551 31 199 47 835 106 582 66 932 59 676 31 686 35 797
Gibraltar 172d 165d 166d 168d 166d 167d - - - - - -
Iceland 86 246 1 108 1 025 397 436 2 292 - 2 357 23 - 3 206 460 - 247
Norway 16 641 17 044 15 250 18 774 14 441 8 682 19 165 23 239 18 763 19 561 20 987 19 247
Switzerland 28 891 28 744 28 309 15 989 - 22 555c 21 914c 26 378 85 701 48 145 43 321 10 238c 16 798c
North America 166 304 226 449 269 531 208 946 301 333 146 261 327 502 312 502 448 717 365 285 378 879 389 563
Canada 22 700 28 400 39 669 39 266 70 565 53 864 39 601 34 723 52 148 53 938 50 536 52 620
United States 143 604 198 049 229 862 169 680 230 768 92 397 287 901 277 779 396 569 311 347 328 343 336 943
Other developed economies 48 927 41 906 68 162 69 061 69 987 63 735 91 879 84 759 120 627 131 174 137 931 117 343
Australia 31 667 36 443 57 050 55 802 54 239 51 854 16 409 19 804 1 669 5 583 - 3 063 - 351
Bermuda - 70c 231c - 258c 48c 55c - 32c 21c - 33c - 337c 241c 50c 93c
Israel 4 607 5 458 9 095 8 055 11 804 6 432 1 751 8 010 9 166 3 258 4 671 3 975
Japan 11 938 - 1 252 - 1 758 1 732 2 304 2 090 74 699 56 263 107 599 122 549 135 749 113 629
New Zealand 785 1 026 4 034 3 424 1 585 3 391 - 1 001 716 2 530 - 456 525 - 4
Developing economiesa 463 637 579 891 639 135 639 022 670 790 681 387 234 522 340 876 357 570 357 249 380 784 468 148
Africa 54 379 44 072 47 705 56 435 53 969 53 912 6 225 9 264 6 500 12 386 15 951 13 073
North Africa 18 134 15 745 7 548 17 151 13 580 11 541 2 498 4 781 1 491 3 332 951 1 672
Algeria 2 746 2 300 2 580 3 052 2 661 1 488d 214 220 534 193 117 ..
Egypt 6 712 6 386 - 483 6 031 4 192 4 783 571 1 176 626 211 301 253
Libya 3 310 1 909 - 1 425 702 50d 1 165 2 722 131 2 509 180 940d
Morocco 1 952c 1 574c 2 568c 2 728c 3 298c 3 582c 470c 589c 179c 406c 332c 444c
South Sudan - - - - - 78d - 700d - - - - - -
Sudan 1 726 2 064 1 734 2 311 1 688 1 277 - - - - - -
Tunisia 1 688 1 513 1 148 1 603 1 117 1 060 77 74 21 13 22 39
Other Africa 36 246 28 327 40 157 39 284 40 388 42 371 3 727 4 483 5 009 9 053 14 999 11 401
West Africa 14 725 12 008 18 956 16 322 14 208 12 763 2 120 1 292 2 526 3 501 2 166 2 255
Benin 134 177 161 230 360 377 31 - 18 60 19 59 31
Burkina Faso 101 35 144 329 490 342 8 - 4 102 73 58 59
Cabo Verde 174 159 155 70 70 78 1 0 1 - 3 - 5 - 5
Côte d’Ivoire 377 339 302 330 407 462 - 9 25 15 14 - 6 9
Gambia 1 20 66 93 38 28 - - - - - -
Ghana 2 897 2 527 3 237 3 293d 3 226d 3 357d 7 - 25 1 9d 12d
/...
World Investment Report 2015: Reforming International Investment GovernanceA4
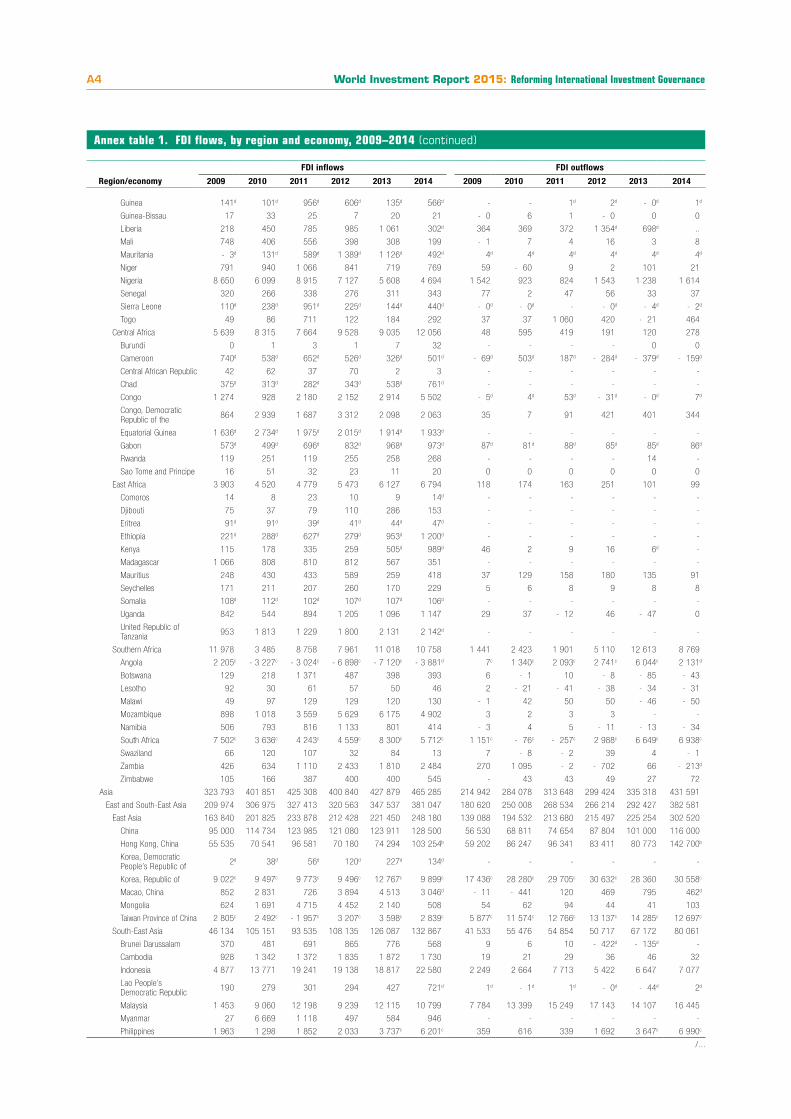
Annex table 1. FDI flows, by region and economy, 2009–2014 (continued)
FDI inflows FDI outflows
Region/economy 2009 2010 2011 2012 2013 2014 2009 2010 2011 2012 2013 2014
Guinea 141d 101d 956d 606d 135d 566d - - 1d 2d - 0d 1d
Guinea-Bissau 17 33 25 7 20 21 - 0 6 1 - 0 0 0
Liberia 218 450 785 985 1 061 302d 364 369 372 1 354d 698d ..
Mali 748 406 556 398 308 199 - 1 7 4 16 3 8
Mauritania - 3d 131d 589d 1 389d 1 126d 492d 4d 4d 4d 4d 4d 4d
Niger 791 940 1 066 841 719 769 59 - 60 9 2 101 21
Nigeria 8 650 6 099 8 915 7 127 5 608 4 694 1 542 923 824 1 543 1 238 1 614
Senegal 320 266 338 276 311 343 77 2 47 56 33 37
Sierra Leone 110d 238d 951d 225d 144d 440d - 0d - 0d - - 0d - 4d - 2d
Togo 49 86 711 122 184 292 37 37 1 060 420 - 21 464
Central Africa 5 639 8 315 7 664 9 528 9 035 12 056 48 595 419 191 120 278
Burundi 0 1 3 1 7 32 - - - - 0 0
Cameroon 740d 538d 652d 526d 326d 501d - 69d 503d 187d - 284d - 379d - 159d
Central African Republic 42 62 37 70 2 3 - - - - - -
Chad 375d 313d 282d 343d 538d 761d - - - - - -
Congo 1 274 928 2 180 2 152 2 914 5 502 - 5d 4d 53d - 31d - 0d 7d
Congo, Democratic Republic of the 864 2 939 1 687 3 312 2 098 2 063 35 7 91 421 401 344
Equatorial Guinea 1 636d 2 734d 1 975d 2 015d 1 914d 1 933d - - - - - -
Gabon 573d 499d 696d 832d 968d 973d 87d 81d 88d 85d 85d 86d
Rwanda 119 251 119 255 258 268 - - - - 14 -
Sao Tome and Principe 16 51 32 23 11 20 0 0 0 0 0 0
East Africa 3 903 4 520 4 779 5 473 6 127 6 794 118 174 163 251 101 99
Comoros 14 8 23 10 9 14d - - - - - -
Djibouti 75 37 79 110 286 153 - - - - - -
Eritrea 91d 91d 39d 41d 44d 47d - - - - - -
Ethiopia 221d 288d 627d 279d 953d 1 200d - - - - - -
Kenya 115 178 335 259 505d 989d 46 2 9 16 6d -
Madagascar 1 066 808 810 812 567 351 - - - - - -
Mauritius 248 430 433 589 259 418 37 129 158 180 135 91
Seychelles 171 211 207 260 170 229 5 6 8 9 8 8
Somalia 108d 112d 102d 107d 107d 106d - - - - - -
Uganda 842 544 894 1 205 1 096 1 147 29 37 - 12 46 - 47 0
United Republic of Tanzania 953 1 813 1 229 1 800 2 131 2 142d - - - - - -
Southern Africa 11 978 3 485 8 758 7 961 11 018 10 758 1 441 2 423 1 901 5 110 12 613 8 769
Angola 2 205c - 3 227c - 3 024c - 6 898c - 7 120c - 3 881d 7c 1 340c 2 093c 2 741c 6 044c 2 131d
Botswana 129 218 1 371 487 398 393 6 - 1 10 - 8 - 85 - 43
Lesotho 92 30 61 57 50 46 2 - 21 - 41 - 38 - 34 - 31
Malawi 49 97 129 129 120 130 - 1 42 50 50 - 46 - 50
Mozambique 898 1 018 3 559 5 629 6 175 4 902 3 2 3 3 - -
Namibia 506 793 816 1 133 801 414 - 3 4 5 - 11 - 13 - 34
South Africa 7 502c 3 636c 4 243c 4 559c 8 300c 5 712c 1 151c - 76c - 257c 2 988c 6 649c 6 938c
Swaziland 66 120 107 32 84 13 7 - 8 - 2 39 4 - 1
Zambia 426 634 1 110 2 433 1 810 2 484 270 1 095 - 2 - 702 66 - 213d
Zimbabwe 105 166 387 400 400 545 - 43 43 49 27 72
Asia 323 793 401 851 425 308 400 840 427 879 465 285 214 942 284 078 313 648 299 424 335 318 431 591
East and South-East Asia 209 974 306 975 327 413 320 563 347 537 381 047 180 620 250 008 268 534 266 214 292 427 382 581
East Asia 163 840 201 825 233 878 212 428 221 450 248 180 139 088 194 532 213 680 215 497 225 254 302 520
China 95 000 114 734 123 985 121 080 123 911 128 500 56 530 68 811 74 654 87 804 101 000 116 000
Hong Kong, China 55 535 70 541 96 581 70 180 74 294 103 254b 59 202 86 247 96 341 83 411 80 773 142 700b
Korea, Democratic People’s Republic of 2d 38d 56d 120d 227d 134d - - - - - -
Korea, Republic of 9 022c 9 497c 9 773c 9 496c 12 767c 9 899c 17 436c 28 280c 29 705c 30 632c 28 360 30 558c
Macao, China 852 2 831 726 3 894 4 513 3 046d - 11 - 441 120 469 795 462d
Mongolia 624 1 691 4 715 4 452 2 140 508 54 62 94 44 41 103
Taiwan Province of China 2 805c 2 492c - 1 957c 3 207c 3 598c 2 839c 5 877c 11 574c 12 766c 13 137c 14 285c 12 697c
South-East Asia 46 134 105 151 93 535 108 135 126 087 132 867 41 533 55 476 54 854 50 717 67 172 80 061
Brunei Darussalam 370 481 691 865 776 568 9 6 10 - 422d - 135d -
Cambodia 928 1 342 1 372 1 835 1 872 1 730 19 21 29 36 46 32
Indonesia 4 877 13 771 19 241 19 138 18 817 22 580 2 249 2 664 7 713 5 422 6 647 7 077
Lao People’s Democratic Republic 190 279 301 294 427 721d 1d - 1d 1d - 0d - 44d 2d
Malaysia 1 453 9 060 12 198 9 239 12 115 10 799 7 784 13 399 15 249 17 143 14 107 16 445
Myanmar 27 6 669 1 118 497 584 946 - - - - - -
Philippines 1 963 1 298 1 852 2 033 3 737c 6 201c 359 616 339 1 692 3 647c 6 990c
/...
ANNEX TABLES A5
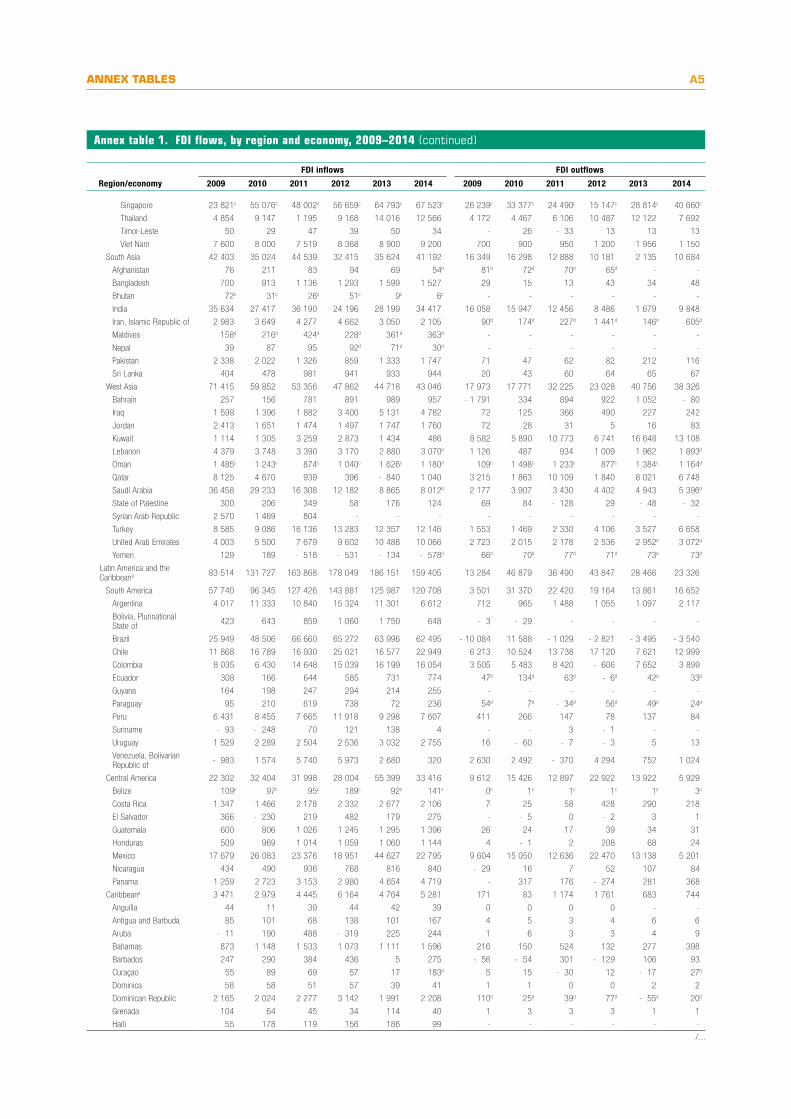
Annex table 1. FDI flows, by region and economy, 2009–2014 (continued)
FDI inflows FDI outflows
Region/economy 2009 2010 2011 2012 2013 2014 2009 2010 2011 2012 2013 2014
Singapore 23 821c 55 076c 48 002c 56 659c 64 793c 67 523c 26 239c 33 377c 24 490c 15 147c 28 814c 40 660c
Thailand 4 854 9 147 1 195 9 168 14 016 12 566 4 172 4 467 6 106 10 487 12 122 7 692
Timor-Leste 50 29 47 39 50 34 - 26 - 33 13 13 13
Viet Nam 7 600 8 000 7 519 8 368 8 900 9 200 700 900 950 1 200 1 956 1 150
South Asia 42 403 35 024 44 539 32 415 35 624 41 192 16 349 16 298 12 888 10 181 2 135 10 684
Afghanistan 76 211 83 94 69 54d 81d 72d 70d 65d - -
Bangladesh 700 913 1 136 1 293 1 599 1 527 29 15 13 43 34 48
Bhutan 72c 31c 26c 51c 9c 6c - - - - - -
India 35 634 27 417 36 190 24 196 28 199 34 417 16 058 15 947 12 456 8 486 1 679 9 848
Iran, Islamic Republic of 2 983 3 649 4 277 4 662 3 050 2 105 90d 174d 227d 1 441d 146d 605d
Maldives 158d 216d 424d 228d 361d 363d - - - - - -
Nepal 39 87 95 92d 71d 30d - - - - - -
Pakistan 2 338 2 022 1 326 859 1 333 1 747 71 47 62 82 212 116
Sri Lanka 404 478 981 941 933 944 20 43 60 64 65 67
West Asia 71 415 59 852 53 356 47 862 44 718 43 046 17 973 17 771 32 225 23 028 40 756 38 326
Bahrain 257 156 781 891 989 957 - 1 791 334 894 922 1 052 - 80
Iraq 1 598 1 396 1 882 3 400 5 131 4 782 72 125 366 490 227 242
Jordan 2 413 1 651 1 474 1 497 1 747 1 760 72 28 31 5 16 83
Kuwait 1 114 1 305 3 259 2 873 1 434 486 8 582 5 890 10 773 6 741 16 648 13 108
Lebanon 4 379 3 748 3 390 3 170 2 880 3 070d 1 126 487 934 1 009 1 962 1 893d
Oman 1 485c 1 243c 874c 1 040c 1 626c 1 180d 109c 1 498c 1 233c 877c 1 384c 1 164d
Qatar 8 125 4 670 939 396 - 840 1 040 3 215 1 863 10 109 1 840 8 021 6 748
Saudi Arabia 36 458 29 233 16 308 12 182 8 865 8 012d 2 177 3 907 3 430 4 402 4 943 5 396d
State of Palestine 300 206 349 58 176 124 69 84 - 128 29 - 48 - 32
Syrian Arab Republic 2 570 1 469 804 - - - - - - - - -
Turkey 8 585 9 086 16 136 13 283 12 357 12 146 1 553 1 469 2 330 4 106 3 527 6 658
United Arab Emirates 4 003 5 500 7 679 9 602 10 488 10 066 2 723 2 015 2 178 2 536 2 952d 3 072d
Yemen 129 189 - 518 - 531 - 134 - 578d 66d 70d 77d 71d 73d 73d
Latin America and the Caribbeana 83 514 131 727 163 868 178 049 186 151 159 405 13 284 46 879 36 490 43 847 28 466 23 326
South America 57 740 96 345 127 426 143 881 125 987 120 708 3 501 31 370 22 420 19 164 13 861 16 652
Argentina 4 017 11 333 10 840 15 324 11 301 6 612 712 965 1 488 1 055 1 097 2 117
Bolivia, Plurinational State of 423 643 859 1 060 1 750 648 - 3 - 29 - - - -
Brazil 25 949 48 506 66 660 65 272 63 996 62 495 - 10 084 11 588 - 1 029 - 2 821 - 3 495 - 3 540
Chile 11 868 16 789 16 930 25 021 16 577 22 949 6 213 10 524 13 738 17 120 7 621 12 999
Colombia 8 035 6 430 14 648 15 039 16 199 16 054 3 505 5 483 8 420 - 606 7 652 3 899
Ecuador 308 166 644 585 731 774 47d 134d 63d - 6d 42d 33d
Guyana 164 198 247 294 214 255 - - - - - -
Paraguay 95 210 619 738 72 236 54d 7d - 34d 56d 49d 24d
Peru 6 431 8 455 7 665 11 918 9 298 7 607 411 266 147 78 137 84
Suriname - 93 - 248 70 121 138 4 - - 3 - 1 - -
Uruguay 1 529 2 289 2 504 2 536 3 032 2 755 16 - 60 - 7 - 3 5 13
Venezuela, Bolivarian Republic of - 983 1 574 5 740 5 973 2 680 320 2 630 2 492 - 370 4 294 752 1 024
Central America 22 302 32 404 31 998 28 004 55 399 33 416 9 612 15 426 12 897 22 922 13 922 5 929
Belize 109c 97c 95c 189c 92c 141c 0c 1c 1c 1c 1c 3c
Costa Rica 1 347 1 466 2 178 2 332 2 677 2 106 7 25 58 428 290 218
El Salvador 366 - 230 219 482 179 275 - - 5 0 - 2 3 1
Guatemala 600 806 1 026 1 245 1 295 1 396 26 24 17 39 34 31
Honduras 509 969 1 014 1 059 1 060 1 144 4 - 1 2 208 68 24
Mexico 17 679 26 083 23 376 18 951 44 627 22 795 9 604 15 050 12 636 22 470 13 138 5 201
Nicaragua 434 490 936 768 816 840 - 29 16 7 52 107 84
Panama 1 259 2 723 3 153 2 980 4 654 4 719 - 317 176 - 274 281 368
Caribbeana 3 471 2 979 4 445 6 164 4 764 5 281 171 83 1 174 1 761 683 744
Anguilla 44 11 39 44 42 39 0 0 0 0 - -
Antigua and Barbuda 85 101 68 138 101 167 4 5 3 4 6 6
Aruba - 11 190 488 - 319 225 244 1 6 3 3 4 9
Bahamas 873 1 148 1 533 1 073 1 111 1 596 216 150 524 132 277 398
Barbados 247 290 384 436 5 275 - 56 - 54 301 - 129 106 93
Curaçao 55 89 69 57 17 183d 5 15 - 30 12 - 17 27d
Dominica 58 58 51 57 39 41 1 1 0 0 2 2
Dominican Republic 2 165 2 024 2 277 3 142 1 991 2 208 110d 25d 39d 77d - 55d 20d
Grenada 104 64 45 34 114 40 1 3 3 3 1 1
Haiti 55 178 119 156 186 99 - - - - - -
/...
World Investment Report 2015: Reforming International Investment GovernanceA6
Annex table 1. FDI flows, by region and economy, 2009–2014 (concluded)
FDI inflows FDI outflows
Region/economy 2009 2010 2011 2012 2013 2014 2009 2010 2011 2012 2013 2014
Jamaica 541c 228c 218c 413c 593c 551c 61c 58c 75c 3c - 87c - 2c
Montserrat 3 4 2 3 4 6 0 0 0 0 0 0
Saint Kitts and Nevis 136 119 112 110 139 120 5 3 2 2 2 2
Saint Lucia 152 127 100 78 95 75 6 5 4 4 3 3
Saint Vincent and the Grenadines 111 97 86 115 160 139 1 0 0 0 0 0
Sint Maarten 40 33 - 48 14 34 67d 1 3 1 - 4 4 4d
Trinidad and Tobago 709 549 1 831 2 453 1 994 2 423d - - 1 060 1 681 824 726d
Oceania 1 952 2 240 2 254 3 697 2 791 2 784 71 655 932 1 593 1 050 158
Cook Islands - 6d - - - - - 13d 540d 814d 1 307d 887d ..
Fiji 164 350 403 376 272 279d 3 6 1 2 4 1d
French Polynesia 22 64 131 155 101 129d 8 38 27 43 66 46d
Kiribati 3 - 0d 0d 1d 9d 1d - 1 - 0 - - 0d - 0d - 0d
Marshall Islands - 11d 27d 34d 27d 23d 28d - 25d - 11d 29d 24d 19d 24d
Micronesia, Federated States of 1d 1d 1d 1d 1d 1d - - - - - -
Nauru 1d - - - - - - - - - - -
New Caledonia 1 182 1 439 1 715 2 887 2 261 2 288d 58 76 40 109 63 70d
Niue - - - - - - - 0d - - 1d - - -
Palau - 10 - 7 6 9 2 6d - - - - - -
Papua New Guinea 423 29 - 310 25 18 - 30 4 0 1 89 - -
Samoa 10 1 15 21 24 23 1 - 1 9 0 4
Solomon Islands 120 238 146 80 43 24 3 2 4 3 3 1
Tonga 20d 25d 44d 31d 51d 56d 5d 3d 16d 7d 7d 11d
Vanuatu 32c 59c 70c 78c - 19c - 22c 1c 1c 1c 1c 0c 1c
Transition economies 70 489 75 013 97 263 85 135 99 590 48 114 47 208 61 984 73 740 53 565 91 496 63 072
South-East Europe 6 270 4 600 7 890 3 562 4 740 4 698 140 317 403 410 380 430
Albania 996 1 051 876 855 1 266 1 093 39 6 30 23 40 30
Bosnia and Herzegovina 250 406 496 351 283 564 6 46 18 16 - 15 2
Montenegro 1 527 760 558 620 447 497 46 29 17 27 17 27
Serbia 2 896 1 686 4 932 1 299 2 053 1 996 24 185 318 331 329 356
The former Yugoslav Republic of Macedonia 201 213 479 143 335 348 11 5 - 0 - 8 - 15 - 21
CIS 63 560 69 599 88 324 80 662 93 901 42 137 47 087 61 532 73 190 52 858 90 997 62 440
Armenia 760 529 515 489 370 383c 50 8 78 16 19 18c
Azerbaijan 473 563 1 465 2 005 2 632 4 430 326 232 533 1 192 1 490 2 209
Belarus 1 877 1 393 4 002 1 429 2 230 1 798 102 51 126 121 246 - 1
Kazakhstan 13 243 11 551 13 973 13 337 10 221 9 562 3 159 7 885 5 390 1 481 2 287 3 624
Kyrgyzstan 189 438 694 293 626 211 - 0 0 0 - 0 - 0 0
Moldova, Republic of 208 208 288 195 236 207 7 4 21 20 29 41
Russian Federation 36 583c 43 168c 55 084c 50 588c 69 219c 20 958c 43 281c 52 616c 66 851c 48 822c 86 507c 56 438c
Tajikistan 16 - 15 70 233 105 263 - - - - - -
Turkmenistan 4 553d 3 632d 3 391d 3 130d 3 076d 3 164d - - - - - -
Ukraine 4 816 6 495 7 207 8 401 4 499 410 162 736 192 1 206 420 111
Uzbekistan 842d 1 636d 1 635d 563d 686d 751d - - - - - -
Georgia 659 814 1 048 911 949 1 279 - 19 135 147 297 120 202
MemorandumLeast developed countries (LDCs)e 16 865 23 774 21 852 23 524 22 327 23 239 1 123 3 055 4 003 4 698 7 454 2 975
Landlocked developing countries (LLDCs)f 26 108 26 011 36 101 34 426 29 980 29 151 4 119 9 378 6 314 2 393 3 917 5 822
Small island developing states (SIDS)g 4 599 4 606 6 160 6 776 5 703 6 948 275 332 2 158 2 032 1 319 1 377
Source: UNCTAD, FDI-MNE Information System, FDI database (www.unctad.org/fdistatistics).a Excluding the financial centres in the Caribbean (Anguilla, Antigua and Barbuda, Aruba, the Bahamas, Barbados, the British Virgin Islands, the Cayman Islands, Curaçao, Dominica, Grenada,
Montserrat, Saint Kitts and Nevis, Saint Lucia, Saint Vincent and the Grenadines, Sint Maarten and Turks and Caicos Islands).b Directional basis calculated from asset/liability basis.c Asset/liability basis.d Estimates. e Least developed countries include Afghanistan, Angola, Bangladesh, Benin, Bhutan, Burkina Faso, Burundi, Cambodia, the Central African Republic, Chad, the Comoros, the Democratic
Republic of the Congo, Djibouti, Equatorial Guinea, Eritrea, Ethiopia, the Gambia, Guinea, Guinea-Bissau, Haiti, Kiribati, the Lao People’s Democratic Republic, Lesotho, Liberia, Madagascar, Malawi, Mali, Mauritania, Mozambique, Myanmar, Nepal, the Niger, Rwanda, Sao Tome and Principe, Senegal, Sierra Leone, Solomon Islands, Somalia, South Sudan, the Sudan, Timor-Leste, Togo, Tuvalu, Uganda, the United Republic of Tanzania, Vanuatu, Yemen and Zambia.
f Landlocked developing countries include Afghanistan, Armenia, Azerbaijan, Bhutan, the Plurinational State of Bolivia, Botswana, Burkina Faso, Burundi, the Central African Republic, Chad, Ethiopia, Kazakhstan, Kyrgyzstan, the Lao People’s Democratic Republic, Lesotho, the former Yugoslav Republic of Macedonia, Malawi, Mali, the Republic of Moldova, Mongolia, Nepal, the Niger, Paraguay, Rwanda, South Sudan, Swaziland, Tajikistan, Turkmenistan, Uganda, Uzbekistan, Zambia and Zimbabwe.
g Small island developing States include Antigua and Barbuda, the Bahamas, Barbados, Cabo Verde, the Comoros, Dominica, Fiji, Grenada, Jamaica, Kiribati, Maldives, the Marshall Islands, Mauritius, Federated States of Micronesia, Nauru, Palau, Papua New Guinea, Saint Kitts and Nevis, Saint Lucia, Saint Vincent and the Grenadines, Samoa, Sao Tome and Principe, Seychelles, Solomon Islands, Timor-Leste, Tonga, Trinidad and Tobago, Tuvalu and Vanuatu.
ANNEX TABLES A7
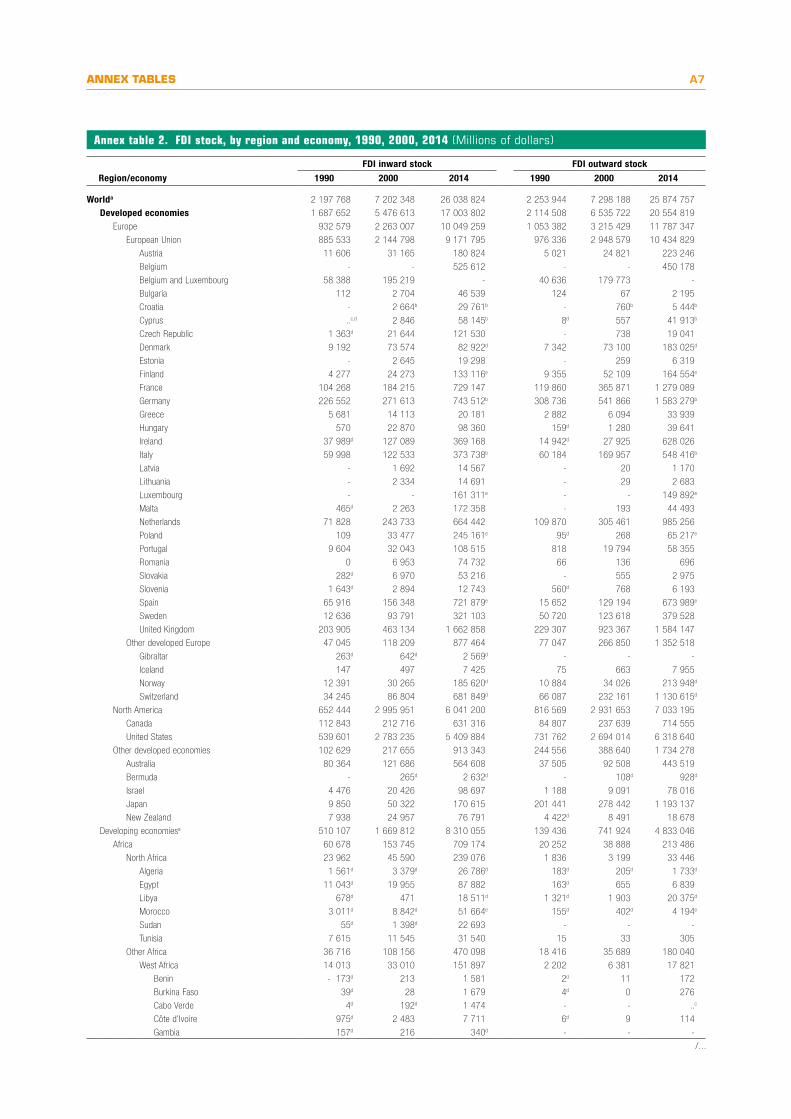
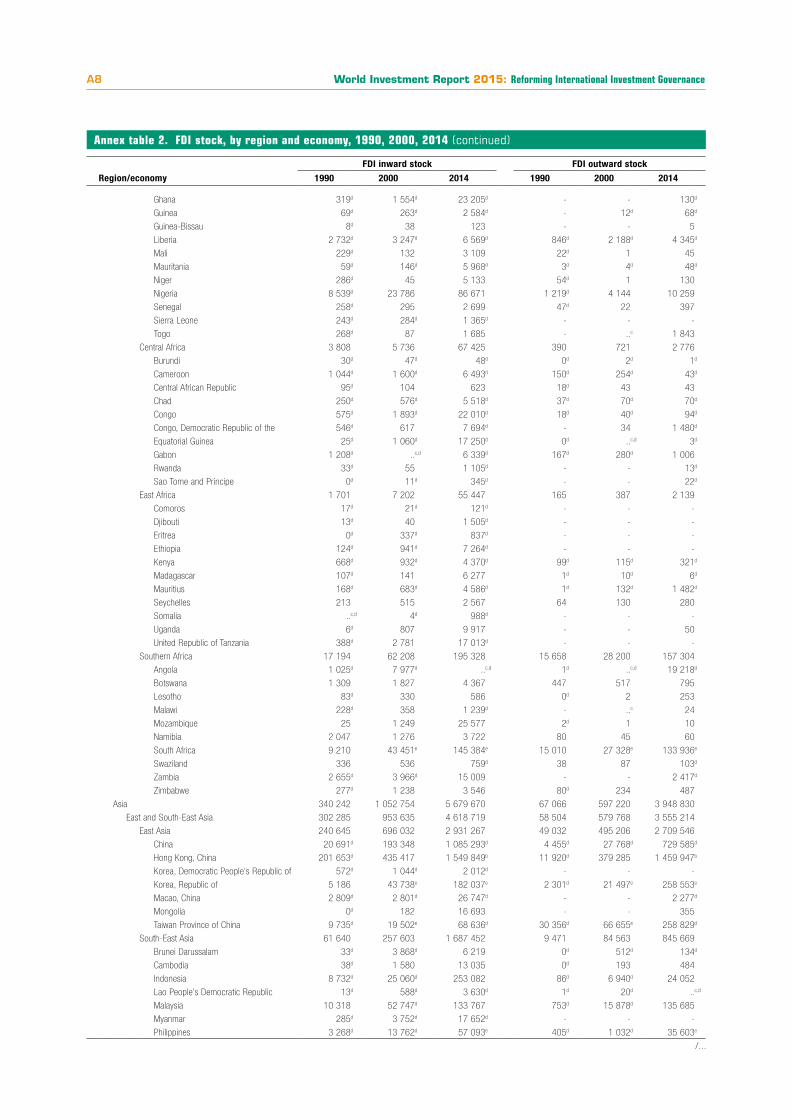
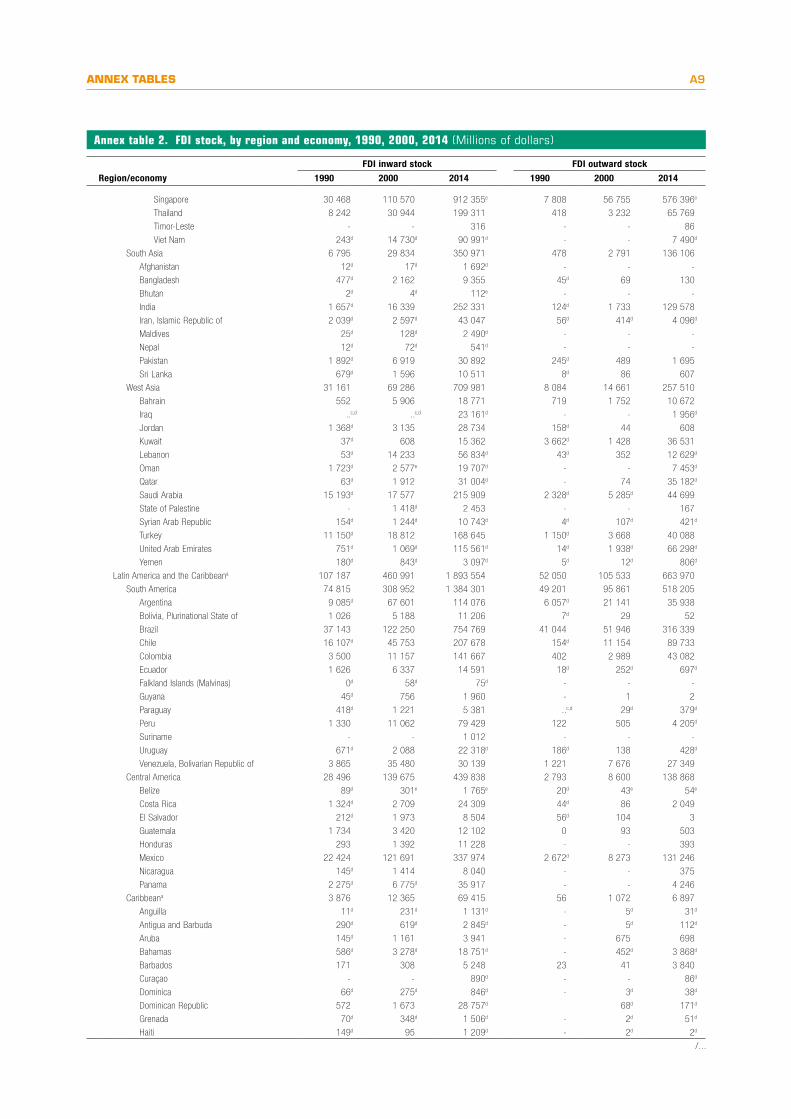
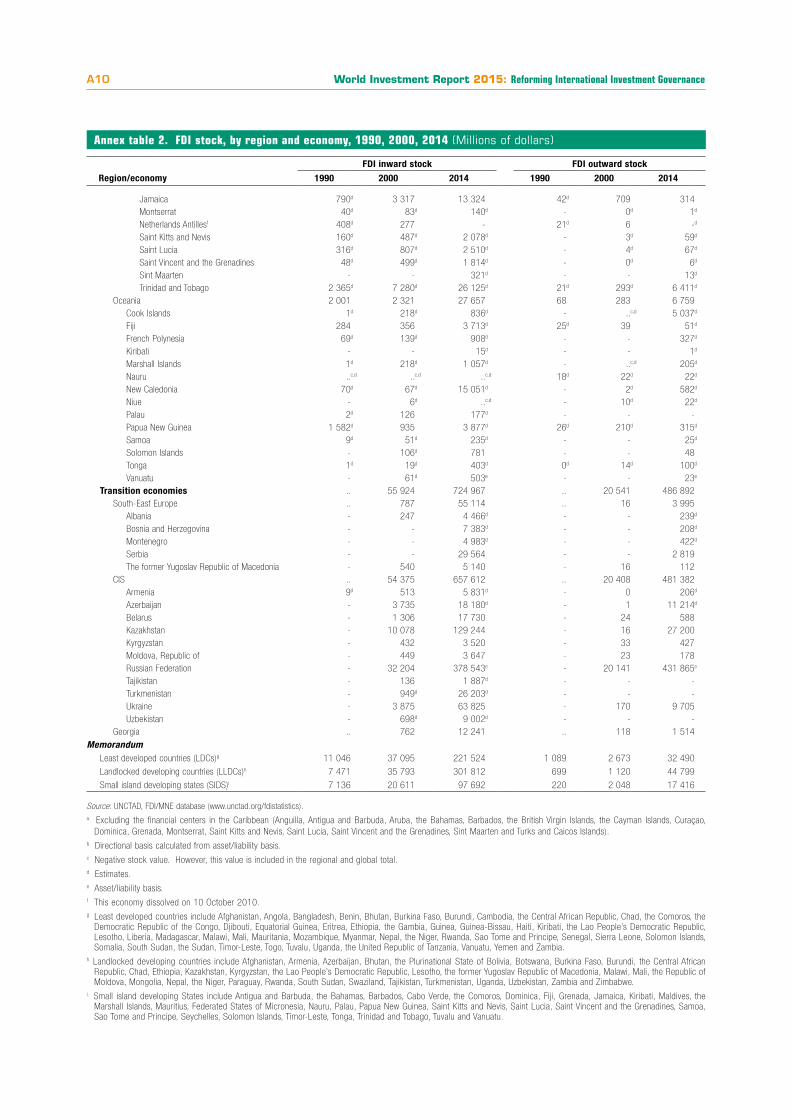
Annex table 2. FDI stock, by region and economy, 1990, 2000, 2014 (Millions of dollars)
FDI inward stock FDI outward stock
Region/economy 1990 2000 2014 1990 2000 2014
Worlda 2 197 768 7 202 348 26 038 824 2 253 944 7 298 188 25 874 757
Developed economies 1 687 652 5 476 613 17 003 802 2 114 508 6 535 722 20 554 819
Europe 932 579 2 263 007 10 049 259 1 053 382 3 215 429 11 787 347
European Union 885 533 2 144 798 9 171 795 976 336 2 948 579 10 434 829
Austria 11 606 31 165 180 824 5 021 24 821 223 246
Belgium - - 525 612 - - 450 178
Belgium and Luxembourg 58 388 195 219 - 40 636 179 773 -
Bulgaria 112 2 704 46 539 124 67 2 195
Croatia - 2 664b 29 761b - 760b 5 444b
Cyprus ..c,d 2 846 58 145b 8d 557 41 913b
Czech Republic 1 363d 21 644 121 530 - 738 19 041
Denmark 9 192 73 574 82 922d 7 342 73 100 183 025d
Estonia - 2 645 19 298 - 259 6 319
Finland 4 277 24 273 133 116e 9 355 52 109 164 554e
France 104 268 184 215 729 147 119 860 365 871 1 279 089
Germany 226 552 271 613 743 512b 308 736 541 866 1 583 279b
Greece 5 681 14 113 20 181 2 882 6 094 33 939
Hungary 570 22 870 98 360 159d 1 280 39 641
Ireland 37 989d 127 089 369 168 14 942d 27 925 628 026
Italy 59 998 122 533 373 738b 60 184 169 957 548 416b
Latvia - 1 692 14 567 - 20 1 170
Lithuania - 2 334 14 691 - 29 2 683
Luxembourg - - 161 311e - - 149 892e
Malta 465d 2 263 172 358 - 193 44 493
Netherlands 71 828 243 733 664 442 109 870 305 461 985 256
Poland 109 33 477 245 161e 95d 268 65 217e
Portugal 9 604 32 043 108 515 818 19 794 58 355
Romania 0 6 953 74 732 66 136 696
Slovakia 282d 6 970 53 216 - 555 2 975
Slovenia 1 643d 2 894 12 743 560d 768 6 193
Spain 65 916 156 348 721 879e 15 652 129 194 673 989e
Sweden 12 636 93 791 321 103 50 720 123 618 379 528
United Kingdom 203 905 463 134 1 662 858 229 307 923 367 1 584 147
Other developed Europe 47 045 118 209 877 464 77 047 266 850 1 352 518
Gibraltar 263d 642d 2 569d - - -
Iceland 147 497 7 425 75 663 7 955
Norway 12 391 30 265 185 620d 10 884 34 026 213 948d
Switzerland 34 245 86 804 681 849d 66 087 232 161 1 130 615d
North America 652 444 2 995 951 6 041 200 816 569 2 931 653 7 033 195
Canada 112 843 212 716 631 316 84 807 237 639 714 555
United States 539 601 2 783 235 5 409 884 731 762 2 694 014 6 318 640
Other developed economies 102 629 217 655 913 343 244 556 388 640 1 734 278
Australia 80 364 121 686 564 608 37 505 92 508 443 519
Bermuda - 265d 2 632d - 108d 928d
Israel 4 476 20 426 98 697 1 188 9 091 78 016
Japan 9 850 50 322 170 615 201 441 278 442 1 193 137
New Zealand 7 938 24 957 76 791 4 422d 8 491 18 678
Developing economiesa 510 107 1 669 812 8 310 055 139 436 741 924 4 833 046
Africa 60 678 153 745 709 174 20 252 38 888 213 486
North Africa 23 962 45 590 239 076 1 836 3 199 33 446
Algeria 1 561d 3 379d 26 786d 183d 205d 1 733d
Egypt 11 043d 19 955 87 882 163d 655 6 839
Libya 678d 471 18 511d 1 321d 1 903 20 375d
Morocco 3 011d 8 842d 51 664e 155d 402d 4 194e
Sudan 55d 1 398d 22 693 - - -
Tunisia 7 615 11 545 31 540 15 33 305
Other Africa 36 716 108 156 470 098 18 416 35 689 180 040
West Africa 14 013 33 010 151 897 2 202 6 381 17 821
Benin - 173d 213 1 581 2d 11 172
Burkina Faso 39d 28 1 679 4d 0 276
Cabo Verde 4d 192d 1 474 - - ..c
Côte d’Ivoire 975d 2 483 7 711 6d 9 114
Gambia 157d 216 340d - - -
/...
World Investment Report 2015: Reforming International Investment GovernanceA8
Annex table 2. FDI stock, by region and economy, 1990, 2000, 2014 (continued)
FDI inward stock FDI outward stock
Region/economy 1990 2000 2014 1990 2000 2014
Ghana 319d 1 554d 23 205d - - 130d
Guinea 69d 263d 2 584d - 12d 68d
Guinea-Bissau 8d 38 123 - - 5
Liberia 2 732d 3 247d 6 569d 846d 2 188d 4 345d
Mali 229d 132 3 109 22d 1 45
Mauritania 59d 146d 5 968d 3d 4d 48d
Niger 286d 45 5 133 54d 1 130
Nigeria 8 539d 23 786 86 671 1 219d 4 144 10 259
Senegal 258d 295 2 699 47d 22 397
Sierra Leone 243d 284d 1 365d - - -
Togo 268d 87 1 685 - ..c 1 843
Central Africa 3 808 5 736 67 425 390 721 2 776
Burundi 30d 47d 48d 0d 2d 1d
Cameroon 1 044d 1 600d 6 493d 150d 254d 43d
Central African Republic 95d 104 623 18d 43 43
Chad 250d 576d 5 518d 37d 70d 70d
Congo 575d 1 893d 22 010d 18d 40d 94d
Congo, Democratic Republic of the 546d 617 7 694d - 34 1 480d
Equatorial Guinea 25d 1 060d 17 250d 0d ..c,d 3d
Gabon 1 208d ..c,d 6 339d 167d 280d 1 006
Rwanda 33d 55 1 105d - - 13d
Sao Tome and Principe 0d 11d 345d - - 22d
East Africa 1 701 7 202 55 447 165 387 2 139
Comoros 17d 21d 121d - - -
Djibouti 13d 40 1 505d - - -
Eritrea 0d 337d 837d - - -
Ethiopia 124d 941d 7 264d - - -
Kenya 668d 932d 4 370d 99d 115d 321d
Madagascar 107d 141 6 277 1d 10d 6d
Mauritius 168d 683d 4 586d 1d 132d 1 482d
Seychelles 213 515 2 567 64 130 280
Somalia ..c,d 4d 988d - - -
Uganda 6d 807 9 917 - - 50
United Republic of Tanzania 388d 2 781 17 013d - - -
Southern Africa 17 194 62 208 195 328 15 658 28 200 157 304
Angola 1 025d 7 977d ..c,d 1d ..c,d 19 218d
Botswana 1 309 1 827 4 367 447 517 795
Lesotho 83d 330 586 0d 2 253
Malawi 228d 358 1 239d - ..c 24
Mozambique 25 1 249 25 577 2d 1 10
Namibia 2 047 1 276 3 722 80 45 60
South Africa 9 210 43 451e 145 384e 15 010 27 328e 133 936e
Swaziland 336 536 759d 38 87 103d
Zambia 2 655d 3 966d 15 009 - - 2 417d
Zimbabwe 277d 1 238 3 546 80d 234 487
Asia 340 242 1 052 754 5 679 670 67 066 597 220 3 948 830
East and South-East Asia 302 285 953 635 4 618 719 58 504 579 768 3 555 214
East Asia 240 645 696 032 2 931 267 49 032 495 206 2 709 546
China 20 691d 193 348 1 085 293d 4 455d 27 768d 729 585d
Hong Kong, China 201 653d 435 417 1 549 849b 11 920d 379 285 1 459 947b
Korea, Democratic People’s Republic of 572d 1 044d 2 012d - - -
Korea, Republic of 5 186 43 738e 182 037e 2 301d 21 497e 258 553e
Macao, China 2 809d 2 801d 26 747d - - 2 277d
Mongolia 0d 182 16 693 - - 355
Taiwan Province of China 9 735d 19 502e 68 636d 30 356d 66 655e 258 829d
South-East Asia 61 640 257 603 1 687 452 9 471 84 563 845 669
Brunei Darussalam 33d 3 868d 6 219 0d 512d 134d
Cambodia 38d 1 580 13 035 0d 193 484
Indonesia 8 732d 25 060d 253 082 86d 6 940d 24 052
Lao People’s Democratic Republic 13d 588d 3 630d 1d 20d ..c,d
Malaysia 10 318 52 747d 133 767 753d 15 878d 135 685
Myanmar 285d 3 752d 17 652d - - -
Philippines 3 268d 13 762d 57 093e 405d 1 032d 35 603e
/...
ANNEX TABLES A9
Annex table 2. FDI stock, by region and economy, 1990, 2000, 2014 (Millions of dollars)
FDI inward stock FDI outward stock
Region/economy 1990 2000 2014 1990 2000 2014
Singapore 30 468 110 570 912 355e 7 808 56 755 576 396e
Thailand 8 242 30 944 199 311 418 3 232 65 769
Timor-Leste - - 316 - - 86
Viet Nam 243d 14 730d 90 991d - - 7 490d
South Asia 6 795 29 834 350 971 478 2 791 136 106
Afghanistan 12d 17d 1 692d - - -
Bangladesh 477d 2 162 9 355 45d 69 130
Bhutan 2d 4d 112e - - -
India 1 657d 16 339 252 331 124d 1 733 129 578
Iran, Islamic Republic of 2 039d 2 597d 43 047 56d 414d 4 096d
Maldives 25d 128d 2 490d - - -
Nepal 12d 72d 541d - - -
Pakistan 1 892d 6 919 30 892 245d 489 1 695
Sri Lanka 679d 1 596 10 511 8d 86 607
West Asia 31 161 69 286 709 981 8 084 14 661 257 510
Bahrain 552 5 906 18 771 719 1 752 10 672
Iraq ..c,d ..c,d 23 161d - - 1 956d
Jordan 1 368d 3 135 28 734 158d 44 608
Kuwait 37d 608 15 362 3 662d 1 428 36 531
Lebanon 53d 14 233 56 834d 43d 352 12 629d
Oman 1 723d 2 577e 19 707d - - 7 453d
Qatar 63d 1 912 31 004d - 74 35 182d
Saudi Arabia 15 193d 17 577 215 909 2 328d 5 285d 44 699
State of Palestine - 1 418d 2 453 - - 167
Syrian Arab Republic 154d 1 244d 10 743d 4d 107d 421d
Turkey 11 150d 18 812 168 645 1 150d 3 668 40 088
United Arab Emirates 751d 1 069d 115 561d 14d 1 938d 66 298d
Yemen 180d 843d 3 097d 5d 12d 806d
Latin America and the Caribbeana 107 187 460 991 1 893 554 52 050 105 533 663 970
South America 74 815 308 952 1 384 301 49 201 95 861 518 205
Argentina 9 085d 67 601 114 076 6 057d 21 141 35 938
Bolivia, Plurinational State of 1 026 5 188 11 206 7d 29 52
Brazil 37 143 122 250 754 769 41 044 51 946 316 339
Chile 16 107d 45 753 207 678 154d 11 154 89 733
Colombia 3 500 11 157 141 667 402 2 989 43 082
Ecuador 1 626 6 337 14 591 18d 252d 697d
Falkland Islands (Malvinas) 0d 58d 75d - - -
Guyana 45d 756 1 960 - 1 2
Paraguay 418d 1 221 5 381 ..c,d 29d 379d
Peru 1 330 11 062 79 429 122 505 4 205d
Suriname - - 1 012 - - -
Uruguay 671d 2 088 22 318d 186d 138 428d
Venezuela, Bolivarian Republic of 3 865 35 480 30 139 1 221 7 676 27 349
Central America 28 496 139 675 439 838 2 793 8 600 138 868
Belize 89d 301e 1 765e 20d 43e 54e
Costa Rica 1 324d 2 709 24 309 44d 86 2 049
El Salvador 212d 1 973 8 504 56d 104 3
Guatemala 1 734 3 420 12 102 0 93 503
Honduras 293 1 392 11 228 - - 393
Mexico 22 424 121 691 337 974 2 672d 8 273 131 246
Nicaragua 145d 1 414 8 040 - - 375
Panama 2 275d 6 775d 35 917 - - 4 246
Caribbeana 3 876 12 365 69 415 56 1 072 6 897
Anguilla 11d 231d 1 131d - 5d 31d
Antigua and Barbuda 290d 619d 2 845d - 5d 112d
Aruba 145d 1 161 3 941 - 675 698
Bahamas 586d 3 278d 18 751d - 452d 3 868d
Barbados 171 308 5 248 23 41 3 840
Curaçao - - 890d - - 86d
Dominica 66d 275d 846d - 3d 38d
Dominican Republic 572 1 673 28 757d 68d 171d
Grenada 70d 348d 1 506d - 2d 51d
Haiti 149d 95 1 209d - 2d 2d
/...
World Investment Report 2015: Reforming International Investment GovernanceA10
Annex table 2. FDI stock, by region and economy, 1990, 2000, 2014 (Millions of dollars)
FDI inward stock FDI outward stock
Region/economy 1990 2000 2014 1990 2000 2014
Jamaica 790d 3 317 13 324 42d 709 314
Montserrat 40d 83d 140d - 0d 1d
Netherlands Antillesf 408d 277 - 21d 6 -d
Saint Kitts and Nevis 160d 487d 2 078d - 3d 59d
Saint Lucia 316d 807d 2 510d - 4d 67d
Saint Vincent and the Grenadines 48d 499d 1 814d - 0d 6d
Sint Maarten - - 321d - - 13d
Trinidad and Tobago 2 365d 7 280d 26 125d 21d 293d 6 411d
Oceania 2 001 2 321 27 657 68 283 6 759Cook Islands 1d 218d 836d - ..c,d 5 037d
Fiji 284 356 3 713d 25d 39 51d
French Polynesia 69d 139d 908d - - 327d
Kiribati - - 15d - - 1d
Marshall Islands 1d 218d 1 057d - ..c,d 205d
Nauru ..c,d ..c,d ..c,d 18d 22d 22d
New Caledonia 70d 67d 15 051d - 2d 582d
Niue - 6d ..c,d - 10d 22d
Palau 2d 126 177d - - -Papua New Guinea 1 582d 935 3 877d 26d 210d 315d
Samoa 9d 51d 235d - - 25d
Solomon Islands - 106d 781 - - 48Tonga 1d 19d 403d 0d 14d 100d
Vanuatu - 61d 503e - - 23e
Transition economies .. 55 924 724 967 .. 20 541 486 892South-East Europe .. 787 55 114 .. 16 3 995
Albania - 247 4 466d - - 239d
Bosnia and Herzegovina - - 7 383d - - 208d
Montenegro - - 4 983d - - 422d
Serbia - - 29 564 - - 2 819The former Yugoslav Republic of Macedonia - 540 5 140 - 16 112
CIS .. 54 375 657 612 .. 20 408 481 382Armenia 9d 513 5 831d - 0 206d
Azerbaijan - 3 735 18 180d - 1 11 214d
Belarus - 1 306 17 730 - 24 588Kazakhstan - 10 078 129 244 - 16 27 200Kyrgyzstan - 432 3 520 - 33 427Moldova, Republic of - 449 3 647 - 23 178Russian Federation - 32 204 378 543e - 20 141 431 865e
Tajikistan - 136 1 887d - - -Turkmenistan - 949d 26 203d - - -Ukraine - 3 875 63 825 - 170 9 705Uzbekistan - 698d 9 002d - - -
Georgia .. 762 12 241 .. 118 1 514
MemorandumLeast developed countries (LDCs)g 11 046 37 095 221 524 1 089 2 673 32 490
Landlocked developing countries (LLDCs)h 7 471 35 793 301 812 699 1 120 44 799
Small island developing states (SIDS)i 7 136 20 611 97 692 220 2 048 17 416
Source: UNCTAD, FDI/MNE database (www.unctad.org/fdistatistics).a Excluding the financial centers in the Caribbean (Anguilla, Antigua and Barbuda, Aruba, the Bahamas, Barbados, the British Virgin Islands, the Cayman Islands, Curaçao,
Dominica, Grenada, Montserrat, Saint Kitts and Nevis, Saint Lucia, Saint Vincent and the Grenadines, Sint Maarten and Turks and Caicos Islands).b Directional basis calculated from asset/liability basis.c Negative stock value. However, this value is included in the regional and global total. d Estimates. e Asset/liability basis.f This economy dissolved on 10 October 2010.g Least developed countries include Afghanistan, Angola, Bangladesh, Benin, Bhutan, Burkina Faso, Burundi, Cambodia, the Central African Republic, Chad, the Comoros, the
Democratic Republic of the Congo, Djibouti, Equatorial Guinea, Eritrea, Ethiopia, the Gambia, Guinea, Guinea-Bissau, Haiti, Kiribati, the Lao People’s Democratic Republic, Lesotho, Liberia, Madagascar, Malawi, Mali, Mauritania, Mozambique, Myanmar, Nepal, the Niger, Rwanda, Sao Tome and Principe, Senegal, Sierra Leone, Solomon Islands, Somalia, South Sudan, the Sudan, Timor-Leste, Togo, Tuvalu, Uganda, the United Republic of Tanzania, Vanuatu, Yemen and Zambia.
h Landlocked developing countries include Afghanistan, Armenia, Azerbaijan, Bhutan, the Plurinational State of Bolivia, Botswana, Burkina Faso, Burundi, the Central African Republic, Chad, Ethiopia, Kazakhstan, Kyrgyzstan, the Lao People’s Democratic Republic, Lesotho, the former Yugoslav Republic of Macedonia, Malawi, Mali, the Republic of Moldova, Mongolia, Nepal, the Niger, Paraguay, Rwanda, South Sudan, Swaziland, Tajikistan, Turkmenistan, Uganda, Uzbekistan, Zambia and Zimbabwe.
i Small island developing States include Antigua and Barbuda, the Bahamas, Barbados, Cabo Verde, the Comoros, Dominica, Fiji, Grenada, Jamaica, Kiribati, Maldives, the Marshall Islands, Mauritius, Federated States of Micronesia, Nauru, Palau, Papua New Guinea, Saint Kitts and Nevis, Saint Lucia, Saint Vincent and the Grenadines, Samoa, Sao Tome and Principe, Seychelles, Solomon Islands, Timor-Leste, Tonga, Trinidad and Tobago, Tuvalu and Vanuatu.
ANNEX TABLES A11
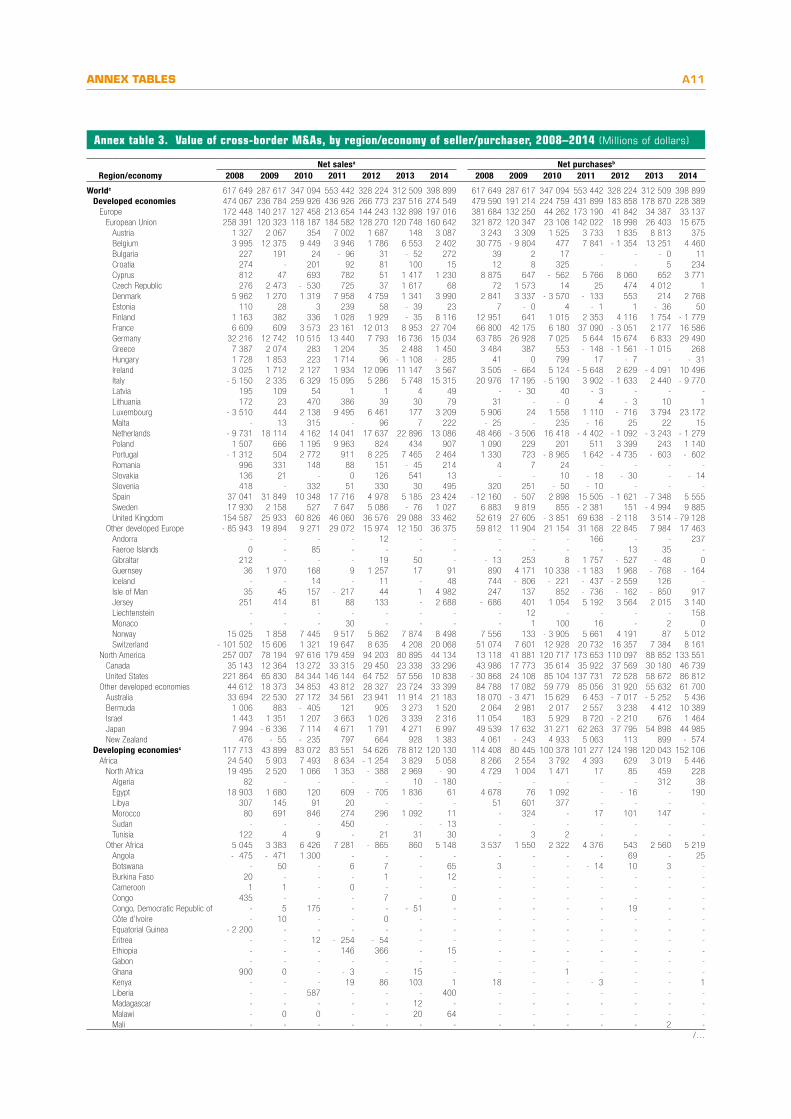
Annex table 3. Value of cross-border M&As, by region/economy of seller/purchaser, 2008–2014 (Millions of dollars)
Net salesa Net purchasesb
Region/economy 2008 2009 2010 2011 2012 2013 2014 2008 2009 2010 2011 2012 2013 2014
Worldc 617 649 287 617 347 094 553 442 328 224 312 509 398 899 617 649 287 617 347 094 553 442 328 224 312 509 398 899Developed economies 474 067 236 784 259 926 436 926 266 773 237 516 274 549 479 590 191 214 224 759 431 899 183 858 178 870 228 389
Europe 172 448 140 217 127 458 213 654 144 243 132 898 197 016 381 684 132 250 44 262 173 190 41 842 34 387 33 137European Union 258 391 120 323 118 187 184 582 128 270 120 748 160 642 321 872 120 347 23 108 142 022 18 998 26 403 15 675
Austria 1 327 2 067 354 7 002 1 687 148 3 087 3 243 3 309 1 525 3 733 1 835 8 813 375Belgium 3 995 12 375 9 449 3 946 1 786 6 553 2 402 30 775 - 9 804 477 7 841 - 1 354 13 251 4 460Bulgaria 227 191 24 - 96 31 - 52 272 39 2 17 - - - 0 11Croatia 274 - 201 92 81 100 15 12 8 325 - - 5 234Cyprus 812 47 693 782 51 1 417 1 230 8 875 647 - 562 5 766 8 060 652 3 771Czech Republic 276 2 473 - 530 725 37 1 617 68 72 1 573 14 25 474 4 012 1Denmark 5 962 1 270 1 319 7 958 4 759 1 341 3 990 2 841 3 337 - 3 570 - 133 553 214 2 768Estonia 110 28 3 239 58 - 39 23 7 - 0 4 - 1 1 - 36 50Finland 1 163 382 336 1 028 1 929 - 35 8 116 12 951 641 1 015 2 353 4 116 1 754 - 1 779France 6 609 609 3 573 23 161 12 013 8 953 27 704 66 800 42 175 6 180 37 090 - 3 051 2 177 16 586Germany 32 216 12 742 10 515 13 440 7 793 16 736 15 034 63 785 26 928 7 025 5 644 15 674 6 833 29 490Greece 7 387 2 074 283 1 204 35 2 488 1 450 3 484 387 553 - 148 - 1 561 - 1 015 268Hungary 1 728 1 853 223 1 714 96 - 1 108 - 285 41 0 799 17 - 7 - - 31Ireland 3 025 1 712 2 127 1 934 12 096 11 147 3 567 3 505 - 664 5 124 - 5 648 2 629 - 4 091 10 496Italy - 5 150 2 335 6 329 15 095 5 286 5 748 15 315 20 976 17 195 - 5 190 3 902 - 1 633 2 440 - 9 770Latvia 195 109 54 1 1 4 49 - - 30 40 - 3 - - -Lithuania 172 23 470 386 39 30 79 31 - - 0 4 - 3 10 1Luxembourg - 3 510 444 2 138 9 495 6 461 177 3 209 5 906 24 1 558 1 110 - 716 3 794 23 172Malta - 13 315 - 96 7 222 - 25 - 235 - 16 25 22 15Netherlands - 9 731 18 114 4 162 14 041 17 637 22 896 13 086 48 466 - 3 506 16 418 - 4 402 - 1 092 - 3 243 - 1 279Poland 1 507 666 1 195 9 963 824 434 907 1 090 229 201 511 3 399 243 1 140Portugal - 1 312 504 2 772 911 8 225 7 465 2 464 1 330 723 - 8 965 1 642 - 4 735 - 603 - 602Romania 996 331 148 88 151 - 45 214 4 7 24 - - - -Slovakia 136 21 - 0 126 541 13 - - 10 - 18 - 30 - - 14Slovenia 418 - 332 51 330 30 495 320 251 - 50 - 10 - - -Spain 37 041 31 849 10 348 17 716 4 978 5 185 23 424 - 12 160 - 507 2 898 15 505 - 1 621 - 7 348 5 555Sweden 17 930 2 158 527 7 647 5 086 - 76 1 027 6 883 9 819 855 - 2 381 151 - 4 994 9 885United Kingdom 154 587 25 933 60 826 46 060 36 576 29 088 33 462 52 619 27 605 - 3 851 69 638 - 2 118 3 514 - 79 128
Other developed Europe - 85 943 19 894 9 271 29 072 15 974 12 150 36 375 59 812 11 904 21 154 31 168 22 845 7 984 17 463Andorra - - - - 12 - - - - - 166 - - 237Faeroe Islands 0 - 85 - - - - - - - - 13 35 -Gibraltar 212 - - - 19 50 - - 13 253 8 1 757 - 527 - 48 0Guernsey 36 1 970 168 9 1 257 17 91 890 4 171 10 338 - 1 183 1 968 - 768 - 164Iceland - - 14 - 11 - 48 744 - 806 - 221 - 437 - 2 559 126 -Isle of Man 35 45 157 - 217 44 1 4 982 247 137 852 - 736 - 162 - 850 917Jersey 251 414 81 88 133 - 2 688 - 686 401 1 054 5 192 3 564 2 015 3 140Liechtenstein - - - - - - - - 12 - - - - 158Monaco - - - 30 - - - - 1 100 16 - 2 0Norway 15 025 1 858 7 445 9 517 5 862 7 874 8 498 7 556 133 - 3 905 5 661 4 191 87 5 012Switzerland - 101 502 15 606 1 321 19 647 8 635 4 208 20 068 51 074 7 601 12 928 20 732 16 357 7 384 8 161
North America 257 007 78 194 97 616 179 459 94 203 80 895 44 134 13 118 41 881 120 717 173 653 110 097 88 852 133 551Canada 35 143 12 364 13 272 33 315 29 450 23 338 33 296 43 986 17 773 35 614 35 922 37 569 30 180 46 739United States 221 864 65 830 84 344 146 144 64 752 57 556 10 838 - 30 868 24 108 85 104 137 731 72 528 58 672 86 812
Other developed economies 44 612 18 373 34 853 43 812 28 327 23 724 33 399 84 788 17 082 59 779 85 056 31 920 55 632 61 700Australia 33 694 22 530 27 172 34 561 23 941 11 914 21 183 18 070 - 3 471 15 629 6 453 - 7 017 - 5 252 5 436Bermuda 1 006 883 - 405 121 905 3 273 1 520 2 064 2 981 2 017 2 557 3 238 4 412 10 389Israel 1 443 1 351 1 207 3 663 1 026 3 339 2 316 11 054 183 5 929 8 720 - 2 210 676 1 464Japan 7 994 - 6 336 7 114 4 671 1 791 4 271 6 997 49 539 17 632 31 271 62 263 37 795 54 898 44 985New Zealand 476 - 55 - 235 797 664 928 1 383 4 061 - 243 4 933 5 063 113 899 - 574
Developing economiesc 117 713 43 899 83 072 83 551 54 626 78 812 120 130 114 408 80 445 100 378 101 277 124 198 120 043 152 106Africa 24 540 5 903 7 493 8 634 - 1 254 3 829 5 058 8 266 2 554 3 792 4 393 629 3 019 5 446
North Africa 19 495 2 520 1 066 1 353 - 388 2 969 - 90 4 729 1 004 1 471 17 85 459 228Algeria 82 - - - - 10 - 180 - - - - - 312 38Egypt 18 903 1 680 120 609 - 705 1 836 61 4 678 76 1 092 - - 16 - 190Libya 307 145 91 20 - - - 51 601 377 - - - -Morocco 80 691 846 274 296 1 092 11 - 324 - 17 101 147 -Sudan - - - 450 - - - 13 - - - - - - -Tunisia 122 4 9 - 21 31 30 - 3 2 - - - -
Other Africa 5 045 3 383 6 426 7 281 - 865 860 5 148 3 537 1 550 2 322 4 376 543 2 560 5 219Angola - 475 - 471 1 300 - - - - - - - - 69 - 25Botswana - 50 - 6 7 - 65 3 - - - 14 10 3 -Burkina Faso 20 - - - 1 - 12 - - - - - - -Cameroon 1 1 - 0 - - - - - - - - - -Congo 435 - - - 7 - 0 - - - - - - -Congo, Democratic Republic of - 5 175 - - - 51 - - - - - 19 - -Côte d’Ivoire - 10 - - 0 - - - - - - - - -Equatorial Guinea - 2 200 - - - - - - - - - - - - -Eritrea - - 12 - 254 - 54 - - - - - - - - -Ethiopia - - - 146 366 - 15 - - - - - - -Gabon - - - - - - - - - - - - - -Ghana 900 0 - - 3 - 15 - - - 1 - - - -Kenya - - - 19 86 103 1 18 - - - 3 - - 1Liberia - - 587 - - - 400 - - - - - - -Madagascar - - - - - 12 - - - - - - - -Malawi - 0 0 - - 20 64 - - - - - - -Mali - - - - - - - - - - - - 2 -
/…
World Investment Report 2015: Reforming International Investment GovernanceA12
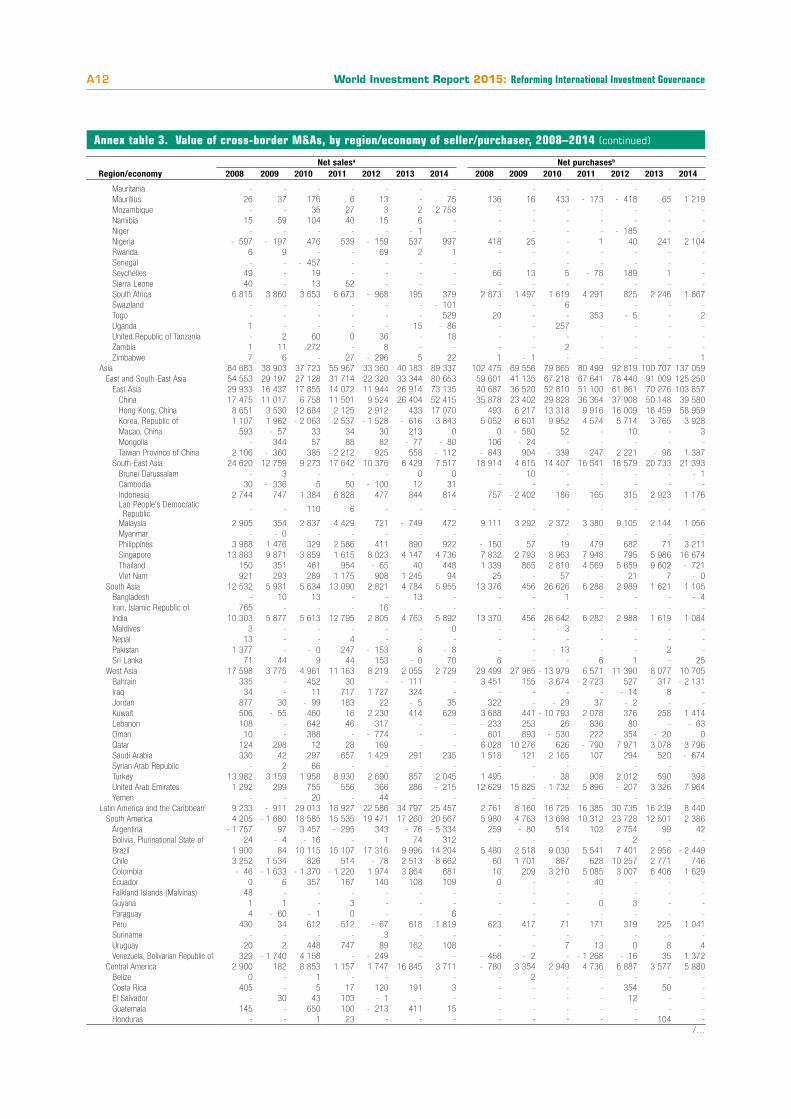
Annex table 3. Value of cross-border M&As, by region/economy of seller/purchaser, 2008–2014 (continued)
Net salesa Net purchasesb
Region/economy 2008 2009 2010 2011 2012 2013 2014 2008 2009 2010 2011 2012 2013 2014
Mauritania - - - - - - - - - - - - - -Mauritius 26 37 176 6 13 - 75 136 16 433 - 173 - 418 65 1 219Mozambique - - 35 27 3 2 2 758 - - - - - - -Namibia 15 59 104 40 15 6 - - - - - - - -Niger - - - - - - 1 - - - - - - 185 - -Nigeria - 597 - 197 476 539 - 159 537 997 418 25 - 1 40 241 2 104Rwanda 6 9 - - 69 2 1 - - - - - - -Senegal - - - 457 - - - - - - - - - - -Seychelles 49 - 19 - - - - 66 13 5 - 78 189 1 -Sierra Leone 40 - 13 52 - - - - - - - - - -South Africa 6 815 3 860 3 653 6 673 - 968 195 379 2 873 1 497 1 619 4 291 825 2 246 1 867Swaziland - - - - - - - 101 - - 6 - - - -Togo - - - - - - 529 20 - - 353 - 5 - 2Uganda 1 - - - - 15 - 86 - - 257 - - - -United Republic of Tanzania - 2 60 0 36 - 18 - - - - - - -Zambia 1 11 272 - 8 - - - - 2 - - - -Zimbabwe 7 6 - 27 - 296 5 22 1 - 1 - - - - 1
Asia 84 683 38 903 37 723 55 967 33 360 40 183 89 337 102 475 69 556 79 865 80 499 92 819 100 707 137 059East and South-East Asia 54 553 29 197 27 128 31 714 22 320 33 344 80 653 59 601 41 135 67 218 67 641 78 440 91 009 125 250
East Asia 29 933 16 437 17 855 14 072 11 944 26 914 73 135 40 687 36 520 52 810 51 100 61 861 70 276 103 857China 17 475 11 017 6 758 11 501 9 524 26 404 52 415 35 878 23 402 29 828 36 364 37 908 50 148 39 580Hong Kong, China 8 651 3 530 12 684 2 125 2 912 433 17 070 493 6 217 13 318 9 916 16 009 16 459 58 959Korea, Republic of 1 107 1 962 - 2 063 2 537 - 1 528 - 616 3 843 5 052 6 601 9 952 4 574 5 714 3 765 3 928Macao, China 593 - 57 33 34 30 213 0 0 - 580 52 - 10 - 3Mongolia - 344 57 88 82 - 77 - 80 106 - 24 - - - - -Taiwan Province of China 2 106 - 360 385 - 2 212 925 558 - 112 - 843 904 - 339 247 2 221 - 96 1 387
South-East Asia 24 620 12 759 9 273 17 642 10 376 6 429 7 517 18 914 4 615 14 407 16 541 16 579 20 733 21 393Brunei Darussalam - 3 - - - 0 0 - 10 - - - - - 1Cambodia 30 - 336 5 50 - 100 12 31 - - - - - - -Indonesia 2 744 747 1 384 6 828 477 844 814 757 - 2 402 186 165 315 2 923 1 176Lao People’s Democratic Republic - - 110 6 - - - - - - - - - -
Malaysia 2 905 354 2 837 4 429 721 - 749 472 9 111 3 292 2 372 3 380 9 105 2 144 1 056Myanmar - - 0 - - - - - - - - - - - -Philippines 3 988 1 476 329 2 586 411 890 922 - 150 57 19 479 682 71 3 211Singapore 13 883 9 871 3 859 1 615 8 023 4 147 4 736 7 832 2 793 8 963 7 948 795 5 986 16 674Thailand 150 351 461 954 - 65 40 448 1 339 865 2 810 4 569 5 659 9 602 - 721Viet Nam 921 293 289 1 175 908 1 245 94 25 - 57 - 21 7 - 0
South Asia 12 532 5 931 5 634 13 090 2 821 4 784 5 955 13 376 456 26 626 6 288 2 989 1 621 1 105Bangladesh - 10 13 - - 13 - - - 1 - - - - 4Iran, Islamic Republic of 765 - - - 16 - - - - - - - - -India 10 303 5 877 5 613 12 795 2 805 4 763 5 892 13 370 456 26 642 6 282 2 988 1 619 1 084Maldives 3 - - - - - 0 - - - 3 - - - -Nepal 13 - - 4 - - - - - - - - - -Pakistan 1 377 - - 0 247 - 153 8 - 8 - - - 13 - - 2 -Sri Lanka 71 44 9 44 153 - 0 70 6 - - 6 1 - 25
West Asia 17 598 3 775 4 961 11 163 8 219 2 055 2 729 29 499 27 965 - 13 979 6 571 11 390 8 077 10 705Bahrain 335 - 452 30 - - 111 - 3 451 155 - 3 674 - 2 723 527 317 - 2 131Iraq 34 - 11 717 1 727 324 - - - - - - 14 8 -Jordan 877 30 - 99 183 22 - 5 35 322 - - 29 37 - 2 - -Kuwait 506 - 55 460 16 2 230 414 629 3 688 441 - 10 793 2 078 376 258 1 414Lebanon 108 - 642 46 317 - - - 233 253 26 836 80 - - 63Oman 10 - 388 - - 774 - - 601 893 - 530 222 354 - 20 0Qatar 124 298 12 28 169 - - 6 028 10 276 626 - 790 7 971 3 078 3 796Saudi Arabia 330 42 297 657 1 429 291 235 1 518 121 2 165 107 294 520 - 674Syrian Arab Republic - 2 66 - - - - - - - - - - -Turkey 13 982 3 159 1 958 8 930 2 690 857 2 045 1 495 - - 38 908 2 012 590 398United Arab Emirates 1 292 299 755 556 366 286 - 215 12 629 15 825 - 1 732 5 896 - 207 3 326 7 964Yemen - - 20 - 44 - - - - - - - - -
Latin America and the Caribbeanc 9 233 - 911 29 013 18 927 22 586 34 797 25 457 2 761 8 160 16 725 16 385 30 735 16 239 8 440South America 4 205 - 1 680 18 585 15 535 19 471 17 260 20 567 5 980 4 763 13 698 10 312 23 728 12 501 2 386
Argentina - 1 757 97 3 457 - 295 343 - 76 - 5 334 259 - 80 514 102 2 754 99 42Bolivia, Plurinational State of 24 - 4 - 16 - 1 74 312 - - - - 2 - -Brazil 1 900 84 10 115 15 107 17 316 9 996 14 204 5 480 2 518 9 030 5 541 7 401 2 956 - 2 449Chile 3 252 1 534 826 514 - 78 2 513 8 662 60 1 701 867 628 10 257 2 771 746Colombia - 46 - 1 633 - 1 370 - 1 220 1 974 3 864 681 16 209 3 210 5 085 3 007 6 406 1 629Ecuador 0 6 357 167 140 108 109 0 - - 40 - - -Falkland Islands (Malvinas) 48 - - - - - - - - - - - - -Guyana 1 1 - 3 - - - - - - 0 3 - -Paraguay 4 - 60 - 1 0 - - 6 - - - - - - -Peru 430 34 612 512 - 67 618 1 819 623 417 71 171 319 225 1 041Suriname - - - - 3 - - - - - - - - -Uruguay 20 2 448 747 89 162 108 - - 7 13 0 8 4Venezuela, Bolivarian Republic of 329 - 1 740 4 158 - - 249 - - - 458 - 2 - - 1 268 - 16 35 1 372
Central America 2 900 182 8 853 1 157 1 747 16 845 3 711 - 780 3 354 2 949 4 736 6 887 3 577 5 880Belize 0 - 1 - - - - - 2 - - - - -Costa Rica 405 - 5 17 120 191 3 - - - - 354 50 -El Salvador - 30 43 103 - 1 - - - - - - 12 - -Guatemala 145 - 650 100 - 213 411 15 - - - - - - -Honduras - - 1 23 - - - - - - - - 104 -
/…
ANNEX TABLES A13
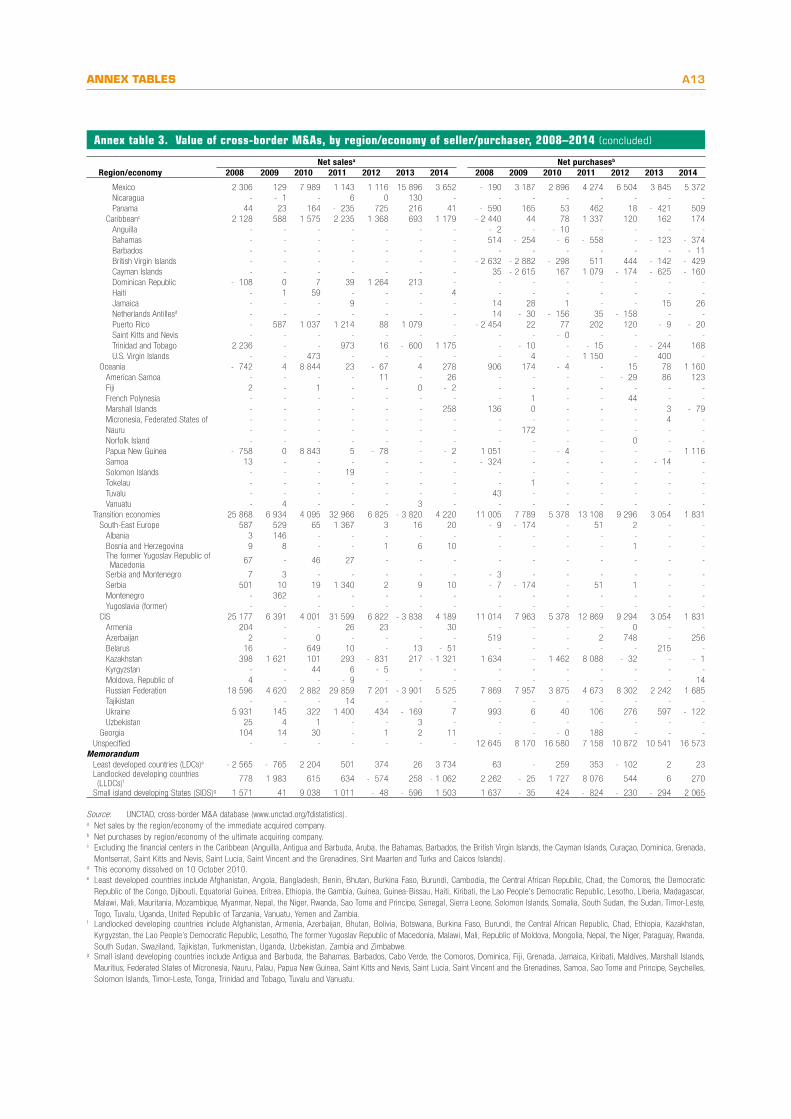
Annex table 3. Value of cross-border M&As, by region/economy of seller/purchaser, 2008–2014 (concluded)
Net salesa Net purchasesb
Region/economy 2008 2009 2010 2011 2012 2013 2014 2008 2009 2010 2011 2012 2013 2014
Mexico 2 306 129 7 989 1 143 1 116 15 896 3 652 - 190 3 187 2 896 4 274 6 504 3 845 5 372Nicaragua - - 1 - 6 0 130 - - - - - - - -Panama 44 23 164 - 235 725 216 41 - 590 165 53 462 18 - 421 509
Caribbeanc 2 128 588 1 575 2 235 1 368 693 1 179 - 2 440 44 78 1 337 120 162 174Anguilla - - - - - - - - 2 - - 10 - - - -Bahamas - - - - - - - 514 - 254 - 6 - 558 - - 123 - 374Barbados - - - - - - - - - - - - - - 11British Virgin Islands - - - - - - - - 2 632 - 2 882 - 298 511 444 - 142 - 429Cayman Islands - - - - - - - 35 - 2 615 167 1 079 - 174 - 625 - 160Dominican Republic - 108 0 7 39 1 264 213 - - - - - - - -Haiti - 1 59 - - - 4 - - - - - - -Jamaica - - - 9 - - - 14 28 1 - - 15 26Netherlands Antillesd - - - - - - - 14 - 30 - 156 35 - 158 - -Puerto Rico - 587 1 037 1 214 88 1 079 - - 2 454 22 77 202 120 - 9 - 20Saint Kitts and Nevis - - - - - - - - - - 0 - - - -Trinidad and Tobago 2 236 - - 973 16 - 600 1 175 - - 10 - - 15 - - 244 168U.S. Virgin Islands - - 473 - - - - - 4 - 1 150 - 400 -
Oceania - 742 4 8 844 23 - 67 4 278 906 174 - 4 - 15 78 1 160American Samoa - - - - 11 - 26 - - - - - 29 86 123Fiji 2 - 1 - - 0 - 2 - - - - - - -French Polynesia - - - - - - - - 1 - - 44 - -Marshall Islands - - - - - - 258 136 0 - - - 3 - 79Micronesia, Federated States of - - - - - - - - - - - - 4 -Nauru - - - - - - - - 172 - - - - -Norfolk Island - - - - - - - - - - - 0 - -Papua New Guinea - 758 0 8 843 5 - 78 - - 2 1 051 - - 4 - - - 1 116Samoa 13 - - - - - - - 324 - - - - - 14 -Solomon Islands - - - 19 - - - - - - - - - -Tokelau - - - - - - - - 1 - - - - -Tuvalu - - - - - - - 43 - - - - - -Vanuatu - 4 - - - 3 - - - - - - - -
Transition economies 25 868 6 934 4 095 32 966 6 825 - 3 820 4 220 11 005 7 789 5 378 13 108 9 296 3 054 1 831South-East Europe 587 529 65 1 367 3 16 20 - 9 - 174 - 51 2 - -
Albania 3 146 - - - - - - - - - - - -Bosnia and Herzegovina 9 8 - - 1 6 10 - - - - 1 - -The former Yugoslav Republic of Macedonia 67 - 46 27 - - - - - - - - - -
Serbia and Montenegro 7 3 - - - - - - 3 - - - - - -Serbia 501 10 19 1 340 2 9 10 - 7 - 174 - 51 1 - -Montenegro - 362 - - - - - - - - - - - -Yugoslavia (former) - - - - - - - - - - - - - -
CIS 25 177 6 391 4 001 31 599 6 822 - 3 838 4 189 11 014 7 963 5 378 12 869 9 294 3 054 1 831Armenia 204 - - 26 23 - 30 - - - - 0 - -Azerbaijan 2 - 0 - - - - 519 - - 2 748 - 256Belarus 16 - 649 10 - 13 - 51 - - - - - 215 -Kazakhstan 398 1 621 101 293 - 831 217 - 1 321 1 634 - 1 462 8 088 - 32 - - 1Kyrgyzstan - - 44 6 - 5 - - - - - - - - -Moldova, Republic of 4 - - - 9 - - - - - - - - - 14Russian Federation 18 596 4 620 2 882 29 859 7 201 - 3 901 5 525 7 869 7 957 3 875 4 673 8 302 2 242 1 685Tajikistan - - - 14 - - - - - - - - - -Ukraine 5 931 145 322 1 400 434 - 169 7 993 6 40 106 276 597 - 122Uzbekistan 25 4 1 - - 3 - - - - - - - -
Georgia 104 14 30 - 1 2 11 - - - 0 188 - - -Unspecified - - - - - - - 12 645 8 170 16 580 7 158 10 872 10 541 16 573
MemorandumLeast developed countries (LDCs)e - 2 565 - 765 2 204 501 374 26 3 734 63 - 259 353 - 102 2 23Landlocked developing countries (LLDCs)f 778 1 983 615 634 - 574 258 - 1 062 2 262 - 25 1 727 8 076 544 6 270
Small island developing States (SIDS)g 1 571 41 9 038 1 011 - 48 - 596 1 503 1 637 - 35 424 - 824 - 230 - 294 2 065
Source: UNCTAD, cross-border M&A database (www.unctad.org/fdistatistics).a Net sales by the region/economy of the immediate acquired company.b Net purchases by region/economy of the ultimate acquiring company.c Excluding the financial centers in the Caribbean (Anguilla, Antigua and Barbuda, Aruba, the Bahamas, Barbados, the British Virgin Islands, the Cayman Islands, Curaçao, Dominica, Grenada,
Montserrat, Saint Kitts and Nevis, Saint Lucia, Saint Vincent and the Grenadines, Sint Maarten and Turks and Caicos Islands).d This economy dissolved on 10 October 2010.e Least developed countries include Afghanistan, Angola, Bangladesh, Benin, Bhutan, Burkina Faso, Burundi, Cambodia, the Central African Republic, Chad, the Comoros, the Democratic
Republic of the Congo, Djibouti, Equatorial Guinea, Eritrea, Ethiopia, the Gambia, Guinea, Guinea-Bissau, Haiti, Kiribati, the Lao People’s Democratic Republic, Lesotho, Liberia, Madagascar, Malawi, Mali, Mauritania, Mozambique, Myanmar, Nepal, the Niger, Rwanda, Sao Tome and Principe, Senegal, Sierra Leone, Solomon Islands, Somalia, South Sudan, the Sudan, Timor-Leste, Togo, Tuvalu, Uganda, United Republic of Tanzania, Vanuatu, Yemen and Zambia.
f Landlocked developing countries include Afghanistan, Armenia, Azerbaijan, Bhutan, Bolivia, Botswana, Burkina Faso, Burundi, the Central African Republic, Chad, Ethiopia, Kazakhstan, Kyrgyzstan, the Lao People’s Democratic Republic, Lesotho, The former Yugoslav Republic of Macedonia, Malawi, Mali, Republic of Moldova, Mongolia, Nepal, the Niger, Paraguay, Rwanda, South Sudan, Swaziland, Tajikistan, Turkmenistan, Uganda, Uzbekistan, Zambia and Zimbabwe.
g Small island developing countries include Antigua and Barbuda, the Bahamas, Barbados, Cabo Verde, the Comoros, Dominica, Fiji, Grenada, Jamaica, Kiribati, Maldives, Marshall Islands, Mauritius, Federated States of Micronesia, Nauru, Palau, Papua New Guinea, Saint Kitts and Nevis, Saint Lucia, Saint Vincent and the Grenadines, Samoa, Sao Tome and Principe, Seychelles, Solomon Islands, Timor-Leste, Tonga, Trinidad and Tobago, Tuvalu and Vanuatu.
World Investment Report 2015: Reforming International Investment GovernanceA14
Ann
ex t
able
4.
Valu
e of
cro
ss-b
orde
r M
&As
, by
sect
or/i
ndus
try,
200
8–20
14 (
Mill
ions
of
dolla
rs)
Sect
or/i
ndus
try
Net
sal
esa
Net
pur
chas
esb
2008
2009
2010
2011
2012
2013
2014
2008
2009
2010
2011
2012
2013
2014
Tota
l61
7 64
928
7 61
734
7 09
455
3 44
232
8 22
431
2 50
939
8 89
961
7 64
928
7 61
734
7 09
455
3 44
232
8 22
431
2 50
939
8 89
9Pr
imar
y89
495
52 8
0867
509
148
857
51 2
9040
792
39 9
4847
927
27 9
1446
838
93 2
543
309
892
14 1
91Ag
ricul
ture
, hun
ting,
fore
stry
and
fish
erie
s2
920
730
2 52
41
426
7 58
57
422
581
2 17
31
784
408
366
-1 4
23 3
18-
214
Min
ing,
qua
rryi
ng a
nd p
etro
leum
86 5
7452
078
64 9
8514
7 43
143
705
33 3
7039
367
45 7
5426
130
46 4
3092
888
4 73
2 5
7414
405
Man
ufac
turi
ng19
3 61
774
408
133
155
202
289
112
211
116
404
145
911
133
981
38 1
4212
7 79
222
2 83
313
7 81
896
238
174
312
Food
, bev
erag
es a
nd to
bacc
o10
608
5 07
934
762
48 3
4018
509
46 0
4130
994
-43
041
- 46
733
620
31 5
4131
671
35 8
3733
863
Text
iles,
clo
thin
g an
d le
athe
r3
831
425
546
4 19
92
233
4 53
52
891
- 51
546
2 96
32
449
2 50
81
747
929
Woo
d an
d w
ood
prod
ucts
1 02
2 6
12 7
205
060
4 51
62
802
1 36
8 4
081
425
8 38
83
748
3 58
93
018
2 95
5Pu
blis
hing
and
prin
ting
- 34
7-
- 8
- 22
3 3
1 2
0 1
94-
284
30
906
- 11
2 6
5 1
6 4
7Co
ke, p
etro
leum
pro
duct
s an
d nu
clea
r fu
el 9
01
506
1 96
4-1
479
-1 3
07-
663
-9 3
68-3
333
- 84
4-6
802
-2 6
73-3
748
-2 0
03-1
6 06
5Ch
emic
als
and
chem
ical
pro
duct
s76
384
27 7
5233
693
77 0
7538
524
32 0
4972
914
60 8
0226
416
46 8
7489
702
41 4
8528
339
72 4
28Ru
bber
and
pla
stic
pro
duct
s 9
25 0
5 47
12
223
1 71
8 7
60 8
24 4
61-
285
127
1 36
7 5
70 3
682
335
Non
-met
allic
min
eral
pro
duct
s27
103
2 24
76
549
927
1 61
95
733
1 68
123
126
- 56
75
198
1 66
3 7
553
609
2 25
1M
etal
s an
d m
etal
pro
duct
s19
507
- 97
26
635
5 68
78
891
9 49
03
072
21 6
602
746
5 07
518
375
9 70
5 6
4946
114
Mac
hine
ry a
nd e
quip
men
t8
505
2 18
06
349
14 2
511
285
5 29
612
474
7 83
71
814
5 91
014
564
12 8
366
804
7 17
9El
ectri
cal a
nd e
lect
roni
c eq
uipm
ent
21 4
7719
763
21 2
7827
525
22 2
317
516
20 3
4347
336
4 71
311
758
39 4
4026
821
13 5
6716
502
Mot
or v
ehic
les
and
othe
r tra
nspo
rt eq
uipm
ent
13 5
6912
539
8 64
44
299
6 91
31
234
508
9 22
1 7
36
737
10 8
994
902
1 05
8-
897
Oth
er m
anuf
actu
ring
10 9
433
277
6 55
114
406
7 04
81
592
8 01
79
839
2 54
07
040
11 8
706
661
3 22
96
671
Serv
ices
334
536
160
401
146
430
202
296
164
723
155
312
213
040
435
741
221
562
172
464
237
355
187
097
215
378
210
396
Elec
trici
ty, g
as a
nd w
ater
48 0
8759
048
-6 7
8421
100
11 9
239
988
17 8
3626
510
44 2
46-1
4 84
16
758
3 12
87
739
16 8
77Co
nstru
ctio
n4
568
11 6
4610
642
3 06
22
253
3 17
42
345
-2 8
90-2
561
-2 0
01-1
575
2 77
44
823
992
Trad
e29
132
3 55
47
195
15 2
8512
730
-4 1
6524
579
18 8
663
821
6 10
46
412
23 1
88-1
591
28 4
96Ac
com
mod
atio
n an
d fo
od s
ervi
ce a
ctiv
ities
6 40
2 7
941
907
1 49
4-
501
4 53
716
825
3 50
7 3
54 8
67 6
84-1
847
925
16 7
92Tr
ansp
orta
tion
and
stor
age
14 7
895
456
10 6
9016
009
10 4
015
708
10 3
816
993
3 65
17
637
6 59
59
129
3 46
14
944
Info
rmat
ion
and
com
mun
icat
ion
28 4
4145
074
19 2
1324
934
34 8
7531
079
-61
969
49 4
6138
880
19 3
0622
954
17 4
1726
874
-78
695
Fina
nce
103
585
17 1
2658
480
64 6
9837
717
49 5
7513
4 86
131
2 97
512
5 83
513
8 01
616
8 03
311
3 47
514
5 89
318
4 13
2Bu
sine
ss s
ervi
ces
88 4
0814
483
30 6
0948
283
43 7
0743
807
51 6
3032
050
7 77
316
864
26 4
2318
839
26 5
9333
388
Publ
ic a
dmin
istra
tion
and
defe
nce
4 20
91
271
1 38
02
910
3 60
24
078
4 32
2-1
1 11
8-
594
-4 3
03-
288
-1 1
65-1
049
-4 5
23Ed
ucat
ion
1 22
5 5
09 8
81 6
85 2
13 7
61
256
155
51
310
112
317
-1 0
40 1
25H
ealth
and
soc
ial s
ervi
ces
2 94
4 6
539
936
2 94
76
636
4 08
51
892
- 73
0 1
873
815
729
954
2 31
52
652
Arts
, ent
erta
inm
ent a
nd r
ecre
atio
n1
956
525
1 56
5 7
26 9
711
591
6 31
21
116
- 77
635
526
275
406
4 92
3O
ther
ser
vice
act
iviti
es 7
93 2
63 7
15 1
64 1
961
780
2 76
9-1
154
- 3
55
- 9
615
29
292
Source:
UNCT
AD, c
ross
-bor
der
M&
A da
taba
se (w
ww.
unct
ad.o
rg/f
dist
atis
tics)
.a
Net
sal
es in
the
indu
stry
of t
he a
cqui
red
com
pany
.b
Net
pur
chas
es b
y th
e in
dust
ry o
f the
acq
uirin
g co
mpa
ny.
Note:
Cros
s-bo
rder
M&
A sa
les
and
purc
hase
s ar
e ca
lcul
ated
on
a ne
t bas
is a
s fo
llow
s: N
et c
ross
-bor
der
M&
As s
ales
by
sect
or/in
dust
ry =
Sal
es o
f com
pani
es in
the
indu
stry
of t
he a
cqui
red
com
pany
to fo
reig
n M
NEs
(-)
Sal
es o
f for
eign
affi
liate
s in
the
indu
stry
of t
he a
cqui
red
com
pany
; net
cro
ss-b
orde
r M
&A
purc
hase
s by
sec
tor/
indu
stry
= P
urch
ases
of c
ompa
nies
abr
oad
by h
ome-
base
d M
NEs
, in
the
indu
stry
of t
he a
cqui
ring
com
pany
(-) S
ales
of f
orei
gn a
ffilia
tes
of h
ome-
base
d M
NEs
, in
the
indu
stry
of t
he a
cqui
ring
com
pany
. The
dat
a co
ver
only
thos
e de
als
that
invo
lved
an
acqu
isiti
on o
f an
equi
ty s
take
of m
ore
than
10
per
cent
.
ANNEX TABLES A15 A
nnex
tab
le 5
. Cro
ss-b
orde
r M
&A
deal
s w
orth
ove
r $3
bill
ion
com
plet
ed in
201
4
Ran
kVa
lue
($ b
illio
n)A
cqui
red
com
pany
Hos
t ec
onom
yaIn
dust
ry o
f th
e ac
quir
ed c
ompa
nyA
cqui
ring
com
pany
Hom
e ec
onom
yaIn
dust
ry o
f th
e ac
quir
ing
com
pany
Shar
es
acqu
ired
1 1
30.3
Veriz
on W
irele
ss In
cUn
ited
Stat
esRa
diot
elep
hone
com
mun
icat
ions
Veriz
on C
omm
unic
atio
ns In
cUn
ited
Stat
esTe
leph
one
com
mun
icat
ions
, exc
ept r
adio
tele
phon
e 4
52
42.
2CI
TIC
Ltd
Chin
aIn
vest
men
t adv
ice
CITI
C Pa
cific
Ltd
Hong
Kon
g, C
hina
Stee
l wor
ks, b
last
furn
aces
and
rollin
g m
ills 1
003
23.
1So
ciet
e Fr
anca
ise d
u Ra
diot
elep
hone
SA
Fran
ceTe
leph
one
com
mun
icat
ions
, exc
ept r
adio
tele
phon
eNu
mer
icab
le G
roup
SA
Fran
ceCa
ble
and
othe
r pay
tele
visio
n se
rvic
es 1
004
15.
3Al
lianc
e Bo
ots
GmbH
Switz
erla
ndDr
ug s
tore
s an
d pr
oprie
tary
sto
res
Wal
gree
n Co
Unite
d St
ates
Drug
sto
res
and
prop
rieta
ry s
tore
s 5
55
14.
2M
erck
& C
o In
c-Co
nsum
er C
are
Busin
ess
Unite
d St
ates
Phar
mac
eutic
al p
repa
ratio
nsBa
yer A
GGe
rman
yCh
emic
als
and
chem
ical
pre
para
tions
, nec
100
6 1
3.9
Beam
Inc
Unite
d St
ates
Win
es, b
rand
y an
d br
andy
spi
rits
Sunt
ory
Hold
ings
Ltd
Japa
nM
alt b
ever
ages
100
7 1
3.4
Tim
Hor
tons
Inc
Cana
daEa
ting
plac
esBu
rger
Kin
g W
orld
wid
e In
cUn
ited
Stat
esEa
ting
plac
es 1
008
11.
2E-
Plus
Mob
ilfun
k Gm
bH &
Co
KGGe
rman
yRa
diot
elep
hone
com
mun
icat
ions
Tele
foni
ca D
euts
chla
nd H
oldi
ng A
GGe
rman
yTe
leph
one
com
mun
icat
ions
, exc
ept r
adio
tele
phon
e 1
009
10.
0Gr
upo
Corp
orat
ivo O
NO S
ASp
ain
Tele
phon
e co
mm
unic
atio
ns, e
xcep
t rad
iote
leph
one
Voda
fone
Hol
ding
s Eu
rope
SLU
Spai
nRa
diot
elep
hone
com
mun
icat
ions
100
10 9
.1Co
ncur
Tec
hnol
ogie
s In
cUn
ited
Stat
esPr
epac
kage
d so
ftwar
eSA
P Am
eric
a In
cUn
ited
Stat
esPr
epac
kage
d so
ftwar
e 1
0011
9.1
Scan
ia A
BSw
eden
Mot
or v
ehic
les
and
pass
enge
r car
bod
ies
Volk
swag
en A
GGe
rman
yM
otor
veh
icle
s an
d pa
ssen
ger c
ar b
odie
s 3
712
8.3
Inte
rMun
e In
cUn
ited
Stat
esBi
olog
ical
pro
duct
s, ex
cept
dia
gnos
tic s
ubst
ance
sRo
che
Hold
ing
AGSw
itzer
land
Phar
mac
eutic
al p
repa
ratio
ns 1
0013
7.0
Xstra
ta P
eru
SAPe
ruCo
pper
ore
sM
MG
Sout
h Am
eric
a M
anag
emen
t Co
Ltd
Hong
Kon
g, C
hina
Inve
stm
ent o
ffice
s, ne
c 1
0014
6.8
Athl
on E
nerg
y In
cUn
ited
Stat
esCr
ude
petro
leum
and
nat
ural
gas
Enca
na C
orp
Cana
daCr
ude
petro
leum
and
nat
ural
gas
100
15 6
.8Zi
ggo
NVNe
ther
land
sCa
ble
and
othe
r pay
tele
visio
n se
rvic
esLi
berty
Glo
bal P
LCUn
ited
King
dom
Cabl
e an
d ot
her p
ay te
levis
ion
serv
ices
72
16 5
.8O
rient
al B
rew
ery
Co L
tdKo
rea,
Rep
ublic
of
Mal
t bev
erag
esAn
heus
er-B
usch
Inbe
vBe
lgiu
mM
alt b
ever
ages
100
17 5
.7AS
Wat
son
Hold
ings
Ltd
Hong
Kon
g, C
hina
Reta
il st
ores
, nec
May
on In
vest
men
ts P
te L
tdSi
ngap
ore
Inve
stor
s, ne
c 2
518
5.7
Itiss
alat
Al M
aghr
ib S
AM
oroc
coTe
leph
one
com
mun
icat
ions
, exc
ept r
adio
tele
phon
eEm
irate
s Te
leco
mm
unic
atio
ns C
orp
Unite
d Ar
ab E
mira
tes
Tele
phon
e co
mm
unic
atio
ns, e
xcep
t rad
iote
leph
one
53
19 5
.6Q
uest
cor P
harm
aceu
tical
s In
cUn
ited
Stat
esPh
arm
aceu
tical
pre
para
tions
Mal
linck
rodt
PLC
Irela
ndPh
arm
aceu
tical
pre
para
tions
100
20 5
.4In
tern
atio
nal L
ease
Fin
ance
Cor
pUn
ited
Stat
esEq
uipm
ent r
enta
l and
leas
ing,
nec
AerC
ap H
oldi
ngs
NVNe
ther
land
sEq
uipm
ent r
enta
l and
leas
ing,
nec
100
21 5
.4Ga
tes
Corp
Unite
d St
ates
Rubb
er a
nd p
last
ics
hose
and
bel
ting
Blac
ksto
ne G
roup
LP
Unite
d St
ates
Inve
stor
s, ne
c 1
0022
5.3
YPF
SAAr
gent
ina
Petro
leum
refin
ing
Arge
ntin
aAr
gent
ina
Natio
nal g
over
nmen
t 5
123
5.2
Broo
kfie
ld O
ffice
Pro
perti
es In
cCa
nada
Ope
rato
rs o
f non
resid
entia
l bui
ldin
gsBr
ookf
ield
Pro
perty
Par
tner
s LP
Berm
uda
Real
est
ate
inve
stm
ent t
rust
s 5
124
5.0
Inve
nsys
PLC
Unite
d Ki
ngdo
mPr
oces
s co
ntro
l ins
trum
ents
Schn
eide
r Ele
ctric
SA
Fran
cePo
wer
, dist
ribut
ion
and
spec
ialty
tran
sfor
mer
s 1
0025
5.0
Noki
a O
yj-De
vices
& S
ervic
es B
usin
ess
Finl
and
Radi
o an
d TV
bro
adca
stin
g an
d co
mm
unica
tions
equ
ipm
ent
Mic
roso
ft Co
rpUn
ited
Stat
esPr
epac
kage
d so
ftwar
e 1
0026
4.9
Old
ford
Gro
up L
tdIs
le o
f Man
Amus
emen
t and
recr
eatio
n sv
csAm
aya
Gam
ing
Grou
p In
cCa
nada
Amus
emen
t and
recr
eatio
n sv
cs 1
0027
4.9
Sky
Deut
schl
and
AGGe
rman
yCa
ble
and
othe
r pay
tele
visio
n se
rvic
esKr
onen
Tau
send
985
GmbH
Germ
any
Cabl
e an
d ot
her p
ay te
levis
ion
serv
ices
57
28 4
.8W
ing
Hang
Ban
k Lt
dHo
ng K
ong,
Chi
naBa
nks
OCB
C Pe
arl L
tdSi
ngap
ore
Bank
s 9
829
4.8
Cele
sio A
GGe
rman
yDr
ugs,
drug
pro
prie
tarie
s an
d dr
uggi
sts’
sun
drie
sDr
agon
fly G
mbH
& C
o Kg
aAGe
rman
yDr
ugs,
drug
pro
prie
tarie
s an
d dr
uggi
sts’
sun
drie
s 7
430
4.7
OAO
RN
Hold
ing
Russ
ian
Fede
ratio
nCr
ude
petro
leum
and
nat
ural
gas
Novy
Inve
stm
ents
Ltd
Cypr
usIn
vest
ors,
nec
12
31 4
.6O
iltan
king
Par
tner
s LP
Unite
d St
ates
Natu
ral g
as tr
ansm
issio
n an
d di
strib
utio
nEn
terp
rise
Prod
ucts
Par
tner
s LP
Unite
d St
ates
Natu
ral g
as tr
ansm
issio
n 6
632
4.6
TUI T
rave
l PLC
Unite
d Ki
ngdo
mTr
avel
age
ncie
sTU
I AG
Germ
any
Trav
el a
genc
ies
54
33 4
.6Re
psol
SA-
Liqu
efie
d Na
tura
l Gas
Bus
ines
sPe
ruNa
tura
l gas
liqu
ids
Roya
l Dut
ch S
hell
PLC
Neth
erla
nds
Crud
e pe
trole
um a
nd n
atur
al g
as 1
0034
4.5
UNS
Ener
gy C
orp
Unite
d St
ates
Elec
tric
serv
ices
Forti
s In
cCa
nada
Elec
tric
serv
ices
100
35 4
.3Br
istol
-Mye
rs S
quib
b Co
-Dia
bete
s Bu
sines
sUn
ited
Stat
esPh
arm
aceu
tical
pre
para
tions
Astra
Zene
ca A
BSw
eden
Phar
mac
eutic
al p
repa
ratio
ns 1
0036
4.2
Viro
Phar
ma
Inc
Unite
d St
ates
Phar
mac
eutic
al p
repa
ratio
nsSh
ire P
LCIre
land
Phar
mac
eutic
al p
repa
ratio
ns 8
837
4.2
Sky
Italia
Cap
ital
Italy
Cabl
e an
d ot
her p
ay te
levis
ion
serv
ices
Sky
Italia
n Ho
ldin
gsIta
lyIn
vest
men
t offi
ces,
nec
100
38 4
.0No
ble
Agri
Ltd
Hong
Kon
g, C
hina
Grai
n an
d fie
ld b
eans
Inve
stor
Gro
upCh
ina
Inve
stor
s, ne
c 5
139
4.0
Groh
e AG
Germ
any
Plas
tics
plum
bing
fixt
ures
Inve
stor
Gro
upJa
pan
Inve
stor
s, ne
c 8
840
3.7
Chry
sler G
roup
LLC
Unite
d St
ates
Mot
or v
ehic
les
and
pass
enge
r car
bod
ies
Fiat
Nor
th A
mer
ica
LLC
Unite
d St
ates
Auto
mob
iles
and
othe
r mot
or v
ehic
les
41
41 3
.5JP
Mor
gan
Chas
e &
Co-
Phys
ical
Com
mod
ities
Bus
ines
sUn
ited
Stat
esNa
tiona
l com
mer
cial
ban
ksM
ercu
ria E
nerg
y Gr
oup
Ltd
Switz
erla
ndPe
trole
um a
nd p
etro
leum
pro
duct
s w
hole
sale
rs, n
ec 1
0042
3.4
Engi
ne H
oldi
ng G
mbH
Germ
any
Mot
or v
ehic
le p
arts
and
acc
esso
ries
Rolls
-Roy
ce H
oldi
ngs
PLC
Unite
d Ki
ngdo
mTu
rbin
es a
nd tu
rbin
e ge
nera
tor s
ets
50
43 3
.3CF
R Ph
arm
aceu
tical
SA
Chile
Phar
mac
eutic
al p
repa
ratio
nsAb
bott
Labo
rato
ries
Unite
d St
ates
Phar
mac
eutic
al p
repa
ratio
ns 1
0044
3.3
Tele
foni
ca C
zech
Rep
ublic
as
Czec
h Re
publ
icRa
diot
elep
hone
com
mun
icat
ions
PPF
Grou
p NV
Neth
erla
nds
Inve
stor
s, ne
c 6
645
3.3
Banc
o Sa
ntan
der(B
rasil
)SA
Braz
ilBa
nks
Banc
o Sa
ntan
der S
ASp
ain
Bank
s 7
46 3
.2Li
ndor
ff Gr
oup
ABNo
rway
Adju
stm
ent a
nd c
olle
ctio
n se
rvic
esLi
ndor
ff Gr
oup
AB S
PVSw
eden
Inve
stm
ent o
ffice
s, ne
c 1
0047
3.2
Cia
Gene
ral d
e El
ectri
cida
d SA
Chile
Elec
tric
serv
ices
Gas
Natu
ral F
enos
a Ch
ile S
pACh
ileNa
tura
l gas
tran
smiss
ion
97
48 3
.2Ne
ts H
oldi
ng A
/SDe
nmar
kFu
nctio
ns re
late
d to
dep
osito
ry b
anki
ng, n
ecIn
vest
or G
roup
Unite
d St
ates
Inve
stor
s, ne
c 1
0049
3.1
Mot
orol
a M
obilit
y Ho
ldin
gs In
cUn
ited
Stat
esRa
dio
and
TV b
road
cast
ing
and
com
mun
icatio
ns e
quip
men
tLe
novo
Gro
up L
tdHo
ng K
ong,
Chi
naEl
ectro
nic
com
pute
rs 1
0050
3.1
WIL
D Fl
avor
s Gm
bHSw
itzer
land
Flav
orin
g ex
tract
s an
d fla
vorin
g sy
rups
, nec
Arch
er D
anie
ls M
idla
nd C
oUn
ited
Stat
esCo
ttons
eed
oil m
ills 1
0051
3.1
Free
port-
McM
oRan
Oil
& G
as L
LC-
Eagl
e Fo
rd S
hale
Ass
ets
Unite
d St
ates
Crud
e pe
trole
um a
nd n
atur
al g
asEn
Cana
Oil
& G
as(U
SA)In
cUn
ited
Stat
esCr
ude
petro
leum
and
nat
ural
gas
100
52 3
.1Ca
stle
Pea
k Po
wer
Co
Ltd
Hong
Kon
g, C
hina
Elec
tric
serv
ices
Inve
stor
Gro
upCh
ina
Inve
stor
s, ne
c 6
053
3.1
Rotta
phar
m S
pAIta
lyPh
arm
aceu
tical
pre
para
tions
Med
a AB
Swed
enPh
arm
aceu
tical
pre
para
tions
100
54 3
.0Fi
rth R
ixson
Ltd
Unite
d Ki
ngdo
mAl
umin
um ro
lling
and
draw
ing,
nec
Alco
a In
cUn
ited
Stat
esRo
lling,
dra
win
g an
d ex
trudi
ng o
f non
ferro
us m
etal
s 1
00
Source:
UNCT
AD, c
ross
-bor
der
M&
A da
taba
se (w
ww.
unct
ad.o
rg/f
dist
atis
tics)
.a I
mm
edia
te c
ount
ry.
Note:
As lo
ng a
s th
e ul
timat
e ho
st e
cono
my
is d
iffer
ent f
rom
the
ultim
ate
hom
e ec
onom
y, M
&A
deal
s th
at w
ere
unde
rtake
n w
ithin
the
sam
e ec
onom
y ar
e st
ill co
nsid
ered
cro
ss-b
orde
r M
&As
. nec
= n
ot e
lsew
here
cla
ssifi
ed.
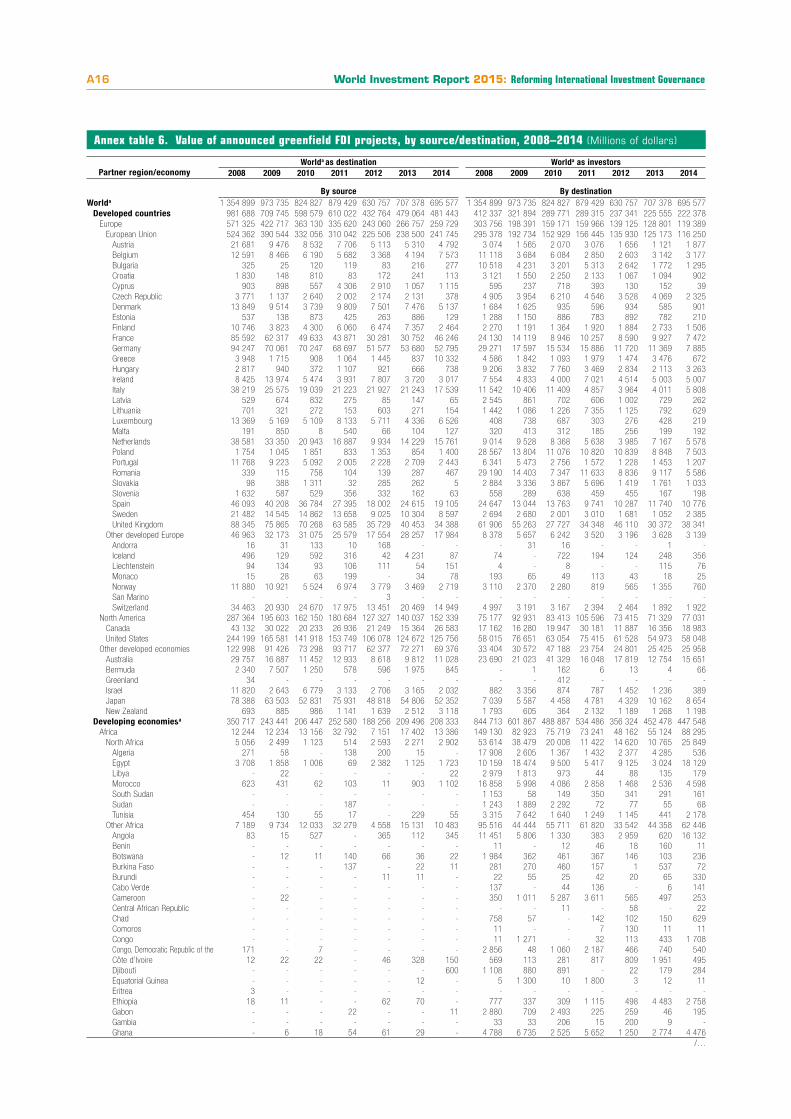
World Investment Report 2015: Reforming International Investment GovernanceA16
Annex table 6. Value of announced greenfield FDI projects, by source/destination, 2008–2014 (Millions of dollars)
Worlda as destination Worlda as investorsPartner region/economy 2008 2009 2010 2011 2012 2013 2014 2008 2009 2010 2011 2012 2013 2014
By source By destinationWorlda 1 354 899 973 735 824 827 879 429 630 757 707 378 695 577 1 354 899 973 735 824 827 879 429 630 757 707 378 695 577
Developed countries 981 688 709 745 598 579 610 022 432 764 479 064 481 443 412 337 321 894 289 771 289 315 237 341 225 555 222 378Europe 571 325 422 717 363 130 335 620 243 060 266 757 259 729 303 756 198 391 159 171 159 966 139 125 128 801 119 389
European Union 524 362 390 544 332 056 310 042 225 506 238 500 241 745 295 378 192 734 152 929 156 445 135 930 125 173 116 250Austria 21 681 9 476 8 532 7 706 5 113 5 310 4 792 3 074 1 565 2 070 3 076 1 656 1 121 1 877Belgium 12 591 8 466 6 190 5 682 3 368 4 194 7 573 11 118 3 684 6 084 2 850 2 603 3 142 3 177Bulgaria 325 25 120 119 83 216 277 10 518 4 231 3 201 5 313 2 642 1 772 1 295Croatia 1 830 148 810 83 172 241 113 3 121 1 550 2 250 2 133 1 067 1 094 902Cyprus 903 898 557 4 306 2 910 1 057 1 115 595 237 718 393 130 152 39Czech Republic 3 771 1 137 2 640 2 002 2 174 2 131 378 4 905 3 954 6 210 4 546 3 528 4 069 2 325Denmark 13 849 9 514 3 739 9 809 7 501 7 476 5 137 1 684 1 625 935 596 934 585 901Estonia 537 138 873 425 263 886 129 1 288 1 150 886 783 892 782 210Finland 10 746 3 823 4 300 6 060 6 474 7 357 2 464 2 270 1 191 1 364 1 920 1 884 2 733 1 506France 85 592 62 317 49 633 43 871 30 281 30 752 46 246 24 130 14 119 8 946 10 257 8 590 9 927 7 472Germany 94 247 70 061 70 247 68 697 51 577 53 680 52 795 29 271 17 597 15 534 15 886 11 720 11 369 7 885Greece 3 948 1 715 908 1 064 1 445 837 10 332 4 586 1 842 1 093 1 979 1 474 3 476 672Hungary 2 817 940 372 1 107 921 666 738 9 206 3 832 7 760 3 469 2 834 2 113 3 263Ireland 8 425 13 974 5 474 3 931 7 807 3 720 3 017 7 554 4 833 4 000 7 021 4 514 5 003 5 007Italy 38 219 25 575 19 039 21 223 21 927 21 243 17 539 11 542 10 406 11 409 4 857 3 964 4 011 5 808Latvia 529 674 832 275 85 147 65 2 545 861 702 606 1 002 729 262Lithuania 701 321 272 153 603 271 154 1 442 1 086 1 226 7 355 1 125 792 629Luxembourg 13 369 5 169 5 109 8 133 5 711 4 336 6 526 408 738 687 303 276 428 219Malta 191 850 8 540 66 104 127 320 413 312 185 256 199 192Netherlands 38 581 33 350 20 943 16 887 9 934 14 229 15 761 9 014 9 528 8 368 5 638 3 985 7 167 5 578Poland 1 754 1 045 1 851 833 1 353 854 1 400 28 567 13 804 11 076 10 820 10 839 8 848 7 503Portugal 11 768 9 223 5 092 2 005 2 228 2 709 2 443 6 341 5 473 2 756 1 572 1 228 1 453 1 207Romania 339 115 758 104 139 287 467 29 190 14 403 7 347 11 633 8 836 9 117 5 586Slovakia 98 388 1 311 32 285 262 5 2 884 3 336 3 867 5 696 1 419 1 761 1 033Slovenia 1 632 587 529 356 332 162 63 558 289 638 459 455 167 198Spain 46 093 40 208 36 784 27 395 18 002 24 615 19 105 24 647 13 044 13 763 9 741 10 287 11 740 10 776Sweden 21 482 14 545 14 862 13 658 9 025 10 304 8 597 2 694 2 680 2 001 3 010 1 681 1 052 2 385United Kingdom 88 345 75 865 70 268 63 585 35 729 40 453 34 388 61 906 55 263 27 727 34 348 46 110 30 372 38 341
Other developed Europe 46 963 32 173 31 075 25 579 17 554 28 257 17 984 8 378 5 657 6 242 3 520 3 196 3 628 3 139Andorra 16 31 133 10 168 - - - 31 16 - - 1 -Iceland 496 129 592 316 42 4 231 87 74 - 722 194 124 248 356Liechtenstein 94 134 93 106 111 54 151 4 - 8 - - 115 76Monaco 15 28 63 199 - 34 78 193 65 49 113 43 18 25Norway 11 880 10 921 5 524 6 974 3 779 3 469 2 719 3 110 2 370 2 280 819 565 1 355 760San Marino - - - - 3 - - - - - - - - -Switzerland 34 463 20 930 24 670 17 975 13 451 20 469 14 949 4 997 3 191 3 167 2 394 2 464 1 892 1 922
North America 287 364 195 603 162 150 180 684 127 327 140 037 152 339 75 177 92 931 83 413 105 596 73 415 71 329 77 031Canada 43 132 30 022 20 233 26 936 21 249 15 364 26 583 17 162 16 280 19 947 30 181 11 887 16 356 18 983United States 244 199 165 581 141 918 153 749 106 078 124 672 125 756 58 015 76 651 63 054 75 415 61 528 54 973 58 048
Other developed economies 122 998 91 426 73 298 93 717 62 377 72 271 69 376 33 404 30 572 47 188 23 754 24 801 25 425 25 958Australia 29 757 16 887 11 452 12 933 8 618 9 812 11 028 23 690 21 023 41 329 16 048 17 819 12 754 15 651Bermuda 2 340 7 507 1 250 578 596 1 975 845 - 1 162 6 13 4 66Greenland 34 - - - - - - - - 412 - - - -Israel 11 820 2 643 6 779 3 133 2 706 3 165 2 032 882 3 356 874 787 1 452 1 236 389Japan 78 388 63 503 52 831 75 931 48 818 54 806 52 352 7 039 5 587 4 458 4 781 4 329 10 162 8 654New Zealand 693 885 986 1 141 1 639 2 512 3 118 1 793 605 364 2 132 1 189 1 268 1 198
Developing economiesa 350 717 243 441 206 447 252 580 188 256 209 496 208 333 844 713 601 867 488 887 534 486 356 324 452 478 447 548Africa 12 244 12 234 13 156 32 792 7 151 17 402 13 386 149 130 82 923 75 719 73 241 48 162 55 124 88 295
North Africa 5 056 2 499 1 123 514 2 593 2 271 2 902 53 614 38 479 20 008 11 422 14 620 10 765 25 849Algeria 271 58 - 138 200 15 - 17 908 2 605 1 367 1 432 2 377 4 285 536Egypt 3 708 1 858 1 006 69 2 382 1 125 1 723 10 159 18 474 9 500 5 417 9 125 3 024 18 129Libya - 22 - - - - 22 2 979 1 813 973 44 88 135 179Morocco 623 431 62 103 11 903 1 102 16 858 5 998 4 086 2 858 1 468 2 536 4 598South Sudan - - - - - - - 1 153 58 149 350 341 291 161Sudan - - - 187 - - - 1 243 1 889 2 292 72 77 55 68Tunisia 454 130 55 17 - 229 55 3 315 7 642 1 640 1 249 1 145 441 2 178
Other Africa 7 189 9 734 12 033 32 279 4 558 15 131 10 483 95 516 44 444 55 711 61 820 33 542 44 358 62 446Angola 83 15 527 - 365 112 345 11 451 5 806 1 330 383 2 959 620 16 132Benin - - - - - - - 11 - 12 46 18 160 11Botswana - 12 11 140 66 36 22 1 984 362 461 367 146 103 236Burkina Faso - - - 137 - 22 11 281 270 460 157 1 537 72Burundi - - - - 11 11 - 22 55 25 42 20 65 330Cabo Verde - - - - - - - 137 - 44 136 - 6 141Cameroon - 22 - - - - - 350 1 011 5 287 3 611 565 497 253Central African Republic - - - - - - - - - 11 - 58 - 22Chad - - - - - - - 758 57 - 142 102 150 629Comoros - - - - - - - 11 - - 7 130 11 11Congo - - - - - - - 11 1 271 - 32 113 433 1 708Congo, Democratic Republic of the 171 - 7 - - - - 2 856 48 1 060 2 187 466 740 540Côte d’Ivoire 12 22 22 - 46 328 150 569 113 281 817 809 1 951 495Djibouti - - - - - - 600 1 108 880 891 - 22 179 284Equatorial Guinea - - - - - 12 - 5 1 300 10 1 800 3 12 11Eritrea 3 - - - - - - - - - - - - -Ethiopia 18 11 - - 62 70 - 777 337 309 1 115 498 4 483 2 758Gabon - - - 22 - - 11 2 880 709 2 493 225 259 46 195Gambia - - - - - - - 33 33 206 15 200 9 -Ghana - 6 18 54 61 29 - 4 788 6 735 2 525 5 652 1 250 2 774 4 476
/…
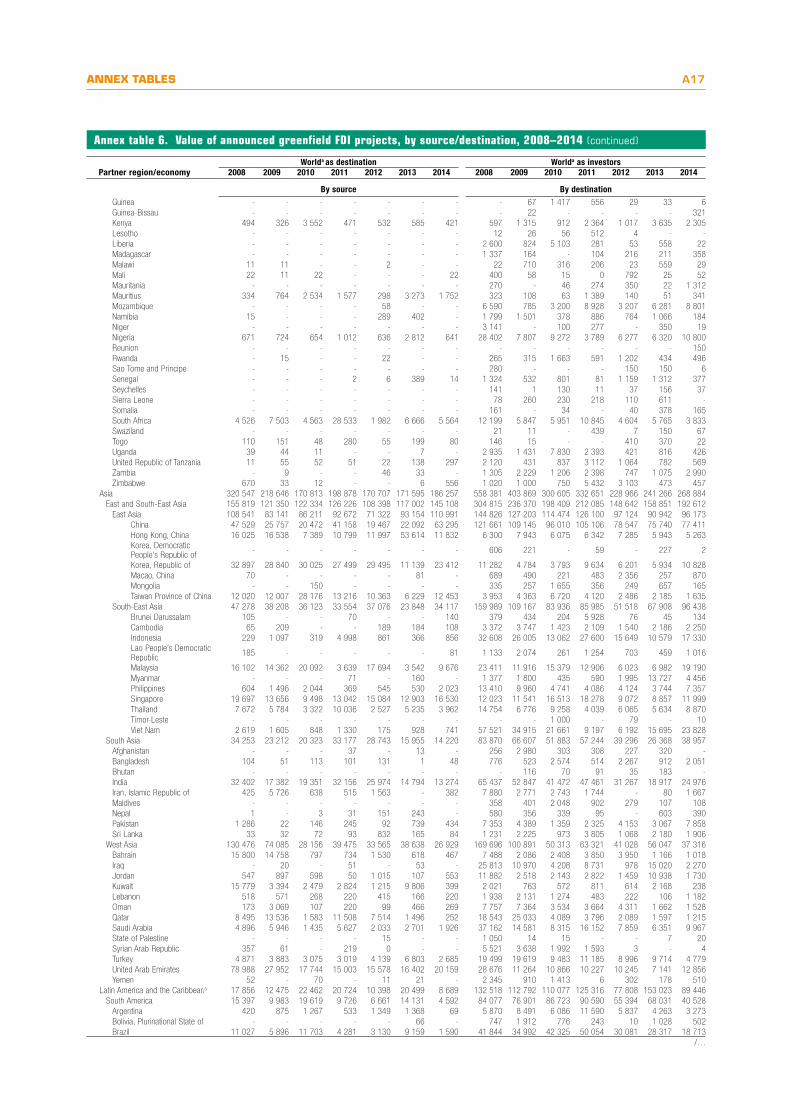
ANNEX TABLES A17
Annex table 6. Value of announced greenfield FDI projects, by source/destination, 2008–2014 (continued)
Worlda as destination Worlda as investorsPartner region/economy 2008 2009 2010 2011 2012 2013 2014 2008 2009 2010 2011 2012 2013 2014
By source By destinationGuinea - - - - - - - - 67 1 417 556 29 33 6Guinea-Bissau - - - - - - - - 22 - - - - 321Kenya 494 326 3 552 471 532 585 421 597 1 315 912 2 364 1 017 3 635 2 305Lesotho - - - - - - - 12 26 56 512 4 - -Liberia - - - - - - - 2 600 824 5 103 281 53 558 22Madagascar - - - - - - - 1 337 164 - 104 216 211 358Malawi 11 11 - - 2 - - 22 710 316 206 23 559 29Mali 22 11 22 - - - 22 400 58 15 0 792 25 52Mauritania - - - - - - - 270 - 46 274 350 22 1 312Mauritius 334 764 2 534 1 577 298 3 273 1 752 323 108 63 1 389 140 51 341Mozambique - - - - 58 - - 6 590 785 3 200 8 928 3 207 6 281 8 801Namibia 15 - - - 289 402 - 1 799 1 501 378 886 764 1 066 184Niger - - - - - - - 3 141 - 100 277 - 350 19Nigeria 671 724 654 1 012 636 2 812 641 28 402 7 807 9 272 3 789 6 277 6 320 10 800Reunion - - - - - - - - - - - - - 150Rwanda - 15 - - 22 - - 265 315 1 663 591 1 202 434 496Sao Tome and Principe - - - - - - - 280 - - - 150 150 6Senegal - - - 2 6 389 14 1 324 532 801 81 1 159 1 312 377Seychelles - - - - - - - 141 1 130 11 37 156 37Sierra Leone - - - - - - - 78 260 230 218 110 611 -Somalia - - - - - - - 161 - 34 - 40 378 165South Africa 4 526 7 503 4 563 28 533 1 982 6 666 5 564 12 199 5 847 5 951 10 845 4 604 5 765 3 833Swaziland - - - - - - - 21 11 - 439 7 150 67Togo 110 151 48 280 55 199 80 146 15 - - 410 370 22Uganda 39 44 11 - - 7 - 2 935 1 431 7 830 2 393 421 816 426United Republic of Tanzania 11 55 52 51 22 138 297 2 120 431 837 3 112 1 064 782 569Zambia - 9 - - 46 33 - 1 305 2 229 1 206 2 398 747 1 075 2 990Zimbabwe 670 33 12 - - 6 556 1 020 1 000 750 5 432 3 103 473 457
Asia 320 547 218 646 170 813 198 878 170 707 171 595 186 257 558 381 403 869 300 605 332 651 228 966 241 266 268 884East and South-East Asia 155 819 121 350 122 334 126 226 108 398 117 002 145 108 304 815 236 370 198 409 212 085 148 642 158 851 192 612
East Asia 108 541 83 141 86 211 92 672 71 322 93 154 110 991 144 826 127 203 114 474 126 100 97 124 90 942 96 173China 47 529 25 757 20 472 41 158 19 467 22 092 63 295 121 661 109 145 96 010 105 106 78 547 75 740 77 411Hong Kong, China 16 025 16 538 7 389 10 799 11 997 53 614 11 832 6 300 7 943 6 075 6 342 7 285 5 943 5 263Korea, Democratic People’s Republic of - - - - - - - 606 221 - 59 - 227 2
Korea, Republic of 32 897 28 840 30 025 27 499 29 495 11 139 23 412 11 282 4 784 3 793 9 634 6 201 5 934 10 828Macao, China 70 - - - - 81 - 689 490 221 483 2 356 257 870Mongolia - - 150 - - - - 335 257 1 655 356 249 657 165Taiwan Province of China 12 020 12 007 28 176 13 216 10 363 6 229 12 453 3 953 4 363 6 720 4 120 2 486 2 185 1 635
South-East Asia 47 278 38 208 36 123 33 554 37 076 23 848 34 117 159 989 109 167 83 936 85 985 51 518 67 908 96 438Brunei Darussalam 105 - - 70 - - 140 379 434 204 5 928 76 45 134Cambodia 65 209 - - 189 184 108 3 372 3 747 1 423 2 109 1 540 2 186 2 250Indonesia 229 1 097 319 4 998 861 366 856 32 608 26 005 13 062 27 600 15 649 10 579 17 330Lao People’s Democratic Republic 185 - - - - - 81 1 133 2 074 261 1 254 703 459 1 016
Malaysia 16 102 14 362 20 092 3 639 17 694 3 542 9 676 23 411 11 916 15 379 12 906 6 023 6 982 19 190Myanmar - - - 71 - 160 - 1 377 1 800 435 590 1 995 13 727 4 456Philippines 604 1 496 2 044 369 545 530 2 023 13 410 9 960 4 741 4 086 4 124 3 744 7 357Singapore 19 697 13 656 9 498 13 042 15 084 12 903 16 530 12 023 11 541 16 513 18 278 9 072 8 857 11 999Thailand 7 672 5 784 3 322 10 036 2 527 5 235 3 962 14 754 6 776 9 258 4 039 6 065 5 634 8 870Timor-Leste - - - - - - - - - 1 000 - 79 - 10Viet Nam 2 619 1 605 848 1 330 175 928 741 57 521 34 915 21 661 9 197 6 192 15 695 23 828
South Asia 34 253 23 212 20 323 33 177 28 743 15 955 14 220 83 870 66 607 51 883 57 244 39 296 26 368 38 957Afghanistan - - - 37 - 13 - 256 2 980 303 308 227 320 -Bangladesh 104 51 113 101 131 1 48 776 523 2 574 514 2 267 912 2 051Bhutan - - - - - - - - 116 70 91 35 183 -India 32 402 17 382 19 351 32 156 25 974 14 794 13 274 65 437 52 847 41 472 47 461 31 267 18 917 24 976Iran, Islamic Republic of 425 5 726 638 515 1 563 - 382 7 880 2 771 2 743 1 744 - 80 1 667Maldives - - - - - - - 358 401 2 048 902 279 107 108Nepal 1 - 3 31 151 243 - 580 356 339 95 - 603 390Pakistan 1 286 22 146 245 92 739 434 7 353 4 389 1 359 2 325 4 153 3 067 7 858Sri Lanka 33 32 72 93 832 165 84 1 231 2 225 973 3 805 1 068 2 180 1 906
West Asia 130 476 74 085 28 156 39 475 33 565 38 638 26 929 169 696 100 891 50 313 63 321 41 028 56 047 37 316Bahrain 15 800 14 758 797 734 1 530 618 467 7 488 2 086 2 408 3 850 3 950 1 166 1 018Iraq - 20 - 51 - 53 - 25 813 10 970 4 208 8 731 978 15 020 2 270Jordan 547 897 598 50 1 015 107 553 11 882 2 518 2 143 2 822 1 459 10 938 1 730Kuwait 15 779 3 394 2 479 2 824 1 215 9 806 399 2 021 763 572 811 614 2 168 238Lebanon 518 571 268 220 415 166 220 1 938 2 131 1 274 483 222 106 1 182Oman 173 3 069 107 220 99 466 269 7 757 7 364 3 534 3 664 4 311 1 662 1 528Qatar 8 495 13 536 1 583 11 508 7 514 1 496 252 18 543 25 033 4 089 3 796 2 089 1 597 1 215Saudi Arabia 4 896 5 946 1 435 5 627 2 033 2 701 1 926 37 162 14 581 8 315 16 152 7 859 6 351 9 967State of Palestine - - - - 15 - - 1 050 14 15 - - 7 20Syrian Arab Republic 357 61 - 219 0 - - 5 521 3 638 1 992 1 593 3 - 4Turkey 4 871 3 883 3 075 3 019 4 139 6 803 2 685 19 499 19 619 9 483 11 185 8 996 9 714 4 779United Arab Emirates 78 988 27 952 17 744 15 003 15 578 16 402 20 159 28 676 11 264 10 866 10 227 10 245 7 141 12 856Yemen 52 - 70 - 11 21 - 2 345 910 1 413 6 302 178 510
Latin America and the Caribbeana 17 856 12 475 22 462 20 724 10 398 20 499 8 689 132 518 112 792 110 077 125 316 77 808 153 023 89 446South America 15 397 9 983 19 619 9 726 6 661 14 131 4 592 84 077 76 901 86 723 90 590 55 394 68 031 40 528
Argentina 420 875 1 267 533 1 349 1 368 69 5 870 8 491 6 086 11 590 5 837 4 263 3 273Bolivia, Plurinational State of - - - - - 66 - 747 1 912 776 243 10 1 028 502Brazil 11 027 5 896 11 703 4 281 3 130 9 159 1 590 41 844 34 992 42 325 50 054 30 081 28 317 18 713
/…
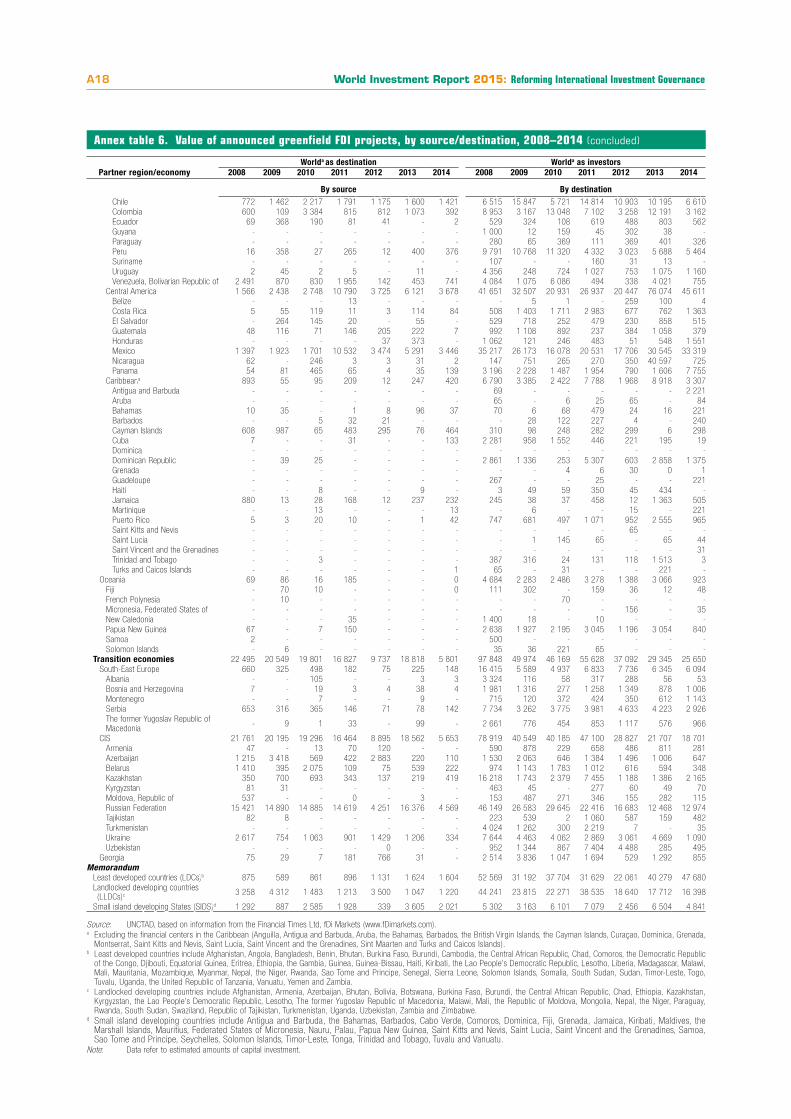
World Investment Report 2015: Reforming International Investment GovernanceA18
Annex table 6. Value of announced greenfield FDI projects, by source/destination, 2008–2014 (concluded)
Worlda as destination Worlda as investorsPartner region/economy 2008 2009 2010 2011 2012 2013 2014 2008 2009 2010 2011 2012 2013 2014
By source By destinationChile 772 1 462 2 217 1 791 1 175 1 600 1 421 6 515 15 847 5 721 14 814 10 903 10 195 6 610Colombia 600 109 3 384 815 812 1 073 392 8 953 3 167 13 048 7 102 3 258 12 191 3 162Ecuador 69 368 190 81 41 - 2 529 324 108 619 488 803 562Guyana - - - - - - - 1 000 12 159 45 302 38 -Paraguay - - - - - - - 280 65 369 111 369 401 326Peru 16 358 27 265 12 400 376 9 791 10 768 11 320 4 332 3 023 5 688 5 464Suriname - - - - - - - 107 - - 160 31 13 -Uruguay 2 45 2 5 - 11 - 4 356 248 724 1 027 753 1 075 1 160Venezuela, Bolivarian Republic of 2 491 870 830 1 955 142 453 741 4 084 1 075 6 086 494 338 4 021 755
Central America 1 566 2 438 2 748 10 790 3 725 6 121 3 678 41 651 32 507 20 931 26 937 20 447 76 074 45 611Belize - - - 13 - - - - 5 1 - 259 100 4Costa Rica 5 55 119 11 3 114 84 508 1 403 1 711 2 983 677 762 1 363El Salvador - 264 145 20 - 55 - 529 718 252 479 230 858 515Guatemala 48 116 71 146 205 222 7 992 1 108 892 237 384 1 058 379Honduras - - - - 37 373 - 1 062 121 246 483 51 548 1 551Mexico 1 397 1 923 1 701 10 532 3 474 5 291 3 446 35 217 26 173 16 078 20 531 17 706 30 545 33 319Nicaragua 62 - 246 3 3 31 2 147 751 265 270 350 40 597 725Panama 54 81 465 65 4 35 139 3 196 2 228 1 487 1 954 790 1 606 7 755
Caribbeana 893 55 95 209 12 247 420 6 790 3 385 2 422 7 788 1 968 8 918 3 307Antigua and Barbuda - - - - - - - 69 - - - - - 2 221Aruba - - - - - - - 65 - 6 25 65 - 84Bahamas 10 35 - 1 8 96 37 70 6 68 479 24 16 221Barbados - - 5 32 21 - - - 28 122 227 4 - 240Cayman Islands 608 987 65 483 295 76 464 310 98 248 282 299 6 298Cuba 7 - - 31 - - 133 2 281 958 1 552 446 221 195 19Dominica - - - - - - - - - - - - - -Dominican Republic - 39 25 - - - - 2 861 1 336 253 5 307 603 2 858 1 375Grenada - - - - - - - - - 4 6 30 0 1Guadeloupe - - - - - - - 267 - - 25 - - 221Haiti - - 8 - - 9 - 3 49 59 350 45 434 -Jamaica 880 13 28 168 12 237 232 245 38 37 458 12 1 363 505Martinique - - 13 - - - 13 - 6 - - 15 - 221Puerto Rico 5 3 20 10 - 1 42 747 681 497 1 071 952 2 555 965Saint Kitts and Nevis - - - - - - - - - - - 65 - -Saint Lucia - - - - - - - - 1 145 65 - 65 44Saint Vincent and the Grenadines - - - - - - - - - - - - - 31Trinidad and Tobago - - 3 - - - - 387 316 24 131 118 1 513 3Turks and Caicos Islands - - - - - - 1 65 - 31 - - 221 -
Oceania 69 86 16 185 - - 0 4 684 2 283 2 486 3 278 1 388 3 066 923Fiji - 70 10 - - - 0 111 302 - 159 36 12 48French Polynesia - 10 - - - - - - - 70 - - - -Micronesia, Federated States of - - - - - - - - - - - 156 - 35New Caledonia - - - 35 - - - 1 400 18 - 10 - - -Papua New Guinea 67 - 7 150 - - - 2 638 1 927 2 195 3 045 1 196 3 054 840Samoa 2 - - - - - - 500 - - - - - -Solomon Islands - 6 - - - - - 35 36 221 65 - - -
Transition economies 22 495 20 549 19 801 16 827 9 737 18 818 5 801 97 848 49 974 46 169 55 628 37 092 29 345 25 650South-East Europe 660 325 498 182 75 225 148 16 415 5 589 4 937 6 833 7 736 6 345 6 094
Albania - - 105 - - 3 3 3 324 116 58 317 288 56 53Bosnia and Herzegovina 7 - 19 3 4 38 4 1 981 1 316 277 1 258 1 349 878 1 006Montenegro - - 7 - - 9 - 715 120 372 424 350 612 1 143Serbia 653 316 365 146 71 78 142 7 734 3 262 3 775 3 981 4 633 4 223 2 926The former Yugoslav Republic of Macedonia - 9 1 33 - 99 - 2 661 776 454 853 1 117 576 966
CIS 21 761 20 195 19 296 16 464 8 895 18 562 5 653 78 919 40 549 40 185 47 100 28 827 21 707 18 701Armenia 47 - 13 70 120 - - 590 878 229 658 486 811 281Azerbaijan 1 215 3 418 569 422 2 883 220 110 1 530 2 063 646 1 384 1 496 1 006 647Belarus 1 410 395 2 075 109 75 539 222 974 1 143 1 783 1 012 616 594 348Kazakhstan 350 700 693 343 137 219 419 16 218 1 743 2 379 7 455 1 188 1 386 2 165Kyrgyzstan 81 31 - - - - - 463 45 - 277 60 49 70Moldova, Republic of 537 - - 0 - 3 - 153 487 271 346 155 282 115Russian Federation 15 421 14 890 14 885 14 619 4 251 16 376 4 569 46 149 26 583 29 645 22 416 16 683 12 468 12 974Tajikistan 82 8 - - - - - 223 539 2 1 060 587 159 482Turkmenistan - - - - - - - 4 024 1 262 300 2 219 7 - 35Ukraine 2 617 754 1 063 901 1 429 1 206 334 7 644 4 463 4 062 2 869 3 061 4 669 1 090Uzbekistan - - - - 0 - - 952 1 344 867 7 404 4 488 285 495
Georgia 75 29 7 181 766 31 - 2 514 3 836 1 047 1 694 529 1 292 855Memorandum
Least developed countries (LDCs)b 875 589 861 896 1 131 1 624 1 604 52 569 31 192 37 704 31 629 22 061 40 279 47 680Landlocked developing countries (LLDCs)c 3 258 4 312 1 483 1 213 3 500 1 047 1 220 44 241 23 815 22 271 38 535 18 640 17 712 16 398
Small island developing States (SIDS)d 1 292 887 2 585 1 928 339 3 605 2 021 5 302 3 163 6 101 7 079 2 456 6 504 4 841
Source: UNCTAD, based on information from the Financial Times Ltd, fDi Markets (www.fDimarkets.com).a Excluding the financial centers in the Caribbean (Anguilla, Antigua and Barbuda, Aruba, the Bahamas, Barbados, the British Virgin Islands, the Cayman Islands, Curaçao, Dominica, Grenada,
Montserrat, Saint Kitts and Nevis, Saint Lucia, Saint Vincent and the Grenadines, Sint Maarten and Turks and Caicos Islands).b Least developed countries include Afghanistan, Angola, Bangladesh, Benin, Bhutan, Burkina Faso, Burundi, Cambodia, the Central African Republic, Chad, Comoros, the Democratic Republic
of the Congo, Djibouti, Equatorial Guinea, Eritrea, Ethiopia, the Gambia, Guinea, Guinea-Bissau, Haiti, Kiribati, the Lao People’s Democratic Republic, Lesotho, Liberia, Madagascar, Malawi, Mali, Mauritania, Mozambique, Myanmar, Nepal, the Niger, Rwanda, Sao Tome and Principe, Senegal, Sierra Leone, Solomon Islands, Somalia, South Sudan, Sudan, Timor-Leste, Togo, Tuvalu, Uganda, the United Republic of Tanzania, Vanuatu, Yemen and Zambia.
c Landlocked developing countries include Afghanistan, Armenia, Azerbaijan, Bhutan, Bolivia, Botswana, Burkina Faso, Burundi, the Central African Republic, Chad, Ethiopia, Kazakhstan, Kyrgyzstan, the Lao People’s Democratic Republic, Lesotho, The former Yugoslav Republic of Macedonia, Malawi, Mali, the Republic of Moldova, Mongolia, Nepal, the Niger, Paraguay, Rwanda, South Sudan, Swaziland, Republic of Tajikistan, Turkmenistan, Uganda, Uzbekistan, Zambia and Zimbabwe.
d Small island developing countries include Antigua and Barbuda, the Bahamas, Barbados, Cabo Verde, Comoros, Dominica, Fiji, Grenada, Jamaica, Kiribati, Maldives, the Marshall Islands, Mauritius, Federated States of Micronesia, Nauru, Palau, Papua New Guinea, Saint Kitts and Nevis, Saint Lucia, Saint Vincent and the Grenadines, Samoa, Sao Tome and Principe, Seychelles, Solomon Islands, Timor-Leste, Tonga, Trinidad and Tobago, Tuvalu and Vanuatu.
Note: Data refer to estimated amounts of capital investment.
ANNEX TABLES
WORLD INVESTMENT REPORT PAST ISSUES
WIR 2014: Investing in the SDGs: An Action Plan
WIR 2013: Global Value Chains: Investment and Trade for Development
WIR 2012: Towards a New Generation of Investment Policies
WIR 2011: Non-Equity Modes of International Production and Development
WIR 2010: Investing in a Low-carbon Economy
WIR 2009: Transnational Corporations, Agricultural Production and Development
WIR 2008: Transnational Corporations and the Infrastructure Challenge
WIR 2007: Transnational Corporations, Extractive Industries and Development
WIR 2006: FDI from Developing and Transition Economies: Implications for Development
WIR 2005: Transnational Corporations and the Internationalization of R&D
WIR 2004: The Shift Towards Services
WIR 2003: FDI Policies for Development: National and International Perspectives
WIR 2002: Transnational Corporations and Export Competitiveness
WIR 2001: Promoting Linkages
WIR 2000: Cross-border Mergers and Acquisitions and Development
WIR 1999: Foreign Direct Investment and the Challenge of Development
WIR 1998: Trends and Determinants
WIR 1997: Transnational Corporations, Market Structure and Competition Policy
WIR 1996: Investment, Trade and International Policy Arrangements
WIR 1995: Transnational Corporations and Competitiveness
WIR 1994: Transnational Corporations, Employment and the Workplace
WIR 1993: Transnational Corporations and Integrated International Production
WIR 1992: Transnational Corporations as Engines of Growth
WIR 1991: The Triad in Foreign Direct Investment
All downloadable at www.unctad.org/wir
World Investment Report 2015: Reforming International Investment Governance
SELECTED UNCTAD PUBLICATION SERIES ON TNCs AND FDI
World Investment Reportwww.unctad.org/wir
FDI Statisticswww.unctad.org/fdistatistics
Global Investment Trends Monitorwww.unctad.org/diae
Investment Policy Hubhttp://investmentpolicyhub.unctad.org/
Investment Policy Monitorwww.unctad.org/iia
Issues in International Investment Agreements: I and II (Sequels)www.unctad.org/iia
International Investment Policies for Developmentwww.unctad.org/iia
Investment Advisory Series A and Bwww.unctad.org/diae
Investment Policy Reviewswww.unctad.org/ipr
Current Series on FDI and Developmentwww.unctad.org/diae
Transnational Corporations Journalwww.unctad.org/tnc
The sales publications may be purchased from distributors of United Nations publications throughout the world.
They may also be obtained by contacting:
United Nations Publications Customer Servicec/o National Book Network
15200 NBN WayPO Box 190
Blue Ridge Summit, PA 17214email: [email protected]
https://unp.un.org/
For further information on the work on foreign direct investment and transnational corporations, please address inquiries to:
Division on Investment and EnterpriseUnited Nations Conference on Trade and Development
Palais des Nations, Room E-10052CH-1211 Geneva 10 Switzerland
Telephone: +41 22 917 4533Fax: +41 22 917 0498www.unctad.org/diae
HOW TO OBTAIN THE PUBLICATIONS