Embed Size (px)
Citation preview

WorldInvestment
Direct
UNITED NATIONS CONFERENCE ON TRADE AND DEVELOPMENT
WORLDINVESTMENT
DIRECTORY
Volume XAfrica
Part 1 of 2OverviewTechnical IntroductionCountry Profiles (Algeria to Lesotho)
UNITED NATIONS
2008
UNITED NATIONS CONFERENCE ON TRADE AND DEVELOPMENT
World Investment Directory
Volume X Africa 2008
Part 1 of 2
UNITED NATIONS
New York and Geneva, 2008
World Investment Directory Volume X Africa 2008
ii
Note
UNCTAD’s Division on Investment, Technology and Enterprise Development serves as the United Nations focal point for all matters of foreign direct investment (FDI) and transnational corporations (TNCs). The division seeks to further the understanding of TNCs and their contribution to development, and to create an enabling environment for international investment and enterprise development. The work of the division is carried out through intergovernmental deliberations, policy analysis and research, technical assistance activities, seminars, workshops and conferences.
Neither the designations employed nor the presentation of data or other information in this publication imply the expression of any opinion whatsoever on the part of the Secretariat of the United Nations concerning the legal status of any country, territory or area or of its authorities, or concerning the delimitation of its frontiers or boundaries. The designations of countries and territories in the tables and text do not necessarily express a judgement about the stage of development reached. Furthermore, the term “country” used in this study also refers, as appropriate, to territories or areas.
All the data in this publication have been obtained by the United Nations from sources believed by it to be accurate and reliable. Because of the possibility of human and mechanical error, as well as other factors, however, all the data are provided “as are” without warranty of any kind, and the United Nations cannot vouch for their accuracy, timeliness, completeness, merchantability or fitness for any particular purpose.
The following conventions have been used in the tables and text of this volume:
Two dots (..) imply that data are either not available or not separately available, unless otherwise specified in the table notes.
A hyphen (-) indicates that the amount is nil or negligible, unless otherwise specified in the table notes.
The totals appearing in the country tables represent the sums of the data in the tables, unless otherwise specified in the table notes. When data are unavailable, as indicated by two dots (..), the total will be equal to the sum of only those data that are available. The sum of two entries, one of which is not available (..) and the other of which is nil or negligible (-), will also be nil or negligible (-).
In all tables, the unavailability of data for an entire line results in the suppression of that line. As a result, the size of the tables varies between countries.
A slash (/) between dates indicates a financial year, for example, 2004/2005.
The use of a dash (–) between dates indicates the full period involved, including the beginning and end years.
UNCTAD/ITE/IIT/2007/5
UNITED NATIONS PUBLICATION Sales No. E.08.II.D.3
ISBN 978-92-1-112733-1
Copyright © United Nations, 2008 All rights reserved
iii
Preface
Foreign direct investment (FDI) continues to gain in importance as a form of international economic transactions and as an instrument of international economic integration. World FDI inflows exceeded $1.3 trillion in 2006. The rate of growth of worldwide FDI inflows in the past two decades has substantially exceeded that of worldwide gross domestic product (GDP), exports and domestic investment. The number of transnational corporations (TNCs) increased significantly, to some 78,000 parent companies (with 780,000 foreign affiliates) in 2006. The sales of these affiliates amounted to about $25 trillion in 2006. As a result, TNCs account for an increasing share and, in some cases, a substantial part of the assets, employment, domestic capital formation, research and development, sales and trade of many countries. Through the continued development of their increasingly integrated international productions systems, TNCs have become one of the driving forces of integration in the world economy.
Despite the increasing importance of FDI in the world economy, published sources or readily accessible databases that provide comparable and accurate data on the investments and other activities of TNCs are scarce. The World Investment Directory series of UNCTAD is an attempt to centralize in the United Nations data-gathering efforts to measure systematically FDI, the activities of TNCs and related variables in the world economy. Accordingly, the purpose of the World Investment Directory and its database is to assemble comprehensive data and information on FDI, operations of TNCs, basic financial data on the largest TNCs, the legal framework in which such investment takes place and selected bibliographic information about FDI and TNCs in individual countries.
The present World Investment Directory publication series consists of the following volumes:
Volume I. Asia and the Pacific (United Nations publication, Sales No. E.92.II.A.11)
Volume II. Central and Eastern Europe (United Nations publication, Sales No. E.93.II.A.1)
Volume III. Developed Countries (United Nations publication, Sales No. E.93.II.A.9)
Volume IV. Latin America and the Caribbean (United Nations publication, Sales No. E.94.II.A.10)
Volume V. Africa (United Nations publication, Sales No. E.97.II.A.1)
Volume VI. West Asia (United Nations publication, Sales No. E.97.II.A.2)
Volume VII. Asia and the Pacific, Part I and Part II (United Nations publication, Sales No. E.00.II.D.1)
Volume VIII. Central and Eastern Europe 2003 (United Nations publication, Sales No. E.03.II.D.24)
Volume IX Latin America and the Caribbean 2004 (United Nations publication, Sales No. E.04.II.D.32)
The present publication covers 53 economies of the African region: Algeria, Angola, Benin, Botswana, Burkina Faso, Burundi, Cameroon, Cape Verde, Central African Republic, Chad, Comoros, Congo, Côte d’Ivoire, the Democratic Republic of the Congo, Djibouti, Egypt, Equatorial Guinea, Eritrea, Ethiopia, Gabon, Gambia, Ghana, Guinea, Guinea-Bissau, Kenya, Lesotho, Liberia, Libyan Arab Jamahiriya, Madagascar, Malawi, Mali, Mauritania, Mauritius, Morocco, Mozambique, Namibia, Niger,

World Investment Directory Volume X Africa 2008
iv
Nigeria, Rwanda, Sao Tome and Principe, Senegal, Seychelles, Sierra Leone, Somalia, South Africa, Sudan, Swaziland, Togo, Tunisia, Uganda, United Republic of Tanzania, Zambia and Zimbabwe. Profiles on all these countries are contained in this volume, based on data available to the secretariat.
Data are presented on both inward and outward flows and stocks of FDI and operations of TNCs. Basic information is provided on the largest TNCs in and from the countries and on the regulatory framework affecting FDI, organized by country. These are based on information available as of December 2007. It is the intention of UNCTAD to update the World Investment Directory series regularly, and country profiles contained in each volume of this series are regularly updated and placed on the UNCTAD’s FDI statistics website (www.unctad.org/fdistatistics). It is hoped that, as work progresses in this area, Governments will make it possible to enhance the frequency and scope of collection and quality of the data and information provided.
It is a widely recognized problem in research on FDI and TNCs that the statistics on them suffer from lack of comparability across sources and countries. The user is thus advised to read the technical introduction to this volume, definitions and sources in each country profile, and the explanatory notes at the end of each table. In presenting the national data on FDI, it is hoped that the need to harmonize these statistics in accordance with internationally accepted definitions will become more evident and inspire efforts at the national, regional and international levels to meet this difficult but necessary objective. UNCTAD provides technical assistance to efforts towards achieving this objective.
The World Investment Directory aims at becoming a standard reference series for policymakers, especially in developing countries, and for researchers and others in academia, governmental, intergovernmental and non-governmental organizations and the private sector who need to gain an understanding of the character, trends and patterns of FDI and TNC activities, and require reliable information as the basis for the formulation and monitoring of policies on FDI and TNCs.
This series has been prepared by a project team led by Masataka Fujita under the supervision of Anne Miroux. The principal officer responsible for the production of this volume was Hilary Nwokeabia, who oversaw the development of the volume at various stages. The other members of the team were Mohamed Chiraz Baly, Bradley Boicourt, John Bolmer, Jovan Licina and Lizanne Martinez. Hamed El-Kady, Justin Fisher, Torbjorn Fredrikkson, Joachim Karl, Hafiz Mirza, Jean-François Outreville, Thomas Pollan, Astrit Sulstarova and Aimable Uwizeye-Mapendano commented on the final draft. Production assistance was provided by Séverine Excoffier and Katia Vieu. Abraham Negash and Eric Kehinde Ogunleye contributed to the sections on regulatory frameworks for investment. Teresita Sabico did the desktop publishing for the volume. Many officials in central banks, statistical offices, investment promotion agencies and other government offices in Africa contributed to the volume through the provision of data.
v
Contents
Page
Preface ...................................................................................................................................................... iii
I. Overview ..............................................................................................................................................1
A. FDI trends in Africa..................................................................................................................1
1. Inward FDI ........................................................................................................................1 a. Recent trends and developments .............................................................................1 b. Geographical and industrial distribution of inward FDI..........................................6
2. Outward FDI ...................................................................................................................13
B. Policy developments with respect to inward FDI.................................................................21
1. Developments at the national level .................................................................................22
2. Developments at the international level .......................................................................... 24
C. Prospects for inward FDI ....................................................................................................... 28
References.......................................................................................................................................... 30
Annex ................................................................................................................................................. 31
Selected recent UNCTAD publications on TNCs and FDI ........................................................... 61
Questionnaire .................................................................................................................................... 67
Figures in the Overview
1. FDI inflows and their share in gross fixed capital formation in Africa, 1985–2007......................2 2. FDI inflows by region, 2005, 2006 and 2007.................................................................................4 3. Africa: shares in world FDI inflows, world GDP and world exports, 1980-2006..........................4 4. Inward FDI stock in African economies, 2006 .............................................................................7 5. FDI outflows from Africa, 1985–2006.........................................................................................15 6. Outward FDI stock from the top 20 African outward-investor economies, 2006 ........................17 7. Africa: BITs and DTTs by region, cumulative 2006....................................................................26 8. Prospects for FDI in Africa, 2007–2009: responses to UNCTAD survey ..................................28
Tables in the Overview
1. FDI inflows to Africa, 1970–2006 .................................................................................................3 2. Industrial distribution of inward FDI stock in selected African countries, selected years .............5 3. Industrial distribution of FDI inflows in selected African countries, selected years......................9 4. Africa: distribution of cross-border M&A sales, by sector and industry, 1995, 2000 and 2006..10 5. Inward FDI of selected countries in Africa from the world and major regions, 1990–2006........11 6. The largest affiliates of foreign TNCs in Africa, 2006.................................................................14 7. Geographical distribution of outward FDI from selected African countries, selected years........16 8. Industrial distribution of outward FDI from selected African countries, selected years..............17 9. The largest home-based TNCs located in Africa, 2007................................................................18
World Investment Directory Volume X Africa 2008
vi
10. The largest foreign affiliates of TNCs from Africa, 2007............................................................19 11. Africa: selected major outward-investor enterprises by country and sector/industry, 2006 ........20 12. African countries’ participation in selected international investment-related instruments as of the end of 2007 ....................................................................................................................25
Annex tables in the Overview
1. Geographical distribution of inward FDI stock in selected African countries, selected years.....31 2. Geographical distribution of FDI inflows in selected African countries, selected years .............33
II. Technical introduction ..................................................................................................................35
A. Scope.........................................................................................................................................35
B. Sources of data ........................................................................................................................39
C. Industrial and geographical breakdown ................................................................................... 40
D. Reporting currency and exchange rates .................................................................................... 42
E. Definitions, descriptions and discrepancies in the data ........................................................... 46
1. FDI statistics ............................................................................................................................ 46 a. Definitions of FDI............................................................................................................. 46
(i) Components of FDI.................................................................................................... 46 (ii) The threshold equity ownership................................................................................. 47 (iii) Defining a controlling interest and treatment of non-equity forms of investment .. 47
b. Methods of data collection and national practices in the treatment of FDI..................... 47 (i) Foreign exchange records versus company surveys ................................................. 47 (ii) Ultimate beneficial owner.......................................................................................... 48 (iii) Variety of sources for FDI data ................................................................................. 48 (iv) Industrial coverage and classification........................................................................ 49 (v) The treatment of banks and other financial institutions ............................................ 49
c. Accounting practices......................................................................................................... 49(i) Historical valuation of FDI ........................................................................................ 49 (ii) Methods of consolidation........................................................................................... 49 (iii) Capital gains and losses ............................................................................................. 50
2. Corporate data.......................................................................................................................... 50 3. Legal information .................................................................................................................... 51
a. National framework .......................................................................................................... 51 b. International framework...............................................................................................51
F. Glossary ......................................................................................................................................... 521. FDI ........................................................................................................................................... 52 2. Operations of TNCs............................................................................................................533. The structure of TNCs ........................................................................................................55
Tables in technical introduction
1. Tables presented in this volume ...................................................................................................38 2. Exchange rates of African economies, 1990-2006.......................................................................43
vii
III. COUNTRY PROFILES
Algeria ..................................................................................................................................................... 61 Angola ..................................................................................................................................................... 77 Benin ....................................................................................................................................................... 87Botswana ................................................................................................................................................. 97Burkina Faso.......................................................................................................................................... 109 Burundi.................................................................................................................................................. 119 Cameroon .............................................................................................................................................. 129 Cape Verde ............................................................................................................................................ 141 Central African Republic....................................................................................................................... 157 Chad ...................................................................................................................................................... 167 Comoros ................................................................................................................................................ 177 Congo .................................................................................................................................................... 185 Congo, Democratic Republic of the ...................................................................................................... 195 Côte d’Ivoire.......................................................................................................................................... 205 Djibouti.................................................................................................................................................. 217 Egypt ..................................................................................................................................................... 227 Equatorial Guinea.................................................................................................................................. 243 Eritrea .................................................................................................................................................... 251 Ethiopia ................................................................................................................................................. 259 Gabon .................................................................................................................................................... 271 Gambia .................................................................................................................................................. 283 Ghana .................................................................................................................................................... 293 Guinea ................................................................................................................................................... 309 Guinea-Bissau ....................................................................................................................................... 319 Kenya .................................................................................................................................................... 327 Lesotho .................................................................................................................................................. 343 Liberia ................................................................................................................................................... 355 Libyan Arab Jamahiriya ........................................................................................................................ 367 Madagascar............................................................................................................................................ 379 Malawi................................................................................................................................................... 397 Mali ....................................................................................................................................................... 409 Mauritania ............................................................................................................................................. 419 Mauritius ............................................................................................................................................... 427 Morocco ................................................................................................................................................ 443 Mozambique.......................................................................................................................................... 465 Namibia ................................................................................................................................................. 479 Niger...................................................................................................................................................... 493 Nigeria ................................................................................................................................................... 505 Rwanda.................................................................................................................................................. 523 Sao Tome and Principe.......................................................................................................................... 531 Senegal .................................................................................................................................................. 539 Seychelles.............................................................................................................................................. 551 Sierra Leone .......................................................................................................................................... 563 Somalia.................................................................................................................................................. 573 South Africa .......................................................................................................................................... 581 Sudan..................................................................................................................................................... 603 Swaziland .............................................................................................................................................. 615 Togo ...................................................................................................................................................... 627 Tunisia ................................................................................................................................................... 637 Uganda .................................................................................................................................................. 655 United Republic of Tanzania................................................................................................................. 667 Zambia................................................................................................................................................... 685 Zimbabwe.............................................................................................................................................. 699

I. Overview
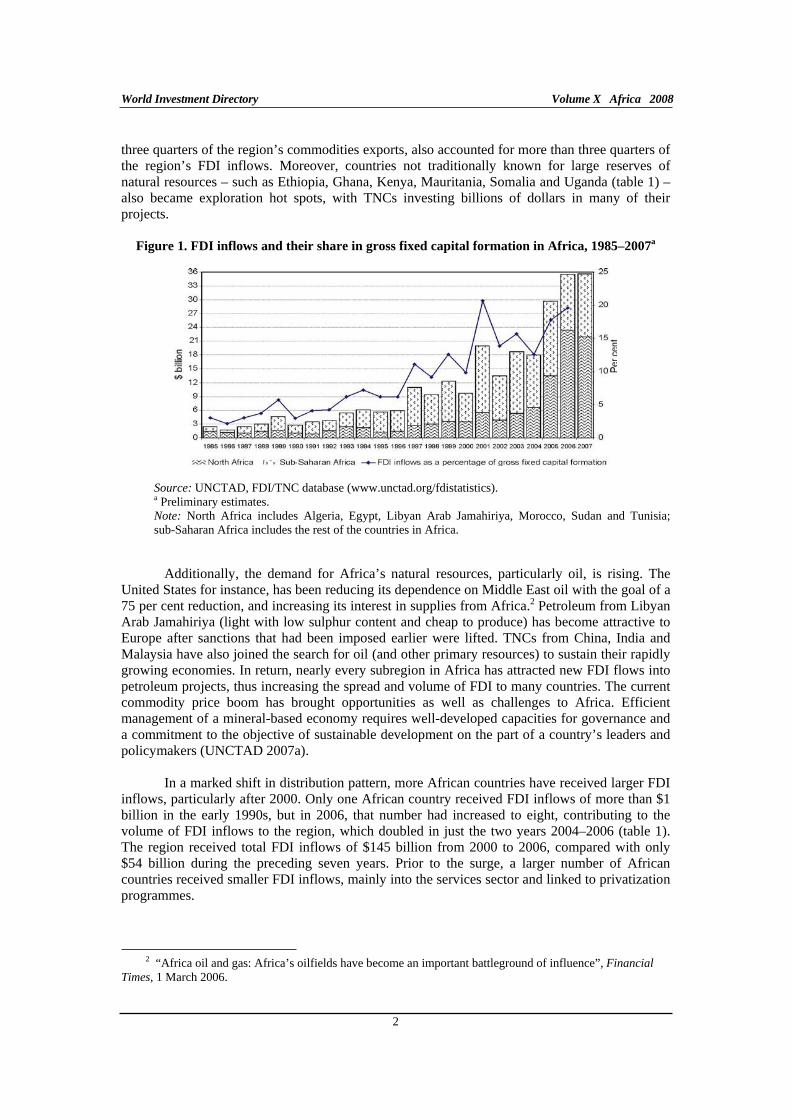
Africa has attracted increasing amounts of inward FDI in the past two decades, with FDI inflows rising from $2.4 billion in 1985 to $36 billion in 2006 (figure 1) and expected to remain at almost the latter level in 2007. Inward FDI stock in the region rose from $40 billion in 1980 to $315 billion in 2006 (UNCTAD 2007a). The ratio of FDI inflows to the region’s gross fixed capital formation reached its highest level of 21 per cent in 2001, declining to 13 per cent in 2002–2004 and recovering to 20 per cent in 2006. In many countries, inflows rose mainly in the primary and services sectors, partly through the existence of vast natural resources and a wide range of national privatization schemes. The profile of the foreign direct investors and their destinations in the region has varied over the years. TNCs from developed countries and, more recently, developing countries have invested in a wide range of industries including, among others, oil exploration, in which there have been many new exploration activities while at the same time existing TNCs have raised their stakes in previously operational mines. Nevertheless, the region’s share in global FDI has declined, partly because of lower inflows to the manufacturing sector in the 1990s, before a slow recovery from 2000 to 2006.
In terms of prospects, high commodity prices and continued liberalization of the national markets are likely to attract more FDI to the primary and services sectors of African economies. Furthermore, the region’s market size, measured by total population and purchasing power, has been growing. Many countries have reformed their investment laws, while at the same time liberalizing trade and price regulation, reducing red tape for business start-ups, improving the financial system, privatizing State firms and offering concessions on infrastructure projects. The prospects for increased FDI flows to the manufacturing sector will depend on improvements in Africa’s industrial profile and the rate at which it shifts from a low value added to semi-industrial production basis, given the available local markets, market access initiatives as well as improvements in business climate.
A. FDI trends in Africa
I. Inward FDI
a. Recent trends and developments
The recent surge of FDI inflows to the African region, particularly over the period 2001–2007 (figure 1), followed from the twin forces of an upward spiral in commodity prices1 and a more positive climate for investments in the region backed by reform of policy frameworks for FDI, including, among others, for natural resource exploitation. A number of African countries have also received more commitments by the international community to scale up aid, support regional development initiatives and infrastructure development, and have been provided more market access initiatives, all of which contribute to shoring up FDI inflows. FDI is now subject to less restrictive compliance criteria and less cumbersome approval procedures. Political instability, internal conflict and poor governance still pose significant problems to too many countries in the region. However, in parts of the region, political conflicts and related sanctions on their economies have waned and efforts have been undertaken to strengthen governance and economic performance improved at a time when commodity prices have been rising rapidly. As a consequence, the region’s largest natural resource producers – such as Angola, Algeria, Libyan Arab Jamahiriya, Mozambique, Nigeria and South Africa (table 1) – which account for roughly
1 Prices of commodities such as aluminium, copper, diamond, gold, nickel, oil and gem stones surged more than 400 per cent between 2000 and 2007. Source: Bloomberg.com - Commodity futures (http://www.bloomberg.com/markets/commodities/ cfutures.html).
World Investment Directory Volume X Africa 2008
2
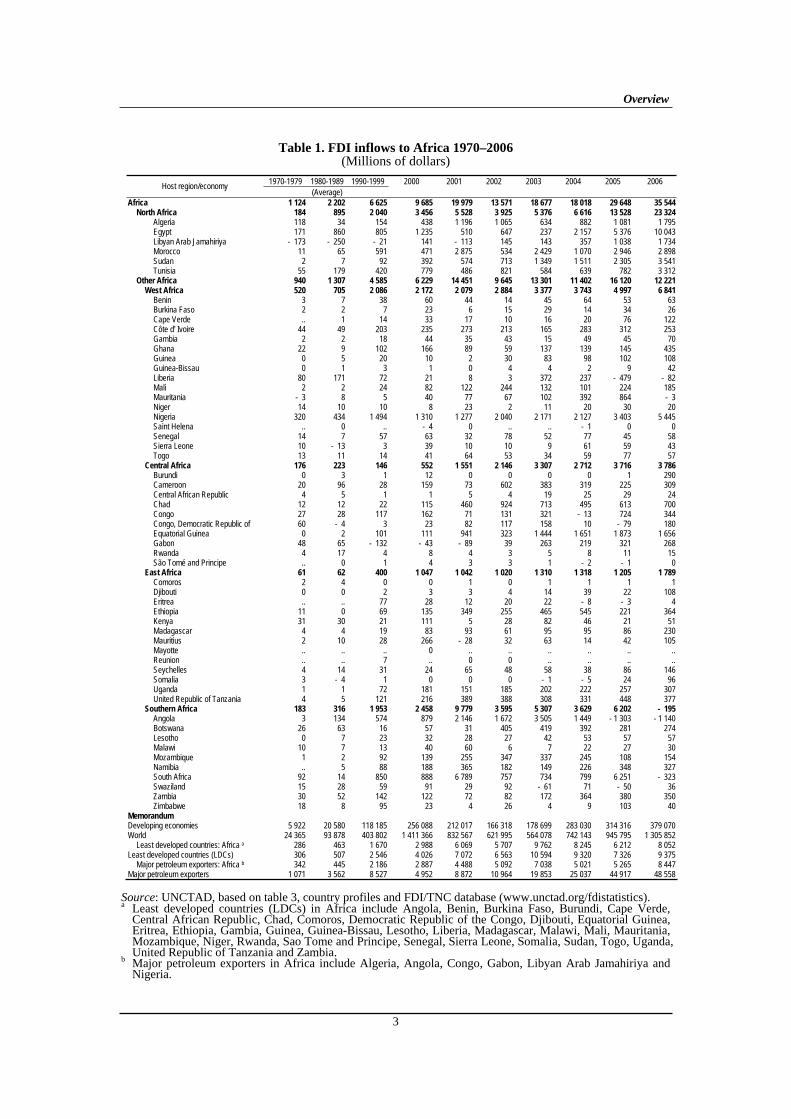
three quarters of the region’s commodities exports, also accounted for more than three quarters of the region’s FDI inflows. Moreover, countries not traditionally known for large reserves of natural resources – such as Ethiopia, Ghana, Kenya, Mauritania, Somalia and Uganda (table 1) – also became exploration hot spots, with TNCs investing billions of dollars in many of their projects.
Figure 1. FDI inflows and their share in gross fixed capital formation in Africa, 1985–2007a
Source: UNCTAD, FDI/TNC database (www.unctad.org/fdistatistics). a Preliminary estimates. Note: North Africa includes Algeria, Egypt, Libyan Arab Jamahiriya, Morocco, Sudan and Tunisia; sub-Saharan Africa includes the rest of the countries in Africa.
Additionally, the demand for Africa’s natural resources, particularly oil, is rising. The United States for instance, has been reducing its dependence on Middle East oil with the goal of a 75 per cent reduction, and increasing its interest in supplies from Africa.2 Petroleum from Libyan Arab Jamahiriya (light with low sulphur content and cheap to produce) has become attractive to Europe after sanctions that had been imposed earlier were lifted. TNCs from China, India and Malaysia have also joined the search for oil (and other primary resources) to sustain their rapidly growing economies. In return, nearly every subregion in Africa has attracted new FDI flows into petroleum projects, thus increasing the spread and volume of FDI to many countries. The current commodity price boom has brought opportunities as well as challenges to Africa. Efficient management of a mineral-based economy requires well-developed capacities for governance and a commitment to the objective of sustainable development on the part of a country’s leaders and policymakers (UNCTAD 2007a).
In a marked shift in distribution pattern, more African countries have received larger FDI inflows, particularly after 2000. Only one African country received FDI inflows of more than $1 billion in the early 1990s, but in 2006, that number had increased to eight, contributing to the volume of FDI inflows to the region, which doubled in just the two years 2004–2006 (table 1). The region received total FDI inflows of $145 billion from 2000 to 2006, compared with only $54 billion during the preceding seven years. Prior to the surge, a larger number of African countries received smaller FDI inflows, mainly into the services sector and linked to privatization programmes.
2 “Africa oil and gas: Africa’s oilfields have become an important battleground of influence”, Financial
Times, 1 March 2006.
Overview
3
Table 1. FDI inflows to Africa 1970–2006 (Millions of dollars)
1970-1979 1980-1989 1990-1999 2000 2001 2002 2003 2004 2005 2006 Host region/economy
(Average)
Africa 1 124 2 202 6 625 9 685 19 979 13 571 18 677 18 018 29 648 35 544North Africa 184 895 2 040 3 456 5 528 3 925 5 376 6 616 13 528 23 324
Algeria 118 34 154 438 1 196 1 065 634 882 1 081 1 795Egypt 171 860 805 1 235 510 647 237 2 157 5 376 10 043Libyan Arab Jamahiriya - 173 - 250 - 21 141 - 113 145 143 357 1 038 1 734Morocco 11 65 591 471 2 875 534 2 429 1 070 2 946 2 898Sudan 2 7 92 392 574 713 1 349 1 511 2 305 3 541Tunisia 55 179 420 779 486 821 584 639 782 3 312
Other Africa 940 1 307 4 585 6 229 14 451 9 645 13 301 11 402 16 120 12 221West Africa 520 705 2 086 2 172 2 079 2 884 3 377 3 743 4 997 6 841
Benin 3 7 38 60 44 14 45 64 53 63Burkina Faso 2 2 7 23 6 15 29 14 34 26Cape Verde .. 1 14 33 17 10 16 20 76 122Côte d' Ivoire 44 49 203 235 273 213 165 283 312 253Gambia 2 2 18 44 35 43 15 49 45 70Ghana 22 9 102 166 89 59 137 139 145 435Guinea 0 5 20 10 2 30 83 98 102 108Guinea-Bissau 0 1 3 1 0 4 4 2 9 42Liberia 80 171 72 21 8 3 372 237 - 479 - 82Mali 2 2 24 82 122 244 132 101 224 185Mauritania - 3 8 5 40 77 67 102 392 864 - 3Niger 14 10 10 8 23 2 11 20 30 20Nigeria 320 434 1 494 1 310 1 277 2 040 2 171 2 127 3 403 5 445Saint Helena .. 0 .. - 4 0 .. .. - 1 0 0Senegal 14 7 57 63 32 78 52 77 45 58Sierra Leone 10 - 13 3 39 10 10 9 61 59 43Togo 13 11 14 41 64 53 34 59 77 57
Central Africa 176 223 146 552 1 551 2 146 3 307 2 712 3 716 3 786Burundi 0 3 1 12 0 0 0 0 1 290Cameroon 20 96 28 159 73 602 383 319 225 309Central African Republic 4 5 1 1 5 4 19 25 29 24Chad 12 12 22 115 460 924 713 495 613 700Congo 27 28 117 162 71 131 321 - 13 724 344Congo, Democratic Republic of 60 - 4 3 23 82 117 158 10 - 79 180Equatorial Guinea 0 2 101 111 941 323 1 444 1 651 1 873 1 656Gabon 48 65 - 132 - 43 - 89 39 263 219 321 268Rwanda 4 17 4 8 4 3 5 8 11 15São Tomé and Principe .. 0 1 4 3 3 1 - 2 - 1 0
East Africa 61 62 400 1 047 1 042 1 020 1 310 1 318 1 205 1 789Comoros 2 4 0 0 1 0 1 1 1 1Djibouti 0 0 2 3 3 4 14 39 22 108Eritrea .. .. 77 28 12 20 22 - 8 - 3 4Ethiopia 11 0 69 135 349 255 465 545 221 364Kenya 31 30 21 111 5 28 82 46 21 51Madagascar 4 4 19 83 93 61 95 95 86 230Mauritius 2 10 28 266 - 28 32 63 14 42 105Mayotte .. .. .. 0 .. .. .. .. .. ..Reunion .. .. 7 .. 0 0 .. .. .. ..Seychelles 4 14 31 24 65 48 58 38 86 146Somalia 3 - 4 1 0 0 0 - 1 - 5 24 96Uganda 1 1 72 181 151 185 202 222 257 307United Republic of Tanzania 4 5 121 216 389 388 308 331 448 377
Southern Africa 183 316 1 953 2 458 9 779 3 595 5 307 3 629 6 202 - 195Angola 3 134 574 879 2 146 1 672 3 505 1 449 - 1 303 - 1 140Botswana 26 63 16 57 31 405 419 392 281 274Lesotho 0 7 23 32 28 27 42 53 57 57Malawi 10 7 13 40 60 6 7 22 27 30Mozambique 1 2 92 139 255 347 337 245 108 154Namibia .. 5 88 188 365 182 149 226 348 327South Africa 92 14 850 888 6 789 757 734 799 6 251 - 323Swaziland 15 28 59 91 29 92 - 61 71 - 50 36Zambia 30 52 142 122 72 82 172 364 380 350Zimbabwe 18 8 95 23 4 26 4 9 103 40
Memorandum Developing economies 5 922 20 580 118 185 256 088 212 017 166 318 178 699 283 030 314 316 379 070World 24 365 93 878 403 802 1 411 366 832 567 621 995 564 078 742 143 945 795 1 305 852
Least developed countries: Africa a 286 463 1 670 2 988 6 069 5 707 9 762 8 245 6 212 8 052Least developed countries (LDCs) 306 507 2 546 4 026 7 072 6 563 10 594 9 320 7 326 9 375
Major petroleum exporters: Africa b 342 445 2 186 2 887 4 488 5 092 7 038 5 021 5 265 8 447Major petroleum exporters 1 071 3 562 8 527 4 952 8 872 10 964 19 853 25 037 44 917 48 558
Source: UNCTAD, based on table 3, country profiles and FDI/TNC database (www.unctad.org/fdistatistics). a Least developed countries (LDCs) in Africa include Angola, Benin, Burkina Faso, Burundi, Cape Verde,
Central African Republic, Chad, Comoros, Democratic Republic of the Congo, Djibouti, Equatorial Guinea, Eritrea, Ethiopia, Gambia, Guinea, Guinea-Bissau, Lesotho, Liberia, Madagascar, Malawi, Mali, Mauritania, Mozambique, Niger, Rwanda, Sao Tome and Principe, Senegal, Sierra Leone, Somalia, Sudan, Togo, Uganda, United Republic of Tanzania and Zambia.
b Major petroleum exporters in Africa include Algeria, Angola, Congo, Gabon, Libyan Arab Jamahiriya and Nigeria.
World Investment Directory Volume X Africa 2008
4
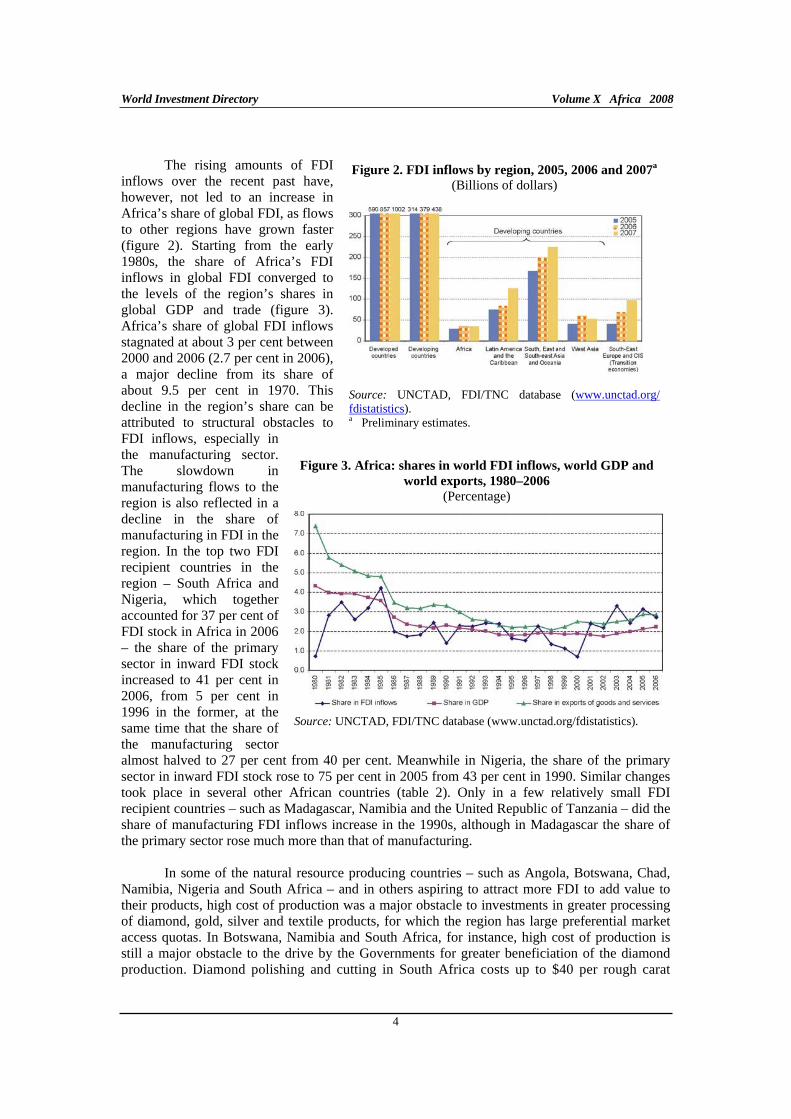
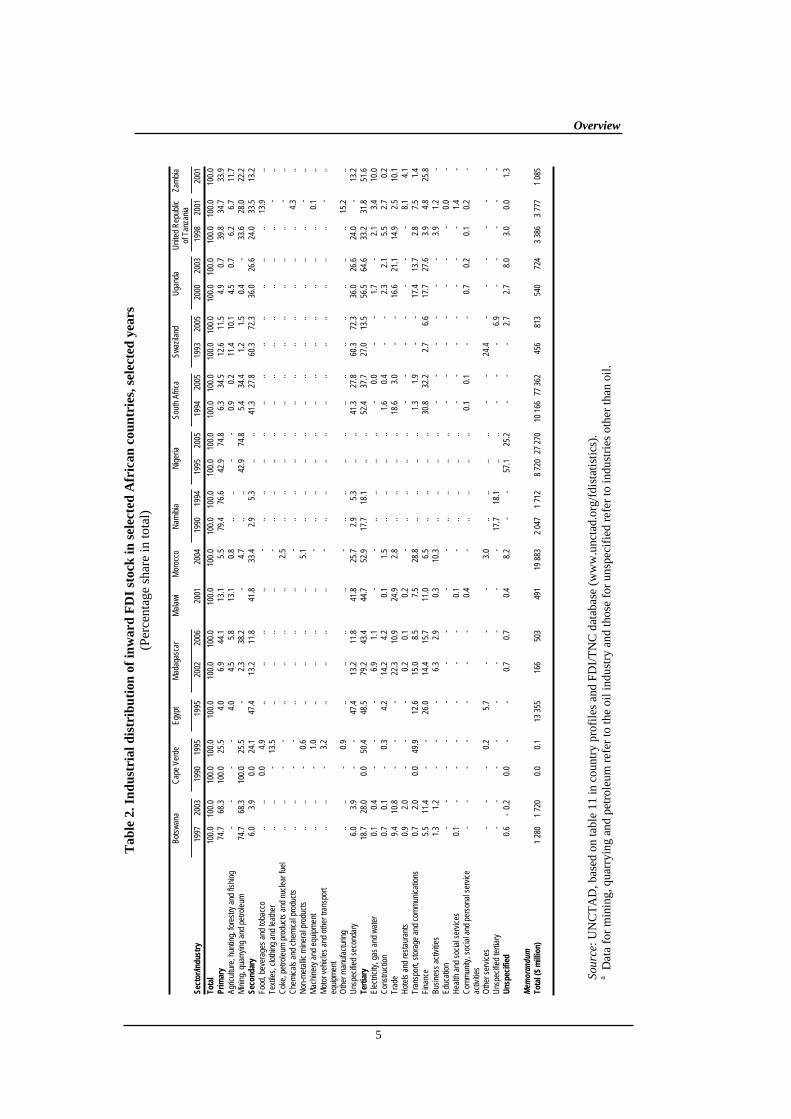
The rising amounts of FDI inflows over the recent past have, however, not led to an increase in Africa’s share of global FDI, as flows to other regions have grown faster (figure 2). Starting from the early 1980s, the share of Africa’s FDI inflows in global FDI converged to the levels of the region’s shares in global GDP and trade (figure 3). Africa’s share of global FDI inflows stagnated at about 3 per cent between 2000 and 2006 (2.7 per cent in 2006), a major decline from its share of about 9.5 per cent in 1970. This decline in the region’s share can be attributed to structural obstacles to FDI inflows, especially in the manufacturing sector. The slowdown in manufacturing flows to the region is also reflected in a decline in the share of manufacturing in FDI in the region. In the top two FDI recipient countries in the region – South Africa and Nigeria, which together accounted for 37 per cent of FDI stock in Africa in 2006 – the share of the primary sector in inward FDI stock increased to 41 per cent in 2006, from 5 per cent in 1996 in the former, at the same time that the share of the manufacturing sector almost halved to 27 per cent from 40 per cent. Meanwhile in Nigeria, the share of the primary sector in inward FDI stock rose to 75 per cent in 2005 from 43 per cent in 1990. Similar changes took place in several other African countries (table 2). Only in a few relatively small FDI recipient countries – such as Madagascar, Namibia and the United Republic of Tanzania – did the share of manufacturing FDI inflows increase in the 1990s, although in Madagascar the share of the primary sector rose much more than that of manufacturing.
In some of the natural resource producing countries – such as Angola, Botswana, Chad, Namibia, Nigeria and South Africa – and in others aspiring to attract more FDI to add value to their products, high cost of production was a major obstacle to investments in greater processing of diamond, gold, silver and textile products, for which the region has large preferential market access quotas. In Botswana, Namibia and South Africa, for instance, high cost of production is still a major obstacle to the drive by the Governments for greater beneficiation of the diamond production. Diamond polishing and cutting in South Africa costs up to $40 per rough carat
Figure 2. FDI inflows by region, 2005, 2006 and 2007a
(Billions of dollars)
Source: UNCTAD, FDI/TNC database (www.unctad.org/ fdistatistics).a Preliminary estimates.
Figure 3. Africa: shares in world FDI inflows, world GDP and
world exports, 1980–2006
(Percentage)
Source: UNCTAD, FDI/TNC database (www.unctad.org/fdistatistics).
Ta
ble
2. In
du
stri
al
dis
trib
uti
on
of
inw
ard
FD
I st
ock
in
sel
ecte
d A
fric
an
cou
ntr
ies,
sel
ecte
d y
ears
(Per
cent
age
shar
e in
tota
l)
B
otsw
ana
C
ape
Ver
de
Egy
ptM
adag
asca
r M
alaw
i M
oroc
coN
amib
iaN
iger
ia
Sou
th A
fric
a S
waz
iland
U
gand
a U
nite
d R
epub
lic
of T
anza
nia
Zam
bia
Sec
tor/
ind
ustr
y 19
97
2003
1990
19
9519
9520
0220
0620
0120
0419
9019
9419
95
2005
1994
2005
1993
2005
2000
2003
1998
2001
2001
Tot
al
100
.0
100
.0
1
00.0
1
00.0
100
.0 1
00.0
100
.0 1
00.0
100
.0 1
00.0
100
.0 1
00.0
1
00.0
100
.0 1
00.0
100
.0 1
00.0
100
.0 1
00.0
100
.0 1
00.0
100
.0
Pri
mar
y 7
4.7
68.
3
100
.0
25.
5 4
.0 6
.9 4
4.1
13.
1 5
.5 7
9.4
76.
6 4
2.9
74.
8 6
.3 3
4.5
12.
6 1
1.5
4.9
0.7
39.
8 3
4.7
33.
9
Agr
icul
ture
, hun
ting,
fore
stry
and
fish
ing
- -
-
- 4
.0 4
.5 5
.8 1
3.1
0.8
....
- -
0.9
0.2
11.
4 1
0.1
4.5
0.7
6.2
6.7
11.
7
Min
ing,
qua
rryi
ng a
nd p
etro
leum
7
4.7
68.
3
100
.0
25.
5-
2.3
38.
2-
4.7
....
42.
9 7
4.8
5.4
34.
4 1
.2 1
.5 0
.4-
33.
6 2
8.0
22.
2
Sec
on
dar
y 6
.0
3.9
0.0
2
4.1
47.
4 1
3.2
11.
8 4
1.8
33.
4 2
.9 5
.3..
.. 4
1.3
27.
8 6
0.3
72.
3 3
6.0
26.
6 2
4.0
33.
5 1
3.2
Foo
d, b
ever
ages
and
toba
cco
.. ..
0
.0
4.9
....
....
-..
....
....
....
....
....
13.
9..
Tex
tiles
, clo
thin
g an
d le
athe
r ..
..
- 1
3.5
....
....
-..
....
....
....
....
....
-..
Cok
e, p
etro
leum
pro
duct
s an
d nu
clea
r fu
el
.. ..
-
-..
....
.. 2
.5..
....
....
....
....
....
-..
Che
mic
als
and
chem
ical
pro
duct
s ..
..
- -
....
....
-..
....
....
....
....
....
4.3
..
Non
-met
allic
min
eral
pro
duct
s ..
..
- 0
.6..
....
.. 5
.1..
....
....
....
....
....
-..
Mac
hine
ry a
nd e
quip
men
t ..
..
- 1
.0..
....
..-
....
.. ..
....
....
....
.. 0
.1..
Mot
or v
ehic
les
and
othe
r tr
ansp
ort
equi
pmen
t ..
..
- 3
.2..
....
..-
....
.. ..
....
....
....
..-
..
Oth
er m
anuf
actu
ring
.. ..
-
0.9
....
....
-..
....
....
....
....
....
15.
2..
Uns
peci
fied
seco
ndar
y 6
.0
3.9
- -
47.
4 1
3.2
11.
8 4
1.8
25.
7 2
.9 5
.3..
.. 4
1.3
27.
8 6
0.3
72.
3 3
6.0
26.
6 2
4.0
- 1
3.2
Ter
tiar
y 1
8.7
28.
0
0.0
5
0.4
48.
5 7
9.2
43.
4 4
4.7
52.
9 1
7.7
18.
1..
.. 5
2.4
37.
7 2
7.0
13.
5 5
6.5
64.
6 3
3.2
31.
8 5
1.6
Ele
ctric
ity, g
as a
nd w
ater
0
.1
0.4
- -
- 6
.9 1
.1-
-..
....
..-
0.0
--
1.7
- 2
.1 3
.4 1
0.0
Con
stru
ctio
n 0
.7
0.1
- 0
.3 4
.2 1
4.2
4.2
0.1
1.5
....
.. ..
1.6
0.4
--
2.3
2.1
5.5
2.7
0.2
Tra
de
9.4
1
0.8
-
--
22.
3 1
0.9
24.
9 2
.8..
....
.. 1
8.6
3.0
--
16.
6 2
1.1
14.
9 2
.5 1
0.1
Hot
els
and
rest
aura
nts
0.9
2
.0
-
--
0.2
0.1
0.2
-..
....
..-
--
--
--
8.1
4.1
Tra
nspo
rt, s
tora
ge a
nd c
omm
unic
atio
ns
0.7
2
.0
0
.0
49.
9 1
2.6
15.
0 8
.5 7
.5 2
8.8
....
.. ..
1.3
1.9
--
17.
4 1
3.7
2.8
7.5
1.4
Fin
ance
5
.5
11.
4
- -
26.
0 1
4.4
15.
7 1
1.0
6.5
....
.. ..
30.
8 3
2.2
2.7
6.6
17.
7 2
7.6
3.9
4.8
25.
8
Bus
ines
s ac
tiviti
es
1.3
1
.2
-
--
6.3
2.9
0.3
10.
3..
....
..-
--
--
- 3
.9 1
.2-
Edu
catio
n -
-
- -
--
--
-..
....
..-
--
--
--
0.0
-
Hea
lth a
nd s
ocia
l ser
vice
s 0
.1
-
- -
--
- 0
.1-
....
.. ..
--
--
--
- 1
.4-
Com
mun
ity, s
ocia
l and
per
sona
l ser
vice
ac
tiviti
es
- -
-
--
--
0.4
-..
....
.. 0
.1 0
.1-
- 0
.7 0
.2 0
.1 0
.2-
Oth
er s
ervi
ces
- -
-
0.2
5.7
--
- 3
.0..
....
..-
- 2
4.4
--
--
--
Uns
peci
fied
tert
iary
-
-
- -
--
--
- 1
7.7
18.
1..
..-
--
6.9
--
--
-
Un
spec
ifie
d 0
.6
- 0
.2
0
.0
--
0.7
0.7
0.4
8.2
--
57.
1 2
5.2
--
- 2
.7 2
.7 8
.0 3
.0 0
.0 1
.3
Mem
ora
nd
um
Tot
al (
$ m
illio
n)
1 2
80
1 7
20
0
.0
0.1
13
355
166
503
491
19
883
2 0
47 1
712
8 7
20
27 2
70 1
0 16
6 7
7 36
2 4
56 8
13 5
40 7
24 3
386
3 7
77 1
085
Sou
rce:
UN
CT
AD
, bas
ed o
n ta
ble
11 in
cou
ntry
pro
file
s an
d F
DI/
TN
C d
atab
ase
(ww
w.u
ncta
d.or
g/fd
ista
tisti
cs).
a D
ata
for
min
ing,
qua
rryi
ng a
nd p
etro
leum
ref
er to
the
oil i
ndus
try
and
thos
e fo
r un
spec
ifie
d re
fer
to in
dust
ries
oth
er th
an o
il.
Overview
5
World Investment Directory Volume X Africa 2008
6
compared with $10 to $14 in India.3 In the apparel and textile industry, South Africa pays its workers $1.38 an hour, as against the Chinese figure of $0.88.4 In the latter industry, FDI inflows to Africa also suffered a major setback in 2005 with the end of the Multi-Fibre Arrangement (MFA) and the consequent increase in competition from other developing countries, particularly China. Enhancing the competitiveness of human resources and maintaining necessary skills to compete in globalized markets require national policies focused on worker productivity and training. It also means adapting labour laws and the education systems to fit the needs of producers and the market economy, thereby addressing the problem of deficit in skills at all levels. In order to benefit from the commodity market boom, a number of economic, environmental and social challenges need to be addressed. The transparent, fair and equitable use of the resource revenues is one key issue. The resource rent can be used to sustain growing FDI inflows and to diversify economically; the development of human capital will consequently be important. One of the challenges for Africa is thus how revenues obtained from commodity exports could be channeled towards education, human resource development and infrastructure development, which are essential for productivity improvements and for industrialization in general, as well as for attracting FDI into the manufacturing sector.
Regional integration schemes that began soon after a majority of African countries attained independence could have created markets to attract more FDI inflows to large-scale production in the manufacturing sector, at least for local markets, but they have not progressed rapidly. It was not until the 1990s that the region resumed harmonization and revitalization of integration efforts, culminating in the establishment of the African Economic Community, the African Union and the New Partnership for Africa’s Development, but these are yet to have significant impact on FDI inflows.
b. Geographical and industrial distribution of inward FDI
The profile of FDI in Africa varies according to its geographical and sectoral destinations. The region’s total inward FDI stock of $315 billion in 2006 was distributed among the subregions as follows: North Africa (37 per cent), West Africa (20 per cent), Central Africa (7 per cent), East Africa (5 per cent) and Southern Africa (33 per cent) (UNCTAD 2007a), with South Africa being the largest recipient country, followed by Nigeria and Egypt (figure 4). The two principal subregional destinations for FDI inflows to Africa – North and Southern Africa – together account for a large part of the inflows (table 1). In 2006, FDI inflows to North Africa surged to a record level of $23 billion, accounting for 66 per cent of inflows to Africa. West Africa received $7 billion in FDI in 2006, amounting to 19 per cent of the inflows to the region. Nigeria was the main destination with about 80 per cent of the inflows. Central Africa attracted nearly $4 billion in FDI in 2006 – about 11 per cent of Africa’s total inflows – mostly in the primary and services sectors. In East Africa, FDI inflows rose to nearly $2 billion in 2006, accounting for about 5 per cent of the region’s inflows. Southern Africa remained a principal destination for a large part of the FDI inflows to the region. In 2005, South Africa alone had received $6.2 billion, about 20 per cent of the inflows to Africa. (Negative inflows to Southern Africa in 2006 were due to sell-offs of some foreign oil assets to the Government of Angola and large repayments of debt by foreign affiliates in South Africa to their parent firms.)
3 “Beneficiation: in search of carrot that may persuade miners to process locally”, Financial Times, 28 June 2005. 4 In comparing the wage rate, productivity of labour should be also taken into account. “Africa economy: China syndrome”, Economist Intelligence Unit (www.viewswire.com), 27 July 2005.
Overview
7
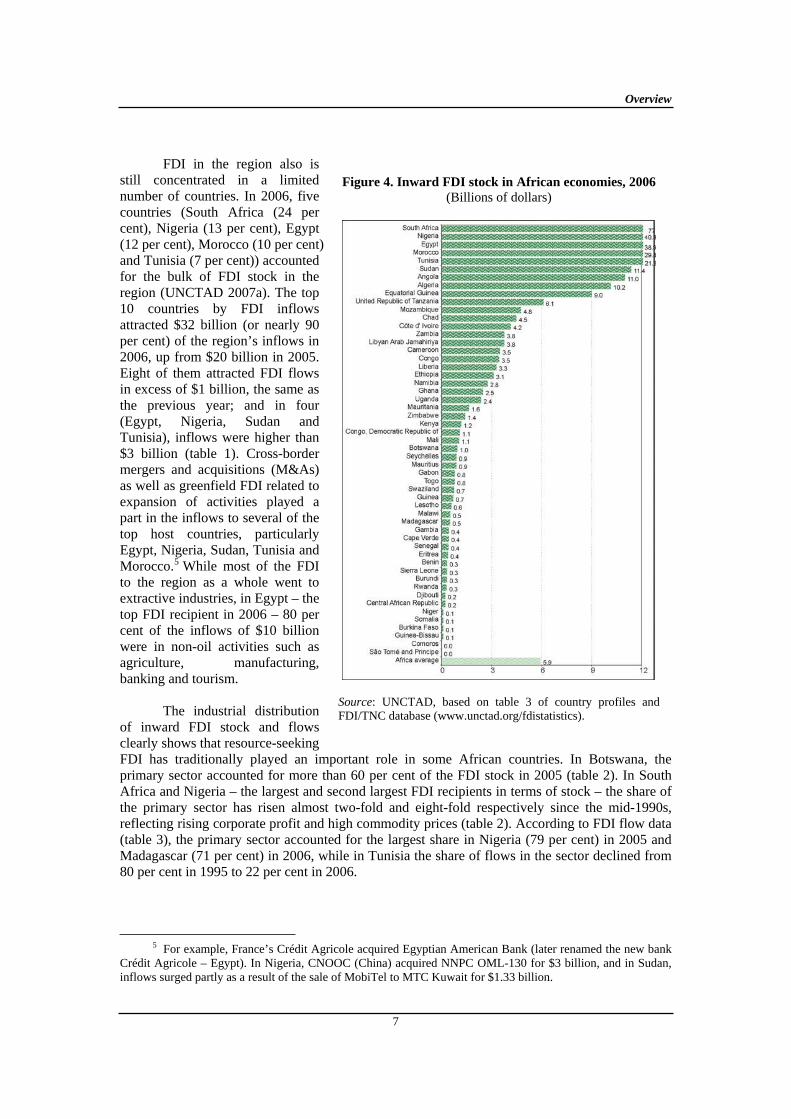
FDI in the region also is still concentrated in a limited number of countries. In 2006, five countries (South Africa (24 per cent), Nigeria (13 per cent), Egypt (12 per cent), Morocco (10 per cent) and Tunisia (7 per cent)) accounted for the bulk of FDI stock in the region (UNCTAD 2007a). The top 10 countries by FDI inflows attracted $32 billion (or nearly 90 per cent) of the region’s inflows in 2006, up from $20 billion in 2005. Eight of them attracted FDI flows in excess of $1 billion, the same as the previous year; and in four (Egypt, Nigeria, Sudan and Tunisia), inflows were higher than $3 billion (table 1). Cross-border mergers and acquisitions (M&As) as well as greenfield FDI related to expansion of activities played a part in the inflows to several of the top host countries, particularly Egypt, Nigeria, Sudan, Tunisia and Morocco.5 While most of the FDI to the region as a whole went to extractive industries, in Egypt – the top FDI recipient in 2006 – 80 per cent of the inflows of $10 billion were in non-oil activities such as agriculture, manufacturing, banking and tourism.
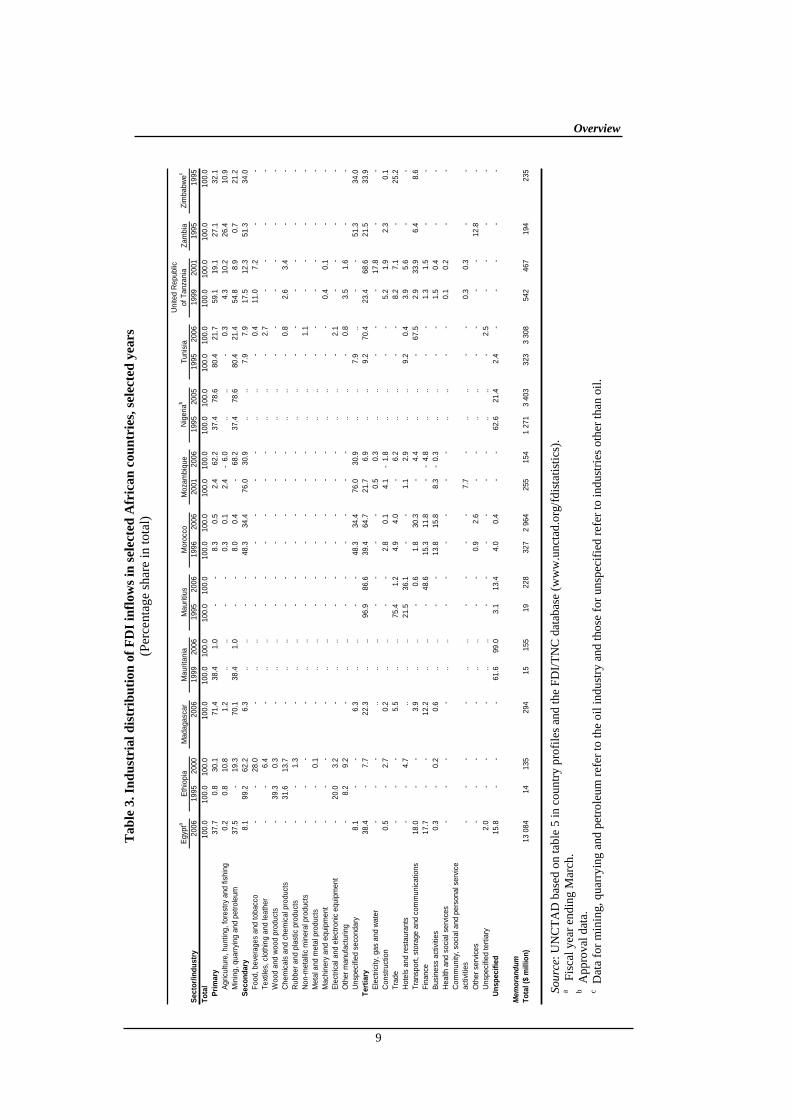
The industrial distribution of inward FDI stock and flows clearly shows that resource-seeking FDI has traditionally played an important role in some African countries. In Botswana, the primary sector accounted for more than 60 per cent of the FDI stock in 2005 (table 2). In South Africa and Nigeria – the largest and second largest FDI recipients in terms of stock – the share of the primary sector has risen almost two-fold and eight-fold respectively since the mid-1990s, reflecting rising corporate profit and high commodity prices (table 2). According to FDI flow data (table 3), the primary sector accounted for the largest share in Nigeria (79 per cent) in 2005 and Madagascar (71 per cent) in 2006, while in Tunisia the share of flows in the sector declined from 80 per cent in 1995 to 22 per cent in 2006.
5 For example, France’s Crédit Agricole acquired Egyptian American Bank (later renamed the new bank Crédit Agricole – Egypt). In Nigeria, CNOOC (China) acquired NNPC OML-130 for $3 billion, and in Sudan, inflows surged partly as a result of the sale of MobiTel to MTC Kuwait for $1.33 billion.
Figure 4. Inward FDI stock in African economies, 2006
(Billions of dollars)
Source: UNCTAD, based on table 3 of country profiles and FDI/TNC database (www.unctad.org/fdistatistics).
World Investment Directory Volume X Africa 2008
8
In some other countries, services and manufacturing are key sectors for FDI. For example, almost the same share (two fifths) of the FDI inflows in 2006 into Egypt (38 per cent) went into services and the primary sector, with 8 per cent going to the manufacturing sector (and 16 per cent unspecified) (table 3). Morocco is another example of an African country that has a large amount of FDI stock in services (60 per cent) and manufacturing industries such as textiles and electronic equipment (31 per cent), and only 3 per cent in mining, quarrying and petroleum. This is confirmed as well by FDI flow data in Morocco (table 3), where there is an increase of the share of services in total flows from 39 per cent in 1996 to 65 per cent in 2006, due to large investments in transport, storage and communications. Financial services accounted for a large share of inward FDI stock in Egypt, South Africa and Zambia, while in Uganda the share increased from 18 per cent in 2000 to 28 per cent in 2003 (table 2); and in Mauritius, as much as half of FDI inflows went to the financial services industry (table 3).
A wider range of small and resource-poor countries has attracted slightly increased FDI inflows into the services sector, mainly from developed countries and South Africa, through privatization programmes. Nevertheless, several countries, particularly LDCs, mostly without large reserves of natural resources, still lagged behind in their FDI inflows (table 1). Some of them were also troubled by civil wars and political instabilities, making it risky for TNCs to make long-term investment in these economies. Six LDCs – Chad, Liberia, Rwanda, Sierra Leone, Somalia and Sudan – were mired in conflicts or their after-effects. However, the situation was moderated with respect to FDI inflows to Chad and Sudan, where oil reserves have been turned into major recipients of FDI, starting from 2003 (table 1).
In terms of cross-border M&A sales, the key industries that attracted most of the investments have been services and mining, quarrying and petroleum (table 4). The value of transactions in the services sector rose manifold to nearly $11 billion in 2006 from $0.4 billion in 1995, with trade, transport, storage and communication, finance, and business services being the most important. Although lower in value and share, cross-border M&A sales in the manufacturing sector have risen noticeably since 2000.
Developed countries have accounted for the lion’s share of inward FDI stock and of flows to many African countries over various periods, and in some of the region’s major recipient countries – such as Algeria, Nigeria, South Africa and Morocco – their share is above 90 per cent (table 5, annex tables 1 and 2). However, in some countries, although developed economies remained the main sources of FDI, their share declined over the years. For example, the developed countries’ share in FDI inflows declined in Algeria (from 93 per cent in 1999 to 66 per cent in 2001), in Egypt (from 83 per cent in 1999–2001 to 67 per cent in 2006) and Tunisia (from 92 per cent in 1990–1992 to 77 per cent in 2005). In some others – such as Ethiopia, Madagascar and Mauritius – developed countries are lately becoming the largest source of FDI flows. Not surprisingly, most of the FDI stock in Africa originates in a few European Union countries – namely the United Kingdom, France, Portugal and Italy – and North America, mainly the United States (annex table 1). Leading developed country sources of FDI in some top host countries of the region include (a) the United Kingdom for FDI in South Africa, Madagascar and Zambia; (b) France for FDI in Morocco; (c) the United States for FDI in Egypt; and (d) Italy for FDI in Tunisia. Over the past five years or so, developed countries such as Canada and Luxembourg have emerged as important new sources of FDI for some countries in Africa (annex table 1). TNCs from Germany and France are engaged in the automotive industries, in addition to natural resource exploitation activities in Nigeria and South Africa. Among developed countries, Japan’s share in the inward FDI stock in Africa is small, and is concentrated in Egypt, Swaziland and the United Republic of Tanzania, accounting for 5 per cent, 6 per cent and 5 per cent, respectively, of those countries’ total inward FDI stock. Japanese TNCs are involved in high-tech activities, with Toyota, for example, running major plants in Egypt and South Africa.
Ta
ble
3.
Ind
ust
rial
dis
trib
uti
on
of
FD
I in
flo
ws
in s
elec
ted
Afr
ica
n c
ou
ntr
ies,
sel
ecte
d y
ears
(Per
cent
age
shar
e in
tota
l)
Egy
pta
Eth
iopi
aM
adag
asca
rM
aurit
ania
Mau
ritiu
sM
oroc
coM
ozam
biqu
eN
iger
iab
Tun
isia
Uni
ted
Rep
ublic
of
Tan
zani
aZ
ambi
aZ
imba
bwec
Sec
tor/
ind
ustr
y20
0619
9520
0020
0619
9920
0619
9520
0619
9620
0620
0120
0619
9520
0519
9520
0619
9920
0119
9519
95T
ota
l 1
00.0
100
.0 1
00.0
100
.0 1
00.0
100
.0 1
00.0
100
.0 1
00.0
100
.0 1
00.0
100
.0 1
00.0
100
.0 1
00.0
100
.0 1
00.0
100
.0 1
00.0
100
.0P
rim
ary
37.
7 0
.8 3
0.1
71.
4 3
8.4
1.0
--
8.3
0.5
2.4
62.
2 3
7.4
78.
6 8
0.4
21.
7 5
9.1
19.
1 2
7.1
32.
1A
gric
ultu
re, h
untin
g, fo
rest
ry a
nd fi
shin
g 0
.2 0
.8 1
0.8
1.2
....
--
0.3
0.1
2.4
- 6
.0..
..-
0.3
4.3
10.
2 2
6.4
10.
9M
inin
g, q
uarr
ying
and
pet
role
um 3
7.5
- 1
9.3
70.
1 3
8.4
1.0
--
8.0
0.4
- 6
8.2
37.
4 7
8.6
80.
4 2
1.4
54.
8 8
.9 0
.7 2
1.2
Se
co
nd
ary
8.1
99.
2 6
2.2
6.3
....
--
48.
3 3
4.4
76.
0 3
0.9
....
7.9
7.9
17.
5 1
2.3
51.
3 3
4.0
Foo
d, b
ever
ages
and
toba
cco
--
28.
0-
....
--
--
--
....
- 0
.4 1
1.0
7.2
--
Text
iles,
clo
thin
g an
d le
athe
r-
- 6
.4-
....
--
--
--
....
- 2
.7-
--
-W
ood
and
woo
d pr
oduc
ts-
39.
3 0
.3-
....
--
--
--
....
--
--
--
Che
mic
als
and
chem
ical
pro
duct
s-
31.
6 1
3.7
-..
..-
--
--
-..
..-
0.8
2.6
3.4
--
Rub
ber
and
plas
tic p
rodu
cts
--
1.3
-..
..-
--
--
-..
..-
--
--
-N
on-m
etal
lic m
iner
al p
rodu
cts
--
--
....
--
--
--
....
- 1
.1-
--
-M
etal
and
met
al p
rodu
cts
--
0.1
-..
..-
--
--
-..
..-
--
--
-M
achi
nery
and
equ
ipm
ent
--
--
....
--
--
--
....
--
0.4
0.1
--
Ele
ctric
al a
nd e
lect
roni
c eq
uipm
ent
- 2
0.0
3.2
-..
..-
--
--
-..
..-
2.1
--
--
Oth
er m
anuf
actu
ring
- 8
.2 9
.2-
....
--
--
--
....
- 0
.8 3
.5 1
.6-
-U
nspe
cifie
d se
cond
ary
8.1
--
6.3
....
--
48.
3 3
4.4
76.
0 3
0.9
....
7.9
..-
- 5
1.3
34.
0T
ert
iary
38.
4-
7.7
22.
3..
.. 9
6.9
86.
6 3
9.4
64.
7 2
1.7
6.9
....
9.2
70.
4 2
3.4
68.
6 2
1.5
33.
9E
lect
ricity
, gas
and
wat
er-
--
....
..-
--
- 0
.5 0
.3..
..-
--
17.
8-
-C
onst
ruct
ion
0.5
- 2
.7 0
.2..
..-
- 2
.8 0
.1 4
.1-
1.8
....
--
5.2
1.9
2.3
0.1
Trad
e-
--
5.5
....
75.
4 1
.2 4
.9 4
.0-
6.2
....
--
8.2
7.1
- 2
5.2
Hot
els
and
rest
aura
nts
--
4.7
....
.. 2
1.5
36.
1-
- 1
.1 2
.9..
.. 9
.2 0
.4 3
.9 5
.6-
-Tr
ansp
ort,
stor
age
and
com
mun
icat
ions
18.
0-
- 3
.9..
..-
0.6
1.8
30.
3-
4.4
....
- 6
7.5
2.9
33.
9 6
.4 8
.6F
inan
ce 1
7.7
--
12.
2..
..-
48.
6 1
5.3
11.
8-
- 4
.8..
..-
- 1
.3 1
.5-
-B
usin
ess
activ
ities
0.3
- 0
.2 0
.6..
..-
- 1
3.8
15.
8 8
.3-
0.3
....
--
1.5
0.4
--
Hea
lth a
nd s
ocia
l ser
vice
s-
--
-..
..-
--
--
-..
..-
- 0
.1 0
.2-
-C
omm
unity
, soc
ial a
nd p
erso
nal s
ervi
ce
activ
ities
--
--
....
--
--
7.7
-..
..-
- 0
.3 0
.3-
-O
ther
ser
vice
s-
--
-..
..-
- 0
.9 2
.6-
-..
..-
--
- 1
2.8
-U
nspe
cifie
d te
rtia
ry 2
.0-
--
....
--
--
--
....
- 2
.5-
--
-U
nsp
ec
ifie
d 1
5.8
--
- 6
1.6
99.
0 3
.1 1
3.4
4.0
0.4
--
62.
6 2
1.4
2.4
--
--
-
Me
mo
ran
du
m
To
tal ($
mil
lio
n)
13
084
14
135
294
15
155
19
228
327
2 9
64 2
55 1
54 1
271
3 4
03 3
23 3
308
542
467
194
235
Sou
rce:
UN
CT
AD
bas
ed o
n ta
ble
5 in
cou
ntry
pro
file
s an
d th
e FD
I/T
NC
dat
abas
e (w
ww
.unc
tad.
org/
fdis
tatis
tics
).
a F
isca
l yea
r en
ding
Mar
ch.
b App
rova
l dat
a.
c Dat
a fo
r m
inin
g, q
uarr
ying
and
pet
role
um r
efer
to th
e oi
l ind
ustr
y an
d th
ose
for
unsp
ecif
ied
refe
r to
indu
stri
es o
ther
than
oil
.
Overview
9
World Investment Directory Volume X Africa 2008
10
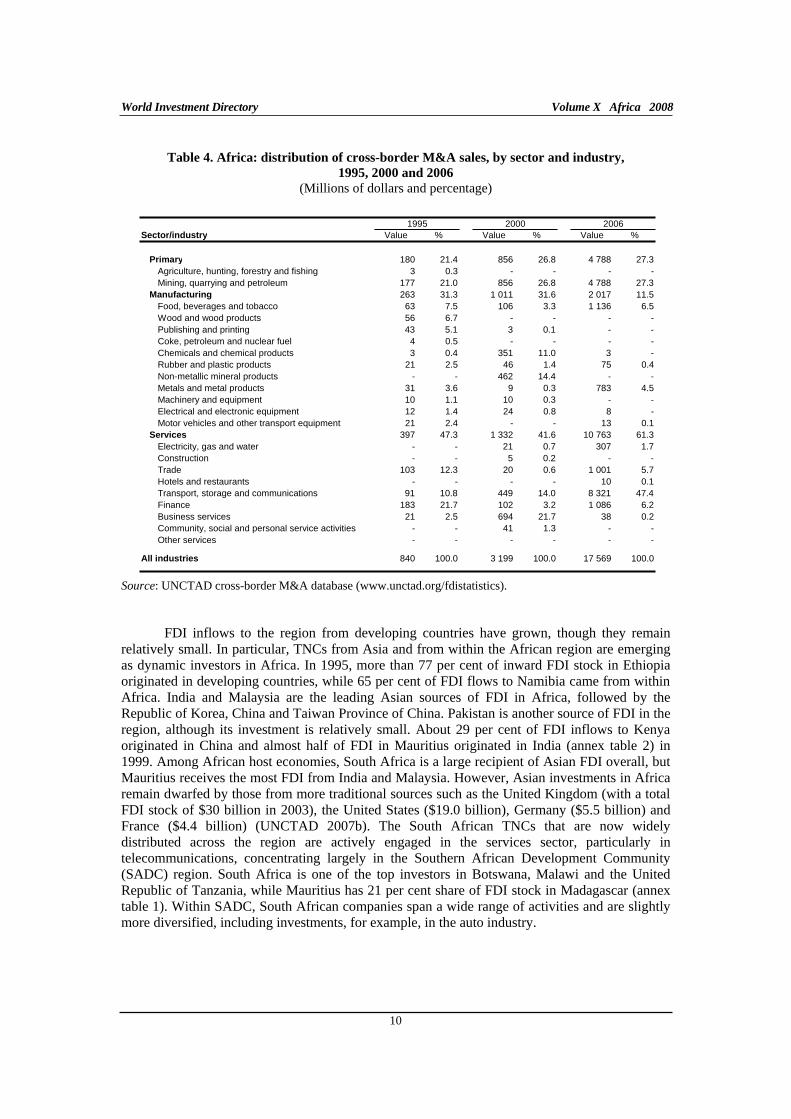
Table 4. Africa: distribution of cross-border M&A sales, by sector and industry,
1995, 2000 and 2006
(Millions of dollars and percentage)
1995 2000 2006Sector/industry Value % Value % Value %
Primary 180 21.4 856 26.8 4 788 27.3Agriculture, hunting, forestry and fishing 3 0.3 - - - -Mining, quarrying and petroleum 177 21.0 856 26.8 4 788 27.3
Manufacturing 263 31.3 1 011 31.6 2 017 11.5Food, beverages and tobacco 63 7.5 106 3.3 1 136 6.5Wood and wood products 56 6.7 - - - -Publishing and printing 43 5.1 3 0.1 - -Coke, petroleum and nuclear fuel 4 0.5 - - - -Chemicals and chemical products 3 0.4 351 11.0 3 -Rubber and plastic products 21 2.5 46 1.4 75 0.4Non-metallic mineral products - - 462 14.4 - -Metals and metal products 31 3.6 9 0.3 783 4.5Machinery and equipment 10 1.1 10 0.3 - -Electrical and electronic equipment 12 1.4 24 0.8 8 -Motor vehicles and other transport equipment 21 2.4 - - 13 0.1
Services 397 47.3 1 332 41.6 10 763 61.3Electricity, gas and water - - 21 0.7 307 1.7Construction - - 5 0.2 - -Trade 103 12.3 20 0.6 1 001 5.7Hotels and restaurants - - - - 10 0.1Transport, storage and communications 91 10.8 449 14.0 8 321 47.4Finance 183 21.7 102 3.2 1 086 6.2Business services 21 2.5 694 21.7 38 0.2Community, social and personal service activities - - 41 1.3 - -Other services - - - - - -
All industries 840 100.0 3 199 100.0 17 569 100.0
Source: UNCTAD cross-border M&A database (www.unctad.org/fdistatistics).
FDI inflows to the region from developing countries have grown, though they remain relatively small. In particular, TNCs from Asia and from within the African region are emerging as dynamic investors in Africa. In 1995, more than 77 per cent of inward FDI stock in Ethiopia originated in developing countries, while 65 per cent of FDI flows to Namibia came from within Africa. India and Malaysia are the leading Asian sources of FDI in Africa, followed by the Republic of Korea, China and Taiwan Province of China. Pakistan is another source of FDI in the region, although its investment is relatively small. About 29 per cent of FDI inflows to Kenya originated in China and almost half of FDI in Mauritius originated in India (annex table 2) in 1999. Among African host economies, South Africa is a large recipient of Asian FDI overall, but Mauritius receives the most FDI from India and Malaysia. However, Asian investments in Africa remain dwarfed by those from more traditional sources such as the United Kingdom (with a total FDI stock of $30 billion in 2003), the United States ($19.0 billion), Germany ($5.5 billion) and France ($4.4 billion) (UNCTAD 2007b). The South African TNCs that are now widely distributed across the region are actively engaged in the services sector, particularly in telecommunications, concentrating largely in the Southern African Development Community (SADC) region. South Africa is one of the top investors in Botswana, Malawi and the United Republic of Tanzania, while Mauritius has 21 per cent share of FDI stock in Madagascar (annex table 1). Within SADC, South African companies span a wide range of activities and are slightly more diversified, including investments, for example, in the auto industry.
Overview
11
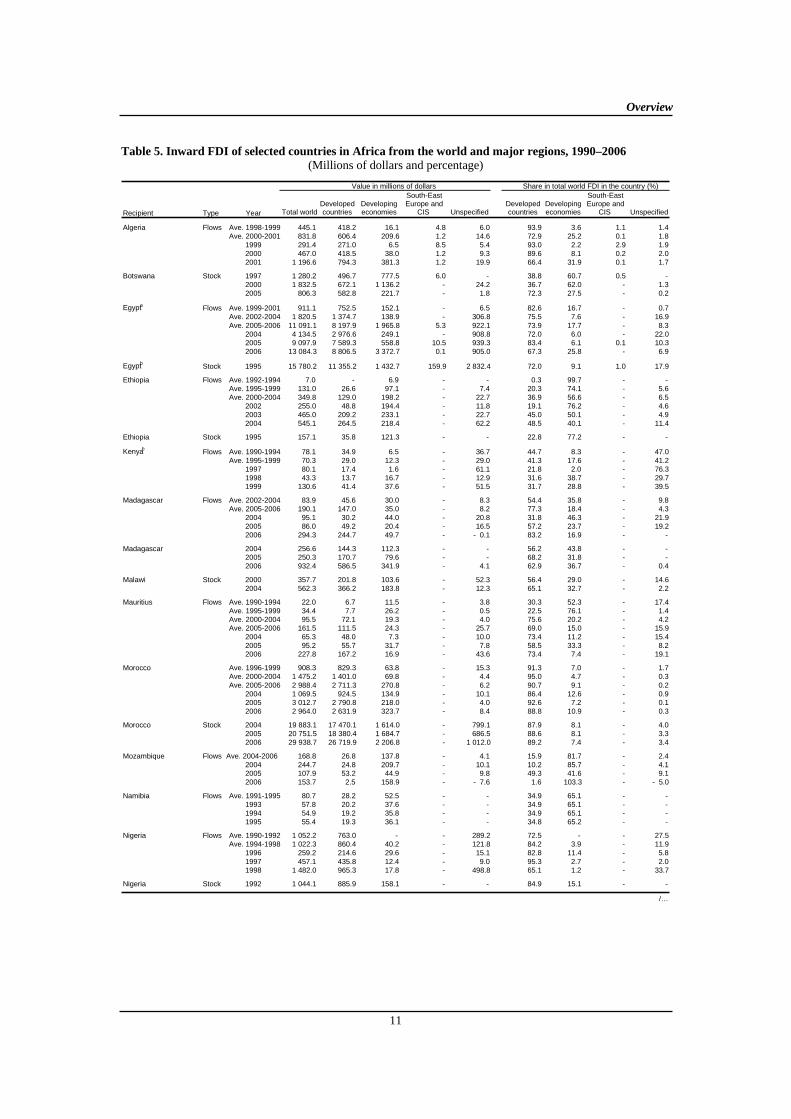
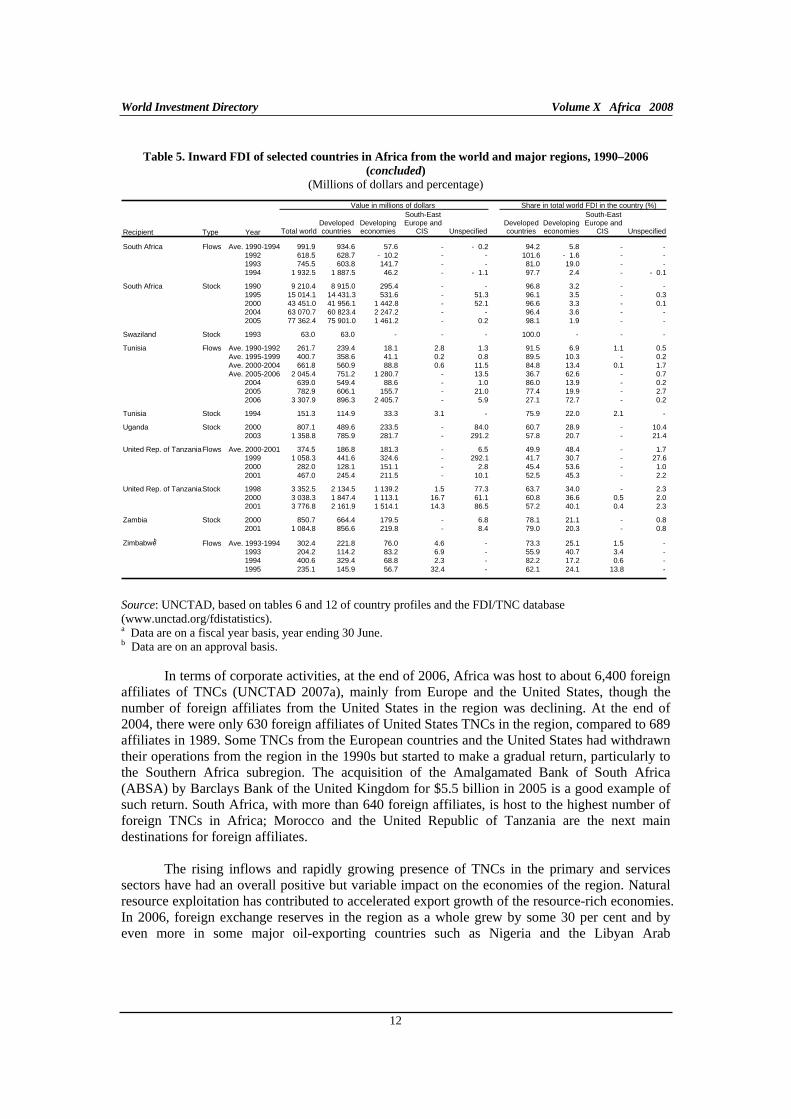
Table 5. Inward FDI of selected countries in Africa from the world and major regions, 1990–2006 (Millions of dollars and percentage)
Value in millions of dollars Share in total world FDI in the country (%)
Recipient Type Year Total worldDeveloped countries
Developing economies
South-East Europe and
CIS UnspecifiedDeveloped countries
Developing economies
South-East Europe and
CIS Unspecified
Algeria Flows Ave. 1998-1999 445.1 418.2 16.1 4.8 6.0 93.9 3.6 1.1 1.4Ave. 2000-2001 831.8 606.4 209.6 1.2 14.6 72.9 25.2 0.1 1.8
1999 291.4 271.0 6.5 8.5 5.4 93.0 2.2 2.9 1.92000 467.0 418.5 38.0 1.2 9.3 89.6 8.1 0.2 2.02001 1 196.6 794.3 381.3 1.2 19.9 66.4 31.9 0.1 1.7
Botswana Stock 1997 1 280.2 496.7 777.5 6.0 - 38.8 60.7 0.5 -2000 1 832.5 672.1 1 136.2 - 24.2 36.7 62.0 - 1.32005 806.3 582.8 221.7 - 1.8 72.3 27.5 - 0.2
Egypta Flows Ave. 1999-2001 911.1 752.5 152.1 - 6.5 82.6 16.7 - 0.7Ave. 2002-2004 1 820.5 1 374.7 138.9 - 306.8 75.5 7.6 - 16.9Ave. 2005-2006 11 091.1 8 197.9 1 965.8 5.3 922.1 73.9 17.7 - 8.3
2004 4 134.5 2 976.6 249.1 - 908.8 72.0 6.0 - 22.02005 9 097.9 7 589.3 558.8 10.5 939.3 83.4 6.1 0.1 10.32006 13 084.3 8 806.5 3 372.7 0.1 905.0 67.3 25.8 - 6.9
Egyptb Stock 1995 15 780.2 11 355.2 1 432.7 159.9 2 832.4 72.0 9.1 1.0 17.9
Ethiopia Flows Ave. 1992-1994 7.0 - 6.9 - - 0.3 99.7 - -Ave. 1995-1999 131.0 26.6 97.1 - 7.4 20.3 74.1 - 5.6Ave. 2000-2004 349.8 129.0 198.2 - 22.7 36.9 56.6 - 6.5
2002 255.0 48.8 194.4 - 11.8 19.1 76.2 - 4.62003 465.0 209.2 233.1 - 22.7 45.0 50.1 - 4.92004 545.1 264.5 218.4 - 62.2 48.5 40.1 - 11.4
Ethiopia Stock 1995 157.1 35.8 121.3 - - 22.8 77.2 - -
Kenyab Flows Ave. 1990-1994 78.1 34.9 6.5 - 36.7 44.7 8.3 - 47.0Ave. 1995-1999 70.3 29.0 12.3 - 29.0 41.3 17.6 - 41.2
1997 80.1 17.4 1.6 - 61.1 21.8 2.0 - 76.31998 43.3 13.7 16.7 - 12.9 31.6 38.7 - 29.71999 130.6 41.4 37.6 - 51.5 31.7 28.8 - 39.5
Madagascar Flows Ave. 2002-2004 83.9 45.6 30.0 - 8.3 54.4 35.8 - 9.8Ave. 2005-2006 190.1 147.0 35.0 - 8.2 77.3 18.4 - 4.3
2004 95.1 30.2 44.0 - 20.8 31.8 46.3 - 21.92005 86.0 49.2 20.4 - 16.5 57.2 23.7 - 19.22006 294.3 244.7 49.7 - - 0.1 83.2 16.9 - -
Madagascar 2004 256.6 144.3 112.3 - - 56.2 43.8 - -2005 250.3 170.7 79.6 - - 68.2 31.8 - -2006 932.4 586.5 341.9 - 4.1 62.9 36.7 - 0.4
Malawi Stock 2000 357.7 201.8 103.6 - 52.3 56.4 29.0 - 14.62004 562.3 366.2 183.8 - 12.3 65.1 32.7 - 2.2
Mauritius Flows Ave. 1990-1994 22.0 6.7 11.5 - 3.8 30.3 52.3 - 17.4Ave. 1995-1999 34.4 7.7 26.2 - 0.5 22.5 76.1 - 1.4Ave. 2000-2004 95.5 72.1 19.3 - 4.0 75.6 20.2 - 4.2Ave. 2005-2006 161.5 111.5 24.3 - 25.7 69.0 15.0 - 15.9
2004 65.3 48.0 7.3 - 10.0 73.4 11.2 - 15.42005 95.2 55.7 31.7 - 7.8 58.5 33.3 - 8.22006 227.8 167.2 16.9 - 43.6 73.4 7.4 - 19.1
Morocco Ave. 1996-1999 908.3 829.3 63.8 - 15.3 91.3 7.0 - 1.7Ave. 2000-2004 1 475.2 1 401.0 69.8 - 4.4 95.0 4.7 - 0.3Ave. 2005-2006 2 988.4 2 711.3 270.8 - 6.2 90.7 9.1 - 0.2
2004 1 069.5 924.5 134.9 - 10.1 86.4 12.6 - 0.92005 3 012.7 2 790.8 218.0 - 4.0 92.6 7.2 - 0.12006 2 964.0 2 631.9 323.7 - 8.4 88.8 10.9 - 0.3
Morocco Stock 2004 19 883.1 17 470.1 1 614.0 - 799.1 87.9 8.1 - 4.02005 20 751.5 18 380.4 1 684.7 - 686.5 88.6 8.1 - 3.32006 29 938.7 26 719.9 2 206.8 - 1 012.0 89.2 7.4 - 3.4
Mozambique Flows Ave. 2004-2006 168.8 26.8 137.8 - 4.1 15.9 81.7 - 2.42004 244.7 24.8 209.7 - 10.1 10.2 85.7 - 4.12005 107.9 53.2 44.9 - 9.8 49.3 41.6 - 9.12006 153.7 2.5 158.9 - - 7.6 1.6 103.3 - - 5.0
Namibia Flows Ave. 1991-1995 80.7 28.2 52.5 - - 34.9 65.1 - -1993 57.8 20.2 37.6 - - 34.9 65.1 - -1994 54.9 19.2 35.8 - - 34.9 65.1 - -1995 55.4 19.3 36.1 - - 34.8 65.2 - -
Nigeria Flows Ave. 1990-1992 1 052.2 763.0 - - 289.2 72.5 - - 27.5Ave. 1994-1998 1 022.3 860.4 40.2 - 121.8 84.2 3.9 - 11.9
1996 259.2 214.6 29.6 - 15.1 82.8 11.4 - 5.81997 457.1 435.8 12.4 - 9.0 95.3 2.7 - 2.01998 1 482.0 965.3 17.8 - 498.8 65.1 1.2 - 33.7
Nigeria Stock 1992 1 044.1 885.9 158.1 - - 84.9 15.1 - -
/…
World Investment Directory Volume X Africa 2008
12
Table 5. Inward FDI of selected countries in Africa from the world and major regions, 1990–2006
(concluded)(Millions of dollars and percentage)
Source: UNCTAD, based on tables 6 and 12 of country profiles and the FDI/TNC database (www.unctad.org/fdistatistics). a Data are on a fiscal year basis, year ending 30 June.b Data are on an approval basis.
In terms of corporate activities, at the end of 2006, Africa was host to about 6,400 foreign affiliates of TNCs (UNCTAD 2007a), mainly from Europe and the United States, though the number of foreign affiliates from the United States in the region was declining. At the end of 2004, there were only 630 foreign affiliates of United States TNCs in the region, compared to 689 affiliates in 1989. Some TNCs from the European countries and the United States had withdrawn their operations from the region in the 1990s but started to make a gradual return, particularly to the Southern Africa subregion. The acquisition of the Amalgamated Bank of South Africa (ABSA) by Barclays Bank of the United Kingdom for $5.5 billion in 2005 is a good example of such return. South Africa, with more than 640 foreign affiliates, is host to the highest number of foreign TNCs in Africa; Morocco and the United Republic of Tanzania are the next main destinations for foreign affiliates.
The rising inflows and rapidly growing presence of TNCs in the primary and services sectors have had an overall positive but variable impact on the economies of the region. Natural resource exploitation has contributed to accelerated export growth of the resource-rich economies. In 2006, foreign exchange reserves in the region as a whole grew by some 30 per cent and by even more in some major oil-exporting countries such as Nigeria and the Libyan Arab
Value in millions of dollars Share in total world FDI in the country (%)
Recipient Type Year Total worldDeveloped countries
Developing economies
South-East Europe and
CIS UnspecifiedDeveloped countries
Developing economies
South-East Europe and
CIS Unspecified
South Africa Flows Ave. 1990-1994 991.9 934.6 57.6 - - 0.2 94.2 5.8 - -1992 618.5 628.7 - 10.2 - - 101.6 - 1.6 - -1993 745.5 603.8 141.7 - - 81.0 19.0 - -1994 1 932.5 1 887.5 46.2 - - 1.1 97.7 2.4 - - 0.1
South Africa Stock 1990 9 210.4 8 915.0 295.4 - - 96.8 3.2 - -1995 15 014.1 14 431.3 531.6 - 51.3 96.1 3.5 - 0.32000 43 451.0 41 956.1 1 442.8 - 52.1 96.6 3.3 - 0.12004 63 070.7 60 823.4 2 247.2 - - 96.4 3.6 - -2005 77 362.4 75 901.0 1 461.2 - 0.2 98.1 1.9 - -
Swaziland Stock 1993 63.0 63.0 - - - 100.0 - - -
Tunisia Flows Ave. 1990-1992 261.7 239.4 18.1 2.8 1.3 91.5 6.9 1.1 0.5Ave. 1995-1999 400.7 358.6 41.1 0.2 0.8 89.5 10.3 - 0.2Ave. 2000-2004 661.8 560.9 88.8 0.6 11.5 84.8 13.4 0.1 1.7Ave. 2005-2006 2 045.4 751.2 1 280.7 - 13.5 36.7 62.6 - 0.7
2004 639.0 549.4 88.6 - 1.0 86.0 13.9 - 0.22005 782.9 606.1 155.7 - 21.0 77.4 19.9 - 2.72006 3 307.9 896.3 2 405.7 - 5.9 27.1 72.7 - 0.2
Tunisia Stock 1994 151.3 114.9 33.3 3.1 - 75.9 22.0 2.1 -
Uganda Stock 2000 807.1 489.6 233.5 - 84.0 60.7 28.9 - 10.42003 1 358.8 785.9 281.7 - 291.2 57.8 20.7 - 21.4
United Rep. of TanzaniaFlows Ave. 2000-2001 374.5 186.8 181.3 - 6.5 49.9 48.4 - 1.71999 1 058.3 441.6 324.6 - 292.1 41.7 30.7 - 27.62000 282.0 128.1 151.1 - 2.8 45.4 53.6 - 1.02001 467.0 245.4 211.5 - 10.1 52.5 45.3 - 2.2
United Rep. of TanzaniaStock 1998 3 352.5 2 134.5 1 139.2 1.5 77.3 63.7 34.0 - 2.32000 3 038.3 1 847.4 1 113.1 16.7 61.1 60.8 36.6 0.5 2.02001 3 776.8 2 161.9 1 514.1 14.3 86.5 57.2 40.1 0.4 2.3
Zambia Stock 2000 850.7 664.4 179.5 - 6.8 78.1 21.1 - 0.82001 1 084.8 856.6 219.8 - 8.4 79.0 20.3 - 0.8
Zimbabweb Flows Ave. 1993-1994 302.4 221.8 76.0 4.6 - 73.3 25.1 1.5 -1993 204.2 114.2 83.2 6.9 - 55.9 40.7 3.4 -1994 400.6 329.4 68.8 2.3 - 82.2 17.2 0.6 -1995 235.1 145.9 56.7 32.4 - 62.1 24.1 13.8 -
Overview
13
Jamahiriya.6 Income on inward FDI as reported in the balance of payments in 2006 grew by 14 per cent, which was more than in Asia and Oceania (9 per cent), but much less than in Latin America and the Caribbean (36 per cent).7 TNCs engaged in the services sector have also helped to boost the level of infrastructure development and economic growth leading local African companies also to expand outside their national territories, particularly in the telecommunications and electricity and gas industries.
As far as distribution of foreign affiliates by industry is concerned, they operate in various industries from small agricultural, agro-processing and manufacturing companies operating in niche markets, to worldwide petroleum, energy and communication companies employing thousands of people. However, large foreign affiliates are engaged mainly in oil exploration and mining and quarrying in the primary sector, and telecommunications in the services sector (table 6).
2. Outward FDI
In some African countries, local companies have successfully transformed themselves into major global players. Several Africa-based TNCs are spreading into the global market and engaging in investment activities outside Africa, including in the United Kingdom and the United States (table 7). In 2006, FDI outflows from Africa stood at over $8 billion (figure 5), and outward FDI stock from the region reached $60 billion, as compared with $7 billion in 1980. The distribution of the region’s outward FDI stock was, however, skewed towards a few home countries, as reflected in the following shares: South Africa (73 per cent), Nigeria (10 per cent), Liberia (5.4 per cent) and Libyan Arab Jamahiriya (2 per cent) (figure 6). North Africa accounted for about 8 per cent of the region’s outward stock, with Libyan Arab Jamahiriya, Morocco, Egypt and Algeria being the principal home countries.
While the spread of outward FDI from Africa is certainly less spectacular than that of FDI from the emerging economies of Asia and Latin America, the amount has become significant, particularly from the mid-1990s. Its rise has been driven by the need to engage in the globalization process, such as with mobile phone services, as well as gains from growth in profits in many production sectors. Recent trends show that total FDI outflows from the region had fluctuated from $2.5 billion in 1995 to –$2.6 billion in 2001, and in 2006, they registered a significant recovery, to $8.2 billion (figure 5). Most of these outflows originated in South Africa.
Since the end of apartheid in the early 1990s, South Africa has emerged as a global powerhouse for outward FDI, with a strong focus on the services sector: communications, finance, electricity, trade, transport and storage. Some South African TNCs are also engaged in the primary and secondary sectors. South Africa’s FDI outflows to the rest of Africa have been a vital part of the region’s FDI, accounting, for example, for up to 40 per cent of the inward FDI stock in Botswana in 2003 (annex table 1). In 2004, the Government of South Africa abolished limits and eased foreign-exchange restrictions on its TNCs investing abroad. As a consequence, TNCs from the country in search of markets and assets have a strong presence abroad in virtually all sectors within Africa and abroad. The expansion is also attributable to South Africa’s robust economy, characterized by a high degree of industrial development and technological capability at the corporate level, compared with other countries in the region. The country’s strategy of encouraging its TNCs’ outward FDI activities has become important for the overall development of other countries in Africa through increased investment in their economies.
6 Data on international reserves from the IMF’s International Financial Statistics.7 Based on 29 African countries; source: IMF, Balance of Payments Statistics.
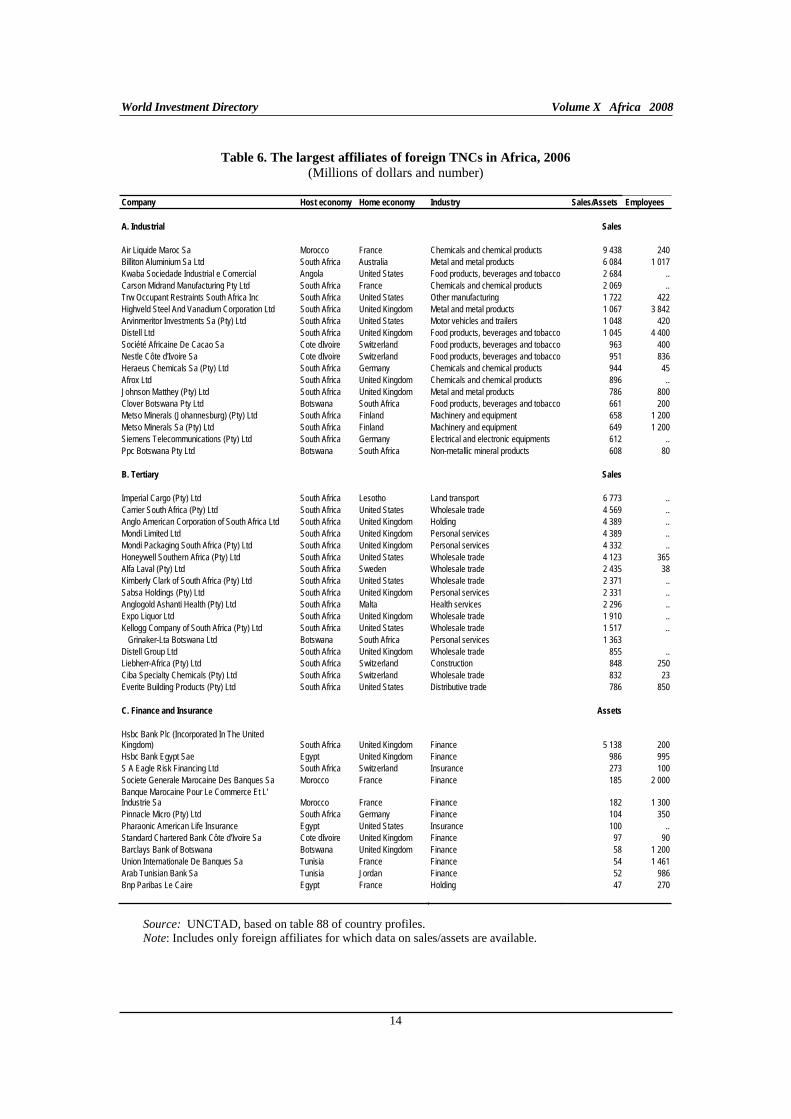
World Investment Directory Volume X Africa 2008
14
Table 6. The largest affiliates of foreign TNCs in Africa, 2006
(Millions of dollars and number)
Company Host economy Home economy Industry Sales/Assets Employees
A. Industrial Sales
Air Liquide Maroc Sa Morocco France Chemicals and chemical products 9 438 240
Billiton Aluminium Sa Ltd South Africa Australia Metal and metal products 6 084 1 017
Kwaba Sociedade Industrial e Comercial Angola United States Food products, beverages and tobacco 2 684 ..
Carson Midrand Manufacturing Pty Ltd South Africa France Chemicals and chemical products 2 069 ..
Trw Occupant Restraints South Africa Inc South Africa United States Other manufacturing 1 722 422
Highveld Steel And Vanadium Corporation Ltd South Africa United Kingdom Metal and metal products 1 067 3 842
Arvinmeritor Investments Sa (Pty) Ltd South Africa United States Motor vehicles and trailers 1 048 420
Distell Ltd South Africa United Kingdom Food products, beverages and tobacco 1 045 4 400
Société Africaine De Cacao Sa Cote dIvoire Switzerland Food products, beverages and tobacco 963 400
Nestle Côte d'Ivoire Sa Cote dIvoire Switzerland Food products, beverages and tobacco 951 836
Heraeus Chemicals Sa (Pty) Ltd South Africa Germany Chemicals and chemical products 944 45
Afrox Ltd South Africa United Kingdom Chemicals and chemical products 896 ..
Johnson Matthey (Pty) Ltd South Africa United Kingdom Metal and metal products 786 800
Clover Botswana Pty Ltd Botswana South Africa Food products, beverages and tobacco 661 200
Metso Minerals (Johannesburg) (Pty) Ltd South Africa Finland Machinery and equipment 658 1 200
Metso Minerals Sa (Pty) Ltd South Africa Finland Machinery and equipment 649 1 200
Siemens Telecommunications (Pty) Ltd South Africa Germany Electrical and electronic equipments 612 ..
Ppc Botswana Pty Ltd Botswana South Africa Non-metallic mineral products 608 80
B. Tertiary Sales
Imperial Cargo (Pty) Ltd South Africa Lesotho Land transport 6 773 ..
Carrier South Africa (Pty) Ltd South Africa United States Wholesale trade 4 569 ..
Anglo American Corporation of South Africa Ltd South Africa United Kingdom Holding 4 389 ..
Mondi Limited Ltd South Africa United Kingdom Personal services 4 389 ..
Mondi Packaging South Africa (Pty) Ltd South Africa United Kingdom Personal services 4 332 ..
Honeywell Southern Africa (Pty) Ltd South Africa United States Wholesale trade 4 123 365
Alfa Laval (Pty) Ltd South Africa Sweden Wholesale trade 2 435 38
Kimberly Clark of South Africa (Pty) Ltd South Africa United States Wholesale trade 2 371 ..
Sabsa Holdings (Pty) Ltd South Africa United Kingdom Personal services 2 331 ..
Anglogold Ashanti Health (Pty) Ltd South Africa Malta Health services 2 296 ..
Expo Liquor Ltd South Africa United Kingdom Wholesale trade 1 910 ..
Kellogg Company of South Africa (Pty) Ltd South Africa United States Wholesale trade 1 517 ..
Grinaker-Lta Botswana Ltd Botswana South Africa Personal services 1 363
Distell Group Ltd South Africa United Kingdom Wholesale trade 855 ..
Liebherr-Africa (Pty) Ltd South Africa Switzerland Construction 848 250
Ciba Specialty Chemicals (Pty) Ltd South Africa Switzerland Wholesale trade 832 23
Everite Building Products (Pty) Ltd South Africa United States Distributive trade 786 850
C. Finance and Insurance Assets
Hsbc Bank Plc (Incorporated In The United Kingdom) South Africa United Kingdom Finance 5 138 200
Hsbc Bank Egypt Sae Egypt United Kingdom Finance 986 995
S A Eagle Risk Financing Ltd South Africa Switzerland Insurance 273 100
Societe Generale Marocaine Des Banques Sa Morocco France Finance 185 2 000
Banque Marocaine Pour Le Commerce Et L' Industrie Sa Morocco France Finance 182 1 300
Pinnacle Micro (Pty) Ltd South Africa Germany Finance 104 350
Pharaonic American Life Insurance Egypt United States Insurance 100 ..
Standard Chartered Bank Côte d'Ivoire Sa Cote dIvoire United Kingdom Finance 97 90
Barclays Bank of Botswana Botswana United Kingdom Finance 58 1 200
Union Internationale De Banques Sa Tunisia France Finance 54 1 461
Arab Tunisian Bank Sa Tunisia Jordan Finance 52 986
Bnp Paribas Le Caire Egypt France Holding 47 270
Source: UNCTAD, based on table 88 of country profiles. Note: Includes only foreign affiliates for which data on sales/assets are available.
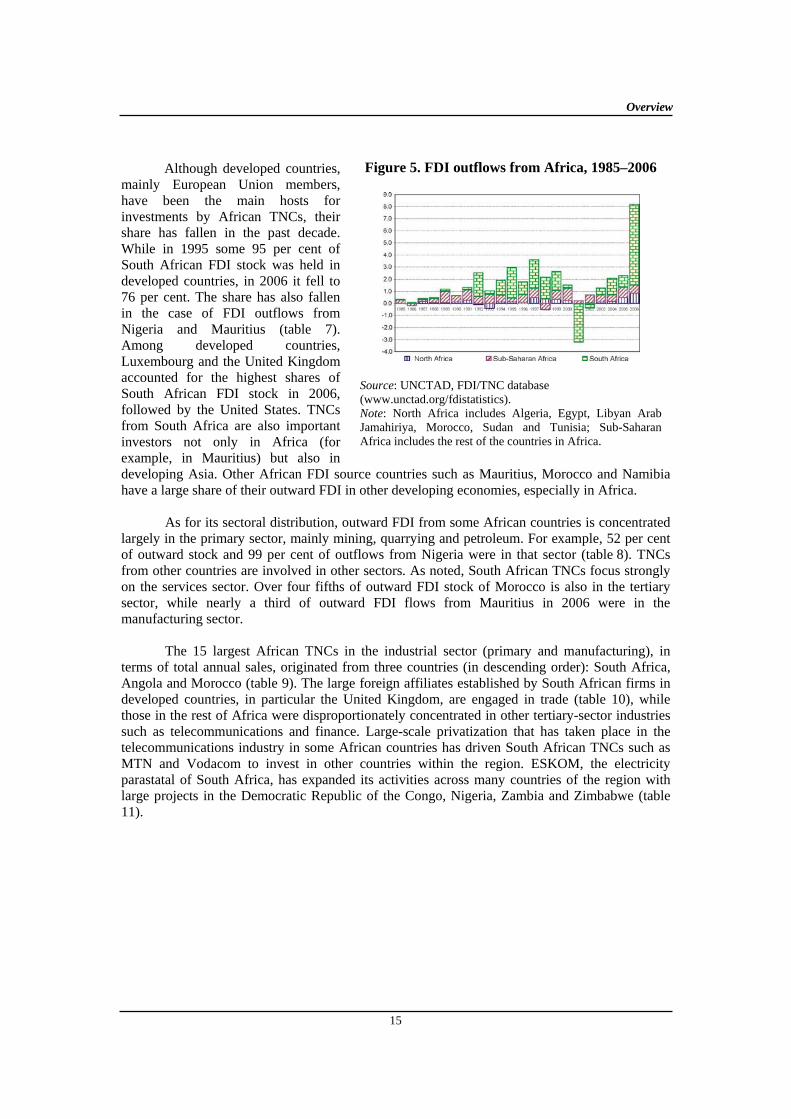
Overview
15
Although developed countries, mainly European Union members, have been the main hosts for investments by African TNCs, their share has fallen in the past decade. While in 1995 some 95 per cent of South African FDI stock was held in developed countries, in 2006 it fell to 76 per cent. The share has also fallen in the case of FDI outflows from Nigeria and Mauritius (table 7). Among developed countries, Luxembourg and the United Kingdom accounted for the highest shares of South African FDI stock in 2006, followed by the United States. TNCs from South Africa are also important investors not only in Africa (for example, in Mauritius) but also in developing Asia. Other African FDI source countries such as Mauritius, Morocco and Namibia have a large share of their outward FDI in other developing economies, especially in Africa.
As for its sectoral distribution, outward FDI from some African countries is concentrated largely in the primary sector, mainly mining, quarrying and petroleum. For example, 52 per cent of outward stock and 99 per cent of outflows from Nigeria were in that sector (table 8). TNCs from other countries are involved in other sectors. As noted, South African TNCs focus strongly on the services sector. Over four fifths of outward FDI stock of Morocco is also in the tertiary sector, while nearly a third of outward FDI flows from Mauritius in 2006 were in the manufacturing sector.
The 15 largest African TNCs in the industrial sector (primary and manufacturing), in terms of total annual sales, originated from three countries (in descending order): South Africa, Angola and Morocco (table 9). The large foreign affiliates established by South African firms in developed countries, in particular the United Kingdom, are engaged in trade (table 10), while those in the rest of Africa were disproportionately concentrated in other tertiary-sector industries such as telecommunications and finance. Large-scale privatization that has taken place in the telecommunications industry in some African countries has driven South African TNCs such as MTN and Vodacom to invest in other countries within the region. ESKOM, the electricity parastatal of South Africa, has expanded its activities across many countries of the region with large projects in the Democratic Republic of the Congo, Nigeria, Zambia and Zimbabwe (table 11).
Figure 5. FDI outflows from Africa, 1985–2006
Source: UNCTAD, FDI/TNC database (www.unctad.org/fdistatistics). Note: North Africa includes Algeria, Egypt, Libyan Arab Jamahiriya, Morocco, Sudan and Tunisia; Sub-Saharan Africa includes the rest of the countries in Africa.
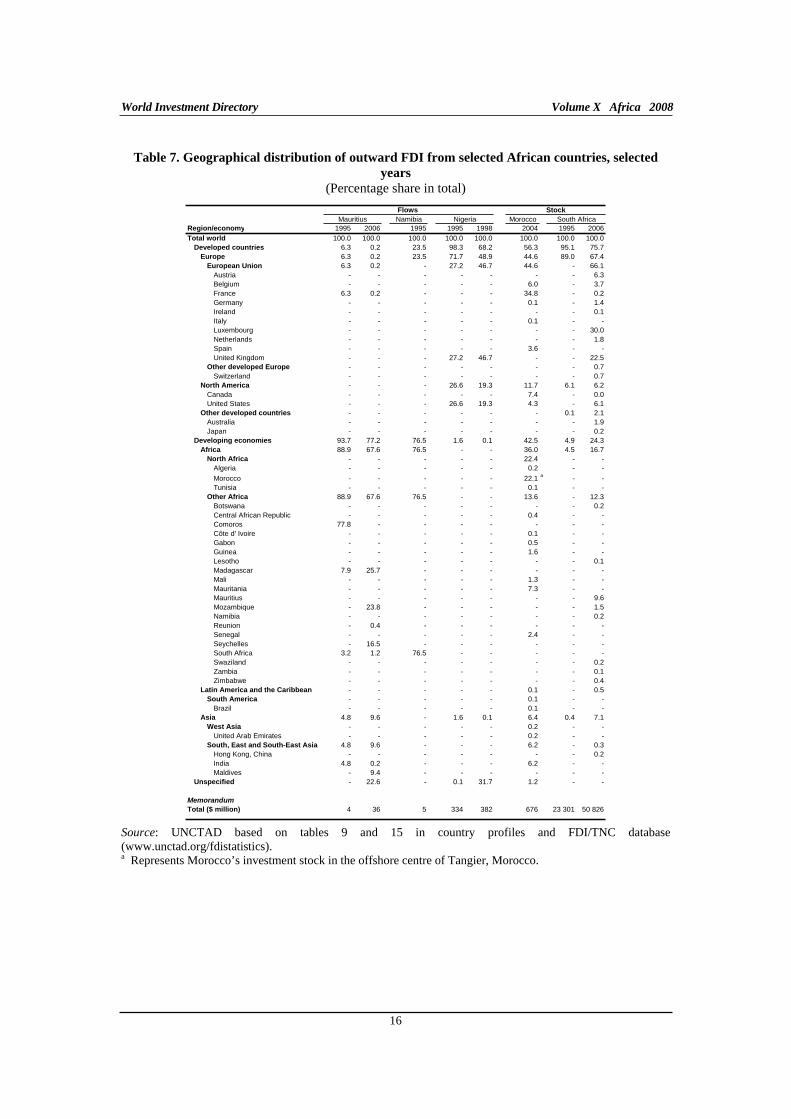
World Investment Directory Volume X Africa 2008
16
Table 7. Geographical distribution of outward FDI from selected African countries, selected
years
(Percentage share in total)
Flows Stock
Mauritius Namibia Nigeria Morocco South AfricaRegion/economy 1995 2006 1995 1995 1998 2004 1995 2006Total world 100.0 100.0 100.0 100.0 100.0 100.0 100.0 100.0
Developed countries 6.3 0.2 23.5 98.3 68.2 56.3 95.1 75.7Europe 6.3 0.2 23.5 71.7 48.9 44.6 89.0 67.4
European Union 6.3 0.2 - 27.2 46.7 44.6 - 66.1Austria - - - - - - - 6.3Belgium - - - - - 6.0 - 3.7France 6.3 0.2 - - - 34.8 - 0.2Germany - - - - - 0.1 - 1.4Ireland - - - - - - - 0.1Italy - - - - - 0.1 - -Luxembourg - - - - - - - 30.0Netherlands - - - - - - - 1.8Spain - - - - - 3.6 - -United Kingdom - - - 27.2 46.7 - - 22.5
Other developed Europe - - - - - - - 0.7Switzerland - - - - - - - 0.7
North America - - - 26.6 19.3 11.7 6.1 6.2Canada - - - - - 7.4 - 0.0United States - - - 26.6 19.3 4.3 - 6.1
Other developed countries - - - - - - 0.1 2.1Australia - - - - - - - 1.9Japan - - - - - - - 0.2
Developing economies 93.7 77.2 76.5 1.6 0.1 42.5 4.9 24.3Africa 88.9 67.6 76.5 - - 36.0 4.5 16.7
North Africa - - - - - 22.4 - -Algeria - - - - - 0.2 - -
Morocco - - - - - 22.1 a - -Tunisia - - - - - 0.1 - -
Other Africa 88.9 67.6 76.5 - - 13.6 - 12.3Botswana - - - - - - - 0.2Central African Republic - - - - - 0.4 - -Comoros 77.8 - - - - - - -Côte d' Ivoire - - - - - 0.1 - -Gabon - - - - - 0.5 - -Guinea - - - - - 1.6 - -Lesotho - - - - - - - 0.1Madagascar 7.9 25.7 - - - - - -Mali - - - - - 1.3 - -Mauritania - - - - - 7.3 - -Mauritius - - - - - - - 9.6Mozambique - 23.8 - - - - - 1.5Namibia - - - - - - - 0.2Reunion - 0.4 - - - - - -Senegal - - - - - 2.4 - -Seychelles - 16.5 - - - - - -South Africa 3.2 1.2 76.5 - - - - -Swaziland - - - - - - - 0.2Zambia - - - - - - - 0.1Zimbabwe - - - - - - - 0.4
Latin America and the Caribbean - - - - - 0.1 - 0.5South America - - - - - 0.1 - -
Brazil - - - - - 0.1 - -Asia 4.8 9.6 - 1.6 0.1 6.4 0.4 7.1
West Asia - - - - - 0.2 - -United Arab Emirates - - - - - 0.2 - -
South, East and South-East Asia 4.8 9.6 - - - 6.2 - 0.3Hong Kong, China - - - - - - - 0.2India 4.8 0.2 - - - 6.2 - -Maldives - 9.4 - - - - - -
Unspecified - 22.6 - 0.1 31.7 1.2 - -
Memorandum
Total ($ million) 4 36 5 334 382 676 23 301 50 826
Source: UNCTAD based on tables 9 and 15 in country profiles and FDI/TNC database (www.unctad.org/fdistatistics). a Represents Morocco’s investment stock in the offshore centre of Tangier, Morocco.
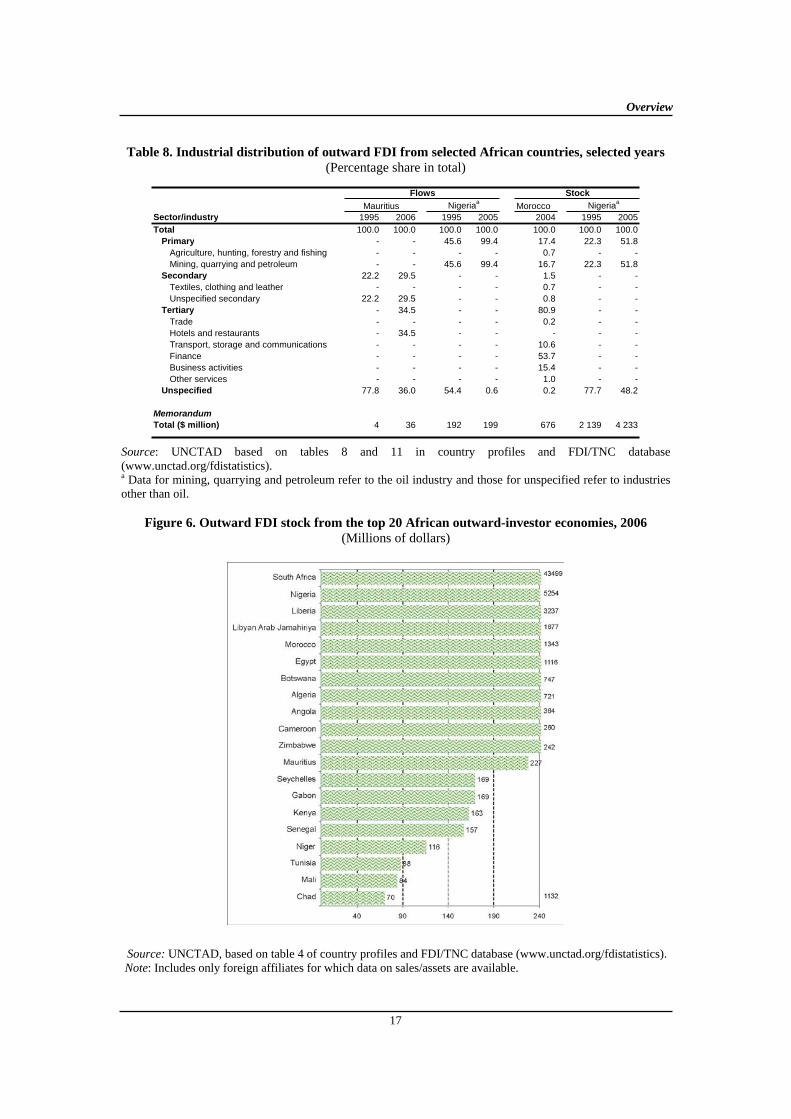
Overview
17
Table 8. Industrial distribution of outward FDI from selected African countries, selected years
(Percentage share in total)
Flows Stock
Mauritius NigeriaaMorocco Nigeriaa
Sector/industry 1995 2006 1995 2005 2004 1995 2005Total 100.0 100.0 100.0 100.0 100.0 100.0 100.0
Primary - - 45.6 99.4 17.4 22.3 51.8Agriculture, hunting, forestry and fishing - - - - 0.7 - -Mining, quarrying and petroleum - - 45.6 99.4 16.7 22.3 51.8
Secondary 22.2 29.5 - - 1.5 - -Textiles, clothing and leather - - - - 0.7 - -Unspecified secondary 22.2 29.5 - - 0.8 - -
Tertiary - 34.5 - - 80.9 - -Trade - - - - 0.2 - -Hotels and restaurants - 34.5 - - - - -Transport, storage and communications - - - - 10.6 - -Finance - - - - 53.7 - -Business activities - - - - 15.4 - -Other services - - - - 1.0 - -
Unspecified 77.8 36.0 54.4 0.6 0.2 77.7 48.2
Memorandum
Total ($ million) 4 36 192 199 676 2 139 4 233
Source: UNCTAD based on tables 8 and 11 in country profiles and FDI/TNC database (www.unctad.org/fdistatistics). a Data for mining, quarrying and petroleum refer to the oil industry and those for unspecified refer to industries other than oil.
Figure 6. Outward FDI stock from the top 20 African outward-investor economies, 2006
(Millions of dollars)
Source: UNCTAD, based on table 4 of country profiles and FDI/TNC database (www.unctad.org/fdistatistics). Note: Includes only foreign affiliates for which data on sales/assets are available.
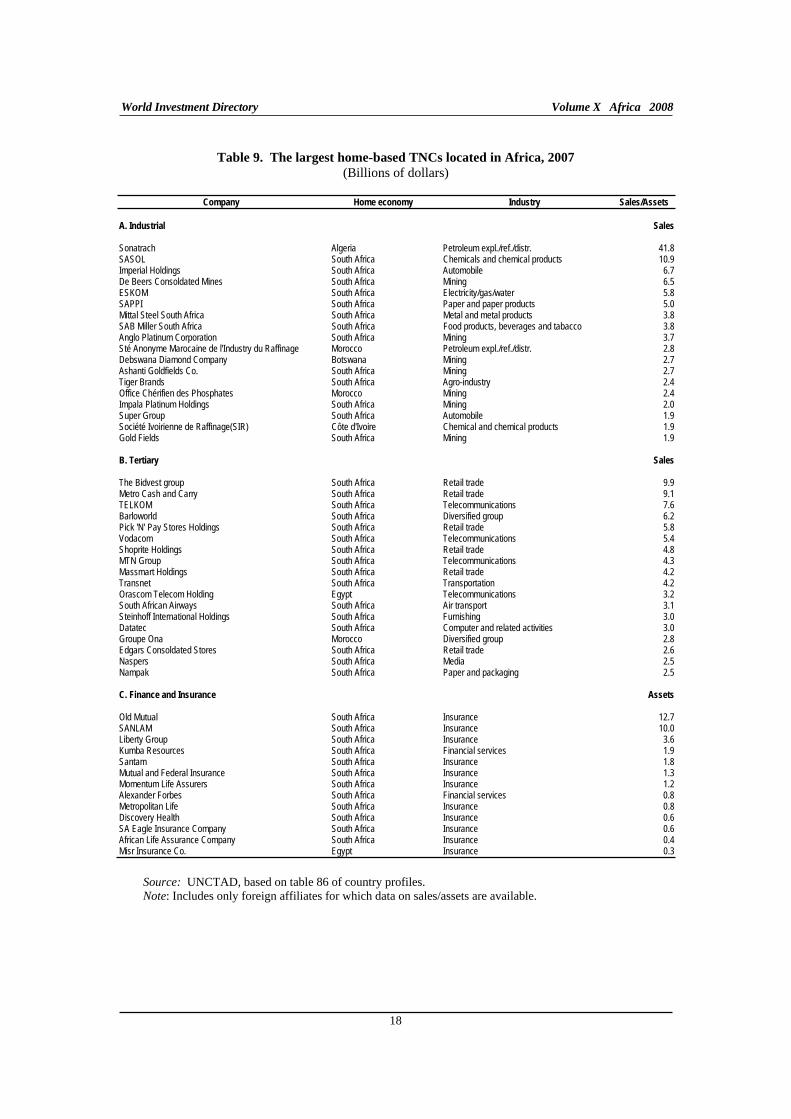
World Investment Directory Volume X Africa 2008
18
Table 9. The largest home-based TNCs located in Africa, 2007
(Billions of dollars)
Company Home economy Industry Sales/Assets
A. Industrial Sales
Sonatrach Algeria Petroleum expl./ref./distr. 41.8SASOL South Africa Chemicals and chemical products 10.9Imperial Holdings South Africa Automobile 6.7De Beers Consoldated Mines South Africa Mining 6.5ESKOM South Africa Electricity/gas/water 5.8SAPPI South Africa Paper and paper products 5.0Mittal Steel South Africa South Africa Metal and metal products 3.8SAB Miller South Africa South Africa Food products, beverages and tabacco 3.8Anglo Platinum Corporation South Africa Mining 3.7Sté Anonyme Marocaine de l'Industry du Raffinage Morocco Petroleum expl./ref./distr. 2.8Debswana Diamond Company Botswana Mining 2.7Ashanti Goldfields Co. South Africa Mining 2.7Tiger Brands South Africa Agro-industry 2.4Office Chérifien des Phosphates Morocco Mining 2.4Impala Platinum Holdings South Africa Mining 2.0Super Group South Africa Automobile 1.9Société Ivoirienne de Raffinage(SIR) Côte d'Ivoire Chemical and chemical products 1.9Gold Fields South Africa Mining 1.9
B. Tertiary Sales
The Bidvest group South Africa Retail trade 9.9Metro Cash and Carry South Africa Retail trade 9.1TELKOM South Africa Telecommunications 7.6Barloworld South Africa Diversified group 6.2Pick 'N' Pay Stores Holdings South Africa Retail trade 5.8Vodacom South Africa Telecommunications 5.4Shoprite Holdings South Africa Retail trade 4.8MTN Group South Africa Telecommunications 4.3Massmart Holdings South Africa Retail trade 4.2Transnet South Africa Transportation 4.2Orascom Telecom Holding Egypt Telecommunications 3.2South African Airways South Africa Air transport 3.1Steinhoff International Holdings South Africa Furnishing 3.0Datatec South Africa Computer and related activities 3.0Groupe Ona Morocco Diversified group 2.8Edgars Consoldated Stores South Africa Retail trade 2.6Naspers South Africa Media 2.5Nampak South Africa Paper and packaging 2.5
C. Finance and Insurance Assets
Old Mutual South Africa Insurance 12.7SANLAM South Africa Insurance 10.0Liberty Group South Africa Insurance 3.6Kumba Resources South Africa Financial services 1.9Santam South Africa Insurance 1.8Mutual and Federal Insurance South Africa Insurance 1.3Momentum Life Assurers South Africa Insurance 1.2Alexander Forbes South Africa Financial services 0.8Metropolitan Life South Africa Insurance 0.8Discovery Health South Africa Insurance 0.6SA Eagle Insurance Company South Africa Insurance 0.6African Life Assurance Company South Africa Insurance 0.4Misr Insurance Co. Egypt Insurance 0.3
Source: UNCTAD, based on table 86 of country profiles. Note: Includes only foreign affiliates for which data on sales/assets are available.
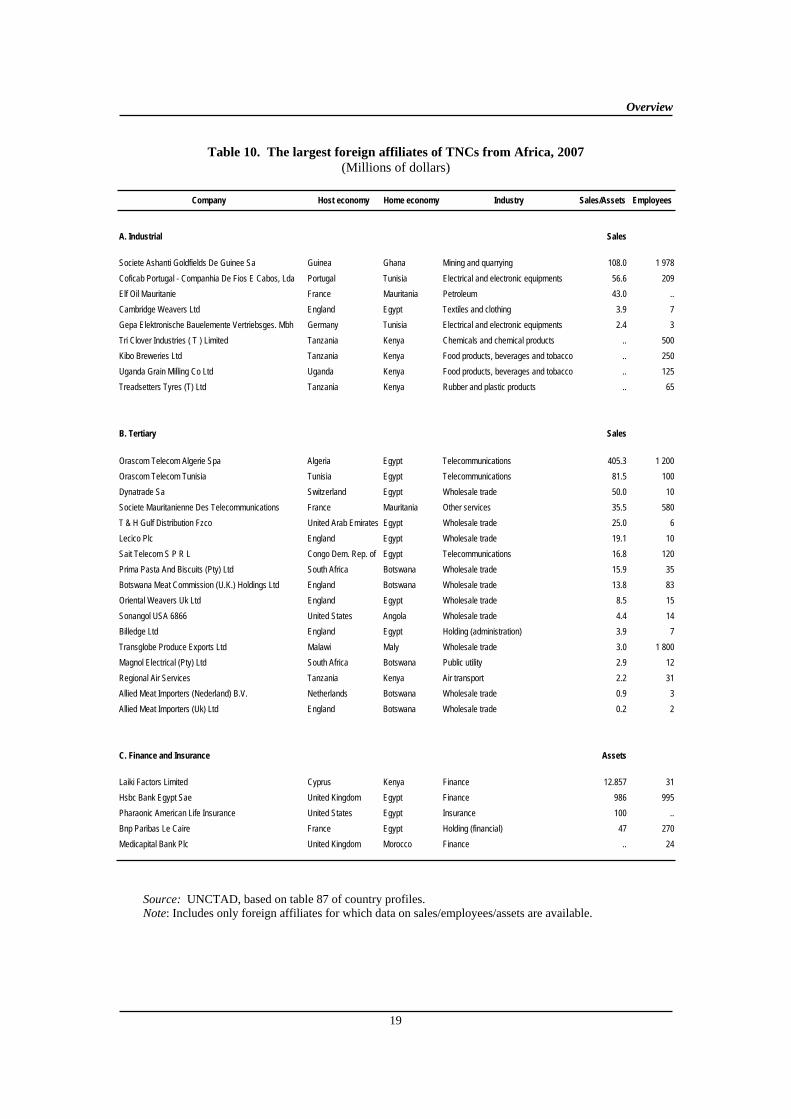
Overview
19
Table 10. The largest foreign affiliates of TNCs from Africa, 2007
(Millions of dollars)
Company Host economy Home economy Industry Sales/Assets Employees
A. Industrial Sales
Societe Ashanti Goldfields De Guinee Sa Guinea Ghana Mining and quarrying 108.0 1 978
Coficab Portugal - Companhia De Fios E Cabos, Lda Portugal Tunisia Electrical and electronic equipments 56.6 209
Elf Oil Mauritanie France Mauritania Petroleum 43.0 ..
Cambridge Weavers Ltd England Egypt Textiles and clothing 3.9 7
Gepa Elektronische Bauelemente Vertriebsges. Mbh Germany Tunisia Electrical and electronic equipments 2.4 3
Tri Clover Industries ( T ) Limited Tanzania Kenya Chemicals and chemical products .. 500
Kibo Breweries Ltd Tanzania Kenya Food products, beverages and tobacco .. 250
Uganda Grain Milling Co Ltd Uganda Kenya Food products, beverages and tobacco .. 125
Treadsetters Tyres (T) Ltd Tanzania Kenya Rubber and plastic products .. 65
B. Tertiary Sales
Orascom Telecom Algerie Spa Algeria Egypt Telecommunications 405.3 1 200
Orascom Telecom Tunisia Tunisia Egypt Telecommunications 81.5 100
Dynatrade Sa Switzerland Egypt Wholesale trade 50.0 10
Societe Mauritanienne Des Telecommunications France Mauritania Other services 35.5 580
T & H Gulf Distribution Fzco United Arab Emirates Egypt Wholesale trade 25.0 6
Lecico Plc England Egypt Wholesale trade 19.1 10
Sait Telecom S P R L Congo Dem. Rep. of Egypt Telecommunications 16.8 120
Prima Pasta And Biscuits (Pty) Ltd South Africa Botswana Wholesale trade 15.9 35
Botswana Meat Commission (U.K.) Holdings Ltd England Botswana Wholesale trade 13.8 83
Oriental Weavers Uk Ltd England Egypt Wholesale trade 8.5 15
Sonangol USA 6866 United States Angola Wholesale trade 4.4 14
Billedge Ltd England Egypt Holding (administration) 3.9 7
Transglobe Produce Exports Ltd Malawi Maly Wholesale trade 3.0 1 800
Magnol Electrical (Pty) Ltd South Africa Botswana Public utility 2.9 12
Regional Air Services Tanzania Kenya Air transport 2.2 31
Allied Meat Importers (Nederland) B.V. Netherlands Botswana Wholesale trade 0.9 3
Allied Meat Importers (Uk) Ltd England Botswana Wholesale trade 0.2 2
C. Finance and Insurance Assets
Laiki Factors Limited Cyprus Kenya Finance 12.857 31
Hsbc Bank Egypt Sae United Kingdom Egypt Finance 986 995
Pharaonic American Life Insurance United States Egypt Insurance 100 ..
Bnp Paribas Le Caire France Egypt Holding (financial) 47 270
Medicapital Bank Plc United Kingdom Morocco Finance .. 24
Source: UNCTAD, based on table 87 of country profiles. Note: Includes only foreign affiliates for which data on sales/employees/assets are available.
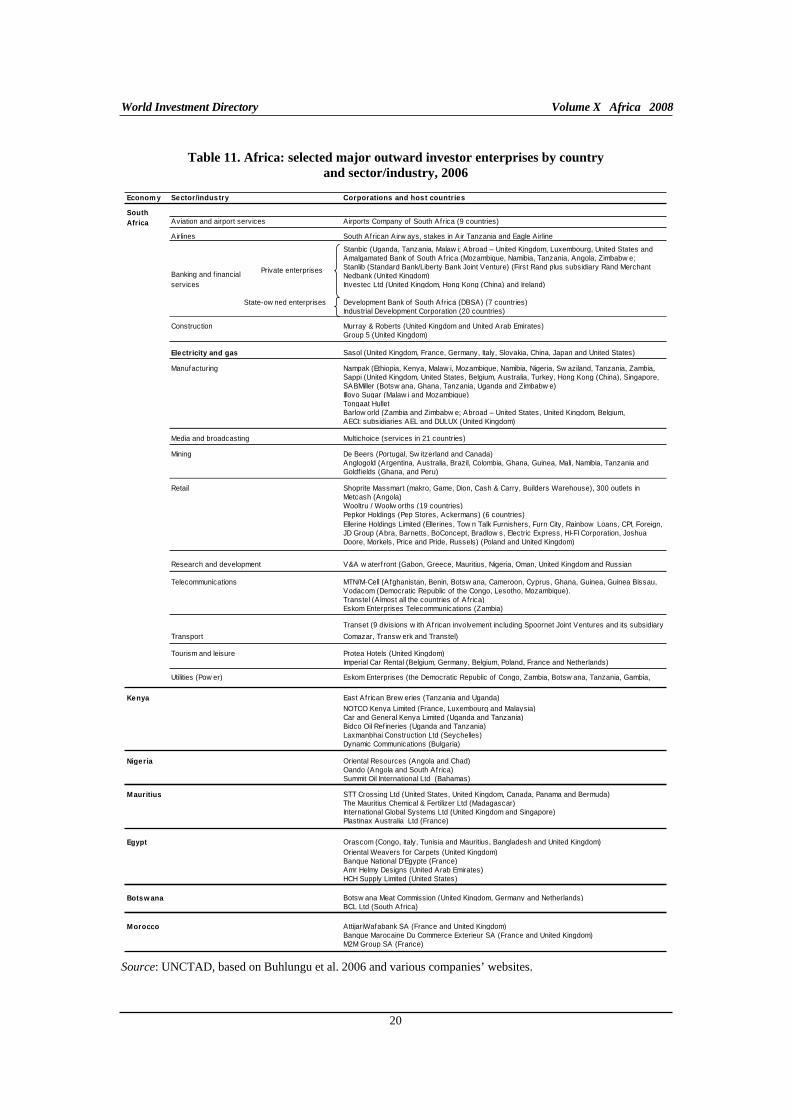
World Investment Directory Volume X Africa 2008
20
Table 11. Africa: selected major outward investor enterprises by country
and sector/industry, 2006
Econom y Corporations and host countries
Airports Company of South Africa (9 countries)
South African Airw ays, stakes in Air Tanzania and Eagle Airline
Stanbic (Uganda, Tanzania, Malaw i; Abroad – United Kingdom, Luxembourg, United States and Amalgamated Bank of South Africa (Mozambique, Namibia, Tanzania, Angola, Zimbabw e; Stanlib (Standard Bank/Liberty Bank Joint Venture) (First Rand plus subsidiary Rand Merchant Nedbank (United Kingdom)Investec Ltd (United Kingdom, Hong Kong (China) and Ireland)
Development Bank of South Africa (DBSA) (7 countries)Industrial Development Corporation (20 countries)
Murray & Roberts (United Kingdom and United Arab Emirates)Group 5 (United Kingdom)
Sasol (United Kingdom, France, Germany, Italy, Slovakia, China, Japan and United States)
Nampak (Ethiopia, Kenya, Malaw i, Mozambique, Namibia, Nigeria, Sw aziland, Tanzania, Zambia, Sappi (United Kingdom, United States, Belgium, Australia, Turkey, Hong Kong (China), Singapore, SABMiller (Botsw ana, Ghana, Tanzania, Uganda and Zimbabw e)Illovo Sugar (Malaw i and Mozambique)Tongaat HulletBarlow orld (Zambia and Zimbabw e; Abroad – United States, United Kingdom, Belgium, AECI: subsidiaries AEL and DULUX (United Kingdom)
Multichoice (services in 21 countries)
De Beers (Portugal, Sw itzerland and Canada)Anglogold (Argentina, Australia, Brazil, Colombia, Ghana, Guinea, Mali, Namibia, Tanzania and Goldf ields (Ghana, and Peru)
Shoprite Massmart (makro, Game, Dion, Cash & Carry, Builders Warehouse), 300 outlets in Metcash (Angola)Wooltru / Woolw orths (19 countries)Pepkor Holdings (Pep Stores, Ackermans) (6 countries)Ellerine Holdings Limited (Ellerines, Tow n Talk Furnishers, Furn City, Rainbow Loans, CPI, Foreign, JD Group (Abra, Barnetts, BoConcept, Bradlow s, Electric Express, HI-FI Corporation, Joshua Doore, Morkels, Price and Pride, Russels) (Poland and United Kingdom)
V&A w aterf ront (Gabon, Greece, Mauritius, Nigeria, Oman, United Kingdom and Russian
MTN/M-Cell (Afghanistan, Benin, Botsw ana, Cameroon, Cyprus, Ghana, Guinea, Guinea Bissau, Vodacom (Democratic Republic of the Congo, Lesotho, Mozambique).Transtel (Almost all the countries of Africa)Eskom Enterprises Telecommunications (Zambia)
Transet (9 divisions w ith Af rican involvement including Spoornet Joint Ventures and its subsidiary
Comazar, Transw erk and Transtel)
Protea Hotels (United Kingdom)Imperial Car Rental (Belgium, Germany, Belgium, Poland, France and Netherlands)
Eskom Enterprises (the Democratic Republic of Congo, Zambia, Botsw ana, Tanzania, Gambia,
Kenya East African Brew eries (Tanzania and Uganda)
NOTCO Kenya Limited (France, Luxembourg and Malaysia)Car and General Kenya Limited (Uganda and Tanzania)Bidco Oil Ref ineries (Uganda and Tanzania)Laxmanbhai Construction Ltd (Seychelles)Dynamic Communications (Bulgaria)
Nigeria Oriental Resources (Angola and Chad)Oando (Angola and South Africa)Summit Oil International Ltd (Bahamas)
Mauritius STT Crossing Ltd (United States, United Kingdom, Canada, Panama and Bermuda)The Mauritius Chemical & Fertilizer Ltd (Madagascar)International Global Systems Ltd (United Kingdom and Singapore)Plastinax Australia Ltd (France)
Egypt Orascom (Congo, Italy, Tunisia and Mauritius, Bangladesh and United Kingdom)Oriental Weavers for Carpets (United Kingdom)Banque National D'Egypte (France)Amr Helmy Designs (United Arab Emirates)HCH Supply Limited (United States)
Botsw ana Botsw ana Meat Commission (United Kingdom, Germany and Netherlands)BCL Ltd (South Africa)
Morocco AttijariWafabank SA (France and United Kingdom)Banque Marocaine Du Commerce Exterieur SA (France and United Kingdom)M2M Group SA (France)
Transport
Tourism and leisure
Utilities (Pow er)
Mining
Retail
Research and development
Telecommunications
Construction
Electricity and gas
Manufacturing
Media and broadcasting
Banking and f inancial services
State-ow ned enterprises
Private enterprises
Sector/industry
Aviation and airport services
Airlines
South
Africa
Source: UNCTAD, based on Buhlungu et al. 2006 and various companies’ websites.
Overview
21
B. Policy developments with respect to inward FDI
In the effort to realize their FDI potential, many African countries have adopted new FDI policy measures and modified existing ones at the national level, and entered into bilateral and other international investment arrangements. They have also engaged in market access initiatives and regional integration schemes: regional market size defined in terms of the consumer population and purchasing power has been growing, but as many individual economies in the region are small, market expansion through regional integration has been an option explored by many African countries right from the early years of independence.
Reforms of investment laws have mainly aimed at liberalizing TNC entry and operations and strengthening the protection of foreign investment. The number of national policy changes related to FDI observed by UNCTAD has risen annually in the region since the early 1990s. In 2006, for example, 57 changes were noted by UNCTAD, 49 of which made the investment environments more favourable to inward FDI.
Previously, common criteria for granting authorization under several investment codes – such as a minimum size of capital investment, assessment of the potential for value added, and job creation – have largely been removed. To establish new businesses, foreign investors typically have to go through the same administrative process as domestic investors. Many African countries have set up investment promotion agencies (IPAs) to promote inward investment, often with the purpose of providing a one-stop shop for companies to go through when investing in a country. At the same time, other policy changes and measures have been pursued with the aim of liberalizing international trade and domestic markets, reducing red tape for businesses, updating the financial systems, privatizing State-owned firms, and offering concessions to investors in extractive industries and various infrastructure industries. They have also strengthened their fiscal position by cutting the public wage bill, trimming subsidies, and widening and deepening the tax net.
However, despite widespread efforts at opening up to inward FDI, inflows have remained concentrated in a small number of countries. In some cases, large FDI inflows have been related to the privatization of formerly State-owned enterprises. Common remaining policy challenges to create an enabling environment for FDI, especially in sub-Saharan African countries, include the development of physical infrastructure, the strengthening of the institutional and policy framework, and the harnessing of human resources. Thus, at the end of 2006, the countries that received the bulk of Africa’s FDI were not countries with the most liberal policies but rather those with large natural resources, notably oil.
A large number of African countries have also sought to standardize entry and operating conditions for FDI with those of other countries and to reduce the risk of investing in their countries. In this context, many of them are now parties to international investment agreements and conventions, and associating with multilateral investment institutions. A common feature of such efforts has been the signing of bilateral investment treaties (BITs) and to a lesser extent, double taxation treaties (DTTs). The network of such agreements between African countries and other countries, both within and outside the region, has increased significantly in recent years. For example, at the end of 2007, all 53 African countries had signed at least one BIT. Moreover, as of the end of 2007, at least 50 African countries were members and one (Niger) fulfilled membership requirements of the Multilateral Investment Guarantee Agency (MIGA) of the World Bank Group (table 12).
World Investment Directory Volume X Africa 2008
22
1. Developments at the national level
Key changes in the national regulatory frameworks for FDI in the region have influenced a number of areas, including, the following.
Limitations on foreign ownership of companies. With the shift towards a more welcoming policy for FDI, many African countries have abolished the approval process and significantly scaled back the requirement of local participation, sometimes on a sector-by-sector basis. In several African countries, privatization programmes have created opportunities for domestic and foreign private firms to acquire State-owned entities through open bidding processes. Furthermore, foreign investors have generally been given improved rights to repatriate their profits.
Expropriation and compensation. Expropriation of private property for public purposes is largely viewed as a thing of the past in many African countries. However, in the extractive industries, some Governments are considering ways to secure a greater share of the revenues generated. To the extent expropriation occurs, African countries now do so according to established principles in international law in a process that is public and more transparent, and in many cases compensation is awarded by court decision.
Dispute settlement. Disputes occasionally arise between Governments and foreign companies. Some cases involve wrongdoing on the part of companies, and some involve problems with government officials and institutions. In many countries, investment codes allow a foreign company that has signed an agreement to refer to international arbitration any case that the local courts are unable to resolve.
Foreign exchange controls on investment-related capital and income flows. Restrictions on foreign exchange have not completely disappeared in many Africa countries as some have been taking a gradualist approach in abolishing the process, depending on the impact on their economies. Many have removed all controls on profit repatriation. Transactions are even more liberalized within the various subregional groupings – such as the Arab Maghreb Union, Common Market for the Eastern and Southern Africa, Economic Community for West African States, Southern Africa Development Community, Communauté Économique et Monétaire de L’Afrique Centrale and Union Economique et Monétaire Ouest Africaine – with the last two of these groupings each using a common central bank. Six countries – Cameroon, Central African Republic, Congo, Gabon, Equatorial Guinea and Chad – belong to the Banque des Etats de l’Afrique Centrale. The Banque Centrale des Etats de l’Afrique de l’Ouest serves as the Central Bank for Benin, Burkina Faso, Cote d’Ivoire, Guinea-Bissau, Mali, Niger, Senegal and Togo. There has also been progress in economic and monetary union in West Africa and Southern Africa, which makes it easy to carry out foreign exchange-related transactions within those groups.
Incentives. As part of their foreign investment promotion efforts, many African countries provide various incentives. Applicable incentives include, among others, exemption from customs duties for imported goods associated directly with the investment. Algeria, Angola, Botswana, Burkina Faso, Cote d’Ivoire, Kenya, Malawi, the United Republic of Tanzania, Sudan, Swaziland and Uganda are among the countries that offer TNCs some form of exemption from custom duties and taxes. Additional benefits are provided in many of the free zones. Some countries provide capital grants and tax credits. The trend towards reducing the tax burden on investors continued in 2006. For example, Egypt reduced its corporate tax to a standard rate of 20
Overview
23
per cent (from a basic rate of 40 per cent and 32 per cent for industrial and export activities). Similar steps were taken by Ghana, which reduced its corporate income tax from 28 per cent to 25 per cent.
Transparency. Several African Governments (18 countries8 as of 2007) had adopted transparent regulatory policies and effective laws to foster competition (UNCTAD 2007c) These codes are designed to meet the requirements of fair competition, ease bureaucratic procedures and facilitate the hiring and firing of employees. New investment codes shorten the application process to establish a business and favour investments that promote handicrafts, exports and labour-intensive businesses. Transparency plays a key role in successful management of revenues from natural resources activities. A number of African countries have strengthened their efforts to further revenue transparency. Consequently, of the 22 candidate countries that wish to support the Extractive Industries Transparency Initiative, 13 are African. Nigeria became the first country to adopt a law making revenue disclosure mandatory (UNCTAD 2007a).
Protection of property rights. Property rights are protected in the region. Many African countries have put in place a system of protection of property rights, as required by international treaties, including the World Trade Organization (WTO’s) Trade Related Intellectual Property Rights agreement. By the end of 2007, a total of 46 and 49 African countries were also parties to the Paris Convention for the Protection of Industrial Property and the World Intellectual Property Organization, respectively (table 12).
In 2006 alone, 40 African countries introduced 57 new measures affecting FDI, of which 49 encouraged inward FDI. A number of these changes were related to sectoral liberalization. The extent to which foreign companies are allowed to invest in an industry has a major influence on the potential for inward FDI. The level of restrictions on FDI varies considerably by country, especially in the services sector. While Uganda has among the fewest restrictions on FDI in services, Ethiopia is among countries at the other end of the spectrum (UNCTAD 2006). Nevertheless, the general trend is towards greater openness. In 2006, for example (UNCTAD 2007a):
Botswana, Burkina Faso, Burundi, Cape Verde, Ghana, Kenya and Namibia allowed FDI wholly or partially into their telecommunication industries; Congo, Egypt and Nigeria wholly or partially opened up their banking industries; Ethiopia approved foreign concessions to its railway company; Mauritius opened its legal professional services industry to FDI; and Swaziland opened up to FDI in insurance.
In some countries, however, Governments recently adopted policies that were less favourable to foreign investment. For example, in Algeria, Egypt, Equatorial Guinea and Zambia, the Governments raised various taxes or royalties that may affect foreign investment. Lesotho extended State monopoly over its fixed-line telephone services for a further 12 months. Swaziland closed its retail sector to foreign investors, and Zimbabwe prohibited money transfer operations by foreign or domestic agencies and main banking institutions. In the Libyan Arab Jamahiriya, new measures were adopted requiring foreign investors to give priority in employment to Libyan nationals in the manufacturing and agricultural sectors and to construction, electricity, transport and communications in the services sector, as well as to provide training to locals, and ensure equal payments between Libyan and foreign staff (UNCTAD 2007a: 38–39).
Higher commodity prices have made many African Governments anxious to reap a fair share of the increased mineral revenues created from the commodity boom. In response, some of
8 Algeria, Benin, Burkina Faso, Cameroon, Central African Republic, Egypt, Cote d’Ivoire, Gabon, Kenya, Malawi, Mali, Morocco, Namibia, Senegal, South Africa, Tunisia, Zambia and Zimbabwe.
World Investment Directory Volume X Africa 2008
24
them have recently made their regulatory frameworks governing TNC participation more stringent. For example (UNCTAD 2007a):
Algeria ended majority foreign ownership in its oil and gas industries and promulgated regulations imposing a windfall tax on production values at prices exceeding $30/barrel of oil in December 2006. The Democratic Republic of the Congo is reviewing 60 mining contracts that were signed over the past decade and that may result in contract renegotiations.South Africa was revising its mining legislation in June 2007, with a view to increasing its revenues and development benefits from mining. In Zambia, the annual budget announced in February 2007 increased mining royalties and tax rates, and curtailed the provision of tax holidays.
In general, however, the policy environment for FDI in Africa has been shifting steadily towards one that encourages and facilitates inward investment and TNC operations. In addition to efforts at the national level, African countries have enlisted bilateral, regional and other international measures to improve their investment environment. There is growing recognition in the region of the importance of clear and transparent rules and regulations for FDI entry and operations, and of the just treatment of the assets and business dealings of foreign investors in the context of national efforts to mobilize FDI towards their respective development goals. At the same time, there is still a need for further domestic reform, stronger governance and improvements in infrastructure to create a more enabling environment for inward FDI.
2. Developments at the international level
A major element in the efforts of African countries to improve the investment climate, promote openness and attract FDI is the initiation and signing of BITs and DTTs. Generally, BITs promote foreign investment by protecting foreign investors against certain political risks in the host country. For this purpose, foreign investors are granted specific rights, including, for instance, non-discriminatory treatment, compensation in case of expropriation, a capital transfer guarantee and access to international arbitration in case of an investment dispute. All of the 53 African countries have concluded these treaties, though with more concentration on BITs than DTTs (figure 7).
By December 2006, over 1,120 such treaties had been signed by African countries: 687 BITs and 438 DTTs. There are, however, large disparities across African countries on the number of treaties concluded. Egypt, for instance, signed 100 BITs and about 50 DTTs. Other countries at the top of the list in this respect include Algeria, Mauritius, Morocco, South Africa and Tunisia. Conversely, some countries (Angola, Burundi, Djibouti, Equatorial Guinea, Guinea-Bissau, Sao Tome and Principe and Somalia) have signed no DTTs and very few BITs. As to other regions, the correlation between signing BITs and DTTs and attracting FDI inflows is not obvious, and the legal security, stability, predictability and transparency that the signing of these treaties entails is but one of the many determinants of FDI flows. Some African countries that have signed a relatively high number of such treaties are also major FDI recipients in the region (e.g. Egypt, Morocco, Tunisia and South Africa). Other African countries that have not been active in signing BITs and DTTs have nonetheless attracted larger FDI inflows than those that have signed multiple treaties. Over 70 per cent of BITs and DTTs concluded by African countries were signed with developed countries, with European countries – mainly the United Kingdom, France, Germany and Italy – having the greatest share. However, hitherto uncommon interregional BITs and DTTs with other developing countries outside the region appear to be gaining prominence in the region.
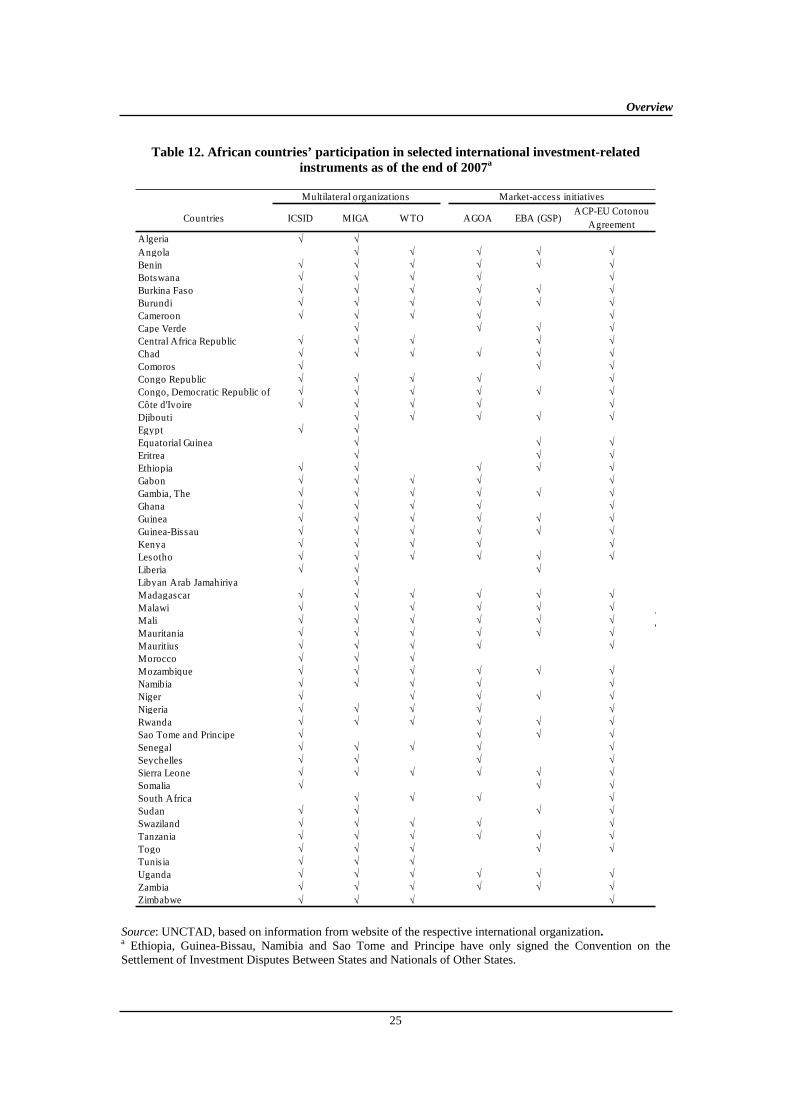
Overview
25
Table 12. African countries’ participation in selected international investment-related
instruments as of the end of 2007a
Countries ICSID MIGA WTO AGOA EBA (GSP)ACP-EU Cotonou
AgreementAlgeriaAngolaBeninBotswanaBurkina FasoBurundiCameroonCape VerdeCentral Africa RepublicChadComorosCongo RepublicCongo, Democratic Republic ofCôte d'IvoireDjiboutiEgyptEquatorial GuineaEritreaEthiopiaGabonGambia, TheGhanaGuineaGuinea-BissauKenyaLesothoLiberiaLibyan Arab JamahiriyaMadagascarMalawiMaliMauritaniaMauritiusMoroccoMozambiqueNamibiaNigerNigeriaRwandaSao Tome and PrincipeSenegalSeychellesSierra LeoneSomaliaSouth AfricaSudanSwazilandTanzaniaTogoTunis iaUgandaZambiaZimbabwe
Multilateral organizations Market-access initiatives
Source: UNCTAD, based on information from website of the respective international organization.a Ethiopia, Guinea-Bissau, Namibia and Sao Tome and Principe have only signed the Convention on the Settlement of Investment Disputes Between States and Nationals of Other States.
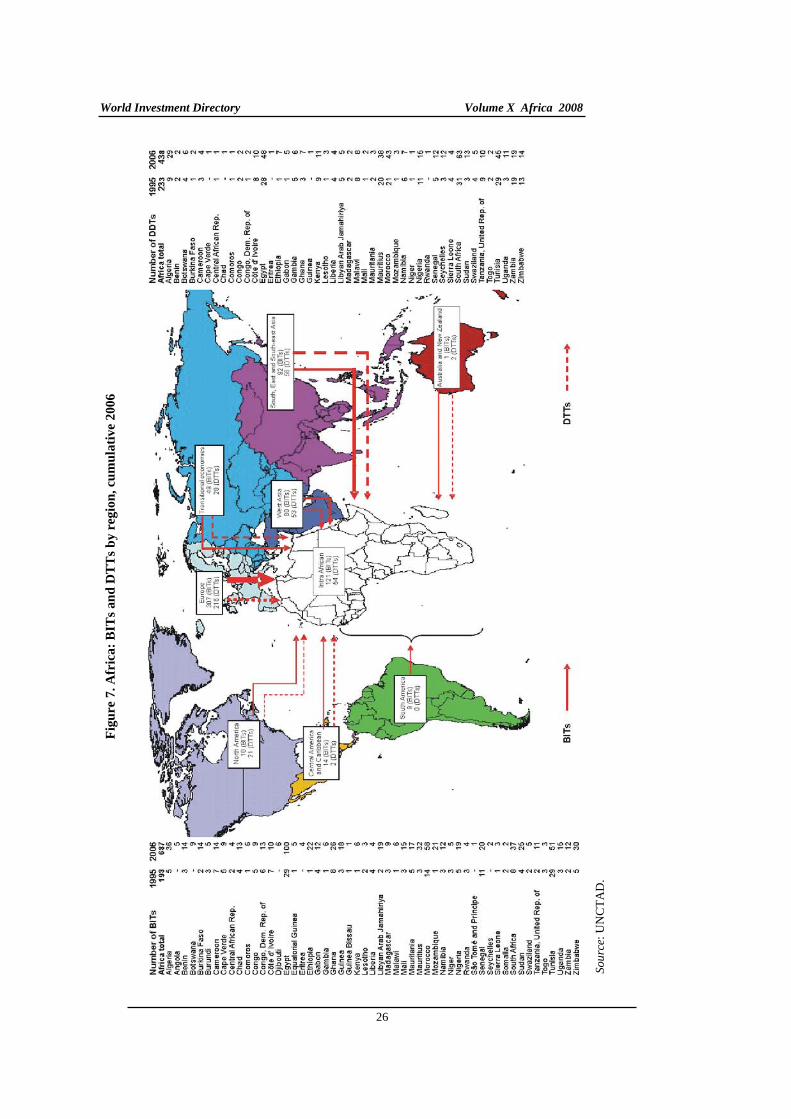
Fig
ure
7.
Afr
ica
: B
ITs
an
d D
TT
s b
y r
egio
n,
cum
ula
tiv
e 2
00
6
Sou
rce:
UN
CT
AD
.
World Investment Directory Volume X Africa 2008
26
Overview
27
In addition to their bilateral treaty programmes, African countries are members in multilateral instruments and related organizations that have provisions for the treatment of foreign investors. The most important of those and the number of African countries that are members in them are: International Centre for Settlement of Investment Disputes (ICSID, 46); Multilateral Investment Guarantee Agency (MIGA, 50), and the World Trade Organization (WTO, 44) (table 12). ICSID provides facilities for conciliation and arbitration of international investment disputes, while MIGA provides political risk insurance, technical assistance and dispute mediation facilities in developing countries. WTO includes a number of agreements that are directly relevant to FDI, namely the General Agreement on Trade in Services (GATS) that covers, among others, the international delivery of services through the cross-border establishment of production facilities (mode three), the Agreement on Trade-Related Investment Measures (TRIMS) that prohibits a number of trade-in-goods-related performance requirements, and the Agreement on Trade-Related Aspects of Intellectual Property Rights (TRIPs) that deals with intellectual property as one potential form of an investment.
Two other important multilateral conventions that have received reasonably wide acceptance in the region are the New York Convention on the Recognition and Enforcement of Foreign Arbitral Awards and the Paris Convention for the Protection of Industrial Property. Adoption of these conventions has further improved the FDI climate in Africa by setting the rules for the treatment of foreign investment and protecting patents and other intellectual property rights in the region. As of February 2008, 49 and 30 African countries have ratified the Paris and New York Conventions, respectively.
At the regional level, there are a number of economic integration schemes among African countries to enhance economic cooperation and increase market size. They include the Economic Community of West African States (ECOWAS), the Common Market for Eastern and Southern Africa (COMESA), the Southern African Development Community (SADC), the East African Community (EAC), the Arab Maghreb Union (AMU), the Community of Sahel-Saharan States (CEN-SAD), and the Economic Community of Central African States (ECCAS), among others, to which different African countries belong. Starting from the 1980s, countries began to harmonize such integration arrangements into unified organizational arrangements such as the African Economic Community (AEC), New Partnership for Africa’s development (NEPAD), and the African Union. Some of the schemes, such as ECCAS and AEC, contain investment-related provisions (UNCTAD 1996 and 2000), and all of them have implications for inward FDI because of their potential impact on market size for the region’s economies.
A number of countries in the region are also participants in key market access initiatives by developed countries, especially the European Union and the United States, for developing countries in general or specifically for Africa, with implications for the latter’s inward FDI. At the end of 2007, 48 African countries were members of the African, Caribbean and Pacific Cotonou Partnership Agreement with the EU (ACP-EU Cotonou),9 39 African countries were eligible for the generalized system of preferences (GSP) under the United States’ African Growth and Opportunities Act and 33 countries eligible for the GSP under the European Union’s “Everything but Arms (EBA)” initiative. Participation in these schemes has widely increased the items that can be exported duty-free and quota-free by domestic as well as foreign enterprises in the eligible African countries, creating a potential for increased FDI in those industries. However, the utilization of the GSP schemes, particularly African Growth and Opportunity Act (AGOA) and EBA, has been very low in African countries thus far, due to lack of productive capacity. In recent years, foreign affiliates in African countries such as Kenya, Lesotho, Mauritius and
9 Cotonou Agreements will be mandatorily replaced with Economic Partnership Agreements.
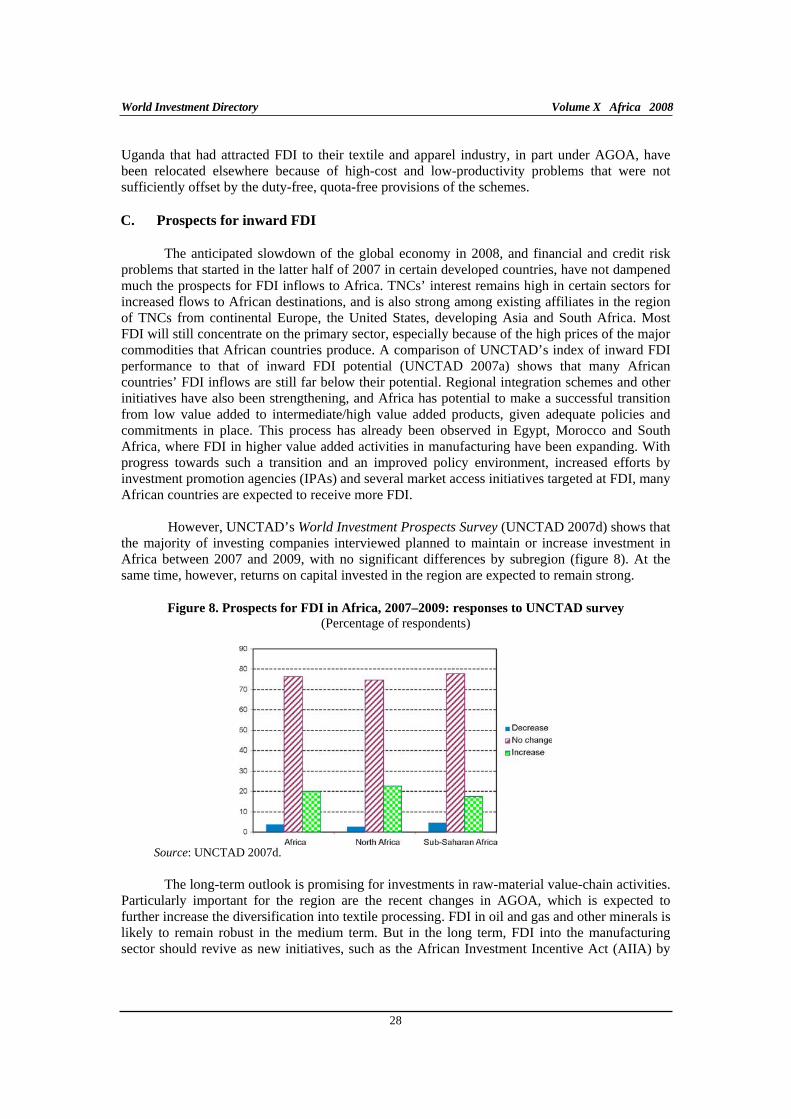
World Investment Directory Volume X Africa 2008
28
Uganda that had attracted FDI to their textile and apparel industry, in part under AGOA, have been relocated elsewhere because of high-cost and low-productivity problems that were not sufficiently offset by the duty-free, quota-free provisions of the schemes.
C. Prospects for inward FDI
The anticipated slowdown of the global economy in 2008, and financial and credit risk problems that started in the latter half of 2007 in certain developed countries, have not dampened much the prospects for FDI inflows to Africa. TNCs’ interest remains high in certain sectors for increased flows to African destinations, and is also strong among existing affiliates in the region of TNCs from continental Europe, the United States, developing Asia and South Africa. Most FDI will still concentrate on the primary sector, especially because of the high prices of the major commodities that African countries produce. A comparison of UNCTAD’s index of inward FDI performance to that of inward FDI potential (UNCTAD 2007a) shows that many African countries’ FDI inflows are still far below their potential. Regional integration schemes and other initiatives have also been strengthening, and Africa has potential to make a successful transition from low value added to intermediate/high value added products, given adequate policies and commitments in place. This process has already been observed in Egypt, Morocco and South Africa, where FDI in higher value added activities in manufacturing have been expanding. With progress towards such a transition and an improved policy environment, increased efforts by investment promotion agencies (IPAs) and several market access initiatives targeted at FDI, many African countries are expected to receive more FDI.
However, UNCTAD’s World Investment Prospects Survey (UNCTAD 2007d) shows that the majority of investing companies interviewed planned to maintain or increase investment in Africa between 2007 and 2009, with no significant differences by subregion (figure 8). At the same time, however, returns on capital invested in the region are expected to remain strong.
Figure 8. Prospects for FDI in Africa, 2007–2009: responses to UNCTAD survey
(Percentage of respondents)
Source: UNCTAD 2007d.
The long-term outlook is promising for investments in raw-material value-chain activities. Particularly important for the region are the recent changes in AGOA, which is expected to further increase the diversification into textile processing. FDI in oil and gas and other minerals is likely to remain robust in the medium term. But in the long term, FDI into the manufacturing sector should revive as new initiatives, such as the African Investment Incentive Act (AIIA) by
Overview
29
the United States Government under the AGOA initiative, are implemented,10 contributing to the region’s attractiveness to FDI. The NEPAD initiative in infrastructure is expected to lead to large foreign investment in infrastructure under the regional integration scheme. Africa could also increase its share of global FDI through promoting investments for manufacturing of basic and intermediate goods and industrial inputs for the regional markets, which suffered a decline over the past decades, but which could be revived with better targeted policies. The wide-ranging changes in FDI-related regulatory frameworks in the region could also contribute to the rise in inflows in the future.
10 Under AGOA, Africa-based clothing exporters were able to import fabric from the cheapest available suppliers while still enjoying duty-free access to the United States market. This concession expired in 2007, and some of the foreign-owned clothing firms in eligible African countries might well have decided to relocate elsewhere with that expiry. However, in December 2006, the United States Congress passed AIIA under the AGOA to help avert the diversion of FDI and the loss of thousands of jobs in the region. The new act supplements and extends the provisions of AGOA to help producers in sub-Saharan Africa compete in the United States market and better withstand greater competitive pressures from China following the expiry of MFA in 2005.
World Investment Directory Volume X Africa 2008
30
References
Buhlungu S, Daniel J, Southall R and Lutchman J (2006). State of the Nation: South Africa, 2005–
2006. (Cape Town: HSRO Press).
UNCTAD (1996). International Investment Instruments: A Compendium, Volume III, Regional
Integration, Bilateral and Non-governmental Instruments. (New York and Geneva: United Nations). United Nations publication, sales No. E.96.II.A.11.
UNCTAD (2000). International Investment Agreements: A Compendium, Volume IV, Multilateral and Regional Instruments (New York and Geneva: United Nations). United Nations publication, SALES No. E.00.II.D.13.
UNCTAD (2006). Measuring Restrictions on FDI in Services in Developing Countries and Transition
Economies. (New York and Geneva: United Nations). United Nations publication, sales No. E.06.II.D.13.
UNCTAD (2007a). World Investment Report 2007: Transnational Corporations, Extractive
Industries and Development. (New York and Geneva: United Nations). United Nations publication, sales No.E.07.II.D.9.
UNCTAD (2007b). Asian Foreign Direct Investment in Africa: Towards a New Era of Cooperation
among Developing Countries. (New York and Geneva: United Nations). United Nations publication, sales No. E.07.II.D.1.
UNCTAD (2007c). Model Law on Competition. UNCTAD Series on Competition Law and Policy. (New York and Geneva: United Nations). United Nations publication. Sales No. E.07.II.D.7.
UNCTAD (2007d). World Investment Prospects Survey 2007–2009. (New York and Geneva: United Nations). United Nations publication, UNCTAD/ITE/IIA/2007/4.
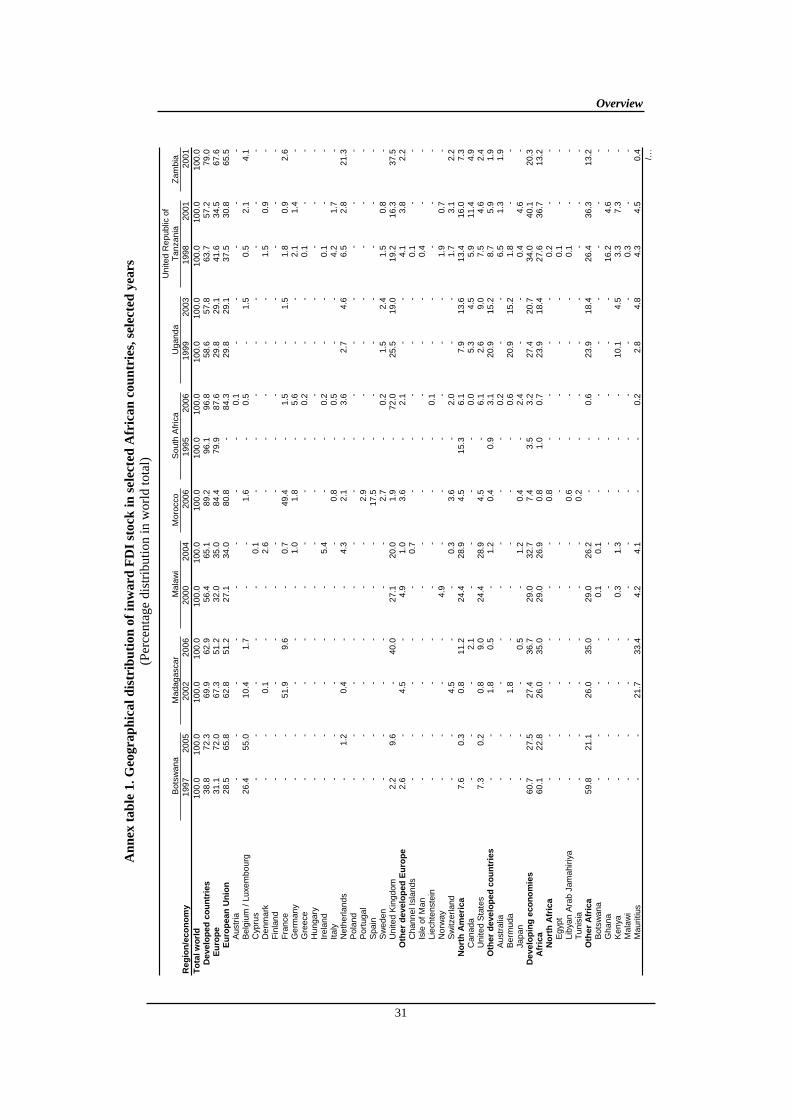
An
nex
ta
ble
1.
Geo
gra
ph
ica
l d
istr
ibu
tio
n o
f in
ward
FD
I st
ock
in
sel
ecte
d A
fric
an
cou
ntr
ies,
sel
ecte
d y
ears
(Per
cent
age
dist
ribu
tion
in w
orld
tota
l)
B
otsw
ana
M
adag
asca
r
Mal
aw
i
Mor
occo
Sou
th A
fric
a
U
gand
a
Uni
ted
Rep
ublic
of
Tan
zani
a
Z
ambi
a R
eg
ion
/eco
no
my
1997
20
05
200
220
06
200
020
04
2006
19
95
2006
19
9920
03
1998
2001
20
01T
ota
l w
orl
d
10
0.0
100
.0
10
0.0
10
0.0
100.
0
100.
0
1
00.0
100
.0
10
0.0
100.
0
100.
0
1
00.0
10
0.0
100.
0D
evelo
ped
co
un
trie
s
38
.8
72
.3
69
.9
62.9
56.4
65
.1
89
.2
96
.1
96
.8
58
.6
57.8
63.7
57
.2
79
.0E
uro
pe
31
.1
72
.0
67
.3
51.2
32.0
35
.0
84
.4
79
.9
87
.6
29
.8
29.1
41.6
34
.5
67
.6E
uro
pean
Un
ion
28
.5
65
.8
62
.8
51.2
27.1
34
.0
80
.8
-
84.3
29.8
29
.1
37
.5
30.8
65.5
Aus
tria
-
-
--
-
-
-
-
0.1
-
-
--
-
Bel
gium
/ Lu
xem
bou
rg
26
.4
55
.0
10
.4
1.7
-
-
1.
6
-
0.5
-
1.
5
0.
5
2.1
4.1
Cyp
rus
- -
-
-
-
0.1
-
-
-
--
-
-
-D
enm
ark
-
-
0.
1-
-
2.
6
-
- -
-
-
1.
5
0.9
-
Fin
land
-
-
--
-
-
-
- -
-
-
--
-
Fra
nce
-
-
51
.9
9.6
-
0.
7
49
.4
-
1.5
-
1.
5
1.
8
0.9
2.6
Ge
rman
y -
-
--
-
1.
0
1.
8
-
5.6
-
-
2.
1
1.4
-
Gre
ece
- -
-
-
--
-
-
0.
2
--
0.1
-
-H
unga
ry
- -
-
-
--
-
-
-
--
-
-
-Ir
elan
d -
-
--
-
5.
4
-
-
0.2
-
-
0.
1-
-
Ital
y -
-
--
-
-
0.
8
-
0.5
-
-
4.
2
1.7
-
Net
herl
ands
-
1.
2
0.
4-
-
4.
3
2.
1
-
3.6
2.7
4.
6
6.
5
2.8
21.3
Pol
and
- -
-
-
--
-
-
-
--
-
-
-P
ortu
gal
- -
-
-
--
2.9
-
-
--
-
-
-S
pain
-
-
--
-
-
17
.5
- -
-
-
--
-
Sw
eden
-
-
--
-
-
2.
7
-
0.2
1.5
2.
4
1.
5
0.8
-
Uni
ted
Kin
gdom
2.2
9.6
-
40
.0
27
.1
20.0
1.9
-
72
.0
25
.5
19.0
19.2
16
.3
37
.5O
ther
deve
lop
ed
Eu
rop
e
2.
6
-
4.
5-
4.9
1.
0
3.
6
-
2.1
-
-
4.
1
3.8
2.2
Cha
nne
l Isl
ands
-
-
--
-
0.
7
-
- -
-
-
0.
1-
-
Isle
of
Man
-
-
--
-
-
-
- -
-
-
0.
4-
-
Lie
chte
nste
in
- -
-
-
--
-
-
0.
1
--
-
-
-N
orw
ay
- -
-
-
4.
9-
-
-
-
--
1.9
0.
7
-S
witz
erl
and
- -
4.5
-
-
0.3
3.6
-
2.
0
--
1.7
3.
1
2.
2N
ort
h A
meri
ca
7.
6
0.
3
0.
8
11.2
24.4
28
.9
4.
5
15
.3
6.
1
7.
9
13.6
13.4
16
.0
7.
3C
anad
a
- -
-
2.
1
--
-
-
0.
0
5.
3
4.5
5.9
11
.4
4.
9U
nite
d S
tate
s
7.3
0.2
0.8
9.
0
24
.4
28.9
4.5
-
6.
1
2.
6
9.0
7.5
4.
6
2.
4O
ther
deve
lop
ed
co
un
trie
s
- -
1.8
0.
5
-
1.2
0.4
0.9
3.
1
20
.9
15.2
8.7
5.
9
1.
9A
ustr
alia
-
-
--
-
-
-
-
0.2
-
-
6.
5
1.3
1.9
Ber
mud
a -
-
1.
8-
-
-
-
-
0.6
20.9
15
.2
1.
8-
-
Jap
an
- -
-
0.
5
-
1.2
0.4
-
2.
4
--
0.4
4.
6
-D
evelo
pin
g e
co
no
mie
s
60
.7
27
.5
27
.4
36.7
29.0
32
.7
7.
4
3.
5
3.2
27.4
20
.7
34
.0
40.1
20.3
Afr
ica
60
.1
22
.8
26
.0
35.0
29.0
26
.9
0.
8
1.
0
0.7
23.9
18
.4
27
.6
36.7
13.2
No
rth
Afr
ica
- -
-
-
--
0.8
-
-
--
0.2
-
-E
gyp
t -
-
--
-
-
-
- -
-
-
0.
1-
-
Lib
yan
Ara
b Ja
mah
iriy
a -
-
--
-
-
0.
6
- -
-
-
0.
1-
-
Tun
isia
-
-
--
-
-
0.
2
- -
-
-
--
-
Oth
er
Afr
ica
59.8
21.1
26.0
35
.0
29
.0
26.2
-
-
0.
6
23
.9
18.4
26.4
36
.3
13
.2B
otsw
ana
-
-
--
0.1
0.
1
-
- -
-
-
--
-
Gh
ana
- -
-
-
--
-
-
-
--
16.2
4.
6
-K
enya
-
-
--
0.3
1.
3
-
- -
10.1
4.
5
3.
3
7.3
-
Mal
aw
i -
-
--
-
-
-
- -
-
-
0.
3-
-
Mau
ritiu
s -
-
21
.7
33.4
4.2
4.
1
-
-
0.2
2.8
4.
8
4.
3
4.5
0.4
/…
Overview
31
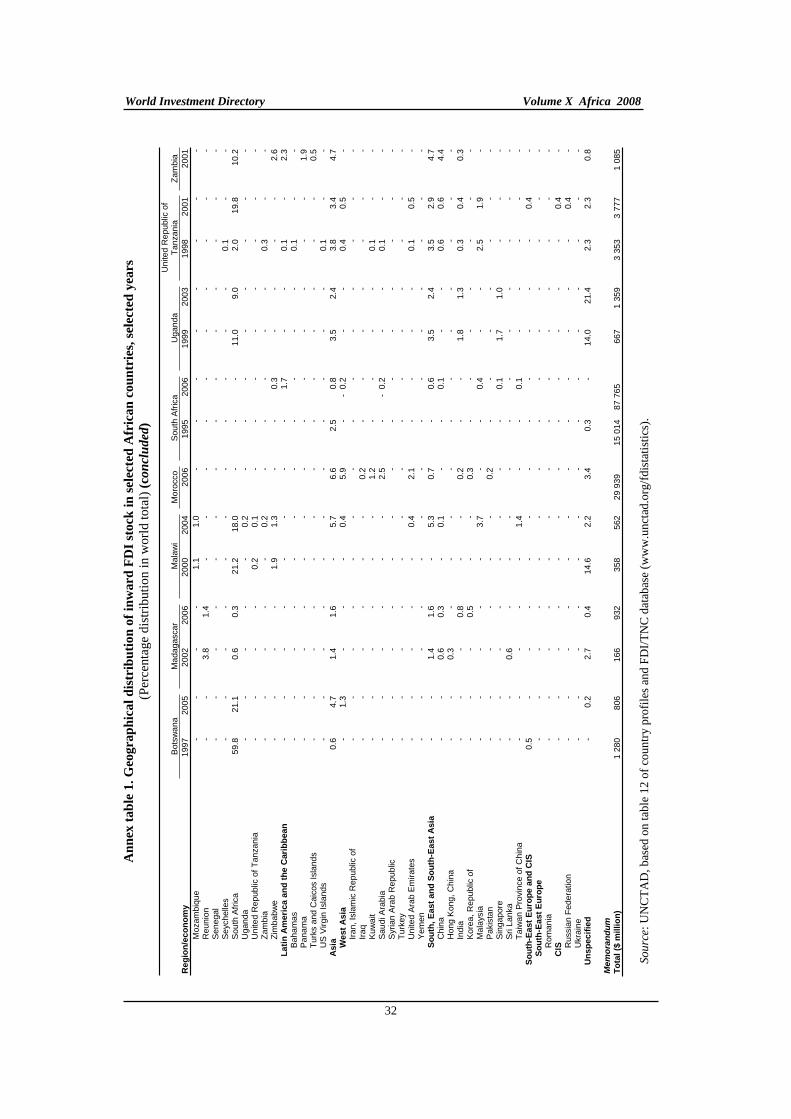
An
nex
ta
ble
1.
Geo
gra
ph
ica
l d
istr
ibu
tio
n o
f in
ward
FD
I st
ock
in
sel
ecte
d A
fric
an
cou
ntr
ies,
sel
ecte
d y
ears
(Per
cent
age
dist
ribu
tion
in w
orld
tota
l) (
con
clu
ded)
B
otsw
ana
Ma
daga
scar
Mal
aw
i
Mor
occ
o
Sou
th A
fric
a
Uga
nda
Uni
ted
Rep
ublic
of
Tan
zani
a
Zam
bia
Re
gio
n/e
co
no
my
1997
2005
20
0220
06
2000
2004
20
06
19
9520
06
1999
2003
19
982
001
20
01M
ozam
biqu
e -
--
-
1.1
1.
0-
-
--
--
--
Reu
nion
-
-
3.8
1.
4-
--
-
--
--
--
Sen
egal
-
--
--
--
-
--
--
--
Se
yche
lles
--
--
--
-
--
--
0.
1-
-S
outh
Afr
ica
59
.8
21.1
0.
6
0.3
21
.2
18.0
-
--
11
.0
9.0
2.
0
19.8
10
.2U
gand
a
--
--
-
0.2
-
--
--
--
-U
nite
d R
epub
lic o
f T
anza
nia
--
--
0.
2
0.1
-
--
--
--
-Z
ambi
a -
--
--
0.
2-
-
--
-
0.3
--
Zim
babw
e -
--
-
1.9
1.
3-
-
0.
3-
--
-
2.6
La
tin
Am
eri
ca a
nd
th
e C
ari
bb
ean
-
--
--
--
-
1.
7-
-
0.1
-
2.3
Bah
am
as
--
--
--
-
--
--
0.
1-
-P
ana
ma
--
--
--
-
--
--
--
1.
9T
urk
s a
nd C
aico
s Is
land
s -
--
--
--
-
--
--
-
0.5
US
Virg
in I
slan
ds
--
--
--
-
--
--
0.
1-
-A
sia
0.6
4.
7
1.4
1.
6-
5.
7
6.6
2.5
0.
8
3.5
2.
4
3.8
3.
4
4.7
West
Asia
-
1.
3-
--
0.
4
5.9
-
- 0
.2-
-
0.4
0.
5-
Iran
, Isl
amic
Rep
ublic
of
--
--
--
-
--
--
--
-Ir
aq
--
--
--
0.
2
--
--
--
-K
uw
ait
--
--
--
1.
2
--
--
0.
1-
-S
audi
Ara
bia
-
--
--
-
2.5
-
- 0
.2-
-
0.1
--
Syr
ian
Ara
b R
epub
lic
--
--
--
-
--
--
--
-T
urke
y -
--
--
--
-
--
--
--
Uni
ted
Ara
b E
mir
ates
-
--
--
0.
4
2.1
-
--
-
0.1
0.
5-
Yem
en
--
--
--
-
--
--
--
-S
ou
th,
East
an
d S
ou
th-E
ast
Asia
-
-
1.4
1.
6-
5.
3
0.7
-
0.
6
3.5
2.
4
3.5
2.
9
4.7
Chi
na
--
0.
6
0.3
-
0.1
-
-
0.1
--
0.
6
0.6
4.
4H
ong
Kon
g, C
hin
a -
-
0.3
--
--
-
--
--
--
Indi
a -
--
0.
8-
-
0.2
-
-
1.8
1.
3
0.3
0.
4
0.3
Kor
ea,
Rep
ublic
of
--
-
0.5
--
0.
3
--
--
--
-M
ala
ysia
-
--
--
3.
7-
-
0.
4-
-
2.5
1.
9-
Pak
ista
n -
--
--
-
0.2
-
--
--
--
Sin
gapo
re
--
--
--
-
-
0.1
1.
7
1.0
--
-S
ri L
anka
-
-
0.6
--
--
-
--
--
--
Tai
wa
n P
rovi
nce
of C
hina
-
--
--
1.
4-
-
0.
1-
--
--
So
uth
-East
Eu
rop
e a
nd
CIS
0.5
--
--
--
-
--
--
0.
4-
So
uth
-East
Eu
rop
e
--
--
--
-
--
--
--
-R
oman
ia
--
--
--
-
--
--
--
-C
IS
--
--
--
-
--
--
-
0.4
-R
ussi
an F
eder
atio
n -
--
--
--
-
--
--
0.
4-
Ukr
aine
-
--
--
--
-
--
--
--
Un
sp
ec
ifie
d
-
0.2
2.
7
0.4
14
.6
2.2
3.
4
0.
3-
14
.0
21.4
2.
3
2.3
0.
8
M
em
oran
du
m
T
ota
l ($
mil
lio
n)
1 2
80
806
16
6
932
35
8
562
29 9
39
1
5 01
487
765
667
1 3
59 3
353
3 7
77 1
085
S
ou
rce:
UN
CT
AD
, bas
ed o
n ta
ble
12 o
f co
untr
y pr
ofile
s an
d F
DI/
TN
C d
atab
ase
(ww
w.u
ncta
d.or
g/fd
ista
tist
ics)
.
World Investment Directory Volume X Africa 2008
32
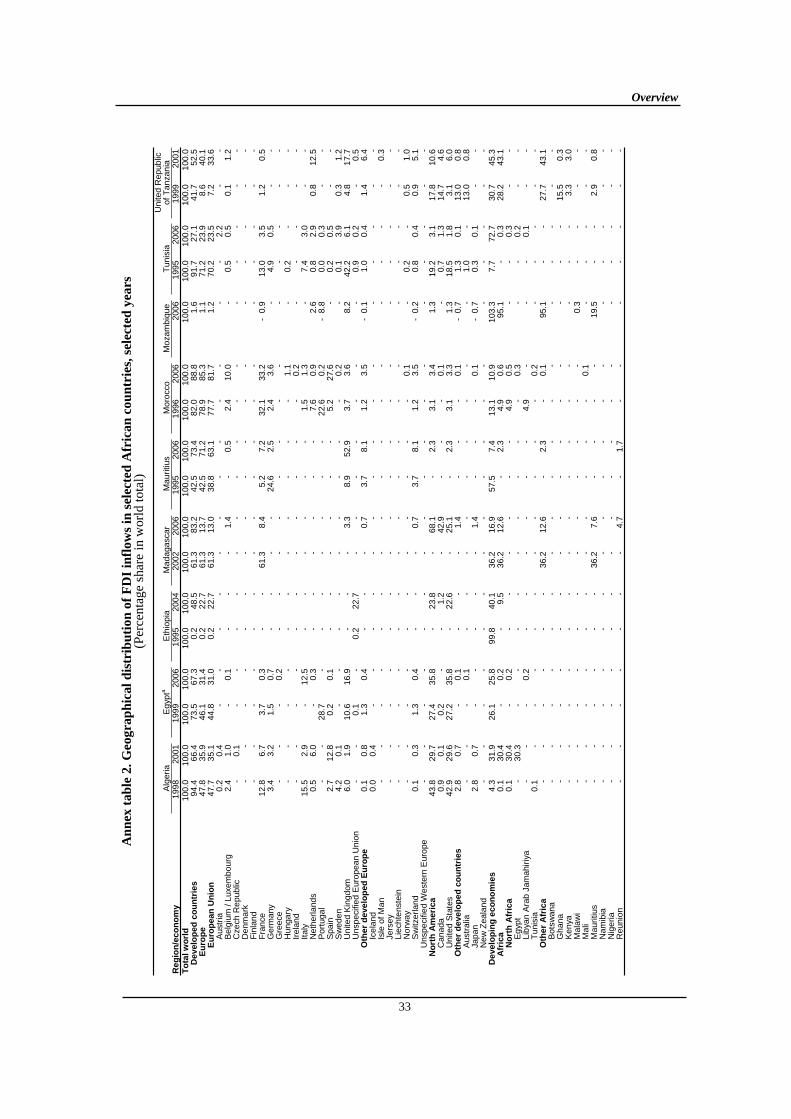
An
nex
tab
le 2
. G
eog
rap
hic
al
dis
trib
uti
on
of
FD
I in
flo
ws
in s
elec
ted
Afr
ica
n c
ou
ntr
ies,
sel
ecte
d y
ears
(P
erce
ntag
e sh
are
in w
orld
tota
l)
A
lger
ia
E
gyp
ta
Eth
iop
ia
M
adag
asca
r
Mau
ritiu
s
Mor
occo
Mo
zam
biq
ue
Tun
isia
Uni
ted
Rep
ublic
of
Tan
zan
ia
Re
gio
n/e
co
no
my
1998
20
01
199
920
06
199
520
04
2002
2006
19
95
2006
19
9620
06
2006
19
9520
06
1999
2001
To
tal w
orl
d
10
0.0
10
0.0
10
0.0
10
0.0
10
0.0
10
0.0
10
0.0
10
0.0
10
0.0
10
0.0
100.
0
100.
0
100.
0
100.
0
100
.0
100.
0
100
.0D
evelo
ped
co
un
trie
s
94
.4
6
6.4
73
.5
67.3
0.
2
48.5
61
.3
83.2
42
.5
73
.4
8
2.0
88
.8
1.6
91
.7
27.1
41
.7
52.5
Eu
rop
e
47.8
35.
9
46.1
31
.4
0.2
22
.7
61.3
13
.7
42.5
71.2
78.
9
85.3
1.
1
71.2
23
.9
8.6
40
.1E
uro
pean
Un
ion
47
.7
3
5.1
44
.8
31.0
0.
2
22.7
61
.3
13.0
38
.8
63
.1
7
7.7
81
.7
1.2
70
.2
23.5
7.
2
33.6
Aus
tria
0.2
0.
4-
--
--
--
-
--
--
2.
2-
-B
elgi
um /
Luxe
mb
ourg
2.4
1.
0-
0.
1-
--
1.
4-
0.
5
2.
4
10.0
-
0.5
0.
5
0.1
1.
2C
zech
Re
publ
ic
-
0.1
--
--
--
- -
-
--
--
--
Den
ma
rk
- -
--
--
--
- -
-
--
--
--
Fin
land
-
--
--
--
--
-
--
--
--
-F
ran
ce
12
.8
6.
7
3.7
0.
3-
-
61.3
8.
4
5.2
7.
2
3
2.1
33
.2-
0.9
13
.0
3.5
1.
2
0.5
Ge
rman
y
3.4
3.
2
1.5
0.
7-
--
-
24.6
2.5
2.4
3.
6-
4.
9
0.5
--
Gre
ece
- -
-
0.2
--
--
- -
-
--
--
--
Hun
gary
-
--
--
--
--
-
-
1.1
-
0.2
--
-Ir
elan
d -
--
--
--
--
-
-
0.2
--
--
-It
aly
15
.5
2.
9-
12
.5-
--
--
-
1.
5
1.3
-
7.4
3.
0-
-N
ethe
rlan
ds
0.
5
6.0
-
0.3
--
--
- -
7.6
0.
9
2.6
0.
8
2.9
0.
8
12.5
Por
tuga
l -
-
28.7
--
--
--
-
2
2.6
0.
2-
8.8
0.
0
0.3
--
Spa
in
2.
7
12.
8
0.2
0.
1-
--
--
-
5.
2
27.6
-
0.2
0.
5-
-S
wed
en
4.
2
0.1
--
--
--
- -
-
0.
2-
0.
1
3.9
0.
3
1.2
Uni
ted
Kin
gdom
6.0
1.
9
10.6
16
.9-
--
3.
3
8.9
52
.9
3.
7
3.6
8.
2
42.2
6.
1
4.8
17
.7U
nspe
cifie
d E
urop
ean
Uni
on
- -
0.
1-
0.
2
22.7
--
- -
-
--
0.
9
0.2
-
0.5
Oth
er
deve
lop
ed
Eu
rop
e
0.
1
0.8
1.
3
0.4
--
-
0.7
3.
7
8.1
1.2
3.
5-
0.1
1.
0
0.4
1.
4
6.4
Ice
land
0.0
0.
4-
--
--
--
-
--
--
--
-Is
le o
f M
an
- -
--
--
--
- -
-
--
--
-
0.3
Jers
ey
- -
--
--
--
- -
-
--
--
--
Lie
chte
nste
in
- -
--
--
--
- -
-
--
--
--
Nor
wa
y -
--
--
--
--
-
-
0.1
-
0.2
-
0.5
1.
0S
witz
erl
and
0.
1
0.3
1.
3
0.4
--
-
0.7
3.
7
8.1
1.2
3.
5-
0.2
0.
8
0.4
0.
9
5.1
Uns
pec
ifie
d W
este
rn E
uro
pe
- -
--
--
--
- -
-
--
--
--
No
rth
Am
eri
ca
43
.8
2
9.7
27
.4
35.8
-
23.8
-
68.1
-
2.3
3.1
3.
4
1.3
19
.2
3.1
17
.8
10.6
Can
ada
0.9
0.
1
0.2
--
1.
2-
42
.9-
-
-
0.1
-
0.7
1.
3
14.7
4.
6U
nite
d S
tate
s
42.9
29.
6
27.2
35
.8-
22
.6-
25
.1-
2.
3
3.
1
3.3
1.
3
18.5
1.
8
3.1
6.
0O
ther
deve
lop
ed
co
un
trie
s
2.
8
0.7
-
0.1
--
-
1.4
- -
-
0.
1-
0.7
1.
3
0.1
13
.0
0.8
Aus
tral
ia
- -
-
0.1
--
--
- -
-
--
1.
0-
13
.0
0.8
Jap
an
2.
8
0.7
--
--
-
1.4
- -
-
0.
1-
0.7
0.
3
0.1
--
Ne
w Z
eala
nd
- -
--
--
--
- -
-
--
--
--
De
velo
pin
g e
co
no
mie
s
4.
3
31.
9
26.1
25
.8
99.
8
40.1
36
.2
16.9
57
.5
7.
4
1
3.1
10
.9
103.
3
7.7
72
.7
30.7
45
.3A
fric
a
0.
1
30.
4-
0.
2-
9.
5
36.2
12
.6-
2.
3
4.
9
0.6
95
.1-
0.
3
28.2
43
.1N
ort
h A
fric
a
0.
1
30.
4-
0.
2-
--
--
-
4.
9
0.5
--
0.
3-
-E
gyp
t -
3
0.3
--
--
--
- -
-
0.
3-
-
0.2
--
Lib
yan
Ara
b Ja
mah
iriy
a -
--
0.
2-
--
--
-
4.
9-
--
0.
1-
-T
unis
ia
0.
1 -
--
--
--
- -
-
0.
2-
--
--
Oth
er
Afr
ica
-
--
--
-
36.2
12
.6-
2.
3
-
0.1
95
.1-
-
27.7
43
.1B
otsw
ana
-
--
--
--
--
-
--
--
--
-G
han
a -
--
--
--
--
-
--
--
-
15.5
0.
3K
enya
-
--
--
--
--
-
--
--
-
3.3
3.
0M
ala
wi
- -
--
--
--
- -
-
-
0.3
--
--
Mal
i -
--
--
--
--
-
-
0.1
--
--
-M
auri
tius
- -
--
--
36
.2
7.6
- -
-
-
19.5
--
2.
9
0.8
Nam
ibia
-
--
--
--
--
-
--
--
--
-N
ige
ria
- -
--
--
--
- -
-
--
--
--
Reu
nion
-
--
--
--
4.
7-
1.
7
--
--
--
-
Overview
33
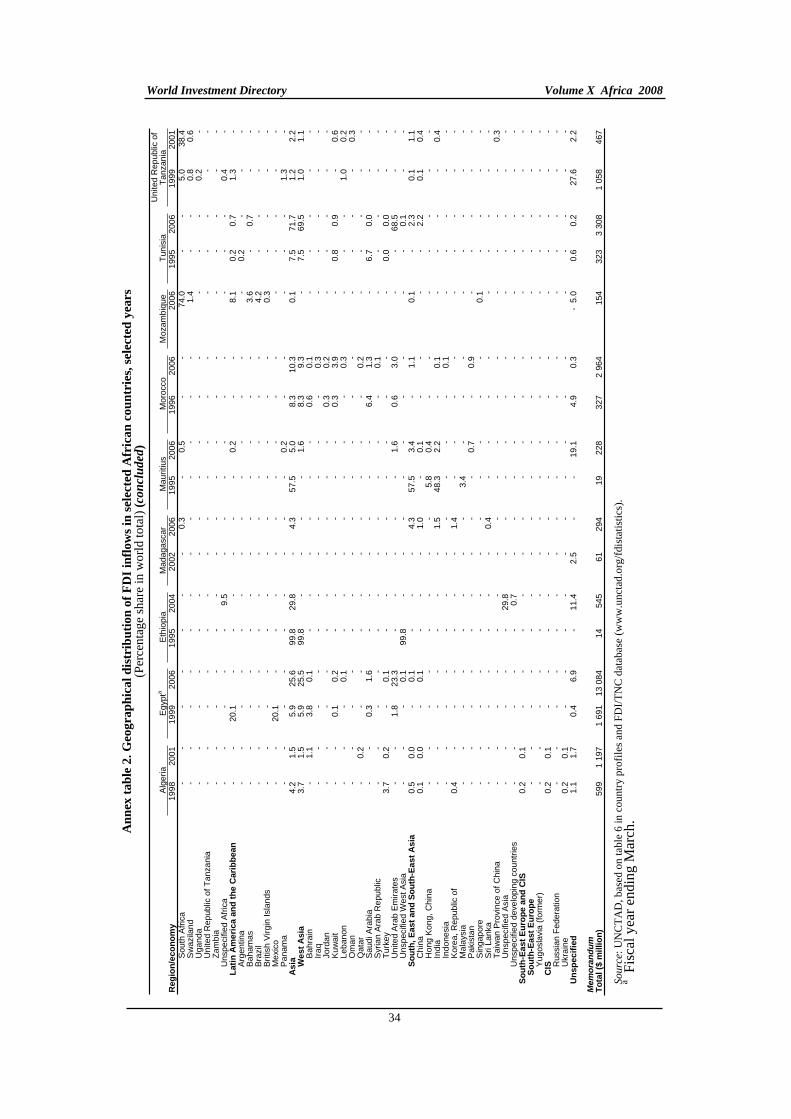
An
nex
ta
ble
2.
Geo
gra
ph
ica
l d
istr
ibu
tio
n o
f F
DI
infl
ow
s in
sel
ecte
d A
fric
an
co
un
trie
s, s
elec
ted
yea
rs
(Per
cent
age
shar
e in
wor
ld to
tal)
(co
ncl
uded
)
A
lger
ia
E
gyp
ta
Eth
iopi
a
Mad
aga
scar
Mau
ritiu
s
Mor
occo
Moz
am
biq
ue
T
unis
ia
U
nite
d R
epub
lic o
f T
anza
nia
Reg
ion
/eco
no
my
1998
20
01
1999
2006
19
9520
04
2002
2006
19
95
2006
19
9620
06
2006
19
9520
06
1999
200
1S
outh
Afr
ica
-
-
--
-
-
-
0.3
-
0.
5
--
74.0
-
-
5.
0
38.4
Sw
azila
nd
- -
-
-
--
-
-
- -
-
-
1.
4
--
0.8
0.
6U
gan
da
- -
-
-
--
-
-
- -
-
-
-
--
0.2
-U
nite
d R
epub
lic o
f Tan
zani
a -
-
--
-
-
--
-
-
--
-
-
-
--
Zam
bia
- -
-
-
--
-
-
- -
-
-
-
--
-
-U
nspe
cifie
d A
fric
a -
-
--
-
9.
5
--
-
-
--
-
-
-
0.
4-
Lati
n A
me
rica a
nd
th
e C
ari
bb
ean
- -
20.1
-
--
-
-
-
0.2
-
-
8.
1
0.
2
0.7
1.3
-A
rgen
tina
- -
-
-
--
-
-
- -
-
-
-
0.
2-
-
-B
aha
mas
-
-
--
-
-
--
-
-
--
3.6
-
0.
7
--
Bra
zil
- -
-
-
--
-
-
- -
-
-
4.
2
--
-
-B
ritis
h V
irg
in I
sla
nds
-
-
--
-
-
--
-
-
--
0.3
-
-
--
Me
xico
-
-
20
.1-
-
-
--
-
-
--
-
-
-
--
Pa
nam
a -
-
--
-
-
--
-
0.
2
--
-
-
-
1.
3-
Asia
4.2
1.
5
5.
9
25.6
99.8
29
.8
-
4.3
57.
5
5.0
8.3
10
.3
0.
1
7.
5
71.7
1.2
2.
2W
es
t A
sia
3.7
1.
5
5.
9
25.5
99.8
-
--
-
1.
6
8.
3
9.3
-
7.5
69
.5
1.
0
1.1
Bah
rain
-
1.
1
3.
8
0.1
-
-
--
-
-
0.
6
0.1
-
-
-
--
Iraq
-
-
--
-
-
--
-
-
-
0.3
-
-
-
--
Jord
an
-
-
--
-
-
--
-
-
0.
3
0.2
-
-
-
--
Ku
wai
t -
-
0.
1
0.2
-
-
--
-
-
0.
3
3.9
-
0.8
0.
9
-
0.6
Leb
anon
-
-
-
0.1
-
-
--
-
-
-
0.3
-
-
-
1.
0
0.2
Om
an
- -
-
-
--
-
-
- -
-
-
-
--
-
0.
3Q
atar
-
0.
2
--
-
-
--
-
-
-
0.2
-
-
-
--
Sau
di A
rabi
a
- -
0.3
1.
6
--
-
-
- -
6.4
1.
3
-
6.
7
0.0
-
-S
yria
n A
rab
Rep
ubl
ic
- -
-
-
--
-
-
- -
-
0.
1
-
--
-
-T
urke
y
3.7
0.
2
-
0.1
-
-
--
-
-
--
-
0.0
0.
0
--
Uni
ted
Ara
b E
mir
ates
-
-
1.
8
23.3
-
-
--
-
1.
6
0.
6
3.0
-
-
68
.5
--
Uns
peci
fied
Wes
t Asi
a -
-
-
0.1
99.8
-
--
-
-
--
-
-
0.
1
--
So
uth
, E
ast
an
d S
ou
th-E
ast
Asia
0.5
0.
0
-
0.1
-
-
-
4.3
57.
5
3.4
-
1.
1
0.
1
-
2.3
0.1
1.
1C
hina
0.1
0.
0
-
0.1
-
-
-
1.0
-
0.
1
--
-
-
2.
2
0.
1
0.4
Hon
g K
ong,
Chi
na
- -
-
-
--
-
-
5.
8
0.4
-
-
-
--
-
-In
dia
-
-
--
-
-
-
1.5
48.
3
2.2
-
0.
1
-
--
-
0.
4In
don
esia
-
-
--
-
-
--
-
-
-
0.1
-
-
-
--
Kor
ea,
Rep
ublic
of
0.
4 -
-
-
--
-
1.
4
- -
-
-
-
--
-
-M
ala
ysia
-
-
--
-
-
--
3.4
-
--
-
-
-
--
Pak
ista
n
- -
-
-
--
-
-
-
0.7
-
0.
9
-
--
-
-S
inga
por
e
- -
-
-
--
-
-
- -
-
-
0.
1
--
-
-S
ri L
an
ka
- -
-
-
--
-
0.
4
- -
-
-
-
--
-
-T
aiw
an P
rovi
nce
of C
hina
-
-
--
-
-
--
-
-
--
-
-
-
-
0.3
Uns
peci
fied
Asi
a -
-
--
-
29
.8
--
-
-
--
-
-
-
--
Uns
peci
fied
deve
lopi
ng
cou
ntrie
s -
-
--
-
0.
7
--
-
-
--
-
-
-
--
So
uth
-Ea
st
Eu
rop
e a
nd
CIS
0.2
0.
1
--
-
-
--
-
-
--
-
-
-
--
So
uth
-Ea
st
Eu
rop
e
- -
-
-
--
-
-
- -
-
-
-
--
-
-Y
ug
osl
avia
(fo
rme
r)
- -
-
-
--
-
-
- -
-
-
-
--
-
-C
IS
0.
2
0.1
-
-
--
-
-
- -
-
-
-
--
-
-R
ussi
an F
eder
atio
n -
-
--
-
-
--
-
-
--
-
-
-
--
Ukr
ain
e
0.2
0.
1
--
-
-
--
-
-
--
-
-
-
--
Un
sp
ecif
ied
1.1
1.
7
0.
4
6.9
-
11
.4
2.
5-
-
19
.1
4.
9
0.3
-
5.0
0.6
0.
2
27
.6
2.2
Mem
oran
du
m
To
tal
($ m
illi
on
)
599
1
197
1
691
13
084
14
545
61
294
19
22
8
32
7 2
964
154
323
3 3
08
1 0
58
467
S
ou
rce:
UN
CT
AD
, bas
ed o
n ta
ble
6 in
cou
ntry
pro
file
s an
d F
DI/
TN
C d
atab
ase
(ww
w.u
ncta
d.or
g/fd
ista
tistic
s).
a F
isca
l yea
r en
ding
Mar
ch.
World Investment Directory Volume X Africa 2008
34
II. Technical introduction
This technical introduction briefly describes the contents of the country data and information provided in the World Investment Directory, the main sources of information used and the geographical and sectoral coverage. It also indicates what is included and excluded under each type of data and the limitations of the data.
A. Scope
Each country profile begins with a discussion of the sources and definitions underlying national FDI data. The extent to which a country departs from benchmark definitions is discussed, and attention is drawn to the shortcomings of the data for the country in question. That information is provided so the reader will be aware of the differences between the data presented in this volume and those presented by other data-gathering agencies, including the International Monetary Fund (IMF). Recommended definitions are discussed in section F.
This text is followed by 88 country tables that provide extensive coverage of data on both FDI and operations of transnational corporations (TNCs) by their geographical and sectoral distributions, together with listings of the major TNCs in each economy and selected financial data. These tables are categorized by 20 groups of variables. In the latter half of the country profile is information regarding the legal framework which governs FDI in each of the countries covered. The legal information is divided into national laws and regulations and multilateral and bilateral treaties. Lastly, there is a brief bibliography of official and secondary material which throws light on various aspects of FDI in the economy in question. Thus, the following information is contained in the country tables:
A. Definitions and sources of data
B. Statistics on FDI and the operations of TNCs
I. Summary tables Table 1. Summary of FDI flows Table 2. Summary of international production
II. FDI by type of investment Table 3. FDI flows, by type of investment Table 4. FDI stocks, by type of investment
III. FDI flows in the host economy Table 5. FDI flows in the host economy, by industry Table 6. FDI flows in the host economy, by geographical origin Table 7. FDI flows in the host economy, by industry and geographical origin
IV. FDI flows abroad Table 8. FDI flows abroad, by industry Table 9. FDI flows abroad, by geographical destination Table 10. FDI flows abroad, by industry and geographical destination
V. FDI stocks in the host economy Table 11. FDI stocks in the host economy, by industry Table 12. FDI stocks in the host economy, by geographical origin Table 13. FDI stocks in the host economy, by industry and geographical origin
VI. FDI stocks abroad Table 14. FDI stocks abroad, by industry Table 15. FDI stocks abroad, by geographical destination Table 16. FDI stocks abroad, by industry and geographical destination
World Investment Directory Volume X Africa 2008
36
VII. Distribution of foreign affiliates and FDI by percentage ownership of parents Table 17. Distribution of foreign affiliates and FDI in the host economy, by percentage ownership of parentsTable 18. Distribution of foreign affiliates and FDI abroad, by percentage ownership of parents
VIII. The number of TNCs Table 19. The number of home-based TNCs, by industry in the home economy Table 20. The number of foreign affiliates of home-based TNCs, by industry in the foreign economy Table 21. The number of foreign affiliates of home-based TNCs, by geographical location abroad Table 22. The number of affiliates of foreign TNCs in the host economy, by industry Table 23. The number of affiliates of foreign TNCs in the host economy, by geographical origin Table 24. The number of foreign affiliates of home-based TNCs and FDI, by percentage ownership of parent companies Table 25. The number of affiliates of foreign TNCs in the host economy and FDI, by percentage ownership of parent companies
IX. Assets of TNCs Table 26. Assets of home-based TNCs, by industry in the home economy Table 27. Assets of foreign affiliates of home-based TNCs, by industry in the foreign economy Table 28. Assets of foreign affiliates of home-based TNCs, by geographical location abroad Table 29. Assets of affiliates of foreign TNCs in the host economy, by industry Table 30. Assets of affiliates of foreign TNCs in the host economy, by geographical origin
X. Employment of TNCs Table 31. Employment of home-based TNCs, by industry in the home economy Table 32. Employment of foreign affiliates of home-based TNCs, by industry in the foreign economy Table 33. Employment of foreign affiliates of home-based TNCs, by geographical location abroad Table 34. Employment of affiliates of foreign TNCs in the host economy, by industry Table 35. Employment of affiliates of foreign TNCs in the host economy, by geographical origin
XI. Wages and salaries of TNCs Table 36. Wages and salaries of home-based TNCs, by industry in the home economy Table 37. Wages and salaries of foreign affiliates of home-based TNCs, by industry in the foreign economy Table 38. Wages and salaries of foreign affiliates of home-based TNCs, by geographical location abroad Table 39. Wages and salaries of affiliates of foreign TNCs in the host economy, by industry in the foreign economy Table 40. Wages and salaries of affiliates of foreign TNCs in the host economy, by geographical origin
XII. Sales of TNCs Table 41. Sales of home-based TNCs, by industry in the home economy Table 42. Sales of foreign affiliates of home-based TNCs, by industry in the foreign economy Table 43. Sales of foreign affiliates of home-based TNCs, by geographical location abroad Table 44. Sales of affiliates of foreign TNCs in the host economy, by industry Table 45. Sales of affiliates of foreign TNCs in the host economy, by geographical origin
XIII. Value Added of TNCs Table 46. Value added of home-based TNCs, by industry in the home economy Table 47. Value added of foreign affiliates of home-based TNCs, by industry in the foreign economy Table 48. Value added of foreign affiliates of home-based TNCs, by geographical location abroad Table 49. Value added of affiliates of foreign TNCs in host economy, by industry Table 50. Value added of affiliates of foreign TNCs in the host economy, by geographical origin
XIV. Profits of TNCs Table 51. Profits of home-based TNCs, by industry in the home economy
Technical introduction
37
Table 52. Profits of foreign affiliates of home-based TNCs, by industry in the foreign economy Table 53. Profits of foreign affiliates of home-based TNCs, by geographical location abroad Table 54. Profits of affiliates of foreign TNCs in the host economy, by industry Table 55. Profits of affiliates of foreign TNCs in the host economy, by geographical origin
XV. Exports of TNCs Table 56. Exports of home-based TNCs, by industry in the home economy Table 57. Exports of foreign affiliates of home-based TNCs, by industry in the foreign economy Table 58. Exports of foreign affiliates of home-based TNCs, by geographical location abroad Table 59. Exports of affiliates of foreign TNCs in the host economy, by industry Table 60. Exports of affiliates of foreign TNCs in the host economy, by geographical origin
XVI. Imports of TNCs Table 61. Imports of home-based TNCs, by industry in the home economy Table 62. Imports of foreign affiliates of home-based TNCs, by industry in the foreign economy Table 63. Imports of foreign affiliates of home-based TNCs, by geographical location abroad Table 64. Imports of affiliates of foreign TNCs in the host economy, by industry Table 65. Imports of affiliates of foreign TNCs in the host economy, by geographical origin
XVII. Research and Development of TNCs Table 66. Research and development expenditures of home-based TNCs, by industry in the home economy Table 67. Research and development expenditures of foreign affiliates of home-based TNCs, by industry in the foreign economy Table 68. Research and development expenditures of foreign affiliates of home-based TNCs, by geographical location abroad Table 69. Research and development expenditures of affiliates of foreign TNCs in the host economy, by industry Table 70. Research and development expenditures of affiliates of foreign TNCs in the host economy, by geographical origin Table 71. Employment in Research and Development of home-based TNCs, by industry in the home economy Table 72. Employment in Research and Development of foreign affiliates of home-based TNCs, by industry in the foreign economy Table 73. Employment in Research and Development of foreign affiliates of home-based TNCs, by geographical location abroad Table 74. Employment in Research and Development of affiliates of foreign TNCs in the host economy, by industry in the foreign economy Table 75. Employment in Research and Development of affiliates of foreign TNCs in the host economy, by geographical origin
XVIII. Royalty receipts of TNCs Table 76. Royalty receipts of home-based TNCs, by industry in the home economy Table 77. Royalty receipts of foreign affiliates of home-based TNCs, by industry in the foreign economy Table 78. Royalty receipts of foreign affiliates of home-based TNCs, by geographical location abroad Table 79. Royalty receipts of affiliates of foreign TNCs in the host economy, by industry Table 80. Royalty receipts of affiliates of foreign TNCs in the host economy, by geographical origin
XIX. Royalty payments of TNCs Table 81. Royalty payments of home-based TNCs, by industry in the home economy Table 82. Royalty payments of foreign affiliates of home-based TNCs, by industry in the foreign economy Table 83. Royalty payments of foreign affiliates of home-based TNCs, by geographical location abroad Table 84. Royalty payments of foreign TNCs in the host economy, by industry Table 85. Royalty payments of affiliates of foreign TNCs in the host economy, by geographical origin
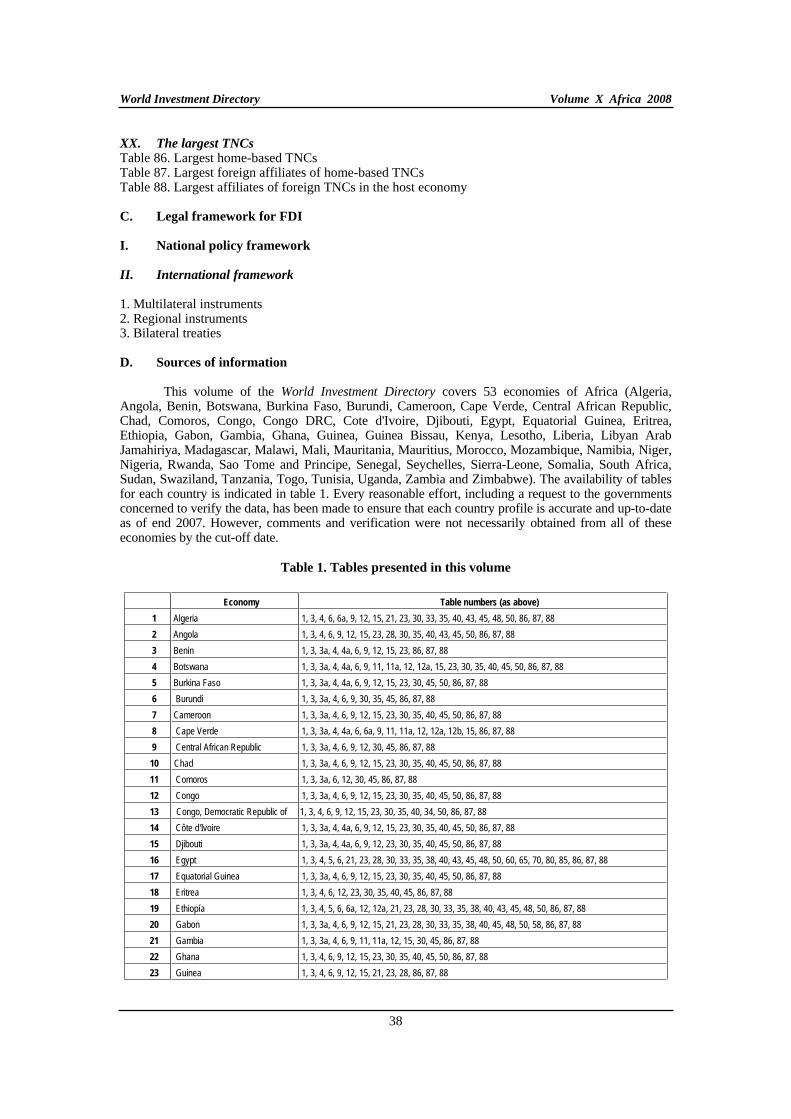
World Investment Directory Volume X Africa 2008
38
XX. The largest TNCs Table 86. Largest home-based TNCs Table 87. Largest foreign affiliates of home-based TNCs Table 88. Largest affiliates of foreign TNCs in the host economy
C. Legal framework for FDI
I. National policy framework
II. International framework
1. Multilateral instruments 2. Regional instruments 3. Bilateral treaties
D. Sources of information
This volume of the World Investment Directory covers 53 economies of Africa (Algeria, Angola, Benin, Botswana, Burkina Faso, Burundi, Cameroon, Cape Verde, Central African Republic, Chad, Comoros, Congo, Congo DRC, Cote d'Ivoire, Djibouti, Egypt, Equatorial Guinea, Eritrea, Ethiopia, Gabon, Gambia, Ghana, Guinea, Guinea Bissau, Kenya, Lesotho, Liberia, Libyan Arab Jamahiriya, Madagascar, Malawi, Mali, Mauritania, Mauritius, Morocco, Mozambique, Namibia, Niger, Nigeria, Rwanda, Sao Tome and Principe, Senegal, Seychelles, Sierra-Leone, Somalia, South Africa, Sudan, Swaziland, Tanzania, Togo, Tunisia, Uganda, Zambia and Zimbabwe). The availability of tables for each country is indicated in table 1. Every reasonable effort, including a request to the governments concerned to verify the data, has been made to ensure that each country profile is accurate and up-to-date as of end 2007. However, comments and verification were not necessarily obtained from all of these economies by the cut-off date.
Table 1. Tables presented in this volume
Economy Table numbers (as above)
1 Algeria 1, 3, 4, 6, 6a, 9, 12, 15, 21, 23, 30, 33, 35, 40, 43, 45, 48, 50, 86, 87, 88
2 Angola 1, 3, 4, 6, 9, 12, 15, 23, 28, 30, 35, 40, 43, 45, 50, 86, 87, 88
3 Benin 1, 3, 3a, 4, 4a, 6, 9, 12, 15, 23, 86, 87, 88
4 Botswana 1, 3, 3a, 4, 4a, 6, 9, 11, 11a, 12, 12a, 15, 23, 30, 35, 40, 45, 50, 86, 87, 88
5 Burkina Faso 1, 3, 3a, 4, 4a, 6, 9, 12, 15, 23, 30, 45, 50, 86, 87, 88
6 Burundi 1, 3, 3a, 4, 6, 9, 30, 35, 45, 86, 87, 88
7 Cameroon 1, 3, 3a, 4, 6, 9, 12, 15, 23, 30, 35, 40, 45, 50, 86, 87, 88
8 Cape Verde 1, 3, 3a, 4, 4a, 6, 6a, 9, 11, 11a, 12, 12a, 12b, 15, 86, 87, 88
9 Central African Republic 1, 3, 3a, 4, 6, 9, 12, 30, 45, 86, 87, 88
10 Chad 1, 3, 3a, 4, 6, 9, 12, 15, 23, 30, 35, 40, 45, 50, 86, 87, 88
11 Comoros 1, 3, 3a, 6, 12, 30, 45, 86, 87, 88
12 Congo 1, 3, 3a, 4, 6, 9, 12, 15, 23, 30, 35, 40, 45, 50, 86, 87, 88
13 Congo, Democratic Republic of 1, 3, 4, 6, 9, 12, 15, 23, 30, 35, 40, 34, 50, 86, 87, 88
14 Côte d'Ivoire 1, 3, 3a, 4, 4a, 6, 9, 12, 15, 23, 30, 35, 40, 45, 50, 86, 87, 88
15 Djibouti 1, 3, 3a, 4, 4a, 6, 9, 12, 23, 30, 35, 40, 45, 50, 86, 87, 88
16 Egypt 1, 3, 4, 5, 6, 21, 23, 28, 30, 33, 35, 38, 40, 43, 45, 48, 50, 60, 65, 70, 80, 85, 86, 87, 88
17 Equatorial Guinea 1, 3, 3a, 4, 6, 9, 12, 15, 23, 30, 35, 40, 45, 50, 86, 87, 88
18 Eritrea 1, 3, 4, 6, 12, 23, 30, 35, 40, 45, 86, 87, 88
19 Ethiopía 1, 3, 4, 5, 6, 6a, 12, 12a, 21, 23, 28, 30, 33, 35, 38, 40, 43, 45, 48, 50, 86, 87, 88
20 Gabon 1, 3, 3a, 4, 6, 9, 12, 15, 21, 23, 28, 30, 33, 35, 38, 40, 45, 48, 50, 58, 86, 87, 88
21 Gambia 1, 3, 3a, 4, 6, 9, 11, 11a, 12, 15, 30, 45, 86, 87, 88
22 Ghana 1, 3, 4, 6, 9, 12, 15, 23, 30, 35, 40, 45, 50, 86, 87, 88
23 Guinea 1, 3, 4, 6, 9, 12, 15, 21, 23, 28, 86, 87, 88
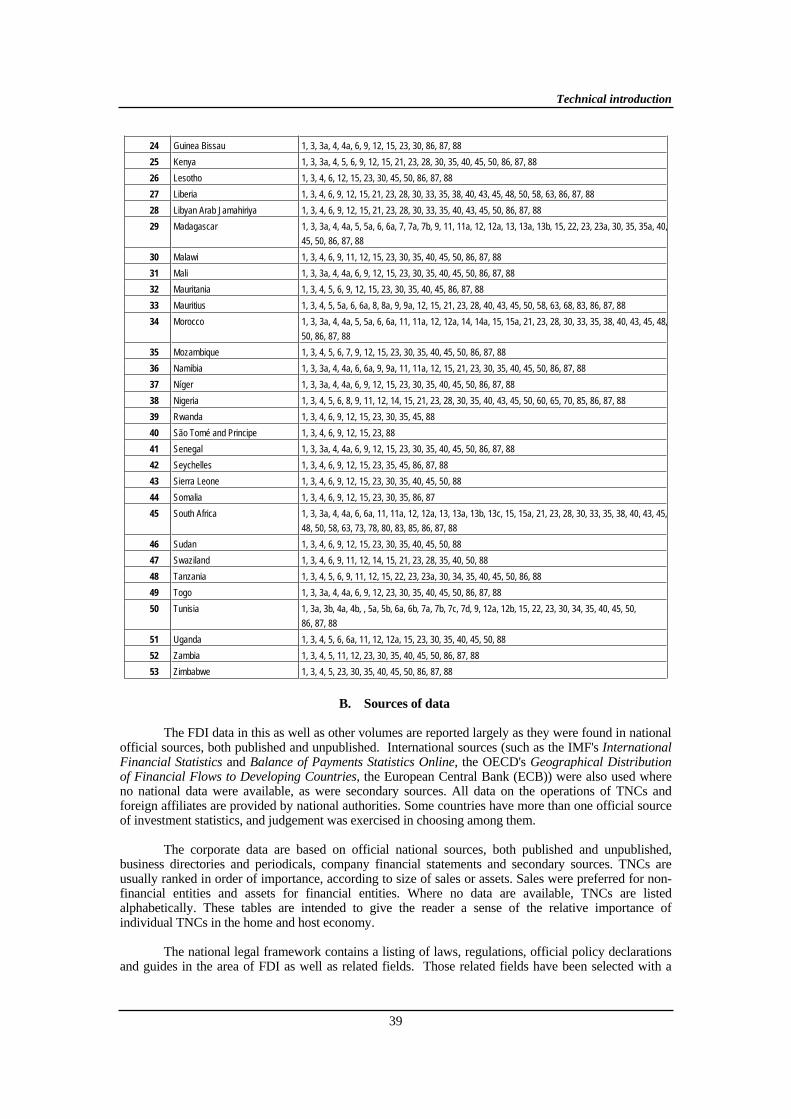
Technical introduction
39
24 Guinea Bissau 1, 3, 3a, 4, 4a, 6, 9, 12, 15, 23, 30, 86, 87, 88
25 Kenya 1, 3, 3a, 4, 5, 6, 9, 12, 15, 21, 23, 28, 30, 35, 40, 45, 50, 86, 87, 88
26 Lesotho 1, 3, 4, 6, 12, 15, 23, 30, 45, 50, 86, 87, 88
27 Liberia 1, 3, 4, 6, 9, 12, 15, 21, 23, 28, 30, 33, 35, 38, 40, 43, 45, 48, 50, 58, 63, 86, 87, 88
28 Libyan Arab Jamahiriya 1, 3, 4, 6, 9, 12, 15, 21, 23, 28, 30, 33, 35, 40, 43, 45, 50, 86, 87, 88
29 Madagascar 1, 3, 3a, 4, 4a, 5, 5a, 6, 6a, 7, 7a, 7b, 9, 11, 11a, 12, 12a, 13, 13a, 13b, 15, 22, 23, 23a, 30, 35, 35a, 40,
45, 50, 86, 87, 88
30 Malawi 1, 3, 4, 6, 9, 11, 12, 15, 23, 30, 35, 40, 45, 50, 86, 87, 88
31 Mali 1, 3, 3a, 4, 4a, 6, 9, 12, 15, 23, 30, 35, 40, 45, 50, 86, 87, 88
32 Mauritania 1, 3, 4, 5, 6, 9, 12, 15, 23, 30, 35, 40, 45, 86, 87, 88
33 Mauritius 1, 3, 4, 5, 5a, 6, 6a, 8, 8a, 9, 9a, 12, 15, 21, 23, 28, 40, 43, 45, 50, 58, 63, 68, 83, 86, 87, 88
34 Morocco 1, 3, 3a, 4, 4a, 5, 5a, 6, 6a, 11, 11a, 12, 12a, 14, 14a, 15, 15a, 21, 23, 28, 30, 33, 35, 38, 40, 43, 45, 48,
50, 86, 87, 88
35 Mozambique 1, 3, 4, 5, 6, 7, 9, 12, 15, 23, 30, 35, 40, 45, 50, 86, 87, 88
36 Namibia 1, 3, 3a, 4, 4a, 6, 6a, 9, 9a, 11, 11a, 12, 15, 21, 23, 30, 35, 40, 45, 50, 86, 87, 88
37 Níger 1, 3, 3a, 4, 4a, 6, 9, 12, 15, 23, 30, 35, 40, 45, 50, 86, 87, 88
38 Nigeria 1, 3, 4, 5, 6, 8, 9, 11, 12, 14, 15, 21, 23, 28, 30, 35, 40, 43, 45, 50, 60, 65, 70, 85, 86, 87, 88
39 Rwanda 1, 3, 4, 6, 9, 12, 15, 23, 30, 35, 45, 88
40 São Tomé and Principe 1, 3, 4, 6, 9, 12, 15, 23, 88
41 Senegal 1, 3, 3a, 4, 4a, 6, 9, 12, 15, 23, 30, 35, 40, 45, 50, 86, 87, 88
42 Seychelles 1, 3, 4, 6, 9, 12, 15, 23, 35, 45, 86, 87, 88
43 Sierra Leone 1, 3, 4, 6, 9, 12, 15, 23, 30, 35, 40, 45, 50, 88
44 Somalia 1, 3, 4, 6, 9, 12, 15, 23, 30, 35, 86, 87
45 South Africa 1, 3, 3a, 4, 4a, 6, 6a, 11, 11a, 12, 12a, 13, 13a, 13b, 13c, 15, 15a, 21, 23, 28, 30, 33, 35, 38, 40, 43, 45,
48, 50, 58, 63, 73, 78, 80, 83, 85, 86, 87, 88
46 Sudan 1, 3, 4, 6, 9, 12, 15, 23, 30, 35, 40, 45, 50, 88
47 Swaziland 1, 3, 4, 6, 9, 11, 12, 14, 15, 21, 23, 28, 35, 40, 50, 88
48 Tanzania 1, 3, 4, 5, 6, 9, 11, 12, 15, 22, 23, 23a, 30, 34, 35, 40, 45, 50, 86, 88
49 Togo 1, 3, 3a, 4, 4a, 6, 9, 12, 23, 30, 35, 40, 45, 50, 86, 87, 88
50 Tunisia 1, 3a, 3b, 4a, 4b, , 5a, 5b, 6a, 6b, 7a, 7b, 7c, 7d, 9, 12a, 12b, 15, 22, 23, 30, 34, 35, 40, 45, 50,
86, 87, 88
51 Uganda 1, 3, 4, 5, 6, 6a, 11, 12, 12a, 15, 23, 30, 35, 40, 45, 50, 88
52 Zambia 1, 3, 4, 5, 11, 12, 23, 30, 35, 40, 45, 50, 86, 87, 88
53 Zimbabwe 1, 3, 4, 5, 23, 30, 35, 40, 45, 50, 86, 87, 88
B. Sources of data
The FDI data in this as well as other volumes are reported largely as they were found in national official sources, both published and unpublished. International sources (such as the IMF's International Financial Statistics and Balance of Payments Statistics Online, the OECD's Geographical Distribution of Financial Flows to Developing Countries, the European Central Bank (ECB)) were also used where no national data were available, as were secondary sources. All data on the operations of TNCs and foreign affiliates are provided by national authorities. Some countries have more than one official source of investment statistics, and judgement was exercised in choosing among them.
The corporate data are based on official national sources, both published and unpublished, business directories and periodicals, company financial statements and secondary sources. TNCs are usually ranked in order of importance, according to size of sales or assets. Sales were preferred for non-financial entities and assets for financial entities. Where no data are available, TNCs are listed alphabetically. These tables are intended to give the reader a sense of the relative importance of individual TNCs in the home and host economy.
The national legal framework contains a listing of laws, regulations, official policy declarations and guides in the area of FDI as well as related fields. Those related fields have been selected with a
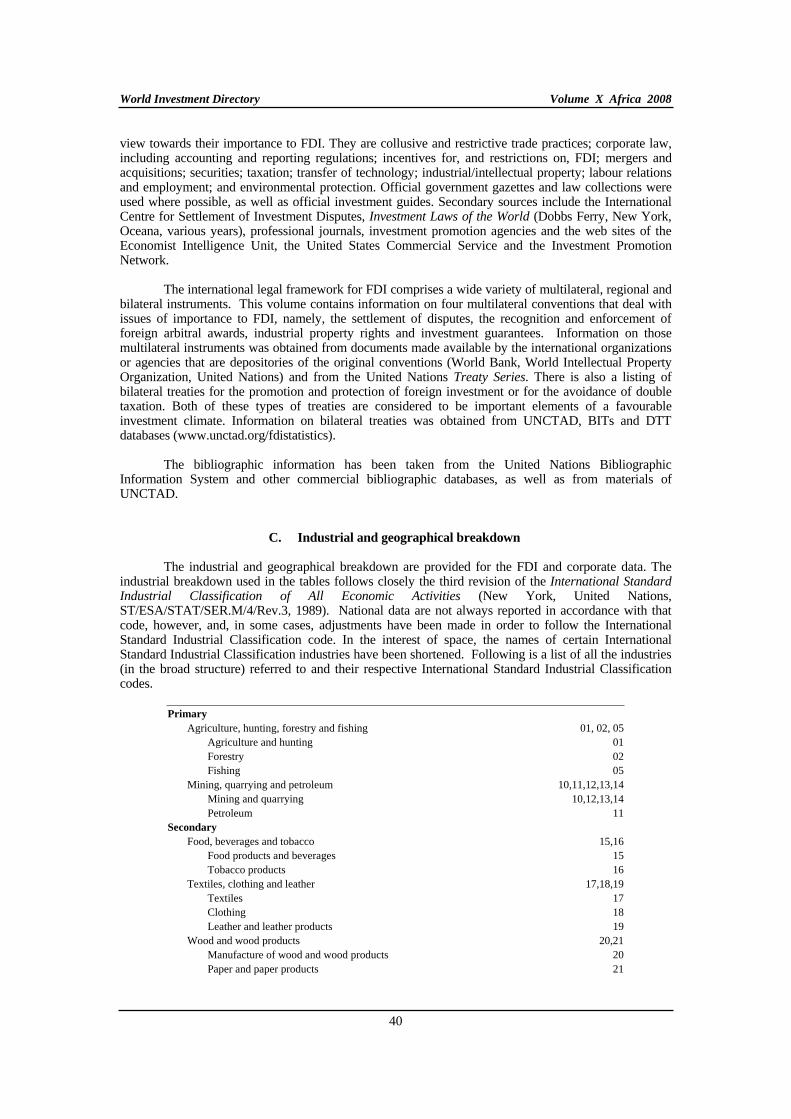
World Investment Directory Volume X Africa 2008
40
view towards their importance to FDI. They are collusive and restrictive trade practices; corporate law, including accounting and reporting regulations; incentives for, and restrictions on, FDI; mergers and acquisitions; securities; taxation; transfer of technology; industrial/intellectual property; labour relations and employment; and environmental protection. Official government gazettes and law collections were used where possible, as well as official investment guides. Secondary sources include the International Centre for Settlement of Investment Disputes, Investment Laws of the World (Dobbs Ferry, New York, Oceana, various years), professional journals, investment promotion agencies and the web sites of the Economist Intelligence Unit, the United States Commercial Service and the Investment Promotion Network.
The international legal framework for FDI comprises a wide variety of multilateral, regional and bilateral instruments. This volume contains information on four multilateral conventions that deal with issues of importance to FDI, namely, the settlement of disputes, the recognition and enforcement of foreign arbitral awards, industrial property rights and investment guarantees. Information on those multilateral instruments was obtained from documents made available by the international organizations or agencies that are depositories of the original conventions (World Bank, World Intellectual Property Organization, United Nations) and from the United Nations Treaty Series. There is also a listing of bilateral treaties for the promotion and protection of foreign investment or for the avoidance of double taxation. Both of these types of treaties are considered to be important elements of a favourable investment climate. Information on bilateral treaties was obtained from UNCTAD, BITs and DTT databases (www.unctad.org/fdistatistics).
The bibliographic information has been taken from the United Nations Bibliographic Information System and other commercial bibliographic databases, as well as from materials of UNCTAD.
C. Industrial and geographical breakdown
The industrial and geographical breakdown are provided for the FDI and corporate data. The industrial breakdown used in the tables follows closely the third revision of the International Standard Industrial Classification of All Economic Activities (New York, United Nations, ST/ESA/STAT/SER.M/4/Rev.3, 1989). National data are not always reported in accordance with that code, however, and, in some cases, adjustments have been made in order to follow the International Standard Industrial Classification code. In the interest of space, the names of certain International Standard Industrial Classification industries have been shortened. Following is a list of all the industries (in the broad structure) referred to and their respective International Standard Industrial Classification codes.
Primary
Agriculture, hunting, forestry and fishing 01, 02, 05 Agriculture and hunting 01 Forestry 02Fishing 05
Mining, quarrying and petroleum 10,11,12,13,14 Mining and quarrying 10,12,13,14 Petroleum 11
Secondary
Food, beverages and tobacco 15,16 Food products and beverages 15 Tobacco products 16
Textiles, clothing and leather 17,18,19 Textiles 17Clothing 18Leather and leather products 19
Wood and wood products 20,21 Manufacture of wood and wood products 20 Paper and paper products 21
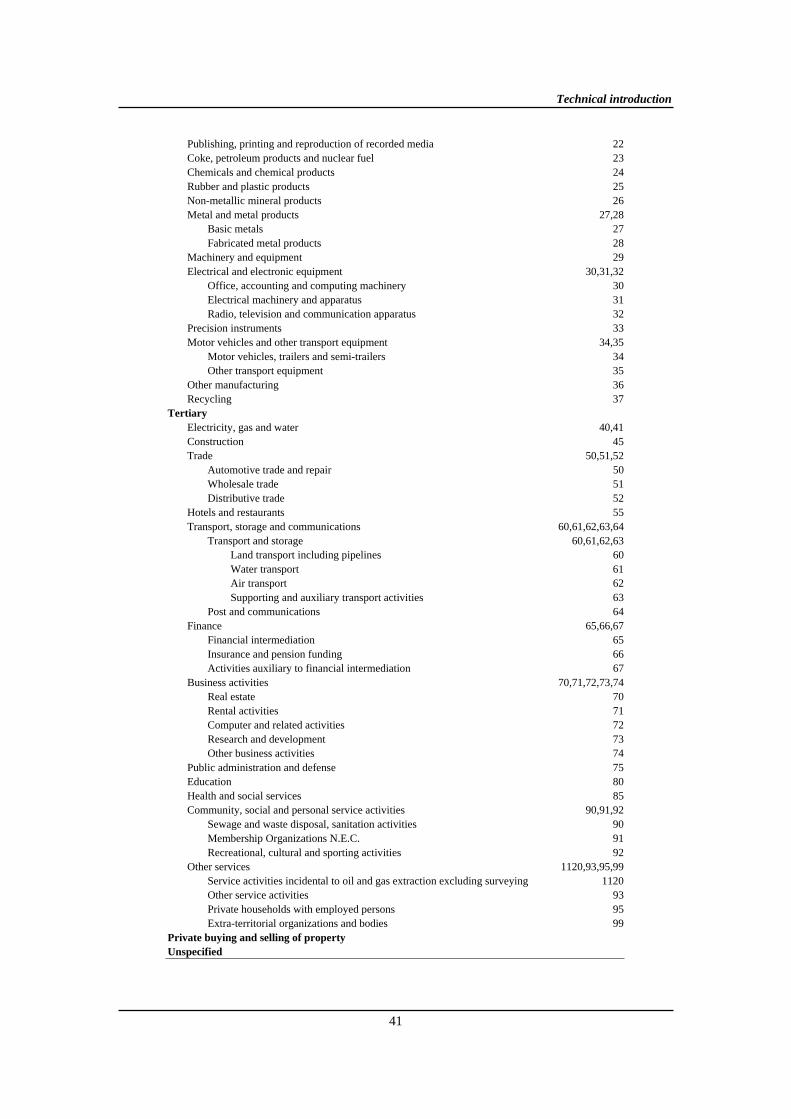
Technical introduction
41
Publishing, printing and reproduction of recorded media 22 Coke, petroleum products and nuclear fuel 23 Chemicals and chemical products 24 Rubber and plastic products 25 Non-metallic mineral products 26 Metal and metal products 27,28
Basic metals 27 Fabricated metal products 28
Machinery and equipment 29 Electrical and electronic equipment 30,31,32
Office, accounting and computing machinery 30 Electrical machinery and apparatus 31 Radio, television and communication apparatus 32
Precision instruments 33 Motor vehicles and other transport equipment 34,35
Motor vehicles, trailers and semi-trailers 34 Other transport equipment 35
Other manufacturing 36 Recycling 37
Tertiary
Electricity, gas and water 40,41 Construction 45Trade 50,51,52
Automotive trade and repair 50 Wholesale trade 51 Distributive trade 52
Hotels and restaurants 55 Transport, storage and communications 60,61,62,63,64
Transport and storage 60,61,62,63 Land transport including pipelines 60 Water transport 61 Air transport 62 Supporting and auxiliary transport activities 63
Post and communications 64 Finance 65,66,67
Financial intermediation 65 Insurance and pension funding 66 Activities auxiliary to financial intermediation 67
Business activities 70,71,72,73,74 Real estate 70Rental activities 71 Computer and related activities 72 Research and development 73 Other business activities 74
Public administration and defense 75 Education 80Health and social services 85 Community, social and personal service activities 90,91,92
Sewage and waste disposal, sanitation activities 90 Membership Organizations N.E.C. 91 Recreational, cultural and sporting activities 92
Other services 1120,93,95,99 Service activities incidental to oil and gas extraction excluding surveying 1120 Other service activities 93 Private households with employed persons 95 Extra-territorial organizations and bodies 99
Private buying and selling of property
Unspecified
World Investment Directory Volume X Africa 2008
42
For the geographical and regional breakdowns, the classification of countries and territories as either developing, developed or Central and Eastern Europe is employed only for statistical and analytical convenience, and follows the breakdown outlined below, which follows closely United Nations practice. Those countries or territories reported by national sources under the heading "other countries", and which are not elsewhere classified, have been placed under the unallocated category. The unallocated component reported in the geographical breakdown may reflect investments by international organizations (for example, the International Finance Corporation or the Asian Development Bank) or other countries not available separately. The classification of developed and developing areas and territories is as follows:
Developed areas:
Western Europe North America Other developed (Australia, Israel, Japan, New Zealand)
Developing areas and territories:
Africa East, South and South-East Asia (excluding Japan) West Asia (excluding Israel) Central Asia Latin America and the Caribbean The Pacific (excluding Australia and New Zealand)
Central and Eastern Europe
D. Reporting currency and exchange rates
For most African countries, data are reported in United States dollars. Exchange rate conversion employed in this volume is presented in table 2.
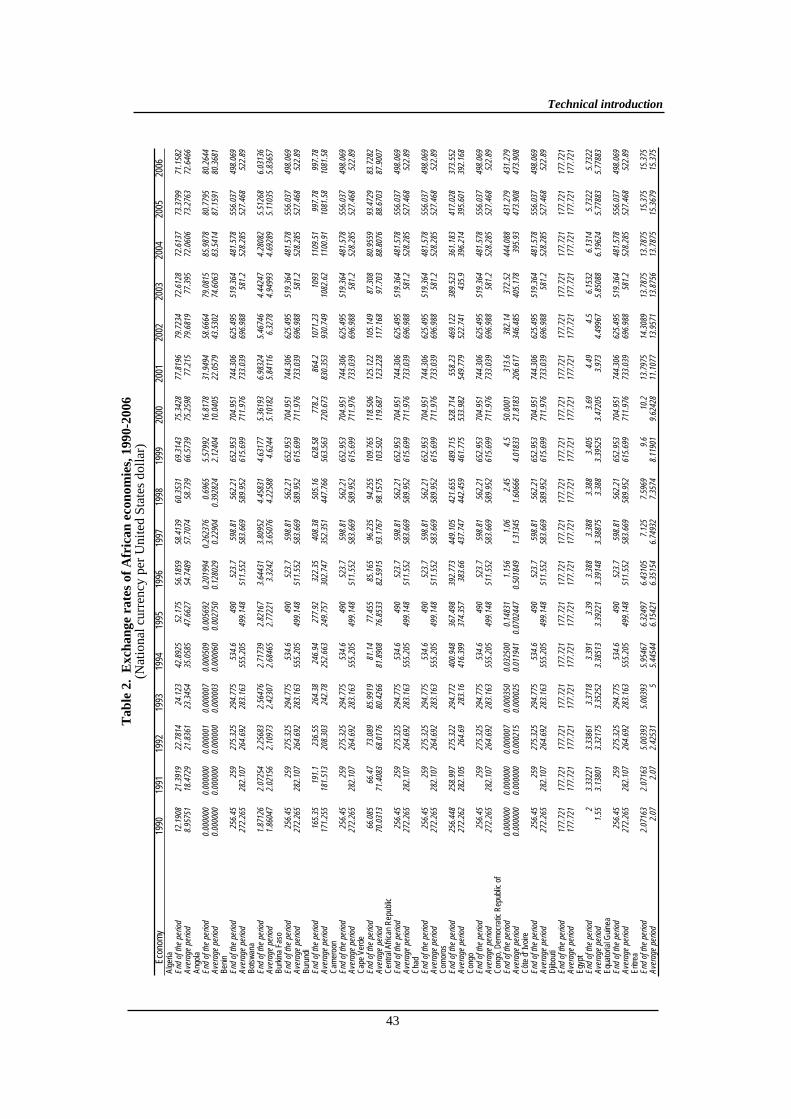
Tab
le 2
. E
xch
an
ge
rate
s of
Afr
ican
eco
no
mie
s, 1
99
0-2
006
(Nat
iona
l cur
renc
y pe
r U
nite
d St
ates
dol
lar)
E
cono
my
1990
19
91
1992
19
93
1994
19
95
1996
19
97
1998
19
99
2000
20
01
2002
20
03
2004
20
05
2006
A
lger
ia
E
nd o
f the
per
iod
12.1
908
21.3
919
22.7
814
24.1
2342
.892
552
.175
56.1
859
58.4
139
60.3
531
69.3
143
75.3
428
77.8
196
79.7
234
72.6
128
72.6
137
73.3
799
71.1
582
Ave
rage
per
iod
8.95
751
18.4
729
21.8
361
23.3
454
35.0
585
47.6
627
54.7
489
57.7
074
58.7
3966
.573
975
.259
877
.215
79.6
819
77.3
9572
.060
673
.276
372
.646
6A
ngol
a
End
of t
he p
erio
d 0.
0000
000.
0000
000.
0000
010.
0000
070.
0005
090.
0056
920.
2019
940.
2623
760.
6965
5.57
992
16.8
178
31.9
494
58.6
664
79.0
815
85.9
878
80.7
795
80.2
644
Ave
rage
per
iod
0.00
0000
0.00
0000
0.00
0000
0.00
0003
0.00
0060
0.00
2750
0.12
8029
0.22
904
0.39
2824
2.12
404
10.0
405
22.0
579
43.5
302
74.6
063
83.5
414
87.1
591
80.3
681
Ben
in
E
nd o
f the
per
iod
256.
4525
927
5.32
529
4.77
553
4.6
490
523.
759
8.81
562.
2165
2.95
370
4.95
174
4.30
662
5.49
551
9.36
448
1.57
855
6.03
749
8.06
9A
vera
ge p
erio
d 27
2.26
528
2.10
726
4.69
228
3.16
355
5.20
549
9.14
851
1.55
258
3.66
958
9.95
261
5.69
971
1.97
673
3.03
969
6.98
858
1.2
528.
285
527.
468
522.
89B
otsw
ana
E
nd o
f the
per
iod
1.87
126
2.07
254
2.25
683
2.56
476
2.71
739
2.82
167
3.64
431
3.80
952
4.45
831
4.63
177
5.36
193
6.98
324
5.46
746
4.44
247
4.28
082
5.51
268
6.03
136
Ave
rage
per
iod
1.86
047
2.02
156
2.10
973
2.42
307
2.68
465
2.77
221
3.32
423.
6507
64.
2258
84.
6244
5.10
182
5.84
116
6.32
784.
9499
34.
6928
95.
1103
55.
8365
7B
urki
na F
aso
E
nd o
f the
per
iod
256.
4525
927
5.32
529
4.77
553
4.6
490
523.
759
8.81
562.
2165
2.95
370
4.95
174
4.30
662
5.49
551
9.36
448
1.57
855
6.03
749
8.06
9A
vera
ge p
erio
d 27
2.26
528
2.10
726
4.69
228
3.16
355
5.20
549
9.14
851
1.55
258
3.66
958
9.95
261
5.69
971
1.97
673
3.03
969
6.98
858
1.2
528.
285
527.
468
522.
89B
urun
di
E
nd o
f the
per
iod
165.
3519
1.1
236.
5526
4.38
246.
9427
7.92
322.
3540
8.38
505.
1662
8.58
778.
286
4.2
1071
.23
1093
1109
.51
997.
7899
7.78
Ave
rage
per
iod
171.
255
181.
513
208.
303
242.
7825
2.66
324
9.75
730
2.74
735
2.35
144
7.76
656
3.56
372
0.67
383
0.35
393
0.74
910
82.6
211
00.9
110
81.5
810
81.5
8C
amer
oon
E
nd o
f the
per
iod
256.
4525
927
5.32
529
4.77
553
4.6
490
523.
759
8.81
562.
2165
2.95
370
4.95
174
4.30
662
5.49
551
9.36
448
1.57
855
6.03
749
8.06
9A
vera
ge p
erio
d 27
2.26
528
2.10
726
4.69
228
3.16
355
5.20
549
9.14
851
1.55
258
3.66
958
9.95
261
5.69
971
1.97
673
3.03
969
6.98
858
1.2
528.
285
527.
468
522.
89C
ape
Ver
de
E
nd o
f the
per
iod
66.0
8566
.47
73.0
8985
.991
981
.14
77.4
5585
.165
96.2
3594
.255
109.
765
118.
506
125.
122
105.
149
87.3
0880
.955
993
.472
983
.728
2A
vera
ge p
erio
d 70
.031
371
.408
368
.017
680
.426
681
.890
876
.853
382
.591
593
.176
798
.157
510
3.50
211
9.68
712
3.22
811
7.16
897
.703
88.8
076
88.6
703
87.9
007
Cen
tral
Afr
ican
Rep
ublic
End
of t
he p
erio
d 25
6.45
259
275.
325
294.
775
534.
649
052
3.7
598.
8156
2.21
652.
953
704.
951
744.
306
625.
495
519.
364
481.
578
556.
037
498.
069
Ave
rage
per
iod
272.
265
282.
107
264.
692
283.
163
555.
205
499.
148
511.
552
583.
669
589.
952
615.
699
711.
976
733.
039
696.
988
581.
252
8.28
552
7.46
852
2.89
Cha
d
End
of t
he p
erio
d 25
6.45
259
275.
325
294.
775
534.
649
052
3.7
598.
8156
2.21
652.
953
704.
951
744.
306
625.
495
519.
364
481.
578
556.
037
498.
069
Ave
rage
per
iod
272.
265
282.
107
264.
692
283.
163
555.
205
499.
148
511.
552
583.
669
589.
952
615.
699
711.
976
733.
039
696.
988
581.
252
8.28
552
7.46
852
2.89
Com
oros
End
of t
he p
erio
d 25
6.44
825
8.99
727
5.32
229
4.77
240
0.94
836
7.49
839
2.77
344
9.10
542
1.65
548
9.71
552
8.71
455
8.23
469.
122
389.
523
361.
183
417.
028
373.
552
Ave
rage
per
iod
272.
262
282.
105
264.
6928
3.16
416.
399
374.
357
383.
6643
7.74
744
2.45
946
1.77
553
3.98
254
9.77
952
2.74
143
5.9
396.
214
395.
601
392.
168
Con
go
End
of t
he p
erio
d 25
6.45
259
275.
325
294.
775
534.
649
052
3.7
598.
8156
2.21
652.
953
704.
951
744.
306
625.
495
519.
364
481.
578
556.
037
498.
069
Ave
rage
per
iod
272.
265
282.
107
264.
692
283.
163
555.
205
499.
148
511.
552
583.
669
589.
952
615.
699
711.
976
733.
039
696.
988
581.
252
8.28
552
7.46
852
2.89
Con
go, D
emoc
ratic
Rep
ublic
of
E
nd o
f the
per
iod
0.00
0000
0.00
0000
0.00
0007
0.00
0350
0.03
2500
0.14
831
1.15
61.
062.
454.
550
.000
131
3.6
382.
1437
2.52
444.
088
431.
279
431.
279
Ave
rage
per
iod
0.00
0000
0.00
0000
0.00
0215
0.00
0025
0.01
1941
0.07
0244
70.
5018
491.
3134
51.
6066
64.
0183
321
.818
320
6.61
734
6.48
540
5.17
839
5.93
473.
908
473.
908
Côt
e d'
Ivoi
re
E
nd o
f the
per
iod
256.
4525
927
5.32
529
4.77
553
4.6
490
523.
759
8.81
562.
2165
2.95
370
4.95
174
4.30
662
5.49
551
9.36
448
1.57
855
6.03
749
8.06
9A
vera
ge p
erio
d 27
2.26
528
2.10
726
4.69
228
3.16
355
5.20
549
9.14
851
1.55
258
3.66
958
9.95
261
5.69
971
1.97
673
3.03
969
6.98
858
1.2
528.
285
527.
468
522.
89D
jibou
ti
End
of t
he p
erio
d 17
7.72
117
7.72
117
7.72
117
7.72
117
7.72
117
7.72
117
7.72
117
7.72
117
7.72
117
7.72
117
7.72
117
7.72
117
7.72
117
7.72
117
7.72
117
7.72
117
7.72
1A
vera
ge p
erio
d 17
7.72
117
7.72
117
7.72
117
7.72
117
7.72
117
7.72
117
7.72
117
7.72
117
7.72
117
7.72
117
7.72
117
7.72
117
7.72
117
7.72
117
7.72
117
7.72
117
7.72
1E
gypt
End
of t
he p
erio
d 2
3.33
221
3.33
861
3.37
183.
391
3.39
3.38
83.
388
3.38
83.
405
3.69
4.49
4.5
6.15
326.
1314
5.73
225.
7322
Ave
rage
per
iod
1.55
3.13
801
3.32
175
3.35
252
3.38
513
3.39
221
3.39
148
3.38
875
3.38
83.
3952
53.
4720
53.
973
4.49
967
5.85
088
6.19
624
5.77
883
5.77
883
Equ
ator
ial G
uine
a
End
of t
he p
erio
d 25
6.45
259
275.
325
294.
775
534.
649
052
3.7
598.
8156
2.21
652.
953
704.
951
744.
306
625.
495
519.
364
481.
578
556.
037
498.
069
Ave
rage
per
iod
272.
265
282.
107
264.
692
283.
163
555.
205
499.
148
511.
552
583.
669
589.
952
615.
699
711.
976
733.
039
696.
988
581.
252
8.28
552
7.46
852
2.89
Erit
rea
E
nd o
f the
per
iod
2.07
163
2.07
163
5.00
393
5.00
393
5.95
467
6.32
497
6.43
105
7.12
57.
5969
9.6
10.2
13.7
975
14.3
089
13.7
875
13.7
875
15.3
7515
.375
Ave
rage
per
iod
2.07
2.07
2.42
531
55.
4454
46.
1542
16.
3515
46.
7493
27.
3574
8.11
901
9.62
428
11.1
077
13.9
571
13.8
756
13.7
875
15.3
679
15.3
75
43
Technical introduction
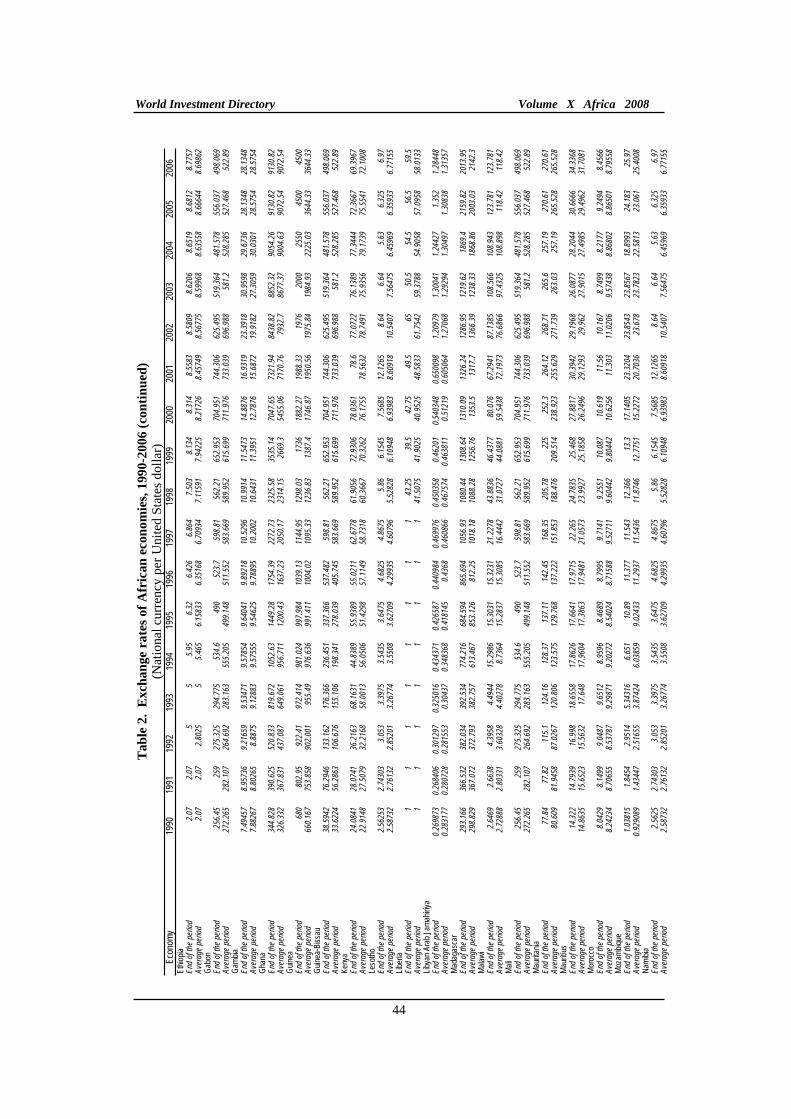
Tab
le 2
. E
xch
an
ge
rate
s of
Afr
ican
eco
no
mie
s, 1
99
0-2
006 (
con
tin
ued
)(N
atio
nal c
urre
ncy
per
Uni
ted
Stat
es d
olla
r)E
cono
my
1990
19
91
1992
19
93
1994
19
95
1996
19
97
1998
19
99
2000
20
01
2002
20
03
2004
20
05
2006
E
thio
pia
E
nd o
f the
per
iod
2.07
2.07
55
5.95
6.32
6.42
66.
864
7.50
38.
134
8.31
48.
5583
8.58
098.
6206
8.65
198.
6812
8.77
57A
vera
ge p
erio
d 2.
072.
072.
8025
55.
465
6.15
833
6.35
168
6.70
934
7.11
591
7.94
225
8.21
726
8.45
749
8.56
775
8.59
968
8.63
558
8.66
644
8.69
862
Gab
on
End
of t
he p
erio
d 25
6.45
259
275.
325
294.
775
534.
649
052
3.7
598.
8156
2.21
652.
953
704.
951
744.
306
625.
495
519.
364
481.
578
556.
037
498.
069
Ave
rage
per
iod
272.
265
282.
107
264.
692
283.
163
555.
205
499.
148
511.
552
583.
669
589.
952
615.
699
711.
976
733.
039
696.
988
581.
252
8.28
552
7.46
852
2.89
Gam
bia
E
nd o
f the
per
iod
7.49
457
8.95
736
9.21
659
9.53
471
9.57
854
9.64
041
9.89
218
10.5
296
10.9
914
11.5
473
14.8
876
16.9
319
23.3
918
30.9
598
29.6
736
28.1
348
28.1
348
Ave
rage
per
iod
7.88
267
8.80
265
8.88
759.
1288
39.
5755
59.
5462
59.
7889
510
.200
210
.643
111
.395
112
.787
615
.687
219
.918
227
.305
930
.030
128
.575
428
.575
4G
hana
E
nd o
f the
per
iod
344.
828
390.
625
520.
833
819.
672
1052
.63
1449
.28
1754
.39
2272
.73
2325
.58
3535
.14
7047
.65
7321
.94
8438
.82
8852
.32
9054
.26
9130
.82
9130
.82
Ave
rage
per
iod
326.
332
367.
831
437.
087
649.
061
956.
711
1200
.43
1637
.23
2050
.17
2314
.15
2669
.354
55.0
671
70.7
679
32.7
8677
.37
9004
.63
9072
.54
9072
.54
Gui
nea
E
nd o
f the
per
iod
680
802.
9592
2.41
972.
414
981.
024
997.
984
1039
.13
1144
.95
1298
.03
1736
1882
.27
1988
.33
1976
2000
2550
4500
4500
Ave
rage
per
iod
660.
167
753.
858
902.
001
955.
4997
6.63
699
1.41
110
04.0
210
95.3
312
36.8
313
87.4
1746
.87
1950
.56
1975
.84
1984
.93
2225
.03
3644
.33
3644
.33
Gui
nea-
Bis
sau
E
nd o
f the
per
iod
38.5
942
76.2
946
133.
162
176.
366
236.
451
337.
366
537.
482
598.
8156
2.21
652.
953
704.
951
744.
306
625.
495
519.
364
481.
578
556.
037
498.
069
Ave
rage
per
iod
33.6
224
56.2
863
106.
676
155.
106
198.
341
278.
039
405.
745
583.
669
589.
952
615.
699
711.
976
733.
039
696.
988
581.
252
8.28
552
7.46
852
2.89
Ken
ya
E
nd o
f the
per
iod
24.0
841
28.0
741
36.2
163
68.1
631
44.8
389
55.9
389
55.0
211
62.6
778
61.9
056
72.9
306
78.0
361
78.6
77.0
722
76.1
389
77.3
444
72.3
667
69.3
967
Ave
rage
per
iod
22.9
148
27.5
079
32.2
168
58.0
013
56.0
506
51.4
298
57.1
149
58.7
318
60.3
667
70.3
262
76.1
755
78.5
632
78.7
491
75.9
356
79.1
739
75.5
541
72.1
008
Leso
tho
E
nd o
f the
per
iod
2.56
253
2.74
303
3.05
33.
3975
3.54
353.
6475
4.68
254.
8675
5.86
6.15
457.
5685
12.1
265
8.64
6.64
5.63
6.32
56.
97A
vera
ge p
erio
d 2.
5873
22.
7613
22.
8520
13.
2677
43.
5508
3.62
709
4.29
935
4.60
796
5.52
828
6.10
948
6.93
983
8.60
918
10.5
407
7.56
475
6.45
969
6.35
933
6.77
155
Libe
ria
End
of t
he p
erio
d 1
11
11
11
143
.25
39.5
42.7
549
.565
50.5
54.5
56.5
59.5
Ave
rage
per
iod
11
11
11
11
41.5
075
41.9
025
40.9
525
48.5
833
61.7
542
59.3
788
54.9
058
57.0
958
58.0
133
Liby
an A
rab
Jam
ahiri
ya
E
nd o
f the
per
iod
0.26
9873
0.26
8406
0.30
1297
0.32
5016
0.43
4371
0.42
6587
0.44
0984
0.46
9976
0.45
0358
0.46
201
0.54
0348
0.65
0098
1.20
979
1.30
041
1.24
427
1.35
21.
2844
8A
vera
ge p
erio
d 0.
2831
770.
2807
280.
2815
530.
3043
70.
3483
680.
4181
450.
4368
0.46
0866
0.46
7574
0.46
3811
0.51
219
0.60
5064
1.27
068
1.29
294
1.30
497
1.30
838
1.31
357
Mad
agas
car
E
nd o
f the
per
iod
293.
166
366.
532
382.
034
392.
534
774.
216
684.
594
865.
694
1056
.93
1080
.44
1308
.64
1310
.09
1326
.24
1286
.95
1219
.62
1869
.421
59.8
220
13.9
5A
vera
ge p
erio
d 29
8.82
936
7.07
237
2.79
338
2.75
761
3.46
785
3.12
681
2.25
1018
.18
1088
.28
1256
.76
1353
.513
17.7
1366
.39
1238
.33
1868
.86
2003
.03
2142
.3M
alaw
i
End
of t
he p
erio
d 2.
6469
2.66
384.
3958
4.49
4415
.298
615
.303
115
.323
121
.227
843
.883
646
.437
780
.076
67.2
941
87.1
385
108.
566
108.
943
123.
781
123.
781
Ave
rage
per
iod
2.72
888
2.80
331
3.60
328
4.40
278
8.73
6415
.283
715
.308
516
.444
231
.072
744
.088
159
.543
872
.197
376
.686
697
.432
510
8.89
811
8.42
118.
42M
ali
E
nd o
f the
per
iod
256.
4525
927
5.32
529
4.77
553
4.6
490
523.
759
8.81
562.
2165
2.95
370
4.95
174
4.30
662
5.49
551
9.36
448
1.57
855
6.03
749
8.06
9A
vera
ge p
erio
d 27
2.26
528
2.10
726
4.69
228
3.16
355
5.20
549
9.14
851
1.55
258
3.66
958
9.95
261
5.69
971
1.97
673
3.03
969
6.98
858
1.2
528.
285
527.
468
522.
89M
aurit
ania
End
of t
he p
erio
d 77
.84
77.8
211
5.1
124.
1612
8.37
137.
1114
2.45
168.
3520
5.78
225
252.
326
4.12
268.
7126
5.6
257.
1927
0.61
270.
61A
vera
ge p
erio
d 80
.609
81.9
458
87.0
267
120.
806
123.
575
129.
768
137.
222
151.
853
188.
476
209.
514
238.
923
255.
629
271.
739
263.
0325
7.19
265.
528
265.
528
Mau
ritiu
s
End
of t
he p
erio
d 14
.322
14.7
939
16.9
9818
.655
817
.862
617
.664
117
.971
522
.265
24.7
835
25.4
6827
.881
730
.394
229
.196
826
.087
728
.204
430
.666
634
.336
8A
vera
ge p
erio
d 14
.863
515
.652
315
.563
217
.648
17.9
604
17.3
863
17.9
481
21.0
573
23.9
927
25.1
858
26.2
496
29.1
293
29.9
6227
.901
527
.498
529
.496
231
.708
1M
oroc
co
E
nd o
f the
per
iod
8.04
298.
1499
9.04
879.
6512
8.95
968.
4689
8.79
959.
7141
9.25
5110
.087
10.6
1911
.56
10.1
678.
7499
8.21
779.
2494
8.45
66A
vera
ge p
erio
d 8.
2423
48.
7065
58.
5378
79.
2987
19.
2027
28.
5402
48.
7158
89.
5271
19.
6044
29.
8044
210
.625
611
.303
11.0
206
9.57
438
8.86
802
8.86
501
8.79
558
Moz
ambi
que
E
nd o
f the
per
iod
1.03
815
1.84
542.
9514
5.34
316
6.65
110
.89
11.3
7711
.543
12.3
6613
.317
.140
523
.320
423
.854
323
.856
718
.899
324
.183
25.9
7A
vera
ge p
erio
d 0.
9290
891.
4344
72.
5165
53.
8742
46.
0385
99.
0243
311
.293
711
.543
611
.874
612
.775
115
.227
220
.703
623
.678
23.7
823
22.5
813
23.0
6125
.400
8N
amib
ia
E
nd o
f the
per
iod
2.56
252.
7430
33.
053
3.39
753.
5435
3.64
754.
6825
4.86
755.
866.
1545
7.56
8512
.126
58.
646.
645.
636.
325
6.97
Ave
rage
per
iod
2.58
732
2.76
132
2.85
201
3.26
774
3.55
083.
6270
94.
2993
54.
6079
65.
5282
86.
1094
86.
9398
38.
6091
810
.540
77.
5647
56.
4596
96.
3593
36.
7715
5
44
World Investment Directory Volume X Africa 2008
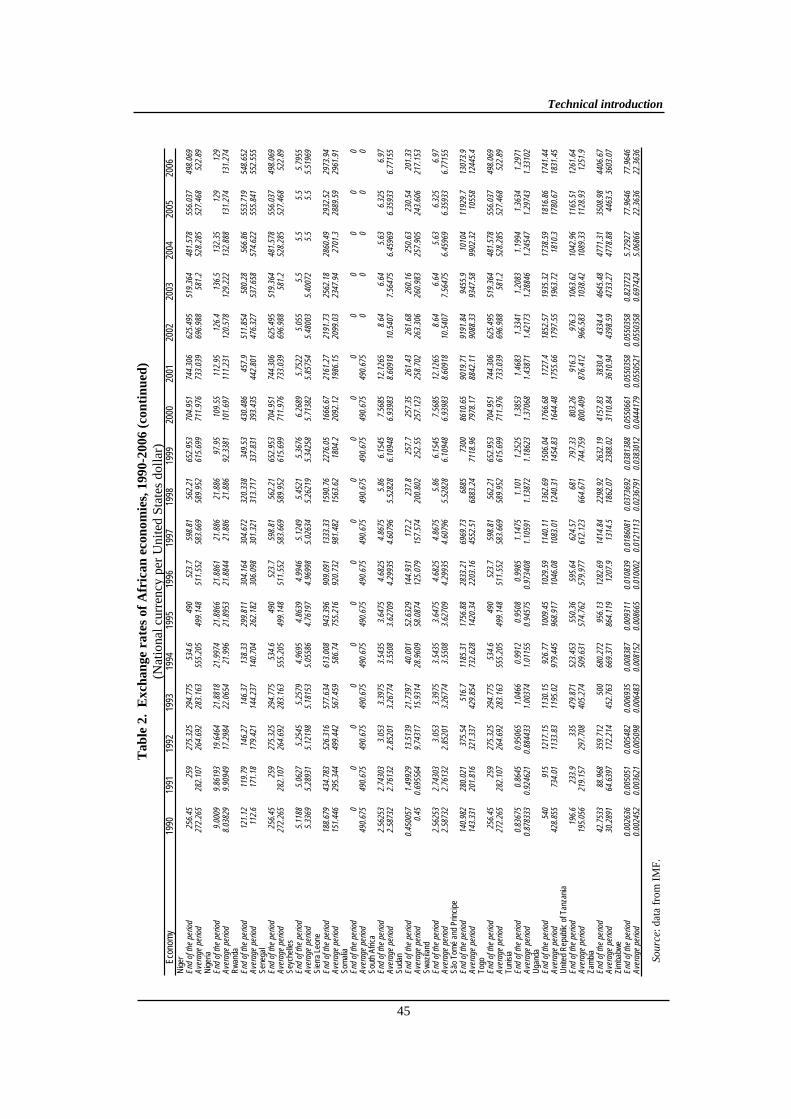
Tab
le 2
. E
xch
an
ge
rate
s of
Afr
ican
eco
no
mie
s, 1
99
0-2
006 (
con
tin
ued
)
(Nat
iona
l cur
renc
y pe
r U
nite
d St
ates
dol
lar)
Eco
nom
y 19
90
1991
19
92
1993
19
94
1995
19
96
1997
19
98
1999
20
00
2001
20
02
2003
20
04
2005
20
06
Nig
er
End
of t
he p
erio
d 25
6.45
259
275.
325
294.
775
534.
649
052
3.7
598.
8156
2.21
652.
953
704.
951
744.
306
625.
495
519.
364
481.
578
556.
037
498.
069
Ave
rage
per
iod
272.
265
282.
107
264.
692
283.
163
555.
205
499.
148
511.
552
583.
669
589.
952
615.
699
711.
976
733.
039
696.
988
581.
252
8.28
552
7.46
852
2.89
Nig
eria
E
nd o
f the
per
iod
9.00
099.
8619
319
.646
421
.881
821
.997
421
.886
621
.886
121
.886
21.8
8697
.95
109.
5511
2.95
126.
413
6.5
132.
3512
912
9A
vera
ge p
erio
d 8.
0382
99.
9094
917
.298
422
.065
421
.996
21.8
953
21.8
844
21.8
8621
.886
92.3
381
101.
697
111.
231
120.
578
129.
222
132.
888
131.
274
131.
274
Rw
anda
E
nd o
f the
per
iod
121.
1211
9.79
146.
2714
6.37
138.
3329
9.81
130
4.16
430
4.67
232
0.33
834
9.53
430.
486
457.
951
1.85
458
0.28
566.
8655
3.71
954
8.65
2A
vera
ge p
erio
d 11
2.6
171.
1817
9.42
114
4.23
714
0.70
426
2.18
230
6.09
830
1.32
131
3.71
733
7.83
139
3.43
544
2.80
147
6.32
753
7.65
857
4.62
255
5.84
155
2.55
5S
eneg
al
E
nd o
f the
per
iod
256.
4525
927
5.32
529
4.77
553
4.6
490
523.
759
8.81
562.
2165
2.95
370
4.95
174
4.30
662
5.49
551
9.36
448
1.57
855
6.03
749
8.06
9A
vera
ge p
erio
d 27
2.26
528
2.10
726
4.69
228
3.16
355
5.20
549
9.14
851
1.55
258
3.66
958
9.95
261
5.69
971
1.97
673
3.03
969
6.98
858
1.2
528.
285
527.
468
522.
89S
eych
elle
s
End
of t
he p
erio
d 5.
1188
5.06
275.
2545
5.25
794.
9695
4.86
394.
9946
5.12
495.
4521
5.36
766.
2689
5.75
225.
055
5.5
5.5
5.5
5.79
55A
vera
ge p
erio
d 5.
3369
5.28
931
5.12
198
5.18
153
5.05
586
4.76
197
4.96
998
5.02
634
5.26
219
5.34
258
5.71
382
5.85
754
5.48
003
5.40
072
5.5
5.5
5.51
969
Sie
rra
Leon
e
End
of t
he p
erio
d 18
8.67
943
4.78
352
6.31
657
7.63
461
3.00
894
3.39
690
9.09
113
33.3
315
90.7
622
76.0
516
66.6
721
61.2
721
91.7
325
62.1
828
60.4
929
32.5
229
73.9
4A
vera
ge p
erio
d 15
1.44
629
5.34
449
9.44
256
7.45
958
6.74
755.
216
920.
732
981.
482
1563
.62
1804
.220
92.1
219
86.1
520
99.0
323
47.9
427
01.3
2889
.59
2961
.91
Som
alia
End
of t
he p
erio
d 0
00
00
00
00
00
00
00
00
Ave
rage
per
iod
490.
675
490.
675
490.
675
490.
675
490.
675
490.
675
490.
675
490.
675
490.
675
490.
675
490.
675
490.
675
00
00
0S
outh
Afr
ica
E
nd o
f the
per
iod
2.56
253
2.74
303
3.05
33.
3975
3.54
353.
6475
4.68
254.
8675
5.86
6.15
457.
5685
12.1
265
8.64
6.64
5.63
6.32
56.
97A
vera
ge p
erio
d 2.
5873
22.
7613
22.
8520
13.
2677
43.
5508
3.62
709
4.29
935
4.60
796
5.52
828
6.10
948
6.93
983
8.60
918
10.5
407
7.56
475
6.45
969
6.35
933
6.77
155
Sud
an
E
nd o
f the
per
iod
0.45
0057
1.49
929
13.5
139
21.7
397
40.0
0152
.632
914
4.93
117
2.2
237.
825
7.7
257.
3526
1.43
261.
6826
0.16
250.
6323
0.54
201.
33A
vera
ge p
erio
d 0.
450.
6955
649.
7431
715
.931
428
.960
958
.087
412
5.07
915
7.57
420
0.80
225
2.55
257.
123
258.
702
263.
306
260.
983
257.
905
243.
606
217.
153
Sw
azila
nd
E
nd o
f the
per
iod
2.56
253
2.74
303
3.05
33.
3975
3.54
353.
6475
4.68
254.
8675
5.86
6.15
457.
5685
12.1
265
8.64
6.64
5.63
6.32
56.
97A
vera
ge p
erio
d 2.
5873
22.
7613
22.
8520
13.
2677
43.
5508
3.62
709
4.29
935
4.60
796
5.52
828
6.10
948
6.93
983
8.60
918
10.5
407
7.56
475
6.45
969
6.35
933
6.77
155
São
Tom
é an
d P
rinci
pe
E
nd o
f the
per
iod
140.
982
280.
021
375.
5451
6.7
1185
.31
1756
.88
2833
.21
6969
.73
6885
7300
8610
.65
9019
.71
9191
.84
9455
.910
104
1192
9.7
1307
3.9
Ave
rage
per
iod
143.
331
201.
816
321.
337
429.
854
732.
628
1420
.34
2203
.16
4552
.51
6883
.24
7118
.96
7978
.17
8842
.11
9088
.33
9347
.58
9902
.32
1055
812
445.
4T
ogo
E
nd o
f the
per
iod
256.
4525
927
5.32
529
4.77
553
4.6
490
523.
759
8.81
562.
2165
2.95
370
4.95
174
4.30
662
5.49
551
9.36
448
1.57
855
6.03
749
8.06
9A
vera
ge p
erio
d 27
2.26
528
2.10
726
4.69
228
3.16
355
5.20
549
9.14
851
1.55
258
3.66
958
9.95
261
5.69
971
1.97
673
3.03
969
6.98
858
1.2
528.
285
527.
468
522.
89T
unis
ia
E
nd o
f the
per
iod
0.83
675
0.86
450.
9506
51.
0466
0.99
120.
9508
0.99
851.
1475
1.10
11.
2525
1.38
531.
4683
1.33
411.
2083
1.19
941.
3634
1.29
71A
vera
ge p
erio
d 0.
8783
330.
9246
210.
8844
331.
0037
41.
0115
50.
9457
50.
9734
081.
1059
11.
1387
21.
1862
31.
3706
81.
4387
11.
4217
31.
2884
61.
2454
71.
2974
31.
3310
2U
gand
a
End
of t
he p
erio
d 54
091
512
17.1
511
30.1
592
6.77
1009
.45
1029
.59
1140
.11
1362
.69
1506
.04
1766
.68
1727
.418
52.5
719
35.3
217
38.5
918
16.8
617
41.4
4A
vera
ge p
erio
d 42
8.85
573
4.01
1133
.83
1195
.02
979.
445
968.
917
1046
.08
1083
.01
1240
.31
1454
.83
1644
.48
1755
.66
1797
.55
1963
.72
1810
.317
80.6
718
31.4
5U
nite
d R
epub
lic o
f Tan
zani
a
End
of t
he p
erio
d 19
6.6
233.
933
547
9.87
152
3.45
355
0.36
595.
6462
4.57
681
797.
3380
3.26
916.
397
6.3
1063
.62
1042
.96
1165
.51
1261
.64
Ave
rage
per
iod
195.
056
219.
157
297.
708
405.
274
509.
631
574.
762
579.
977
612.
123
664.
671
744.
759
800.
409
876.
412
966.
583
1038
.42
1089
.33
1128
.93
1251
.9Z
ambi
a
End
of t
he p
erio
d 42
.753
388
.968
359.
712
500
680.
272
956.
1312
82.6
914
14.8
422
98.9
226
32.1
941
57.8
338
30.4
4334
.446
45.4
847
71.3
135
08.9
844
06.6
7A
vera
ge p
erio
d 30
.289
164
.639
717
2.21
445
2.76
366
9.37
186
4.11
912
07.9
1314
.518
62.0
723
88.0
231
10.8
436
10.9
443
98.5
947
33.2
747
78.8
844
63.5
3603
.07
Zim
babw
e
End
of t
he p
erio
d 0.
0026
360.
0050
510.
0054
820.
0069
350.
0083
870.
0093
110.
0108
390.
0186
081
0.03
7369
20.
0381
388
0.05
5066
10.
0550
358
0.05
5035
80.
8237
235.
7292
777
.964
677
.964
6A
vera
ge p
erio
d 0.
0024
520.
0036
210.
0050
980.
0064
830.
0081
520.
0086
650.
0100
020.
0121
113
0.02
3679
10.
0383
012
0.04
4417
90.
0550
521
0.05
5035
80.
6974
245.
0686
622
.363
622
.363
6
So
urc
e: d
ata
from
IM
F.
Technical introduction
45
World Investment Directory Volume X Africa 2008
46
E. Definitions, descriptions and discrepancies in the data
1. FDI statistics
The two main definitions of FDI are contained in the Balance of Payments Manual: Fifth
Edition (Washington, D.C., International Monetary Fund, 1993) and the second edition of the Detailed
Benchmark Definitions of Foreign Direct Investment: Third Edition (Paris, Organisation for Economic Co-operation and Development, 1996).
According to the Balance of Payments Manual, FDI refers to investment made to acquire lasting interest in enterprises operating outside of the economy of the investor. Further, in cases of FDI, the investor's purpose is to gain an effective voice in the management of the enterprise. The foreign entity or group of associated entities that makes the investment is termed the "direct investor". The unincorporated or incorporated enterprise-a branch or subsidiary, respectively, in which direct investment is made-is referred to as a "direct investment enterprise". Some degree of equity ownership is almost always considered to be associated with an effective voice in the management of an enterprise; in the revised edition of the Manual, IMF suggests a threshold of 10 per cent of equity ownership to qualify an investor as a foreign direct investor.
Once a direct investment enterprise has been identified, it is necessary to define which capital flows between the enterprise and entities in other economies should be classified as FDI. Since the main feature of FDI is taken to be the lasting interest of a direct investor in an enterprise, only capital that is provided by the direct investor-either directly or through other enterprises related to the investor-should be classified as FDI. The forms of investment by the direct investor which are classified as FDI are equity capital, the reinvestment of earnings and the provision of long- and short-term intra-company loans (between parent and affiliate enterprises).
According to the benchmark definition of the OECD, a direct investment enterprise is an incorporated or unincorporated enterprise in which a single foreign investor either owns 10 per cent or more of the ordinary shares or voting power of an enterprise (unless it can be proved that the 10 per cent ownership does not allow the investor an effective voice in the management) or owns less than 10 per cent of the ordinary shares or voting power of an enterprise, yet still maintains an effective voice in management. An effective voice in management only implies that direct investors are able to influence the management of an enterprise and does not imply that they have absolute control. The most important characteristic of FDI, which distinguishes it from portfolio investment, is that it is undertaken with the intention of exercising control over an enterprise.
There is a notorious lack of comparability of the FDI data of different countries. This lack of comparability usually results in discrepancies between total outflows and total inflows or between outward stocks and inward stocks. There are three main causes for the lack of comparability and discrepancies. First, countries differ in their definitions of FDI, since most depart in one way or another from the conventions recommended by IMF or OECD. Second, countries differ in their methods of data collection; a principal problem is the difficulty of identifying the ultimate beneficiary as opposed to the immediate beneficiary of FDI. Third, corporate accounting practices and valuation methods differ between countries. Each of those groups of issues is discussed in turn below.
a. Definitions of FDI
(i) Components of FDI
As stated above, the components of FDI are equity capital, reinvested earnings and intra-company loans. As countries do not always collect data for each of those components, reported data on
Technical introduction
47
FDI are not comparable across countries. In particular, data on reinvested earnings, the collection of which depends on company surveys, are often unreported by many countries.
(ii) The threshold equity ownership
Countries differ in the threshold value for foreign equity ownership which they take as evidence of a direct investment relationship. This is the level of participation at or above which the direct investor is normally regarded as having an effective say in the management of the enterprise involved. The threshold value usually involves chosen ranges of between 10 and 50 per cent, and in recent years it has tended to move towards the lower end of this range, owing to the fact that even a small shareholding may allow an effective voice in management. Some countries do not specify a threshold point, but rely entirely on other evidence, including companies' own assessments as to whether the investing company has an effective voice in the foreign firm in which it has an equity stake. The quantitative impact of differences in the threshold value used is relatively small, owing to the large proportion of FDI which is directed to majority-owned subsidiaries and branches.
(iii) Defining a controlling interest and treatment of non-equity forms of investment
Other than having an equity stake in an enterprise, there are many other ways in which foreign investors may acquire an effective voice. Those include subcontracting, management contracts, turnkey arrangements, franchising, leasing, licensing and production-sharing. A franchise (a firm to which business is subcontracted) or a company which sells most of its production to a foreign firm through means other than an equity stake are not usually collected, some countries have begun to contemplate doing so. For example, the OECD treats financial leases between direct investors and their branches, subsidiaries or associates as if they were conventional loans; such relationships will therefore be included in its revised definition of FDI.
b. Methods of data collection and national practices in the treatment of FDI
(i) Foreign exchange records versus company surveys
Very often it is difficult for a country to comply with the recommended definitions and report on all three components of FDI because it relies exclusively on foreign exchange records of the central bank. Thus it is only able to account for capital which crosses its borders and not reinvested earnings. Another approach taken by some countries involves a requirement by the central bank of additional information from foreign investors.
Data on FDI flows are collected primarily for balance-of-payments purposes. However, the data are usually based on the exchange records of the central bank and are extremely limited in details. Some countries supplement their exchange records data with company surveys. In most cases, that involves a request for information on components of FDI not properly covered in the recording of foreign exchange transactions, the most important of which is reinvested earnings. This generally entails an annual company survey. In some countries, there is also a periodic census or benchmark survey which covers all aspects of FDI and may extend to other related variables. In several cases-such as Australia, Canada, Nigeria and the United States, for instance, surveys are the only source of FDI information.
Very often, however, stock data are not available for some developed countries (and for several developing countries) because of their reliance on the exchange records. Stock data may also be obtained from company surveys. If FDI flows were also obtained on the same basis, then cumulative FDI flows would equal FDI stocks because it would include, for example, changes in valuation due to depreciation. However, where FDI flow data are collected from exchange records and FDI stock data are derived from company surveys, cumulative FDI flows do not generally match stocks. Once again, one major source of discrepancies is that-in the absence of company surveys, and the presence of an exclusive reliance on records of exchange transactions-reinvested earnings are excluded from FDI flow data.
World Investment Directory Volume X Africa 2008
48
Another difficulty is that equity capital, as well as changes in intra-company loans between parents and affiliates, and reinvested earnings tend to fluctuate considerably between years and can be substantially revised. Although there may be attempts to revise the FDI-flow-data series accordingly, it can be difficult to attribute revisions to particular previous years. For that reason, proper adjustments are normally made only at the time of comprehensive surveys. Surveys also allow for a revaluation of assets which helps to ensure a more accurate assessment of investment stocks.
(ii) Ultimate beneficial owner
As stated above, FDI flow data are likely to be organized on the basis of the immediate host country and immediate investing country, rather than the ultimate host and ultimate investing country. Where funds are channelled through holding companies, major problems may be created in the compilation of an accurate geographical or industrial distribution of FDI. That often leads to an overstatement of investments, particularly in the financial sector, in or from financial centres. The ultimate investment's origins or intentions of the parent companies are lost as a consequence.
Some countries, however, have made efforts to reduce that problem. Surveys to collect data on FDI stocks can be drawn up in terms of either immediate or ultimate owners. A version of this appears in the German FDI data, where there is a distinction between primary and secondary FDI. Other countries have paid particular attention to trying to resolve the problem of ultimate beneficial ownership, which arises in the case of offshore companies or banks. Those are firms incorporated in countries which are typically offshore banking centres or tax havens (such as the Netherlands Antilles, Panama, Bermuda or the Cayman Islands) that are not active in the country of incorporation and have their management offices in other countries, generally that of the parent company.
Similar difficulties are encountered in cases of takeovers of firms. If a direct investor is taken over by a foreign firm from a different country, the host country will not always record the change in ownership. If an inward direct investment enterprise owned by a firm in country A is taken over by a firm in country B, the host country should record this as a disinvestment by A and as a direct investment by B; it is recognized, however, that countries do not always have the data to implement that recommendation.
Further problems sometimes arise where takeovers proceed in incremental stages. Early acquisitions are treated as portfolio investment and, consequently, are not included in FDI flows until such time that threshold level is reached. The flow data are not subsequently revised once the threshold level is reached; only the investment which takes the firm over the critical threshold and its following investments are recorded in FDI flows.
(iii) Variety of sources for FDI data
Many countries have a variety of sources for FDI data, including those collected by the central bank for balance-of-payments purposes and those collected by the board of investment or a similar institution for monitoring and investment promotion purposes.
Owing to the lack of comprehensive FDI data, especially in some countries and territories, it is necessary to draw upon the data provided by institutions responsible for the regulation or promotion of FDI. Allowances must then be made for the regulatory framework within which the data were gathered. For example, not all FDI may have to be registered with the authorities in question; it is possible that reinvested earnings or investments in ventures in which the foreign equity stake is below a certain percentage are excluded.
A typical occurrence is that data provided by those institutions are on approved FDI investments rather than on the investments actually implemented. Sometimes, geographical and sectoral disaggregation of FDI are available only for approved investments. In such cases, data on approved
Technical introduction
49
investments provide crucial information, but their limitations must be acknowledged. Normally, approved investments are larger than those actually implemented.
(iv) Industrial coverage and classification
Sometimes, the industrial coverage of FDI reporting is limited, or the classification used by national bodies is incompatible with the second revision of the International Standard Industrial
Classification of All Economic Activities. For a few countries, FDI data are highly aggregated in very broad categories. In addition, the industrial classification used may be based on either the primary activity of the parent company, or the primary activity of the affiliate. Exceptions are found in the German and United States FDI data, which are compiled in accordance with both of those criteria. The most common method is to rely on the industry of the parent firm; nevertheless, in some cases (for example, the United Kingdom) data are classified by the industry of the affiliate. In some countries, outward FDI is classified according to the industry of the parent company, while inward FDI is attributed to the industry of the affiliate.
(v) The treatment of banks and other financial institutions
There are particular problems relating to the measurement of FDI in the finance sector. The level of banking activity by local branches may bear little relationship to the assets owned by the parent banks. FDI data sometimes mistakenly include the deposits made by a parent bank in its foreign affiliates. This can give rise to a substantial overestimation of FDI, as the motivation for such deposits may be a response to interest-rate differentials, fiscal changes or political uncertainty. Thus, it is recommended that deposits made by a parent bank in its branches or subsidiaries abroad not be classified as FDI. Similarly, the intra-company flows between affiliated entities engaged in financial intermediation should be excluded from FDI.
c. Accounting practices
(i) Historical valuation of FDI
A serious problem stems from the fact that data on FDI stocks usually represent the book value or historical costs of assets. This means that all assets are valued at the prices and exchange rates which prevailed at the time of acquisition. In a company's book of accounts, investments are recorded in terms of the prices paid at the time they were made and usually expressed in local currency units converted at the then-prevailing exchange rate.
This creates major difficulties if inflation or movements of exchange rates become significant. For economies with a significant inward or outward FDI stock established before 1970, the effect of high inflation in the 1970s has been complicated by the impact of dramatic exchange rate fluctuations in the 1980s. It is not possible to allow for these effects through the normal techniques of price indexing in a given currency, as the FDI data are neither at current nor constant prices and do not reflect a single exchange rate. This implies that cross-country comparisons of FDI data must be treated with caution. The United Nations System of National Accounts, the IMF and the Benchmark Definition of OECD recommend market values as the conceptual basis for valuation of stocks. Nevertheless, for practical purposes, OECD recognizes book values from the balance sheets of direct investment enterprises as the only widely available value for the estimation of stocks.
(ii) Methods of consolidation
Country rules differ as to how the transactions of the members of an enterprises group are to be consolidated. Foreign affiliates are divided into three categories: subsidiaries, associates and branches. Parent companies in most economies consolidate the accounts of subsidiaries, associates and branches in accordance with national accounting regulations. Such rules may differ from those of the recommended
World Investment Directory Volume X Africa 2008
50
definitions which suggest full consolidation. The reported FDI position of countries which do not adopt the fully consolidated system may be considerably understated.
(iii) Capital gains and losses
Some countries include realized capital gains and losses as affiliate income and, consequently, such figures may be represented in their FDI data under the category of reinvested earnings. Until recently, the United States had also included unrealized capital gains and losses in reinvested earnings. That was a major source of difficulty during the 1980s, when substantial exchange-rate fluctuations generated large unrealized capital gains and losses, which led to dramatic fluctuations in the United States FDI flow data. Such movements should be excluded from FDI figures as the changes in the investment position which they bring about are of a portfolio, or purely financial kind, rather than a change in FDI itself.
2. Corporate data
A transnational corporation is generally regarded as an enterprise comprising entities in more than one country which operate under a system of decision-making that permits coherent policies and a common strategy. The entities are so linked, by ownership or otherwise, that one or more of them may be able to exercise a significant influence over the others and, in particular, to share knowledge, resources and responsibilities with the others.
Once a TNC has been identified, it may be necessary to select the most important parent company for any given associate enterprise. Because the definition of a TNC does not specify majority control, it is possible for an enterprise to be an associate of more than one TNC. In such cases in the tables covering corporate data, enterprises have been treated as associates only of the parent with the highest percentage ownership.
Similarly, some TNCs are active in more than one industrial sector. Such TNCs are listed in the tables containing corporate data as being active only in the sector which is most predominant among its activities. In certain cases where a predominant activity could not be identified, the activities of TNCs have been listed as "diversified".
One of the most complex problems in the compilation of the data on TNCs is the identification of holding companies. In identifying such companies, attention was paid to the strategy of each holding company, including their definition of product or service offerings. If a holding company maintains a purely financial relationship with the companies that it holds, treating the companies themselves as its product, such a holding company would be classified as a financial institution. Alternatively, if a holding company actively involves itself in the management of the companies it holds, thereby treating the goods or services produced by those held companies as its own goods or services, such a holding company would be classified as being involved in the industrial sector of the companies it holds, and ranked accordingly.
Another problem with the corporate data presented in the tables arises from the fact that requirements for the consolidation of financial data differ between countries. Because TNCs, by their very nature, cross borders, the degree to which the financial data of any given TNC are consolidated is often uncertain. Therefore, the data on sales or assets of a foreign affiliate in the host country are not always compiled using the fully consolidated sales or assets of all foreign affiliates of its parent company. In most cases when data are reported on assets or sales of foreign affiliates or of domestically-based TNCs, the extent of consolidation is not known.
Technical introduction
51
3. Legal information
a. National framework
The regulatory framework for FDI in a country or territory consists of laws, regulations, official policy declarations and guidelines that are relevant to FDI and related fields. Naturally, the regulatory framework for FDI differs considerably between countries. Some countries have specific legal frameworks regulating FDI. Others, like the United States, have very few or no laws specifically dealing with FDI. Many developing countries regulate FDI explicitly by enacting investment codes, or by passing laws that deal with the establishment of public investment boards or similar institutions. Others have not enacted FDI-related legislation. Instead, they have enacted industry-specific laws which regulate FDI. Since investment flows are often concentrated in specific industries, the investment laws and regulations that cover these industries have been included in the table relating to the legal framework for TNCs, in addition to basic FDI laws when they were available.
In the country profiles prepared for this volume, the laws and regulations have been selected to cover, inter alia:
corporate law, including accounting and reporting regulations; incentives for, and restrictions on, FDI; mergers and acquisitions; securities; taxation (mainly corporate and individual income tax); transfer of technology; industrial/intellectual property; labour relations and employment; environmental protection.
Foreign exchange laws have been expressly omitted since this topic is fully covered in other specialized publication.1 Similarly, customs law has also been omitted-in view of the space limitations-since, compared to the other areas mentioned, it bears only on one aspect of FDI.
To the extent available, the laws and regulations are listed in chronological sequence. They are not presented according to the subject matter of the instrument because the diversity and complexity of the national legal systems prevent such a classification. Laws and regulations that cover two or more legal areas are not unusual.
The citation of laws and regulations includes their title, year of enactment, date of enforcement and source. Where possible, the official source has been cited. In cases where the source is presented in a language other than English, French or Spanish, another source containing the English (official or unofficial) translation has sometimes been added. It should be mentioned, however, that due to considerable difficulties in tracing, updating and, last but not least, translating the relevant national legal instruments, the legal information presented in the individual country profiles compiled for this volume should be considered as a best-effort attempt to cover the vast area of FDI-related legislation in the region.
b. International framework
The present volume contains information on four major legally-binding multilateral instruments. Each of those instruments deals with a specific issue that is considered to be of importance for relations between foreign direct investors and host countries, namely, the settlement of disputes between States
1 See for example, International Monetary Fund, Yearbook on Foreign Exchange Regulations (Washington, D.C., International Monetary Fund, various issues).
World Investment Directory Volume X Africa 2008
52
and investors from other States; the recognition and enforcement of foreign arbitral awards; industrial property rights; and investment guarantees for non-commercial risks (that is, expropriation).
With respect to bilateral treaties, this volume provides information on two types of treaties, namely, bilateral treaties for the promotion and protection of foreign investment (BITs) and bilateral treaties for the avoidance of double taxation (DTTs). The former deal exclusively with investment issues. The latter deal with a significant aspect of foreign investment management, namely, the avoidance of double taxation. Both types of treaties have been concluded in large numbers between countries from all regions of the world and are considered to be important policy instruments for the promotion of investment flows.
F. Glossary
1. FDI
An investment involving a long-term relationship and reflecting a lasting interest of a resident entity in one economy (direct investor) in an entity resident in an economy other than of the investor. The direct investor's purpose is to exert a significant degree of influence on the management of the enterprise resident in the other economy. FDI involves both the initial transaction between the two entities and all subsequent transactions between them and among affiliated enterprises, both incorporated and unincorporated. FDI may be undertaken by individuals, as well as business entities.
FDI flows
For associates and subsidiaries, FDI flows consist of the net sales of shares and loans (including non-cash acquisitions made against equipment, manufacturing rights, etc.) to the parent company plus the parent firm's share of the affiliate's reinvested earnings plus total net intra-company loans (short- and long-term) provided by the parent company.
For branches, FDI flows consist of the increase in reinvested earnings plus the net increase in funds received from the foreign direct investor.
FDI flows with a negative sign (reverse flows) indicate that at least one of the components in the above definition is negative and not offset by positive amounts of the remaining components.
Equity capital
The foreign direct investor's net purchase of the shares and loans of an enterprise in a country other than its own.
Reinvested earnings
The part of an affiliate's earnings accruing to the foreign investor that is reinvested in that enterprise.
Intra-company loans
Short- or long-term loans from parent firms to affiliate enterprises or vice versa. In the case of banks, deposits, bills and short-term loans are excluded.
FDI stock
For associate and subsidiary enterprises, it is the value of the share of their capital and reserves (including retained profits) attributable to the parent enterprise (this is equal to total assets minus total liabilities), plus the net indebtedness of the associate or subsidiary to the parent firm.
Technical introduction
53
For branches, it is the value of fixed assets and the value of current assets and investments, excluding amounts due from the parent, less liabilities to third parties.
2. Operations of TNCs
Total assets
Everything an incorporated or unincorporated enterprise owns which has a monetary value. The characteristics of assets are their control by the enterprise, the expectation that they will provide future benefits to the enterprise and that they are the outcome of a prior event or transaction. Total assets may be tangible (with physical substance, such as land and buildings) or intangible (without physical substance, such as patents and rights granted by a Government). The assets of a direct investment enterprise cover all the assets of the enterprise carried on its balance sheet, regardless of how they are financed; whether they are financed by the direct investors, or from other non-resident or resident sources.
Fixed assets are regarded as tangible assets with a useful life in excess of one year, which are used in the operation of a business enterprise and subject to depreciation. Current assets, on the other hand are regarded as tangible assets with a life of one year or less which can be readily turned into cash, for example, bank deposits, bills receivable and securities.
Employment
The figures reported for employment should include the number of full- and part-time employees on the payroll. The figures should not include contract and temporary employees who are not listed in the enterprise’s payroll. Ideally, figures for part-time employees should be reported on a full-time equivalent basis (FTE). However, where data on a full time equivalent basis are difficult to obtain, countries should use the number of persons employed.
Wages and salaries
"Wages and salaries include the value of any social contributions, income taxes, etc., payable by the employee even if they are actually withheld by the employer … and paid directly to social insurance schemes, tax authorities, etc., on behalf of the employee" (United Nations, The System of National
Accounts, 1993, paragraphs 7.31-7.32).
Sales
Sales and turnover are used interchangeably to mean the same thing. “Sales measures gross operating revenues less rebates, discounts and returns. Sales should be measured exclusive of consumption and sales taxes on consumers, and value added taxes” (European Commission, IMF, OECD, UN, UNCTAD and WTO, Manual on Statistics of International Trade in Services, Final draft, September 2001, paragraphs 4.48 and 4.50). Sales consist of all goods and services invoiced by an establishment or enterprise during the reporting period. They also include all other charges passed on to the customer, for transportation, packaging etc. The figure used for sales should be after any price reductions, discounts and rebates and credits for returned packaging. Other operating income, financial income and extraordinary income should not be included in sales.
Value added
The difference at each stage of production between the cost of a product and the cost of all capital and labour input or any other input used to make this product. It “measures the value created by production”. In essence, it is obtained by subtracting the value of inputs (the cost of materials, fuel and other supplies otherwise called intermediate consumption) from the value of an enterprise’s gross output. “Gross valued added is an unduplicated measure of output in which the value of the goods and services used as intermediate inputs are eliminated from the value of output” (United Nations, The System of
National Accounts, 1993, paragraphs 6.222 and 6.223).
World Investment Directory Volume X Africa 2008
54
Profits
Gross profit refers to total sales revenue less payments of wages, salaries, rents, costs of raw materials and other costs incurred in carrying out the operations of the enterprise. Net profit, on the other hand, refers to gross profit less interest on loans and depreciation.
Exports and imports
Exports should represent the value of the enterprise’s (or enterprise group’s) total exports of goods and services, including its exports to its foreign affiliates. Imports should similarly cover total imports of goods and services, including those from foreign affiliates.
Merchandise exports should include general merchandise, goods exported for processing, repairs on moveable goods owned by non-residents such as ships, aircraft etc., goods procured in ports (goods sold to non-resident carriers – ships, aircraft etc.), and nonmonetary gold. (Repairs on goods are valued at the prices – the fees paid for the repairs and not the gross value of the goods.) Merchandise exports should be valued free on board (f.o.b.) at the frontier of the exporting country (IMF, Balance of
Payments Manual, chapter X). Merchandise imports should also include general merchandise, goods imported for processing, repairs on the enterprise’s moveable goods performed by non-residents, goods procured in foreign ports by those enterprises which are international carriers, and imports of non-monetary gold. Merchandise imports should also be valued f.o.b. at the frontier of the exporting country (IMF, Balance of Payments Manual, chapter X).
Exports and imports of services cover the enterprise’s exports and imports of transportation and travel services, communications, construction, insurance, financial, computer and information services, royalties and license fees, and other business, personal, cultural and recreational services. Exports should also include any sales which the enterprise makes to foreign embassies and international institutions located in its country (IMF, Balance of Payments Manual, chapters XI, XII, and XIII).
R&D expenditures
“Research and development by a market producer is an activity undertaken for the purpose of discovering or developing new products, including improved versions or qualities of existing products, or discovering or developing new or more efficient processes of production” (United Nations, The
System of National Accounts, 1993, paragraph 6.142). In the case of inward investment, direct investment enterprises should be asked to report total R&D spending within the host economy during the reporting period.
R&D employment
Data for the number of researchers are on the same basis as data for total employment. The data include all employees engaged in R&D.
Royalty payments
Monetary payments for the use of copyrighted or patented materials and production processes, or payments for the right of extraction of natural resources to the owner of these materials, processes or resources. These may be payments to a Government or to another business enterprise.
Royalty receipts
Receipts of monies for allowing the use of copyrighted or patented materials and production processes, or receipts from providing the right of extraction of natural resources by the owner of these materials, processes or resources. The owner may be a Government or another business enterprise.
Technical introduction
55
3. The structure of TNCs
A TNC is an enterprise, which is irrespective of its country of origin and its ownership, including private, public or mixed, which comprises entities located in two or more countries which are linked, by ownership or otherwise, such that one or more of them may be able to exercise significant influence over the activities of others and, in particular, to share knowledge, resources and responsibilities with the others. TNCs operate under a system of decision making which permits coherent policies and a common strategy through one or more decision-making centres. This definition does not regard the legal form and fields of activity of these entities. In the above definition, the term "entities" refers to both parent enterprises, defined below, and other enterprises.
For working purposes, the UNCTAD considers a "transnational corporation" to be an entity controlling assets abroad.
Parent enterprise
An incorporated or unincorporated enterprise, or group of enterprises, which has a direct investment enterprise operating in a country other than that of the parent enterprise.
Affiliate enterprise
An incorporated or unincorporated enterprise in which a foreign investor has an effective voice in management. Such an enterprise may be a subsidiary, associate or branch (defined below).
Subsidiary enterprise
An incorporated enterprise in the host country in which another entity directly owns more than half of the shareholders' voting power, or is a shareholder in the enterprise, and has the right to appoint or remove a majority of the members of the administrative, management or supervisory body.
Associate enterprise
An incorporated enterprise in the host country in which an investor, together with its subsidiaries and associates, owns a total of at least 10 per cent, but not more than half, of the shareholders' voting power (the figure may be less than 10 per cent if there is evidence of an effective voice in management).
Branch
An unincorporated enterprise in the host country which is one of the following: (i) a permanent establishment or office of the foreign investor; (ii) an unincorporated partnership or joint venture (defined below) between the foreign direct investor and one or more third parties; (iii) land, structures (except structures owned by government entities), and/or immovable equipment and objects directly owned by a foreign resident; (iv) mobile equipment (such as ships, aircraft, gas or oil-drilling rigs) operating within a country other than that of the foreign investor for at least one year.
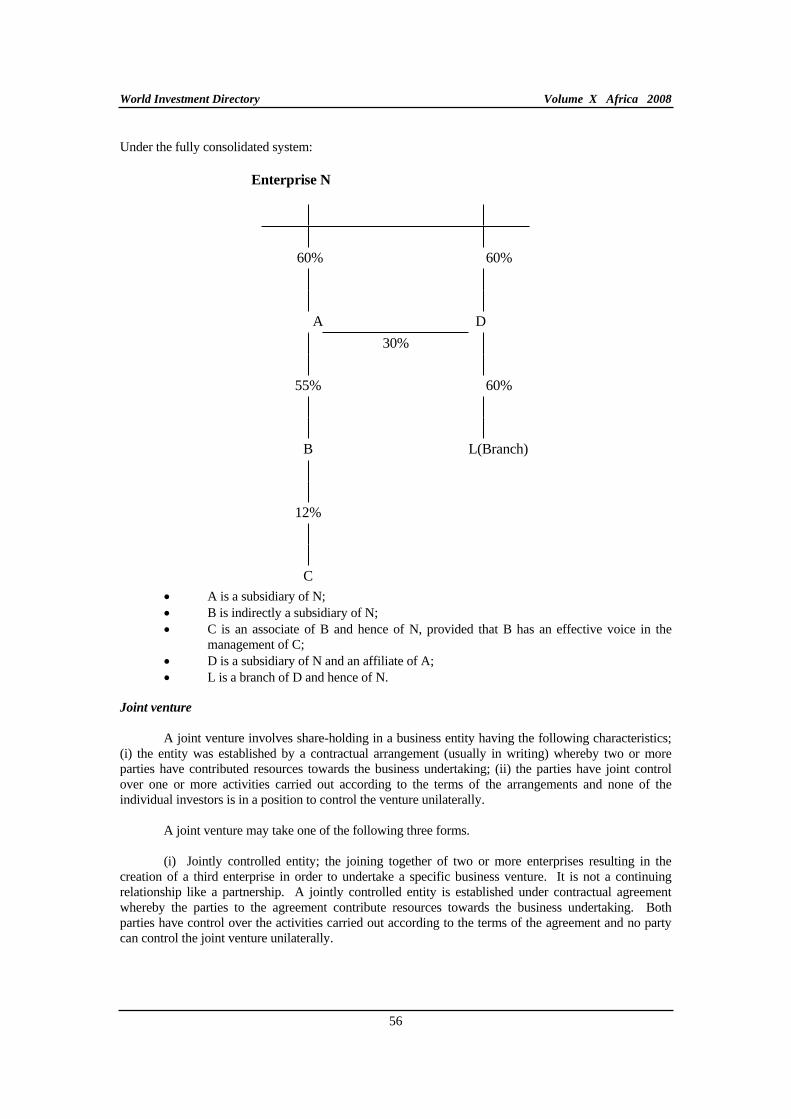
World Investment Directory Volume X Africa 2008
56
Under the fully consolidated system:
Enterprise N
60% 60%
A D
30%
55% 60%
B L(Branch)
12%
C A is a subsidiary of N; B is indirectly a subsidiary of N; C is an associate of B and hence of N, provided that B has an effective voice in the
management of C; D is a subsidiary of N and an affiliate of A; L is a branch of D and hence of N.
Joint venture
A joint venture involves share-holding in a business entity having the following characteristics; (i) the entity was established by a contractual arrangement (usually in writing) whereby two or more parties have contributed resources towards the business undertaking; (ii) the parties have joint control over one or more activities carried out according to the terms of the arrangements and none of the individual investors is in a position to control the venture unilaterally.
A joint venture may take one of the following three forms.
(i) Jointly controlled entity; the joining together of two or more enterprises resulting in the creation of a third enterprise in order to undertake a specific business venture. It is not a continuing relationship like a partnership. A jointly controlled entity is established under contractual agreement whereby the parties to the agreement contribute resources towards the business undertaking. Both parties have control over the activities carried out according to the terms of the agreement and no party can control the joint venture unilaterally.
Technical introduction
57
(ii) Jointly controlled assets: the coordinated use of parts of the investors' enterprises in order to work on a common project which does not form separate entity, and which operates with a loose organizational structure. The assets and expertise of each partner remain under the direct control of that partner.
(iii) Jointly controlled operation: the contribution of resources by investors to a joint venture project which is managed by either one of the investors or by a joint management team. In such a venture, a joint venture agreement defines the terms of the project, and each investor possesses an undivided interest in the assets of the project.
Holding company
A corporation that owns voting stock in another corporation and is able to influence its board of directors, and therefore control its policies and management. A holding company need not own a majority of the shares of the corporation or be involved in activities similar to those of the company it holds.

COUNTRY PROFILES

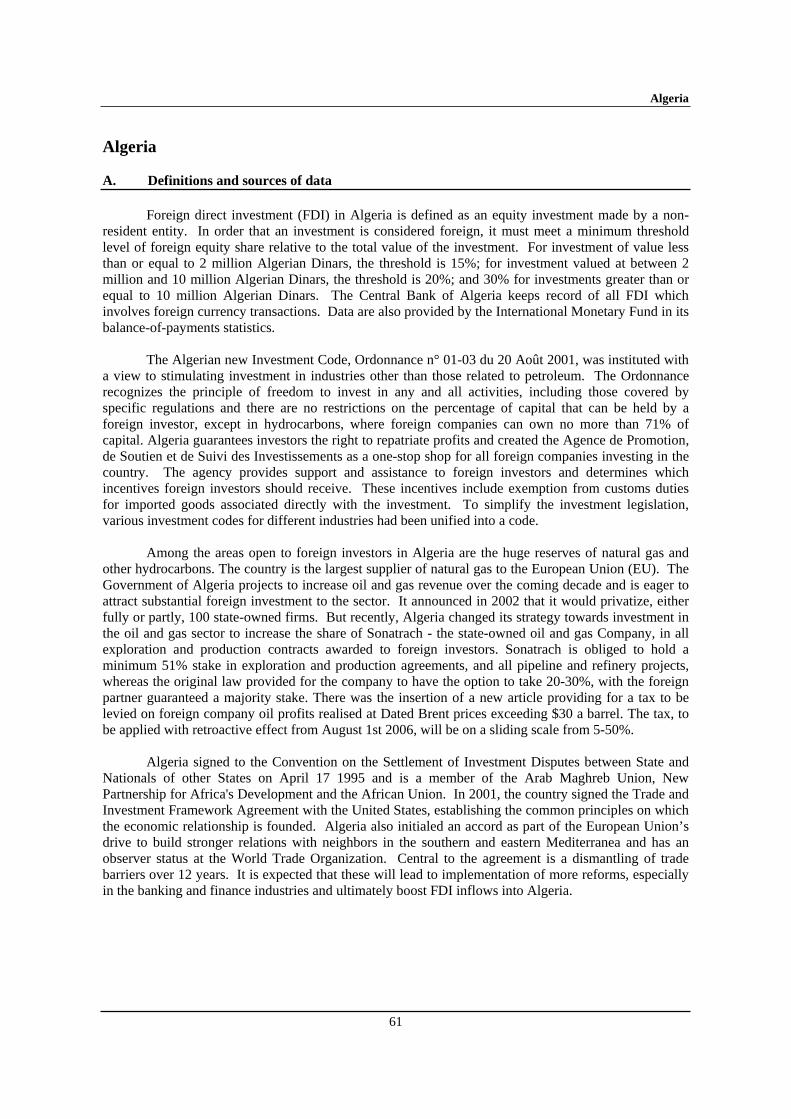
Algeria
61
Algeria
A. Definitions and sources of data
Foreign direct investment (FDI) in Algeria is defined as an equity investment made by a non-resident entity. In order that an investment is considered foreign, it must meet a minimum threshold level of foreign equity share relative to the total value of the investment. For investment of value less than or equal to 2 million Algerian Dinars, the threshold is 15%; for investment valued at between 2 million and 10 million Algerian Dinars, the threshold is 20%; and 30% for investments greater than or equal to 10 million Algerian Dinars. The Central Bank of Algeria keeps record of all FDI which involves foreign currency transactions. Data are also provided by the International Monetary Fund in its balance-of-payments statistics.
The Algerian new Investment Code, Ordonnance n° 01-03 du 20 Août 2001, was instituted with a view to stimulating investment in industries other than those related to petroleum. The Ordonnance recognizes the principle of freedom to invest in any and all activities, including those covered by specific regulations and there are no restrictions on the percentage of capital that can be held by a foreign investor, except in hydrocarbons, where foreign companies can own no more than 71% of capital. Algeria guarantees investors the right to repatriate profits and created the Agence de Promotion, de Soutien et de Suivi des Investissements as a one-stop shop for all foreign companies investing in the country. The agency provides support and assistance to foreign investors and determines which incentives foreign investors should receive. These incentives include exemption from customs duties for imported goods associated directly with the investment. To simplify the investment legislation, various investment codes for different industries had been unified into a code.
Among the areas open to foreign investors in Algeria are the huge reserves of natural gas and other hydrocarbons. The country is the largest supplier of natural gas to the European Union (EU). The Government of Algeria projects to increase oil and gas revenue over the coming decade and is eager to attract substantial foreign investment to the sector. It announced in 2002 that it would privatize, either fully or partly, 100 state-owned firms. But recently, Algeria changed its strategy towards investment in the oil and gas sector to increase the share of Sonatrach - the state-owned oil and gas Company, in all exploration and production contracts awarded to foreign investors. Sonatrach is obliged to hold a minimum 51% stake in exploration and production agreements, and all pipeline and refinery projects, whereas the original law provided for the company to have the option to take 20-30%, with the foreign partner guaranteed a majority stake. There was the insertion of a new article providing for a tax to be levied on foreign company oil profits realised at Dated Brent prices exceeding $30 a barrel. The tax, to be applied with retroactive effect from August 1st 2006, will be on a sliding scale from 5-50%.
Algeria signed to the Convention on the Settlement of Investment Disputes between State and Nationals of other States on April 17 1995 and is a member of the Arab Maghreb Union, New Partnership for Africa's Development and the African Union. In 2001, the country signed the Trade and Investment Framework Agreement with the United States, establishing the common principles on which the economic relationship is founded. Algeria also initialed an accord as part of the European Union’s drive to build stronger relations with neighbors in the southern and eastern Mediterranea and has an observer status at the World Trade Organization. Central to the agreement is a dismantling of trade barriers over 12 years. It is expected that these will lead to implementation of more reforms, especially in the banking and finance industries and ultimately boost FDI inflows into Algeria.
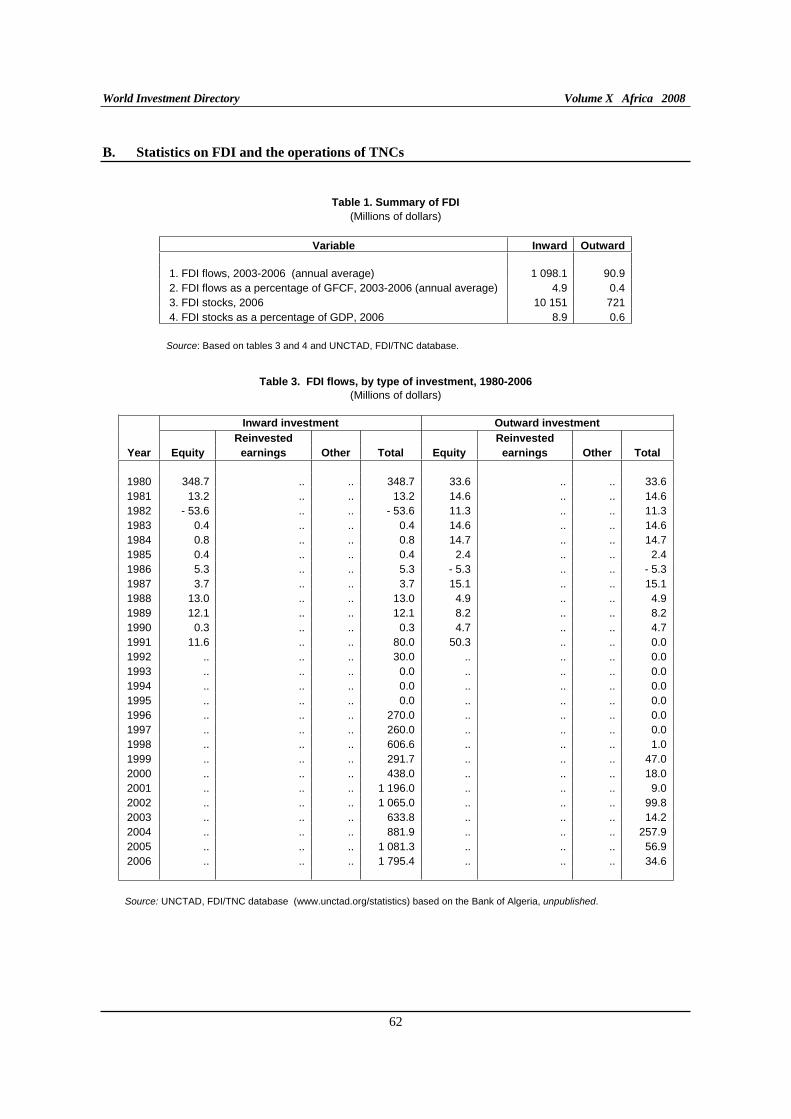
World Investment Directory Volume X Africa 2008
62
B. Statistics on FDI and the operations of TNCs
Table 1. Summary of FDI
(Millions of dollars)
Variable Inward Outward
1. FDI flows, 2003-2006 (annual average) 1 098.1 90.9 2. FDI flows as a percentage of GFCF, 2003-2006 (annual average) 4.9 0.4 3. FDI stocks, 2006 10 151 721 4. FDI stocks as a percentage of GDP, 2006 8.9 0.6 Source: Based on tables 3 and 4 and UNCTAD, FDI/TNC database.
Table 3. FDI flows, by type of investment, 1980-2006
(Millions of dollars)
Inward investment Outward investment
Reinvested Reinvested
Year Equity earnings Other Total Equity earnings Other Total
1980 348.7 .. .. 348.7 33.6 .. .. 33.6 1981 13.2 .. .. 13.2 14.6 .. .. 14.6 1982 - 53.6 .. .. - 53.6 11.3 .. .. 11.3 1983 0.4 .. .. 0.4 14.6 .. .. 14.6 1984 0.8 .. .. 0.8 14.7 .. .. 14.7 1985 0.4 .. .. 0.4 2.4 .. .. 2.4 1986 5.3 .. .. 5.3 - 5.3 .. .. - 5.3 1987 3.7 .. .. 3.7 15.1 .. .. 15.1 1988 13.0 .. .. 13.0 4.9 .. .. 4.9 1989 12.1 .. .. 12.1 8.2 .. .. 8.2 1990 0.3 .. .. 0.3 4.7 .. .. 4.7 1991 11.6 .. .. 80.0 50.3 .. .. 0.0 1992 .. .. .. 30.0 .. .. .. 0.0 1993 .. .. .. 0.0 .. .. .. 0.0 1994 .. .. .. 0.0 .. .. .. 0.0 1995 .. .. .. 0.0 .. .. .. 0.0 1996 .. .. .. 270.0 .. .. .. 0.0 1997 .. .. .. 260.0 .. .. .. 0.0 1998 .. .. .. 606.6 .. .. .. 1.0 1999 .. .. .. 291.7 .. .. .. 47.0 2000 .. .. .. 438.0 .. .. .. 18.0 2001 .. .. .. 1 196.0 .. .. .. 9.0 2002 .. .. .. 1 065.0 .. .. .. 99.8 2003 .. .. .. 633.8 .. .. .. 14.2 2004 .. .. .. 881.9 .. .. .. 257.9 2005 .. .. .. 1 081.3 .. .. .. 56.9 2006 .. .. .. 1 795.4 .. .. .. 34.6 Source: UNCTAD, FDI/TNC database (www.unctad.org/statistics) based on the Bank of Algeria, unpublished.
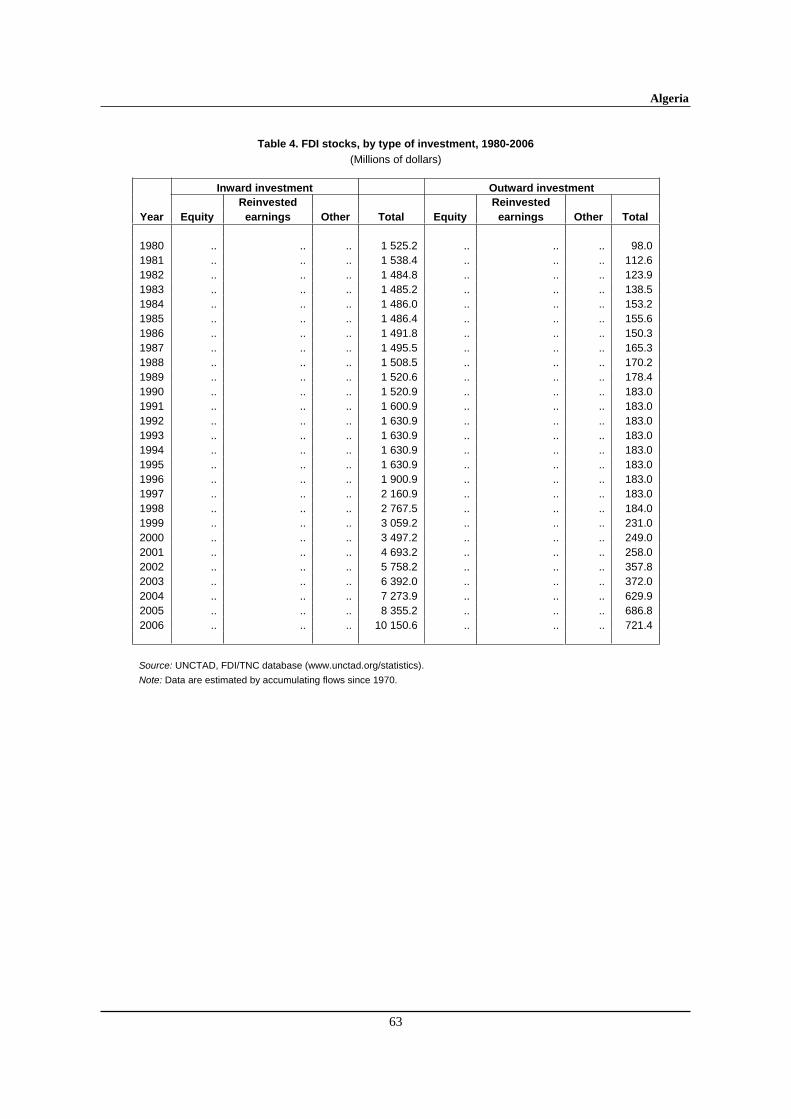
Algeria
63
Table 4. FDI stocks, by type of investment, 1980-2006
(Millions of dollars)
Inward investment Outward investment
Reinvested Reinvested
Year Equity earnings Other Total Equity earnings Other Total
1980 .. .. .. 1 525.2 .. .. .. 98.0 1981 .. .. .. 1 538.4 .. .. .. 112.6 1982 .. .. .. 1 484.8 .. .. .. 123.9 1983 .. .. .. 1 485.2 .. .. .. 138.5 1984 .. .. .. 1 486.0 .. .. .. 153.2 1985 .. .. .. 1 486.4 .. .. .. 155.6 1986 .. .. .. 1 491.8 .. .. .. 150.3 1987 .. .. .. 1 495.5 .. .. .. 165.3 1988 .. .. .. 1 508.5 .. .. .. 170.2 1989 .. .. .. 1 520.6 .. .. .. 178.4 1990 .. .. .. 1 520.9 .. .. .. 183.0 1991 .. .. .. 1 600.9 .. .. .. 183.0 1992 .. .. .. 1 630.9 .. .. .. 183.0 1993 .. .. .. 1 630.9 .. .. .. 183.0 1994 .. .. .. 1 630.9 .. .. .. 183.0 1995 .. .. .. 1 630.9 .. .. .. 183.0 1996 .. .. .. 1 900.9 .. .. .. 183.0 1997 .. .. .. 2 160.9 .. .. .. 183.0 1998 .. .. .. 2 767.5 .. .. .. 184.0 1999 .. .. .. 3 059.2 .. .. .. 231.0 2000 .. .. .. 3 497.2 .. .. .. 249.0 2001 .. .. .. 4 693.2 .. .. .. 258.0 2002 .. .. .. 5 758.2 .. .. .. 357.8 2003 .. .. .. 6 392.0 .. .. .. 372.0 2004 .. .. .. 7 273.9 .. .. .. 629.9 2005 .. .. .. 8 355.2 .. .. .. 686.8 2006 .. .. .. 10 150.6 .. .. .. 721.4 Source: UNCTAD, FDI/TNC database (www.unctad.org/statistics).
Note: Data are estimated by accumulating flows since 1970.
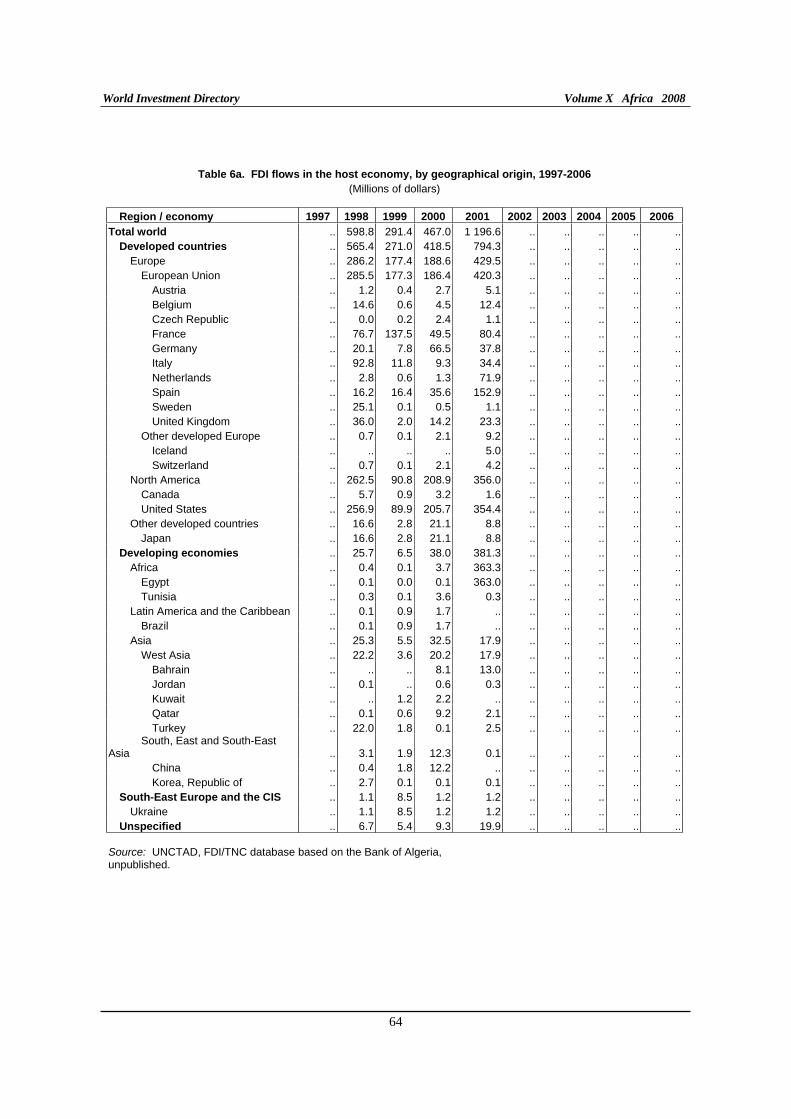
World Investment Directory Volume X Africa 2008
64
Table 6a. FDI flows in the host economy, by geographical origin, 1997-2006
(Millions of dollars)
Region / economy 1997 1998 1999 2000 2001 2002 2003 2004 2005 2006
Total world .. 598.8 291.4 467.0 1 196.6 .. .. .. .. ..Developed countries .. 565.4 271.0 418.5 794.3 .. .. .. .. ..
Europe .. 286.2 177.4 188.6 429.5 .. .. .. .. ..European Union .. 285.5 177.3 186.4 420.3 .. .. .. .. ..
Austria .. 1.2 0.4 2.7 5.1 .. .. .. .. ..Belgium .. 14.6 0.6 4.5 12.4 .. .. .. .. ..Czech Republic .. 0.0 0.2 2.4 1.1 .. .. .. .. ..France .. 76.7 137.5 49.5 80.4 .. .. .. .. ..Germany .. 20.1 7.8 66.5 37.8 .. .. .. .. ..Italy .. 92.8 11.8 9.3 34.4 .. .. .. .. ..Netherlands .. 2.8 0.6 1.3 71.9 .. .. .. .. ..Spain .. 16.2 16.4 35.6 152.9 .. .. .. .. ..Sweden .. 25.1 0.1 0.5 1.1 .. .. .. .. ..United Kingdom .. 36.0 2.0 14.2 23.3 .. .. .. .. ..
Other developed Europe .. 0.7 0.1 2.1 9.2 .. .. .. .. ..Iceland .. .. .. .. 5.0 .. .. .. .. ..Switzerland .. 0.7 0.1 2.1 4.2 .. .. .. .. ..
North America .. 262.5 90.8 208.9 356.0 .. .. .. .. ..Canada .. 5.7 0.9 3.2 1.6 .. .. .. .. ..United States .. 256.9 89.9 205.7 354.4 .. .. .. .. ..
Other developed countries .. 16.6 2.8 21.1 8.8 .. .. .. .. ..Japan .. 16.6 2.8 21.1 8.8 .. .. .. .. ..
Developing economies .. 25.7 6.5 38.0 381.3 .. .. .. .. ..Africa .. 0.4 0.1 3.7 363.3 .. .. .. .. ..
Egypt .. 0.1 0.0 0.1 363.0 .. .. .. .. ..Tunisia .. 0.3 0.1 3.6 0.3 .. .. .. .. ..
Latin America and the Caribbean .. 0.1 0.9 1.7 .. .. .. .. .. ..Brazil .. 0.1 0.9 1.7 .. .. .. .. .. ..
Asia .. 25.3 5.5 32.5 17.9 .. .. .. .. ..West Asia .. 22.2 3.6 20.2 17.9 .. .. .. .. ..
Bahrain .. .. .. 8.1 13.0 .. .. .. .. ..Jordan .. 0.1 .. 0.6 0.3 .. .. .. .. ..Kuwait .. .. 1.2 2.2 .. .. .. .. .. ..Qatar .. 0.1 0.6 9.2 2.1 .. .. .. .. ..Turkey .. 22.0 1.8 0.1 2.5 .. .. .. .. ..
South, East and South-East Asia .. 3.1 1.9 12.3 0.1 .. .. .. .. ..
China .. 0.4 1.8 12.2 .. .. .. .. .. ..Korea, Republic of .. 2.7 0.1 0.1 0.1 .. .. .. .. ..
South-East Europe and the CIS .. 1.1 8.5 1.2 1.2 .. .. .. .. ..Ukraine .. 1.1 8.5 1.2 1.2 .. .. .. .. ..
Unspecified .. 6.7 5.4 9.3 19.9 .. .. .. .. .. Source: UNCTAD, FDI/TNC database based on the Bank of Algeria, unpublished.
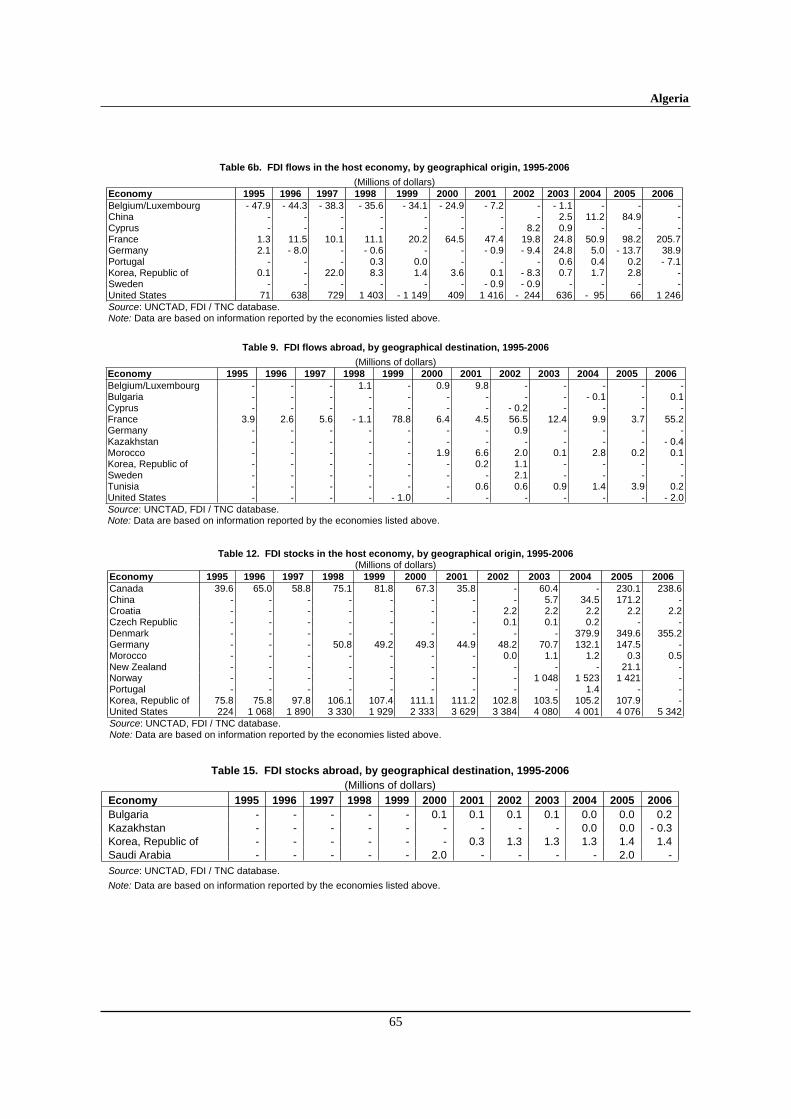
Algeria
65
Table 6b. FDI flows in the host economy, by geographical origin, 1995-2006
(Millions of dollars) Economy 1995 1996 1997 1998 1999 2000 2001 2002 2003 2004 2005 2006 Belgium/Luxembourg - 47.9 - 44.3 - 38.3 - 35.6 - 34.1 - 24.9 - 7.2 - - 1.1 - - -China - - - - - - - - 2.5 11.2 84.9 -Cyprus - - - - - - - 8.2 0.9 - - -France 1.3 11.5 10.1 11.1 20.2 64.5 47.4 19.8 24.8 50.9 98.2 205.7Germany 2.1 - 8.0 - - 0.6 - - - 0.9 - 9.4 24.8 5.0 - 13.7 38.9Portugal - - - 0.3 0.0 - - - 0.6 0.4 0.2 - 7.1Korea, Republic of 0.1 - 22.0 8.3 1.4 3.6 0.1 - 8.3 0.7 1.7 2.8 -Sweden - - - - - - - 0.9 - 0.9 - - - -United States 71 638 729 1 403 - 1 149 409 1 416 - 244 636 - 95 66 1 246Source: UNCTAD, FDI / TNC database. Note: Data are based on information reported by the economies listed above.
Table 9. FDI flows abroad, by geographical destination, 1995-2006
(Millions of dollars) Economy 1995 1996 1997 1998 1999 2000 2001 2002 2003 2004 2005 2006 Belgium/Luxembourg - - - 1.1 - 0.9 9.8 - - - - -Bulgaria - - - - - - - - - - 0.1 - 0.1Cyprus - - - - - - - - 0.2 - - - -France 3.9 2.6 5.6 - 1.1 78.8 6.4 4.5 56.5 12.4 9.9 3.7 55.2Germany - - - - - - - 0.9 - - - -Kazakhstan - - - - - - - - - - - - 0.4Morocco - - - - - 1.9 6.6 2.0 0.1 2.8 0.2 0.1Korea, Republic of - - - - - - 0.2 1.1 - - - -Sweden - - - - - - - 2.1 - - - -Tunisia - - - - - - 0.6 0.6 0.9 1.4 3.9 0.2United States - - - - - 1.0 - - - - - - - 2.0Source: UNCTAD, FDI / TNC database. Note: Data are based on information reported by the economies listed above.
Table 12. FDI stocks in the host economy, by geographical origin, 1995-2006 (Millions of dollars)
Economy 1995 1996 1997 1998 1999 2000 2001 2002 2003 2004 2005 2006 Canada 39.6 65.0 58.8 75.1 81.8 67.3 35.8 - 60.4 - 230.1 238.6China - - - - - - - - 5.7 34.5 171.2 -Croatia - - - - - - - 2.2 2.2 2.2 2.2 2.2Czech Republic - - - - - - - 0.1 0.1 0.2 - -Denmark - - - - - - - - - 379.9 349.6 355.2Germany - - - 50.8 49.2 49.3 44.9 48.2 70.7 132.1 147.5 -Morocco - - - - - - - 0.0 1.1 1.2 0.3 0.5New Zealand - - - - - - - - - - 21.1 -Norway - - - - - - - - 1 048 1 523 1 421 -Portugal - - - - - - - - - 1.4 - -Korea, Republic of 75.8 75.8 97.8 106.1 107.4 111.1 111.2 102.8 103.5 105.2 107.9 -United States 224 1 068 1 890 3 330 1 929 2 333 3 629 3 384 4 080 4 001 4 076 5 342Source: UNCTAD, FDI / TNC database. Note: Data are based on information reported by the economies listed above.
Table 15. FDI stocks abroad, by geographical destination, 1995-2006
(Millions of dollars) Economy 1995 1996 1997 1998 1999 2000 2001 2002 2003 2004 2005 2006
Bulgaria - - - - - 0.1 0.1 0.1 0.1 0.0 0.0 0.2 Kazakhstan - - - - - - - - - 0.0 0.0 - 0.3 Korea, Republic of - - - - - - 0.3 1.3 1.3 1.3 1.4 1.4 Saudi Arabia - - - - - 2.0 - - - - 2.0 -
Source: UNCTAD, FDI / TNC database.
Note: Data are based on information reported by the economies listed above.
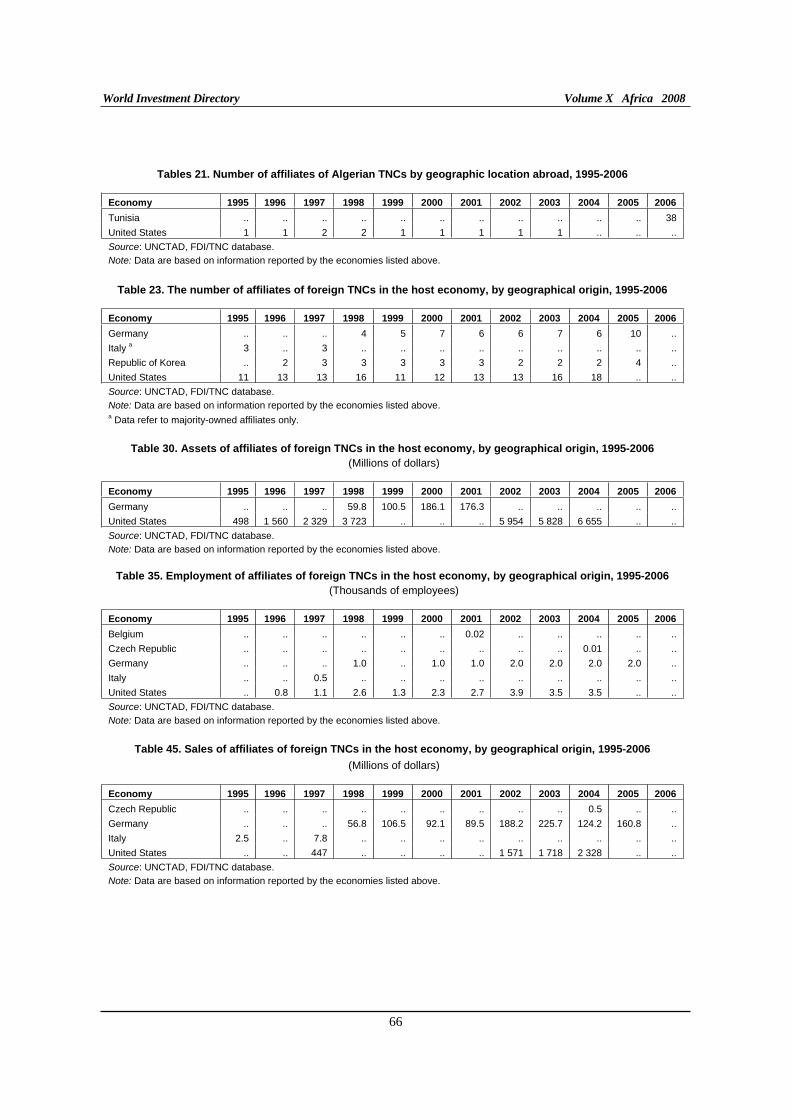
World Investment Directory Volume X Africa 2008
66
Tables 21. Number of affiliates of Algerian TNCs by geographic location abroad, 1995-2006
Economy 1995 1996 1997 1998 1999 2000 2001 2002 2003 2004 2005 2006
Tunisia .. .. .. .. .. .. .. .. .. .. .. 38
United States 1 1 2 2 1 1 1 1 1 .. .. ..
Source: UNCTAD, FDI/TNC database.
Note: Data are based on information reported by the economies listed above.
Table 23. The number of affiliates of foreign TNCs in the host economy, by geographical origin, 1995-2006
Economy 1995 1996 1997 1998 1999 2000 2001 2002 2003 2004 2005 2006
Germany .. .. .. 4 5 7 6 6 7 6 10 ..
Italy a 3 .. 3 .. .. .. .. .. .. .. .. ..
Republic of Korea .. 2 3 3 3 3 3 2 2 2 4 ..
United States 11 13 13 16 11 12 13 13 16 18 .. ..
Source: UNCTAD, FDI/TNC database.
Note: Data are based on information reported by the economies listed above. a Data refer to majority-owned affiliates only.
Table 30. Assets of affiliates of foreign TNCs in the host economy, by geographical origin, 1995-2006
(Millions of dollars)
Economy 1995 1996 1997 1998 1999 2000 2001 2002 2003 2004 2005 2006
Germany .. .. .. 59.8 100.5 186.1 176.3 .. .. .. .. ..
United States 498 1 560 2 329 3 723 .. .. .. 5 954 5 828 6 655 .. ..
Source: UNCTAD, FDI/TNC database.
Note: Data are based on information reported by the economies listed above.
Table 35. Employment of affiliates of foreign TNCs in the host economy, by geographical origin, 1995-2006
(Thousands of employees)
Economy 1995 1996 1997 1998 1999 2000 2001 2002 2003 2004 2005 2006
Belgium .. .. .. .. .. .. 0.02 .. .. .. .. ..
Czech Republic .. .. .. .. .. .. .. .. .. 0.01 .. ..
Germany .. .. .. 1.0 .. 1.0 1.0 2.0 2.0 2.0 2.0 ..
Italy .. .. 0.5 .. .. .. .. .. .. .. .. ..
United States .. 0.8 1.1 2.6 1.3 2.3 2.7 3.9 3.5 3.5 .. ..
Source: UNCTAD, FDI/TNC database.
Note: Data are based on information reported by the economies listed above.
Table 45. Sales of affiliates of foreign TNCs in the host economy, by geographical origin, 1995-2006
(Millions of dollars)
Economy 1995 1996 1997 1998 1999 2000 2001 2002 2003 2004 2005 2006
Czech Republic .. .. .. .. .. .. .. .. .. 0.5 .. ..
Germany .. .. .. 56.8 106.5 92.1 89.5 188.2 225.7 124.2 160.8 ..
Italy 2.5 .. 7.8 .. .. .. .. .. .. .. .. ..
United States .. .. 447 .. .. .. .. 1 571 1 718 2 328 .. ..
Source: UNCTAD, FDI/TNC database.
Note: Data are based on information reported by the economies listed above.
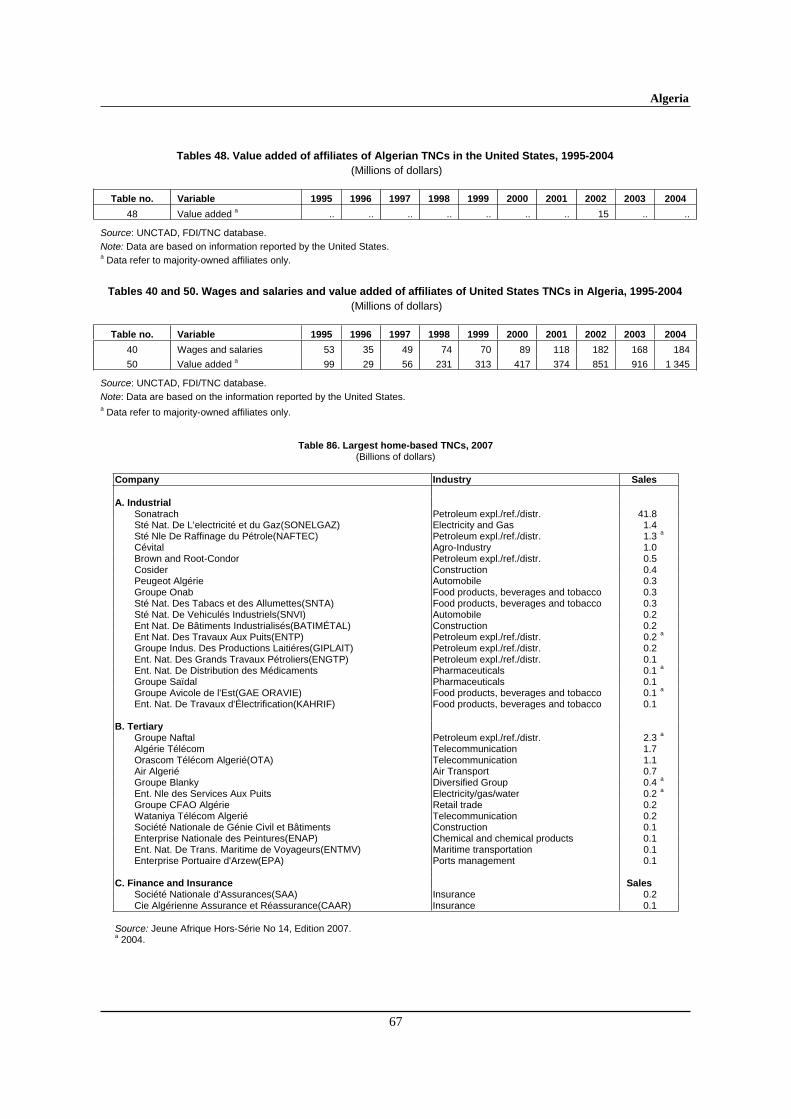
Algeria
67
Tables 48. Value added of affiliates of Algerian TNCs in the United States, 1995-2004
(Millions of dollars)
Table no. Variable 1995 1996 1997 1998 1999 2000 2001 2002 2003 2004
48 Value added a .. .. .. .. .. .. .. 15 .. ..
Source: UNCTAD, FDI/TNC database.
Note: Data are based on information reported by the United States. a Data refer to majority-owned affiliates only.
Tables 40 and 50. Wages and salaries and value added of affiliates of United States TNCs in Algeria, 1995-2004
(Millions of dollars)
Table no. Variable 1995 1996 1997 1998 1999 2000 2001 2002 2003 2004
40 Wages and salaries 53 35 49 74 70 89 118 182 168 184
50 Value added a 99 29 56 231 313 417 374 851 916 1 345
Source: UNCTAD, FDI/TNC database.
Note: Data are based on the information reported by the United States. a Data refer to majority-owned affiliates only.
Table 86. Largest home-based TNCs, 2007 (Billions of dollars)
Company Industry Sales
A. Industrial
Sonatrach Petroleum expl./ref./distr. 41.8Sté Nat. De L'electricité et du Gaz(SONELGAZ) Electricity and Gas 1.4Sté Nle De Raffinage du Pétrole(NAFTEC) Petroleum expl./ref./distr. 1.3 a
Cévital Agro-Industry 1.0Brown and Root-Condor Petroleum expl./ref./distr. 0.5Cosider Construction 0.4Peugeot Algérie Automobile 0.3Groupe Onab Food products, beverages and tobacco 0.3Sté Nat. Des Tabacs et des Allumettes(SNTA) Food products, beverages and tobacco 0.3Sté Nat. De Vehiculés Industriels(SNVI) Automobile 0.2Ent Nat. De Bâtiments Industrialisés(BATIMÉTAL) Construction 0.2Ent Nat. Des Travaux Aux Puits(ENTP) Petroleum expl./ref./distr. 0.2 a
Groupe Indus. Des Productions Laitiéres(GIPLAIT) Petroleum expl./ref./distr. 0.2Ent. Nat. Des Grands Travaux Pétroliers(ENGTP) Petroleum expl./ref./distr. 0.1Ent. Nat. De Distribution des Médicaments Pharmaceuticals 0.1 a
Groupe Saïdal Pharmaceuticals 0.1Groupe Avicole de l'Est(GAE ORAVIE) Food products, beverages and tobacco 0.1 a
Ent. Nat. De Travaux d'Électrification(KAHRIF) Food products, beverages and tobacco 0.1
B. Tertiary Groupe Naftal Petroleum expl./ref./distr. 2.3 a
Algérie Télécom Telecommunication 1.7 Orascom Télécom Algerié(OTA) Telecommunication 1.1Air Algerié Air Transport 0.7Groupe Blanky Diversified Group 0.4 a
Ent. Nle des Services Aux Puits Electricity/gas/water 0.2 a
Groupe CFAO Algérie Retail trade 0.2Wataniya Télécom Algerié Telecommunication 0.2Société Nationale de Génie Civil et Bâtiments Construction 0.1Enterprise Nationale des Peintures(ENAP) Chemical and chemical products 0.1Ent. Nat. De Trans. Maritime de Voyageurs(ENTMV) Maritime transportation 0.1Enterprise Portuaire d'Arzew(EPA) Ports management 0.1
C. Finance and Insurance Sales
Société Nationale d'Assurances(SAA) Insurance 0.2Cie Algérienne Assurance et Réassurance(CAAR) Insurance 0.1
Source: Jeune Afrique Hors-Série No 14, Edition 2007.a 2004.
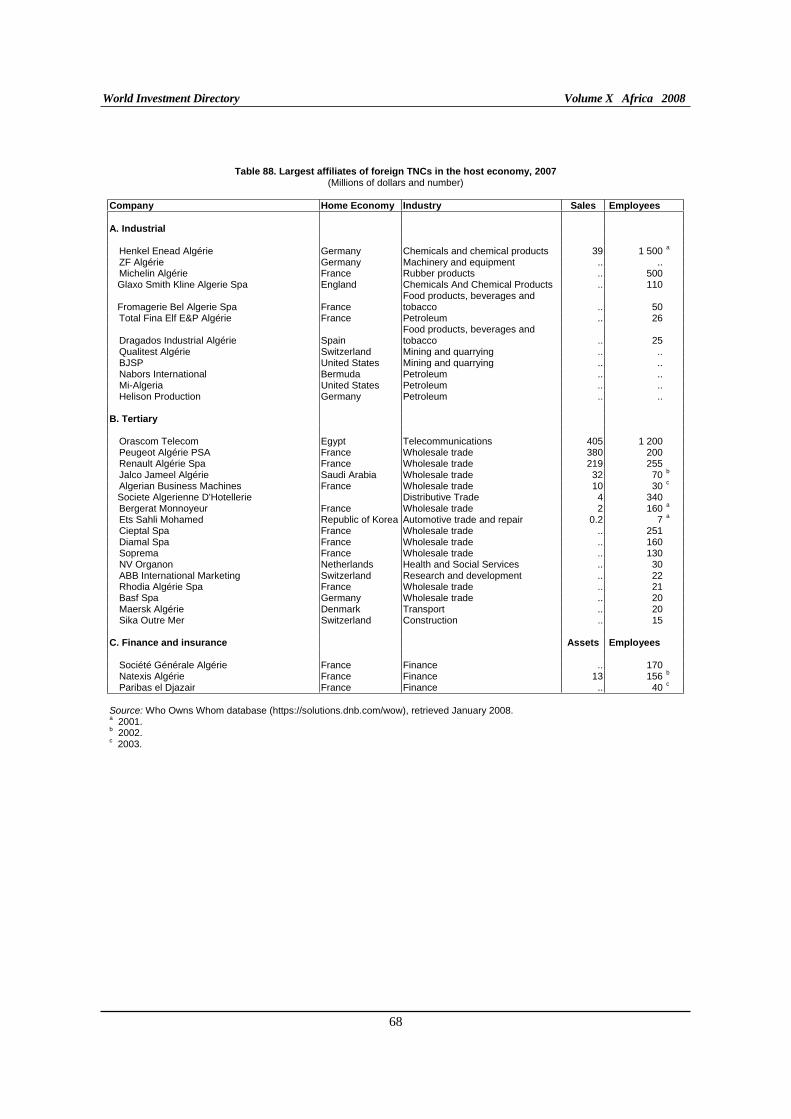
World Investment Directory Volume X Africa 2008
68
Table 88. Largest affiliates of foreign TNCs in the host economy, 2007 (Millions of dollars and number)
Company Home Economy Industry Sales Employees A. Industrial
Henkel Enead Algérie Germany Chemicals and chemical products 39 1 500 a
ZF Algérie Germany Machinery and equipment .. ..Michelin Algérie France Rubber products .. 500
Glaxo Smith Kline Algerie Spa England Chemicals And Chemical Products .. 110
Fromagerie Bel Algerie Spa France Food products, beverages and tobacco .. 50
Total Fina Elf E&P Algérie France Petroleum .. 26
Dragados Industrial Algérie Spain Food products, beverages and tobacco .. 25
Qualitest Algérie Switzerland Mining and quarrying .. ..BJSP United States Mining and quarrying .. ..Nabors International Bermuda Petroleum .. ..Mi-Algeria United States Petroleum .. ..Helison Production Germany Petroleum .. ..
B. Tertiary
Orascom Telecom Egypt Telecommunications 405 1 200Peugeot Algérie PSA France Wholesale trade 380 200Renault Algérie Spa France Wholesale trade 219 255Jalco Jameel Algérie Saudi Arabia Wholesale trade 32 70 b
Algerian Business Machines France Wholesale trade 10 30 c
Societe Algerienne D'Hotellerie Distributive Trade 4 340Bergerat Monnoyeur France Wholesale trade 2 160 a
Ets Sahli Mohamed Republic of Korea Automotive trade and repair 0.2 7 a
Cieptal Spa France Wholesale trade .. 251Diamal Spa France Wholesale trade .. 160Soprema France Wholesale trade .. 130NV Organon Netherlands Health and Social Services .. 30ABB International Marketing Switzerland Research and development .. 22Rhodia Algérie Spa France Wholesale trade .. 21Basf Spa Germany Wholesale trade .. 20Maersk Algérie Denmark Transport .. 20Sika Outre Mer Switzerland Construction .. 15
C. Finance and insurance Assets Employees
Société Générale Algérie France Finance .. 170Natexis Algérie France Finance 13 156 b
Paribas el Djazair France Finance .. 40 c
Source: Who Owns Whom database (https://solutions.dnb.com/wow), retrieved January 2008. a 2001. b 2002. c 2003.
Algeria
69
C. Legal Frameworks for Transnational Corporations
Algeria is liberalizing and opening its economy to foreign direct investment inflows. In the effort to make it easy for transnational corporations and foreign investors to come into the country, it has adopted a number of legal instruments at national, bilateral and multilateral levels. The key instruments applicable in the country include the following:
I. National framework
Decree for the Implementation of Ordinance N° 66-54, of March 3, 1966, Relating to Inventors' Certificates and Patents for Invention (N° 66-60 of March 19, 1966) Source: Abu-Ghazaleh Intellectual Property, (http://www.agip.com).
Ordinance relating to Inventors' Certificates and Patents for Inventions (No. 66-54, of March 3, 1966) (JORA N° 19 du 08/03/1966) Source: Abu-Ghazaleh Intellectual Property, (http://www.agip.com).
Ordinance N° 66-57 of 19 March 1966 concerning Trademark Law; effective on 24 March 1966 Source:Journal Official de la Republique Algerienne (Official Gazette of Algeria), 25 March 1966. (JORA N° 24 du 25/03/1966).
Decree for the Implementation of Ordinance N° 66-57 Of March 19, 1966 relating to Trademarks (N° 66-63 of March 26, 1966) (JORA N° 26 du 01/04/1966) Source: Abu-Ghazaleh Intellectual Property, (http://www.agip.com).
Décret N° 66-120 du 19 mai 1966 fixant les taxes applicables en matière de certificats d’inventeurs et de brevets d’invention (JORA N° 42 du 27/05/1966).
Décret N° 74-204 du 01 octobre 1974 fixant les taxes applicables en matière de certificat d’inventeurs et de brevets d’invention (JORA N° 82 du 11/10/1974).
Ordinance N° 76-65 of 16 July 1976 on Appellations of Origin (JORA N° 59 du 23/07/1976) Source: World Intellectual Property Organization, Industrial Property Laws and Treaties, No. 1, January 1977 (English translation).
Decree N° 76-121 of 16 July 1976 on the Rules for Registering and Publishing Appellations of Origin, and Laying Down the Relevant Fees (JORA N° 59 du 23/07/1976) Source: World Intellectual Property Organization, Industrial Property Laws and Treaties, No. l, January 1977 (English translation).
Law N° 82-13 of 28 August 1982 pertaining to the Organization and Operation of Mixed Economy Companies (JORA N° 35 du 31/08/1982) Source: Middle East Executive Report (English translation), February 1984, p. 23.
Law No. 86-13 of 19 August 1986 ammending Law N° 82-13 of 28 August 1982. Source: Journal Official de la Republique Algerienne (Official Gazette of Algeria), 27 August 1986. (JORA N° 35 du 27/08/1986).
Law No° 86-14 of 19 August 1986 on Foreign Oil and Gas Investments. Source: Journal Officiel de la Republique Algerienne (Official Gazette of Algeria), 27 August 1986. (JORA N° 35 du 27/08/1986).
World Investment Directory Volume X Africa 2008
70
Law N° 88-04 Establishing Rules Applicable to Public Economic Enterprises. Source: Middle East Executive Report (English translation), July 1989, page 25. (JORA N° 02 du 13/01/1988)
Loi N° 88-25 du 12 juillet 1988 relative à l’orientation des investissements économiques privés nationaux (JORA N° 28 du 13/07/1988).
Law N° 89-01 of 7 February 1989 on Management Contracts (portant Code du Commerce) Source: Journal Official de la Republique Algerienne (Official Gazette of Algeria), 8 February 1989 and MEER (English translation), June 1989, page 26. (JORA N° 06 du 08/02/1989).
Arrêté du 02 septembre 1989 portant délivrance du brevet d’invention (JORA N° 38 du 06/09/1989)
Law N° 90-10 of 14 April 1990 on Money and Credit, Effective 25 April 1990 Source: Journal Official de la Republique Algerienne (Official Gazette of Algeria), 18 April 1990.
Regulation CMC N° 90-03 of 8 September 1990 concerning Transfer of Capital into Algeria for Financing Business and Repatriation of Capital. (JORA N° 45 du 24/10/1990). Source: Middle East Executive Report, December 1990, page 22 (English translation).
Regulation of CMC N° 90-04 of 8 September 1990 Concerning Procedures for the Approval of Wholesales and Distributors (JORA N° 45 du 24/10/1990) Source: Middle East Executive Report (English translation), January 1989, page 24.
Il faut noter que la Loi N° 90-10 relative à la monnaie et au crédit a été abrogée par l'ordonnance N° 03-11 du 26 août 2003 qui renforce les attributions du Conseil de la monnaie et du crédit (CMC) ainsi que la supervision bancaire.
Law N° 90-11 of 21 April 1990 on Work Relations. Source: Journal Officiel de la Republique Algerienne (Official Gazette of Algeria), 25 April 1990. (JORA N° 17 du 25/04/1990)
Implementing Law n° 90-22 of 18 August 1990 relative au registre de commerce (JORA N° 36 du 27/08/1990).
Legislative Decree N° 93-12 of 19 Rabie Ethani 1414 (5 October 1993) on Investment Promotion. Source: Journal Officiel de la Republique Algerienne (Official Gazette of Algeria), N° 64 of 24 Rabie Ethani 1414 (10 October 1993).
Executive Decree No 94-319 of 12 Joumada El Oula 1415 (17 October 1994) on the organization of the Investment Promotion Agency. (JORA N° 67 du 19/10/1994) Source: Republique Algerienne Democratique et Populaire, Services du Chef de Gouvernement, Agency de Promotion, de Soutien et de Suivi des Investissements. Les Publications de PAPSI - March 1995.
Executive Decree N° 94-320 of 12 Joumada El Oula 1415 (17 October 1994) on Free Zones Source: Republique Algerienne Democratique et Populaire, Services du Chef de Gouvernement, Agency de Promotion, de Soutien et de Suivi des Investissements. Les Publications de l'APSI - March 1995 (JORA N° 67 du 19/10/1994).
Executive Decree N° 94-321 of 12 Joumada El Oula 1415 (17 October 1994) (portant application des dispositions de l’article 24 du decret législatif n°93-12 du 05/10/1993) (JORA N° 67 du 19/10/1994) on implementation of the Legislative Decree No 93-12 of 19 Rabie Ethani 1414 (5 October 1993) on Investment Promotion (JORA N° 64 du 10/10/1993).
Algeria
71
Source: Republique Algerienne Democratique et Populaire, Services du Chef de Gouvernement, Agency de Promotion, de Soutien et de Suivi des Investissements. Les Publications de PAPSI - March 1995. Executive Decree N° 94-322 of 17 October 1994 (relatif à la concession de terrains domaniaux situés en zones spécifiques dans le cadre de la promotion de l’investissement) (JORA N° 67 du 19/10/1994) ; implements Legislative Decree No. 93-12 of 5 October 1993. (JORA N° 64 du 10/10/1993) Source: Republique Algerienne Democratique et Populaire, Services du Chef de Gouvernement, Agency de Promotion, de Soutien et de Suivi des Investissements. Les Publications de l’APSI - March 1995.
Décret exécutif N° 94-323 du 17 octobre 1994, fixant le seuil minimum des fonds propres relatifs aux investissements (JORA N° 67 du 19/10/1994).
Règlement du CMC (Conseil de la Monnaie et du Crédit) N° 94-17 du 22 octobre 1994 définissant la réglementation des changes spécifiques aux zones franches (JORA N° 83 du 21/12/1994).
Ordinance N° 95-07 of 10 January 1995 relative aux assurances (JORA N° 13 du 08/03/1995) Source: Official Journal of 14 January 1996.
Règlement du CMC (Conseil de la Monnaie et du Crédit) N° 2000-03 du 02 avril 2000 relatif aux investissements étrangers.
Règlement du CMC N° 2000-04 du 02 avril 2000 relatif aux mouvements des capitaux au titre des investissements de portefeuille des non résidents.
Ordonnance N° 01-01 du 27 février 2001 modifiant et complétant la Loi N° 90-10 du 14 avril 1990, relative à la monnaie et au crédit (JORA N° 14 du 28/02/2001).
Loi N° 01-04 du 09 mai 2001 portant approbation de l’Ordonnance N° 01- 01 du 27 février 2001 (JORA N° 27 du 13/05/2001).
Law N° 01-04 enacted on 20 August 2001 on organization, management and privatization of economic public enterprises, 20 august 2001 (JORA N° 47 du 22/08/2001). Source: Algeria Interface: http://www.algeria-interface.com/.
Ordonnance N° 03-07 du 19 juillet 2003 relative aux brevets d’invention (JORA N° 44 du 23/07/2003).
Loi N° 03-19 du 04 novembre 2003 portant approbation de l’ordonnance N° 03-07 (JORA N° 67 du 05/11/2003).
Règlement du CMC N° 2005-03 du 06 juin 2005 relatif aux investissements étrangers (JORA N° 53 du 31/07/2005).
Ordinance N° 01-03 concerning the Development of Investment, August 2001 (JORA N° 47 du 22/08/2001) Source: Algeria Interface: http://www.algeria-interface.com/ french/economie/codeinvest290901.htm (http://www.algeria-interface.com/english/archives/index.htm) and (http://www.mem-algeria.org/ cadre_legis/ index.htm).
Mining Act Law N° 01-10 enacted on 3 July 2001 (JORA N° 35 du 04/07/2001) Source: Democratic and Popular Republic of Algeria, Ministry of Energy and Mines, Journal Officiel N° 35 of 4 July 2001, (http://www.mem-algeria.org/cadre_legis/Mining_act_2001.pdf).
Décret exécutif N° 2001-281 24 septembre 2001 relatif à la composition, organisation et au fonctionnement du Conseil National de l’Investissement (JORA N° 50 du 19/07/2005).
Décret exécutif N° 2001-282 du 24 septembre 2001 portant attribution, organisation et fonctionnement de l’Agence Nationale de Développement des Investissements « ANDI » (JORA N° 55 du 26/09/2001).
World Investment Directory Volume X Africa 2008
72
Law on Orientation in the Promotion of Small and Medium-Sized Enterprise (Law N° 01-18 Of December 12 2001). (JORA N° 77 du 15/12/2001) Source: Foreign Tax Law, Bi-Weekly Bulletin, Index Volume 2001(http://www.foreignlaw.com/whatsnew.htm).
Law Opening the Distribution of Electricity and Gas for Private Investment, 2001 (approved by the government) Loi n° 02-01 du 5 février 2002 relative à l’électricité et à la distribution du gaz par canalisation (JORA N° 8 du 6 févirer 2002) Source: Algeria Interface: http://www.algeria-interface.com/ french/economie/loienergie251001.htm and (http://www.algeria-interface.com/english/archives/index.htm).
Décret exécutif N° 2002-373 du 11 novembre 2002 portant création et fixant les statuts du Fonds de Garantie des Crédits « FGAR » (JORA N° 74 du 13/11/2002).
Une ordonnance récente (N° 03-02 du 19 juillet 2003) fixe les règles générales régissant les zones franches ainsi que le régime d'encouragement applicable aux investissements réalisés dans ces zones.
Décret exécutif N° 2003-78 du 25 février 2003 portant statut type des pépinières d’entreprises (JORA N° 13 du 26/02/2003).
Décret exécutif N° 2003-79 du 25 février 2003 fixant la nature juridique, les missions et l’organisation des Centres de facilitations des petites et moyennes entreprises « PME » (JORA N° 13 du 26/02/2003) ;
Décret exécutif N° 2003-80 du 25 février 2003 portant organisation et fonctionnement du Conseil National Consultatif pour la promotion des petites et moyennes entreprises « PME » (JORA N° 13 du 26/02/2003) ;
Décret Exécutif N° 2003-83 du 26 février 2003 modifiant et complétant le Décret Exécutif N° 99-44 du 13/02/1999, portant création et fixant les statuts du Fonds de Garantie des Risques découlant des micro-crédits (JORA N° 14 du 02/03/2003).
Décret exécutif N° 2003-106 du 05 mars 2003 modifiant et complétant le Décret Exécutif N° 98-200 du 09/06/1998, portant création et fixant les statuts du Fonds de Caution Mutuelle de Garantie risques/crédits jeunes promoteurs (JORA N° 17 du 09/03/2003).
Décret exécutif N° 2003-289 du 26 septembre 2003 modifiant et complétant le Décret Exécutif N° 98-200 du 09/06/1998, portant création et fixant les statuts du Fonds de Caution de Garantie risques/crédits jeunes promoteurs (JORA N° 54 du 10/09/2003).
Décret exécutif N° 2004-03 du 03 janvier 2004 portant création et fixant les statuts du Fonds de Caution Mutuelle de Garantie des risques /crédits des investissements des chômeurs promoteurs âgés de 35 à 50 ans (JORA N° 03 du 11/01/2004).
Décret présidentiel N° 2004-13 du 22 janvier 2004 relatif aux dispositifs du micro-crédit (JORA N° 06 du 25/01/2004).
Décret exécutif N° 2004-14 du 22 janvier 2004 portant création et fixant les statuts de l’Agence Nationale de Gestion du Micro-crédit (JORA N° 06 du 25/01/2004).
Décret exécutif N° 2004-16 du 22 janvier 2004 portant création et fixant les statuts du Fonds de Garantie Mutuelle des Micro-crédits (JORA N° 06 du 25/01/2004).
Décret présidentiel N° 2004-134 du 19 avril 2004 portant statuts de la Caisse de Garantie des Crédits d’Investissements pour les petites et moyennes entreprises « PME » (JORA N° 27 du 28/04/2004).
Algeria
73
Décret exécutif N° 2004-162 du 05 juin 2004 portant statut, organisation, missions et attribution de la Caisse nationale d’équipement pour le développement (JORA N° 36 du 06/06/2004) ;
Décret exécutif N° 2005-02 du 03 janvier 2005 modifiant et complétant le Décret Exécutif n° 04-16 du 22/01/2004, portant création et fixant les statuts du Fonds de Caution de Garantie Mutuelle des Micro-crédits « FGMMC » (JORA N° 04 du 09/01/2005).
Décret exécutif N° 2005-165 du 03 mai 2005 portant création, organisation et fonctionnement de l’Agence Nationale de Développement de la petites et moyennes entreprises « PME » (JORA N° 32 du 04/05/2005).
Loi N° 05-07 du 28 avril 2005 relative aux hydrocarbures (JORA N° 50 du 19/07/2005).
Décret exécutif N° 05- 275 du 02 août 2005 fixant les modalités de dépôt et de délivrance des brevets d’invention. (JORA N° 54 du 07/08/2005).
Business Facilitation (Miscellaneous Provisions) Act 2006 Source:http://www.enterprisemauritius.biz/busfaclt.htm, http://www.gov.mu/portal/site/MOFSite/menuitem.4ae1c08cc723f8f4e0aad110a7b521ca/
II. International framework
A. Algeria is a party to the following multilateral and regional instruments:
Convention on the Recognition and Enforcement of Foreign Arbitral Awards of 10 June 1958, Entered into force on 7 June 1959.
Convention on the Settlement of Investment Disputes Between States and Nationals of Other States of 18 March 1965; entered into force on 14 October 1966.
Ordonnance N° 66-48 du 25 février 1966 portant adhésion de la République Algérienne Démocratique et Populaire à la Convention de Paris pour la protection de la propriété industrielle du 20 mars 1883 (JORA N°16 du 25/02/1966.
Convention Establishing the Inter-Arab Investment Guarantee Corporation of May 1971; entered into force in April 1974.
Ordonnance N° 72-16 du 07 juin 1972 portant ratification de la Convention relative à la création de l’Organisme Arabe pour la Garantie des Investissements (JORA N° 53 du 04/07/1972).
Ordonnance N° 74-47 du 25 avril 1974 portant ratification de la Charte de la Conférence Islamique (JORA N° 42 du 24/05/1974).
Agreement for the Promotion, Protection and Guarantee of Investment among Member States of the Organization of Islamic Conference, of I June 1981; entered into force on 23 September 1986.
Unified Agreement for the Investment of Arab Capital in the Arab States of 1982.
Paris Convention for Protection of Industrial Property of 20 March 1883, (revised at Brussels on 14 December 1900, Washington on 2 June 1911, the Hague on 6 November 1925, London on 2 June 1934, Lisbon on 31 October 1958, Stockholm on 14 July 1967, and as amended on 2 October 1979), signed in 1984.
World Investment Directory Volume X Africa 2008
74
Loi N° 88-18 du 18 juillet 1988 portant adhésion à la Convention pour la reconnaissance et l’exécution des sentences arbitrales étrangères adoptées par la Conférence des Nations Unies (JORA N° 28 du 13/07/1988).
Décret N° 88-233 du 15 novembre 1988 portant adhésion avec réserve à la Convention pour la reconnaissance et l’exécution des sentences arbitrales étrangères adoptées par la Conférence des Nations Unies à New York le 10 juin 1958 (JORA N° 48 du 23/11/1988).
Convention Establishing the Multilateral Investment Guarantee Agency of 11 October 1985; entered into force on 12 April 1988.
Il faut noter que la Loi N° 90-10 relative à la monnaie et au crédit a été abrogée par l'ordonnance N° 03-11 du 26 août 2003 qui renforce les attributions du Conseil de la monnaie et du crédit (CMC) ainsi que la supervision bancaire.
Décret Présidentiel N° 90-420 du 22 décembre 1990 portant ratification de la Convention entre les pays de l’Union du Maghreb Arabe (U.M.A) pour la promotion et la garantie des investissements signée à Alger le 23 juillet 1990 (JORA N° 06 du 06/02/1991).
Articles of Agreement of the Islamic Corporation for the Insurance of Investment and Export Credit of 19 February 1992 entered into force on 1 August 1994.
Ordonnance N° 95-04 du 21 janvier 1995 portant ratification de la Convention pour le règlement des différents relatifs aux investissements entre Etats et ressortissants d’autres Etats (JORA N° 07 du 15/02/1995).
Ordonnance N° 95-05 du 21 janvier 1995 portant approbation de la Convention portant création de l’Agence Internationale de Garantie des Investissements (JORA N° 07 du 15/02/1995).
Décret Présidentiel N° 95-306 du 07 octobre 1995 portant ratification par l’Algérie de la Convention Unifiée pour l’Investissement des Capitaux Arabes dans les pays arabes (JORA N° 59 du 11/10/1995).
Décret Présidentiel N° 96-144 du 23 avril 1996 portant ratification par l’Algérie de la Convention portant création de la Société Islamique de Garantie des Investissements et de Crédit à l’Exportation (JORA N° 26 du 24/04/1996).
Décret Présidentiel N° 96-146 du 23 avril 1996 autorisant la participation de l’Algérie au capital de la Société Islamique de gGrantie des Investissements et de Crédit à l’Exportation (JORA N° 26 du 24/04/1996).
Interface: http://www.algeria-interface.com/ french/economie/codeinvest290901.htm (http://www.algeria-interface.com/english/archives/index.htm) and (http://www.mem-algeria.org/cadre_legis/index.htm).
Une ordonnance récente (N° 03-02 du 19 juillet 2003) fixe les règles générales régissant les zones franches ainsi que le régime d'encouragement applicable aux investissements réalisés dans ces zones.
Trois ordonnances ont été promulguées le 19 juillet 2003: L'ordonnance N° 03-06 relative aux marques, L'ordonnance N° 03-07 relative aux brevets d'invention, L'ordonnance N° 03-08 relative à la protection des schémas de configuration des circuits intégrés.
A l’exception de la ratification de la charte de la conférence islamique, aucune autre ratification de conventions, dans le cadre de l’OCI (Organisation de la Conférence Islamique), au nombre de douze, n’a été effectuée à ce jour. Au cours de la dernière conférence de l’OCI, tenue à Djeda en décembre 2005, une demande réitérée a été adressée aux pays membres qui n’ont pas ratifié ces conventions pour le faire. En
Algeria
75
Algérie, lesdites conventions sont actuellement en cours d’études par les services du Ministère des Affaires Etrangères.
B. Bilateral treaties
1. Bilateral investment treaties for the protection and promotion of investments: United States of America 1990, Belgium/Luxembourg 1991, Italy 1991, France 1993, Romania 1994, Spain 1994, China 1996, Germany 1996, Jordan 1996, Mali 1996, Qatar 1996, Viet Nam 1996, Egypt 1997, Syria Arab Republic 1997, Bulgaria 1998, Mozambique 1998, Niger 1998, Turkey 1998, Cuba 1999, Denmark 1999, Korea, Republic of 1999, Yemen 1999, Argentina 2000, Czech Republic 2000, Greece 2000, Indonesia 2000, Malaysia 2000, Oman 2000, Saint Helen 2001, South Africa 2001, United Arab Emirates 2001, Bulgaria 2002, Czech Republic 2002, Austria 2003, Bahrain 2003, Denmark 2003, Ethiopia 2003, Iran, Islamic Republic of 2003, Kuwait 2003, Libyan Arab Jamahiriya 2003, Nigeria 2003, Sudan 2003, Sweden 2003, Austria 2004, Portugal 2004, Sweden 2004, Switzerland 2004, Finland 2005, Portugal 2005, Russian Federation 2006, Tunisia 2006.
2. Bilateral treaties for the avoidance of double taxation: United Kingdom 1981, France 1982, Tunisia 1985, Libyan Arab Jamahiriya 1988, Morocco 1990, Belgium 1991, Italy 1991, Romania 1994, Turkey 1994, Syrian Arab Republic 1997, Bulgaria 1998, Qatar 1998, Canada 1999, Mali 1999, Viet Nam 1999, Bahrain 2000, Jordan 2000, Oman 2000, Poland 2000, Korea, Republic of 2001, United Arab Emirates 2001, Ethiopia 2002, Lebanon 2002, Spain 2002, Yemen 2002, Portugal 2003,Austria 2003, Spain 2005, Ukraine 2004, Russian Federation 2006, Switzerland 2006.
C. Other treaties:
Agreement with the government of the United States of America concerning the development of trade and investment relations (2001).
Euro-Mediterranean Agreement Establishing association with the European Communities and their member states (1976 and 2002).
World Investment Directory Volume X Africa 2008
76
D. Sources of information
Official
Central Bank of Algeria (www.bank-of-algeria.dz).
Secondary
Clement, Henry (1996). The Mediterranean Debt Crescent: Money and Power in Algeria, Egypt, Morocco,
Tunisia and Turkey (Florida: University Press).
Economist Intelligence Unit (EIU) (various years). Country Profile: Algeria (London: EIU Ltd.).
__________________________ (various years). Country Report: Algeria (London: EIU Ltd.).
European Commission (EC) (1997). "Guide for investors in Algeria, Euro-Mediterranean Partnership" (Brussels: EC).
Foreign Investment Advisory Service (FIAS) and the United Nations Development Programme (UNDP) (2002). "Diagnostic sur le climat de l'investissement etranger en Algerie" (Washington D.C.: FIAS).
PricewaterhouseCoopers en partenariat avec le MDPPI (2002). "Investir en Algerie" (London: PricewaterhouseCoopers).
Radziewsky, M.C. (1994). "Foreign investment in Algeria: new regulation issued", Middle East Executive Reports,17(1), January.
Soderbom, M. and F. Teal (2004). "Size and Efficiency in Africa Manufacturing firms: Evidence from Firm-Level Panel Data." Journal of Development Economics, 73. pp 369 - 394.
United Nations Conference on Trade and Development (UNCTAD) (forthcoming). Investment Policy
Review: Algeria (Geneva: UNCTAD/ITE/IPC/2003/9).
__________________(2005a). Investor-Disputes Arising from Investment Treaties: A Review. UNCTAD Series of International Investment Policies for Development (UNCTAD/ITE/IIT/2005/4).
___________________(2005b). A Survey of Support by Investment Promotion Agencies to Linkages,Advisory Studies No. 18 (UNCTAD/ITE/IPC/2005/12).
World Bank/International Finance Corporation (2007). Doing Business 2008 Algeria (Washington D.C.: The World Bank Group).
Zouaimia, R. (1993). "Le regime des investissements etrangers en Algeria", Journal du droit international,
pp 569-598.
Angola
77
Angola
A. Definitions and sources of data
Foreign direct investment (FDI) is defined in Angola as the utilization of transferred capital, technology and transferable assets by non-residents on national territory with the aim of setting up a wholly or partly foreign owned business (Foreign Investment Law, Law 15 of Sept. 23, 1994). The Banco Nacional de Angola collects FDI data in Angola for compiling the balance-of-payments statistics. The International Monetary Fund also reports FDI data on Angola in its balance-of-payments statistics.
In 1994, Angola replaced its FDI regulation with a new and more liberal investment code. The new Code permitted FDI in various forms and most industries. Priority is given to the export-promoting or import-reducing investments. Foreign investors are allowed to transfer profits and to repatriate capital. Investors may enjoy certain incentives including exemptions from or the reduction of income tax and custom duties. Also in the same year, the Government of Angola shortened investment application procedures. It had established the Foreign Investment Office (FIO) in the Ministry of Economic Planning in 1989 with a view to promoting and supervising FDI, and providing guidance to potential foreign investors. Since then, foreign investment projects became subject to the approval of the Ministry of Economic Planning and the Council of Ministers. In project evaluation, these authorities consider the assessment of the FIO.
Angola has large potential for FDI. It has large reserves of oil and gas, diamond, considerable hydroelectric potential, varied agricultural land, adequate rainfall and well-stocked marine resources. It is the world's fourth largest diamond producer. The economy is now dominated by the capital-intensive oil sector which produces a large part of the gross domestic product. Massive investment is expected into the oil sector, particularly the deepwater extractions. Other minerals such as iron ore and gold were identified in surveys.
In recent years, Angola introduced some changes in corporate regulations to improve the poor state of its infrastructure, including through privatization and new licensing agreements. Since then, Angola Telecom has introduced a mobile phone network in Luanda and is gradually extending this to some of the larger towns. License was also granted to private cellular telephone companies for a joint venture that included Portugal Telecom, Sonangol and local investors. The authorities have equally concentrated on large new hydro-electric projects. Construction of the Capanda Dam on the Kwanza River resumed and the first turbine already started. The Angolan Government has set up an Institute to regulate the process of privatizing public enterprises through Luanda's new stock exchange, Bolsa de Valores e Derivativos de Angola (BVDA), which was constituted in March 2007. Initially only ten companies are expected to list on the BVDA, but the Government plans to expand the number to 40 within five years.
The country recently increased its effort to recapture international markets and trade by joining regional integration schemes and other trade and investment enhancing initiatives. Angola is a full and eligible member of the African Union, New Partnership for Africa's Development, the Common Market for the Eastern and Southern Africa, Southern Africa Development Community (SADC). Angola qualifies for the special and preferential market access schemes available to the least developed countries and is an eligible member of the United States' market access initiative for Africa – the African Growth and Opportunity Act, European Union's (EU) Everything But Arms initiative and the Cotonou Agreement for renegotiating the trade partnership agreement between African, Caribbean and Pacific countries with the EU. The SADC, particularly, is promoting a regional electricity grid thus alleviating the infrastructure problems and placing Angola as a potential leader in FDI inflows in Southern Africa. Angola is a member of the World Trade Organization.
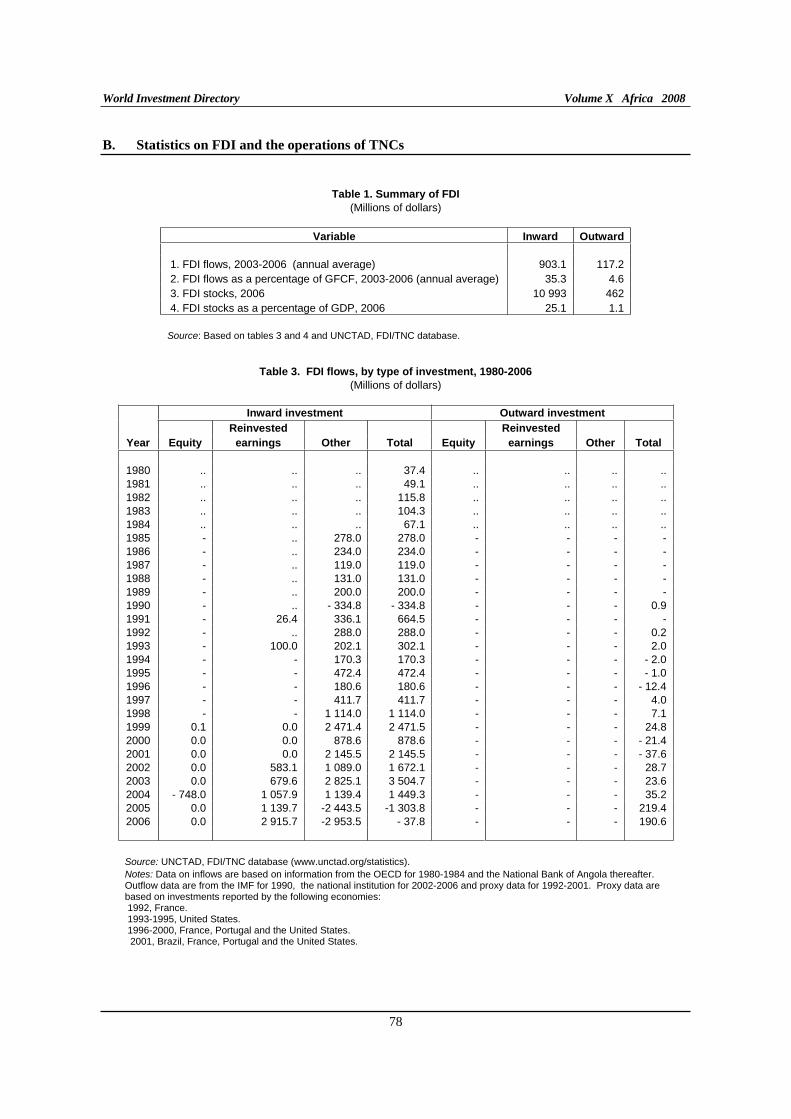
World Investment Directory Volume X Africa 2008
78
B. Statistics on FDI and the operations of TNCs
Table 1. Summary of FDI
(Millions of dollars)
Variable Inward Outward
1. FDI flows, 2003-2006 (annual average) 903.1 117.2 2. FDI flows as a percentage of GFCF, 2003-2006 (annual average) 35.3 4.6 3. FDI stocks, 2006 10 993 462 4. FDI stocks as a percentage of GDP, 2006 25.1 1.1 Source: Based on tables 3 and 4 and UNCTAD, FDI/TNC database.
Table 3. FDI flows, by type of investment, 1980-2006
(Millions of dollars)
Inward investment Outward investment
Reinvested Reinvested
Year Equity earnings Other Total Equity earnings Other Total
1980 .. .. .. 37.4 .. .. .. .. 1981 .. .. .. 49.1 .. .. .. .. 1982 .. .. .. 115.8 .. .. .. .. 1983 .. .. .. 104.3 .. .. .. .. 1984 .. .. .. 67.1 .. .. .. .. 1985 - .. 278.0 278.0 - - - - 1986 - .. 234.0 234.0 - - - - 1987 - .. 119.0 119.0 - - - - 1988 - .. 131.0 131.0 - - - - 1989 - .. 200.0 200.0 - - - - 1990 - .. - 334.8 - 334.8 - - - 0.9 1991 - 26.4 336.1 664.5 - - - - 1992 - .. 288.0 288.0 - - - 0.2 1993 - 100.0 202.1 302.1 - - - 2.0 1994 - - 170.3 170.3 - - - - 2.0 1995 - - 472.4 472.4 - - - - 1.0 1996 - - 180.6 180.6 - - - - 12.4 1997 - - 411.7 411.7 - - - 4.0 1998 - - 1 114.0 1 114.0 - - - 7.1 1999 0.1 0.0 2 471.4 2 471.5 - - - 24.8 2000 0.0 0.0 878.6 878.6 - - - - 21.4 2001 0.0 0.0 2 145.5 2 145.5 - - - - 37.6 2002 0.0 583.1 1 089.0 1 672.1 - - - 28.7 2003 0.0 679.6 2 825.1 3 504.7 - - - 23.6 2004 - 748.0 1 057.9 1 139.4 1 449.3 - - - 35.2 2005 0.0 1 139.7 -2 443.5 -1 303.8 - - - 219.4 2006 0.0 2 915.7 -2 953.5 - 37.8 - - - 190.6 Source: UNCTAD, FDI/TNC database (www.unctad.org/statistics). Notes: Data on inflows are based on information from the OECD for 1980-1984 and the National Bank of Angola thereafter. Outflow data are from the IMF for 1990, the national institution for 2002-2006 and proxy data for 1992-2001. Proxy data are based on investments reported by the following economies: 1992, France. 1993-1995, United States. 1996-2000, France, Portugal and the United States. 2001, Brazil, France, Portugal and the United States.
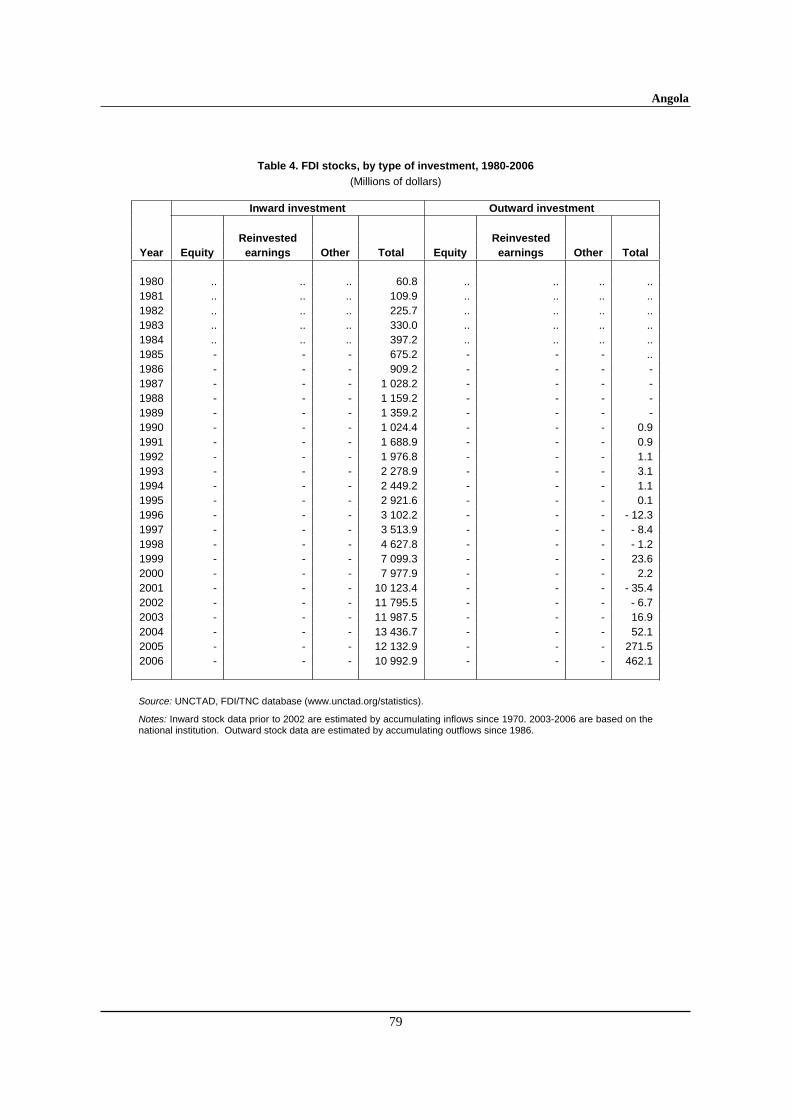
Angola
79
Table 4. FDI stocks, by type of investment, 1980-2006
(Millions of dollars)
Inward investment Outward investment
Reinvested Reinvested
Year Equity earnings Other Total Equity earnings Other Total
1980 .. .. .. 60.8 .. .. .. .. 1981 .. .. .. 109.9 .. .. .. .. 1982 .. .. .. 225.7 .. .. .. .. 1983 .. .. .. 330.0 .. .. .. .. 1984 .. .. .. 397.2 .. .. .. .. 1985 - - - 675.2 - - - .. 1986 - - - 909.2 - - - - 1987 - - - 1 028.2 - - - - 1988 - - - 1 159.2 - - - - 1989 - - - 1 359.2 - - - - 1990 - - - 1 024.4 - - - 0.9 1991 - - - 1 688.9 - - - 0.9 1992 - - - 1 976.8 - - - 1.1 1993 - - - 2 278.9 - - - 3.1 1994 - - - 2 449.2 - - - 1.1 1995 - - - 2 921.6 - - - 0.1 1996 - - - 3 102.2 - - - - 12.3 1997 - - - 3 513.9 - - - - 8.4 1998 - - - 4 627.8 - - - - 1.2 1999 - - - 7 099.3 - - - 23.6 2000 - - - 7 977.9 - - - 2.2 2001 - - - 10 123.4 - - - - 35.4 2002 - - - 11 795.5 - - - - 6.7 2003 - - - 11 987.5 - - - 16.9 2004 - - - 13 436.7 - - - 52.1 2005 - - - 12 132.9 - - - 271.5 2006 - - - 10 992.9 - - - 462.1 Source: UNCTAD, FDI/TNC database (www.unctad.org/statistics).
Notes: Inward stock data prior to 2002 are estimated by accumulating inflows since 1970. 2003-2006 are based on the national institution. Outward stock data are estimated by accumulating outflows since 1986.
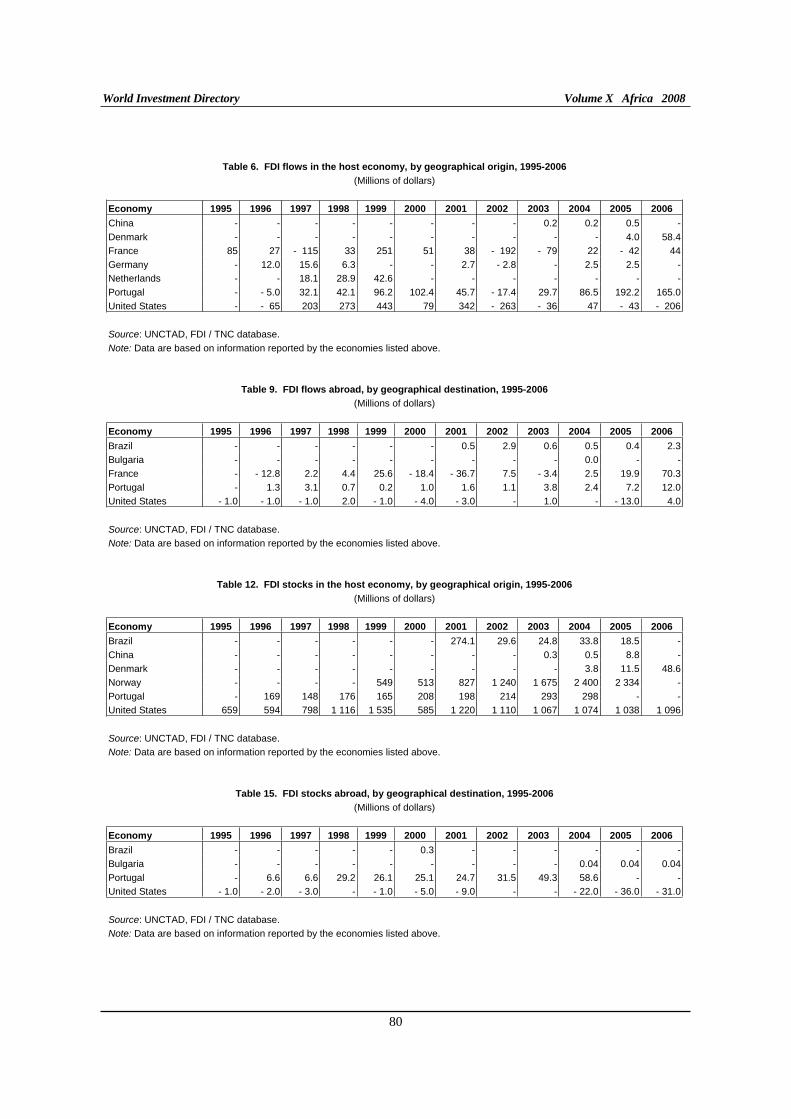
World Investment Directory Volume X Africa 2008
80
Table 6. FDI flows in the host economy, by geographical origin, 1995-2006
(Millions of dollars)
Economy 1995 1996 1997 1998 1999 2000 2001 2002 2003 2004 2005 2006
China - - - - - - - - 0.2 0.2 0.5 -
Denmark - - - - - - - - - - 4.0 58.4
France 85 27 - 115 33 251 51 38 - 192 - 79 22 - 42 44
Germany - 12.0 15.6 6.3 - - 2.7 - 2.8 - 2.5 2.5 -
Netherlands - - 18.1 28.9 42.6 - - - - - - -
Portugal - - 5.0 32.1 42.1 96.2 102.4 45.7 - 17.4 29.7 86.5 192.2 165.0
United States - - 65 203 273 443 79 342 - 263 - 36 47 - 43 - 206
Source: UNCTAD, FDI / TNC database.
Note: Data are based on information reported by the economies listed above.
Table 9. FDI flows abroad, by geographical destination, 1995-2006
(Millions of dollars)
Economy 1995 1996 1997 1998 1999 2000 2001 2002 2003 2004 2005 2006
Brazil - - - - - - 0.5 2.9 0.6 0.5 0.4 2.3
Bulgaria - - - - - - - - - 0.0 - -
France - - 12.8 2.2 4.4 25.6 - 18.4 - 36.7 7.5 - 3.4 2.5 19.9 70.3
Portugal - 1.3 3.1 0.7 0.2 1.0 1.6 1.1 3.8 2.4 7.2 12.0
United States - 1.0 - 1.0 - 1.0 2.0 - 1.0 - 4.0 - 3.0 - 1.0 - - 13.0 4.0
Source: UNCTAD, FDI / TNC database.
Note: Data are based on information reported by the economies listed above.
Table 12. FDI stocks in the host economy, by geographical origin, 1995-2006
(Millions of dollars)
Economy 1995 1996 1997 1998 1999 2000 2001 2002 2003 2004 2005 2006
Brazil - - - - - - 274.1 29.6 24.8 33.8 18.5 -
China - - - - - - - - 0.3 0.5 8.8 -
Denmark - - - - - - - - - 3.8 11.5 48.6
Norway - - - - 549 513 827 1 240 1 675 2 400 2 334 -
Portugal - 169 148 176 165 208 198 214 293 298 - -
United States 659 594 798 1 116 1 535 585 1 220 1 110 1 067 1 074 1 038 1 096
Source: UNCTAD, FDI / TNC database.
Note: Data are based on information reported by the economies listed above.
Table 15. FDI stocks abroad, by geographical destination, 1995-2006
(Millions of dollars)
Economy 1995 1996 1997 1998 1999 2000 2001 2002 2003 2004 2005 2006
Brazil - - - - - 0.3 - - - - - -
Bulgaria - - - - - - - - - 0.04 0.04 0.04
Portugal - 6.6 6.6 29.2 26.1 25.1 24.7 31.5 49.3 58.6 - -
United States - 1.0 - 2.0 - 3.0 - - 1.0 - 5.0 - 9.0 - - - 22.0 - 36.0 - 31.0
Source: UNCTAD, FDI / TNC database.
Note: Data are based on information reported by the economies listed above.
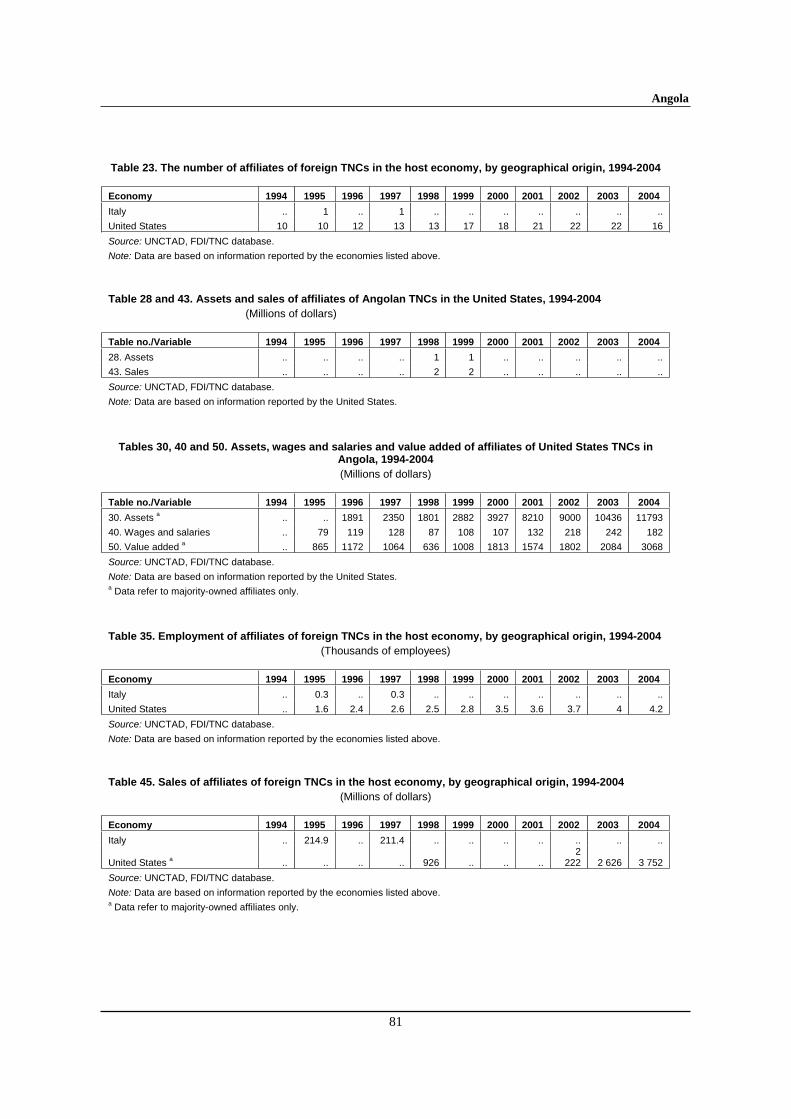
Angola
81
Table 23. The number of affiliates of foreign TNCs in the host economy, by geographical origin, 1994-2004
Economy 1994 1995 1996 1997 1998 1999 2000 2001 2002 2003 2004
Italy .. 1 .. 1 .. .. .. .. .. .. ..
United States 10 10 12 13 13 17 18 21 22 22 16
Source: UNCTAD, FDI/TNC database.
Note: Data are based on information reported by the economies listed above.
Table 28 and 43. Assets and sales of affiliates of Angolan TNCs in the United States, 1994-2004
(Millions of dollars)
Table no./Variable 1994 1995 1996 1997 1998 1999 2000 2001 2002 2003 2004
28. Assets .. .. .. .. 1 1 .. .. .. .. ..
43. Sales .. .. .. .. 2 2 .. .. .. .. ..
Source: UNCTAD, FDI/TNC database.
Note: Data are based on information reported by the United States.
Tables 30, 40 and 50. Assets, wages and salaries and value added of affiliates of United States TNCs in Angola, 1994-2004
(Millions of dollars)
Table no./Variable 1994 1995 1996 1997 1998 1999 2000 2001 2002 2003 2004
30. Assets a .. .. 1891 2350 1801 2882 3927 8210 9000 10436 11793
40. Wages and salaries .. 79 119 128 87 108 107 132 218 242 182
50. Value added a .. 865 1172 1064 636 1008 1813 1574 1802 2084 3068
Source: UNCTAD, FDI/TNC database.
Note: Data are based on information reported by the United States. a Data refer to majority-owned affiliates only.
Table 35. Employment of affiliates of foreign TNCs in the host economy, by geographical origin, 1994-2004
(Thousands of employees)
Economy 1994 1995 1996 1997 1998 1999 2000 2001 2002 2003 2004
Italy .. 0.3 .. 0.3 .. .. .. .. .. .. ..
United States .. 1.6 2.4 2.6 2.5 2.8 3.5 3.6 3.7 4 4.2
Source: UNCTAD, FDI/TNC database.
Note: Data are based on information reported by the economies listed above.
Table 45. Sales of affiliates of foreign TNCs in the host economy, by geographical origin, 1994-2004
(Millions of dollars)
Economy 1994 1995 1996 1997 1998 1999 2000 2001 2002 2003 2004
Italy .. 214.9 .. 211.4 .. .. .. .. .. .. ..
United States a .. .. .. .. 926 .. .. .. 2
222 2 626 3 752
Source: UNCTAD, FDI/TNC database.
Note: Data are based on information reported by the economies listed above. a Data refer to majority-owned affiliates only.
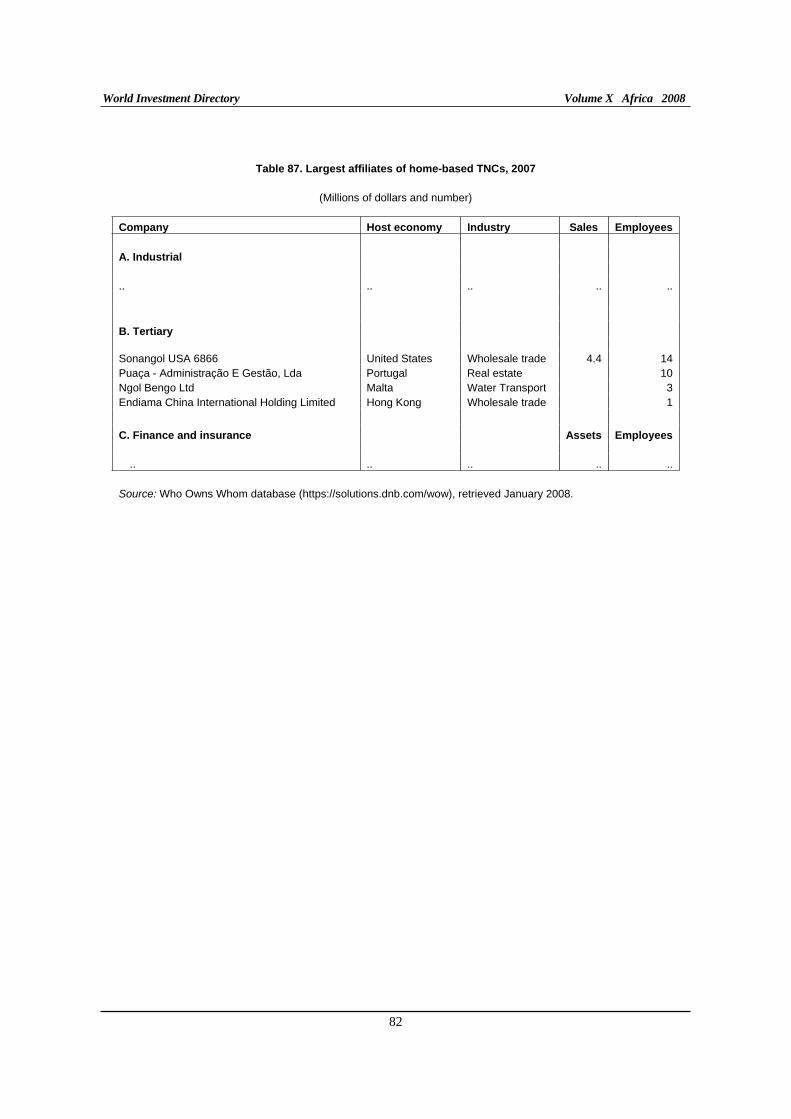
World Investment Directory Volume X Africa 2008
82
Table 87. Largest affiliates of home-based TNCs, 2007
(Millions of dollars and number)
Company Host economy Industry Sales Employees
A. Industrial
.. .. .. .. ..
B. Tertiary Sonangol USA 6866 United States Wholesale trade 4.4 14 Puaça - Administração E Gestão, Lda Portugal Real estate 10 Ngol Bengo Ltd Malta Water Transport 3 Endiama China International Holding Limited Hong Kong Wholesale trade 1
C. Finance and insurance Assets Employees
.. .. .. .. ..
Source: Who Owns Whom database (https://solutions.dnb.com/wow), retrieved January 2008.
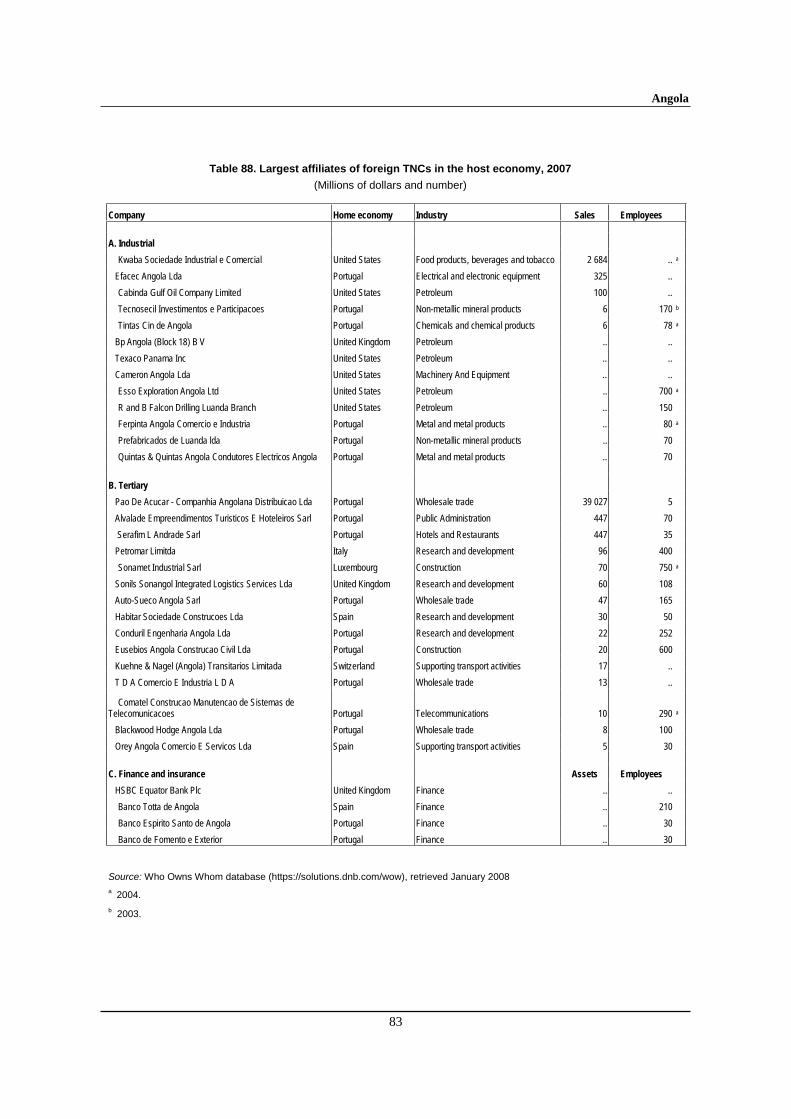
Angola
83
Table 88. Largest affiliates of foreign TNCs in the host economy, 2007
(Millions of dollars and number)
Company Home economy Industry Sales Employees
A. Industrial
Kwaba Sociedade Industrial e Comercial United States Food products, beverages and tobacco 2 684 .. a
Efacec Angola Lda Portugal Electrical and electronic equipment 325 ..
Cabinda Gulf Oil Company Limited United States Petroleum 100 ..
Tecnosecil Investimentos e Participacoes Portugal Non-metallic mineral products 6 170 b
Tintas Cin de Angola Portugal Chemicals and chemical products 6 78 a
Bp Angola (Block 18) B V United Kingdom Petroleum .. ..
Texaco Panama Inc United States Petroleum .. ..
Cameron Angola Lda United States Machinery And Equipment .. ..
Esso Exploration Angola Ltd United States Petroleum .. 700 a
R and B Falcon Drilling Luanda Branch United States Petroleum .. 150
Ferpinta Angola Comercio e Industria Portugal Metal and metal products .. 80 a
Prefabricados de Luanda lda Portugal Non-metallic mineral products .. 70
Quintas & Quintas Angola Condutores Electricos Angola Portugal Metal and metal products .. 70
B. Tertiary
Pao De Acucar - Companhia Angolana Distribuicao Lda Portugal Wholesale trade 39 027 5
Alvalade Empreendimentos Turisticos E Hoteleiros Sarl Portugal Public Administration 447 70
Serafim L Andrade Sarl Portugal Hotels and Restaurants 447 35
Petromar Limitda Italy Research and development 96 400
Sonamet Industrial Sarl Luxembourg Construction 70 750 a
Sonils Sonangol Integrated Logistics Services Lda United Kingdom Research and development 60 108
Auto-Sueco Angola Sarl Portugal Wholesale trade 47 165
Habitar Sociedade Construcoes Lda Spain Research and development 30 50
Conduril Engenharia Angola Lda Portugal Research and development 22 252
Eusebios Angola Construcao Civil Lda Portugal Construction 20 600
Kuehne & Nagel (Angola) Transitarios Limitada Switzerland Supporting transport activities 17 ..
T D A Comercio E Industria L D A Portugal Wholesale trade 13 ..
Comatel Construcao Manutencao de Sistemas de Telecomunicacoes Portugal Telecommunications 10 290 a
Blackwood Hodge Angola Lda Portugal Wholesale trade 8 100
Orey Angola Comercio E Servicos Lda Spain Supporting transport activities 5 30
C. Finance and insurance Assets Employees
HSBC Equator Bank Plc United Kingdom Finance .. ..
Banco Totta de Angola Spain Finance .. 210
Banco Espirito Santo de Angola Portugal Finance .. 30
Banco de Fomento e Exterior Portugal Finance .. 30
Source: Who Owns Whom database (https://solutions.dnb.com/wow), retrieved January 2008a 2004.
b 2003.
World Investment Directory Volume X Africa 2008
84
C. Legal frameworks for transnational corporations
Investors in Angola, particularly of foreign origin, are subject to specific regulations through national, bilateral and multilateral legal instruments. The key regulatory instruments that are applicable to all foreign investors in the country include:
I. National framework
Law relative to Oil Activities, Law No. 13/78, 1978. Source: Ministry of Finance, Evaluation of Angolan Petroleum Sector, Executive Summary: Initial Report (http://www.angola.org/referenc/reports/oil_diagnostic_eng.pdf).
Decree No. 14/88, June 1988, replacing what was formerly: Conselho de Ministros. Decreto No. 180/80 de outubro 1980. Estatuto Orgânico da Secretaria de Estado da Cultura (Artigo 15°, Subsecçao V: Do Instituto Nacional da Propriedade Intelectual). Source: WIPO (http://www.wipo.org).
The Law of Economic Activities", Law No 10/88, of 2 July 1988. Source: http://209.183.193.172/business/law1394.html
Copyright Law No. 4/90, March 1990. Source: WIPO (http://www.wipo.org).
Industrial Property Law No. 3/92, February 1992. Source: WIPO (http://www.wipo.org).
Law of Delimitation of the Sectors of Economic Activity (Law No. 13/94) Source: http://209.183.193.172/business/Private_invest_law_2003.pdf
Foreign Investment Law No. 15/94 of 23 September 1994, repeals Law 13/1988 of 16 June 1988. Source: Unofficial translation. French Embassy in Luanda (1990), available at: Centre Francais du Commenrce Exterieur – Paris.
Decree 30/95 of 1995 related to the regulation of financial flows and currency exchange Source: Ministry of Finance, Evaluation of Angolan Petroleum Sector, Executive Summary: Initial Report (http://www.angola.org/referenc/reports/oil_diagnostic_eng.pdf).
Foreign Exchange Law (Law No. 5/97) Source: http://209.183.193.172/business/Private_invest_law_2003.pdf
Republic Of Angola Law On The Bases For Private Investment Law, 2003. Source: http://209.183.193.172/business/Private_invest_law_2003.pdf
II. International Framework
A. Angola is a party to the following multilateral and regional instruments:
Convention on the Recognition and Enforcement of Foreign Arbitral Awards of 1958, which entered into force on 7th June 1959.
Convention on the Settlement of Investment Disputes between States and Nationals of other States of 1965. Entered into force on 14 October 1966
Convention Establishing the Multilateral Investment Guarantee Agency of 1985, entered into force on 12 April 1988.
Angola
85
Fourth ACP - EEC Convention (Lome IV) of 1989, entered into force on 1st March 1990.
Charter on a Regime of Multinational Industrial Enterprises (MIEs) in the Preferential Trade Area for Eastern and Southern African States (PTA), signed on 21 November 1990, entered into force August 1995. Source: Preferential Trade Area for Eastern ans Southern African States: Report of the Sixteenth Meeting of the Council of Ministers, 17-19 november, 1990, Mbabane, Swaziland (PTA/CM/XVI/2)
Southern Africa Development Community (SADC), signed on 17 August, 1992.Source: http://www.sadc.int/about_sadc/history.php.
Treaty Establishing the Market for Eastern and Southern Africa (COMESA), 1993.
Paris Convention for the Protection of Industrial Property of 1883 (Revised at Brussels in 1900, Washington in 1911, The Hague in 1925, London in 1934, Lisbon in 1958 and Stockholm in 1967, and as amended in 1979). Signed in 1994.
Marrakesh Agreement Establishing the World Trade Organisation of 15 April 1994. Entered into force on 1 January 1995. Agreement on Trade-Related Investment Measures. General Agreement on Trade in Services. Agreement on Trade Related Aspects of Intellectual Property Rights.
Partnership Agreement between the Members of The African, Caribbean and Pacific Group of States, of the one part and the European Community and its member states, of the other part signed in Cotonou, Benin on 23 June 2000.
B. Bilateral treaties
1. Bilateral investment treaties for the protection and promotion of investments: Cape Verde 1997, Portugal 1997, United Kingdom 2000, Italy 2002, Germany 2003.
2. Bilateral treaties for the avoidance of double taxation:
D. Sources of information
Official
Banco Nacional de Angola (central bank - www.bna.ao). Foreign investment Office (www.minfin.gv.ao).
Secondary
Bennell, Paul (1997). "Foreign direct investment in Africa: rhetoric and reality", SAIS Review (Summer/Fall) pp. 127-139.
Bennell, Paul (1997). "Privatization in Sub-Saharan Africa: progress and prospects during the 1990s", World Development, vol. 25, no. 11, pp. 1785-1803.
Business Map (2000). SADC Investor Survey-Complex Terrain (Johannesburg: Business Map), pp. 25-27.
Broll, U. (2003). "Foreign direct investment, credible policy: the role of risk sharing", International trade journal, vol. XVII, No. 2., pp. 165 – 176.
World Investment Directory Volume X Africa 2008
86
Dahl, J. (2002). "Incentives for foreign direct investments – the case of SADC in the 1990s" (Namibia: NEPRU, Working paper).
Economist Intelligence Unit (EIU) (various years). Country Profile: Angola (London: EIU Ltd.).
_____________ (various years). Country Report: Angola (London: EIU Ltd.).
Global Witness (2002). "A crude awakening: the role of the oil and banking industries in Angola’s civil war and the plunder of state assets", www.oneworld.org/globalwitness March).
Hodges, Tony (2001). Angola from Afro-Stalinism to Petro-diamond capitalism (James Currey: Indiana University Press).
International Monetary Fund (IMF) (2006). IMF's Sub-Saharan Africa Regional Economic Outlook, March 10, 2006. (Washington D.C.: IMF).
McCormick, Shawn (1994). The Angolan Economy, Prospects for Growth in a Post-War Environment(Washington D.C.: Centre for Strategic and International Studies).
Morisset, J. (2001). "Foreign direct investment in Africa: policies also matter", OECD Global Forum on International Investment (Paris: OECD).
Rosenn, Keith (1997). "Regulation of foreign investment in Angola", Briefing note for consulting assistance on economic reform (CAER II Discussion Paper No. 12).
Soderbom, M. and F. Teal (2004). "Size and Efficiency in Africa Manufacturing firms: Evidence from Firm-Level Panel Data." Journal of Development Economics, 73. pp 369 - 394.
United Nations Conference on Trade and Development (UNCTAD) (2002). FDI in Least Developed Countries at a Glance (Geneva: UNCTAD) (www.unctad.org/en/subsites/dite/LDCs/ pdfs/Countries/benin.pdf).
______________(2005a). Investor-Disputes Arising from Investment Treaties: A Review. UNCTAD Series of International Investment Policies for Development (UNCTAD/ITE/IIT/2005/4).
______________(2005b). A Survey of Support by Investment Promotion Agencies to Linkages, Advisory Studies No. 18 (UNCTAD/ITE/IPC/2005/12).
_______________(2005c). FDI in least developed countries at a glance: 2005/2006(UNCTAD/ITE/IIA/2005/17).
United States Trade Representative (2006). 2006 Comprehensive Report on U.S. Trade and Investment Policy Toward Sub-Saharan Africa and Implementation of the Africa Growth and Opportunity Act: The Sixth of Eight Annual Reports, May 2006. (Washington D.C.: US Government).
World Bank (2003). "Transitional support strategy for the Republic of Angola" (Washington D.C.: World Bank).
World Bank/International Finance Corporation (2007). Doing Business 2008 Angola (Washington D.C.: The World Bank Group).
Benin
87
Benin
A. Definitions and sources of data
In Benin, the Investment Code (Loi No. 82-005) governs all investment activities in the country, including foreign direct investment (FDI). The code does not contain an explicit definition of FDI. Data on FDI in the country are gathered from the Banque Centrale des Etats de l'Afrique de l'Ouest (BCEAO). Data are also provided by the International Monetary Fund in its balance-of-payment statistics.
After the widespread programme of nationalization in the years following the independence, Benin started to liberalize its economy in 1989 as a means to increase private sector activities and FDI. By 2005, the Government of Benin had privatized or liquidated more than one hundred and fifty state-owned companies in such industries as cement, textiles, brewing and tobacco. The government is also committed to strengthening transparency in public administration and public procurement, and ending corruption.
Benin has some proven mineral reserves, notably marble, iron, and phosphate, though there is no significant mining activity in the country except quarrying of limestone. Following the liberalization programmes, gold exploration agreements have been signed with companies from Australia, Canada, Germany, Ghana, Nigeria, South Africa and the United Kingdom. Oil production, which began in 1982 by exploitation at the Sèmè oilfield ended in 1998 when reserves were exhausted, but there are hopes of new discoveries. Exploration was restarted in 2002. The national oil distribution company, Societe nationale de Commercialisation des Produits Petroliers (Sonacop), was privatized in 1999.
Benin signed to the Convention on the Settlement of Investment Disputes between State and Nationals of other States on September 10, 1965 and is a member of the West African Economic and Monetary Union which imposes a common external tariff. Benin was also a founding member of the Economic Community of West African States and is engaged in a convergence programme for regional integration in the West African Franc Zone, the Union Economique et Monetaire Ouest-Africaine. Monetary policy is controlled by the regional central bank, BCEAO. Membership of the franc zone limits government borrowing and money creation, while the BCEAO sets interest rates. Benin is a member of the African Union, New Partnership for Africa's Development and is eligible for the United States' market access initiative for African countries – the African Growth and Opportunity Act, the European Union (EU) initiatives - Everything But Arms and the Cotonou Agreement for renegotiating the African, Caribbean and Pacific countries' partnership treaty with the EU. It is also eligible for all the market access under the generalized system of preferences schemes available to the least developed countries and a member of the World Trade Organization.
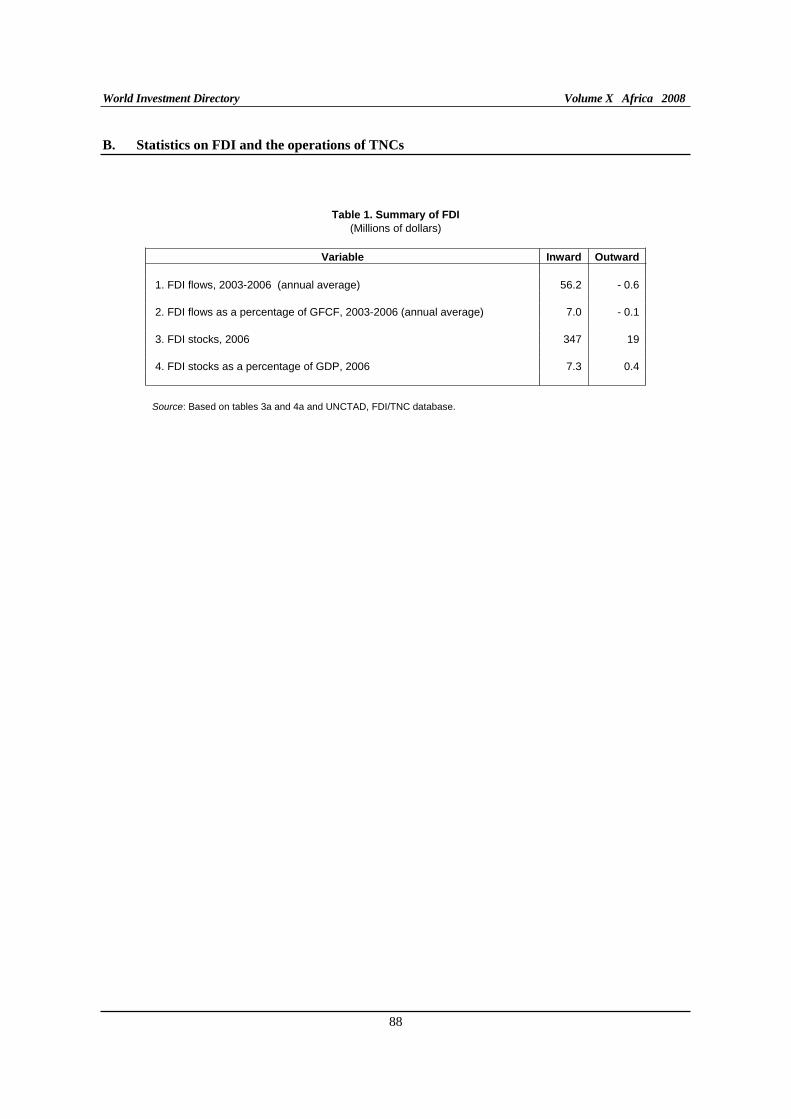
World Investment Directory Volume X Africa 2008
88
B. Statistics on FDI and the operations of TNCs
Table 1. Summary of FDI
(Millions of dollars)
Variable Inward Outward
1. FDI flows, 2003-2006 (annual average) 56.2 - 0.6
2. FDI flows as a percentage of GFCF, 2003-2006 (annual average) 7.0 - 0.1
3. FDI stocks, 2006 347 19
4. FDI stocks as a percentage of GDP, 2006 7.3 0.4
Source: Based on tables 3a and 4a and UNCTAD, FDI/TNC database.
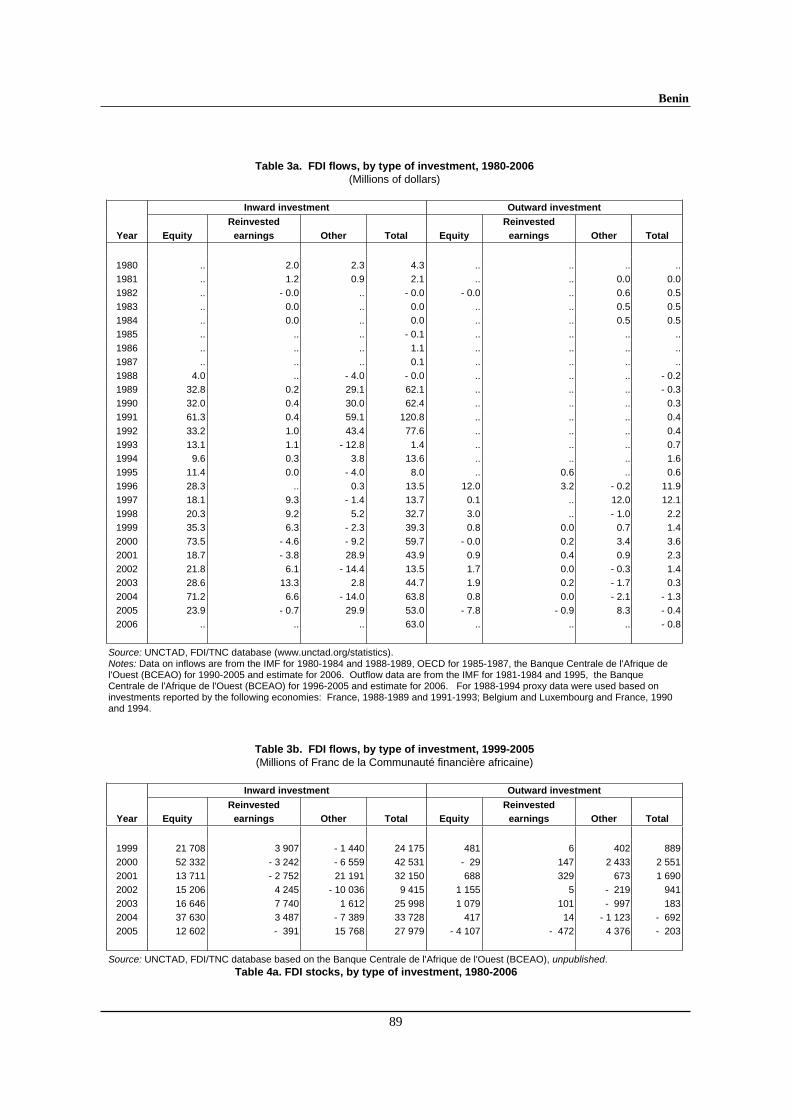
Benin
89
Table 3a. FDI flows, by type of investment, 1980-2006 (Millions of dollars)
Inward investment Outward investment
Reinvested Reinvested
Year Equity earnings Other Total Equity earnings Other Total
1980 .. 2.0 2.3 4.3 .. .. .. ..
1981 .. 1.2 0.9 2.1 .. .. 0.0 0.0
1982 .. - 0.0 .. - 0.0 - 0.0 .. 0.6 0.5
1983 .. 0.0 .. 0.0 .. .. 0.5 0.5
1984 .. 0.0 .. 0.0 .. .. 0.5 0.5
1985 .. .. .. - 0.1 .. .. .. ..
1986 .. .. .. 1.1 .. .. .. ..
1987 .. .. .. 0.1 .. .. .. ..
1988 4.0 .. - 4.0 - 0.0 .. .. .. - 0.2
1989 32.8 0.2 29.1 62.1 .. .. .. - 0.3
1990 32.0 0.4 30.0 62.4 .. .. .. 0.3
1991 61.3 0.4 59.1 120.8 .. .. .. 0.4
1992 33.2 1.0 43.4 77.6 .. .. .. 0.4
1993 13.1 1.1 - 12.8 1.4 .. .. .. 0.7
1994 9.6 0.3 3.8 13.6 .. .. .. 1.6
1995 11.4 0.0 - 4.0 8.0 .. 0.6 .. 0.6
1996 28.3 .. 0.3 13.5 12.0 3.2 - 0.2 11.9
1997 18.1 9.3 - 1.4 13.7 0.1 .. 12.0 12.1
1998 20.3 9.2 5.2 32.7 3.0 .. - 1.0 2.2
1999 35.3 6.3 - 2.3 39.3 0.8 0.0 0.7 1.4
2000 73.5 - 4.6 - 9.2 59.7 - 0.0 0.2 3.4 3.6
2001 18.7 - 3.8 28.9 43.9 0.9 0.4 0.9 2.3
2002 21.8 6.1 - 14.4 13.5 1.7 0.0 - 0.3 1.4
2003 28.6 13.3 2.8 44.7 1.9 0.2 - 1.7 0.3
2004 71.2 6.6 - 14.0 63.8 0.8 0.0 - 2.1 - 1.3
2005 23.9 - 0.7 29.9 53.0 - 7.8 - 0.9 8.3 - 0.4
2006 .. .. .. 63.0 .. .. .. - 0.8
Source: UNCTAD, FDI/TNC database (www.unctad.org/statistics). Notes: Data on inflows are from the IMF for 1980-1984 and 1988-1989, OECD for 1985-1987, the Banque Centrale de l'Afrique de l'Ouest (BCEAO) for 1990-2005 and estimate for 2006. Outflow data are from the IMF for 1981-1984 and 1995, the Banque Centrale de l'Afrique de l'Ouest (BCEAO) for 1996-2005 and estimate for 2006. For 1988-1994 proxy data were used based on investments reported by the following economies: France, 1988-1989 and 1991-1993; Belgium and Luxembourg and France, 1990 and 1994.
Table 3b. FDI flows, by type of investment, 1999-2005 (Millions of Franc de la Communauté financière africaine)
Inward investment Outward investment
Reinvested Reinvested
Year Equity earnings Other Total Equity earnings Other Total
1999 21 708 3 907 - 1 440 24 175 481 6 402 889
2000 52 332 - 3 242 - 6 559 42 531 - 29 147 2 433 2 551
2001 13 711 - 2 752 21 191 32 150 688 329 673 1 690
2002 15 206 4 245 - 10 036 9 415 1 155 5 - 219 941
2003 16 646 7 740 1 612 25 998 1 079 101 - 997 183
2004 37 630 3 487 - 7 389 33 728 417 14 - 1 123 - 692
2005 12 602 - 391 15 768 27 979 - 4 107 - 472 4 376 - 203
Source: UNCTAD, FDI/TNC database based on the Banque Centrale de l'Afrique de l'Ouest (BCEAO), unpublished.Table 4a. FDI stocks, by type of investment, 1980-2006
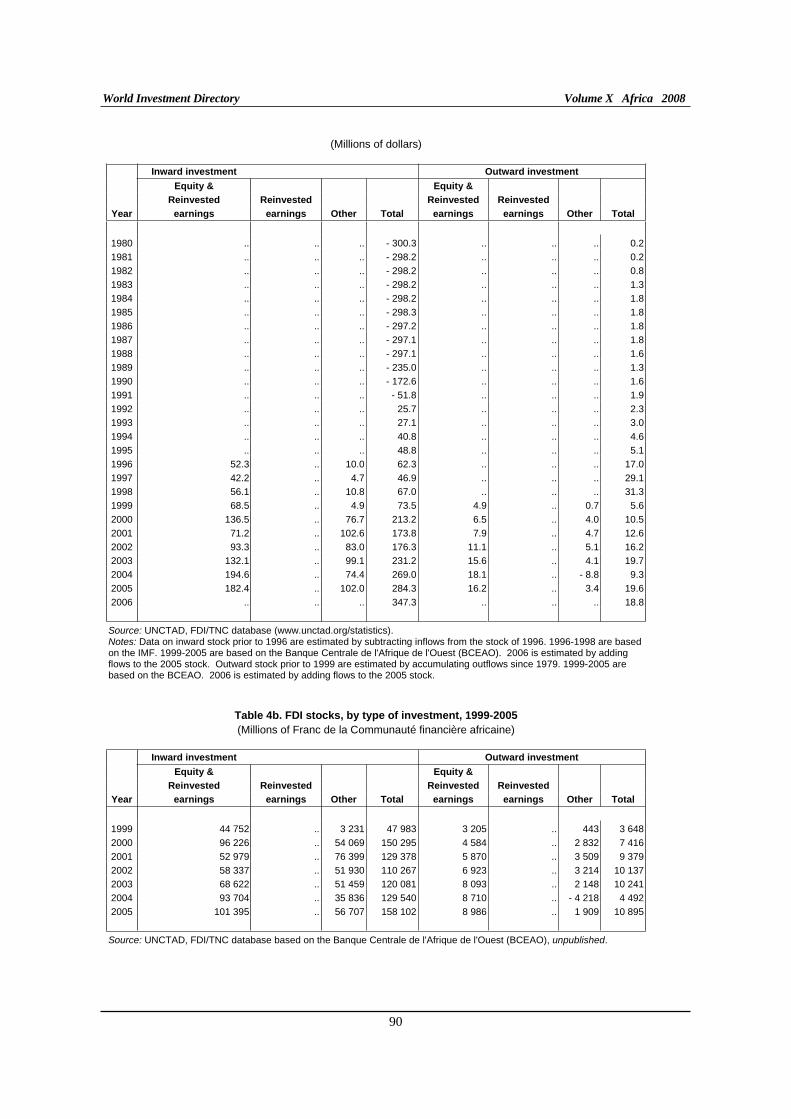
World Investment Directory Volume X Africa 2008
90
(Millions of dollars)
Inward investment Outward investment
Equity & Equity &
Reinvested Reinvested Reinvested Reinvested
Year earnings earnings Other Total earnings earnings Other Total
1980 .. .. .. - 300.3 .. .. .. 0.2
1981 .. .. .. - 298.2 .. .. .. 0.2
1982 .. .. .. - 298.2 .. .. .. 0.8
1983 .. .. .. - 298.2 .. .. .. 1.3
1984 .. .. .. - 298.2 .. .. .. 1.8
1985 .. .. .. - 298.3 .. .. .. 1.8
1986 .. .. .. - 297.2 .. .. .. 1.8
1987 .. .. .. - 297.1 .. .. .. 1.8
1988 .. .. .. - 297.1 .. .. .. 1.6
1989 .. .. .. - 235.0 .. .. .. 1.3
1990 .. .. .. - 172.6 .. .. .. 1.6
1991 .. .. .. - 51.8 .. .. .. 1.9
1992 .. .. .. 25.7 .. .. .. 2.3
1993 .. .. .. 27.1 .. .. .. 3.0
1994 .. .. .. 40.8 .. .. .. 4.6
1995 .. .. .. 48.8 .. .. .. 5.1
1996 52.3 .. 10.0 62.3 .. .. .. 17.0
1997 42.2 .. 4.7 46.9 .. .. .. 29.1
1998 56.1 .. 10.8 67.0 .. .. .. 31.3
1999 68.5 .. 4.9 73.5 4.9 .. 0.7 5.6
2000 136.5 .. 76.7 213.2 6.5 .. 4.0 10.5
2001 71.2 .. 102.6 173.8 7.9 .. 4.7 12.6
2002 93.3 .. 83.0 176.3 11.1 .. 5.1 16.2
2003 132.1 .. 99.1 231.2 15.6 .. 4.1 19.7
2004 194.6 .. 74.4 269.0 18.1 .. - 8.8 9.3
2005 182.4 .. 102.0 284.3 16.2 .. 3.4 19.6
2006 .. .. .. 347.3 .. .. .. 18.8
Source: UNCTAD, FDI/TNC database (www.unctad.org/statistics). Notes: Data on inward stock prior to 1996 are estimated by subtracting inflows from the stock of 1996. 1996-1998 are based on the IMF. 1999-2005 are based on the Banque Centrale de l'Afrique de l'Ouest (BCEAO). 2006 is estimated by adding flows to the 2005 stock. Outward stock prior to 1999 are estimated by accumulating outflows since 1979. 1999-2005 are based on the BCEAO. 2006 is estimated by adding flows to the 2005 stock.
Table 4b. FDI stocks, by type of investment, 1999-2005
(Millions of Franc de la Communauté financière africaine)
Inward investment Outward investment
Equity & Equity &
Reinvested Reinvested Reinvested Reinvested
Year earnings earnings Other Total earnings earnings Other Total
1999 44 752 .. 3 231 47 983 3 205 .. 443 3 648
2000 96 226 .. 54 069 150 295 4 584 .. 2 832 7 416
2001 52 979 .. 76 399 129 378 5 870 .. 3 509 9 379
2002 58 337 .. 51 930 110 267 6 923 .. 3 214 10 137
2003 68 622 .. 51 459 120 081 8 093 .. 2 148 10 241
2004 93 704 .. 35 836 129 540 8 710 .. - 4 218 4 492
2005 101 395 .. 56 707 158 102 8 986 .. 1 909 10 895
Source: UNCTAD, FDI/TNC database based on the Banque Centrale de l'Afrique de l'Ouest (BCEAO), unpublished.
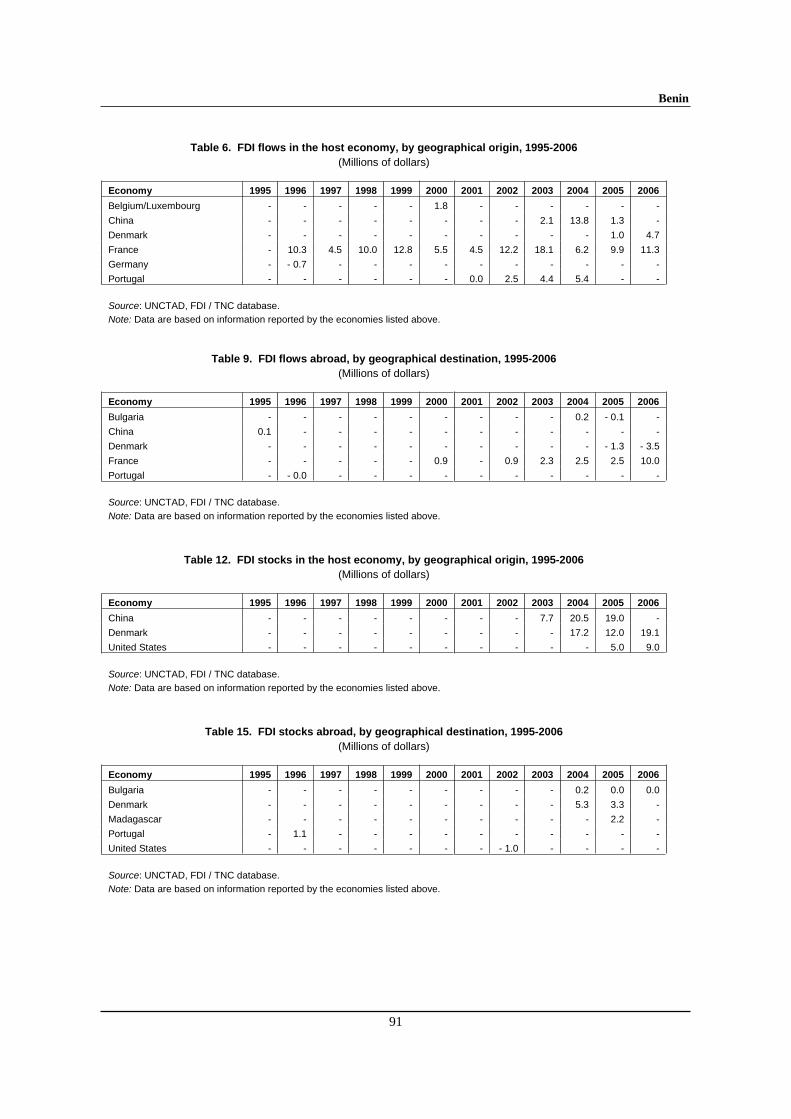
Benin
91
Table 6. FDI flows in the host economy, by geographical origin, 1995-2006
(Millions of dollars)
Economy 1995 1996 1997 1998 1999 2000 2001 2002 2003 2004 2005 2006
Belgium/Luxembourg - - - - - 1.8 - - - - - -
China - - - - - - - - 2.1 13.8 1.3 -
Denmark - - - - - - - - - - 1.0 4.7
France - 10.3 4.5 10.0 12.8 5.5 4.5 12.2 18.1 6.2 9.9 11.3
Germany - - 0.7 - - - - - - - - - -
Portugal - - - - - - 0.0 2.5 4.4 5.4 - - Source: UNCTAD, FDI / TNC database.
Note: Data are based on information reported by the economies listed above.
Table 9. FDI flows abroad, by geographical destination, 1995-2006
(Millions of dollars)
Economy 1995 1996 1997 1998 1999 2000 2001 2002 2003 2004 2005 2006
Bulgaria - - - - - - - - - 0.2 - 0.1 -
China 0.1 - - - - - - - - - - -
Denmark - - - - - - - - - - - 1.3 - 3.5
France - - - - - 0.9 - 0.9 2.3 2.5 2.5 10.0
Portugal - - 0.0 - - - - - - - - - - Source: UNCTAD, FDI / TNC database.
Note: Data are based on information reported by the economies listed above.
Table 12. FDI stocks in the host economy, by geographical origin, 1995-2006
(Millions of dollars)
Economy 1995 1996 1997 1998 1999 2000 2001 2002 2003 2004 2005 2006
China - - - - - - - - 7.7 20.5 19.0 -
Denmark - - - - - - - - - 17.2 12.0 19.1
United States - - - - - - - - - - 5.0 9.0 Source: UNCTAD, FDI / TNC database.
Note: Data are based on information reported by the economies listed above.
Table 15. FDI stocks abroad, by geographical destination, 1995-2006
(Millions of dollars)
Economy 1995 1996 1997 1998 1999 2000 2001 2002 2003 2004 2005 2006
Bulgaria - - - - - - - - - 0.2 0.0 0.0
Denmark - - - - - - - - - 5.3 3.3 -
Madagascar - - - - - - - - - - 2.2 -
Portugal - 1.1 - - - - - - - - - -
United States - - - - - - - - 1.0 - - - - Source: UNCTAD, FDI / TNC database.
Note: Data are based on information reported by the economies listed above.
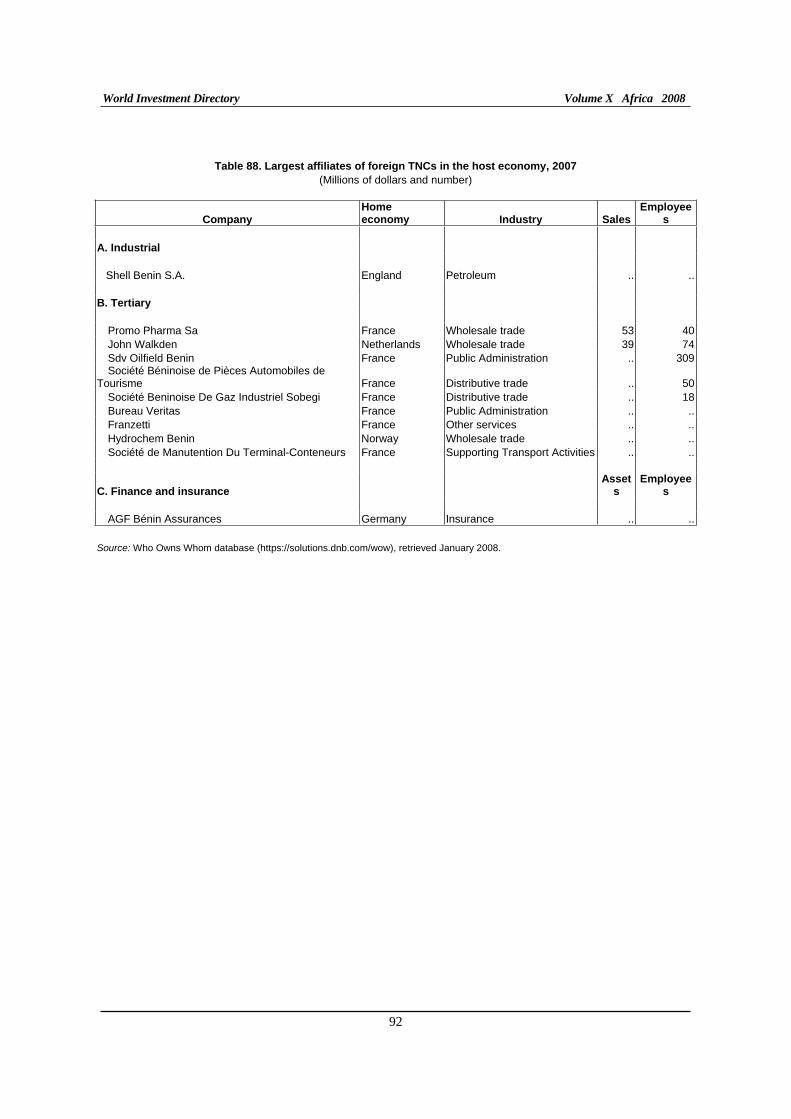
World Investment Directory Volume X Africa 2008
92
Table 88. Largest affiliates of foreign TNCs in the host economy, 2007
(Millions of dollars and number)
Company Homeeconomy Industry Sales
Employees
A. Industrial
Shell Benin S.A. England Petroleum .. .. B. Tertiary
Promo Pharma Sa France Wholesale trade 53 40John Walkden Netherlands Wholesale trade 39 74Sdv Oilfield Benin France Public Administration .. 309Société Béninoise de Pièces Automobiles de
Tourisme France Distributive trade .. 50Société Beninoise De Gaz Industriel Sobegi France Distributive trade .. 18Bureau Veritas France Public Administration .. ..Franzetti France Other services .. ..Hydrochem Benin Norway Wholesale trade .. ..Société de Manutention Du Terminal-Conteneurs France Supporting Transport Activities .. ..
C. Finance and insurance Asset
sEmployee
s
AGF Bénin Assurances Germany Insurance .. ..
Source: Who Owns Whom database (https://solutions.dnb.com/wow), retrieved January 2008.
Benin
93
C. Legal framework for transnational corporations
The laws that regulate the activities of the foreign investors at national, bilateral and multilateral levels in Benin include:
I. National framework
Bangui Agreement, March 1977 (Annex I). Source: WIPO (http://www.wipo.org).
Bangui Agreement, March 1977 (Annex III). Source: WIPO (http://www.wipo.org).
Bangui Agreement, March 1977 (Annexes II and IV). Source: WIPO (http://www.wipo.org).
Law No. 84-008, March 1984. Source: WIPO (http://www.wipo.org).
Law No. 90-002 of 9 May 1990 concerning the Investment Code as amended by Law 90-033 of 24 December 1990, repeals Law No. 82 of 20 May 1982 concerning the Investment Code and the Implementation Decrees. Source: Republic of Benin, "Code des Investissements", Official Publication.
Law No. 90-004 of 15 May 1990 on the declaration of labour, the employment and cancellation of labour contracts Source: Republic of Benin, "Code des Investissements", Official Publication.
Law No. 90-005 of 15 May 1990 on the commercial activities in the Republic of Benin. Source: Republic of Benin, "Code des Investissements", Official Publication.
Implementation Decree No. 91-002 of 4 January 1991. Source: Republic of Benin, "Code des Investissements", Official Publication.
Arrete No. 002 /MPS/DC/DP/SI of 9 January 1991 on the eligibility to special incentives regimes. Source:Republic of Benin, "Code des Investissements", Official Publication.
II. International Framework
A. Benin is a party to the following multilateral and regional instruments:
Convention on the Recognition and Enforcement of Foreign Arbitral Awards of 10 June 1958.
Convention on the Settlement of Investment Disputes Between States and Nationals of Other States of 18 March 1965.
Paris Convention for the Protection of Industrial Property of 20 March 1883, (Revised at Brussels on 14 December 1900, Washington on 2 June 1911, The Hague on 6 November 1925, London on 2 June 1934, Lisbon on 31 October 1958, Stockholm on 14 July 1967, and as amended on 2 October 1979), signed in 1967.
Agreement for the Promotion, Protection and Guarantee of Investment Among Member States of the Organization of Islamic Conference of 1 June 1981; entered into force on 23 September 1986.
Convention Establishing the Multilateral Investment Guarantee Agency of 11 October 1985; entered into force on 12 April 1988.
World Investment Directory Volume X Africa 2008
94
Fourth ACP-EEC Convention (LOME IV) of 15 December 1989; entered into force 1 March 1990.
Articles of Agreement of the Islamic Corporation for the Insurance of Investment Export Credit of 19 February 1992; entered into force on 1 August 1994.
Revised Treaty of the Economic Community of West African States (ECOWAS) 1993.
West African Economic and Monetary Union (WAEMU), established in 1994.
Marrakesh Agreement Establishing the World Trade Organisation of 15 April 1994. Entered into force on 1 January 1995. Agreement on Trade-Related Investment Measures. General Agreement on Trade in Services. Agreement on Trade Related Aspects of Intellectual Property Rights.
Partnership Agreement between the Members of The African, Caribbean and Pacific Group of States, of the one part and the European Community and its member states, of the other part signed in Cotonou, Benin on 23 June 2000.
B. Bilateral treaties
1. Bilateral investment treaties for the protection and promotion of investments: Switzerland 1966, Germany 1978, United Kingdom 1987, Belgium/Luxembourg 2001, Burkina Faso 2001, Chad 2001, Ghana 2001, Guinea 2001, Mali 2001, Mauritius 2001, Netherlands 2001, China 2004, Lebanon 2004, Morocco 2004.
2. Bilateral treaties for the avoidance of double taxation: France 1975, Norway 1979.
Benin
95
D. Sources of information
Official
Banque Centrale des Etats de l'Afrique de l'Ouest (BCEAO – www.bceao.int).
Secondary
Adamon, A (1995). Le Renouveau democratique au Benin: La Conference nationale des forces vives et la periode
de transition (Paris: Harmattan).
Economist Intelligence Unit (EIU) (various years). Country Profile: Benin (London: EIU Ltd.).
_____________ (various years). Country Report: Benin (London: EIU Ltd.).
Igue, J. (1992). L'Etat entrepot au Benin: Commerce informel ou solution a la crise (Paris: Karthala).
International Monetary Fund (IMF) (1998). Benin: Selected Issues and Statistical Appendix (Washington D.C.: IMF).
_____________ (2006). IMF's Sub-Saharan Africa Regional Economic Outlook, March 10, 2006. (Washington D.C.: IMF).
Morisset, J. (2001). "Foreign direct investment in Africa: policies also matter", OECD Global Forum on International Investment (Paris: OECD).
Ruffer, Tim, S. Jones and S. Akroyd (2002). "Development box proposals and their potential effect on developing countries." Mimeo, (London: U.K. Department for International Development).
Soderbom, M. and F. Teal (2004). "Size and Efficiency in Africa Manufacturing firms: Evidence from Firm-Level Panel Data." Journal of Development Economics, 73. pp 369 - 394.
United Nations Conference on Trade and Development (UNCTAD) (2002). FDI in Least Developed Countries at
a Glance (Geneva: UNCTAD) (www.unctad.org/en/subsites/dite/LDCs/ pdfs/Countries/benin.pdf).
_____________ (2005a). Investor-Disputes Arising from Investment Treaties: A Review. UNCTAD Series of International Investment Policies for Development (UNCTAD/ITE/IIT/2005/4).
_____________ (2005b). A Survey of Support by Investment Promotion Agencies to Linkages, Advisory Studies No. 18 (UNCTAD/ITE/IPC/2005/12).
_____________ (2005c). FDI in least developed countries at a glance: 2005/2006 (UNCTAD/ITE/IIA/2005/17).
United States Trade Representative (2006). 2006 Comprehensive Report on U.S. Trade and Investment Policy
Toward Sub-Saharan Africa and Implementation of the Africa Growth and Opportunity Act: The Sixth of
Eight Annual Reports, May 2006. (Washington D.C.: US Government).
World Bank (2002). Global Economic Prospects and the Developing Countries 2003: Investing to Unlock
Opportunities (Washington D.C.: World Bank). World Bank (2005). Une evaluation du Climat des Investissement. Novembre 2005. Report No xxxx - Benin.
World Bank/International Finance Corporation (2007). Doing Business 2008 Benin (Washington D.C.: The World Bank Group).

Botswana
97
Botswana
A. Definitions and sources of data
The Bank of Botswana defines foreign direct investment (FDI) in line with the recommendations of the fifth edition of the International Monetary Fund (IMF) balance-of-payments manual. It comprises of “investment made with the objectives of establishing a lasting interest by an entity (or group of related entities) in one economy, in an enterprise in a different economy. A feature of a direct investment relationship is the potential for a significant influence to be exercised by the investor over the management of the direct investment enterprise. Such influence may be less than outright control, but nonetheless, significant in key policy decisions of the enterprise. For statistical purposes, ownership by an investor, held directly or indirectly, of 10% or more of voting power in the entity of an enterprise in another economy is taken as evidence of a direct investment relationship” (Botswana Export Development and Investment Authority Act (BEDIA), 1997). The Bank of Botswana compiles statistics on FDI through an annual survey. The survey has been carried out since 1990 and collects data, at enterprise groups, on equity, reinvested earnings, and long and short-term intra-company loans. Since 1998, stock data in market value have been compiled. Also, a quarterly survey records of purchases and sales of foreign exchange exists (exchange controls were abolished in 1999). FDI flows data in Botswana are also reported by the IMF in its balance-of-payments statistics.
Botswana has no investment code. Investment byelaws exist and are in the Companies Act, the Factories Act, the Employment Act, the Financial Assistance Policy and the Income Tax Act of 1995. These acts are explicit on the investment position of the country. Investment protection and promotion have been a part of the incentives in Botswana. The Trade and Investment Promotion Agency, which was established in 1984, encouraged potential investors through disseminating information, organizing trade and investment fairs and the providing investment advice. This agency was replaced by BEDIA, an independent statutory body established in 1998. BEDIA is a one-stop shop for foreign investors. It promotes inward FDI into Botswana, identifies market outlets for products manufactured in Botswana and constructs factory buildings. BEDIA assists foreign investors to obtain clearances, such as residence permits or work permits, organizes investment promotion missions and visits of potential investors to Botswana. An individual wishing to invest in an enterprise in Botswana must first apply for a license and obtain permits from immigration and labour departments. Investment promotion activities focus on diversifying the country’s industrial base away from mineral resources.
Through the Financial Assistance Policy introduced in 1982, the Government of Botswana provides capital grants to foreign investors in manufacturing projects in proportion to projected employment, as well as wage subsidies and training grants. The Botswana Development Corporation (BDC) undertakes equity participation in investment projects. It also provides loans and carries out the construction of factory shells. Also, an International Financial Services Centre (IFSC) was created with the objective of diversifying the country’s industrial base. IFSC incentives include exemption from withholding taxes in Botswana. To qualify for IFSC incentives, investors have to apply to BDC.
The corporate tax rate is uniform at 15%. Manufacturing companies registered with the Director of Customs are allowed to import raw materials duty-free provided the entire output is destined for export. Botswana signed to the Convention on the Settlement of Investment Disputes between State and Nationals of other States on January 15, 1970, is a member of the Multilateral Investment Guarantee Agency, the African Union, New Partnership for Africa's Development and Southern Africa Development Community. It is also eligible for the United States' market access initiative for Africa – the African Growth and Opportunity Act, the Cotonou Agreement for renegotiating the trade partnership agreement between African, Caribbean and Pacific countries with the European Union and a member of the World Trade Organization.

World Investment Directory Volume X Africa 2008
98
B. Statistics on FDI and the operations of TNCs
Table 1. Summary of FDI
(Millions of dollars)
Variable Inward Outward
1. FDI flows, 2003-2006 (annual average) 341.4 63.5 2. FDI flows as a percentage of GFCF, 2003-2006 (annual average) 17.4 3.2 3. FDI stocks, 2006 958 747 4. FDI stocks as a percentage of GDP, 2006 9.8 7.6 Source: Based on tables 3a and 4a and UNCTAD, FDI/TNC database.
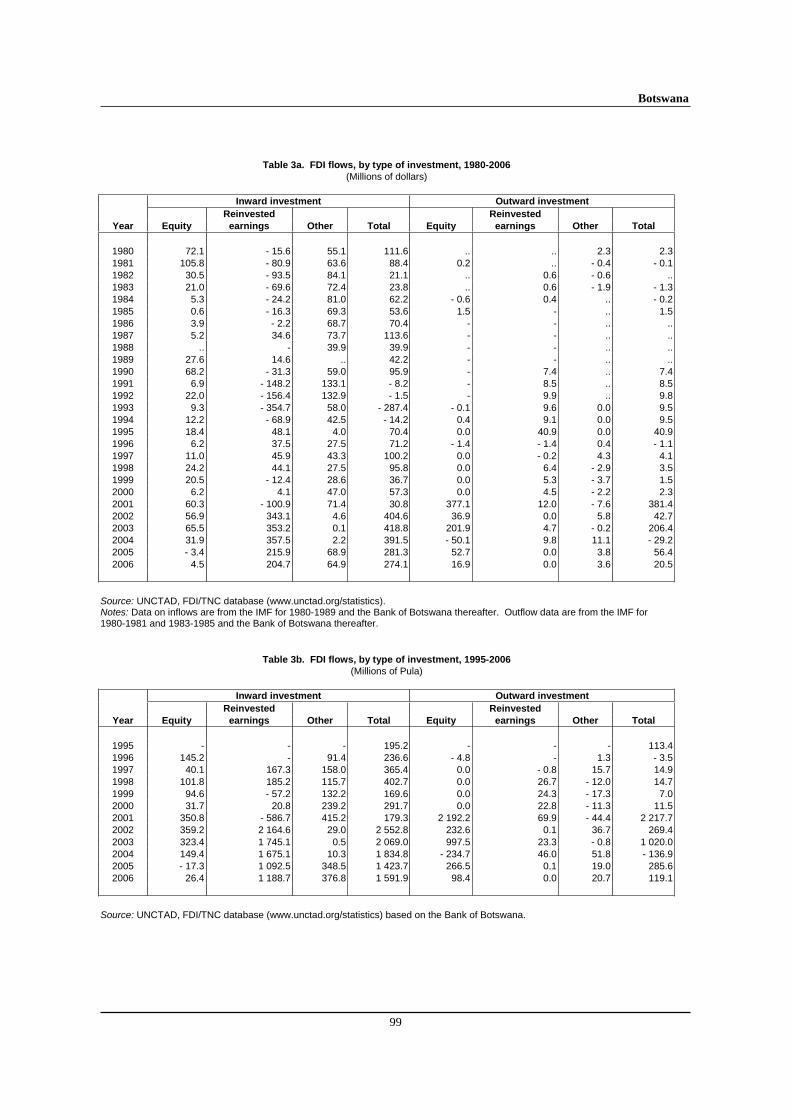
Botswana
99
Table 3a. FDI flows, by type of investment, 1980-2006 (Millions of dollars)
Inward investment Outward investment
Reinvested Reinvested
Year Equity earnings Other Total Equity earnings Other Total
1980 72.1 - 15.6 55.1 111.6 .. .. 2.3 2.31981 105.8 - 80.9 63.6 88.4 0.2 .. - 0.4 - 0.11982 30.5 - 93.5 84.1 21.1 .. 0.6 - 0.6 ..1983 21.0 - 69.6 72.4 23.8 .. 0.6 - 1.9 - 1.31984 5.3 - 24.2 81.0 62.2 - 0.6 0.4 .. - 0.21985 0.6 - 16.3 69.3 53.6 1.5 - .. 1.51986 3.9 - 2.2 68.7 70.4 - - .. ..1987 5.2 34.6 73.7 113.6 - - .. ..1988 .. - 39.9 39.9 - - .. ..1989 27.6 14.6 .. 42.2 - - .. ..1990 68.2 - 31.3 59.0 95.9 - 7.4 .. 7.41991 6.9 - 148.2 133.1 - 8.2 - 8.5 .. 8.51992 22.0 - 156.4 132.9 - 1.5 - 9.9 .. 9.81993 9.3 - 354.7 58.0 - 287.4 - 0.1 9.6 0.0 9.51994 12.2 - 68.9 42.5 - 14.2 0.4 9.1 0.0 9.51995 18.4 48.1 4.0 70.4 0.0 40.9 0.0 40.91996 6.2 37.5 27.5 71.2 - 1.4 - 1.4 0.4 - 1.11997 11.0 45.9 43.3 100.2 0.0 - 0.2 4.3 4.11998 24.2 44.1 27.5 95.8 0.0 6.4 - 2.9 3.51999 20.5 - 12.4 28.6 36.7 0.0 5.3 - 3.7 1.52000 6.2 4.1 47.0 57.3 0.0 4.5 - 2.2 2.32001 60.3 - 100.9 71.4 30.8 377.1 12.0 - 7.6 381.42002 56.9 343.1 4.6 404.6 36.9 0.0 5.8 42.72003 65.5 353.2 0.1 418.8 201.9 4.7 - 0.2 206.42004 31.9 357.5 2.2 391.5 - 50.1 9.8 11.1 - 29.22005 - 3.4 215.9 68.9 281.3 52.7 0.0 3.8 56.42006 4.5 204.7 64.9 274.1 16.9 0.0 3.6 20.5
Source: UNCTAD, FDI/TNC database (www.unctad.org/statistics). Notes: Data on inflows are from the IMF for 1980-1989 and the Bank of Botswana thereafter. Outflow data are from the IMF for 1980-1981 and 1983-1985 and the Bank of Botswana thereafter.
Table 3b. FDI flows, by type of investment, 1995-2006
(Millions of Pula)
Inward investment Outward investment
Reinvested Reinvested
Year Equity earnings Other Total Equity earnings Other Total
1995 - - - 195.2 - - - 113.41996 145.2 - 91.4 236.6 - 4.8 - 1.3 - 3.51997 40.1 167.3 158.0 365.4 0.0 - 0.8 15.7 14.91998 101.8 185.2 115.7 402.7 0.0 26.7 - 12.0 14.71999 94.6 - 57.2 132.2 169.6 0.0 24.3 - 17.3 7.02000 31.7 20.8 239.2 291.7 0.0 22.8 - 11.3 11.52001 350.8 - 586.7 415.2 179.3 2 192.2 69.9 - 44.4 2 217.72002 359.2 2 164.6 29.0 2 552.8 232.6 0.1 36.7 269.42003 323.4 1 745.1 0.5 2 069.0 997.5 23.3 - 0.8 1 020.02004 149.4 1 675.1 10.3 1 834.8 - 234.7 46.0 51.8 - 136.92005 - 17.3 1 092.5 348.5 1 423.7 266.5 0.1 19.0 285.62006 26.4 1 188.7 376.8 1 591.9 98.4 0.0 20.7 119.1
Source: UNCTAD, FDI/TNC database (www.unctad.org/statistics) based on the Bank of Botswana.
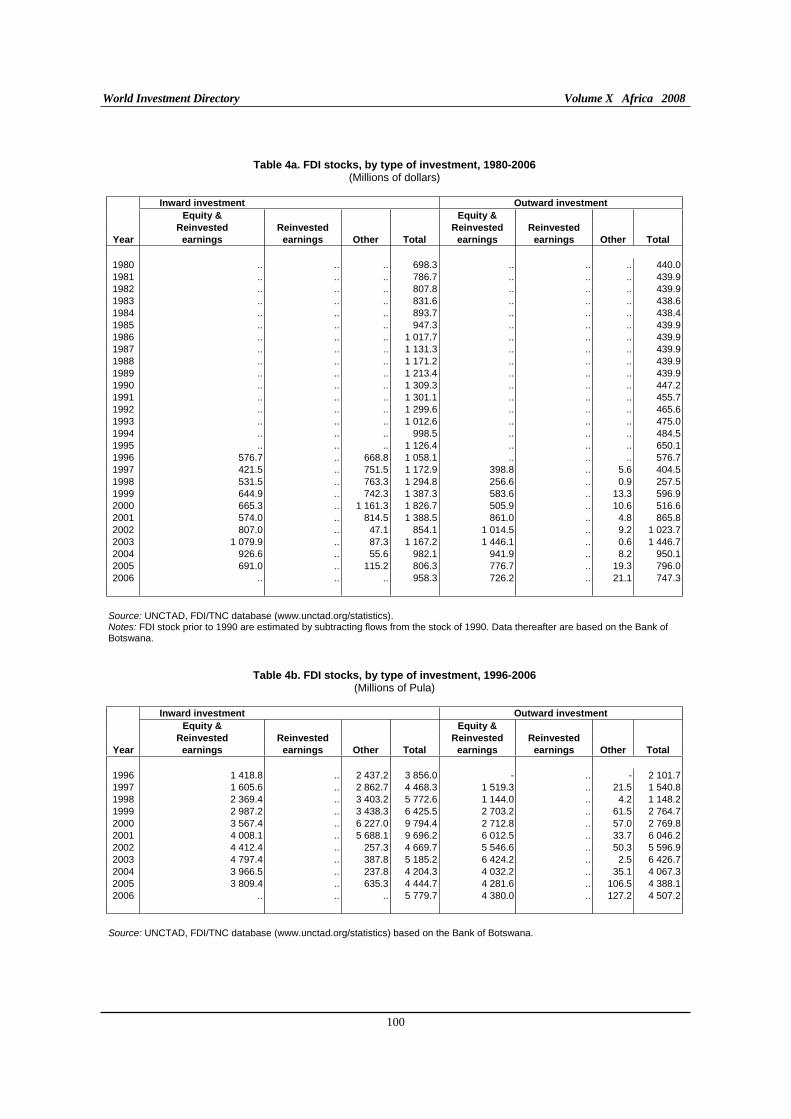
World Investment Directory Volume X Africa 2008
100
Table 4a. FDI stocks, by type of investment, 1980-2006 (Millions of dollars)
Inward investment Outward investment
Equity & Equity &
Reinvested Reinvested Reinvested Reinvested
Year earnings earnings Other Total earnings earnings Other Total
1980 .. .. .. 698.3 .. .. .. 440.01981 .. .. .. 786.7 .. .. .. 439.91982 .. .. .. 807.8 .. .. .. 439.91983 .. .. .. 831.6 .. .. .. 438.61984 .. .. .. 893.7 .. .. .. 438.41985 .. .. .. 947.3 .. .. .. 439.91986 .. .. .. 1 017.7 .. .. .. 439.91987 .. .. .. 1 131.3 .. .. .. 439.91988 .. .. .. 1 171.2 .. .. .. 439.91989 .. .. .. 1 213.4 .. .. .. 439.91990 .. .. .. 1 309.3 .. .. .. 447.21991 .. .. .. 1 301.1 .. .. .. 455.71992 .. .. .. 1 299.6 .. .. .. 465.61993 .. .. .. 1 012.6 .. .. .. 475.01994 .. .. .. 998.5 .. .. .. 484.51995 .. .. .. 1 126.4 .. .. .. 650.11996 576.7 .. 668.8 1 058.1 .. .. .. 576.71997 421.5 .. 751.5 1 172.9 398.8 .. 5.6 404.51998 531.5 .. 763.3 1 294.8 256.6 .. 0.9 257.51999 644.9 .. 742.3 1 387.3 583.6 .. 13.3 596.92000 665.3 .. 1 161.3 1 826.7 505.9 .. 10.6 516.62001 574.0 .. 814.5 1 388.5 861.0 .. 4.8 865.82002 807.0 .. 47.1 854.1 1 014.5 .. 9.2 1 023.72003 1 079.9 .. 87.3 1 167.2 1 446.1 .. 0.6 1 446.72004 926.6 .. 55.6 982.1 941.9 .. 8.2 950.12005 691.0 .. 115.2 806.3 776.7 .. 19.3 796.02006 .. .. .. 958.3 726.2 .. 21.1 747.3
Source: UNCTAD, FDI/TNC database (www.unctad.org/statistics). Notes: FDI stock prior to 1990 are estimated by subtracting flows from the stock of 1990. Data thereafter are based on the Bank of Botswana.
Table 4b. FDI stocks, by type of investment, 1996-2006 (Millions of Pula)
Inward investment Outward investment
Equity & Equity &
Reinvested Reinvested Reinvested Reinvested
Year earnings earnings Other Total earnings earnings Other Total
1996 1 418.8 .. 2 437.2 3 856.0 - .. - 2 101.71997 1 605.6 .. 2 862.7 4 468.3 1 519.3 .. 21.5 1 540.81998 2 369.4 .. 3 403.2 5 772.6 1 144.0 .. 4.2 1 148.21999 2 987.2 .. 3 438.3 6 425.5 2 703.2 .. 61.5 2 764.72000 3 567.4 .. 6 227.0 9 794.4 2 712.8 .. 57.0 2 769.82001 4 008.1 .. 5 688.1 9 696.2 6 012.5 .. 33.7 6 046.22002 4 412.4 .. 257.3 4 669.7 5 546.6 .. 50.3 5 596.92003 4 797.4 .. 387.8 5 185.2 6 424.2 .. 2.5 6 426.72004 3 966.5 .. 237.8 4 204.3 4 032.2 .. 35.1 4 067.32005 3 809.4 .. 635.3 4 444.7 4 281.6 .. 106.5 4 388.12006 .. .. .. 5 779.7 4 380.0 .. 127.2 4 507.2
Source: UNCTAD, FDI/TNC database (www.unctad.org/statistics) based on the Bank of Botswana.
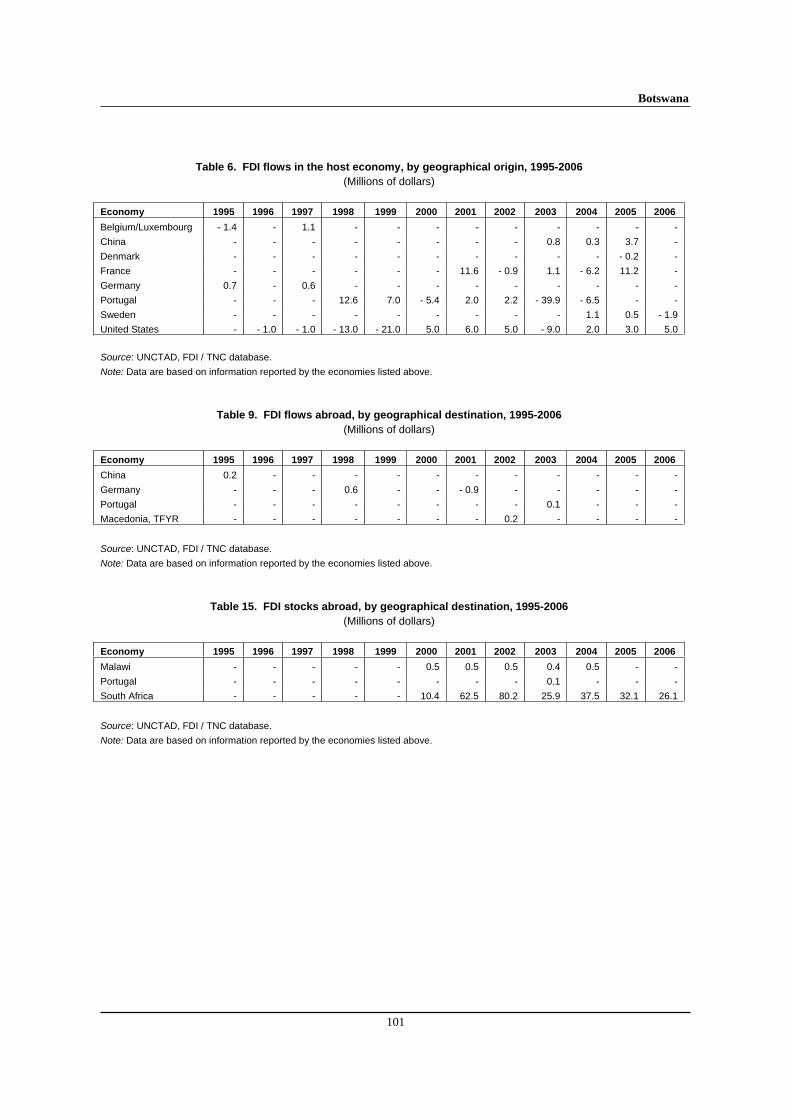
Botswana
101
Table 6. FDI flows in the host economy, by geographical origin, 1995-2006
(Millions of dollars)
Economy 1995 1996 1997 1998 1999 2000 2001 2002 2003 2004 2005 2006
Belgium/Luxembourg - 1.4 - 1.1 - - - - - - - - -
China - - - - - - - - 0.8 0.3 3.7 -
Denmark - - - - - - - - - - - 0.2 -
France - - - - - - 11.6 - 0.9 1.1 - 6.2 11.2 -
Germany 0.7 - 0.6 - - - - - - - - -
Portugal - - - 12.6 7.0 - 5.4 2.0 2.2 - 39.9 - 6.5 - -
Sweden - - - - - - - - - 1.1 0.5 - 1.9
United States - - 1.0 - 1.0 - 13.0 - 21.0 5.0 6.0 5.0 - 9.0 2.0 3.0 5.0 Source: UNCTAD, FDI / TNC database.
Note: Data are based on information reported by the economies listed above.
Table 9. FDI flows abroad, by geographical destination, 1995-2006
(Millions of dollars)
Economy 1995 1996 1997 1998 1999 2000 2001 2002 2003 2004 2005 2006
China 0.2 - - - - - - - - - - -
Germany - - - 0.6 - - - 0.9 - - - - -
Portugal - - - - - - - - 0.1 - - -
Macedonia, TFYR - - - - - - - 0.2 - - - -
Source: UNCTAD, FDI / TNC database.
Note: Data are based on information reported by the economies listed above.
Table 15. FDI stocks abroad, by geographical destination, 1995-2006
(Millions of dollars)
Economy 1995 1996 1997 1998 1999 2000 2001 2002 2003 2004 2005 2006
Malawi - - - - - 0.5 0.5 0.5 0.4 0.5 - -
Portugal - - - - - - - - 0.1 - - -
South Africa - - - - - 10.4 62.5 80.2 25.9 37.5 32.1 26.1
Source: UNCTAD, FDI / TNC database.
Note: Data are based on information reported by the economies listed above.
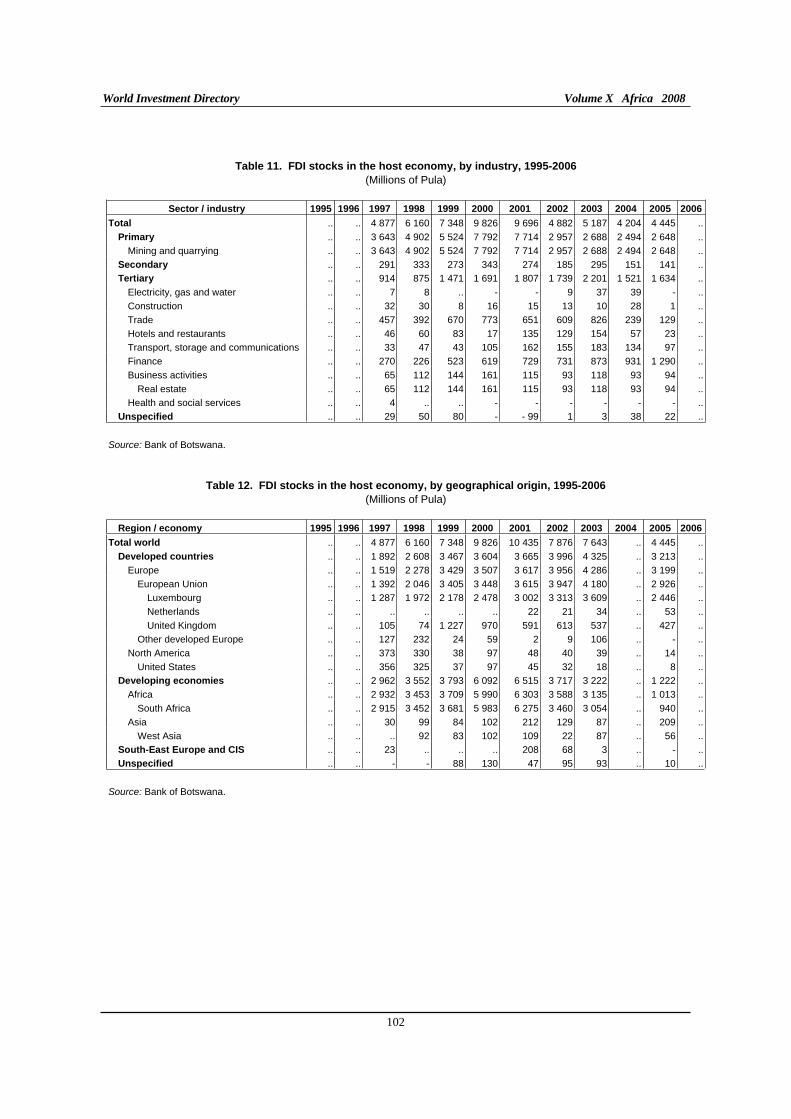
World Investment Directory Volume X Africa 2008
102
Table 11. FDI stocks in the host economy, by industry, 1995-2006
(Millions of Pula)
Sector / industry 1995 1996 1997 1998 1999 2000 2001 2002 2003 2004 2005 2006
Total .. .. 4 877 6 160 7 348 9 826 9 696 4 882 5 187 4 204 4 445 ..
Primary .. .. 3 643 4 902 5 524 7 792 7 714 2 957 2 688 2 494 2 648 ..
Mining and quarrying .. .. 3 643 4 902 5 524 7 792 7 714 2 957 2 688 2 494 2 648 ..
Secondary .. .. 291 333 273 343 274 185 295 151 141 ..
Tertiary .. .. 914 875 1 471 1 691 1 807 1 739 2 201 1 521 1 634 ..
Electricity, gas and water .. .. 7 8 .. - - 9 37 39 - ..
Construction .. .. 32 30 8 16 15 13 10 28 1 ..
Trade .. .. 457 392 670 773 651 609 826 239 129 ..
Hotels and restaurants .. .. 46 60 83 17 135 129 154 57 23 ..
Transport, storage and communications .. .. 33 47 43 105 162 155 183 134 97 ..
Finance .. .. 270 226 523 619 729 731 873 931 1 290 ..
Business activities .. .. 65 112 144 161 115 93 118 93 94 ..
Real estate .. .. 65 112 144 161 115 93 118 93 94 ..
Health and social services .. .. 4 .. .. - - - - - - ..
Unspecified .. .. 29 50 80 - - 99 1 3 38 22 ..
Source: Bank of Botswana.
Table 12. FDI stocks in the host economy, by geographical origin, 1995-2006
(Millions of Pula)
Region / economy 1995 1996 1997 1998 1999 2000 2001 2002 2003 2004 2005 2006
Total world .. .. 4 877 6 160 7 348 9 826 10 435 7 876 7 643 .. 4 445 ..
Developed countries .. .. 1 892 2 608 3 467 3 604 3 665 3 996 4 325 .. 3 213 ..
Europe .. .. 1 519 2 278 3 429 3 507 3 617 3 956 4 286 .. 3 199 ..
European Union .. .. 1 392 2 046 3 405 3 448 3 615 3 947 4 180 .. 2 926 ..
Luxembourg .. .. 1 287 1 972 2 178 2 478 3 002 3 313 3 609 .. 2 446 ..
Netherlands .. .. .. .. .. .. 22 21 34 .. 53 ..
United Kingdom .. .. 105 74 1 227 970 591 613 537 .. 427 ..
Other developed Europe .. .. 127 232 24 59 2 9 106 .. - ..
North America .. .. 373 330 38 97 48 40 39 .. 14 ..
United States .. .. 356 325 37 97 45 32 18 .. 8 ..
Developing economies .. .. 2 962 3 552 3 793 6 092 6 515 3 717 3 222 .. 1 222 ..
Africa .. .. 2 932 3 453 3 709 5 990 6 303 3 588 3 135 .. 1 013 ..
South Africa .. .. 2 915 3 452 3 681 5 983 6 275 3 460 3 054 .. 940 ..
Asia .. .. 30 99 84 102 212 129 87 .. 209 ..
West Asia .. .. .. 92 83 102 109 22 87 .. 56 ..
South-East Europe and CIS .. .. 23 .. .. .. 208 68 3 .. - ..
Unspecified .. .. - - 88 130 47 95 93 .. 10 ..
Source: Bank of Botswana.
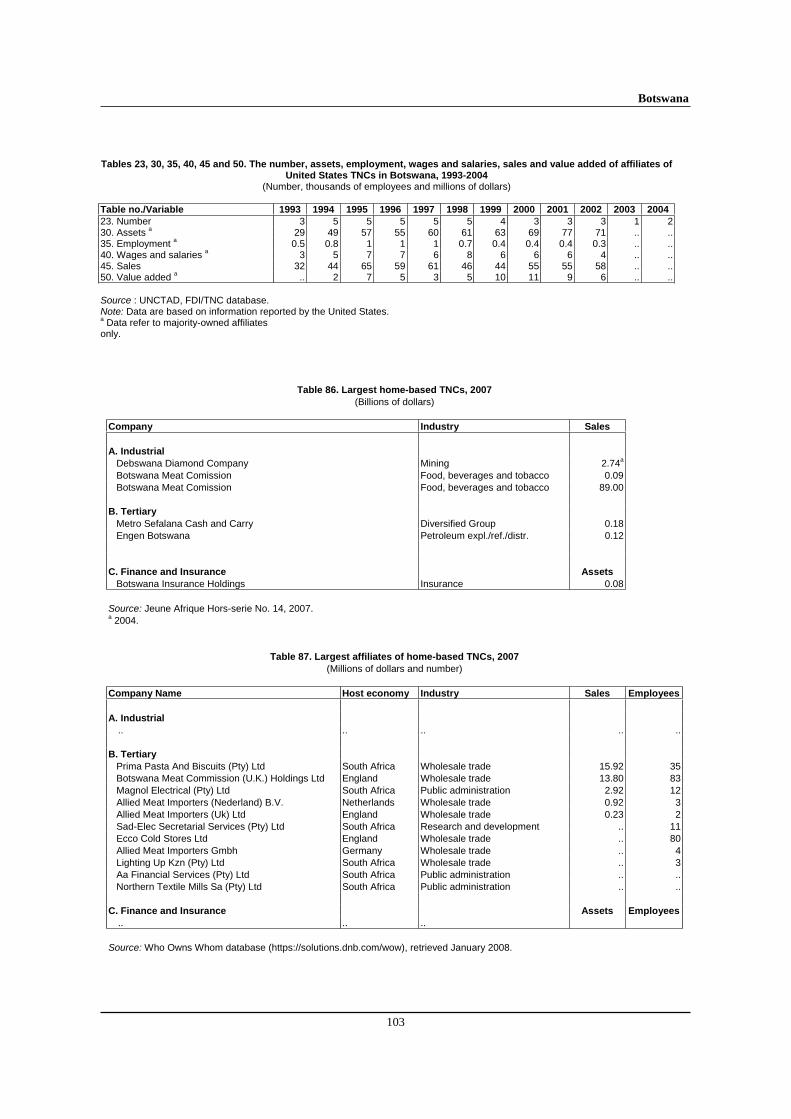
Botswana
103
Tables 23, 30, 35, 40, 45 and 50. The number, assets, employment, wages and salaries, sales and value added of affiliates of United States TNCs in Botswana, 1993-2004
(Number, thousands of employees and millions of dollars) Table no./Variable 1993 1994 1995 1996 1997 1998 1999 2000 2001 2002 2003 2004 23. Number 3 5 5 5 5 5 4 3 3 3 1 230. Assets a 29 49 57 55 60 61 63 69 77 71 .. ..35. Employment a 0.5 0.8 1 1 1 0.7 0.4 0.4 0.4 0.3 .. ..40. Wages and salaries a 3 5 7 7 6 8 6 6 6 4 .. ..45. Sales 32 44 65 59 61 46 44 55 55 58 .. ..50. Value added a .. 2 7 5 3 5 10 11 9 6 .. .. Source : UNCTAD, FDI/TNC database. Note: Data are based on information reported by the United States. a Data refer to majority-owned affiliates only.
Table 86. Largest home-based TNCs, 2007
(Billions of dollars) Company Industry Sales
A. Industrial Debswana Diamond Company Mining 2.74a
Botswana Meat Comission Food, beverages and tobacco 0.09 Botswana Meat Comission Food, beverages and tobacco 89.00 B. Tertiary Metro Sefalana Cash and Carry Diversified Group 0.18 Engen Botswana Petroleum expl./ref./distr. 0.12
C. Finance and Insurance Assets
Botswana Insurance Holdings Insurance 0.08
Source: Jeune Afrique Hors-serie No. 14, 2007.a 2004.
Table 87. Largest affiliates of home-based TNCs, 2007
(Millions of dollars and number) Company Name Host economy Industry Sales Employees
A. Industrial
.. .. .. .. ..
B. Tertiary Prima Pasta And Biscuits (Pty) Ltd South Africa Wholesale trade 15.92 35 Botswana Meat Commission (U.K.) Holdings Ltd England Wholesale trade 13.80 83 Magnol Electrical (Pty) Ltd South Africa Public administration 2.92 12 Allied Meat Importers (Nederland) B.V. Netherlands Wholesale trade 0.92 3 Allied Meat Importers (Uk) Ltd England Wholesale trade 0.23 2 Sad-Elec Secretarial Services (Pty) Ltd South Africa Research and development .. 11 Ecco Cold Stores Ltd England Wholesale trade .. 80 Allied Meat Importers Gmbh Germany Wholesale trade .. 4 Lighting Up Kzn (Pty) Ltd South Africa Wholesale trade .. 3 Aa Financial Services (Pty) Ltd South Africa Public administration .. .. Northern Textile Mills Sa (Pty) Ltd South Africa Public administration .. .. C. Finance and Insurance Assets Employees
.. .. ..
Source: Who Owns Whom database (https://solutions.dnb.com/wow), retrieved January 2008.
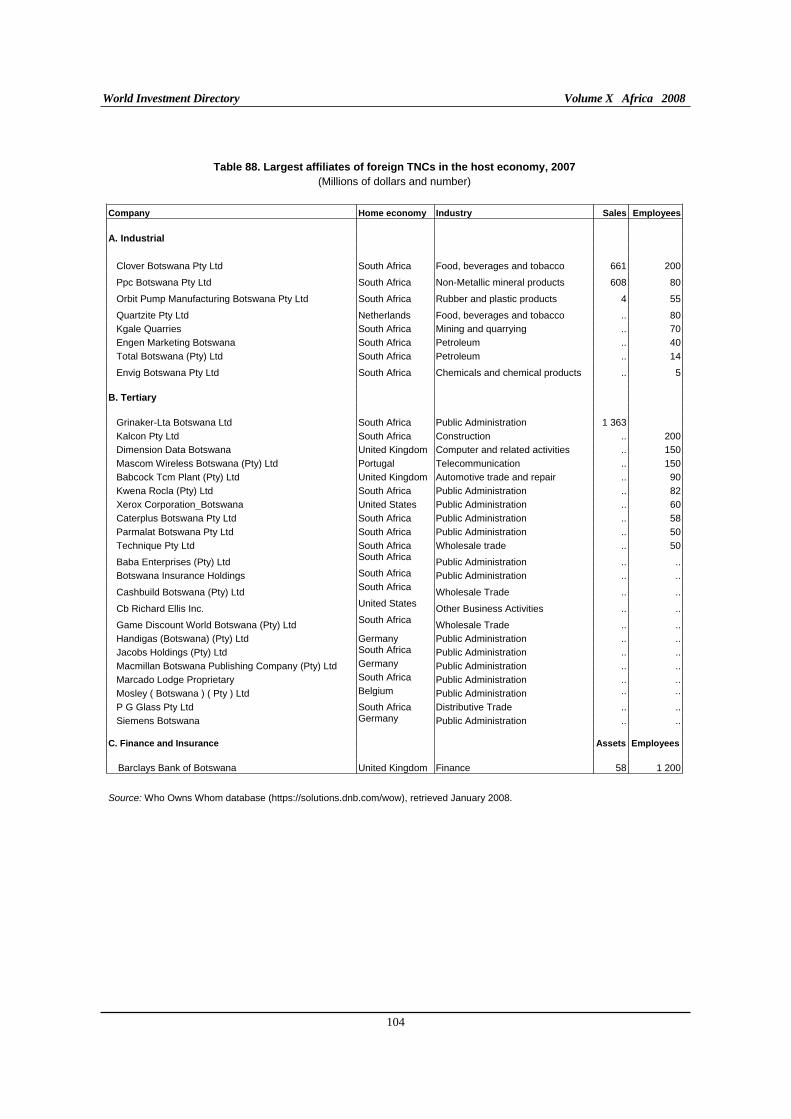
World Investment Directory Volume X Africa 2008
104
Table 88. Largest affiliates of foreign TNCs in the host economy, 2007
(Millions of dollars and number)
Company Home economy Industry Sales Employees
A. Industrial
Clover Botswana Pty Ltd South Africa Food, beverages and tobacco 661 200
Ppc Botswana Pty Ltd South Africa Non-Metallic mineral products 608 80
Orbit Pump Manufacturing Botswana Pty Ltd South Africa Rubber and plastic products 4 55
Quartzite Pty Ltd Netherlands Food, beverages and tobacco .. 80
Kgale Quarries South Africa Mining and quarrying .. 70
Engen Marketing Botswana South Africa Petroleum .. 40
Total Botswana (Pty) Ltd South Africa Petroleum .. 14
Envig Botswana Pty Ltd South Africa Chemicals and chemical products .. 5
B. Tertiary
Grinaker-Lta Botswana Ltd South Africa Public Administration 1 363
Kalcon Pty Ltd South Africa Construction .. 200
Dimension Data Botswana United Kingdom Computer and related activities .. 150
Mascom Wireless Botswana (Pty) Ltd Portugal Telecommunication .. 150
Babcock Tcm Plant (Pty) Ltd United Kingdom Automotive trade and repair .. 90
Kwena Rocla (Pty) Ltd South Africa Public Administration .. 82
Xerox Corporation_Botswana United States Public Administration .. 60
Caterplus Botswana Pty Ltd South Africa Public Administration .. 58
Parmalat Botswana Pty Ltd South Africa Public Administration .. 50
Technique Pty Ltd South Africa Wholesale trade .. 50
Baba Enterprises (Pty) Ltd South Africa Public Administration .. ..
Botswana Insurance Holdings South Africa Public Administration .. ..
Cashbuild Botswana (Pty) Ltd South Africa Wholesale Trade .. ..
Cb Richard Ellis Inc. United States Other Business Activities .. ..
Game Discount World Botswana (Pty) Ltd South Africa Wholesale Trade .. ..
Handigas (Botswana) (Pty) Ltd Germany Public Administration .. ..
Jacobs Holdings (Pty) Ltd South Africa Public Administration .. ..
Macmillan Botswana Publishing Company (Pty) Ltd Germany Public Administration .. ..
Marcado Lodge Proprietary South Africa Public Administration .. ..
Mosley ( Botswana ) ( Pty ) Ltd Belgium Public Administration .. ..
P G Glass Pty Ltd South Africa Distributive Trade .. ..
Siemens Botswana Germany Public Administration .. .. C. Finance and Insurance Assets Employees
Barclays Bank of Botswana United Kingdom Finance 58 1 200
Source: Who Owns Whom database (https://solutions.dnb.com/wow), retrieved January 2008.
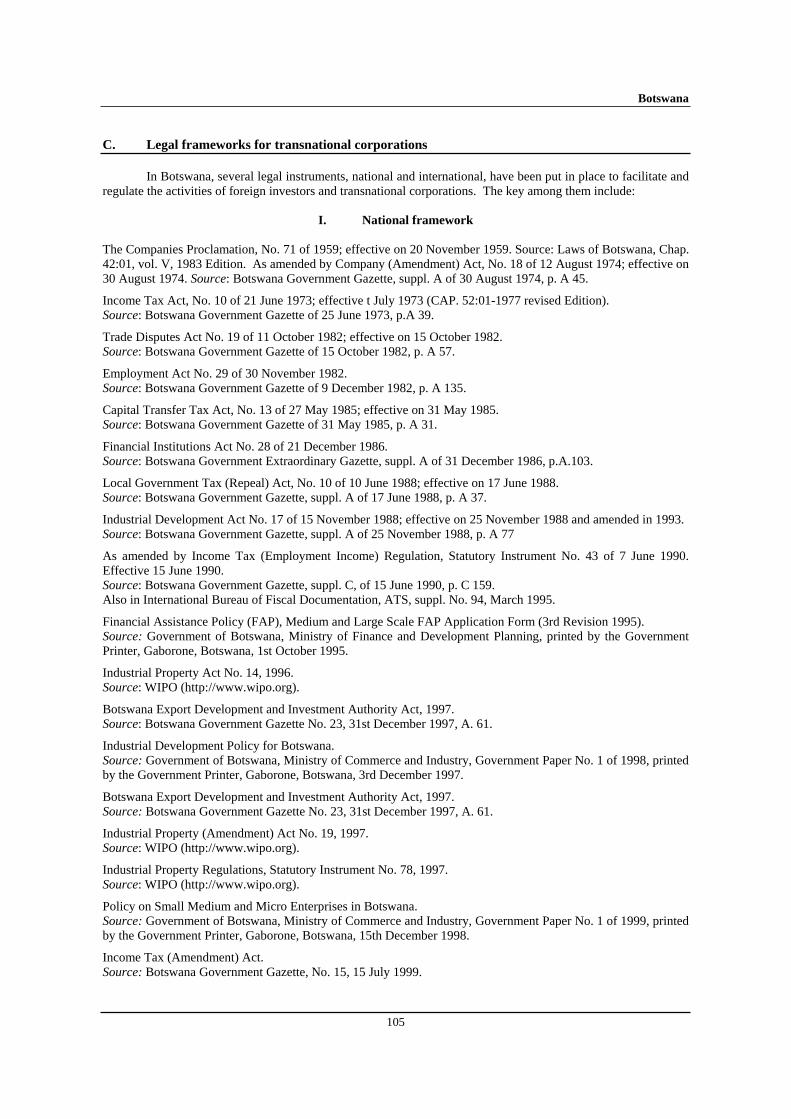
Botswana
105
C. Legal frameworks for transnational corporations
In Botswana, several legal instruments, national and international, have been put in place to facilitate and regulate the activities of foreign investors and transnational corporations. The key among them include:
I. National framework
The Companies Proclamation, No. 71 of 1959; effective on 20 November 1959. Source: Laws of Botswana, Chap. 42:01, vol. V, 1983 Edition. As amended by Company (Amendment) Act, No. 18 of 12 August 1974; effective on 30 August 1974. Source: Botswana Government Gazette, suppl. A of 30 August 1974, p. A 45.
Income Tax Act, No. 10 of 21 June 1973; effective t July 1973 (CAP. 52:01-1977 revised Edition). Source: Botswana Government Gazette of 25 June 1973, p.A 39.
Trade Disputes Act No. 19 of 11 October 1982; effective on 15 October 1982. Source: Botswana Government Gazette of 15 October 1982, p. A 57.
Employment Act No. 29 of 30 November 1982. Source: Botswana Government Gazette of 9 December 1982, p. A 135.
Capital Transfer Tax Act, No. 13 of 27 May 1985; effective on 31 May 1985. Source: Botswana Government Gazette of 31 May 1985, p. A 31.
Financial Institutions Act No. 28 of 21 December 1986. Source: Botswana Government Extraordinary Gazette, suppl. A of 31 December 1986, p.A.103.
Local Government Tax (Repeal) Act, No. 10 of 10 June 1988; effective on 17 June 1988. Source: Botswana Government Gazette, suppl. A of 17 June 1988, p. A 37.
Industrial Development Act No. 17 of 15 November 1988; effective on 25 November 1988 and amended in 1993. Source: Botswana Government Gazette, suppl. A of 25 November 1988, p. A 77
As amended by Income Tax (Employment Income) Regulation, Statutory Instrument No. 43 of 7 June 1990. Effective 15 June 1990. Source: Botswana Government Gazette, suppl. C, of 15 June 1990, p. C 159. Also in International Bureau of Fiscal Documentation, ATS, suppl. No. 94, March 1995.
Financial Assistance Policy (FAP), Medium and Large Scale FAP Application Form (3rd Revision 1995). Source: Government of Botswana, Ministry of Finance and Development Planning, printed by the Government Printer, Gaborone, Botswana, 1st October 1995.
Industrial Property Act No. 14, 1996. Source: WIPO (http://www.wipo.org).
Botswana Export Development and Investment Authority Act, 1997. Source: Botswana Government Gazette No. 23, 31st December 1997, A. 61.
Industrial Development Policy for Botswana. Source: Government of Botswana, Ministry of Commerce and Industry, Government Paper No. 1 of 1998, printed by the Government Printer, Gaborone, Botswana, 3rd December 1997.
Botswana Export Development and Investment Authority Act, 1997. Source: Botswana Government Gazette No. 23, 31st December 1997, A. 61.
Industrial Property (Amendment) Act No. 19, 1997. Source: WIPO (http://www.wipo.org).
Industrial Property Regulations, Statutory Instrument No. 78, 1997. Source: WIPO (http://www.wipo.org).
Policy on Small Medium and Micro Enterprises in Botswana. Source: Government of Botswana, Ministry of Commerce and Industry, Government Paper No. 1 of 1999, printed by the Government Printer, Gaborone, Botswana, 15th December 1998.
Income Tax (Amendment) Act. Source: Botswana Government Gazette, No. 15, 15 July 1999.
World Investment Directory Volume X Africa 2008
106
Statement from the Minister of Finance abolition of all remaining exchange controls, 1999. Source: Budget Speech 1999.
Bank of Botswana (Amendment) Act. Source: Botswana Government Extraordinary Gazette, No. 19, 31 December 1999, Supplement A.
Copyright and Neighbouring Rights Act No. 8, 2000. Source: WIPO (http://www.wipo.org).
Government’s Privatization Policy (April 2000). Source: United States Department of Commerce/ Botswana Country Commercial Guide FY 2001. (http://www1.usatrade.gov/website/ccg.nsf).
II. International Framework
A. Botswana is a party to the following multilateral and regional instruments:
Convention on the Recognition and Enforcement of Foreign Arbitral Awards of 1958, which entered into force on 7th June 1959.
Convention on the Settlement of Investment Disputes between States and Nationals of other States of 1965. Entered into force on 14 October 1966
Convention Establishing the Multilateral Investment Guarantee Agency of 1985, entered into force on 12 April 1988.
Fourth ACP - EEC Convention (Lome IV) of 1989, entered into force on 1st March 1990.
Charter on a Regime of Multinational Industrial Enterprises (MIEs) in the Preferential Trade Area for Eastern and Southern African States (PTA), signed on 21 November 1990, entered into force August 1995. Source: Preferential Trade Area for Eastern ans Southern African States: Report of the Sixteenth Meeting of the Council of Ministers, 17-19 november, 1990, Mbabane, Swaziland (PTA/CM/XVI/2)
Southern Africa Development Community (SADC), signed on 17 August, 1992.Source: http://www.sadc.int/about_sadc/history.php
Treaty Establishing the Market for Eastern and Southern Africa (COMESA), 1993.
Paris Convention for the Protection of Industrial Property of 1883 (Revised at Brussels in 1900, Washington in 1911, The Hague in 1925, London in 1934, Lisbon in 1958 and Stockholm in 1967, and as amended in 1979). Signed in 1994.
Marrakesh Agreement Establishing the World Trade Organisation of 15 April 1994. Entered into force on 1 January 1995. Agreement on Trade-Related Investment Measures. General Agreement on Trade in Services. Agreement on Trade Related Aspects of Intellectual Property Rights.
Partnership Agreement between the Members of The African, Caribbean and Pacific Group of States, of the one part and the European Community and its member states, of the other part signed in Cotonou, Benin on 23 June 2000.
B. Bilateral treaties
1. Bilateral investment treaties for the protection and promotion of investments: Malaysia 1997, Switzerland 1998, China 2000, Germany 2000, Egypt 2003, Ghana 2003, Zimbabwe 2003, Mauritius 2005, Belgium and Luxembourg 2006.
2. Bilateral treaties for the avoidance of double taxation: South Africa 1977, United Kingdom 1977(2005?), Sweden 1992, Mauritius 1995, Barbados 2005.
Botswana
107
D. Sources of information
Official
Bank of Botswana (www.bankofbotswana.bw).
Botswana Export Development and Investment Authority (BEDIA) (www.bedia.co.bw).
Secondary
Allen, T. (1992). “The law relating to private foreign investment in manufacturing in Botswana, Zambia and Zimbabwe”, African Journal of International and Comparative Law, A22.5(4), pp. 44-83.
Business Map (2000). “Botswana: the challenge of development”, in SADC Investor Survey-Complex
Terrain (Johannesburg: Business Map), pp. 28-31.
Economist Intelligence Unit (EIU) (various years). Country Profile: Botswana (London: EIU Ltd.).
_____________ (various years). Country Report: Botswana (London: EIU Ltd.).
Emerging Markets Investment Center (1999). "Botswana Investment and Business Guide" (USA: International Business Publication).
Harvey, C. (1992). "Botswana: is the economic miracle over?", Discussion Paper No. D298, (Brighton, Sussex: Institute of Development Studies).
International Monetary Fund (IMF) (1995). "Botswana – background papers and statistical appendix", Series: IMF Staff Country Report No. 95/1 (Washington, D.C.: IMF), January, mimeo.
_____________(2006). IMF's Sub-Saharan Africa Regional Economic Outlook, March 10, 2006. (Washington D.C.: IMF).
Jefferis, K. (1995). “The Botswana share market and its role in financial and economic development”, World
Development, 23(4), April, pp. 663-678.
Kirby, Robin (2003). "Foreign exchange controls: foreign exchange management", pp. 23 – 27; FIAS: South Asia FDI Roundtable (Washington D.C.: FIAS) (http://www.fias.net/Conferences/030403%20Kirby.pdf).
Kufigwa Siphambe Happy (2003). "The implications of globalization for foreign direct investment in Botswana", paper presented at the South African Economic Association Biannual Conference, September, mimeo.
Mannathoko, Ita (2000). “Botswana”, in World Economic Forum, The Africa Competitiveness Report,
2000/2001 (New York: Oxford University Press), pp. 94-99.
Martin, I. (1990). “Incentives for foreign participation in Botswana’s manufacturing sector”, in A.W. Whiteside, Industrialization and Investment Incentives in Southern Africa, (Pietermaritzburg: University of Natal Press) pp. 45-65.
McLeman N. and N. Armstrong (1994). “Botswana: an objective study of investment conditions”, Corporate
Location (Botswana Supplement), Jan/Feb, pp. 3-14.
World Investment Directory Volume X Africa 2008
108
McPherson, Malcom F. and Tzvetana Rakovski (1999). "Financial Deepening and Investment in Africa: Evidence from Botswana and Mauritius", Discussion Paper no. 727 (Cambridge, MA.: Harvard Institute for International Development).
Ministry of Commerce and Industry (1996). "Botswana: Review of Commerce and Industry (Gaberone: B & T Directories).
Pigato, M. and D. Shiels (2000). “FDI in Africa: old tales and new evidence and a case study of Botswana”, Paper presented at a FIAS Seminar, May, mimeo.
PricewaterhouseCoopers (1994). Doing Business in Botswana (Gaberone: PricewaterhouseCoopers), July.
_______________(1999). Botswana Tax Information Summary, 1999 (Gaberone: PricewaterhouseCoopers).
Shiels D. and D. Spar (2000). “Establishing a manufacturing pant in Africa: Owens Corning & Botswana”, Foreign Investment Advisory Service (Washington D.C.: FIAS), http://www.worldbank.org/ifc/FIAS/calendar/seminar/seminarBotwana.doc, October.
Soderbom, M. and F. Teal (2004). "Size and Efficiency in Africa Manufacturing firms: Evidence from Firm-Level Panel Data." Journal of Development Economics, 73. pp 369 - 394.
Trade Information Center (2000). Botswana: Investment Climate, Openness to Foreign Investment.
http://infoserv2.ita.doc.gov/afweb.nsf, November.
United Nations Conference on Trade and Development (UNCTAD) (2000). Capital Flows and Growth in
Africa (Geneva: UNCTAD/GDS/MDPB/7), July.
______________(2002). Investment Policy Review: Botswana (Geneva: UNCTAD/ITE/IPC/Misc.10).
______________(2005a). Investor-Disputes Arising from Investment Treaties: A Review. UNCTAD Series of International Investment Policies for Development (UNCTAD/ITE/IIT/2005/4).
______________(2005b). A Survey of Support by Investment Promotion Agencies to Linkages, Advisory Studies No. 18 (UNCTAD/ITE/IPC/2005/12).
United States Trade Representative (2006). 2006 Comprehensive Report on U.S. Trade and Investment Policy Toward Sub-Saharan Africa and Implementation of the Africa Growth and Opportunity Act:
The Sixth of Eight Annual Reports, May 2006. (Washington D.C.: US Government).
US Embassy Gaberone (1999). FY 2000 Country Commercial Guides: Botswana (Washington, D.C.: U.S. Department of State), http://www.state.gov/www/ about_state/business/com_guides/2000/africa/botswana_CCG2000.pdf.
World Bank (1993). “Opportunities for industrial development in Botswana: an economy in transition”, 28 April, Report No. 11267-BT.
World Bank/International Finance Corporation (2007). Doing Business 2008 Botswana (Washington D.C.: The World Bank Group).
Burkina Faso
109
Burkina Faso
A. Definitions and sources of data
The Investment Code of 1995 (Loi n°62/95/ADP du 14 Décembre 1995) of Burkina Faso contains a general definition of investment without specific concept of foreign direct investment (FDI). The Banque Centrale des États de l'Afrique de l'Ouest (BCEAO) provides the data on FDI in Burkina Faso. The International Monetary Fund also provides FDI data on the country in its balance-of-payment statistics.
The Investment Code guarantees equal treatment of foreign investors. The Ministry of Industry, Commerce and Mines approves new foreign investments, based on the recommendations of the National Investment Commission. The commission's main criterion is the investment's direct value added. The investment code established three incentive schedules. Schedule 'A' is for investments of less than FCFA 200 million and grants companies with an exemption from most taxes for the first five years of its existence. A tax credit is granted for the ensuing five-year period. Moreover, companies in schedule "A" are permitted to stagger payment of Burkina Faso's registration tax over a four-year period. The registration tax is equal to 3% of the capital invested. Schedule "B" is for investment over FCFA 200 million and grants companies with an eight-year tax exemption from most Burkinabe taxes. It also enables a company to spread the payment of the registration tax over a five-year period. Also, all schedule "A" and "B" investments outside the country's two major cities – Ouagadougou and Bobo-dioulassou receive the above benefits for five extra years. Schedule "'C' only applies to export companies and grants permanent exemption from all Burkinabe taxes. In 2005, Burkina Faso halved the fee for registering new contracts and commercial agreements, and reduced the import tax on basic goods from 2% to 1% for formal-sector businesses. The government also made effort to ease business registration through the setting up of a one-stop shop for investors in Ouagadougou—Centre de formation des enterprises (Cefore), officially launched in May 2006, and the simplification of administrative procedures.
Burkina Faso signed to the Convention on the Settlement of Investment Disputes between State and Nationals of other States on September 16, 1965, is a member of several regional and international organizations and has fostered international investment agreements with developing and developed countries. For instance, Burkina Faso is a member of the West African Monetary and Economic Union, BCEAO, Economic Community of West African States, New Partnership for Africa's Development and African Union. It signed a cooperation treaty with France, a trade, investment protection and technical cooperation agreement with Switzerland and the Cotonou Agreement for renegotiating the trade partnership agreement between African, Caribbean and Pacific countries with the European Union (EU). Burkina Faso is eligible for the African Growth and Opportunity Act, and the EU's Everything But Arms market access initiative. The country is a member of the World Intellectual Property Organization and the World Trade Organization.
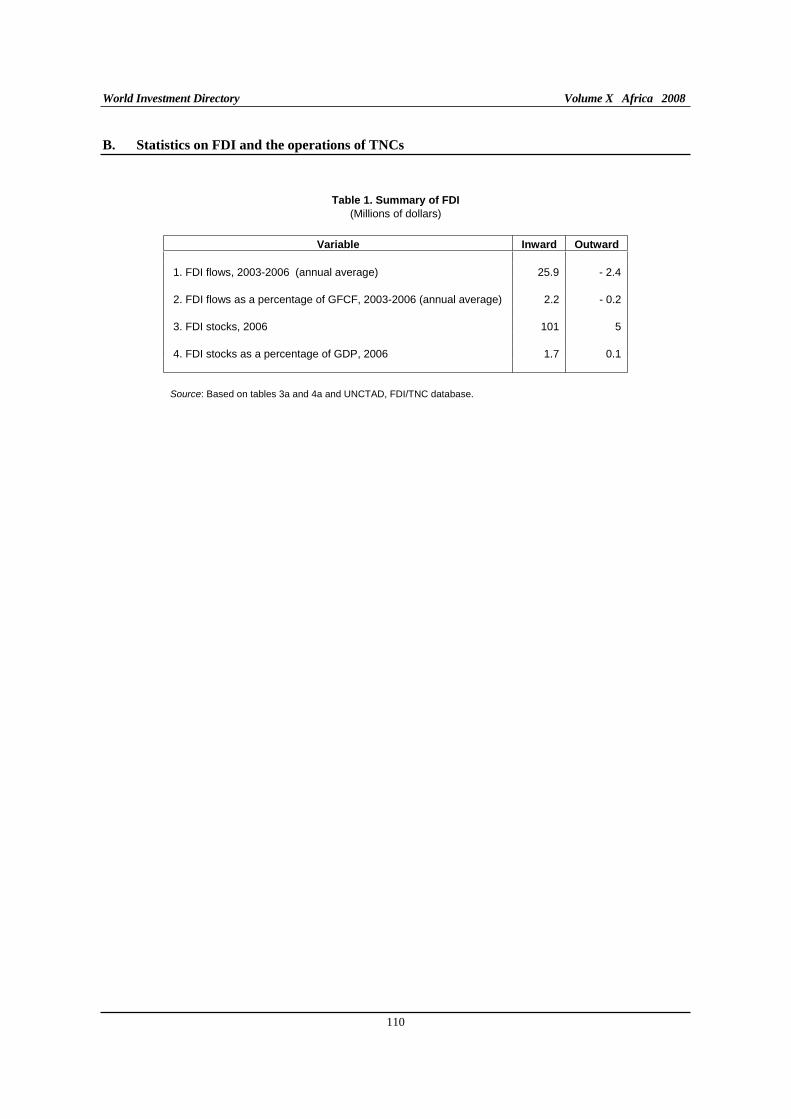
World Investment Directory Volume X Africa 2008
110
B. Statistics on FDI and the operations of TNCs
Table 1. Summary of FDI
(Millions of dollars)
Variable Inward Outward
1. FDI flows, 2003-2006 (annual average) 25.9 - 2.4 2. FDI flows as a percentage of GFCF, 2003-2006 (annual average) 2.2 - 0.2 3. FDI stocks, 2006 101 5 4. FDI stocks as a percentage of GDP, 2006 1.7 0.1 Source: Based on tables 3a and 4a and UNCTAD, FDI/TNC database.
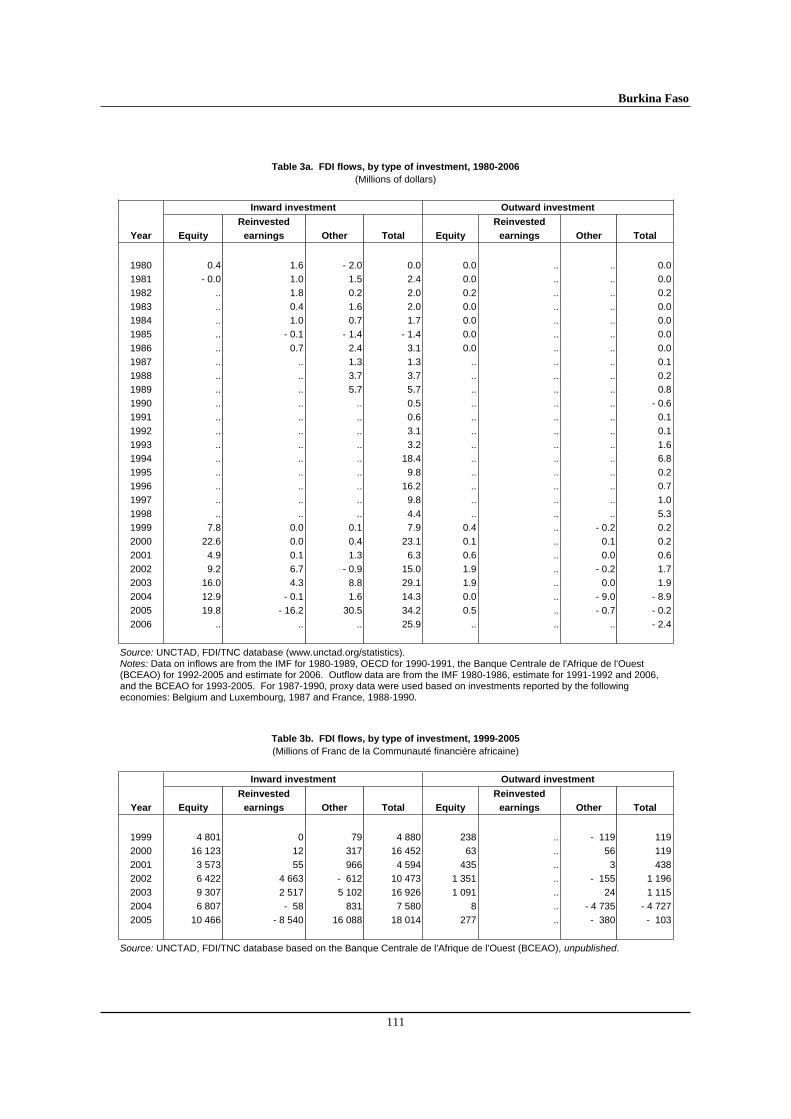
Burkina Faso
111
Table 3a. FDI flows, by type of investment, 1980-2006
(Millions of dollars)
Inward investment Outward investment
Reinvested Reinvested
Year Equity earnings Other Total Equity earnings Other Total
1980 0.4 1.6 - 2.0 0.0 0.0 .. .. 0.0
1981 - 0.0 1.0 1.5 2.4 0.0 .. .. 0.0
1982 .. 1.8 0.2 2.0 0.2 .. .. 0.2
1983 .. 0.4 1.6 2.0 0.0 .. .. 0.0
1984 .. 1.0 0.7 1.7 0.0 .. .. 0.0
1985 .. - 0.1 - 1.4 - 1.4 0.0 .. .. 0.0
1986 .. 0.7 2.4 3.1 0.0 .. .. 0.0
1987 .. .. 1.3 1.3 .. .. .. 0.1
1988 .. .. 3.7 3.7 .. .. .. 0.2
1989 .. .. 5.7 5.7 .. .. .. 0.8
1990 .. .. .. 0.5 .. .. .. - 0.6
1991 .. .. .. 0.6 .. .. .. 0.1
1992 .. .. .. 3.1 .. .. .. 0.1
1993 .. .. .. 3.2 .. .. .. 1.6
1994 .. .. .. 18.4 .. .. .. 6.8
1995 .. .. .. 9.8 .. .. .. 0.2
1996 .. .. .. 16.2 .. .. .. 0.7
1997 .. .. .. 9.8 .. .. .. 1.0
1998 .. .. .. 4.4 .. .. .. 5.3
1999 7.8 0.0 0.1 7.9 0.4 .. - 0.2 0.2
2000 22.6 0.0 0.4 23.1 0.1 .. 0.1 0.2
2001 4.9 0.1 1.3 6.3 0.6 .. 0.0 0.6
2002 9.2 6.7 - 0.9 15.0 1.9 .. - 0.2 1.7
2003 16.0 4.3 8.8 29.1 1.9 .. 0.0 1.9
2004 12.9 - 0.1 1.6 14.3 0.0 .. - 9.0 - 8.9
2005 19.8 - 16.2 30.5 34.2 0.5 .. - 0.7 - 0.2
2006 .. .. .. 25.9 .. .. .. - 2.4
Source: UNCTAD, FDI/TNC database (www.unctad.org/statistics). Notes: Data on inflows are from the IMF for 1980-1989, OECD for 1990-1991, the Banque Centrale de l'Afrique de l'Ouest (BCEAO) for 1992-2005 and estimate for 2006. Outflow data are from the IMF 1980-1986, estimate for 1991-1992 and 2006, and the BCEAO for 1993-2005. For 1987-1990, proxy data were used based on investments reported by the following economies: Belgium and Luxembourg, 1987 and France, 1988-1990.
Table 3b. FDI flows, by type of investment, 1999-2005
(Millions of Franc de la Communauté financière africaine)
Inward investment Outward investment
Reinvested Reinvested
Year Equity earnings Other Total Equity earnings Other Total
1999 4 801 0 79 4 880 238 .. - 119 119
2000 16 123 12 317 16 452 63 .. 56 119
2001 3 573 55 966 4 594 435 .. 3 438
2002 6 422 4 663 - 612 10 473 1 351 .. - 155 1 196
2003 9 307 2 517 5 102 16 926 1 091 .. 24 1 115
2004 6 807 - 58 831 7 580 8 .. - 4 735 - 4 727
2005 10 466 - 8 540 16 088 18 014 277 .. - 380 - 103
Source: UNCTAD, FDI/TNC database based on the Banque Centrale de l'Afrique de l'Ouest (BCEAO), unpublished.
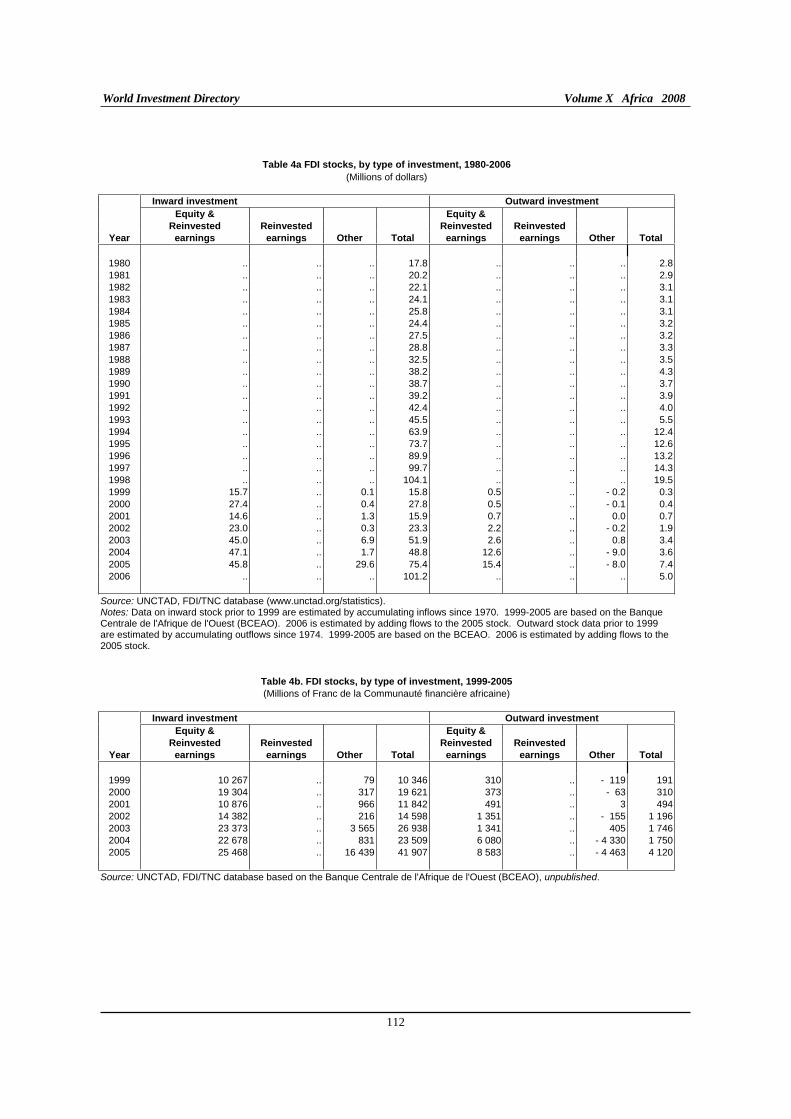
World Investment Directory Volume X Africa 2008
112
Table 4a FDI stocks, by type of investment, 1980-2006
(Millions of dollars)
Inward investment Outward investment
Equity & Equity &
Reinvested Reinvested Reinvested Reinvested
Year earnings earnings Other Total earnings earnings Other Total
1980 .. .. .. 17.8 .. .. .. 2.81981 .. .. .. 20.2 .. .. .. 2.91982 .. .. .. 22.1 .. .. .. 3.11983 .. .. .. 24.1 .. .. .. 3.11984 .. .. .. 25.8 .. .. .. 3.11985 .. .. .. 24.4 .. .. .. 3.21986 .. .. .. 27.5 .. .. .. 3.21987 .. .. .. 28.8 .. .. .. 3.31988 .. .. .. 32.5 .. .. .. 3.51989 .. .. .. 38.2 .. .. .. 4.31990 .. .. .. 38.7 .. .. .. 3.71991 .. .. .. 39.2 .. .. .. 3.91992 .. .. .. 42.4 .. .. .. 4.01993 .. .. .. 45.5 .. .. .. 5.51994 .. .. .. 63.9 .. .. .. 12.41995 .. .. .. 73.7 .. .. .. 12.61996 .. .. .. 89.9 .. .. .. 13.21997 .. .. .. 99.7 .. .. .. 14.31998 .. .. .. 104.1 .. .. .. 19.51999 15.7 .. 0.1 15.8 0.5 .. - 0.2 0.32000 27.4 .. 0.4 27.8 0.5 .. - 0.1 0.42001 14.6 .. 1.3 15.9 0.7 .. 0.0 0.72002 23.0 .. 0.3 23.3 2.2 .. - 0.2 1.92003 45.0 .. 6.9 51.9 2.6 .. 0.8 3.42004 47.1 .. 1.7 48.8 12.6 .. - 9.0 3.62005 45.8 .. 29.6 75.4 15.4 .. - 8.0 7.42006 .. .. .. 101.2 .. .. .. 5.0
Source: UNCTAD, FDI/TNC database (www.unctad.org/statistics). Notes: Data on inward stock prior to 1999 are estimated by accumulating inflows since 1970. 1999-2005 are based on the Banque Centrale de l'Afrique de l'Ouest (BCEAO). 2006 is estimated by adding flows to the 2005 stock. Outward stock data prior to 1999 are estimated by accumulating outflows since 1974. 1999-2005 are based on the BCEAO. 2006 is estimated by adding flows to the2005 stock.
Table 4b. FDI stocks, by type of investment, 1999-2005
(Millions of Franc de la Communauté financière africaine)
Inward investment Outward investment
Equity & Equity &
Reinvested Reinvested Reinvested Reinvested
Year earnings earnings Other Total earnings earnings Other Total
1999 10 267 .. 79 10 346 310 .. - 119 1912000 19 304 .. 317 19 621 373 .. - 63 3102001 10 876 .. 966 11 842 491 .. 3 4942002 14 382 .. 216 14 598 1 351 .. - 155 1 1962003 23 373 .. 3 565 26 938 1 341 .. 405 1 7462004 22 678 .. 831 23 509 6 080 .. - 4 330 1 7502005 25 468 .. 16 439 41 907 8 583 .. - 4 463 4 120
Source: UNCTAD, FDI/TNC database based on the Banque Centrale de l'Afrique de l'Ouest (BCEAO), unpublished.
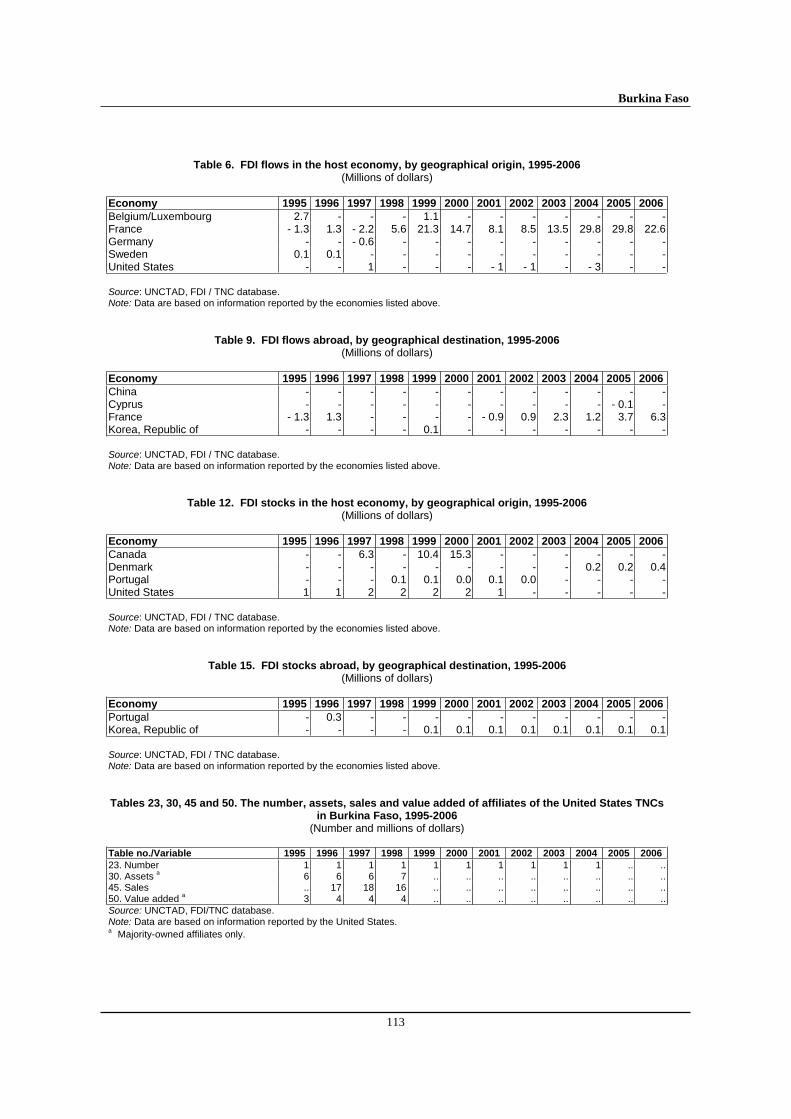
Burkina Faso
113
Table 6. FDI flows in the host economy, by geographical origin, 1995-2006 (Millions of dollars)
Economy 1995 1996 1997 1998 1999 2000 2001 2002 2003 2004 2005 2006Belgium/Luxembourg 2.7 - - - 1.1 - - - - - - -France - 1.3 1.3 - 2.2 5.6 21.3 14.7 8.1 8.5 13.5 29.8 29.8 22.6Germany - - - 0.6 - - - - - - - - -Sweden 0.1 0.1 - - - - - - - - - -United States - - 1 - - - - 1 - 1 - - 3 - - Source: UNCTAD, FDI / TNC database. Note: Data are based on information reported by the economies listed above.
Table 9. FDI flows abroad, by geographical destination, 1995-2006 (Millions of dollars)
Economy 1995 1996 1997 1998 1999 2000 2001 2002 2003 2004 2005 2006China - - - - - - - - - - - -Cyprus - - - - - - - - - - - 0.1 -France - 1.3 1.3 - - - - - 0.9 0.9 2.3 1.2 3.7 6.3Korea, Republic of - - - - 0.1 - - - - - - - Source: UNCTAD, FDI / TNC database. Note: Data are based on information reported by the economies listed above.
Table 12. FDI stocks in the host economy, by geographical origin, 1995-2006 (Millions of dollars)
Economy 1995 1996 1997 1998 1999 2000 2001 2002 2003 2004 2005 2006Canada - - 6.3 - 10.4 15.3 - - - - - -Denmark - - - - - - - - - 0.2 0.2 0.4Portugal - - - 0.1 0.1 0.0 0.1 0.0 - - - -United States 1 1 2 2 2 2 1 - - - - - Source: UNCTAD, FDI / TNC database. Note: Data are based on information reported by the economies listed above.
Table 15. FDI stocks abroad, by geographical destination, 1995-2006 (Millions of dollars)
Economy 1995 1996 1997 1998 1999 2000 2001 2002 2003 2004 2005 2006Portugal - 0.3 - - - - - - - - - -Korea, Republic of - - - - 0.1 0.1 0.1 0.1 0.1 0.1 0.1 0.1 Source: UNCTAD, FDI / TNC database. Note: Data are based on information reported by the economies listed above. Tables 23, 30, 45 and 50. The number, assets, sales and value added of affiliates of the United States TNCs
in Burkina Faso, 1995-2006 (Number and millions of dollars)
Table no./Variable 1995 1996 1997 1998 1999 2000 2001 2002 2003 2004 2005 200623. Number 1 1 1 1 1 1 1 1 1 1 .. ..30. Assets a 6 6 6 7 .. .. .. .. .. .. .. ..45. Sales .. 17 18 16 .. .. .. .. .. .. .. ..50. Value added a 3 4 4 4 .. .. .. .. .. .. .. ..Source: UNCTAD, FDI/TNC database. Note: Data are based on information reported by the United States. a Majority-owned affiliates only.
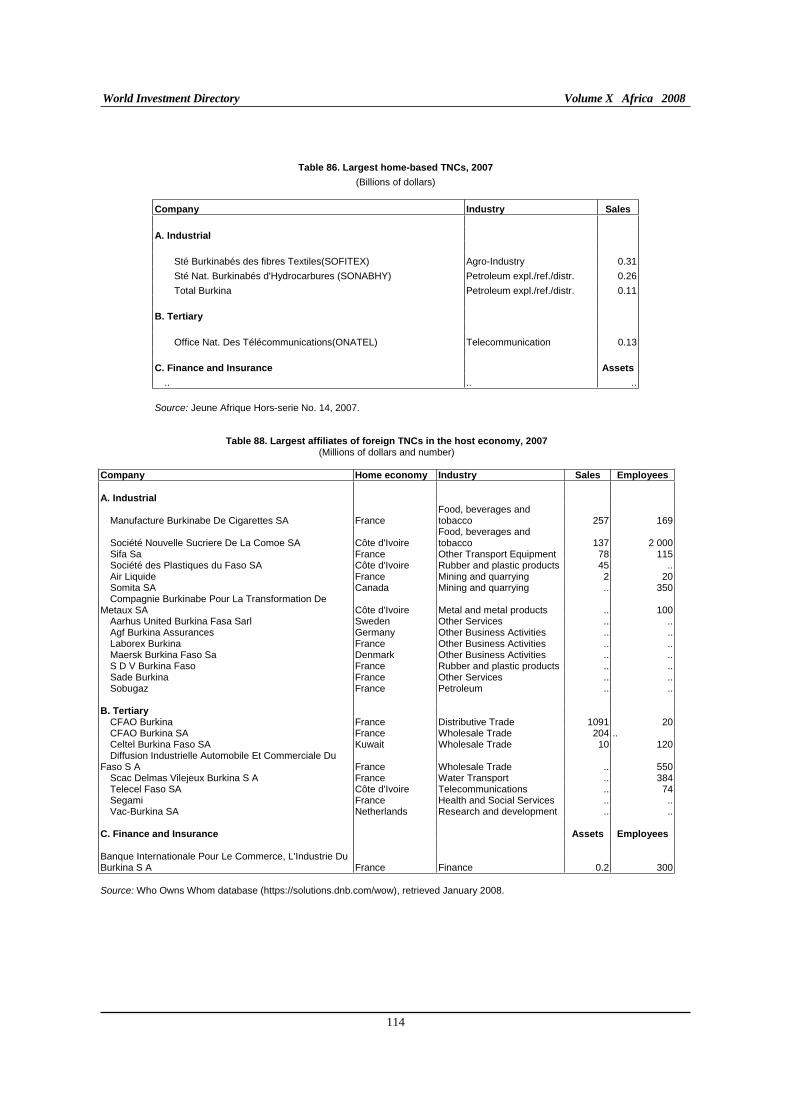
World Investment Directory Volume X Africa 2008
114
Table 86. Largest home-based TNCs, 2007
(Billions of dollars)
Company Industry Sales
A. Industrial
Sté Burkinabés des fibres Textiles(SOFITEX) Agro-Industry 0.31
Sté Nat. Burkinabés d'Hydrocarbures (SONABHY) Petroleum expl./ref./distr. 0.26
Total Burkina Petroleum expl./ref./distr. 0.11
B. Tertiary
Office Nat. Des Télécommunications(ONATEL) Telecommunication 0.13
C. Finance and Insurance Assets
.. .. ..
Source: Jeune Afrique Hors-serie No. 14, 2007.
Table 88. Largest affiliates of foreign TNCs in the host economy, 2007 (Millions of dollars and number)
Company Home economy Industry Sales Employees A. Industrial
Manufacture Burkinabe De Cigarettes SA France Food, beverages and tobacco 257 169
Société Nouvelle Sucriere De La Comoe SA Côte d'Ivoire Food, beverages and tobacco 137 2 000
Sifa Sa France Other Transport Equipment 78 115Société des Plastiques du Faso SA Côte d'Ivoire Rubber and plastic products 45 ..Air Liquide France Mining and quarrying 2 20Somita SA Canada Mining and quarrying .. 350Compagnie Burkinabe Pour La Transformation De
Metaux SA Côte d'Ivoire Metal and metal products .. 100Aarhus United Burkina Fasa Sarl Sweden Other Services .. ..Agf Burkina Assurances Germany Other Business Activities .. ..Laborex Burkina France Other Business Activities .. ..Maersk Burkina Faso Sa Denmark Other Business Activities .. ..S D V Burkina Faso France Rubber and plastic products .. ..Sade Burkina France Other Services .. ..Sobugaz France Petroleum .. ..
B. Tertiary
CFAO Burkina France Distributive Trade 1091 20CFAO Burkina SA France Wholesale Trade 204 .. Celtel Burkina Faso SA Kuwait Wholesale Trade 10 120Diffusion Industrielle Automobile Et Commerciale Du
Faso S A France Wholesale Trade .. 550Scac Delmas Vilejeux Burkina S A France Water Transport .. 384Telecel Faso SA Côte d'Ivoire Telecommunications .. 74Segami France Health and Social Services .. ..Vac-Burkina SA Netherlands Research and development .. ..
C. Finance and Insurance Assets Employees Banque Internationale Pour Le Commerce, L'Industrie Du Burkina S A France Finance 0.2 300
Source: Who Owns Whom database (https://solutions.dnb.com/wow), retrieved January 2008.
Burkina Faso
115
C. Legal framework for transnational corporations
Burkina Faso has enacted a number of legal instruments at national, bilateral and multilateral levels to regulate the activities of foreign investors in the country. The key instruments that apply at these levels:
I. National framework
Ordinance No. 91-0044 Authorising the Privatization of 12 Enterprises and creating a Privatization Commission of 17 July 1991. Source: World Bank, Technical Paper No. 186, "Divestiture of State Enterprises. An overview of the legal framework".
Decree No. 91-0385 setting forth the composition, Organisation and Operations of the Privatization Commission of 15 Sept. 1991. Source: World Bank, Technical Paper No. 186, "Divestiture of State Enterprises. An overview of the legal framework".
Ordinance No. 92/PRES of July 1992 on the Investment Code Source: Official Copy - Ministry of Industry-Commerce and Mines.
Implementation Decree No. 92-230/PRES/MICM, on the Implementation of the Ordinance concerning the Investment Code of Burkina Faso Source: Official Copy - Ministry of Industry-Commerce and Mines.
Ordinance No. 93/PRES of March 1993 concerning the Mining Code of Burkina Faso Source: Official Copy - Ministry of Industry-Commerce and Mines.
Loi n°62/95/ADP du 14 décembre 1995, portant code des investissements au Burkina Faso Source:La Découverte du Burkina Faso (http://www.primature.gov.bf/economie/freglement.htm)
Loi No. 032/99/AN du 22 Décembre 1999 portant protection de la propriété littéraire et artistique. Source: WIPO (http://www.wipo.org).
II. International Framework
A. Burkin Faso is a party to the following multilateral and regional instruments:
Convention on the Recognition and Enforcement of Foreign Arbitral Awards of 1958, which entered into force on 7th June 1959.
Convention on the Settlement of Investment Disputes between States and Nationals of other States of 1965. Entered into force on 14 October 1966.
Bangui Agreement, March 1977 (Annex I). Source: WIPO (http://www.wipo.org).
Bangui Agreement, March 1977 (Annexes II and IV). Source: WIPO (http://www.wipo.org).
Bangui Agreement, March 1977 (Annex III). Source: WIPO (http://www.wipo.org).
World Investment Directory Volume X Africa 2008
116
Agreement for the Promotion, Protection and Guarantee of Investment Among Member States of the Organization of Islamic Conference of l June 1981; entered into force on 23 September 1986.
Convention Establishing the Multilateral Investment Guarantee Agency of 1985, entered into force on 12 April 1988.
Articles of Agreement of the Islamic Corporation for the Insurance of Investment and Export Credit of 19 February 1991 En' into force on 1 August 1994.
Paris Convention for the Protection of Industrial Property of 1883 (Revised at Brussels in 1900, Washington in 1911, The Hague in 1925, London in 1934, Lisbon in 1958 and Stockholm in 1967, and as amended in 1979). Signed in 1994.
West African Economic and Monetary Union (WAEMU), established in 1994.
Marrakesh Agreement Establishing the World Trade Organisation of 15 April 1994. Entered into force on 1 January 1995. Agreement on Trade-Related Investment Measures. General Agreement on Trade in Services. Agreement on Trade Related Aspects of Intellectual Property Rights.
Revised Treaty of the Economic Community of West African States. ECOWAS
Partnership Agreement between the Members of The African, Caribbean and Pacific Group of States, of the one part and the European Community and its member states, of the other part signed in Cotonou, Benin on 23 June 2000.
One stop shop 2005/2006 Source: www.eiu.com EIU Country report Main report June 2006, http://test.maisondelentreprise.org/index2.php?option=com_content&do_pdf=1&id=399
B. Bilateral treaties
1. Bilateral investment treaties for the protection and promotion of investments: Switzerland 1969, Tunisia 1993, Germany 1996, Malaysia 1998, Netherlands 2000, Belgium/Luxembourg 2001, Benin 2001, Chad 2001, Comoros 2001, Ghana 2001, Mauritania 2001, Guinea 2003, Korea, Republic of 2004, Morocco 2007.
2. Bilateral treaties for the avoidance of double taxation: France 1965, Tunisia 2003.
Burkina Faso
117
D. Sources of information
Official
Banque Centrale des Etats de l'Afrique de l'Ouest (www.bceao.in).
Commission Nationale des Investissements (www.ministere-finances.dj).
Secondary
Bennell, Paul (1997). "Foreign direct investment in Africa: rhetoric and reality", SAIS Review (Summer/Fall); pp. 127-139.
___________ (1997). "Privatization in Sub-Saharan Africa: progress and prospects during the 1990s", World
Development, vol. 25, no. 11, pp. 1785-1803.
Economist Intelligence Unit (EIU) (various years). Country Profile: Burkina Faso (London: EIU Ltd.).
___________ (various years). Country Report: Burkina Faso (London: EIU Ltd.).
International Monetary Fund (IMF) (2006). IMF's Sub-Saharan Africa Regional Economic Outlook, March 10, 2006. (Washington D.C.: IMF).
Maatman, A. (2000). "Si le fleuve se tord, que le crocodile se torde." Une analyse des systemes agrarian de la region Nord-Ouest du Burkina Faso a l'aide des modeles de programmation mathematique (PhD Thesis, University of Gronnigen).
Marches Tropicaux et Mediterraneens (1985). "Nouveau code d'Investissements du Burkina-Faso", 41(2048), 8 February, pp. 321-322.
Multilateral Investment Guarantee Agency (MIGA) (2002). Annual Report 2002 (Washington D.C.: MIGA), p. 9.
Soderbom, M. and F. Teal (2004). "Size and Efficiency in Africa Manufacturing firms: Evidence from Firm-Level Panel Data." Journal of Development Economics, 73. pp 369 - 394.
United Nations Conference on Trade and Development (UNCTAD) (2003). FDI in landlocked developing
countries at a glance (Geneva: UNCTAD/ITE/IIA/2003/5).
_____________(2005a). Investor-Disputes Arising from Investment Treaties: A Review. UNCTAD Series of International Investment Policies for Development (UNCTAD/ITE/IIT/2005/4).
_____________(2005b). A Survey of Support by Investment Promotion Agencies to Linkages, Advisory Studies No. 18 (UNCTAD/ITE/IPC/2005/12).
_____________(2005c). FDI in least developed countries at a glance: 2005/2006
(UNCTAD/ITE/IIA/2005/17).
United States Trade Representative (2006). 2006 Comprehensive Report on U.S. Trade and Investment
Policy Toward Sub-Saharan Africa and Implementation of the Africa Growth and Opportunity Act:
The Sixth of Eight Annual Reports, May 2006. (Washington D.C.: US Government).
World Bank (2002). Global Economic Prospects and the Developing Countries 2003: Investing to Unlock
Opportunities (Washington D.C.: World Bank).
World Investment Directory Volume X Africa 2008
118
World Bank/International Finance Corporation (2007). Doing Business 2008 Burkina Faso (Washington D.C.: The World Bank Group).
World Economic Forum (2000/2001). Africa competitiveness report (New York: Oxford University Press).
Zeiger, L. and P. Michelini (1989). "Untapped mineral resources of West Africa offer opportunities for trade and investment in the 1990s", Business America, 110(24), December, pp 28-31.
Burundi
119
Burundi
A. Definitions and sources of data
Burundi Investment Code (Décret-loi No. 1/8 d’avril 1979 portant Code des investissements du Burundi and Law No 1/001/1986 of 10 July 1986) govern all foreign investment in the country. The Codes do not provide specific definition of foreign direct investment (FDI). Data on FDI in the country are gathered by the National Bank of the Republic of Burundi. Data are also reported by the International Monetary Fund in its balance-of-payment statistics.
The Government of Burundi treats domestic and foreign firms equally and seeks FDI. In the country, residents may hold foreign exchange accounts but documentation must be submitted to the National Bank. Some withdrawals require supporting documentation and an approval from the National Bank to hold them abroad. Non-residents may hold foreign exchange accounts and withdraw funds up to a set limit on presentation of documentation. All payments for invisibles require an approval and are often subject to limitations and bona fide tests. Capital transfers out of Burundi by residents are approved on an individual basis. Capital transactions such as credit operations, direct investment and personal capital movements are subject to restrictions or authorization requirements.
Burundi participates in many integration and market access schemes. It signed to the Convention on the Settlement of Investment Disputes between State and Nationals of other States on February 17, 1967, and bilateral treaties with many countries including Comoros, Germany, Belgium and Luxembourg, Mauritius and the United Kingdom. Burundi is also signatory to regional integration agreements, including the African Union, New Partnership for Africa's Development, the Community Investment Code of the Economic Community of the Great Lakes Countries, among others. It is party to the Cotonou Agreement for renegotiating the partnership agreements between the Africa, Caribbean and Pacific and the European Union countries, the Economic Community of Central African States, the Common Market for Eastern and Southern African and eligible for the African Growth and Opportunity Act. The country belongs to multilateral agreements including the Convention establishing the Multilateral Investment Guarantee Agency, the Paris Convention for the protection of Industrial Property and the World Trade Organization.
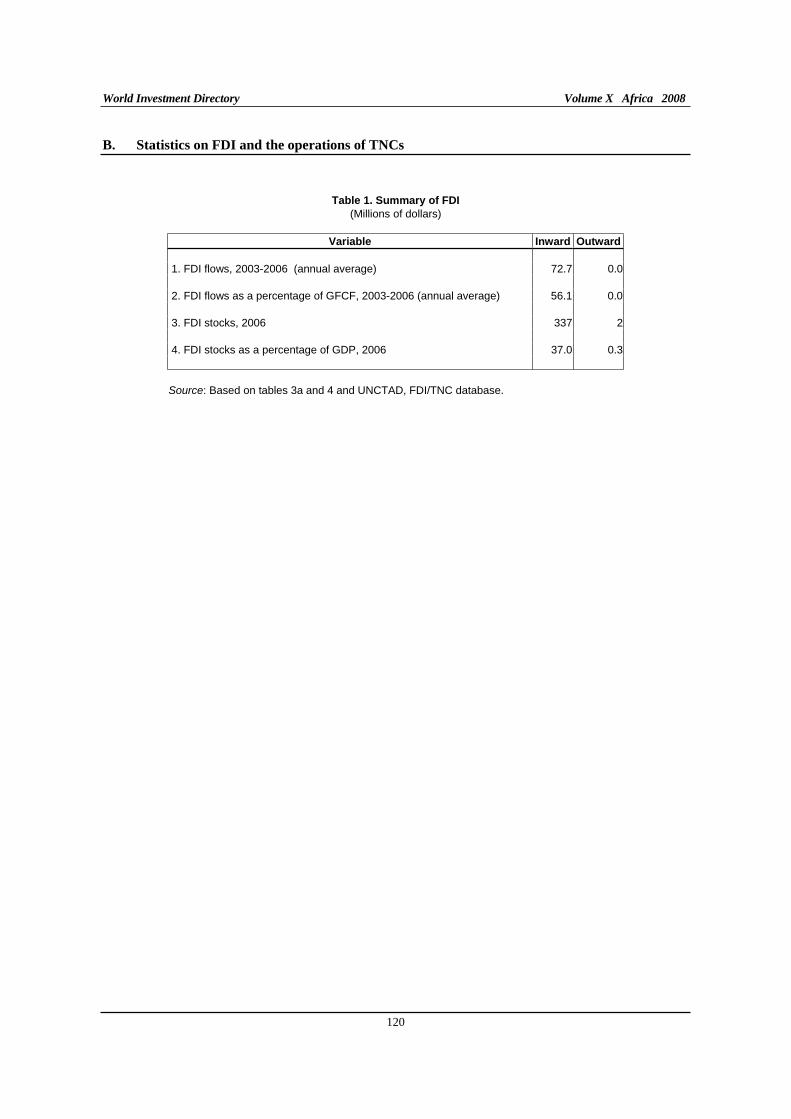
World Investment Directory Volume X Africa 2008
120
B. Statistics on FDI and the operations of TNCs
Table 1. Summary of FDI
(Millions of dollars)
Variable Inward Outward
1. FDI flows, 2003-2006 (annual average) 72.7 0.0
2. FDI flows as a percentage of GFCF, 2003-2006 (annual average) 56.1 0.0
3. FDI stocks, 2006 337 2
4. FDI stocks as a percentage of GDP, 2006 37.0 0.3
Source: Based on tables 3a and 4 and UNCTAD, FDI/TNC database.
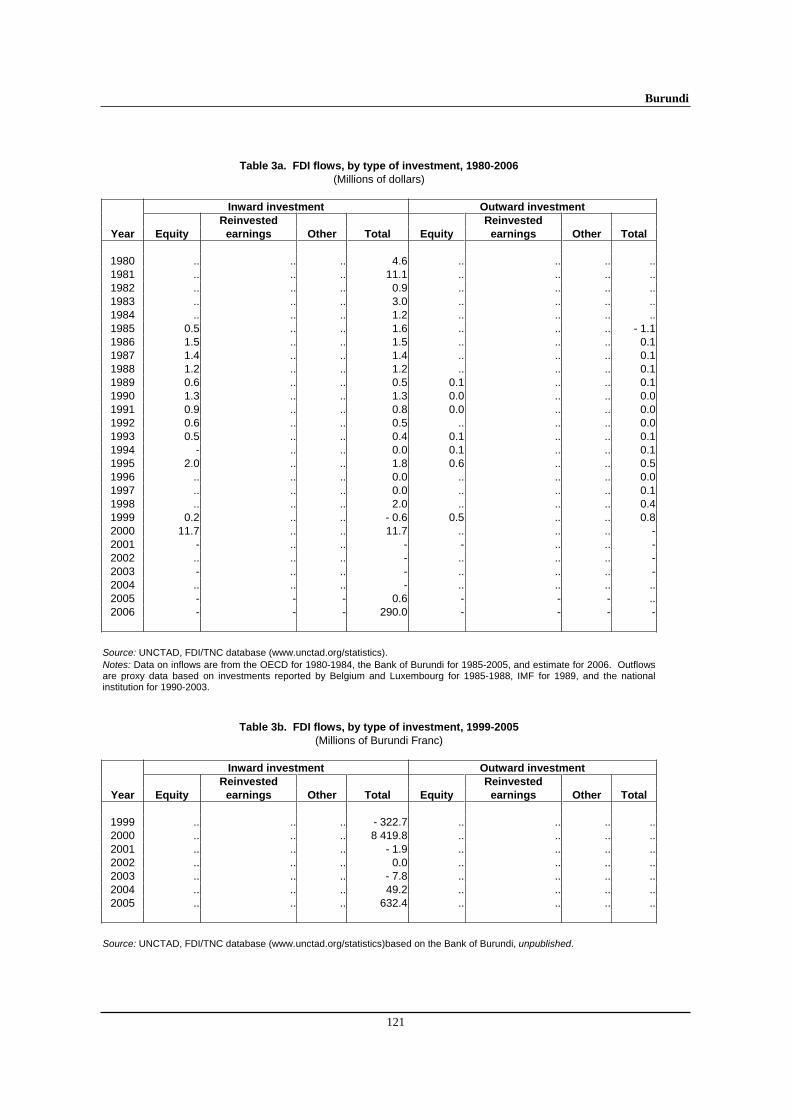
Burundi
121
Table 3a. FDI flows, by type of investment, 1980-2006
(Millions of dollars)
Inward investment Outward investment
Reinvested Reinvested
Year Equity earnings Other Total Equity earnings Other Total
1980 .. .. .. 4.6 .. .. .. ..1981 .. .. .. 11.1 .. .. .. ..1982 .. .. .. 0.9 .. .. .. ..1983 .. .. .. 3.0 .. .. .. ..1984 .. .. .. 1.2 .. .. .. ..1985 0.5 .. .. 1.6 .. .. .. - 1.11986 1.5 .. .. 1.5 .. .. .. 0.11987 1.4 .. .. 1.4 .. .. .. 0.11988 1.2 .. .. 1.2 .. .. .. 0.11989 0.6 .. .. 0.5 0.1 .. .. 0.11990 1.3 .. .. 1.3 0.0 .. .. 0.01991 0.9 .. .. 0.8 0.0 .. .. 0.01992 0.6 .. .. 0.5 .. .. .. 0.01993 0.5 .. .. 0.4 0.1 .. .. 0.11994 - .. .. 0.0 0.1 .. .. 0.11995 2.0 .. .. 1.8 0.6 .. .. 0.51996 .. .. .. 0.0 .. .. .. 0.01997 .. .. .. 0.0 .. .. .. 0.11998 .. .. .. 2.0 .. .. .. 0.41999 0.2 .. .. - 0.6 0.5 .. .. 0.82000 11.7 .. .. 11.7 .. .. .. -2001 - .. .. - - .. .. -2002 .. .. .. - .. .. .. -2003 - .. .. - .. .. .. -2004 .. .. .. - .. .. .. ..2005 - - - 0.6 - - - ..2006 - - - 290.0 - - - -
Source: UNCTAD, FDI/TNC database (www.unctad.org/statistics). Notes: Data on inflows are from the OECD for 1980-1984, the Bank of Burundi for 1985-2005, and estimate for 2006. Outflows are proxy data based on investments reported by Belgium and Luxembourg for 1985-1988, IMF for 1989, and the national institution for 1990-2003.
Table 3b. FDI flows, by type of investment, 1999-2005
(Millions of Burundi Franc)
Inward investment Outward investment
Reinvested Reinvested
Year Equity earnings Other Total Equity earnings Other Total
1999 .. .. .. - 322.7 .. .. .. ..2000 .. .. .. 8 419.8 .. .. .. ..2001 .. .. .. - 1.9 .. .. .. ..2002 .. .. .. 0.0 .. .. .. ..2003 .. .. .. - 7.8 .. .. .. ..2004 .. .. .. 49.2 .. .. .. ..2005 .. .. .. 632.4 .. .. .. ..
Source: UNCTAD, FDI/TNC database (www.unctad.org/statistics)based on the Bank of Burundi, unpublished.
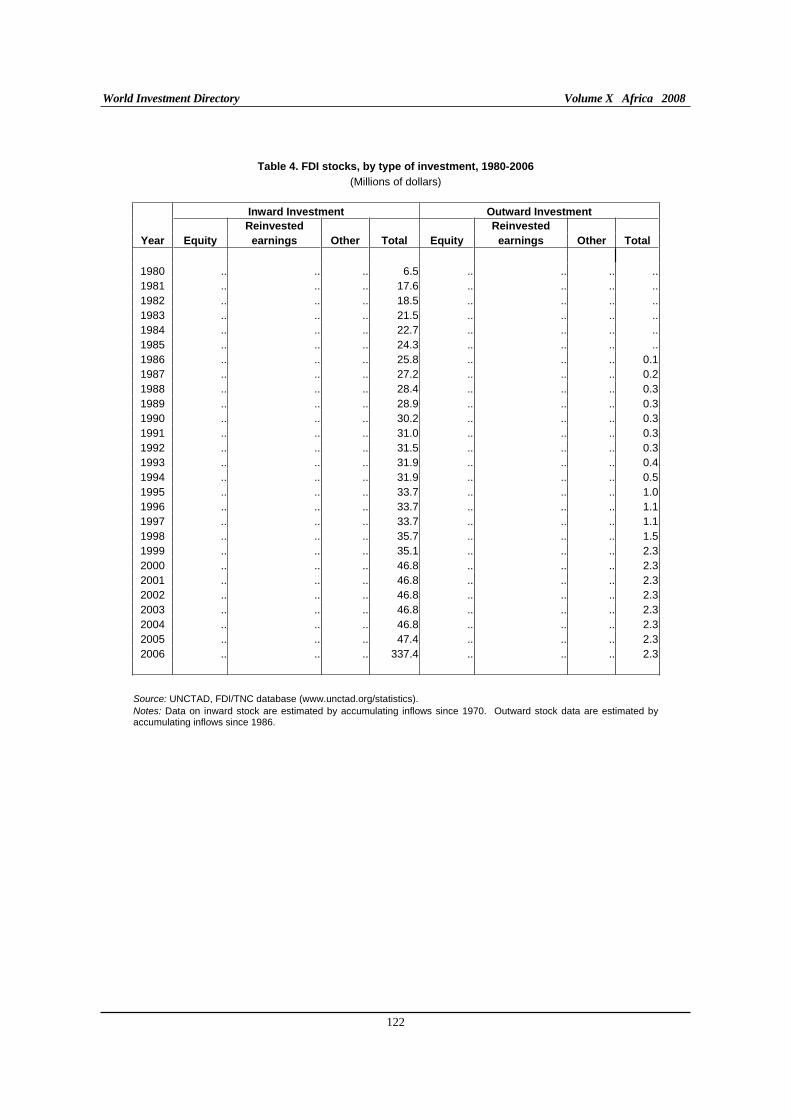
World Investment Directory Volume X Africa 2008
122
Table 4. FDI stocks, by type of investment, 1980-2006
(Millions of dollars)
Inward Investment Outward Investment
Reinvested Reinvested
Year Equity earnings Other Total Equity earnings Other Total
1980 .. .. .. 6.5 .. .. .. ..1981 .. .. .. 17.6 .. .. .. ..1982 .. .. .. 18.5 .. .. .. ..1983 .. .. .. 21.5 .. .. .. ..1984 .. .. .. 22.7 .. .. .. ..1985 .. .. .. 24.3 .. .. .. ..1986 .. .. .. 25.8 .. .. .. 0.11987 .. .. .. 27.2 .. .. .. 0.21988 .. .. .. 28.4 .. .. .. 0.31989 .. .. .. 28.9 .. .. .. 0.31990 .. .. .. 30.2 .. .. .. 0.31991 .. .. .. 31.0 .. .. .. 0.31992 .. .. .. 31.5 .. .. .. 0.31993 .. .. .. 31.9 .. .. .. 0.41994 .. .. .. 31.9 .. .. .. 0.51995 .. .. .. 33.7 .. .. .. 1.01996 .. .. .. 33.7 .. .. .. 1.11997 .. .. .. 33.7 .. .. .. 1.11998 .. .. .. 35.7 .. .. .. 1.51999 .. .. .. 35.1 .. .. .. 2.32000 .. .. .. 46.8 .. .. .. 2.32001 .. .. .. 46.8 .. .. .. 2.32002 .. .. .. 46.8 .. .. .. 2.32003 .. .. .. 46.8 .. .. .. 2.32004 .. .. .. 46.8 .. .. .. 2.32005 .. .. .. 47.4 .. .. .. 2.32006 .. .. .. 337.4 .. .. .. 2.3
Source: UNCTAD, FDI/TNC database (www.unctad.org/statistics). Notes: Data on inward stock are estimated by accumulating inflows since 1970. Outward stock data are estimated by accumulating inflows since 1986.
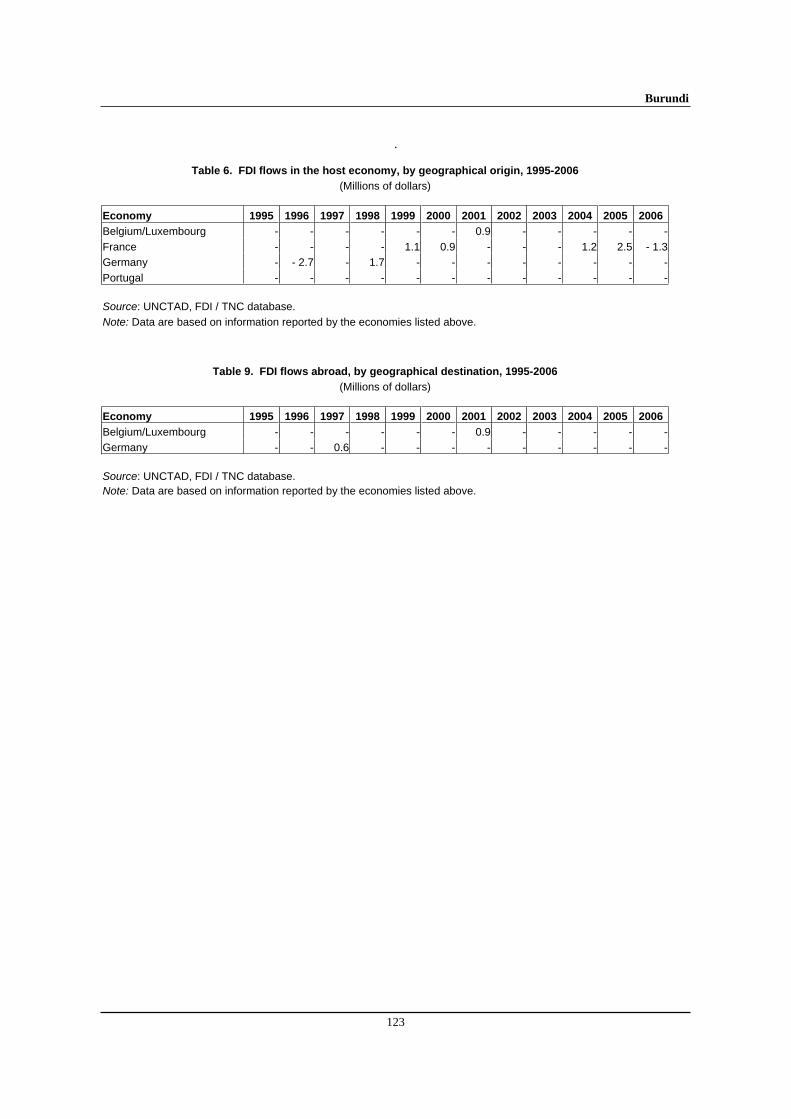
Burundi
123
.
Table 6. FDI flows in the host economy, by geographical origin, 1995-2006
(Millions of dollars)
Economy 1995 1996 1997 1998 1999 2000 2001 2002 2003 2004 2005 2006
Belgium/Luxembourg - - - - - - 0.9 - - - - -
France - - - - 1.1 0.9 - - - 1.2 2.5 - 1.3
Germany - - 2.7 - 1.7 - - - - - - - -
Portugal - - - - - - - - - - - - Source: UNCTAD, FDI / TNC database.
Note: Data are based on information reported by the economies listed above.
Table 9. FDI flows abroad, by geographical destination, 1995-2006
(Millions of dollars)
Economy 1995 1996 1997 1998 1999 2000 2001 2002 2003 2004 2005 2006
Belgium/Luxembourg - - - - - - 0.9 - - - - -
Germany - - 0.6 - - - - - - - - - Source: UNCTAD, FDI / TNC database. Note: Data are based on information reported by the economies listed above.
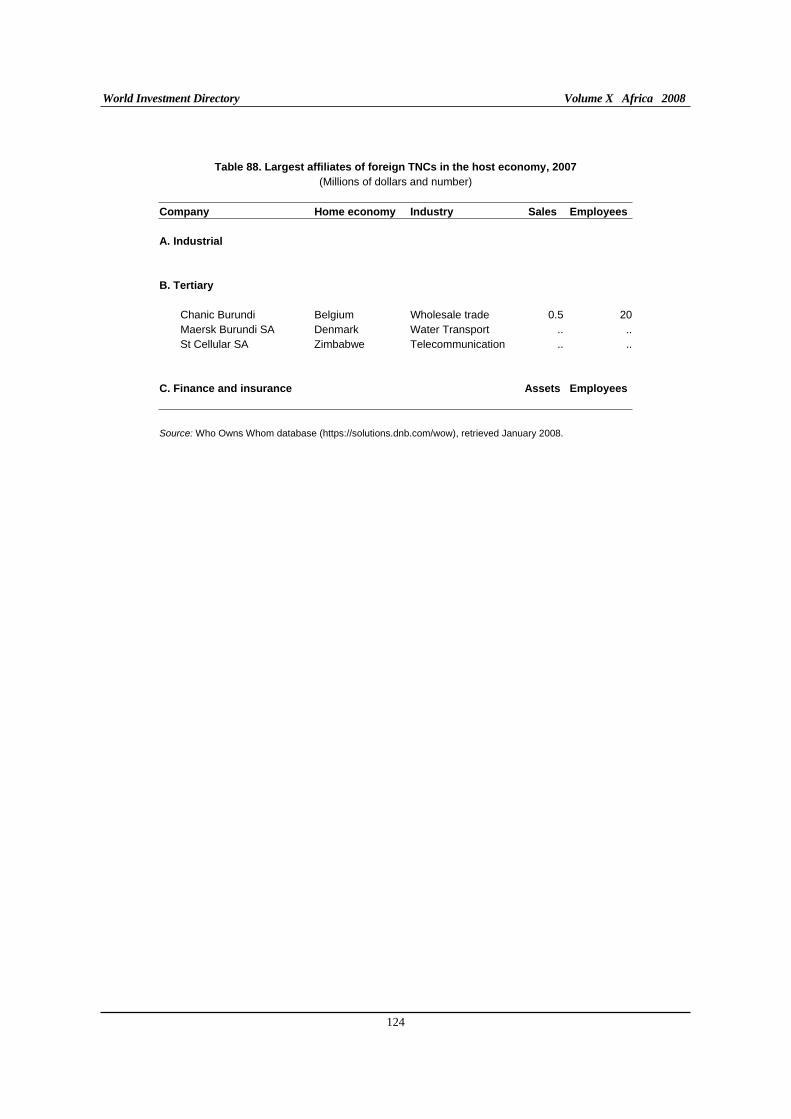
World Investment Directory Volume X Africa 2008
124
Table 88. Largest affiliates of foreign TNCs in the host economy, 2007
(Millions of dollars and number)
Company Home economy Industry Sales Employees
A. Industrial
B. Tertiary
Chanic Burundi Belgium Wholesale trade 0.5 20 Maersk Burundi SA Denmark Water Transport .. .. St Cellular SA Zimbabwe Telecommunication .. ..
C. Finance and insurance Assets Employees
Source: Who Owns Whom database (https://solutions.dnb.com/wow), retrieved January 2008.
Burundi
125
C. Legal frameworks for transnational corporations
A number of legal instruments exist in Burundi to facilitate as well as regulate the activities of foreign investors. Some of these instruments remit from its association in international organizations and laws enacted at national level. Some of the instruments include:
I. National framework
Industrial Designs Law, August 1964. Source: WIPO (http://www.wipo.org).
Patent Law, August 1964. Source: WIPO (http://www.wipo.org).
Trademark Law, August 1964. Source: WIPO (http://www.wipo.org).
Arrêté ministériel No. 040/523 de septembre 1964 portant mesures d’exécution de la Loi d’août 1964 sur les marques de fabrique et de commerce. Source: WIPO (http://www.wipo.org).
Arrêté ministériel No. 040/750 de juillet 1965 portant mesures d’exécution de la Loi d’août 1964 sur les brevets. Source: WIPO (http://www.wipo.org).
Arrêté ministériel No. 040/120 de juin 1966 portant mesures d’exécution de la Loi d’août 1964 sur les dessins et modèles industriels. Source: WIPO (http://www.wipo.org).
Legislative Decree No. 1/169, July 1968 amending the Law. Source: WIPO (http://www.wipo.org).
Décret-loi No 1/171 de juillet 1968 portant modification de la Loi d’août 1964 sur les dessins et modèles industriels. Legislative Decree No. 1/171, July 1968 amending the Law. Source: WIPO (http://www.wipo.org).
Copyright Legislative Decree, May 1978. Source: WIPO (http://www.wipo.org).
Décret-loi No. 1/8 d’avril 1979 portant Code des investissements du Burundi. Source: WIPO (http://www.wipo.org).
Investment Incentives Law No 1/001/1986 of 10 July 1986 - The Investment Code of 1986; together with the implementation Decree No 120/284 of 23 July 1986; as amended by Law No. 1-005 of 14 January 1987, Decree-Law No. 1-021 of 30 June 1990 and No. 1-025 of 30 September 1991. Source: Centre Francais du Commerce Exterieur - Paris - DAMEX-Africa and Middle East Publications, 1993.
Decree No. 1/21 on Privatization of States-Owned Enterprises of 12 August 1991. Source: World Bank, Technical Paper No. 186, "Divestiture of State Enterprises". An overview of legal framework.
Ordinance No. 120/321, setting Modalities for Competitive Bidding for the Privatization of State-Owned Enterprises, 4 October 1991.
World Investment Directory Volume X Africa 2008
126
Source: World Bank, Technical Paper No. 186. "Divestiture of State Enterprises". An overview of legal framework.
Law No. 1/30 on the Creation of a Free Zone in Burundi , of 31 August 1992 Source: Centre Francais du Commerce Exterieur - Paris - DAMEX-Africa and Middle East Publications, 1993.
Business environment 2005/2006 Source: http://web.worldbank.org/WBSITE/EXTERNAL/COUNTRIES/AFRICAEXT/0,,contentMDK: 21043365~menuPK:258657~pagePK:2865106~piPK:2865128~theSitePK:258644,00.html
II. International Framework
A. Burundi is a party to the following multilateral and regional instruments:
Convention on the Settlement of Investment Disputes between States and Nationals of other States of 1965. Entered into force on 14 October 1966.
Community Investment Code of the Economic Community of the Great Lakes Countries of 31 January 1982; entered into force on: 4 October 1987.
Treaty for the Establishment of the Economic Community of Central African States of 18 October 1983; entered into force in December 1984.
Convention Establishing the Multilateral Investment Guarantee Agency of 1985, entered into force on 12 April 1988.
Treaty Establishing the Common Market for Eastern and Southern Africa (COMESA) of 5 November 1993 (entered into force on 8 December 1994).
Paris Convention for the Protection of Industrial Property of 1883 (Revised at Brussels in 1900, Washington in 1911, The Hague in 1925, London in 1934, Lisbon in 1958 and Stockholm in 1967, and as amended in 1979). Signed in 1994.
Marrakesh Agreement Establishing the World Trade Organisation of 15 April 1994. Entered into force on 1 January 1995. Agreement on Trade-Related Investment Measures. General Agreement on Trade in Services. Agreement on Trade Related Aspects of Intellectual Property Rights.
Partnership Agreement between the Members of The African, Caribbean and Pacific Group of States, of the one part and the European Community and its member states, of the other part signed in Cotonou, Benin on 23 June 2000.
B. Bilateral treaties
1. Bilateral investment treaties for the protection and promotion of investments: Germany 1984, Belgium/Luxembourg 1989, United Kingdom 1990, Comoros 2001, Mauritius 2001.
2. Bilateral treaties for the avoidance of double taxation: …
C. Other treaties:
Investment agreement for the COMESA Common Investment Area (2007).
Burundi
127
D. Sources of information
Official
National Bank of Burundi.
Secondary
Bennell, Paul (1997). "Privatization in Sub-Saharan Africa: progress and prospects during the 1990s", World
Development, vol. 25, no. 11, pp. 1785-1803.
Boocock, Colin N. (2002). "Lesson from FDI in mining in Sub-Saharan Africa", power point presentation, OECD Paris, February.
Broll, U. (2003). "Foreign direct investment, credible policy: the role of risk sharing". International trade
journal, vol. XVII, No. 2., pp. 165 – 176.
Economist Intelligence Unit (EIU) (various years). Country Profile : Burundi (London: EIU Ltd.).
_________________ (various years). Country Report: Burundi (London: EIU Ltd.).
International Finance Corporation (IFC) (1997). "Foreign direct investment", IFC: Lessons of Experience Series No. 5 (Washington, D.C.: World Bank).
International Monetary Fund (IMF) (2006). IMF's Sub-Saharan Africa Regional Economic Outlook, March 10, 2006. (Washington D.C.: IMF).
Pigato, Miria (1999). "Foreign direct investment in Africa: old tales and new evidence" (Washington D.C.: World Bank), Mimeo.
Rogoff, Kenneth and Reinhart, Carmen (2002). "FDI to Africa: the role of price stability and currency instability", IMF Working Paper, 41 (Washington D.C.: IMF).
Soderbom, M. and F. Teal (2004). "Size and Efficiency in Africa Manufacturing firms: Evidence from Firm-Level Panel Data." Journal of Development Economics, 73. pp 369 - 394.
United Nations Conference on Trade and Development (UNCTAD) (2000). Capital Flows and Growth in
Africa (Geneva: UNCTAD/GDS/MDPB/7), July.
______________(2003). FDI in Landlocked Developing Countries at a Glance 2002 (Geneva: UNCTAD/ITE/IIA/2003/5).
______________(2005a). Investor-Disputes Arising from Investment Treaties: A Review. UNCTAD Series of International Investment Policies for Development (UNCTAD/ITE/IIT/2005/4).
______________(2005b). A Survey of Support by Investment Promotion Agencies to Linkages, Advisory Studies No. 18 (UNCTAD/ITE/IPC/2005/12).
______________(2005c). FDI in least developed countries at a glance: 2005/2006
(UNCTAD/ITE/IIA/2005/17).
United States Trade Representative (2006). 2006 Comprehensive Report on U.S. Trade and Investment
Policy Toward Sub-Saharan Africa and Implementation of the Africa Growth and Opportunity Act:
The Sixth of Eight Annual Reports, May 2006. (Washington D.C.: US Government).

World Investment Directory Volume X Africa 2008
128
World Bank/International Finance Corporation (2007). Doing Business 2008 Burundi (Washington D.C.: The World Bank Group).
Cameroon
129
Cameroon
A. Definitions and sources of data
The data on foreign direct investment (FDI) in Cameroon were collected by the Banque Centrale des Etats d'Afrique Centrale (BEAC). The country's Code of Investment of 1990 (Ordinance No. 90/007 of 8 November 1990) governs all investment activities, including FDI. The code however, does not provide an explicit definition of FDI. The International Monetary Fund also provides data on FDI in Cameroon in its balance-of-payment statistics.
Cameroon is keen to boost its FDI inflows and provides incentives as stipulated in its national laws, and accepts binding international arbitration of investment disputes through its membership of investment-related bodies. It provides identical incentives for domestic and foreign investors. The measures that Cameroon had put in place to support the private sector include: privatizing public utilities to improve the provision of services; the strengthening of prudential regulations for credit institutions; and promoting micro-finance institutions to encourage savings for productive investment. The Government is also keen to develop capital markets to mobilize long-term savings and provide better access to long-term debt and equity financing. It has set up a competitiveness committee composed of government and business representatives to streamline business procedures and regulations.
Cameroon subscribes to several treaties. Cameroon signed to the Convention on the Settlement of Investment Disputes between State and Nationals of other States on September 23, 1965. It is signatory to the 1998 treaty between the 15 states of the CFA franc zone to harmonize their business Laws and a member of and serves as the headquarters to the Organisation Africaine de la Propiété Intellectuelle - a member of the World Intellectual Property Organization. Cameroon as signatory to the Convention on the Recognition and Enforcement of Foreign Arbitrage awards, has signed other investment insurance programs with Overseas Private Investment Cooperation and its investment code guarantees protection from non-commercial risk through the articles of the Multilateral Investment Guarantee Agency. In 2007, the Government announced its intention to accelerate the privatization of the 27 hotels that it owns directly or through the state-owned National Investment Corporation, with FDI options.
Cameroon signed to the Convention on the Settlement of Investment Disputes between State and Nationals of other States on September 23, 1965 and is entitled to preferential treatment in major markets of the world. It is a dominant member of the Central African Economic and Monetary Committee, the six-country Economic and Monetary Community of Central African States. It is also a member of the African Union, New Partnership for Africa's Development, enjoys special trading advantages with the European Union and benefits from the United States market access initiative - the African Growth and Opportunity Act. It is party to the Cotonou Agreement for renegotiating the partnership treaty between the European Union and the African, Caribbean and Pacific countries - the Lomè Convention and the World Trade Organisation.
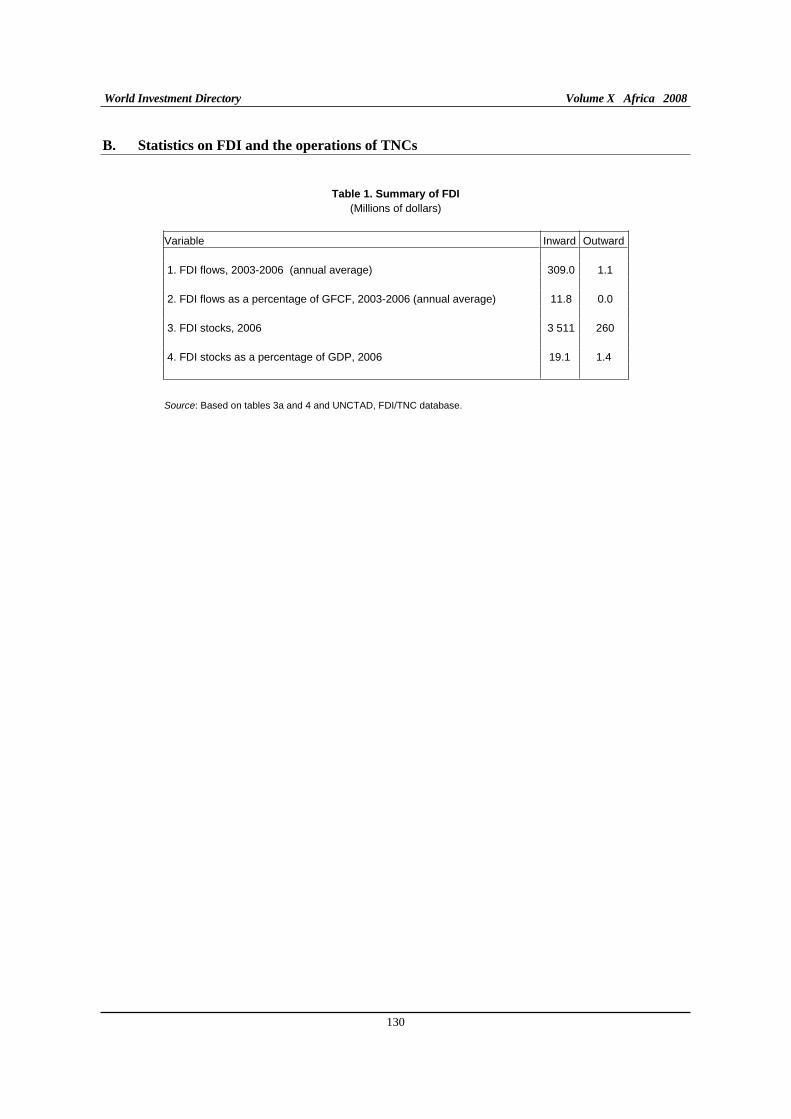
World Investment Directory Volume X Africa 2008
130
B. Statistics on FDI and the operations of TNCs
Table 1. Summary of FDI
(Millions of dollars)
Variable Inward Outward
1. FDI flows, 2003-2006 (annual average) 309.0 1.1
2. FDI flows as a percentage of GFCF, 2003-2006 (annual average) 11.8 0.0
3. FDI stocks, 2006 3 511 260
4. FDI stocks as a percentage of GDP, 2006 19.1 1.4
Source: Based on tables 3a and 4 and UNCTAD, FDI/TNC database.
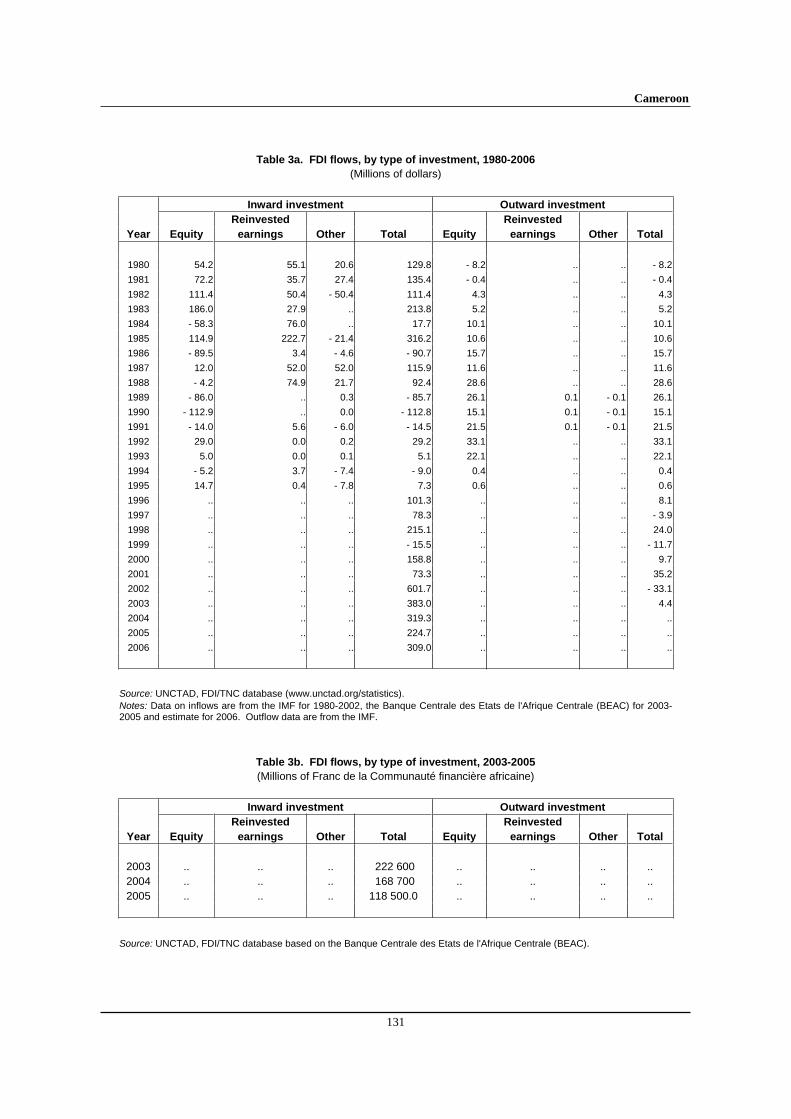
Cameroon
131
Table 3a. FDI flows, by type of investment, 1980-2006
(Millions of dollars)
Inward investment Outward investment
Reinvested Reinvested
Year Equity earnings Other Total Equity earnings Other Total
1980 54.2 55.1 20.6 129.8 - 8.2 .. .. - 8.2
1981 72.2 35.7 27.4 135.4 - 0.4 .. .. - 0.4
1982 111.4 50.4 - 50.4 111.4 4.3 .. .. 4.3
1983 186.0 27.9 .. 213.8 5.2 .. .. 5.2
1984 - 58.3 76.0 .. 17.7 10.1 .. .. 10.1
1985 114.9 222.7 - 21.4 316.2 10.6 .. .. 10.6
1986 - 89.5 3.4 - 4.6 - 90.7 15.7 .. .. 15.7
1987 12.0 52.0 52.0 115.9 11.6 .. .. 11.6
1988 - 4.2 74.9 21.7 92.4 28.6 .. .. 28.6
1989 - 86.0 .. 0.3 - 85.7 26.1 0.1 - 0.1 26.1
1990 - 112.9 .. 0.0 - 112.8 15.1 0.1 - 0.1 15.1
1991 - 14.0 5.6 - 6.0 - 14.5 21.5 0.1 - 0.1 21.5
1992 29.0 0.0 0.2 29.2 33.1 .. .. 33.1
1993 5.0 0.0 0.1 5.1 22.1 .. .. 22.1
1994 - 5.2 3.7 - 7.4 - 9.0 0.4 .. .. 0.4
1995 14.7 0.4 - 7.8 7.3 0.6 .. .. 0.6
1996 .. .. .. 101.3 .. .. .. 8.1
1997 .. .. .. 78.3 .. .. .. - 3.9
1998 .. .. .. 215.1 .. .. .. 24.0
1999 .. .. .. - 15.5 .. .. .. - 11.7
2000 .. .. .. 158.8 .. .. .. 9.7
2001 .. .. .. 73.3 .. .. .. 35.2
2002 .. .. .. 601.7 .. .. .. - 33.1
2003 .. .. .. 383.0 .. .. .. 4.4
2004 .. .. .. 319.3 .. .. .. ..
2005 .. .. .. 224.7 .. .. .. ..
2006 .. .. .. 309.0 .. .. .. ..
Source: UNCTAD, FDI/TNC database (www.unctad.org/statistics). Notes: Data on inflows are from the IMF for 1980-2002, the Banque Centrale des Etats de l'Afrique Centrale (BEAC) for 2003-2005 and estimate for 2006. Outflow data are from the IMF.
Table 3b. FDI flows, by type of investment, 2003-2005
(Millions of Franc de la Communauté financière africaine)
Inward investment Outward investment
Reinvested Reinvested
Year Equity earnings Other Total Equity earnings Other Total
2003 .. .. .. 222 600 .. .. .. .. 2004 .. .. .. 168 700 .. .. .. .. 2005 .. .. .. 118 500.0 .. .. .. ..
Source: UNCTAD, FDI/TNC database based on the Banque Centrale des Etats de l'Afrique Centrale (BEAC).
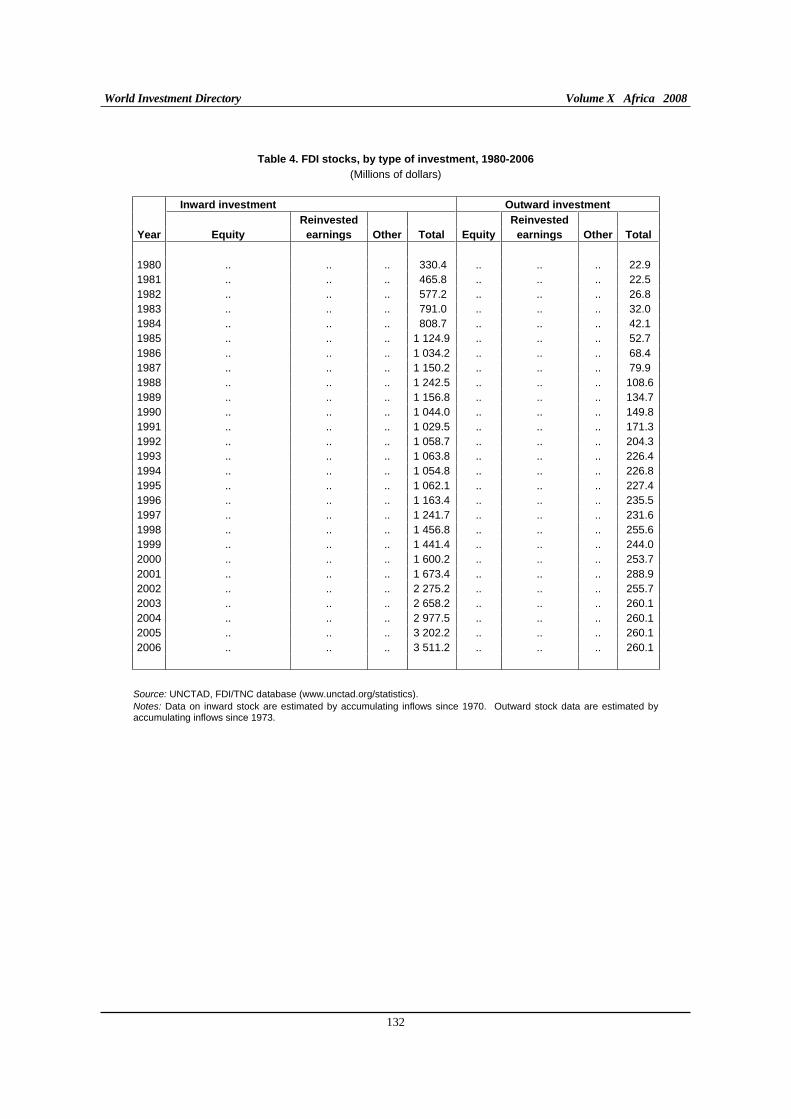
World Investment Directory Volume X Africa 2008
132
Table 4. FDI stocks, by type of investment, 1980-2006
(Millions of dollars) Inward investment Outward investment
Reinvested Reinvested
Year Equity earnings Other Total Equity earnings Other Total
1980 .. .. .. 330.4 .. .. .. 22.9 1981 .. .. .. 465.8 .. .. .. 22.5 1982 .. .. .. 577.2 .. .. .. 26.8 1983 .. .. .. 791.0 .. .. .. 32.0 1984 .. .. .. 808.7 .. .. .. 42.1 1985 .. .. .. 1 124.9 .. .. .. 52.7 1986 .. .. .. 1 034.2 .. .. .. 68.4 1987 .. .. .. 1 150.2 .. .. .. 79.9 1988 .. .. .. 1 242.5 .. .. .. 108.61989 .. .. .. 1 156.8 .. .. .. 134.71990 .. .. .. 1 044.0 .. .. .. 149.81991 .. .. .. 1 029.5 .. .. .. 171.31992 .. .. .. 1 058.7 .. .. .. 204.31993 .. .. .. 1 063.8 .. .. .. 226.41994 .. .. .. 1 054.8 .. .. .. 226.81995 .. .. .. 1 062.1 .. .. .. 227.41996 .. .. .. 1 163.4 .. .. .. 235.51997 .. .. .. 1 241.7 .. .. .. 231.61998 .. .. .. 1 456.8 .. .. .. 255.61999 .. .. .. 1 441.4 .. .. .. 244.02000 .. .. .. 1 600.2 .. .. .. 253.72001 .. .. .. 1 673.4 .. .. .. 288.92002 .. .. .. 2 275.2 .. .. .. 255.72003 .. .. .. 2 658.2 .. .. .. 260.12004 .. .. .. 2 977.5 .. .. .. 260.12005 .. .. .. 3 202.2 .. .. .. 260.12006 .. .. .. 3 511.2 .. .. .. 260.1
Source: UNCTAD, FDI/TNC database (www.unctad.org/statistics). Notes: Data on inward stock are estimated by accumulating inflows since 1970. Outward stock data are estimated by accumulating inflows since 1973.
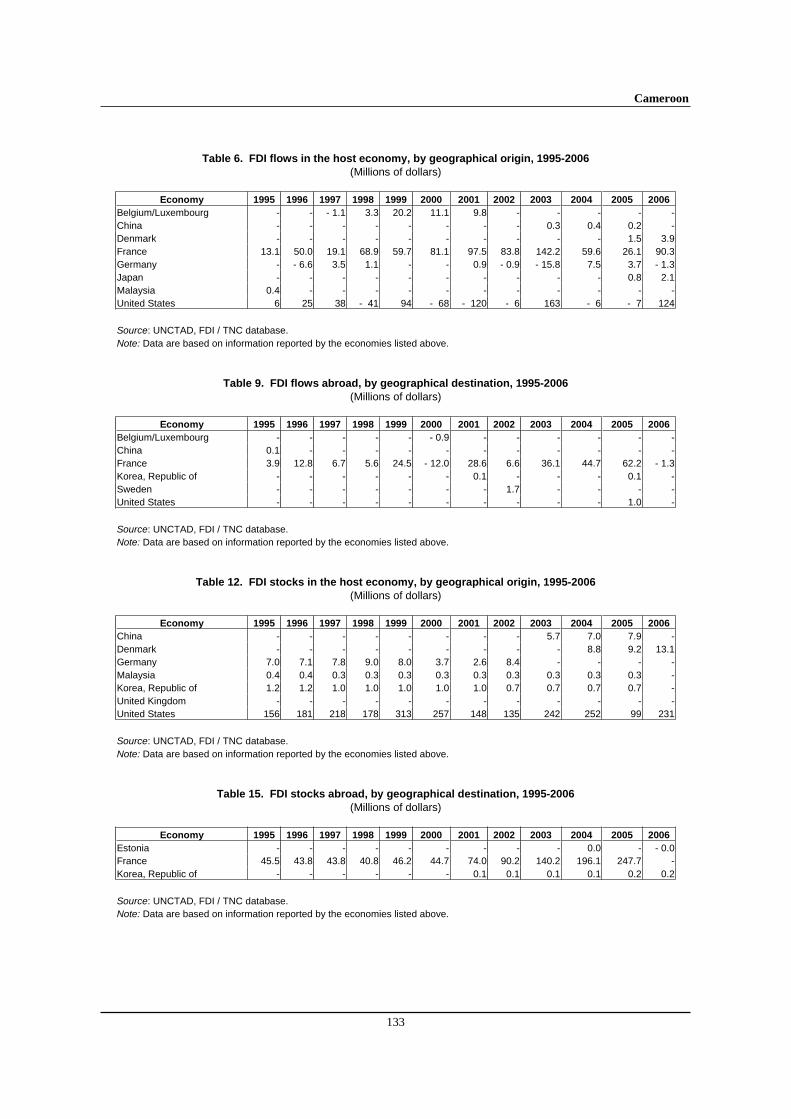
Cameroon
133
Table 6. FDI flows in the host economy, by geographical origin, 1995-2006
(Millions of dollars)
Economy 1995 1996 1997 1998 1999 2000 2001 2002 2003 2004 2005 2006
Belgium/Luxembourg - - - 1.1 3.3 20.2 11.1 9.8 - - - - -China - - - - - - - - 0.3 0.4 0.2 -Denmark - - - - - - - - - - 1.5 3.9France 13.1 50.0 19.1 68.9 59.7 81.1 97.5 83.8 142.2 59.6 26.1 90.3Germany - - 6.6 3.5 1.1 - - 0.9 - 0.9 - 15.8 7.5 3.7 - 1.3Japan - - - - - - - - - - 0.8 2.1Malaysia 0.4 - - - - - - - - - - -United States 6 25 38 - 41 94 - 68 - 120 - 6 163 - 6 - 7 124
Source: UNCTAD, FDI / TNC database. Note: Data are based on information reported by the economies listed above.
Table 9. FDI flows abroad, by geographical destination, 1995-2006
(Millions of dollars)
Economy 1995 1996 1997 1998 1999 2000 2001 2002 2003 2004 2005 2006
Belgium/Luxembourg - - - - - - 0.9 - - - - - -China 0.1 - - - - - - - - - - -France 3.9 12.8 6.7 5.6 24.5 - 12.0 28.6 6.6 36.1 44.7 62.2 - 1.3Korea, Republic of - - - - - - 0.1 - - - 0.1 -Sweden - - - - - - - 1.7 - - - -United States - - - - - - - - - - 1.0 -
Source: UNCTAD, FDI / TNC database. Note: Data are based on information reported by the economies listed above.
Table 12. FDI stocks in the host economy, by geographical origin, 1995-2006
(Millions of dollars)
Economy 1995 1996 1997 1998 1999 2000 2001 2002 2003 2004 2005 2006
China - - - - - - - - 5.7 7.0 7.9 -Denmark - - - - - - - - - 8.8 9.2 13.1Germany 7.0 7.1 7.8 9.0 8.0 3.7 2.6 8.4 - - - -Malaysia 0.4 0.4 0.3 0.3 0.3 0.3 0.3 0.3 0.3 0.3 0.3 -Korea, Republic of 1.2 1.2 1.0 1.0 1.0 1.0 1.0 0.7 0.7 0.7 0.7 -United Kingdom - - - - - - - - - - - -United States 156 181 218 178 313 257 148 135 242 252 99 231
Source: UNCTAD, FDI / TNC database. Note: Data are based on information reported by the economies listed above.
Table 15. FDI stocks abroad, by geographical destination, 1995-2006
(Millions of dollars)
Economy 1995 1996 1997 1998 1999 2000 2001 2002 2003 2004 2005 2006
Estonia - - - - - - - - - 0.0 - - 0.0France 45.5 43.8 43.8 40.8 46.2 44.7 74.0 90.2 140.2 196.1 247.7 -Korea, Republic of - - - - - - 0.1 0.1 0.1 0.1 0.2 0.2
Source: UNCTAD, FDI / TNC database. Note: Data are based on information reported by the economies listed above.
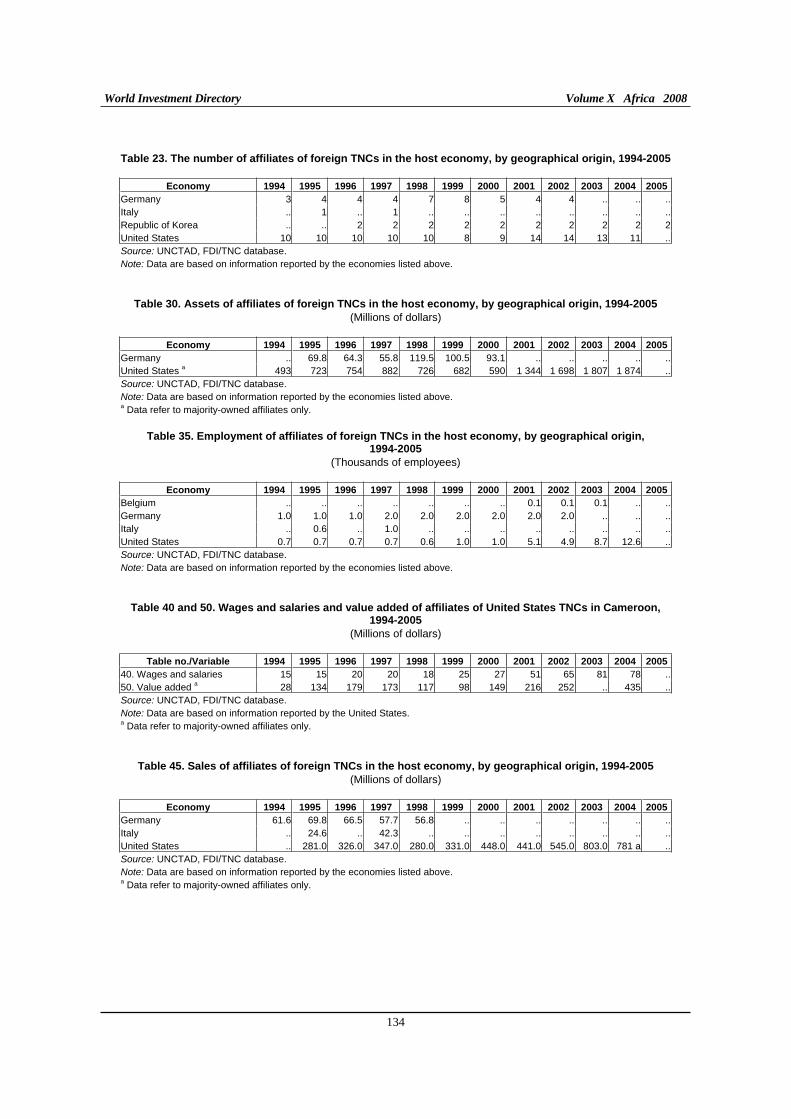
World Investment Directory Volume X Africa 2008
134
Table 23. The number of affiliates of foreign TNCs in the host economy, by geographical origin, 1994-2005
Economy 1994 1995 1996 1997 1998 1999 2000 2001 2002 2003 2004 2005
Germany 3 4 4 4 7 8 5 4 4 .. .. ..Italy .. 1 .. 1 .. .. .. .. .. .. .. ..Republic of Korea .. .. 2 2 2 2 2 2 2 2 2 2United States 10 10 10 10 10 8 9 14 14 13 11 ..Source: UNCTAD, FDI/TNC database. Note: Data are based on information reported by the economies listed above.
Table 30. Assets of affiliates of foreign TNCs in the host economy, by geographical origin, 1994-2005
(Millions of dollars)
Economy 1994 1995 1996 1997 1998 1999 2000 2001 2002 2003 2004 2005
Germany .. 69.8 64.3 55.8 119.5 100.5 93.1 .. .. .. .. ..United States a 493 723 754 882 726 682 590 1 344 1 698 1 807 1 874 ..Source: UNCTAD, FDI/TNC database. Note: Data are based on information reported by the economies listed above. a Data refer to majority-owned affiliates only.
Table 35. Employment of affiliates of foreign TNCs in the host economy, by geographical origin,
1994-2005
(Thousands of employees)
Economy 1994 1995 1996 1997 1998 1999 2000 2001 2002 2003 2004 2005
Belgium .. .. .. .. .. .. .. 0.1 0.1 0.1 .. ..Germany 1.0 1.0 1.0 2.0 2.0 2.0 2.0 2.0 2.0 .. .. ..Italy .. 0.6 .. 1.0 .. .. .. .. .. .. .. ..United States 0.7 0.7 0.7 0.7 0.6 1.0 1.0 5.1 4.9 8.7 12.6 ..Source: UNCTAD, FDI/TNC database. Note: Data are based on information reported by the economies listed above.
Table 40 and 50. Wages and salaries and value added of affiliates of United States TNCs in Cameroon, 1994-2005
(Millions of dollars)
Table no./Variable 1994 1995 1996 1997 1998 1999 2000 2001 2002 2003 2004 2005
40. Wages and salaries 15 15 20 20 18 25 27 51 65 81 78 ..50. Value added a 28 134 179 173 117 98 149 216 252 .. 435 ..Source: UNCTAD, FDI/TNC database. Note: Data are based on information reported by the United States. a Data refer to majority-owned affiliates only.
Table 45. Sales of affiliates of foreign TNCs in the host economy, by geographical origin, 1994-2005
(Millions of dollars)
Economy 1994 1995 1996 1997 1998 1999 2000 2001 2002 2003 2004 2005
Germany 61.6 69.8 66.5 57.7 56.8 .. .. .. .. .. .. ..Italy .. 24.6 .. 42.3 .. .. .. .. .. .. .. ..United States .. 281.0 326.0 347.0 280.0 331.0 448.0 441.0 545.0 803.0 781 a ..Source: UNCTAD, FDI/TNC database. Note: Data are based on information reported by the economies listed above. a Data refer to majority-owned affiliates only.
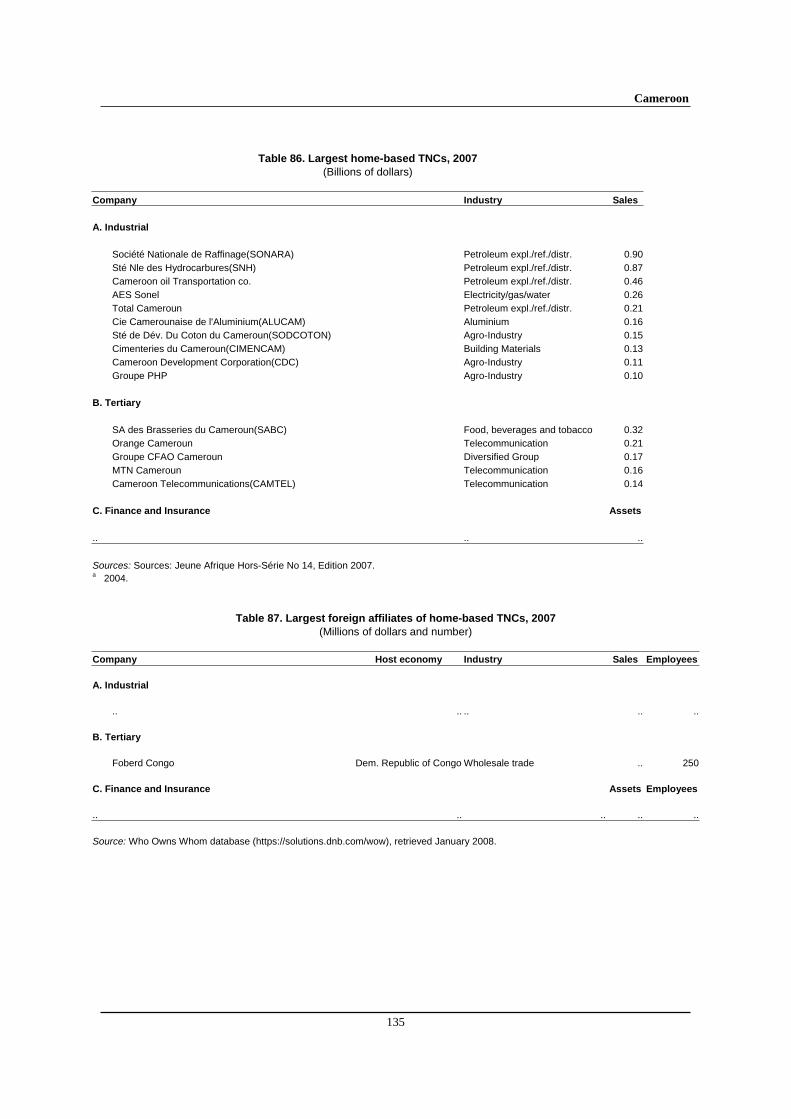
Cameroon
135
Table 86. Largest home-based TNCs, 2007
(Billions of dollars)
Company Industry Sales
A. Industrial
Société Nationale de Raffinage(SONARA) Petroleum expl./ref./distr. 0.90Sté Nle des Hydrocarbures(SNH) Petroleum expl./ref./distr. 0.87Cameroon oil Transportation co. Petroleum expl./ref./distr. 0.46AES Sonel Electricity/gas/water 0.26Total Cameroun Petroleum expl./ref./distr. 0.21Cie Camerounaise de l'Aluminium(ALUCAM) Aluminium 0.16Sté de Dév. Du Coton du Cameroun(SODCOTON) Agro-Industry 0.15Cimenteries du Cameroun(CIMENCAM) Building Materials 0.13Cameroon Development Corporation(CDC) Agro-Industry 0.11Groupe PHP Agro-Industry 0.10
B. Tertiary
SA des Brasseries du Cameroun(SABC) Food, beverages and tobacco 0.32Orange Cameroun Telecommunication 0.21Groupe CFAO Cameroun Diversified Group 0.17MTN Cameroun Telecommunication 0.16Cameroon Telecommunications(CAMTEL) Telecommunication 0.14
C. Finance and Insurance Assets
.. .. ..
Sources: Sources: Jeune Afrique Hors-Série No 14, Edition 2007. a 2004.
Table 87. Largest foreign affiliates of home-based TNCs, 2007
(Millions of dollars and number)
Company Host economy Industry Sales Employees
A. Industrial
.. .. .. .. ..
B. Tertiary
Foberd Congo Dem. Republic of Congo Wholesale trade .. 250
C. Finance and Insurance Assets Employees
.. .. .. .. ..
Source: Who Owns Whom database (https://solutions.dnb.com/wow), retrieved January 2008.
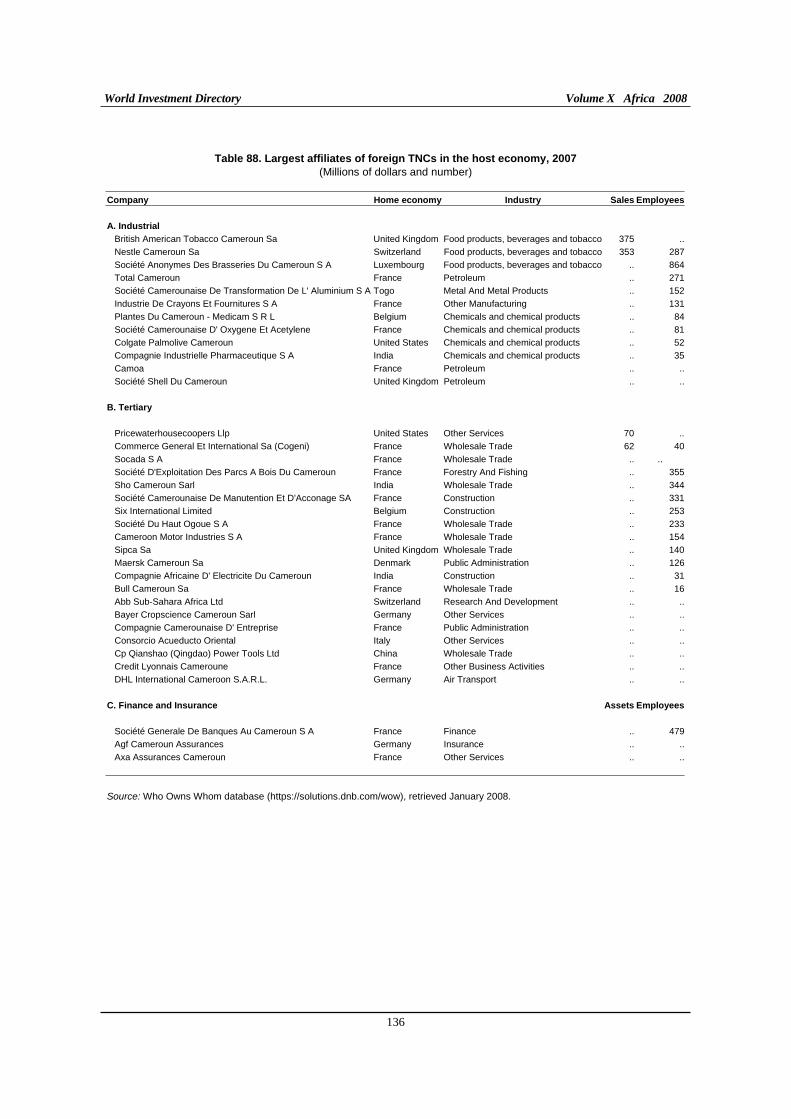
World Investment Directory Volume X Africa 2008
136
Table 88. Largest affiliates of foreign TNCs in the host economy, 2007
(Millions of dollars and number)
Company Home economy Industry Sales Employees
A. Industrial
British American Tobacco Cameroun Sa United Kingdom Food products, beverages and tobacco 375 ..
Nestle Cameroun Sa Switzerland Food products, beverages and tobacco 353 287
Société Anonymes Des Brasseries Du Cameroun S A Luxembourg Food products, beverages and tobacco .. 864
Total Cameroun France Petroleum .. 271
Société Camerounaise De Transformation De L' Aluminium S A Togo Metal And Metal Products .. 152
Industrie De Crayons Et Fournitures S A France Other Manufacturing .. 131
Plantes Du Cameroun - Medicam S R L Belgium Chemicals and chemical products .. 84
Société Camerounaise D' Oxygene Et Acetylene France Chemicals and chemical products .. 81
Colgate Palmolive Cameroun United States Chemicals and chemical products .. 52
Compagnie Industrielle Pharmaceutique S A India Chemicals and chemical products .. 35
Camoa France Petroleum .. ..
Société Shell Du Cameroun United Kingdom Petroleum .. ..
B. Tertiary
Pricewaterhousecoopers Llp United States Other Services 70 ..
Commerce General Et International Sa (Cogeni) France Wholesale Trade 62 40
Socada S A France Wholesale Trade .. ..
Société D'Exploitation Des Parcs A Bois Du Cameroun France Forestry And Fishing .. 355
Sho Cameroun Sarl India Wholesale Trade .. 344
Société Camerounaise De Manutention Et D'Acconage SA France Construction .. 331
Six International Limited Belgium Construction .. 253
Société Du Haut Ogoue S A France Wholesale Trade .. 233
Cameroon Motor Industries S A France Wholesale Trade .. 154
Sipca Sa United Kingdom Wholesale Trade .. 140
Maersk Cameroun Sa Denmark Public Administration .. 126
Compagnie Africaine D' Electricite Du Cameroun India Construction .. 31
Bull Cameroun Sa France Wholesale Trade .. 16
Abb Sub-Sahara Africa Ltd Switzerland Research And Development .. ..
Bayer Cropscience Cameroun Sarl Germany Other Services .. ..
Compagnie Camerounaise D' Entreprise France Public Administration .. ..
Consorcio Acueducto Oriental Italy Other Services .. ..
Cp Qianshao (Qingdao) Power Tools Ltd China Wholesale Trade .. ..
Credit Lyonnais Cameroune France Other Business Activities .. ..
DHL International Cameroon S.A.R.L. Germany Air Transport .. ..
C. Finance and Insurance Assets Employees
Société Generale De Banques Au Cameroun S A France Finance .. 479
Agf Cameroun Assurances Germany Insurance .. ..
Axa Assurances Cameroun France Other Services .. ..
Source: Who Owns Whom database (https://solutions.dnb.com/wow), retrieved January 2008.
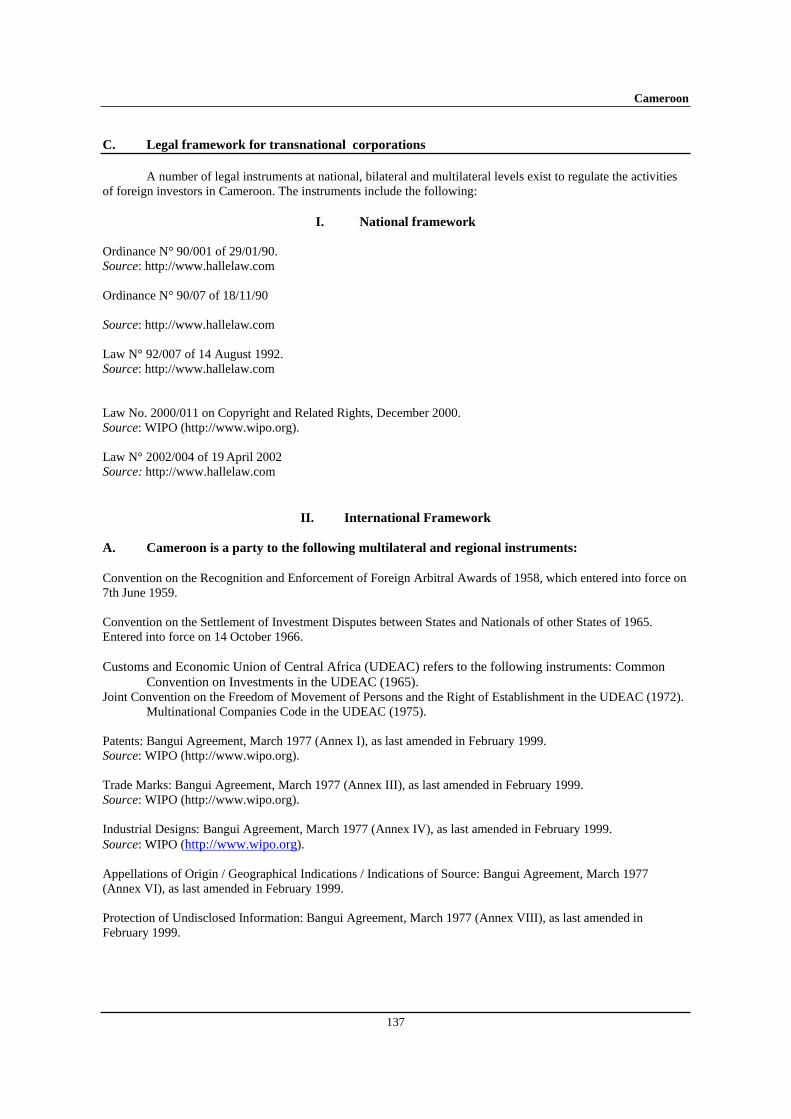
Cameroon
137
C. Legal framework for transnational corporations
A number of legal instruments at national, bilateral and multilateral levels exist to regulate the activities of foreign investors in Cameroon. The instruments include the following:
I. National framework
Ordinance N° 90/001 of 29/01/90. Source: http://www.hallelaw.com
Ordinance N° 90/07 of 18/11/90
Source: http://www.hallelaw.com
Law N° 92/007 of 14 August 1992. Source: http://www.hallelaw.com
Law No. 2000/011 on Copyright and Related Rights, December 2000. Source: WIPO (http://www.wipo.org).
Law N° 2002/004 of 19 April 2002 Source: http://www.hallelaw.com
II. International Framework
A. Cameroon is a party to the following multilateral and regional instruments:
Convention on the Recognition and Enforcement of Foreign Arbitral Awards of 1958, which entered into force on 7th June 1959.
Convention on the Settlement of Investment Disputes between States and Nationals of other States of 1965. Entered into force on 14 October 1966.
Customs and Economic Union of Central Africa (UDEAC) refers to the following instruments: Common Convention on Investments in the UDEAC (1965).
Joint Convention on the Freedom of Movement of Persons and the Right of Establishment in the UDEAC (1972). Multinational Companies Code in the UDEAC (1975).
Patents: Bangui Agreement, March 1977 (Annex I), as last amended in February 1999. Source: WIPO (http://www.wipo.org).
Trade Marks: Bangui Agreement, March 1977 (Annex III), as last amended in February 1999. Source: WIPO (http://www.wipo.org).
Industrial Designs: Bangui Agreement, March 1977 (Annex IV), as last amended in February 1999. Source: WIPO (http://www.wipo.org).
Appellations of Origin / Geographical Indications / Indications of Source: Bangui Agreement, March 1977 (Annex VI), as last amended in February 1999.
Protection of Undisclosed Information: Bangui Agreement, March 1977 (Annex VIII), as last amended in February 1999.
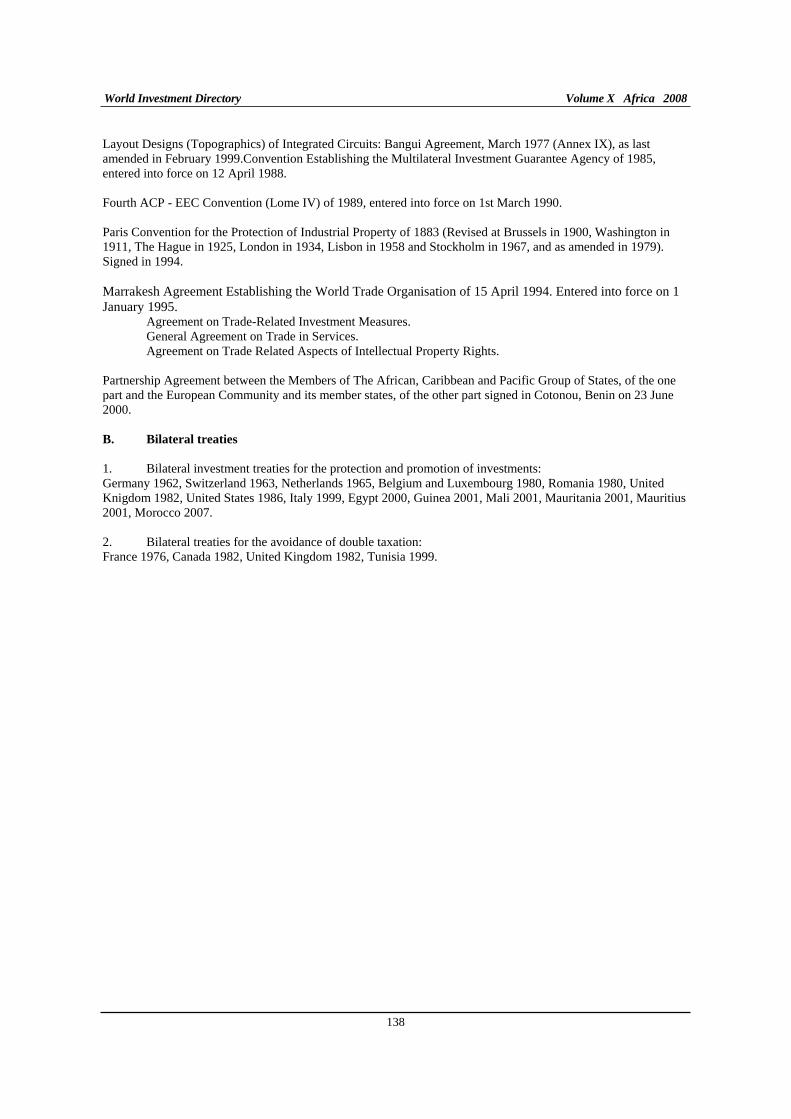
World Investment Directory Volume X Africa 2008
138
Layout Designs (Topographics) of Integrated Circuits: Bangui Agreement, March 1977 (Annex IX), as last amended in February 1999.Convention Establishing the Multilateral Investment Guarantee Agency of 1985, entered into force on 12 April 1988.
Fourth ACP - EEC Convention (Lome IV) of 1989, entered into force on 1st March 1990.
Paris Convention for the Protection of Industrial Property of 1883 (Revised at Brussels in 1900, Washington in 1911, The Hague in 1925, London in 1934, Lisbon in 1958 and Stockholm in 1967, and as amended in 1979). Signed in 1994.
Marrakesh Agreement Establishing the World Trade Organisation of 15 April 1994. Entered into force on 1 January 1995. Agreement on Trade-Related Investment Measures. General Agreement on Trade in Services. Agreement on Trade Related Aspects of Intellectual Property Rights.
Partnership Agreement between the Members of The African, Caribbean and Pacific Group of States, of the one part and the European Community and its member states, of the other part signed in Cotonou, Benin on 23 June 2000.
B. Bilateral treaties
1. Bilateral investment treaties for the protection and promotion of investments: Germany 1962, Switzerland 1963, Netherlands 1965, Belgium and Luxembourg 1980, Romania 1980, United Knigdom 1982, United States 1986, Italy 1999, Egypt 2000, Guinea 2001, Mali 2001, Mauritania 2001, Mauritius 2001, Morocco 2007.
2. Bilateral treaties for the avoidance of double taxation: France 1976, Canada 1982, United Kingdom 1982, Tunisia 1999.
Cameroon
139
D. Sources of information
Official
Banque des Etats l'Afrique Centrale (www.beac.int).
Secondary
Andrea, Marino (2000). "The impact of FDI on developing countries growth: trade policy matters" (www.etsg.org/ETS2000/Papers/Marino.pdf).
Dirk te Velde, Willem and Oliver Morrissey (2002). "Foreign ownership and wages: evidence from five African countries (Cameroon, Ghana, Kenya, Zambia and Zimbabwe) (Nothingham: Center for Research in Economic Development and International Trade, University of Nothingham; Research paper No. 01/19).
Economist Intelligence Unit (EIU) (various years). Country Profile: Cameroon (London: EIU Ltd.).
_______________ (various years). Country Report: Cameroon (London: EIU Ltd.).
International Monetary Fund (IMF) (2006). IMF's Sub-Saharan Africa Regional Economic Outlook, March 10, 2006. (Washington D.C.: IMF).
Morisset, J.(2001). "Foreign direct investment in Africa: Policies also matter", OECD Global Forum on International Investment (Paris: OECD).
Ogunleye, Eric Kehinde (2008) "Exchange rate volatility and foreign direct investment inflows in selected Sub-Saharan African Countries" (PhD Thesis, University of Ibadan).
Ruffer, Tim, S. Jones and S. Akroyd (2002). "Development box proposals and their potential effect on developing countries." Mimeo (London: U.K. Department for International Development).
Soderbom, M. and F. Teal (2004). "Size and Efficiency in Africa Manufacturing firms: Evidence from Firm-Level Panel Data." Journal of Development Economics, 73. pp 369 - 394.
United States Commercial Service (2006). Doing Business in Cameroon: A country Commercial Guide for
US Companies. (Washington D.C.: US Government).
United Nations Conference on Trade and Development (UNCTAD) (2005a). Investor-Disputes Arising from
Investment Treaties: A Review. UNCTAD Series of International Investment Policies for Development (UNCTAD/ITE/IIT/2005/4).
___________(2005b). A Survey of Support by Investment Promotion Agencies to Linkages, Advisory Studies No. 18 (UNCTAD/ITE/IPC/2005/12).
United States Trade Representative (2006). 2006 Comprehensive Report on U.S. Trade and Investment
Policy Toward Sub-Saharan Africa and Implementation of the Africa Growth and Opportunity Act:
The Sixth of Eight Annual Reports, May 2006. (Washington D.C.: US Government).
World Bank (2002). Global Economic Prospects and the Developing Countries 2003: Investing to Unlock
Opportunities (Washington D.C.: World Bank).
World Investment Directory Volume X Africa 2008
140
World Bank/International Finance Corporation (2007). Doing Business 2008 Cameroon (Washington D.C.: The World Bank Group).
Cape Verde
141
Cape Verde
A. Definitions and sources of data
In Cape Verde, foreign direct investment (FDI) is the same as "external investment", in the country's External Investment Code (Law 89/IV/93). In this code, external investment is defined as any participation in an economic activity made, according to the law, with contributions from abroad that can be monetarily evaluated. The institution responsible for the registration, supervision and surveillance of FDI activities in Cape Verde is the Centro de Promoção Turística dos Investimentos e das Exportações de Cabo Verde (PROMEX). PROMEX records statistics on FDI. The International Monetary Fund also provides data on FDI in Cape Verde in its balance-of-payment statistics.
The Government of Cape Verde encourages foreign investment, particularly in tourism, fishing, light manufacturing, communications and transportation. All sectors of the economy are open to foreign investment, although approval is required. Residents and non-residents may hold foreign exchange accounts, subject to government approval and regulations. Most payments and transfers are subject to controls. Real estate transactions require a Central Bank (Banco de Cabo Verde) approval. When permitted the Central Bank must approve most capital transactions in advance.
The Government of Cape Verde has put in place reforms to streamline the cumbersome bureaucracy and to increase transparency for businesses to set up in Cape Verde. PROMEX has become a one-stop shop for external investors. When an application is submitted to PROMEX, within thirty days the investor should get a reply. If Government action is not forthcoming, within 30 days, approval is automatic. Mass privatizations have also eased the burden of competing with state-owned enterprises. The Government of Cape Verde works to ensure that its economy is integrated in the global economy. Cape Verde is a member of the African Union, New Partnership for Africa's Development and Economic Community of West Africa States. It is also eligible for the United States' market access initiative for African countries - the African Growth and Opportunity Act, the Cotonou Agreement for renegotiating the trade links between the African, Caribbean and Pacific countries with the European Union (EU), the EU's Everything But Arms initiative and the generalized system of preferences for the least developed countries. Cape Verde has an observer status at the World Trade Organization.

World Investment Directory Volume X Africa 2008
142
B. Statistics on FDI and the operations of TNCs
Table 1. Summary of FDI
(Millions of dollars)
Variable Inward Outward
1. FDI flows, 2003-2006 (annual average) 58.3 0.1
2. FDI flows as a percentage of GFCF, 2003-2006 (annual average) 17.2 0.0
3. FDI stocks, 2006 433 8
4. FDI stocks as a percentage of GDP, 2006 36.1 0.6
Source: Based on tables 3a and 4a and UNCTAD, FDI/TNC database.
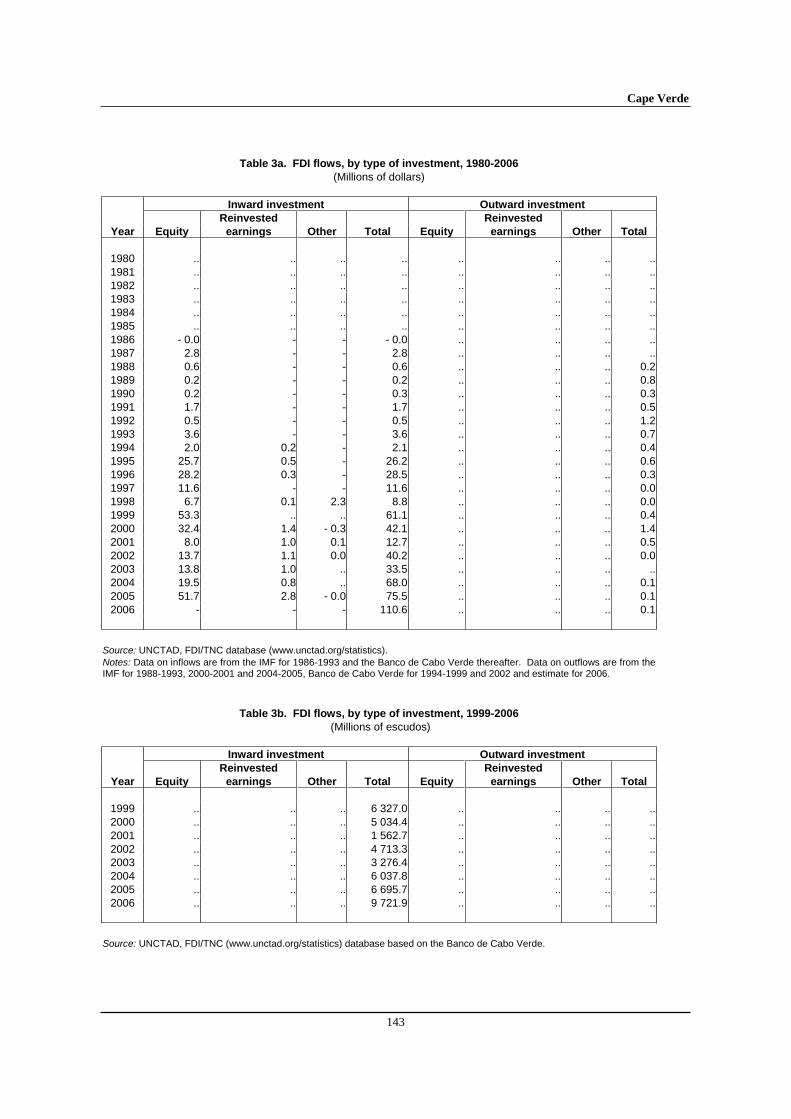
Cape Verde
143
Table 3a. FDI flows, by type of investment, 1980-2006
(Millions of dollars)
Inward investment Outward investment
Reinvested Reinvested
Year Equity earnings Other Total Equity earnings Other Total
1980 .. .. .. .. .. .. .. ..1981 .. .. .. .. .. .. .. ..1982 .. .. .. .. .. .. .. ..1983 .. .. .. .. .. .. .. ..1984 .. .. .. .. .. .. .. ..1985 .. .. .. .. .. .. .. ..1986 - 0.0 - - - 0.0 .. .. .. ..1987 2.8 - - 2.8 .. .. .. ..1988 0.6 - - 0.6 .. .. .. 0.21989 0.2 - - 0.2 .. .. .. 0.81990 0.2 - - 0.3 .. .. .. 0.31991 1.7 - - 1.7 .. .. .. 0.51992 0.5 - - 0.5 .. .. .. 1.21993 3.6 - - 3.6 .. .. .. 0.71994 2.0 0.2 - 2.1 .. .. .. 0.41995 25.7 0.5 - 26.2 .. .. .. 0.61996 28.2 0.3 - 28.5 .. .. .. 0.31997 11.6 - - 11.6 .. .. .. 0.01998 6.7 0.1 2.3 8.8 .. .. .. 0.01999 53.3 .. .. 61.1 .. .. .. 0.42000 32.4 1.4 - 0.3 42.1 .. .. .. 1.42001 8.0 1.0 0.1 12.7 .. .. .. 0.52002 13.7 1.1 0.0 40.2 .. .. .. 0.02003 13.8 1.0 .. 33.5 .. .. .. ..2004 19.5 0.8 .. 68.0 .. .. .. 0.12005 51.7 2.8 - 0.0 75.5 .. .. .. 0.12006 - - - 110.6 .. .. .. 0.1
Source: UNCTAD, FDI/TNC database (www.unctad.org/statistics). Notes: Data on inflows are from the IMF for 1986-1993 and the Banco de Cabo Verde thereafter. Data on outflows are from the IMF for 1988-1993, 2000-2001 and 2004-2005, Banco de Cabo Verde for 1994-1999 and 2002 and estimate for 2006.
Table 3b. FDI flows, by type of investment, 1999-2006
(Millions of escudos)
Inward investment Outward investment
Reinvested Reinvested
Year Equity earnings Other Total Equity earnings Other Total
1999 .. .. .. 6 327.0 .. .. .. ..2000 .. .. .. 5 034.4 .. .. .. ..2001 .. .. .. 1 562.7 .. .. .. ..2002 .. .. .. 4 713.3 .. .. .. ..2003 .. .. .. 3 276.4 .. .. .. ..2004 .. .. .. 6 037.8 .. .. .. ..2005 .. .. .. 6 695.7 .. .. .. ..2006 .. .. .. 9 721.9 .. .. .. ..
Source: UNCTAD, FDI/TNC (www.unctad.org/statistics) database based on the Banco de Cabo Verde.
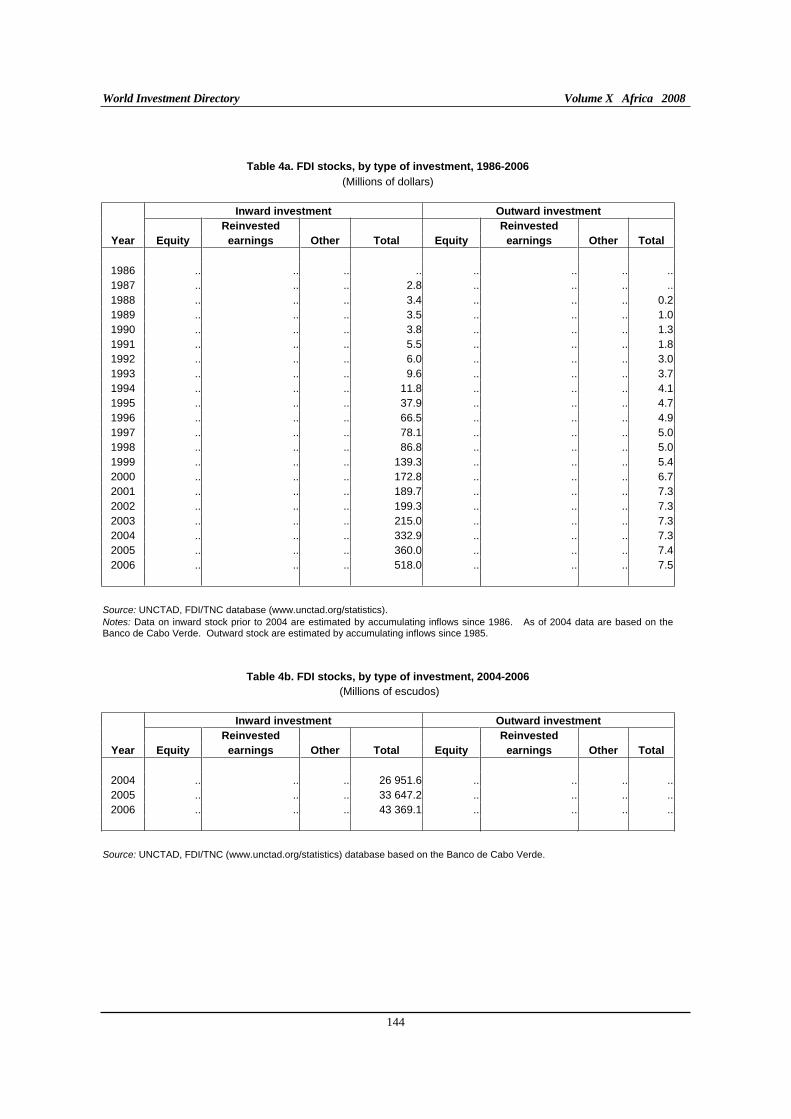
World Investment Directory Volume X Africa 2008
144
Table 4a. FDI stocks, by type of investment, 1986-2006
(Millions of dollars)
Inward investment Outward investment
Reinvested Reinvested
Year Equity earnings Other Total Equity earnings Other Total
1986 .. .. .. .. .. .. .. ..1987 .. .. .. 2.8 .. .. .. ..1988 .. .. .. 3.4 .. .. .. 0.21989 .. .. .. 3.5 .. .. .. 1.01990 .. .. .. 3.8 .. .. .. 1.31991 .. .. .. 5.5 .. .. .. 1.81992 .. .. .. 6.0 .. .. .. 3.01993 .. .. .. 9.6 .. .. .. 3.71994 .. .. .. 11.8 .. .. .. 4.11995 .. .. .. 37.9 .. .. .. 4.71996 .. .. .. 66.5 .. .. .. 4.91997 .. .. .. 78.1 .. .. .. 5.01998 .. .. .. 86.8 .. .. .. 5.01999 .. .. .. 139.3 .. .. .. 5.42000 .. .. .. 172.8 .. .. .. 6.72001 .. .. .. 189.7 .. .. .. 7.32002 .. .. .. 199.3 .. .. .. 7.32003 .. .. .. 215.0 .. .. .. 7.32004 .. .. .. 332.9 .. .. .. 7.32005 .. .. .. 360.0 .. .. .. 7.42006 .. .. .. 518.0 .. .. .. 7.5
Source: UNCTAD, FDI/TNC database (www.unctad.org/statistics). Notes: Data on inward stock prior to 2004 are estimated by accumulating inflows since 1986. As of 2004 data are based on the Banco de Cabo Verde. Outward stock are estimated by accumulating inflows since 1985.
Table 4b. FDI stocks, by type of investment, 2004-2006
(Millions of escudos)
Inward investment Outward investment
Reinvested Reinvested
Year Equity earnings Other Total Equity earnings Other Total
2004 .. .. .. 26 951.6 .. .. .. ..2005 .. .. .. 33 647.2 .. .. .. ..2006 .. .. .. 43 369.1 .. .. .. ..
Source: UNCTAD, FDI/TNC (www.unctad.org/statistics) database based on the Banco de Cabo Verde.
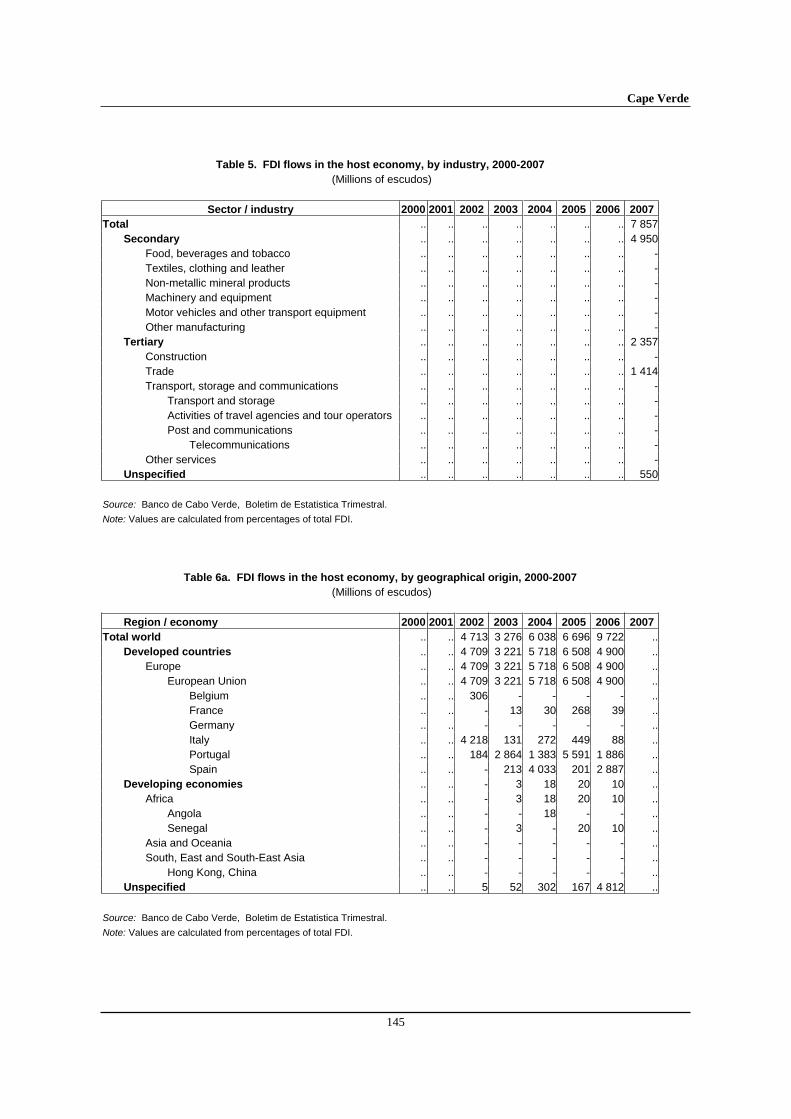
Cape Verde
145
Table 5. FDI flows in the host economy, by industry, 2000-2007
(Millions of escudos)
Sector / industry 2000 2001 2002 2003 2004 2005 2006 2007
Total .. .. .. .. .. .. .. 7 857Secondary .. .. .. .. .. .. .. 4 950
Food, beverages and tobacco .. .. .. .. .. .. .. -Textiles, clothing and leather .. .. .. .. .. .. .. -Non-metallic mineral products .. .. .. .. .. .. .. -Machinery and equipment .. .. .. .. .. .. .. -Motor vehicles and other transport equipment .. .. .. .. .. .. .. -Other manufacturing .. .. .. .. .. .. .. -
Tertiary .. .. .. .. .. .. .. 2 357Construction .. .. .. .. .. .. .. -Trade .. .. .. .. .. .. .. 1 414Transport, storage and communications .. .. .. .. .. .. .. -
Transport and storage .. .. .. .. .. .. .. -Activities of travel agencies and tour operators .. .. .. .. .. .. .. -Post and communications .. .. .. .. .. .. .. -
Telecommunications .. .. .. .. .. .. .. -Other services .. .. .. .. .. .. .. -
Unspecified .. .. .. .. .. .. .. 550 Source: Banco de Cabo Verde, Boletim de Estatistica Trimestral.
Note: Values are calculated from percentages of total FDI.
Table 6a. FDI flows in the host economy, by geographical origin, 2000-2007
(Millions of escudos)
Region / economy 2000 2001 2002 2003 2004 2005 2006 2007
Total world .. .. 4 713 3 276 6 038 6 696 9 722 ..Developed countries .. .. 4 709 3 221 5 718 6 508 4 900 ..
Europe .. .. 4 709 3 221 5 718 6 508 4 900 ..European Union .. .. 4 709 3 221 5 718 6 508 4 900 ..
Belgium .. .. 306 - - - - ..France .. .. - 13 30 268 39 ..Germany .. .. - - - - - ..Italy .. .. 4 218 131 272 449 88 ..Portugal .. .. 184 2 864 1 383 5 591 1 886 ..Spain .. .. - 213 4 033 201 2 887 ..
Developing economies .. .. - 3 18 20 10 ..Africa .. .. - 3 18 20 10 ..
Angola .. .. - - 18 - - ..Senegal .. .. - 3 - 20 10 ..
Asia and Oceania .. .. - - - - - ..South, East and South-East Asia .. .. - - - - - ..
Hong Kong, China .. .. - - - - - ..Unspecified .. .. 5 52 302 167 4 812 ..
Source: Banco de Cabo Verde, Boletim de Estatistica Trimestral.
Note: Values are calculated from percentages of total FDI.
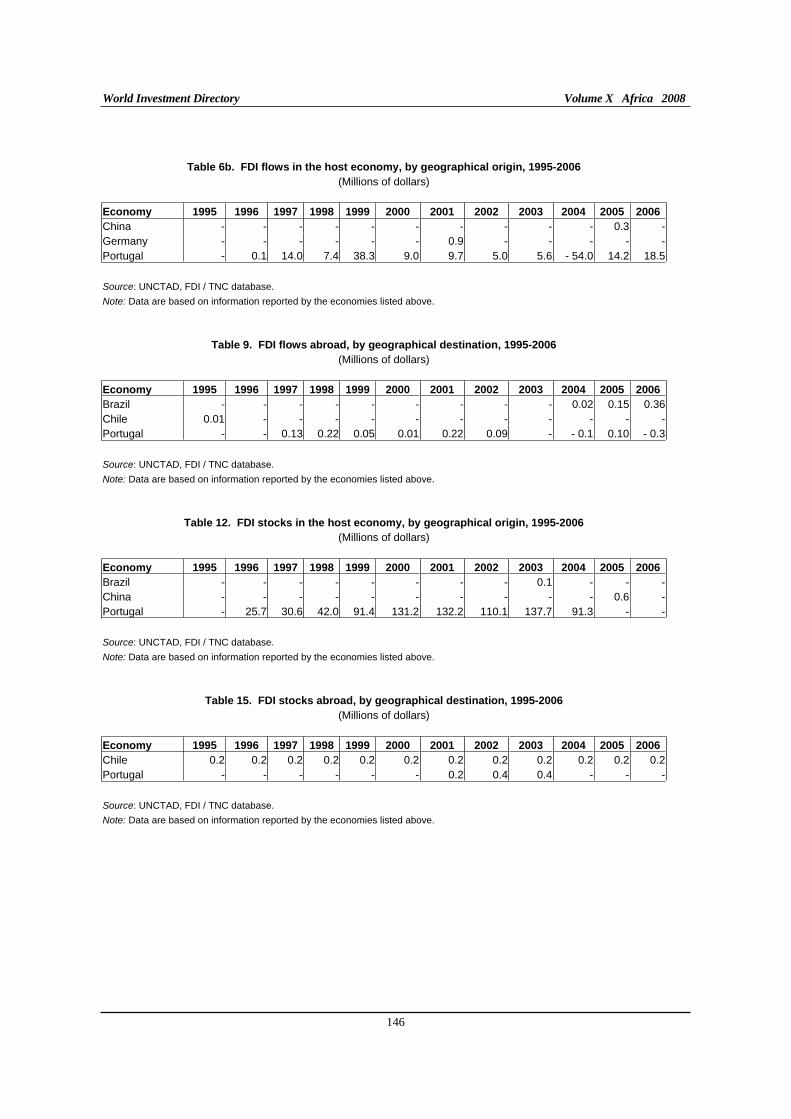
World Investment Directory Volume X Africa 2008
146
Table 6b. FDI flows in the host economy, by geographical origin, 1995-2006
(Millions of dollars)
Economy 1995 1996 1997 1998 1999 2000 2001 2002 2003 2004 2005 2006
China - - - - - - - - - - 0.3 -Germany - - - - - - 0.9 - - - - -Portugal - 0.1 14.0 7.4 38.3 9.0 9.7 5.0 5.6 - 54.0 14.2 18.5
Source: UNCTAD, FDI / TNC database.
Note: Data are based on information reported by the economies listed above.
Table 9. FDI flows abroad, by geographical destination, 1995-2006
(Millions of dollars)
Economy 1995 1996 1997 1998 1999 2000 2001 2002 2003 2004 2005 2006
Brazil - - - - - - - - - 0.02 0.15 0.36Chile 0.01 - - - - - - - - - - -Portugal - - 0.13 0.22 0.05 0.01 0.22 0.09 - - 0.1 0.10 - 0.3
Source: UNCTAD, FDI / TNC database.
Note: Data are based on information reported by the economies listed above.
Table 12. FDI stocks in the host economy, by geographical origin, 1995-2006
(Millions of dollars)
Economy 1995 1996 1997 1998 1999 2000 2001 2002 2003 2004 2005 2006
Brazil - - - - - - - - 0.1 - - -China - - - - - - - - - - 0.6 -Portugal - 25.7 30.6 42.0 91.4 131.2 132.2 110.1 137.7 91.3 - -
Source: UNCTAD, FDI / TNC database.
Note: Data are based on information reported by the economies listed above.
Table 15. FDI stocks abroad, by geographical destination, 1995-2006
(Millions of dollars)
Economy 1995 1996 1997 1998 1999 2000 2001 2002 2003 2004 2005 2006
Chile 0.2 0.2 0.2 0.2 0.2 0.2 0.2 0.2 0.2 0.2 0.2 0.2Portugal - - - - - - 0.2 0.4 0.4 - - -
Source: UNCTAD, FDI / TNC database.
Note: Data are based on information reported by the economies listed above.
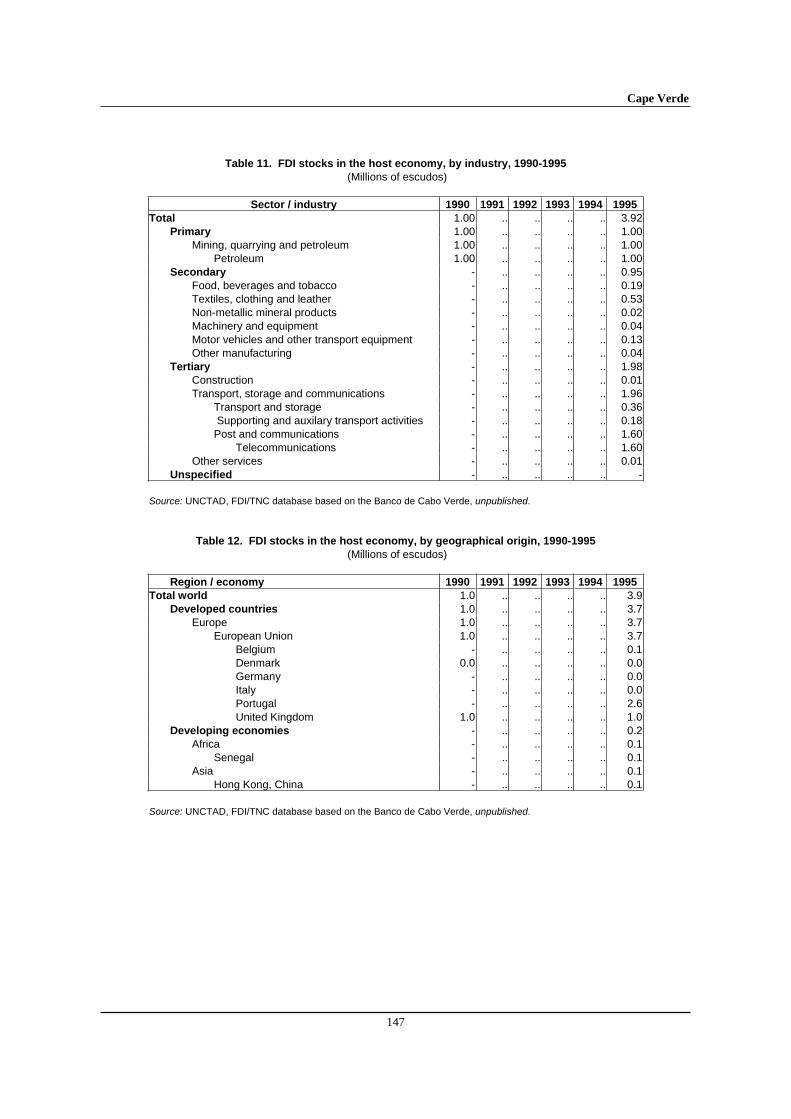
Cape Verde
147
Table 11. FDI stocks in the host economy, by industry, 1990-1995
(Millions of escudos)
Sector / industry 1990 1991 1992 1993 1994 1995
Total 1.00 .. .. .. .. 3.92Primary 1.00 .. .. .. .. 1.00
Mining, quarrying and petroleum 1.00 .. .. .. .. 1.00Petroleum 1.00 .. .. .. .. 1.00
Secondary - .. .. .. .. 0.95Food, beverages and tobacco - .. .. .. .. 0.19Textiles, clothing and leather - .. .. .. .. 0.53Non-metallic mineral products - .. .. .. .. 0.02Machinery and equipment - .. .. .. .. 0.04Motor vehicles and other transport equipment - .. .. .. .. 0.13Other manufacturing - .. .. .. .. 0.04
Tertiary - .. .. .. .. 1.98Construction - .. .. .. .. 0.01Transport, storage and communications - .. .. .. .. 1.96
Transport and storage - .. .. .. .. 0.36 Supporting and auxilary transport activities - .. .. .. .. 0.18Post and communications - .. .. .. .. 1.60
Telecommunications - .. .. .. .. 1.60Other services - .. .. .. .. 0.01
Unspecified - .. .. .. .. - Source: UNCTAD, FDI/TNC database based on the Banco de Cabo Verde, unpublished.
Table 12. FDI stocks in the host economy, by geographical origin, 1990-1995
(Millions of escudos)
Region / economy 1990 1991 1992 1993 1994 1995
Total world 1.0 .. .. .. .. 3.9Developed countries 1.0 .. .. .. .. 3.7
Europe 1.0 .. .. .. .. 3.7European Union 1.0 .. .. .. .. 3.7
Belgium - .. .. .. .. 0.1Denmark 0.0 .. .. .. .. 0.0Germany - .. .. .. .. 0.0Italy - .. .. .. .. 0.0Portugal - .. .. .. .. 2.6United Kingdom 1.0 .. .. .. .. 1.0
Developing economies - .. .. .. .. 0.2Africa - .. .. .. .. 0.1
Senegal - .. .. .. .. 0.1Asia - .. .. .. .. 0.1
Hong Kong, China - .. .. .. .. 0.1 Source: UNCTAD, FDI/TNC database based on the Banco de Cabo Verde, unpublished.
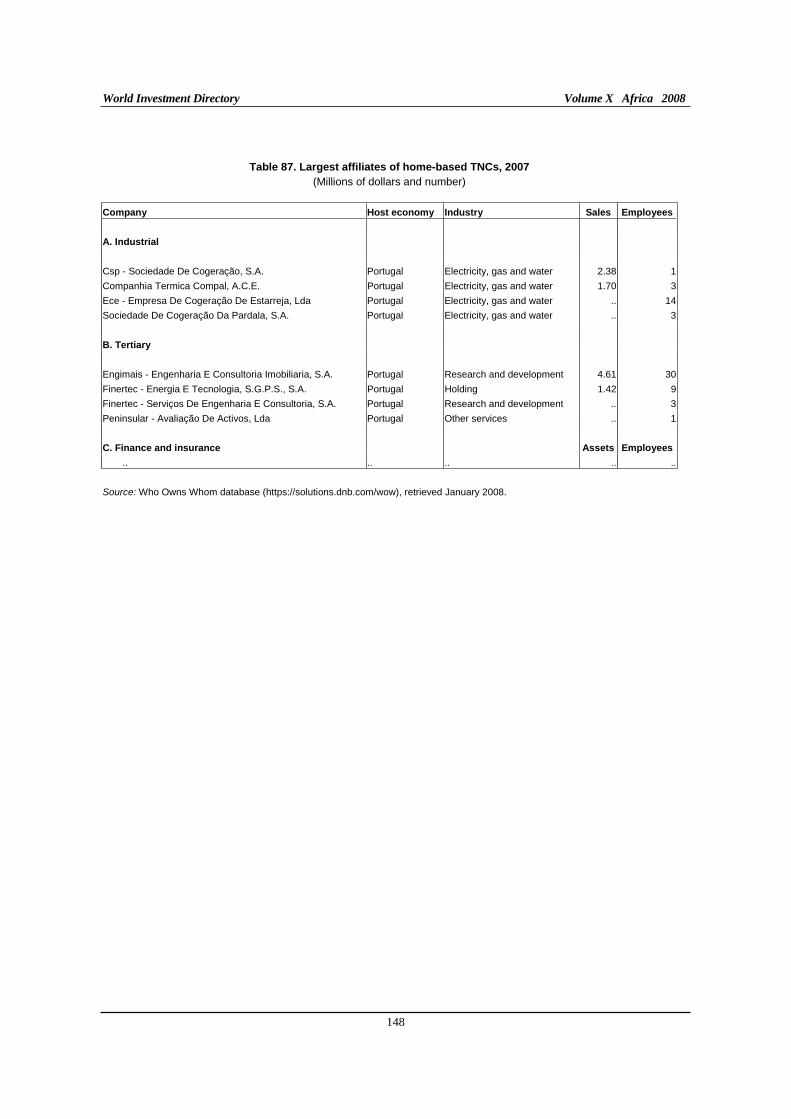
World Investment Directory Volume X Africa 2008
148
Table 87. Largest affiliates of home-based TNCs, 2007
(Millions of dollars and number)
Company Host economy Industry Sales Employees
A. Industrial
Csp - Sociedade De Cogeração, S.A. Portugal Electricity, gas and water 2.38 1
Companhia Termica Compal, A.C.E. Portugal Electricity, gas and water 1.70 3
Ece - Empresa De Cogeração De Estarreja, Lda Portugal Electricity, gas and water .. 14
Sociedade De Cogeração Da Pardala, S.A. Portugal Electricity, gas and water .. 3
B. Tertiary
Engimais - Engenharia E Consultoria Imobiliaria, S.A. Portugal Research and development 4.61 30
Finertec - Energia E Tecnologia, S.G.P.S., S.A. Portugal Holding 1.42 9
Finertec - Serviços De Engenharia E Consultoria, S.A. Portugal Research and development .. 3
Peninsular - Avaliação De Activos, Lda Portugal Other services .. 1
C. Finance and insurance Assets Employees
.. .. .. .. ..
Source: Who Owns Whom database (https://solutions.dnb.com/wow), retrieved January 2008.
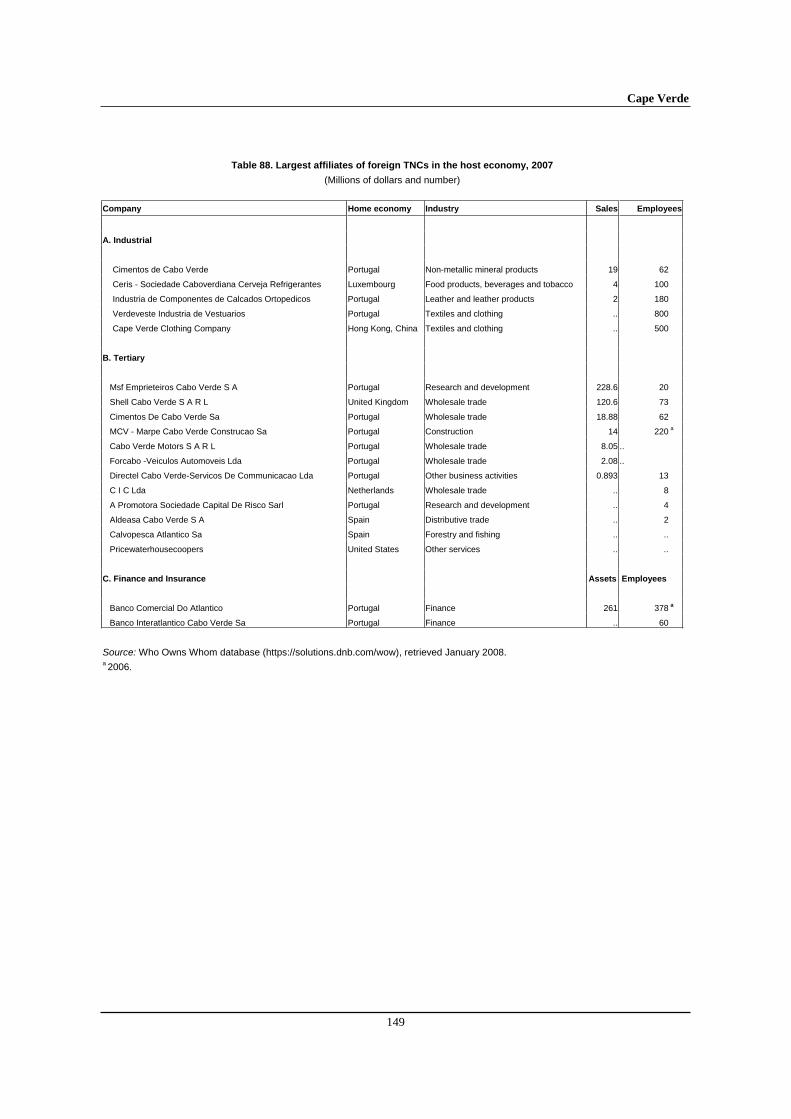
Cape Verde
149
Table 88. Largest affiliates of foreign TNCs in the host economy, 2007
(Millions of dollars and number)
Company Home economy Industry Sales Employees
A. Industrial
Cimentos de Cabo Verde Portugal Non-metallic mineral products 19 62
Ceris - Sociedade Caboverdiana Cerveja Refrigerantes Luxembourg Food products, beverages and tobacco 4 100
Industria de Componentes de Calcados Ortopedicos Portugal Leather and leather products 2 180
Verdeveste Industria de Vestuarios Portugal Textiles and clothing .. 800
Cape Verde Clothing Company Hong Kong, China Textiles and clothing .. 500
B. Tertiary
Msf Emprieteiros Cabo Verde S A Portugal Research and development 228.6 20
Shell Cabo Verde S A R L United Kingdom Wholesale trade 120.6 73
Cimentos De Cabo Verde Sa Portugal Wholesale trade 18.88 62
MCV - Marpe Cabo Verde Construcao Sa Portugal Construction 14 220 a
Cabo Verde Motors S A R L Portugal Wholesale trade 8.05 ..
Forcabo -Veiculos Automoveis Lda Portugal Wholesale trade 2.08 ..
Directel Cabo Verde-Servicos De Communicacao Lda Portugal Other business activities 0.893 13
C I C Lda Netherlands Wholesale trade .. 8
A Promotora Sociedade Capital De Risco Sarl Portugal Research and development .. 4
Aldeasa Cabo Verde S A Spain Distributive trade .. 2
Calvopesca Atlantico Sa Spain Forestry and fishing .. ..
Pricewaterhousecoopers United States Other services .. ..
C. Finance and Insurance Assets Employees
Banco Comercial Do Atlantico Portugal Finance 261 378 a
Banco Interatlantico Cabo Verde Sa Portugal Finance .. 60
Source: Who Owns Whom database (https://solutions.dnb.com/wow), retrieved January 2008. a 2006.
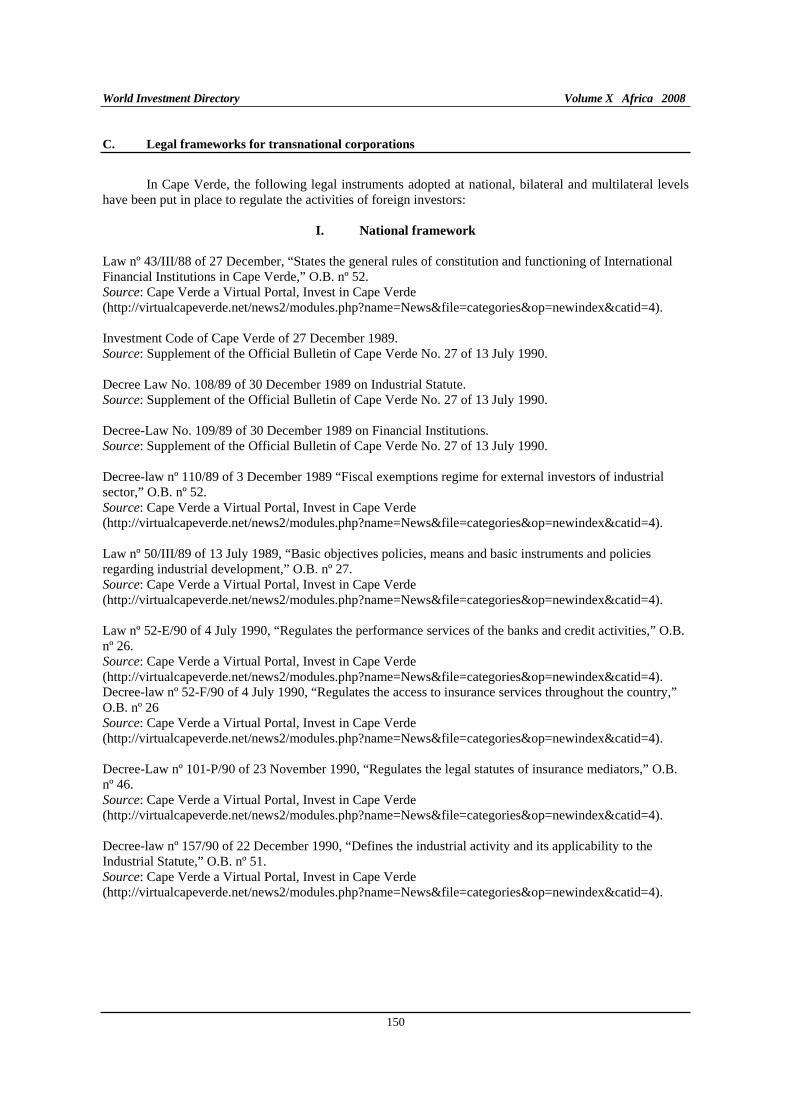
World Investment Directory Volume X Africa 2008
150
C. Legal frameworks for transnational corporations
In Cape Verde, the following legal instruments adopted at national, bilateral and multilateral levels have been put in place to regulate the activities of foreign investors:
I. National framework
Law nº 43/III/88 of 27 December, “States the general rules of constitution and functioning of International Financial Institutions in Cape Verde,” O.B. nº 52. Source: Cape Verde a Virtual Portal, Invest in Cape Verde (http://virtualcapeverde.net/news2/modules.php?name=News&file=categories&op=newindex&catid=4).
Investment Code of Cape Verde of 27 December 1989. Source: Supplement of the Official Bulletin of Cape Verde No. 27 of 13 July 1990.
Decree Law No. 108/89 of 30 December 1989 on Industrial Statute. Source: Supplement of the Official Bulletin of Cape Verde No. 27 of 13 July 1990.
Decree-Law No. 109/89 of 30 December 1989 on Financial Institutions. Source: Supplement of the Official Bulletin of Cape Verde No. 27 of 13 July 1990.
Decree-law nº 110/89 of 3 December 1989 “Fiscal exemptions regime for external investors of industrial sector,” O.B. nº 52. Source: Cape Verde a Virtual Portal, Invest in Cape Verde (http://virtualcapeverde.net/news2/modules.php?name=News&file=categories&op=newindex&catid=4).
Law nº 50/III/89 of 13 July 1989, “Basic objectives policies, means and basic instruments and policies regarding industrial development,” O.B. nº 27. Source: Cape Verde a Virtual Portal, Invest in Cape Verde (http://virtualcapeverde.net/news2/modules.php?name=News&file=categories&op=newindex&catid=4).
Law nº 52-E/90 of 4 July 1990, “Regulates the performance services of the banks and credit activities,” O.B. nº 26. Source: Cape Verde a Virtual Portal, Invest in Cape Verde (http://virtualcapeverde.net/news2/modules.php?name=News&file=categories&op=newindex&catid=4). Decree-law nº 52-F/90 of 4 July 1990, “Regulates the access to insurance services throughout the country,” O.B. nº 26 Source: Cape Verde a Virtual Portal, Invest in Cape Verde (http://virtualcapeverde.net/news2/modules.php?name=News&file=categories&op=newindex&catid=4).
Decree-Law nº 101-P/90 of 23 November 1990, “Regulates the legal statutes of insurance mediators,” O.B. nº 46. Source: Cape Verde a Virtual Portal, Invest in Cape Verde (http://virtualcapeverde.net/news2/modules.php?name=News&file=categories&op=newindex&catid=4).
Decree-law nº 157/90 of 22 December 1990, “Defines the industrial activity and its applicability to the Industrial Statute,” O.B. nº 51. Source: Cape Verde a Virtual Portal, Invest in Cape Verde (http://virtualcapeverde.net/news2/modules.php?name=News&file=categories&op=newindex&catid=4).
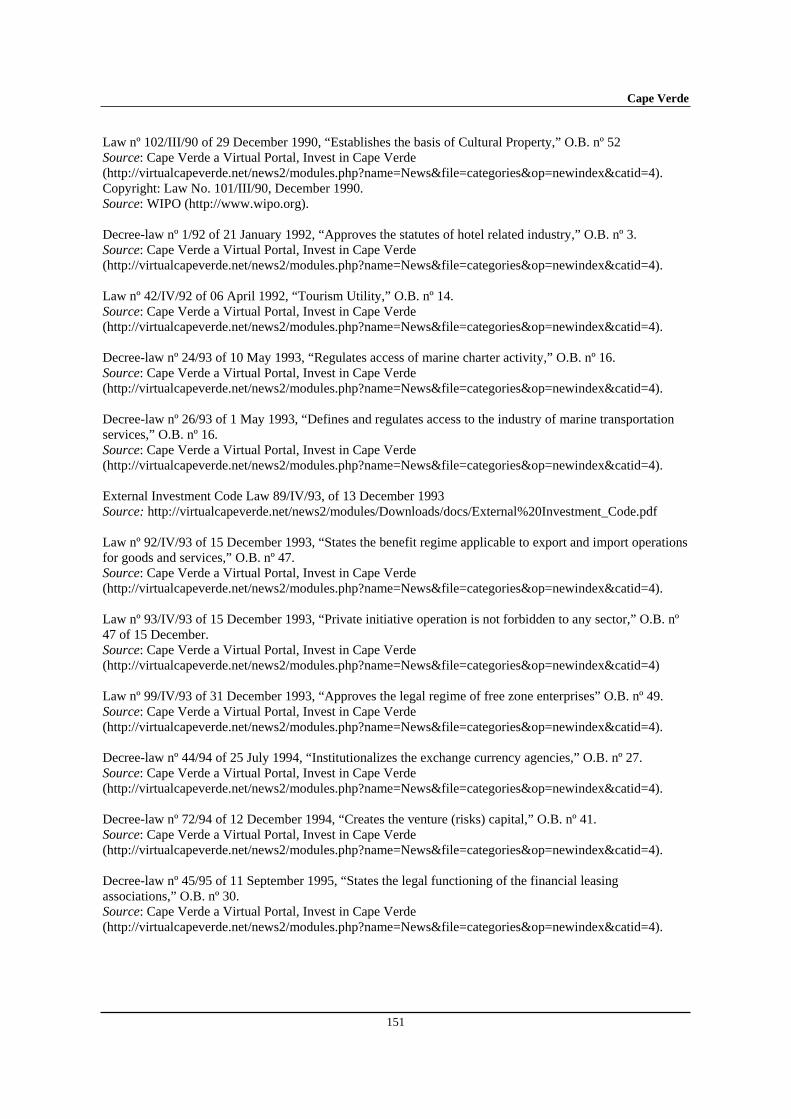
Cape Verde
151
Law nº 102/III/90 of 29 December 1990, “Establishes the basis of Cultural Property,” O.B. nº 52 Source: Cape Verde a Virtual Portal, Invest in Cape Verde (http://virtualcapeverde.net/news2/modules.php?name=News&file=categories&op=newindex&catid=4). Copyright: Law No. 101/III/90, December 1990. Source: WIPO (http://www.wipo.org).
Decree-law nº 1/92 of 21 January 1992, “Approves the statutes of hotel related industry,” O.B. nº 3. Source: Cape Verde a Virtual Portal, Invest in Cape Verde (http://virtualcapeverde.net/news2/modules.php?name=News&file=categories&op=newindex&catid=4).
Law nº 42/IV/92 of 06 April 1992, “Tourism Utility,” O.B. nº 14. Source: Cape Verde a Virtual Portal, Invest in Cape Verde (http://virtualcapeverde.net/news2/modules.php?name=News&file=categories&op=newindex&catid=4).
Decree-law nº 24/93 of 10 May 1993, “Regulates access of marine charter activity,” O.B. nº 16. Source: Cape Verde a Virtual Portal, Invest in Cape Verde (http://virtualcapeverde.net/news2/modules.php?name=News&file=categories&op=newindex&catid=4).
Decree-law nº 26/93 of 1 May 1993, “Defines and regulates access to the industry of marine transportation services,” O.B. nº 16. Source: Cape Verde a Virtual Portal, Invest in Cape Verde (http://virtualcapeverde.net/news2/modules.php?name=News&file=categories&op=newindex&catid=4).
External Investment Code Law 89/IV/93, of 13 December 1993 Source: http://virtualcapeverde.net/news2/modules/Downloads/docs/External%20Investment_Code.pdf
Law nº 92/IV/93 of 15 December 1993, “States the benefit regime applicable to export and import operations for goods and services,” O.B. nº 47. Source: Cape Verde a Virtual Portal, Invest in Cape Verde (http://virtualcapeverde.net/news2/modules.php?name=News&file=categories&op=newindex&catid=4).
Law nº 93/IV/93 of 15 December 1993, “Private initiative operation is not forbidden to any sector,” O.B. nº 47 of 15 December. Source: Cape Verde a Virtual Portal, Invest in Cape Verde (http://virtualcapeverde.net/news2/modules.php?name=News&file=categories&op=newindex&catid=4)
Law nº 99/IV/93 of 31 December 1993, “Approves the legal regime of free zone enterprises” O.B. nº 49. Source: Cape Verde a Virtual Portal, Invest in Cape Verde (http://virtualcapeverde.net/news2/modules.php?name=News&file=categories&op=newindex&catid=4).
Decree-law nº 44/94 of 25 July 1994, “Institutionalizes the exchange currency agencies,” O.B. nº 27. Source: Cape Verde a Virtual Portal, Invest in Cape Verde (http://virtualcapeverde.net/news2/modules.php?name=News&file=categories&op=newindex&catid=4).
Decree-law nº 72/94 of 12 December 1994, “Creates the venture (risks) capital,” O.B. nº 41. Source: Cape Verde a Virtual Portal, Invest in Cape Verde (http://virtualcapeverde.net/news2/modules.php?name=News&file=categories&op=newindex&catid=4).
Decree-law nº 45/95 of 11 September 1995, “States the legal functioning of the financial leasing associations,” O.B. nº 30. Source: Cape Verde a Virtual Portal, Invest in Cape Verde (http://virtualcapeverde.net/news2/modules.php?name=News&file=categories&op=newindex&catid=4).
World Investment Directory Volume X Africa 2008
152
Decree-law nº 70/95 of 20 November 1995, “Defines access and service performance of telecommunications on the value added regime,” O.B. nº 40. Source: Cape Verde a Virtual Portal, Invest in Cape Verde (http://virtualcapeverde.net/news2/modules.php?name=News&file=categories&op=newindex&catid=4).
Decree-law nº 72/95 of 20 November 1995, “Defines the management regime for the establishment and exploration of the infrastructure and services performance of complementary telecommunications,” O.B. nº 40. Source: Cape Verde a Virtual Portal, Invest in Cape Verde (http://virtualcapeverde.net/news2/modules.php?name=News&file=categories&op=newindex&catid=4).
Decree-law nº 13/96 of 18 March 1996, “Defines the tariffs regime and prices of services performed exclusively by the operators of public services of post-offices and telecommunications,” O.B. nº 6. Source: Cape Verde a Virtual Portal, Invest in Cape Verde (http://virtualcapeverde.net/news2/modules.php?name=News&file=categories&op=newindex&catid=4).
Law nº 3/V/96 of 1 July 1996, “States the general rules of constitution and functioning of banks and financial institutions,” O.B. nº 20. Source: Cape Verde a Virtual Portal, Invest in Cape Verde (http://virtualcapeverde.net/news2/modules.php?name=News&file=categories&op=newindex&catid=4).
Decree-law nº 51/96 of 26 December 1996, “Regulates the international shipping registration services,” O.B. nº 44. Note: The National Assembly has approved a new law on International Ship Registration. It awaits publication in the Official Bulletin and regulation. The new law will revoke Decree-Law nº 51/96. Source: Cape Verde a Virtual Portal, Invest in Cape Verde (http://virtualcapeverde.net/news2/modules.php?name=News&file=categories&op=newindex&catid=4).
Law nº 32/V/97 of 30 June 1997, “Alters some law-articles nº 43/III/88 of 27 December regarding the International Financial Institutions,” O.B. nº 25. Source: Cape Verde a Virtual Portal, Invest in Cape Verde (http://virtualcapeverde.net/news2/modules.php?name=News&file=categories&op=newindex&catid=4).
Decree-law nº 66/97 of 3 November 1997, “ Regulates the specific conditions of Authorization, for the constitution or establishment and functioning of International Financial Institutions in Cape Verde,” O.B. nº 42, 1st Series.
Notice nº 3/98 of 18 August 1998, “Clarifications regarding the movements of foreign accounts in escudos, foreign accounts in foreign currency, national accounts in foreign currency,” O.B. nº 30. Source: Cape Verde a Virtual Portal, Invest in Cape Verde (http://virtualcapeverde.net/news2/modules.php?name=News&file=categories&op=newindex&catid=4).
Decree-law nº 25/98 of 29 July 1998, “Approves the new Exchange Operation regime,” O.B. nº 23. Source: Cape Verde a Virtual Portal, Invest in Cape Verde (http://virtualcapeverde.net/news2/modules.php?name=News&file=categories&op=newindex&catid=4).
Decree-law nº 26/98 of 29 June 1998, “Approves the new current and capital operation regime,” O.B. nº 23. Source: Cape Verde a Virtual Portal, Invest in Cape Verde (http://virtualcapeverde.net/news2/modules.php?name=News&file=categories&op=newindex&catid=4).
Decree-law nº 46/98 of 7 September 1998, “Determines the pre-conditions to be observed by the entities performing as marine agents,” O.B. nº 33. Source: Cape Verde a Virtual Portal, Invest in Cape Verde (http://virtualcapeverde.net/news2/modules.php?name=News&file=categories&op=newindex&catid=4).
Cape Verde
153
Notice nº 4/98 of 21 December 1998, “Regulates current and capital operations,” O.B. nº 47. Source: Cape Verde a Virtual Portal, Invest in Cape Verde (http://virtualcapeverde.net/news2/modules.php?name=News&file=categories&op=newindex&catid=4).
Law nº 83/V/98 of 21 December 1998, “Creates free trade zones” O.B. nº 47. Source: Cape Verde a Virtual Portal, Invest in Cape Verde (http://virtualcapeverde.net/news2/modules.php?name=News&file=categories&op=newindex&catid=4).
Decree-law nº 1/99 of 1 February 1999, “Establishes the price policy for goods and services,” O.B. nº 1. Source: Cape Verde a Virtual Portal, Invest in Cape Verde (http://virtualcapeverde.net/news2/modules.php?name=News&file=categories&op=newindex&catid=4).
Decree-law nº 3/99 of 1 February 1999, “Total liberalization of imports,” O.B. nº 1. Source: Cape Verde a Virtual Portal, Invest in Cape Verde (http://virtualcapeverde.net/news2/modules.php?name=News&file=categories&op=newindex&catid=4).
Legislative law nº 3/99 of 29 March 1999, “Approves the Code of Trade Enterprises,” O.B. nº 9. Source: Cape Verde a Virtual Portal, Invest in Cape Verde (http://virtualcapeverde.net/news2/modules.php?name=News&file=categories&op=newindex&catid=4).
Decree-law nº 4/99, “States the norms for economic operations,” O.B. nº 1. Source: Cape Verde a Virtual Portal, Invest in Cape Verde (http://virtualcapeverde.net/news2/modules.php?name=News&file=categories&op=newindex&catid=4).
Decree-law nº 59/99 of 27 September 1999, “Regulates registration procedures for firms,” O.B. nº 35. Source: Cape Verde a Virtual Portal, Invest in Cape Verde (http://virtualcapeverde.net/news2/modules.php?name=News&file=categories&op=newindex&catid=4).
Decree-law nº 30/2000 of 10 July 2000, “Re-analyzes the legal exchange agencies regimes,” O.B. nº 21 Source: Cape Verde a Virtual Portal, Invest in Cape Verde (http://virtualcapeverde.net/news2/modules.php?name=News&file=categories&op=newindex&catid=4).
Decree-law nº 126/VI/2001 of 22 January 2001, “Granting of fiscal benefits to the holders of air transportation,” O.B. nº 2. Source: Cape Verde a Virtual Portal, Invest in Cape Verde (http://virtualcapeverde.net/news2/modules.php?name=News&file=categories&op=newindex&catid=4).
Decree-law nº 10/VI/2002 of 15 July 2002, “Approves the organic law of the Bank of Cape Verde,” O.B. nº 21. Source: Cape Verde a Virtual Portal, Invest in Cape Verde (http://virtualcapeverde.net/news2/modules.php?name=News&file=categories&op=newindex&catid=4).
II. International Framework
A. Cape Verde is a party to the following multilateral and regional instruments:
Convention Establishing the Multilateral Investment Guarantee Agency of 1985, entered into force on 12 April 1988.
Fourth ACP - EEC Convention (Lome IV) of 1989, entered into force on 1st March 1990.
Partnership Agreement between the Members of The African, Caribbean and Pacific Group of States, of the one part and the European Community and its member states, of the other part signed in Cotonou, Benin on 23 June 2000.
World Investment Directory Volume X Africa 2008
154
B. Bilateral treaties
1. Bilateral investment treaties for the protection and promotion of investments: Germany 1990, Portugal 1990, Austria 1991, Netherlands 1991, Switzerland 1991, Angola 1997, Cuba 1997, Italy 1997, China 1998.
2. Bilateral treaties for the avoidance of double taxation: Portugal 1999.
Cape Verde
155
D. Sources of information
Official
Centro de Promoção Turística dos Investimentos e das Exportações de Cabo Verde (PROMEX). Banco de Cabo Verde (www.bcv.cv).
Secondary
Economist Intelligence Unit (EIU) (various years). Country Profile: Cape Verde (London: EIU Ltd.).
______________ (various years). Country Report: Cape Verde (London: EIU Ltd.).
Foreign Investment Advisory Service (FIAS) (2000). "Providing advice on FDI in small island economies: the need for a differentiated approach?" (FIAS/PREM seminars, 17 October 2000).
International Monetary Fund (IMF) (2006). IMF's Sub-Saharan Africa Regional Economic Outlook, March 10, 2006. (Washington D.C.: IMF).
Morisset, J. (2001). "Foreign direct investment in Africa: policies also matter", OECD Global Forum on International Investment (Paris: OECD).
Ruffer, Tim, S. Jones and S. Akroyd (2002). "Development box proposals and their potential effect on developing countries." Mimeo, (London: U.K. Department for International Development).
Soderbom, M. and F. Teal (2004). "Size and Efficiency in Africa Manufacturing firms: Evidence from Firm-Level Panel Data." Journal of Development Economics, 73. pp 369 - 394.
Willem Dirk te Velde and Oliver Morrissey (2002). "Foreign ownership and wages: evidence from five African countries" (Cameroon, Ghana, Kenya, Zambia and Zimbabwe) (Nothingham: Center for Research in Economic Development and International Trade, University of Nothingham; Research paper No. 01/19).
The Government of Cape Verde (2001). "Country presentation: Cape Verde", presented at the Third United Nations Conference on the Least Developed Countries (Paris: UNCTAD).
United Nations Conference on Trade and Development (UNCTAD) (2002). FDI in Least Developed
Countries at a Glance (Geneva: UNCTAD) (www.unctad.org/en/subsites/dite/LDCs/ pdfs/Countries/capeverde.pdf).
_____________(2005a). Investor-Disputes Arising from Investment Treaties: A Review. UNCTAD Series of International Investment Policies for Development (UNCTAD/ITE/IIT/2005/4).
_____________(2005b). A Survey of Support by Investment Promotion Agencies to Linkages, Advisory Studies No. 18 (UNCTAD/ITE/IPC/2005/12).
_____________(2005c). FDI in least developed countries at a glance: 2005/2006
(UNCTAD/ITE/IIA/2005/17).
United States Trade Representative (2006). 2006 Comprehensive Report on U.S. Trade and Investment
Policy Toward Sub-Saharan Africa and Implementation of the Africa Growth and Opportunity Act:
The Sixth of Eight Annual Reports, May 2006. (Washington D.C.: US Government).

World Investment Directory Volume X Africa 2008
156
World Bank/International Finance Corporation (2007). Doing Business 2008 Cape Verde (Washington D.C.: The World Bank Group).
Central African Republic
157
Central African Republic
A. Definitions and sources of data
Data on foreign direct investment (FDI) in Central African Republic are gathered by the Banque des États de l’Afrique Centrale (BEAC). Data are also provided by the international Monetary in its balance-of-payment statistics. The Investment Code (Investment Code - No. 88-004 of 9 May 1988) governs all foreign investment in the country, including foreign direct investment (FDI). This code does not define FDI.
Central African Republic welcomes foreign investment particularly in the mining which has grown in the recent years. Alluvial diamonds are the main source of mineral income. There are many diamond companies in the country. Other companies are planning to develop deposits of silver, lead and iron in the country. In the investment code, the Ministry of Energy and Mines will be entirely responsible for issuing licenses, in an attempt to speed up license acquisition. Given the improved political stability, there is likely to be a rise in foreign investment in cotton, timber and mining.
In Central African Republic, investments must be declared unless they are reinvestment of undistributed profits. The investment code is designed to open up the country to foreign investors while complying with the treaty creating the Central African States Economic and Monetary Community. In the code, there is no sector in which foreign investors are denied national treatment in Central African Republic. Foreigners have also won a significant presence in some formerly state-dominated sectors such as telecommunications, and full ownership of businesses by foreigners is permitted. Residents and non-residents may hold foreign exchange accounts. The Government plans to privatize its share in several other public companies. But in 2005, the Central African Republic introduced an indefinite suspension of the issuance of new gold and diamond mining permits and banned foreigners from entering mining zones.
Central African Republic signed to the Convention on the Settlement of Investment Disputes between State and Nationals of other States on August 26, 1965 and is a member of the Central African States Economic and Monetary Community which includes Cameroon, Chad, the Republic of Congo, Equatorial Guinea and Gabon. It is also a member of the African Union, New Partnership for Africa's Development, BEAC and is eligible for several preferential trade schemes, such as the generalized system of preferences for the least developed countries, the European Union market access scheme - the Everything But Arms initiative and is signatory to the Cotonou Agreement for renegotiating the preferential trade between the Africa, Caribbean and Pacific countries with the European Union. Central Africa Republic is a member of the World Trade Organization.

World Investment Directory Volume X Africa 2008
158
B. Statistics on FDI and the operations of TNCs
Table 1. Summary of FDI
(Millions of dollars)
Variable Inward Outward
1. FDI flows, 2003-2006 (annual average) 24.3 0.0
2. FDI flows as a percentage of GFCF, 2003-2006 (annual average) 37.1 0.0
3. FDI stocks, 2006 211 45
4. FDI stocks as a percentage of GDP, 2006 14.2 3.0
Source: Based on tables 3a and 4 and UNCTAD, FDI/TNC database.
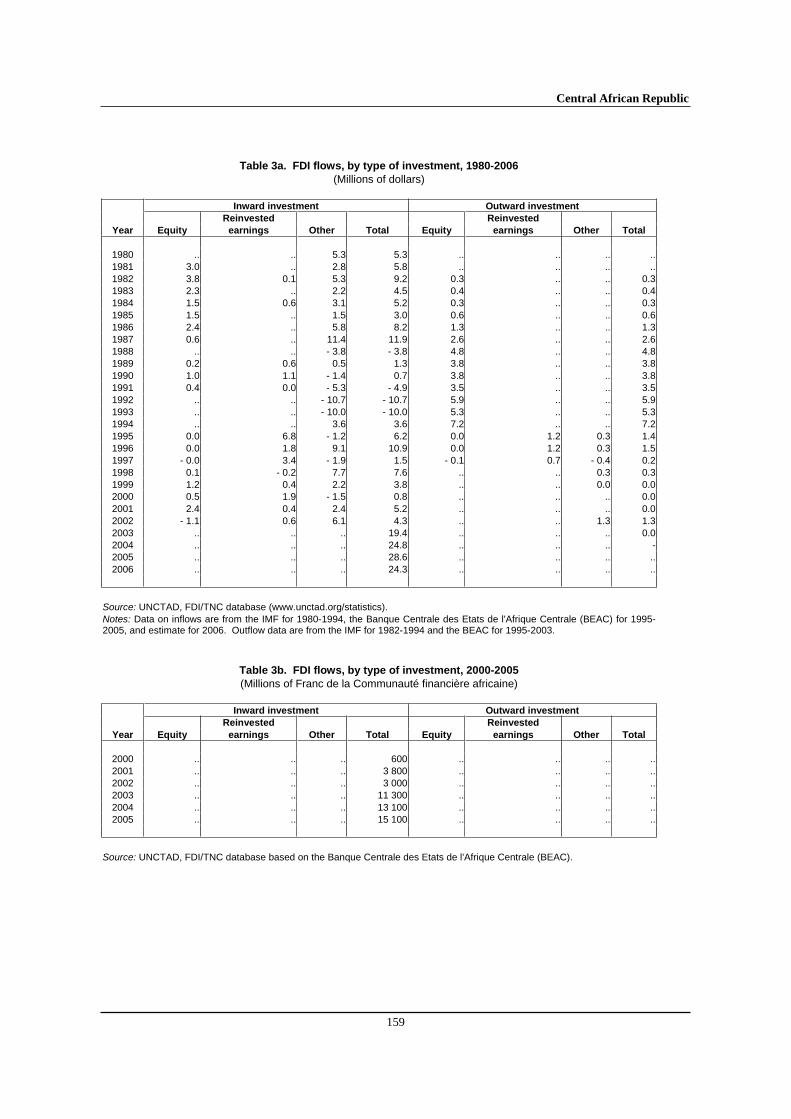
Central African Republic
159
Table 3a. FDI flows, by type of investment, 1980-2006
(Millions of dollars)
Inward investment Outward investment
Reinvested Reinvested
Year Equity earnings Other Total Equity earnings Other Total
1980 .. .. 5.3 5.3 .. .. .. ..1981 3.0 .. 2.8 5.8 .. .. .. ..1982 3.8 0.1 5.3 9.2 0.3 .. .. 0.31983 2.3 .. 2.2 4.5 0.4 .. .. 0.41984 1.5 0.6 3.1 5.2 0.3 .. .. 0.31985 1.5 .. 1.5 3.0 0.6 .. .. 0.61986 2.4 .. 5.8 8.2 1.3 .. .. 1.31987 0.6 .. 11.4 11.9 2.6 .. .. 2.61988 .. .. - 3.8 - 3.8 4.8 .. .. 4.81989 0.2 0.6 0.5 1.3 3.8 .. .. 3.81990 1.0 1.1 - 1.4 0.7 3.8 .. .. 3.81991 0.4 0.0 - 5.3 - 4.9 3.5 .. .. 3.51992 .. .. - 10.7 - 10.7 5.9 .. .. 5.91993 .. .. - 10.0 - 10.0 5.3 .. .. 5.31994 .. .. 3.6 3.6 7.2 .. .. 7.21995 0.0 6.8 - 1.2 6.2 0.0 1.2 0.3 1.41996 0.0 1.8 9.1 10.9 0.0 1.2 0.3 1.51997 - 0.0 3.4 - 1.9 1.5 - 0.1 0.7 - 0.4 0.21998 0.1 - 0.2 7.7 7.6 .. .. 0.3 0.31999 1.2 0.4 2.2 3.8 .. .. 0.0 0.02000 0.5 1.9 - 1.5 0.8 .. .. .. 0.02001 2.4 0.4 2.4 5.2 .. .. .. 0.02002 - 1.1 0.6 6.1 4.3 .. .. 1.3 1.32003 .. .. .. 19.4 .. .. .. 0.02004 .. .. .. 24.8 .. .. .. -2005 .. .. .. 28.6 .. .. .. ..2006 .. .. .. 24.3 .. .. .. ..
Source: UNCTAD, FDI/TNC database (www.unctad.org/statistics). Notes: Data on inflows are from the IMF for 1980-1994, the Banque Centrale des Etats de l'Afrique Centrale (BEAC) for 1995-2005, and estimate for 2006. Outflow data are from the IMF for 1982-1994 and the BEAC for 1995-2003.
Table 3b. FDI flows, by type of investment, 2000-2005
(Millions of Franc de la Communauté financière africaine)
Inward investment Outward investment
Reinvested Reinvested
Year Equity earnings Other Total Equity earnings Other Total
2000 .. .. .. 600 .. .. .. ..2001 .. .. .. 3 800 .. .. .. ..2002 .. .. .. 3 000 .. .. .. ..2003 .. .. .. 11 300 .. .. .. ..2004 .. .. .. 13 100 .. .. .. ..2005 .. .. .. 15 100 .. .. .. ..
Source: UNCTAD, FDI/TNC database based on the Banque Centrale des Etats de l'Afrique Centrale (BEAC).
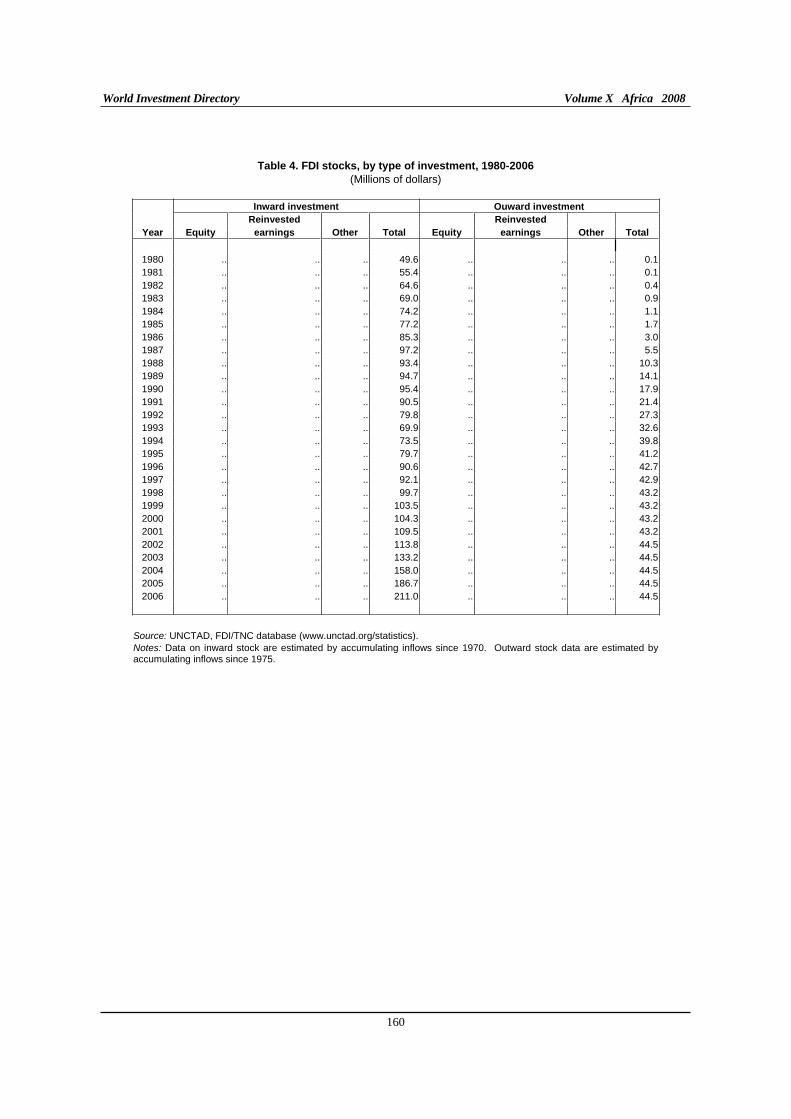
World Investment Directory Volume X Africa 2008
160
Table 4. FDI stocks, by type of investment, 1980-2006
(Millions of dollars)
Inward investment Ouward investment
Reinvested Reinvested
Year Equity earnings Other Total Equity earnings Other Total
1980 .. .. .. 49.6 .. .. .. 0.11981 .. .. .. 55.4 .. .. .. 0.11982 .. .. .. 64.6 .. .. .. 0.41983 .. .. .. 69.0 .. .. .. 0.91984 .. .. .. 74.2 .. .. .. 1.11985 .. .. .. 77.2 .. .. .. 1.71986 .. .. .. 85.3 .. .. .. 3.01987 .. .. .. 97.2 .. .. .. 5.51988 .. .. .. 93.4 .. .. .. 10.31989 .. .. .. 94.7 .. .. .. 14.11990 .. .. .. 95.4 .. .. .. 17.91991 .. .. .. 90.5 .. .. .. 21.41992 .. .. .. 79.8 .. .. .. 27.31993 .. .. .. 69.9 .. .. .. 32.61994 .. .. .. 73.5 .. .. .. 39.81995 .. .. .. 79.7 .. .. .. 41.21996 .. .. .. 90.6 .. .. .. 42.71997 .. .. .. 92.1 .. .. .. 42.91998 .. .. .. 99.7 .. .. .. 43.21999 .. .. .. 103.5 .. .. .. 43.22000 .. .. .. 104.3 .. .. .. 43.22001 .. .. .. 109.5 .. .. .. 43.22002 .. .. .. 113.8 .. .. .. 44.52003 .. .. .. 133.2 .. .. .. 44.52004 .. .. .. 158.0 .. .. .. 44.52005 .. .. .. 186.7 .. .. .. 44.52006 .. .. .. 211.0 .. .. .. 44.5
Source: UNCTAD, FDI/TNC database (www.unctad.org/statistics). Notes: Data on inward stock are estimated by accumulating inflows since 1970. Outward stock data are estimated by accumulating inflows since 1975.
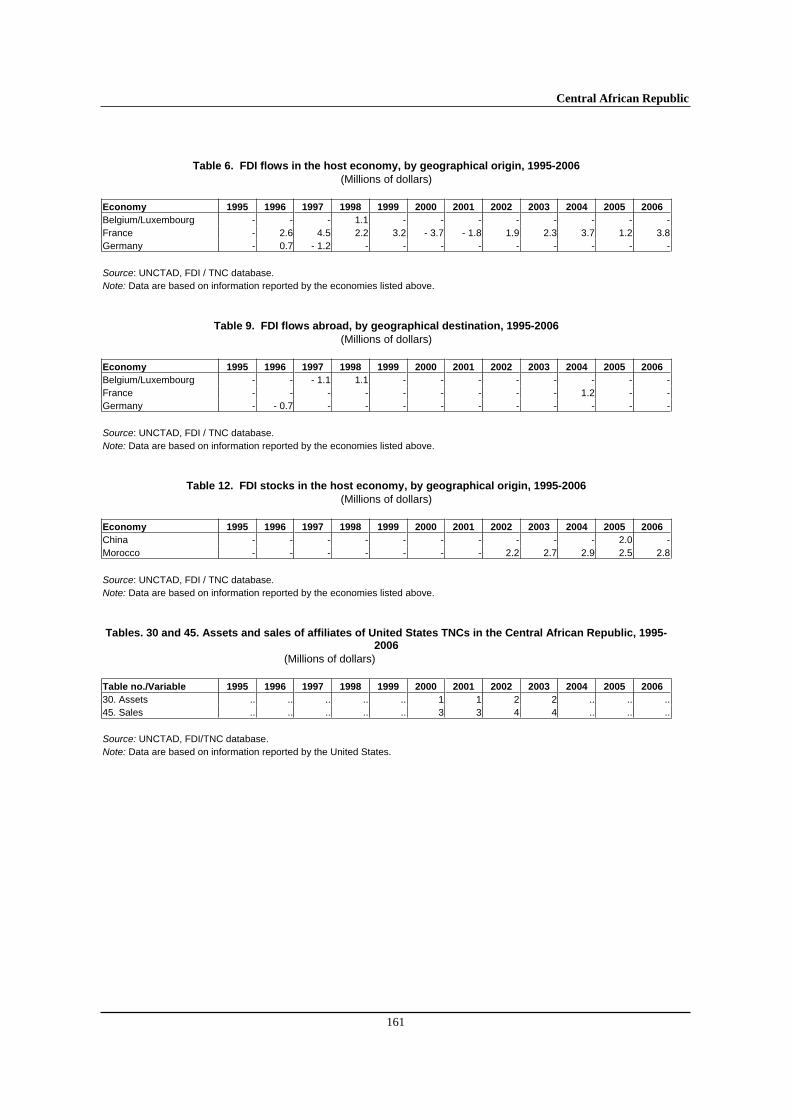
Central African Republic
161
Table 6. FDI flows in the host economy, by geographical origin, 1995-2006
(Millions of dollars) Economy 1995 1996 1997 1998 1999 2000 2001 2002 2003 2004 2005 2006
Belgium/Luxembourg - - - 1.1 - - - - - - - -France - 2.6 4.5 2.2 3.2 - 3.7 - 1.8 1.9 2.3 3.7 1.2 3.8Germany - 0.7 - 1.2 - - - - - - - - -
Source: UNCTAD, FDI / TNC database. Note: Data are based on information reported by the economies listed above.
Table 9. FDI flows abroad, by geographical destination, 1995-2006
(Millions of dollars) Economy 1995 1996 1997 1998 1999 2000 2001 2002 2003 2004 2005 2006
Belgium/Luxembourg - - - 1.1 1.1 - - - - - - - -France - - - - - - - - - 1.2 - -Germany - - 0.7 - - - - - - - - - -
Source: UNCTAD, FDI / TNC database. Note: Data are based on information reported by the economies listed above.
Table 12. FDI stocks in the host economy, by geographical origin, 1995-2006
(Millions of dollars) Economy 1995 1996 1997 1998 1999 2000 2001 2002 2003 2004 2005 2006
China - - - - - - - - - - 2.0 -Morocco - - - - - - - 2.2 2.7 2.9 2.5 2.8
Source: UNCTAD, FDI / TNC database. Note: Data are based on information reported by the economies listed above. Tables. 30 and 45. Assets and sales of affiliates of United States TNCs in the Central African Republic, 1995-
2006
(Millions of dollars) Table no./Variable 1995 1996 1997 1998 1999 2000 2001 2002 2003 2004 2005 2006
30. Assets .. .. .. .. .. 1 1 2 2 .. .. ..45. Sales .. .. .. .. .. 3 3 4 4 .. .. .. Source: UNCTAD, FDI/TNC database. Note: Data are based on information reported by the United States.
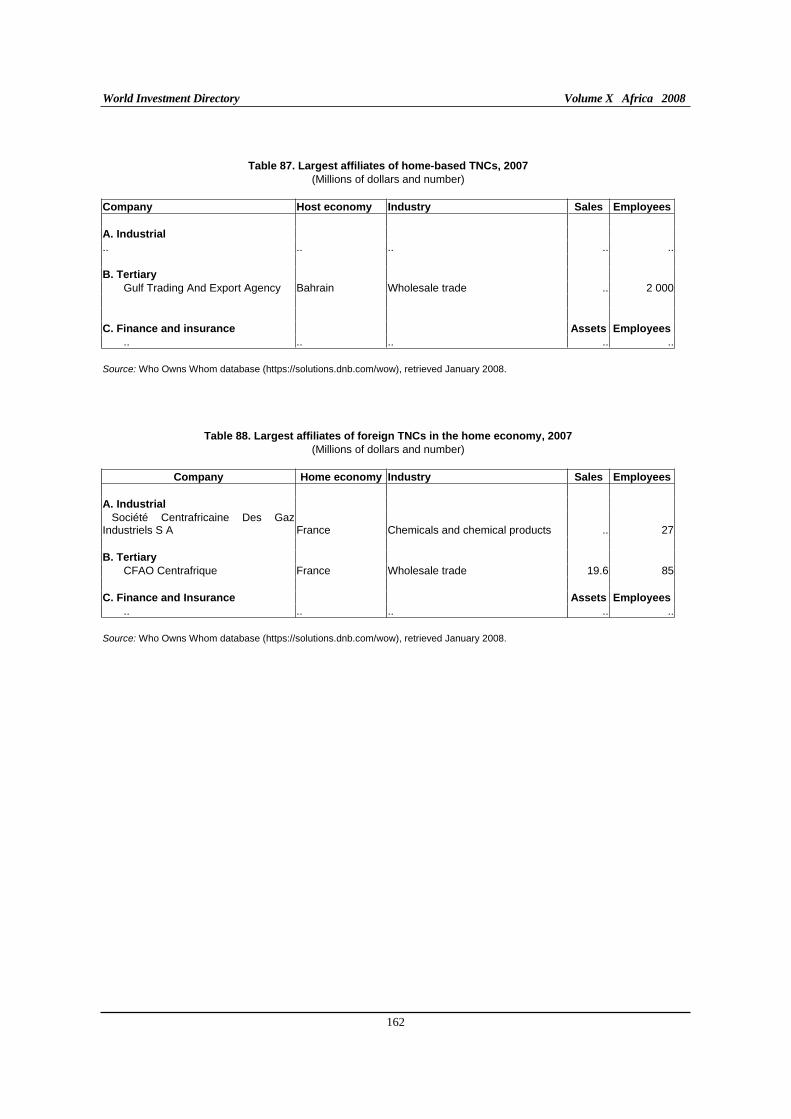
World Investment Directory Volume X Africa 2008
162
Table 87. Largest affiliates of home-based TNCs, 2007
(Millions of dollars and number) Company Host economy Industry Sales Employees
A. Industrial .. .. .. .. .. B. Tertiary
Gulf Trading And Export Agency Bahrain Wholesale trade .. 2 000
C. Finance and insurance Assets Employees
.. .. .. .. ..
Source: Who Owns Whom database (https://solutions.dnb.com/wow), retrieved January 2008.
Table 88. Largest affiliates of foreign TNCs in the home economy, 2007
(Millions of dollars and number)
Company Home economy Industry Sales Employees
A. Industrial Société Centrafricaine Des Gaz Industriels S A France Chemicals and chemical products .. 27 B. Tertiary
CFAO Centrafrique France Wholesale trade 19.6 85 C. Finance and Insurance Assets Employees
.. .. .. .. ..
Source: Who Owns Whom database (https://solutions.dnb.com/wow), retrieved January 2008.
Central African Republic
163
C. Legal frameworks for transnational corporations
The legal instruments adopted in the Central African Republic to regulate the activities of foreign investors at national, bilateral and multilateral levels include:
I. National framework
Code of Tax Benefits. Decree 67-72 of 30 December 1967. Source: Official Journal of the Central African Republic of 15 February 1968.
Decree on Company Tax No. 74-0013 of 24 January 1974. Source: Official Journal of the Central African Republic of 15 March 1974.
Ordinance No. 85-002 on Copyright. Source: WIPO (http://www.wipo.org).
Investment Code - No. 88-004 of 9 May 1988 concerning the Central African Republic Investment Code - Repeals Law No. 62-355 of 19 February 1963. Source: Official Journal of the Central African Republic of 9 May 1988.
Decree No. 88-165 of 9 May 1988 on the Legislation of Enterprises in the Central African Republic. Source: Fiduciare France Afrique, 1994 edition. Also official copy received from PEE-French Embassy in Bangui.
Decree No. 89-103 on the implementation modalities of Law No. 88- 004 of 9 May 1988. Source: Fiduciare France Afrique, 1994 edition. Also official copy received from PEE-French Embassy in Bangui.
Investment Guide Source: "News", published by the Embassy of the Central African Republic, Washington, D.C., May 1989.
Finance Law 1990 providing for a tax reduction in respect of investments. Source: Fisealite Africaine, FIDAFRICA, 1990.
II. International Framework
A. Central African Republic is a party to the following multilateral and regional instruments:
Convention on the Recognition and Enforcement of Foreign Arbitral Awards of 1958, which entered into force on 7th June 1959.
Customs and Economic Union of Central Africa (UDEAC) refers to the following instruments: Common Convention on Investments in the UDEAC (1965). Joint Convention on the Freedom of Movement of Persons and the Right of Establishment in the UDEAC (1972).
Multinational Companies Code in the UDEAC (1975).
Convention on the Settlement of Investment Disputes between States and Nationals of other States of 1965. Entered into force on 14 October 1966.
Patents: Bangui Agreement, March 1977 (Annex I), as last amended in February 1999. Source: WIPO (http://www.wipo.org).
World Investment Directory Volume X Africa 2008
164
Trade Marks: Bangui Agreement, March 1977 (Annex III), as last amended in February 1999. Source: WIPO (http://www.wipo.org).
Industrial Designs: Bangui Agreement, March 1977 (Annexes II and IV), as last amended in February 1999. Source: WIPO (http://www.wipo.org).
Convention Establishing the Multilateral Investment Guarantee Agency of 1985, entered into force on 12 April 1988.
Fourth ACP - EEC Convention (Lome IV) of 1989, entered into force on 1st March 1990.
Paris Convention for the Protection of Industrial Property of 1883 (Revised at Brussels in 1900, Washington in 1911, The Hague in 1925, London in 1934, Lisbon in 1958 and Stockholm in 1967, and as amended in 1979). Signed in 1994.
Marrakesh Agreement Establishing the World Trade Organisation of 15 April 1994. Entered into force on 1 January 1995. Agreement on Trade-Related Investment Measures. General Agreement on Trade in Services. Agreement on Trade Related Aspects of Intellectual Property Rights.
Partnership Agreement between the Members of The African, Caribbean and Pacific Group of States, of the one part and the European Community and its member states, of the other part signed in Cotonou, Benin on 23 June 2000.
B. Bilateral treaties
1. Bilateral investment treaties for the protection and promotion of investments: Germany 1965, Switzerland 1973, Egypt 2000, Morocco 2006.
2. Bilateral treaties for the avoidance of double taxation: France 1969.
Central African Republic
165
D. Sources of information
Official
Bank of Central African States (www.beac.int).
Secondary
Economist Intelligence Unit (EIU) (various years). Country Profile: Central African Republic (London: EIU Ltd.).
_____________ (various years). Country Report: Central African Republic (London: EIU Ltd.).
International Monetary Fund (IMF) (1996). Aftermath of the CFA Franc Devaluation (Washington D.C.: IMF).
_____________(2006). IMF's Sub-Saharan Africa Regional Economic Outlook, March 10, 2006. (Washington D.C.: IMF).
Morisset, J. (2001). "Foreign direct investment in Africa: policies also matter", OECD Global Forum on International Investment (Paris: OECD).
Mobbs, P. M. (1999). "The mineral industry of the Central African Republic" (minerals.usgs.gov/minerals).
OECD (2002). FDI from developing countries: A vector for trade and development (Paris: OECD).
Ogunleye, Eric Kehinde (2008) "Exchange rate volatility and foreign direct investment inflows in selected Sub-Saharan African Countries" (PhD Thesis, University of Ibadan).
Soderbom, M. and F. Teal (2004). "Size and Efficiency in Africa Manufacturing firms: Evidence from Firm-Level Panel Data." Journal of Development Economics, 73. pp 369 - 394.
United Nations Conference on Trade and Development (UNCTAD) (2002). FDI in Least Developed
Countries at a Glance (Geneva: UNCTAD) (www.unctad.org/en/subsites/dite/LDCs/ pdfs/Countries/chad.pdf).
_____________ (2003). FDI in Landlocked Developing Countries at a Glance 2002 (Geneva: UNCTAD/ITE/IIA/2003/5).
_______________(2005a). Investor-Disputes Arising from Investment Treaties: A Review. UNCTAD Series of International Investment Policies for Development (UNCTAD/ITE/IIT/2005/4).
_______________(2005b). A Survey of Support by Investment Promotion Agencies to Linkages, Advisory Studies No. 18 (UNCTAD/ITE/IPC/2005/12).
_______________(2005c). FDI in least developed countries at a glance: 2005/2006
(UNCTAD/ITE/IIA/2005/17).
United States Department of State, Bureau of African Affairs (1995). "Investment climate report: sub-Saharan Africa" (Washington D.C.: United States Department of State).
World Investment Directory Volume X Africa 2008
166
United States Trade Representative (2006). 2006 Comprehensive Report on U.S. Trade and Investment
Policy Toward Sub-Saharan Africa and Implementation of the Africa Growth and Opportunity Act:
The Sixth of Eight Annual Reports, May 2006. (Washington D.C.: US Government).
World Bank (2002a). Global Economic Prospects and the Developing Countries 2003: Investing to Unlock
Opportunities (Washington D.C.: World Bank).
_____________(2002b). Global Development Finance: financing the poorest countries Washington D.C.: World Bank).
World Bank/International Finance Corporation (2007). Doing Business 2008 Central African Republic
(Washington D.C.: The World Bank Group).
Chad
167
Chad
A. Definitions and sources of data
The Investment Code of the Republic of Chad (Ordonance No. 25/PR/87) governs all investment in the country. This code provides no specific definition of foreign direct investment (FDI). The main agency in charge of promoting foreign investment in the country is Office de Promotion Industrielle du Tchad (OPIT). Data on the annual FDI are collected from the Banque Centrale des Etats d'Afrique Centrale (BEAC) or the Central Bank of Central Africa States. The International Monetary Fund also provided FDI data on the country in its balance-of-payments statistics, until 1994.
Chad welcomes foreign investment, places no limits on foreign ownership, and provides equal treatment to domestic and foreign investors. All investments must be reviewed and approved by the Government. Residents and non-residents may hold foreign exchange accounts with government approval. Capital transactions, payments and transfers to some countries are permitted freely while those to other countries are subject to exchange-control approval and quantitative limits. The government's investment policy does not discriminate against foreign investment.
Chad is known to have large commercially viable petroleum reserves in the Doba basin of lake Chad. Recent completion of the oil pipeline from Chad to the ports in Cameroon had significantly reduced constraint to exploring these oil reserves and lead to significant increase of FDI in the industry. Planned exploitation of the Doba oilfields is expected to further increase its economic contribution to the secondary and tertiary sectors.
Chad signed to the Convention on the Settlement of Investment Disputes between State and Nationals of other States on May 12, 1966, is active in many regional integration schemes and eligible for participation in market access and trade initiatives. It is a member of the Communaute Economique et Monetaire de l'Afrique Centrale (CEMAC, named Union Douaniere et Economique de l'Afrique Centrale, until 1994). CEMAC's main aim is to extend the economic integration of six Central African countries-Cameroon, Central African Republic, Chad, Congo (Brazzaville), Gabon and Equatorial Guinea which are already tied to a common currency, the CFA franc, and a monetary policy under the aegis of the BEAC. Chad is a member of African Union, New Partnership for Africa's Development, World Trade Organization and eligible for the United States' market access initiative for Africa countries - the African Growth and Opportunity Act, the Cotonou Agreement for renegotiating the partnership trade treaty between the African, Caribbean and Pacific countries with the European Union (EU) and the EU's Everything But Arms initiative.
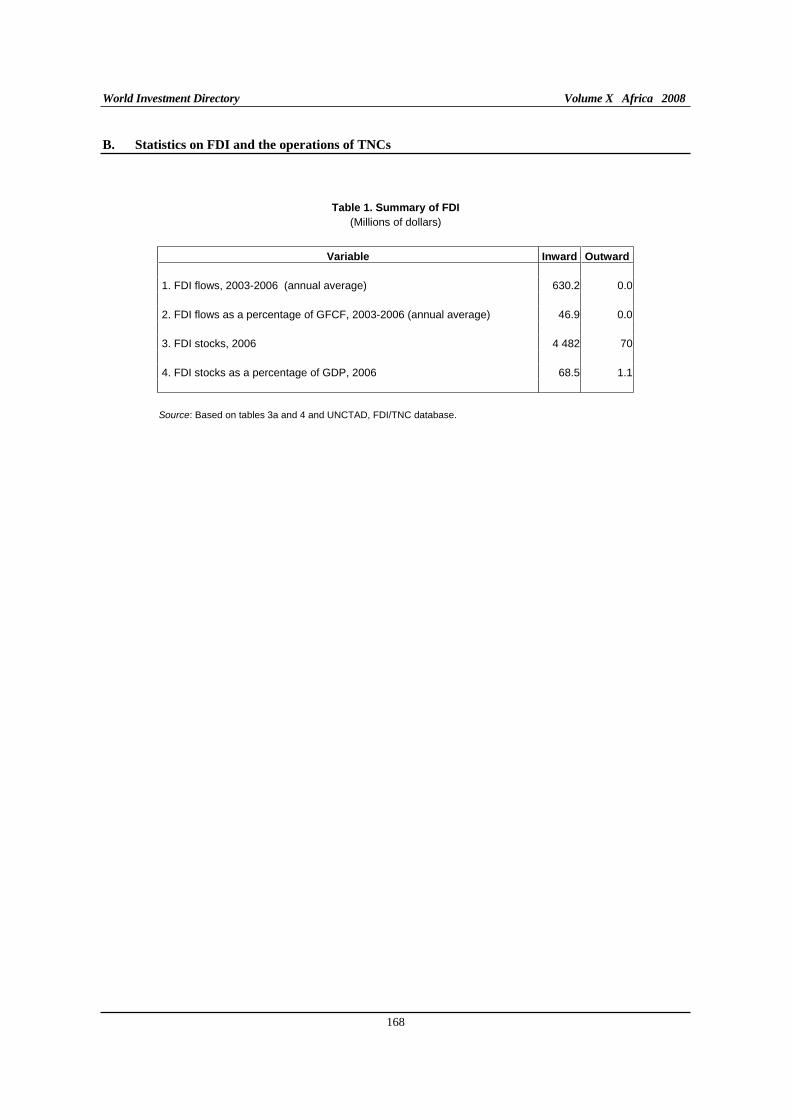
World Investment Directory Volume X Africa 2008
168
B. Statistics on FDI and the operations of TNCs
Table 1. Summary of FDI
(Millions of dollars)
Variable Inward Outward
1. FDI flows, 2003-2006 (annual average) 630.2 0.0
2. FDI flows as a percentage of GFCF, 2003-2006 (annual average) 46.9 0.0
3. FDI stocks, 2006 4 482 70
4. FDI stocks as a percentage of GDP, 2006 68.5 1.1
Source: Based on tables 3a and 4 and UNCTAD, FDI/TNC database.
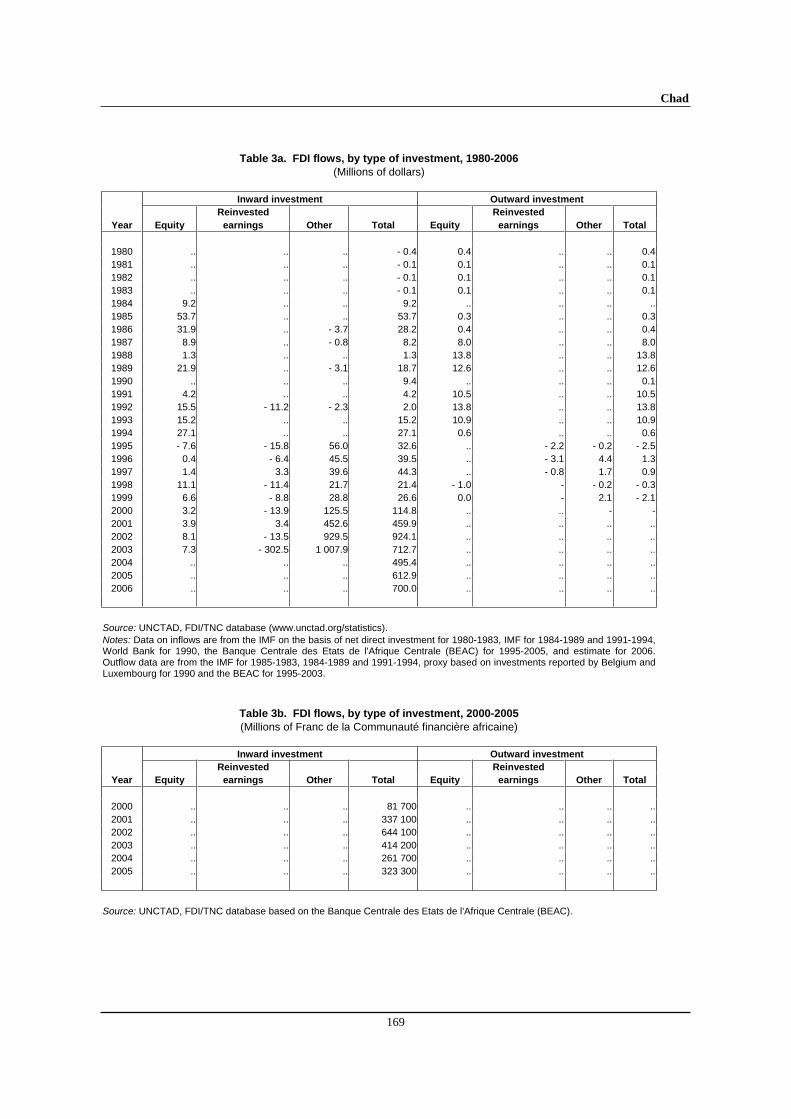
Chad
169
Table 3a. FDI flows, by type of investment, 1980-2006
(Millions of dollars)
Inward investment Outward investment
Reinvested Reinvested
Year Equity earnings Other Total Equity earnings Other Total
1980 .. .. .. - 0.4 0.4 .. .. 0.41981 .. .. .. - 0.1 0.1 .. .. 0.11982 .. .. .. - 0.1 0.1 .. .. 0.11983 .. .. .. - 0.1 0.1 .. .. 0.11984 9.2 .. .. 9.2 .. .. .. ..1985 53.7 .. .. 53.7 0.3 .. .. 0.31986 31.9 .. - 3.7 28.2 0.4 .. .. 0.41987 8.9 .. - 0.8 8.2 8.0 .. .. 8.01988 1.3 .. .. 1.3 13.8 .. .. 13.81989 21.9 .. - 3.1 18.7 12.6 .. .. 12.61990 .. .. .. 9.4 .. .. .. 0.11991 4.2 .. .. 4.2 10.5 .. .. 10.51992 15.5 - 11.2 - 2.3 2.0 13.8 .. .. 13.81993 15.2 .. .. 15.2 10.9 .. .. 10.91994 27.1 .. .. 27.1 0.6 .. .. 0.61995 - 7.6 - 15.8 56.0 32.6 .. - 2.2 - 0.2 - 2.51996 0.4 - 6.4 45.5 39.5 .. - 3.1 4.4 1.31997 1.4 3.3 39.6 44.3 .. - 0.8 1.7 0.91998 11.1 - 11.4 21.7 21.4 - 1.0 - - 0.2 - 0.31999 6.6 - 8.8 28.8 26.6 0.0 - 2.1 - 2.12000 3.2 - 13.9 125.5 114.8 .. .. - -2001 3.9 3.4 452.6 459.9 .. .. .. ..2002 8.1 - 13.5 929.5 924.1 .. .. .. ..2003 7.3 - 302.5 1 007.9 712.7 .. .. .. ..2004 .. .. .. 495.4 .. .. .. ..2005 .. .. .. 612.9 .. .. .. ..2006 .. .. .. 700.0 .. .. .. ..
Source: UNCTAD, FDI/TNC database (www.unctad.org/statistics). Notes: Data on inflows are from the IMF on the basis of net direct investment for 1980-1983, IMF for 1984-1989 and 1991-1994, World Bank for 1990, the Banque Centrale des Etats de l'Afrique Centrale (BEAC) for 1995-2005, and estimate for 2006. Outflow data are from the IMF for 1985-1983, 1984-1989 and 1991-1994, proxy based on investments reported by Belgium and Luxembourg for 1990 and the BEAC for 1995-2003.
Table 3b. FDI flows, by type of investment, 2000-2005
(Millions of Franc de la Communauté financière africaine)
Inward investment Outward investment
Reinvested Reinvested
Year Equity earnings Other Total Equity earnings Other Total
2000 .. .. .. 81 700 .. .. .. ..2001 .. .. .. 337 100 .. .. .. ..2002 .. .. .. 644 100 .. .. .. ..2003 .. .. .. 414 200 .. .. .. ..2004 .. .. .. 261 700 .. .. .. ..2005 .. .. .. 323 300 .. .. .. ..
Source: UNCTAD, FDI/TNC database based on the Banque Centrale des Etats de l'Afrique Centrale (BEAC).
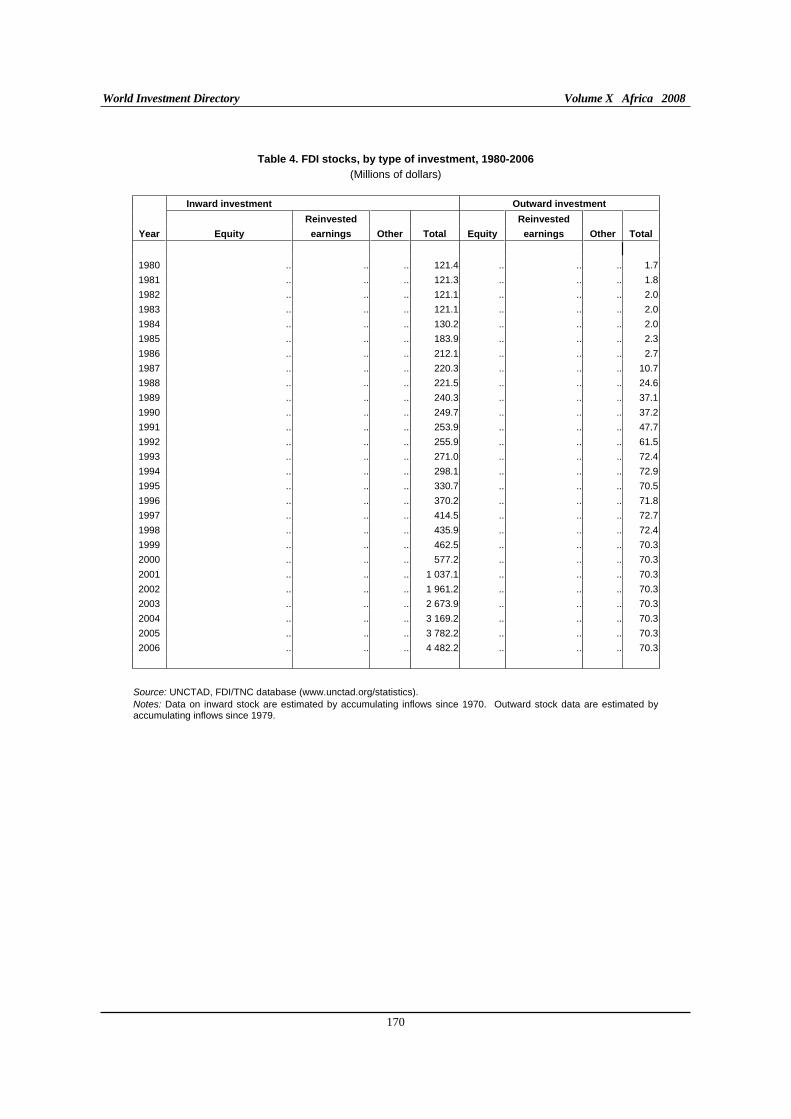
World Investment Directory Volume X Africa 2008
170
Table 4. FDI stocks, by type of investment, 1980-2006
(Millions of dollars)
Inward investment Outward investment
Reinvested Reinvested
Year Equity earnings Other Total Equity earnings Other Total
1980 .. .. .. 121.4 .. .. .. 1.7
1981 .. .. .. 121.3 .. .. .. 1.8
1982 .. .. .. 121.1 .. .. .. 2.0
1983 .. .. .. 121.1 .. .. .. 2.0
1984 .. .. .. 130.2 .. .. .. 2.0
1985 .. .. .. 183.9 .. .. .. 2.3
1986 .. .. .. 212.1 .. .. .. 2.7
1987 .. .. .. 220.3 .. .. .. 10.7
1988 .. .. .. 221.5 .. .. .. 24.6
1989 .. .. .. 240.3 .. .. .. 37.1
1990 .. .. .. 249.7 .. .. .. 37.2
1991 .. .. .. 253.9 .. .. .. 47.7
1992 .. .. .. 255.9 .. .. .. 61.5
1993 .. .. .. 271.0 .. .. .. 72.4
1994 .. .. .. 298.1 .. .. .. 72.9
1995 .. .. .. 330.7 .. .. .. 70.5
1996 .. .. .. 370.2 .. .. .. 71.8
1997 .. .. .. 414.5 .. .. .. 72.7
1998 .. .. .. 435.9 .. .. .. 72.4
1999 .. .. .. 462.5 .. .. .. 70.3
2000 .. .. .. 577.2 .. .. .. 70.3
2001 .. .. .. 1 037.1 .. .. .. 70.3
2002 .. .. .. 1 961.2 .. .. .. 70.3
2003 .. .. .. 2 673.9 .. .. .. 70.3
2004 .. .. .. 3 169.2 .. .. .. 70.3
2005 .. .. .. 3 782.2 .. .. .. 70.3
2006 .. .. .. 4 482.2 .. .. .. 70.3
Source: UNCTAD, FDI/TNC database (www.unctad.org/statistics). Notes: Data on inward stock are estimated by accumulating inflows since 1970. Outward stock data are estimated by accumulating inflows since 1979.
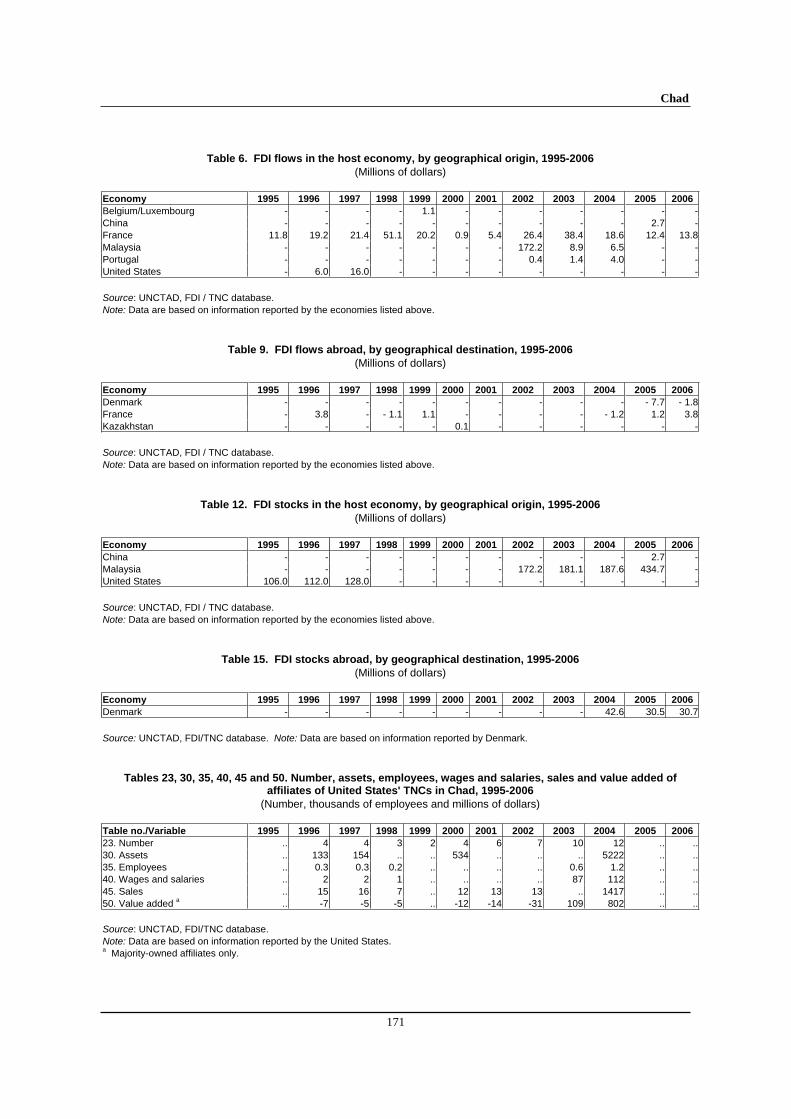
Chad
171
Table 6. FDI flows in the host economy, by geographical origin, 1995-2006
(Millions of dollars) Economy 1995 1996 1997 1998 1999 2000 2001 2002 2003 2004 2005 2006
Belgium/Luxembourg - - - - 1.1 - - - - - - -China - - - - - - - - - - 2.7 -France 11.8 19.2 21.4 51.1 20.2 0.9 5.4 26.4 38.4 18.6 12.4 13.8Malaysia - - - - - - - 172.2 8.9 6.5 - -Portugal - - - - - - - 0.4 1.4 4.0 - -United States - 6.0 16.0 - - - - - - - - -
Source: UNCTAD, FDI / TNC database. Note: Data are based on information reported by the economies listed above.
Table 9. FDI flows abroad, by geographical destination, 1995-2006
(Millions of dollars) Economy 1995 1996 1997 1998 1999 2000 2001 2002 2003 2004 2005 2006
Denmark - - - - - - - - - - - 7.7 - 1.8France - 3.8 - - 1.1 1.1 - - - - - 1.2 1.2 3.8Kazakhstan - - - - - 0.1 - - - - - -
Source: UNCTAD, FDI / TNC database. Note: Data are based on information reported by the economies listed above.
Table 12. FDI stocks in the host economy, by geographical origin, 1995-2006
(Millions of dollars) Economy 1995 1996 1997 1998 1999 2000 2001 2002 2003 2004 2005 2006
China - - - - - - - - - - 2.7 -Malaysia - - - - - - - 172.2 181.1 187.6 434.7 -United States 106.0 112.0 128.0 - - - - - - - - -
Source: UNCTAD, FDI / TNC database. Note: Data are based on information reported by the economies listed above.
Table 15. FDI stocks abroad, by geographical destination, 1995-2006
(Millions of dollars) Economy 1995 1996 1997 1998 1999 2000 2001 2002 2003 2004 2005 2006
Denmark - - - - - - - - - 42.6 30.5 30.7
Source: UNCTAD, FDI/TNC database. Note: Data are based on information reported by Denmark.
Tables 23, 30, 35, 40, 45 and 50. Number, assets, employees, wages and salaries, sales and value added of affiliates of United States' TNCs in Chad, 1995-2006
(Number, thousands of employees and millions of dollars) Table no./Variable 1995 1996 1997 1998 1999 2000 2001 2002 2003 2004 2005 2006
23. Number .. 4 4 3 2 4 6 7 10 12 .. ..30. Assets .. 133 154 .. .. 534 .. .. .. 5222 .. ..35. Employees .. 0.3 0.3 0.2 .. .. .. .. 0.6 1.2 .. ..40. Wages and salaries .. 2 2 1 .. .. .. .. 87 112 .. ..45. Sales .. 15 16 7 .. 12 13 13 .. 1417 .. ..50. Value added a .. -7 -5 -5 .. -12 -14 -31 109 802 .. .. Source: UNCTAD, FDI/TNC database. Note: Data are based on information reported by the United States. a Majority-owned affiliates only.
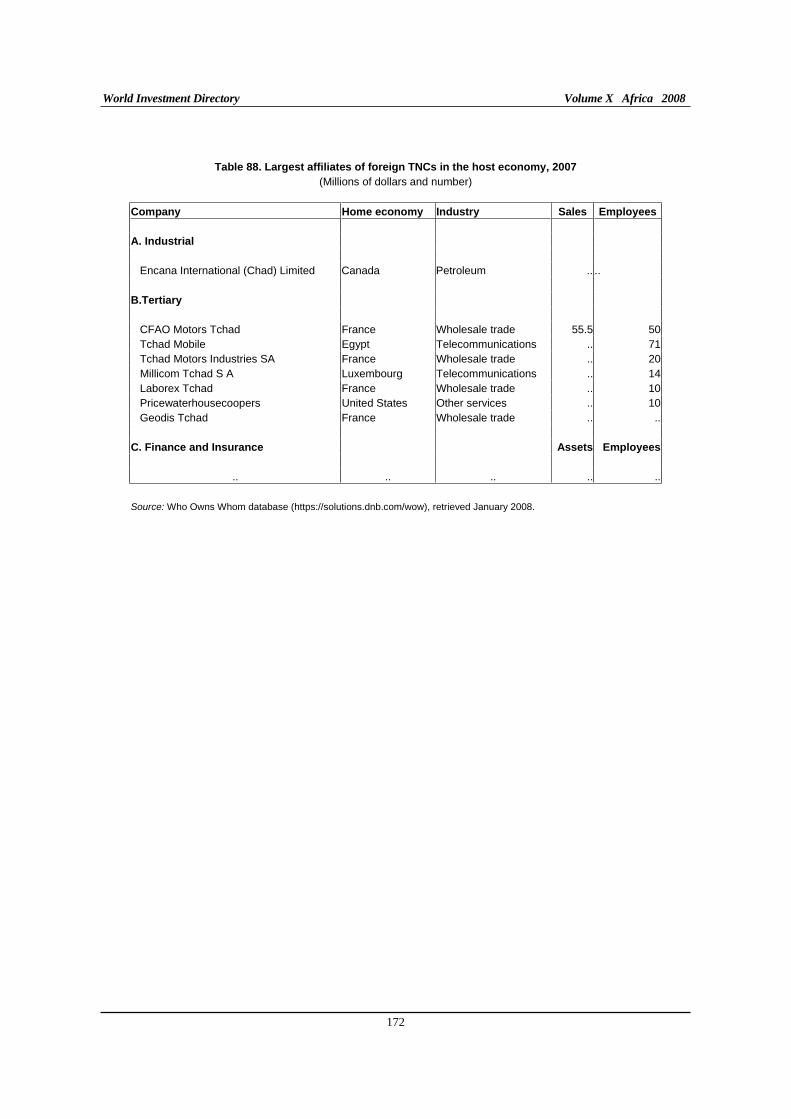
World Investment Directory Volume X Africa 2008
172
Table 88. Largest affiliates of foreign TNCs in the host economy, 2007
(Millions of dollars and number)
Company Home economy Industry Sales Employees
A. Industrial
Encana International (Chad) Limited Canada Petroleum .. .. B.Tertiary
CFAO Motors Tchad France Wholesale trade 55.5 50 Tchad Mobile Egypt Telecommunications .. 71 Tchad Motors Industries SA France Wholesale trade .. 20 Millicom Tchad S A Luxembourg Telecommunications .. 14 Laborex Tchad France Wholesale trade .. 10 Pricewaterhousecoopers United States Other services .. 10 Geodis Tchad France Wholesale trade .. .. C. Finance and Insurance Assets Employees
.. .. .. .. ..
Source: Who Owns Whom database (https://solutions.dnb.com/wow), retrieved January 2008.
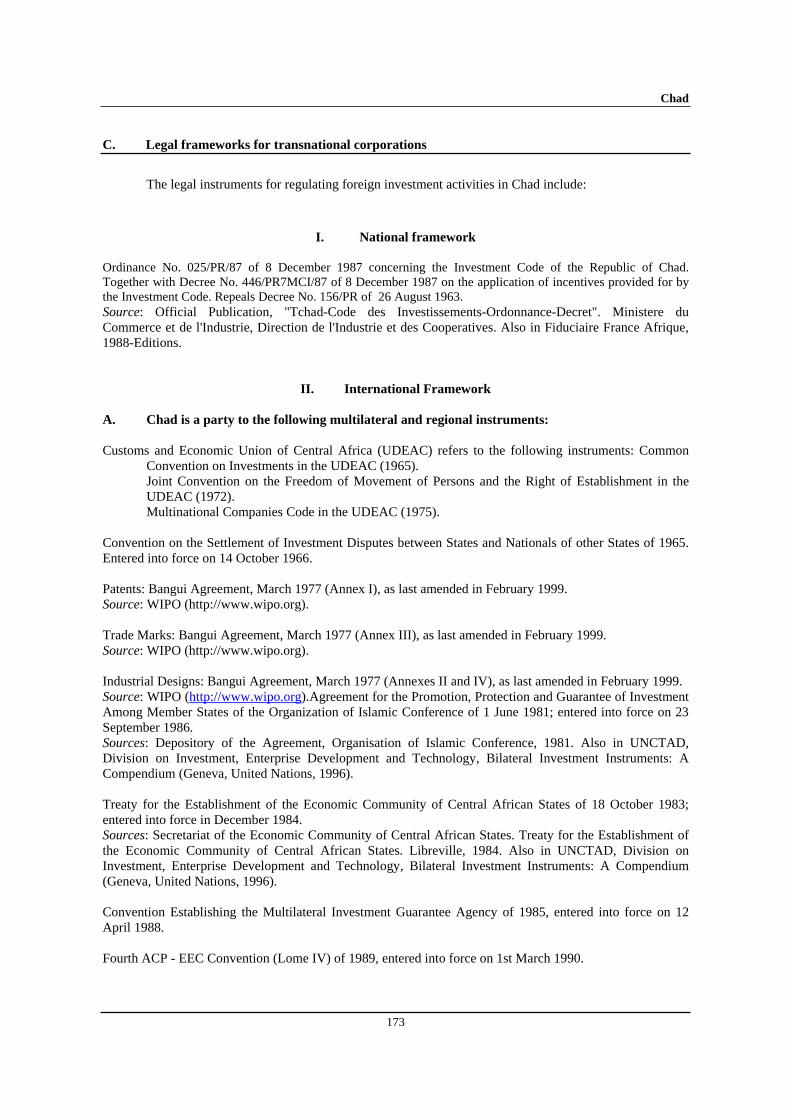
Chad
173
C. Legal frameworks for transnational corporations
The legal instruments for regulating foreign investment activities in Chad include:
I. National framework
Ordinance No. 025/PR/87 of 8 December 1987 concerning the Investment Code of the Republic of Chad. Together with Decree No. 446/PR7MCI/87 of 8 December 1987 on the application of incentives provided for by the Investment Code. Repeals Decree No. 156/PR of 26 August 1963. Source: Official Publication, "Tchad-Code des Investissements-Ordonnance-Decret". Ministere du Commerce et de l'Industrie, Direction de l'Industrie et des Cooperatives. Also in Fiduciaire France Afrique, 1988-Editions.
II. International Framework
A. Chad is a party to the following multilateral and regional instruments:
Customs and Economic Union of Central Africa (UDEAC) refers to the following instruments: Common Convention on Investments in the UDEAC (1965). Joint Convention on the Freedom of Movement of Persons and the Right of Establishment in the UDEAC (1972).
Multinational Companies Code in the UDEAC (1975).
Convention on the Settlement of Investment Disputes between States and Nationals of other States of 1965. Entered into force on 14 October 1966.
Patents: Bangui Agreement, March 1977 (Annex I), as last amended in February 1999. Source: WIPO (http://www.wipo.org).
Trade Marks: Bangui Agreement, March 1977 (Annex III), as last amended in February 1999. Source: WIPO (http://www.wipo.org).
Industrial Designs: Bangui Agreement, March 1977 (Annexes II and IV), as last amended in February 1999. Source: WIPO (http://www.wipo.org).Agreement for the Promotion, Protection and Guarantee of Investment Among Member States of the Organization of Islamic Conference of 1 June 1981; entered into force on 23 September 1986. Sources: Depository of the Agreement, Organisation of Islamic Conference, 1981. Also in UNCTAD, Division on Investment, Enterprise Development and Technology, Bilateral Investment Instruments: A Compendium (Geneva, United Nations, 1996).
Treaty for the Establishment of the Economic Community of Central African States of 18 October 1983; entered into force in December 1984. Sources: Secretariat of the Economic Community of Central African States. Treaty for the Establishment of the Economic Community of Central African States. Libreville, 1984. Also in UNCTAD, Division on Investment, Enterprise Development and Technology, Bilateral Investment Instruments: A Compendium (Geneva, United Nations, 1996).
Convention Establishing the Multilateral Investment Guarantee Agency of 1985, entered into force on 12 April 1988.
Fourth ACP - EEC Convention (Lome IV) of 1989, entered into force on 1st March 1990.
World Investment Directory Volume X Africa 2008
174
Articles of Agreement of the Islamic Corporation for the Insurance of Investment and Export Credit of 19 February 1992. Entered into force on l August 1994. Sources: Islamic Development Bank, "Articles of Agreement of the Islamic Corporation for the Insurance of Investment and Export Credit", (LD133/A:CI/RI/MH,C:2212/RI) (Jeddah, Islamic Development Bank, 1992). Also in UNCTAD, Division on Investment, Enterprise Development and Technology, Bilateral Investment Instruments: A Compendium (Geneva, United Nations, 1996).
Paris Convention for the Protection of Industrial Property of 1883 (Revised at Brussels in 1900, Washington in 1911, The Hague in 1925, London in 1934, Lisbon in 1958 and Stockholm in 1967, and as amended in 1979). Signed in 1994.
Marrakesh Agreement Establishing the World Trade Organisation of 15 April 1994. Entered into force on 1 January 1995. Agreement on Trade-Related Investment Measures. General Agreement on Trade in Services. Agreement on Trade Related Aspects of Intellectual Property Rights.
Partnership Agreement between the Members of The African, Caribbean and Pacific Group of States, of the one part and the European Community and its member states, of the other part signed in Cotonou, Benin on 23 June 2000.
B. Bilateral treaties
1. Bilateral investment treaties for the protection and promotion of investments: France 1960, Germany 1967, Switzerland 1967, Italy 1969, Morocco 1997, Egypt 1998, Qatar 1999, Benin 2001, Burkina Faso 2001, Mali 2001, Mauritius 2001, Guinea 2004, Lebanon 2004, .
2. Bilateral treaties for the avoidance of double taxation: Qatar 1999.
Chad
175
D. Sources of information
Official
Banque des Etats l'Afrique Centrale (www.beac.int). Office de Promotion Industrielle du Tchad (OPIT) (droit.francophonie.org).
Secondary
Economist Intelligence Unit (EIU) (various years). Country Profile: Chad (London: EIU Ltd.).
______________ (various years). Country Report: Chad (London: EIU Ltd.).
International Monetary Fund (IMF) (2000). "Chad: preliminary document on the enhanced initiative for
heavily indebted poor countries" (Washington D.C.: IMF). ______________(2006). IMF's Sub-Saharan Africa Regional Economic Outlook, March 10, 2006.
(Washington D.C.: IMF).
Morisset, J. (2001). "Foreign direct investment in Africa: policies also matter", OECD Global Forum on International Investment (Paris: OECD).
Ruffer, Tim, S. Jones and S. Akroyd (2002). "Development box proposals and their potential effect on developing countries." Mimeo (London: U.K. Department for International Development).
Soderbom, M. and F. Teal (2004). "Size and Efficiency in Africa Manufacturing firms: Evidence from Firm-Level Panel Data." Journal of Development Economics, 73. pp 369 - 394.
Thierry, Lemoine (1998). Tchad 1960-1990, Trente Annees d'Independance (Paris: Editions Lettres du Monde).
United Nations Conference on Trade and Development (UNCTAD) (2002). FDI in Least Developed
Countries at a Glance (Geneva: UNCTAD) (www.unctad.org/en/subsites/dite/LDCs/ pdfs/Countries/chad.pdf).
_____________(2005a). Investor-Disputes Arising from Investment Treaties: A Review. UNCTAD Series of International Investment Policies for Development (UNCTAD/ITE/IIT/2005/4).
_____________(2005b). A Survey of Support by Investment Promotion Agencies to Linkages, Advisory Studies No. 18 (UNCTAD/ITE/IPC/2005/12).
_____________(2005c). FDI in least developed countries at a glance: 2005/2006
(UNCTAD/ITE/IIA/2005/17).
United States Commercial Service (2002). "Chad: country commercial guide", chpt. 7 (Washington D.C.: United States Department of Trade) (www.usatrade.gov).
United States Department of State, Bureau of African Affairs (1995). "Investment climate report: sub-Saharan Africa" (Washington D.C.: United States Department of State).
United States Trade Representative (2006). 2006 Comprehensive Report on U.S. Trade and Investment
Policy Toward Sub-Saharan Africa and Implementation of the Africa Growth and Opportunity Act: The Sixth of Eight Annual Reports, May 2006. (Washington D.C.: US Government).

World Investment Directory Volume X Africa 2008
176
World Bank (2002). Global Economic Prospects and the Developing Countries 2003: Investing to Unlock
Opportunities (Washington D.C.: World Bank).
World Bank/International Finance Corporation (2007). Doing Business 2008 Chad (Washington D.C.: The World Bank Group).
Comoros
177
Comoros
A. Definitions and sources of data
The Investment Code of Comoros (Ordinance No. 92 on Investment of November 1992) does not provide an explicit definition of foreign direct investment (FDI). Data on FDI in Comoros are not available except those provided by the International Monetary Fund in its balance-of-payment statistics.
The Government of Comoros welcomes FDI. Lush and with regular rainfall, Comoros possesses vast rich agricultural land. As a result, agriculture is at the heart of the Comorian economy but economic growth and development have been tightly constrained by geographical isolation, the small size of the domestic market and an absence of minerals and other high-value raw materials. Its coastal waters are rich in marine wildlife, notably the coelacanth fish, fishing and marine trade, which can contribute to other small coastal economies but have been neglected.
Infrastructure is still in a poor stage of development, particularly the telecommunication facilities. The Government of Comoros is, however, adopting private sector-oriented policies to reverse the conditions of the sector. A mobile telephony service is now being provided by a company formed by a consortium of the Libyan Arab Jamahiriya Foreign Investment Company and French firms - Alcatel and SNPT. Also, the Global System for Mobile Communications network is due to come into operation in Grande Comore and Moheli.
Comoros signed to the Convention on the Settlement of Investment Disputes between State and Nationals of other States on September 26, 1978 and is a member of the Common Market for Eastern and Southern Africa, the East African Community, New Partnership for Africa's Development, the African Union, the Cotonou Agreement for renegotiating the Lomè Convention between European Union (EU) and the African, Caribbean and Pacific countries, the EU market access initiative - the Everything But Arms initiative, the Southern African Development Community and the Indian Ocean Rim Association for Regional Co-operation. Comoros also qualifies for the preferential market access schemes such as the generalized system of preferences for the least developed countries. Comoros has an observer status at the World Trade Organization.

World Investment Directory Volume X Africa 2008
178
B. Statistics on FDI and the operations of TNCs
Table 1. Summary of FDI
(Millions of dollars)
Variable Inward Outward
1. FDI flows, 2003-2006 (annual average) 0.8 -
2. FDI flows as a percentage of GFCF, 2003-2006 (annual average) 2.4 -
3. FDI stocks, 2006 26 1
4. FDI stocks as a percentage of GDP, 2006 6.3 0.3
Source: Based on tables 3a and 4 and UNCTAD, FDI/TNC database.
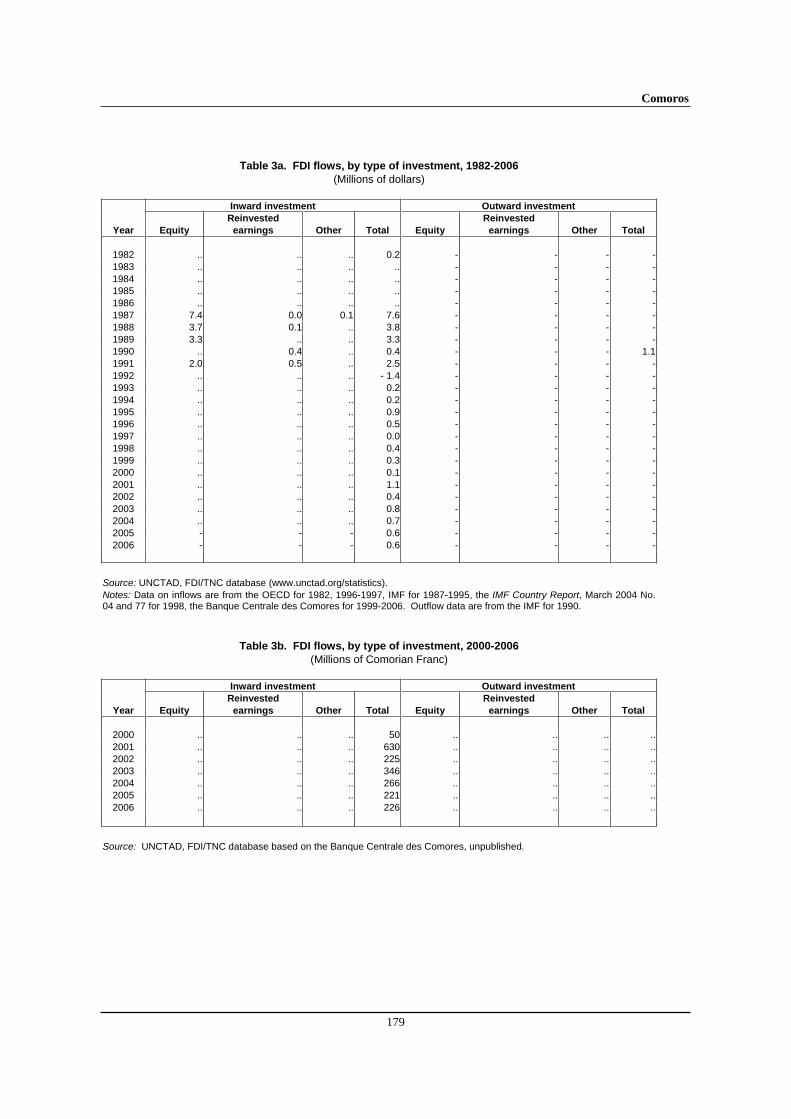
Comoros
179
Table 3a. FDI flows, by type of investment, 1982-2006
(Millions of dollars)
Inward investment Outward investment
Reinvested Reinvested
Year Equity earnings Other Total Equity earnings Other Total
1982 .. .. .. 0.2 - - - -1983 .. .. .. .. - - - -1984 .. .. .. .. - - - -1985 .. .. .. .. - - - -1986 .. .. .. .. - - - -1987 7.4 0.0 0.1 7.6 - - - -1988 3.7 0.1 .. 3.8 - - - -1989 3.3 .. .. 3.3 - - - -1990 .. 0.4 .. 0.4 - - - 1.11991 2.0 0.5 .. 2.5 - - - -1992 .. .. .. - 1.4 - - - -1993 .. .. .. 0.2 - - - -1994 .. .. .. 0.2 - - - -1995 .. .. .. 0.9 - - - -1996 .. .. .. 0.5 - - - -1997 .. .. .. 0.0 - - - -1998 .. .. .. 0.4 - - - -1999 .. .. .. 0.3 - - - -2000 .. .. .. 0.1 - - - -2001 .. .. .. 1.1 - - - -2002 .. .. .. 0.4 - - - -2003 .. .. .. 0.8 - - - -2004 .. .. .. 0.7 - - - -2005 - - - 0.6 - - - -2006 - - - 0.6 - - - -
Source: UNCTAD, FDI/TNC database (www.unctad.org/statistics). Notes: Data on inflows are from the OECD for 1982, 1996-1997, IMF for 1987-1995, the IMF Country Report, March 2004 No. 04 and 77 for 1998, the Banque Centrale des Comores for 1999-2006. Outflow data are from the IMF for 1990.
Table 3b. FDI flows, by type of investment, 2000-2006
(Millions of Comorian Franc)
Inward investment Outward investment
Reinvested Reinvested
Year Equity earnings Other Total Equity earnings Other Total
2000 .. .. .. 50 .. .. .. ..2001 .. .. .. 630 .. .. .. ..2002 .. .. .. 225 .. .. .. ..2003 .. .. .. 346 .. .. .. ..2004 .. .. .. 266 .. .. .. ..2005 .. .. .. 221 .. .. .. ..2006 .. .. .. 226 .. .. .. ..
Source: UNCTAD, FDI/TNC database based on the Banque Centrale des Comores, unpublished.
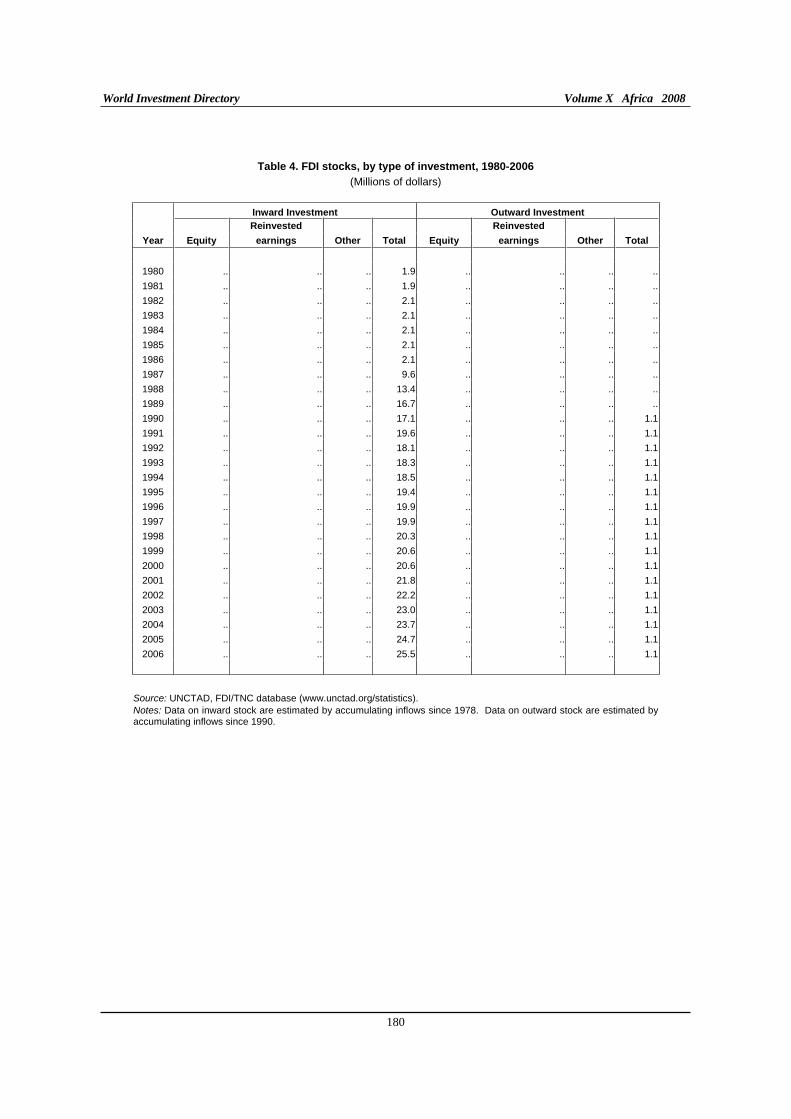
World Investment Directory Volume X Africa 2008
180
Table 4. FDI stocks, by type of investment, 1980-2006
(Millions of dollars)
Inward Investment Outward Investment
Reinvested Reinvested
Year Equity earnings Other Total Equity earnings Other Total
1980 .. .. .. 1.9 .. .. .. ..
1981 .. .. .. 1.9 .. .. .. ..
1982 .. .. .. 2.1 .. .. .. ..
1983 .. .. .. 2.1 .. .. .. ..
1984 .. .. .. 2.1 .. .. .. ..
1985 .. .. .. 2.1 .. .. .. ..
1986 .. .. .. 2.1 .. .. .. ..
1987 .. .. .. 9.6 .. .. .. ..
1988 .. .. .. 13.4 .. .. .. ..
1989 .. .. .. 16.7 .. .. .. ..
1990 .. .. .. 17.1 .. .. .. 1.1
1991 .. .. .. 19.6 .. .. .. 1.1
1992 .. .. .. 18.1 .. .. .. 1.1
1993 .. .. .. 18.3 .. .. .. 1.1
1994 .. .. .. 18.5 .. .. .. 1.1
1995 .. .. .. 19.4 .. .. .. 1.1
1996 .. .. .. 19.9 .. .. .. 1.1
1997 .. .. .. 19.9 .. .. .. 1.1
1998 .. .. .. 20.3 .. .. .. 1.1
1999 .. .. .. 20.6 .. .. .. 1.1
2000 .. .. .. 20.6 .. .. .. 1.1
2001 .. .. .. 21.8 .. .. .. 1.1
2002 .. .. .. 22.2 .. .. .. 1.1
2003 .. .. .. 23.0 .. .. .. 1.1
2004 .. .. .. 23.7 .. .. .. 1.1
2005 .. .. .. 24.7 .. .. .. 1.1
2006 .. .. .. 25.5 .. .. .. 1.1
Source: UNCTAD, FDI/TNC database (www.unctad.org/statistics). Notes: Data on inward stock are estimated by accumulating inflows since 1978. Data on outward stock are estimated by accumulating inflows since 1990.

Comoros
181
Table 6. FDI flows in the host economy, by geographical origin, 1995-2006
(Millions of dollars) Economy 1995 1996 1997 1998 1999 2000 2001 2002 2003 2004 2005 2006
Mauritius 2.8 1.0 1.2 - - - - - - - - - Source: UNCTAD, FDI/TNC database. Note: Data are based on information reported by Mauritius.
Table 12. FDI stocks in the host economy, by geographical origin, 1995-2006
(Millions of dollars) Economy 1995 1996 1997 1998 1999 2000 2001 2002 2003 2004 2005 2006
Brazil - - - - - - - - 1.1 - - -China - - - - - - - - - 0.01 0.01 - Source: UNCTAD, FDI/TNC database. Note: Data are based on information reported by the economies listed above.
Tables. 30 and 45. Assets and sales of affiliates of United States TNCs in Comoros, 1995-2006
(Millions of dollars) Table no./Variable 1995 1996 1997 1998 1999 2000 2001 2002 2003 2004 2005 2006
30. Assets .. .. .. .. .. .. .. .. .. 2 .. ..45. Sales .. .. .. .. .. .. .. .. .. 2 .. .. Source: UNCTAD, FDI/TNC database. Note: Data are based on information reported by the United States.
Table 88. Largest affiliates of foreign TNCs in the host economy, 2007
(Millions of dollars and number)
Company Home economy Industry Sales Employees
A. Industrial
.. .. .. .. ..
B. Tertiary
.. .. .. .. ..
C. Finance and insurance Assets Employees
Banque pour l'Industrie et le Commerce du
Comores France Finance .. 65
Source: Who Owns Whom database (https://solutions.dnb.com/wow), retrieved January 2008.
World Investment Directory Volume X Africa 2008
182
C. Legal frameworks for transnational corporations
The legal instruments for regulating the activities of the transnational corporations and foreign investors in Comoros include:
I. National framework
Ordinance No. 92 on Investment of November 1992. Repeals Investment Law of 1984. Source: Unofficial copy – Banque Internationale des Comores, Agence de Moroni, 1992.
II. International Framework
A. Comoros is a party to the following multilateral and regional instruments:
Convention on the Settlement of Investment Disputes between States and Nationals of other States of 1965. Entered into force on 14 October 1966.
Fourth ACP - EEC Convention (Lome IV) of 1989, entered into force on 1st March 1990.
Charter on a Regime of Multinational Industrial Enterprises (MIEs) in the Preferential Trade Area for Eastern and Southern African States (PTA), signed on 21 November 1990, entered into force August 1995. Source: Preferential Trade Area for Eastern ans Southern African States: Report of the Sixteenth Meeting of the Council of Ministers, 17-19 November, 1990, Mbabane, Swaziland (PTA/CM/XVI/2).
Articles of Agreement of the Islamic Corporation for the Insurance of Investment and Export Credit of 19 February 1992. Entered into force on 1 August 1994.
Market for Eastern and Southern Africa (COMESA), 1993.
Partnership Agreement between the Members of The African, Caribbean and Pacific Group of States, of the one part and the European Community and its member states, of the other part signed in Cotonou, Benin on 23 June 2000.
B. Bilateral treaties
1. Bilateral investment treaties for the protection and promotion of investments: Egypt 1994, Belgium / Luxembourg 2001, Burkina Faso 2001, Burundi 2001, Mali 2001, Mauritius 2001.
2. Bilateral treaties for the avoidance of double taxation: France 1970.
C. Other treaties:
Investment agreement for the COMESA Common Investment Area (2007).
Comoros
183
D. Sources of information
Official
Banque Centrale des Comores.
Secondary
Economist Intelligence Unit (EIU) (various years). Country Profile: Comoros (London: EIU Ltd.).
_____________ (various years). Country Report: Comoros (London: EIU Ltd.).
Foreign Investment Advisory Service (FIAS) (2000). "Providing advice on FDI in small island economies: the need for a differentiated approach?", FIAS/PREM seminars, 17 October 2000.
International Monetary Fund (IMF) (2006). IMF's Sub-Saharan Africa Regional Economic Outlook, March 10, 2006. (Washington D.C.: IMF).
Malyn Newitt (1984). The Comoro Islands: Struggle Against Dependency in the Indian Ocean, (Gower, Boulder, CO).
Morisset, J. (2001). "Foreign direct investment in Africa: policies also matter", OECD Global Forum on International Investment (Paris: OECD).
Soderbom, M. and F. Teal (2004). "Size and Efficiency in Africa Manufacturing firms: Evidence from Firm-Level Panel Data." Journal of Development Economics, 73. pp 369 - 394.
The Government of Comoros (2001). "Country presentation: Comoros", presented at the Third United Nations Conference on the Least Developed Countries (Paris: UNCTAD).
United Nations Conference on Trade and Development (UNCTAD) (2002). FDI in Least Developed
Countries at a Glance (Geneva: UNCTAD) (www.unctad.org/en/subsites/dite/LDCs/ pdfs/Countries/capeverde.pdf).
____________(2005a). Investor-Disputes Arising from Investment Treaties: A Review. UNCTAD Series of International Investment Policies for Development (UNCTAD/ITE/IIT/2005/4).
____________(2005b). A Survey of Support by Investment Promotion Agencies to Linkages. Advisory Studies No. 18 (UNCTAD/ITE/IPC/2005/12).
____________(2005c). FDI in least developed countries at a glance: 2005/2006
(UNCTAD/ITE/IIA/2005/17).
United States Trade Representative (2006). 2006 Comprehensive Report on U.S. Trade and Investment
Policy Toward Sub-Saharan Africa and Implementation of the Africa Growth and Opportunity Act:
The Sixth of Eight Annual Reports, May 2006. (Washington D.C.: US Government).
World Investment Directory Volume X Africa 2008
184
World Bank (1987). "The Comoros: the arduous path to economic growth: the need for adjustment", Report No. 6690-COM (Washington D.C.: World Bank), August.
World Bank/International Finance Corporation (2007). Doing Business 2008 Comoros (Washington D.C.: The World Bank Group).
Congo
185
Congo
A. Definitions and sources of data
The Investment Code of Congo, of March 1992, governs all foreign investments in the country. This code does not provide specific definition of foreign direct investment (FDI). Data on the annual inflows of FDI are collected by the Banque des Etats de l'Afrique Centrale (BEAC). The International Monetary Fund also provides data on FDI in the country in its balance-of-payment statistics. FDI stock data were estimated as an accumulation of flows.
FDI in Congo exists in the oil and forestry industries, but privatization has attracted some interests. The country is a substantial oil producer. Most of the oilfields are offshore and are gradually extending into deep waters. TotalFinaElf, a French company, has traditionally dominated the oil sector in Congo. Agip of Italy is the next most significant player. The United States-based companies Anadarko, CMS Nomeco, Chevron, Marathon and ExxonMobil, and the Anglo-Dutch company - Shell, are also involved in production or exploration in the oil sector in the country.
Congo also has some potential in the non-oil mineral sector. Production of diamond and gold has been restricted to artisanal mining. Rights are granted to corporation to market diamonds from areas to the border with the Central African Republic. Potash and Iron ore reserves are estimated to exist along the southern section of the Gabon frontier and access is possible through the spur of the Brazzaville-Pointe-Noire railway. A Canadian company, Magnesium Alloy Corporation has unveiled plans to develop magnesium deposits in Kouilou region, near Pointe-Noire.
Congo signed to the Convention on the Settlement of Investment Disputes between State and Nationals of other States on December 27, 1978 and is a member of regional integration schemes. The most prominent ones are the BEAC, Communauté économique et monétaire de l’Afrique centrale, the Union économique et monétaire ouest-africaine, New Partnership for Africa's Development and the African Union. Congo is also an eligible member of the Cotonou Agreement for renegotiating the Lomè Convention offering a group of African, Caribbean and Pacific countries preferential trade and aid links with the European Union. Congo is signatory to the convention that established the multilateral investment guarantee agency and World Trade Organization.
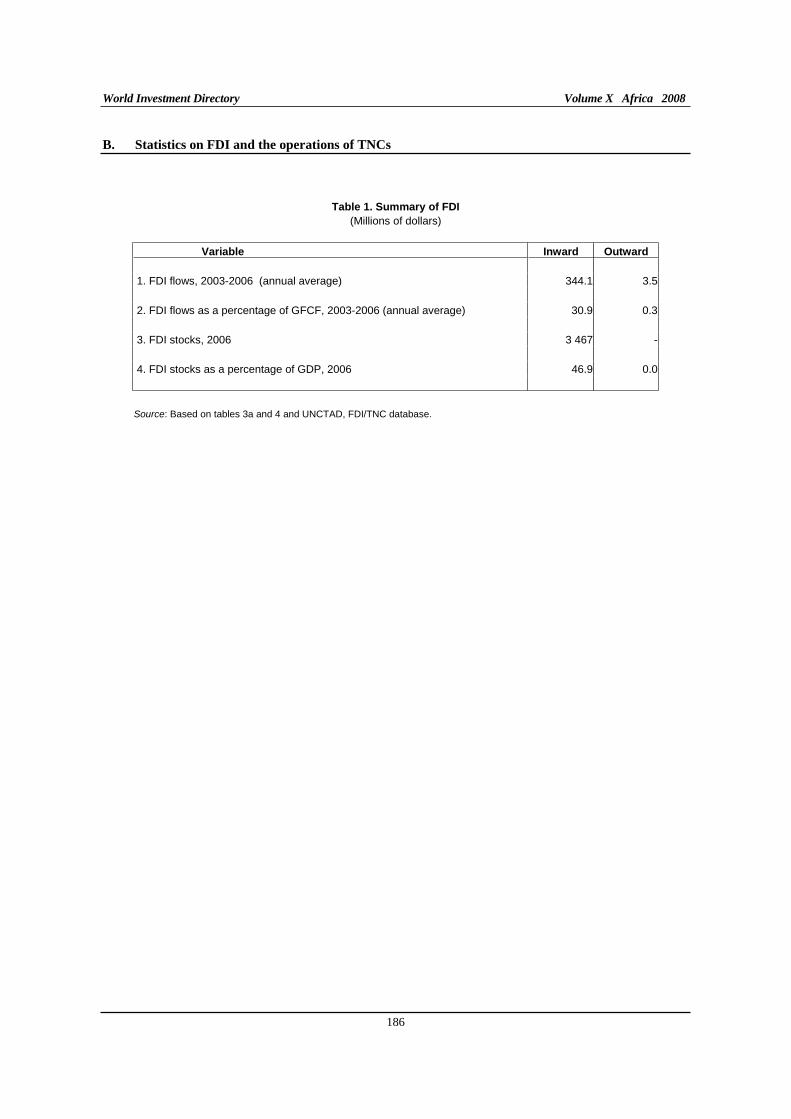
World Investment Directory Volume X Africa 2008
186
B. Statistics on FDI and the operations of TNCs
Table 1. Summary of FDI
(Millions of dollars)
Variable Inward Outward
1. FDI flows, 2003-2006 (annual average) 344.1 3.5 2. FDI flows as a percentage of GFCF, 2003-2006 (annual average) 30.9 0.3 3. FDI stocks, 2006 3 467 - 4. FDI stocks as a percentage of GDP, 2006 46.9 0.0 Source: Based on tables 3a and 4 and UNCTAD, FDI/TNC database.
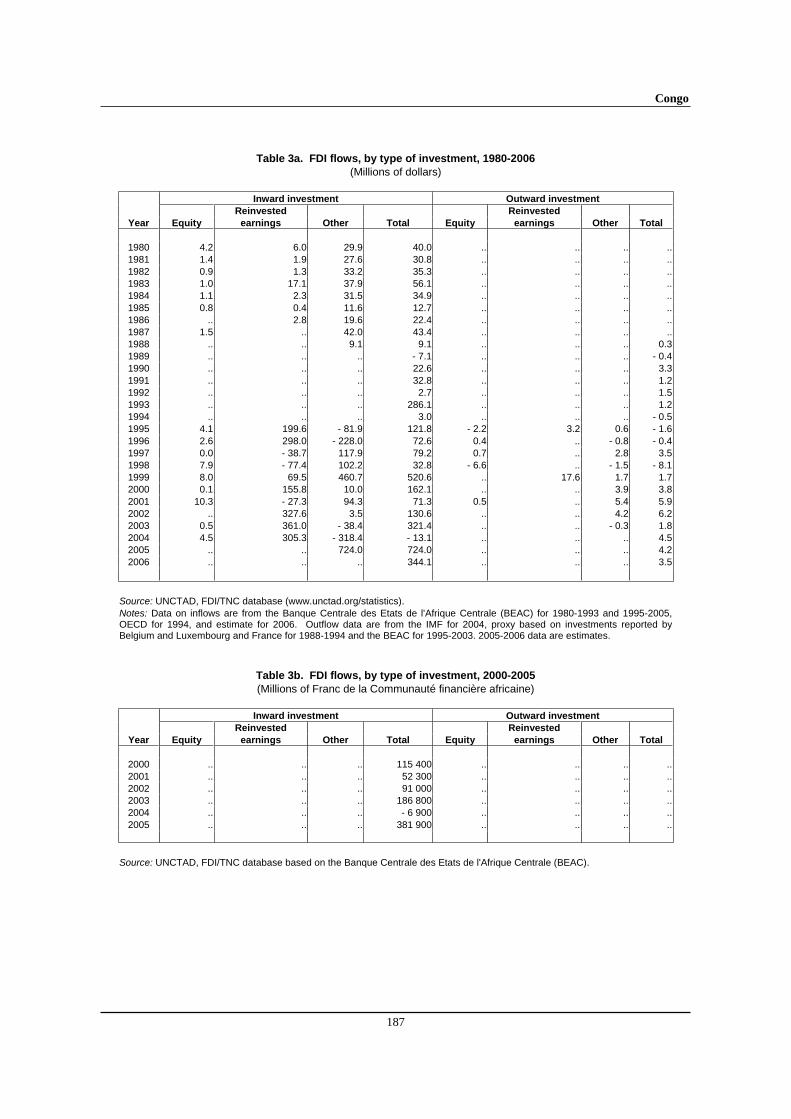
Congo
187
Table 3a. FDI flows, by type of investment, 1980-2006
(Millions of dollars)
Inward investment Outward investment
Reinvested Reinvested
Year Equity earnings Other Total Equity earnings Other Total
1980 4.2 6.0 29.9 40.0 .. .. .. ..1981 1.4 1.9 27.6 30.8 .. .. .. ..1982 0.9 1.3 33.2 35.3 .. .. .. ..1983 1.0 17.1 37.9 56.1 .. .. .. ..1984 1.1 2.3 31.5 34.9 .. .. .. ..1985 0.8 0.4 11.6 12.7 .. .. .. ..1986 .. 2.8 19.6 22.4 .. .. .. ..1987 1.5 .. 42.0 43.4 .. .. .. ..1988 .. .. 9.1 9.1 .. .. .. 0.31989 .. .. .. - 7.1 .. .. .. - 0.41990 .. .. .. 22.6 .. .. .. 3.31991 .. .. .. 32.8 .. .. .. 1.21992 .. .. .. 2.7 .. .. .. 1.51993 .. .. .. 286.1 .. .. .. 1.21994 .. .. .. 3.0 .. .. .. - 0.51995 4.1 199.6 - 81.9 121.8 - 2.2 3.2 0.6 - 1.61996 2.6 298.0 - 228.0 72.6 0.4 .. - 0.8 - 0.41997 0.0 - 38.7 117.9 79.2 0.7 .. 2.8 3.51998 7.9 - 77.4 102.2 32.8 - 6.6 .. - 1.5 - 8.11999 8.0 69.5 460.7 520.6 .. 17.6 1.7 1.72000 0.1 155.8 10.0 162.1 .. .. 3.9 3.82001 10.3 - 27.3 94.3 71.3 0.5 .. 5.4 5.92002 .. 327.6 3.5 130.6 .. .. 4.2 6.22003 0.5 361.0 - 38.4 321.4 .. .. - 0.3 1.82004 4.5 305.3 - 318.4 - 13.1 .. .. .. 4.52005 .. .. 724.0 724.0 .. .. .. 4.22006 .. .. .. 344.1 .. .. .. 3.5
Source: UNCTAD, FDI/TNC database (www.unctad.org/statistics). Notes: Data on inflows are from the Banque Centrale des Etats de l'Afrique Centrale (BEAC) for 1980-1993 and 1995-2005, OECD for 1994, and estimate for 2006. Outflow data are from the IMF for 2004, proxy based on investments reported by Belgium and Luxembourg and France for 1988-1994 and the BEAC for 1995-2003. 2005-2006 data are estimates.
Table 3b. FDI flows, by type of investment, 2000-2005
(Millions of Franc de la Communauté financière africaine)
Inward investment Outward investment
Reinvested Reinvested
Year Equity earnings Other Total Equity earnings Other Total
2000 .. .. .. 115 400 .. .. .. ..2001 .. .. .. 52 300 .. .. .. ..2002 .. .. .. 91 000 .. .. .. ..2003 .. .. .. 186 800 .. .. .. ..2004 .. .. .. - 6 900 .. .. .. ..2005 .. .. .. 381 900 .. .. .. ..
Source: UNCTAD, FDI/TNC database based on the Banque Centrale des Etats de l'Afrique Centrale (BEAC).
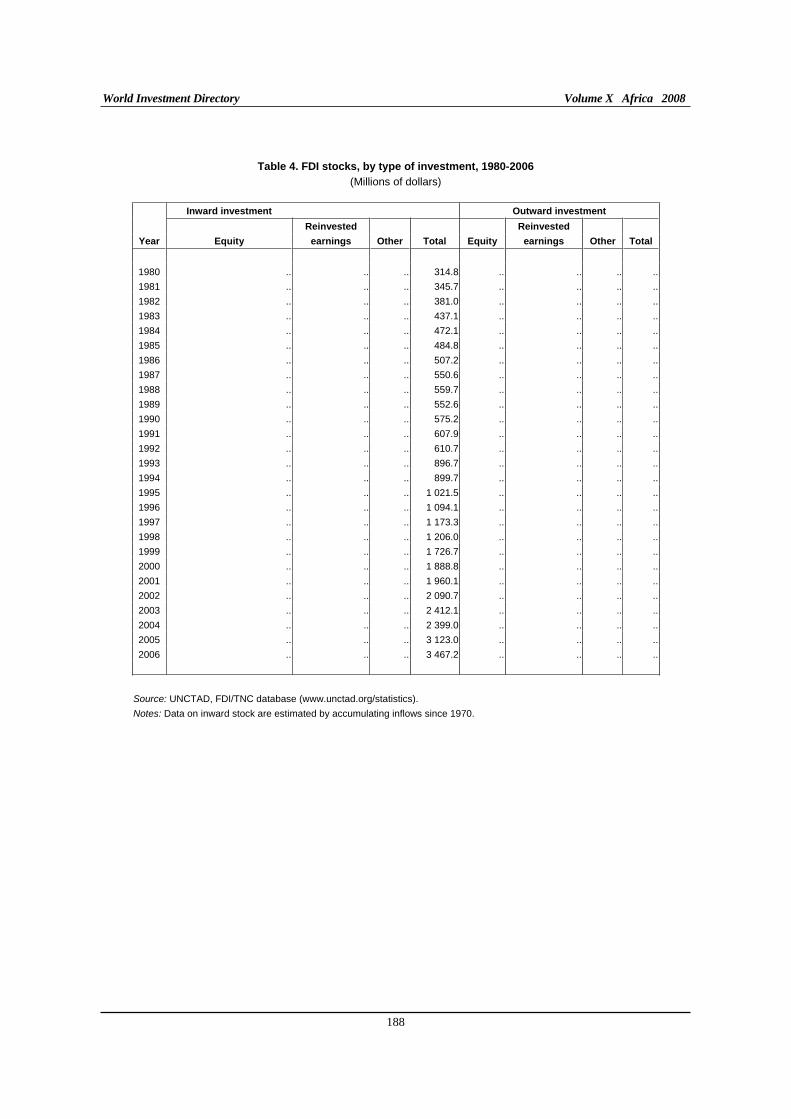
World Investment Directory Volume X Africa 2008
188
Table 4. FDI stocks, by type of investment, 1980-2006
(Millions of dollars)
Inward investment Outward investment
Reinvested Reinvested
Year Equity earnings Other Total Equity earnings Other Total
1980 .. .. .. 314.8 .. .. .. ..
1981 .. .. .. 345.7 .. .. .. ..
1982 .. .. .. 381.0 .. .. .. ..
1983 .. .. .. 437.1 .. .. .. ..
1984 .. .. .. 472.1 .. .. .. ..
1985 .. .. .. 484.8 .. .. .. ..
1986 .. .. .. 507.2 .. .. .. ..
1987 .. .. .. 550.6 .. .. .. ..
1988 .. .. .. 559.7 .. .. .. ..
1989 .. .. .. 552.6 .. .. .. ..
1990 .. .. .. 575.2 .. .. .. ..
1991 .. .. .. 607.9 .. .. .. ..
1992 .. .. .. 610.7 .. .. .. ..
1993 .. .. .. 896.7 .. .. .. ..
1994 .. .. .. 899.7 .. .. .. ..
1995 .. .. .. 1 021.5 .. .. .. ..
1996 .. .. .. 1 094.1 .. .. .. ..
1997 .. .. .. 1 173.3 .. .. .. ..
1998 .. .. .. 1 206.0 .. .. .. ..
1999 .. .. .. 1 726.7 .. .. .. ..
2000 .. .. .. 1 888.8 .. .. .. ..
2001 .. .. .. 1 960.1 .. .. .. ..
2002 .. .. .. 2 090.7 .. .. .. ..
2003 .. .. .. 2 412.1 .. .. .. ..
2004 .. .. .. 2 399.0 .. .. .. ..
2005 .. .. .. 3 123.0 .. .. .. ..
2006 .. .. .. 3 467.2 .. .. .. ..
Source: UNCTAD, FDI/TNC database (www.unctad.org/statistics).
Notes: Data on inward stock are estimated by accumulating inflows since 1970.
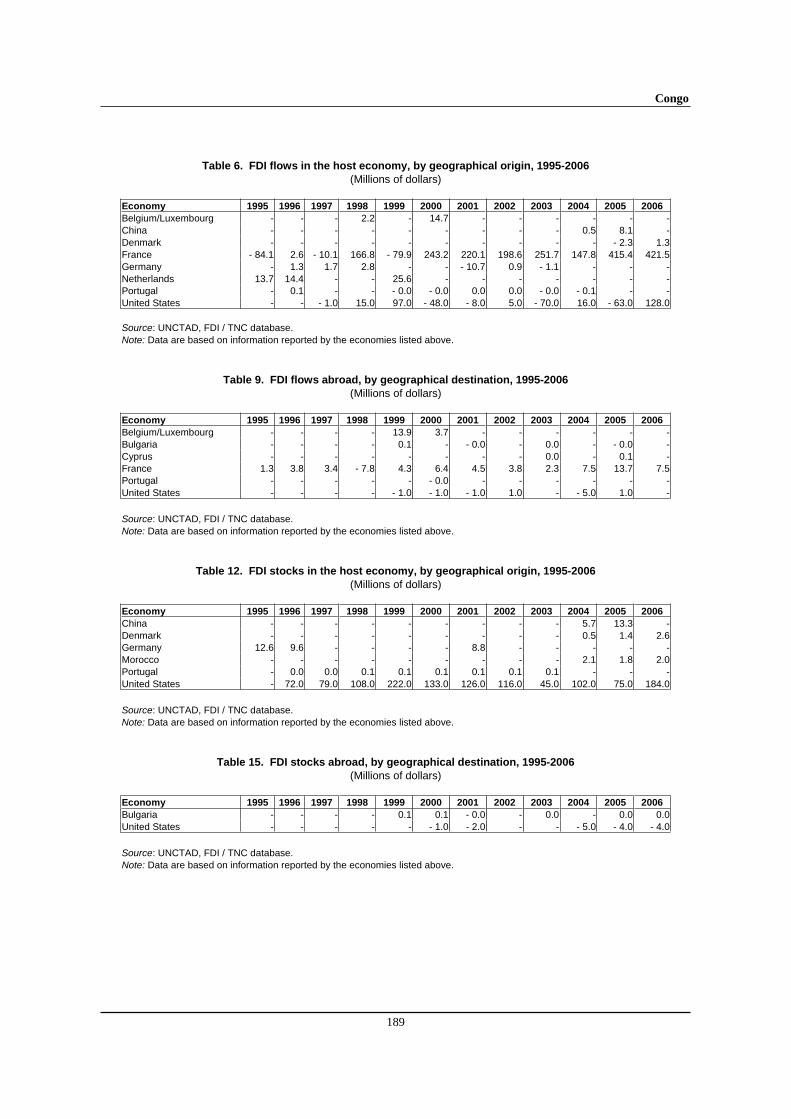
Congo
189
Table 6. FDI flows in the host economy, by geographical origin, 1995-2006
(Millions of dollars) Economy 1995 1996 1997 1998 1999 2000 2001 2002 2003 2004 2005 2006
Belgium/Luxembourg - - - 2.2 - 14.7 - - - - - -China - - - - - - - - - 0.5 8.1 -Denmark - - - - - - - - - - - 2.3 1.3France - 84.1 2.6 - 10.1 166.8 - 79.9 243.2 220.1 198.6 251.7 147.8 415.4 421.5Germany - 1.3 1.7 2.8 - - - 10.7 0.9 - 1.1 - - -Netherlands 13.7 14.4 - - 25.6 - - - - - - -Portugal - 0.1 - - - 0.0 - 0.0 0.0 0.0 - 0.0 - 0.1 - -United States - - - 1.0 15.0 97.0 - 48.0 - 8.0 5.0 - 70.0 16.0 - 63.0 128.0 Source: UNCTAD, FDI / TNC database. Note: Data are based on information reported by the economies listed above.
Table 9. FDI flows abroad, by geographical destination, 1995-2006
(Millions of dollars) Economy 1995 1996 1997 1998 1999 2000 2001 2002 2003 2004 2005 2006
Belgium/Luxembourg - - - - 13.9 3.7 - - - - - -Bulgaria - - - - 0.1 - - 0.0 - 0.0 - - 0.0 -Cyprus - - - - - - - - 0.0 - 0.1 -France 1.3 3.8 3.4 - 7.8 4.3 6.4 4.5 3.8 2.3 7.5 13.7 7.5Portugal - - - - - - 0.0 - - - - - -United States - - - - - 1.0 - 1.0 - 1.0 1.0 - - 5.0 1.0 -
Source: UNCTAD, FDI / TNC database. Note: Data are based on information reported by the economies listed above.
Table 12. FDI stocks in the host economy, by geographical origin, 1995-2006
(Millions of dollars) Economy 1995 1996 1997 1998 1999 2000 2001 2002 2003 2004 2005 2006
China - - - - - - - - - 5.7 13.3 -Denmark - - - - - - - - - 0.5 1.4 2.6Germany 12.6 9.6 - - - - 8.8 - - - - -Morocco - - - - - - - - - 2.1 1.8 2.0Portugal - 0.0 0.0 0.1 0.1 0.1 0.1 0.1 0.1 - - -United States - 72.0 79.0 108.0 222.0 133.0 126.0 116.0 45.0 102.0 75.0 184.0
Source: UNCTAD, FDI / TNC database. Note: Data are based on information reported by the economies listed above.
Table 15. FDI stocks abroad, by geographical destination, 1995-2006
(Millions of dollars) Economy 1995 1996 1997 1998 1999 2000 2001 2002 2003 2004 2005 2006
Bulgaria - - - - 0.1 0.1 - 0.0 - 0.0 - 0.0 0.0United States - - - - - - 1.0 - 2.0 - - - 5.0 - 4.0 - 4.0
Source: UNCTAD, FDI / TNC database. Note: Data are based on information reported by the economies listed above.
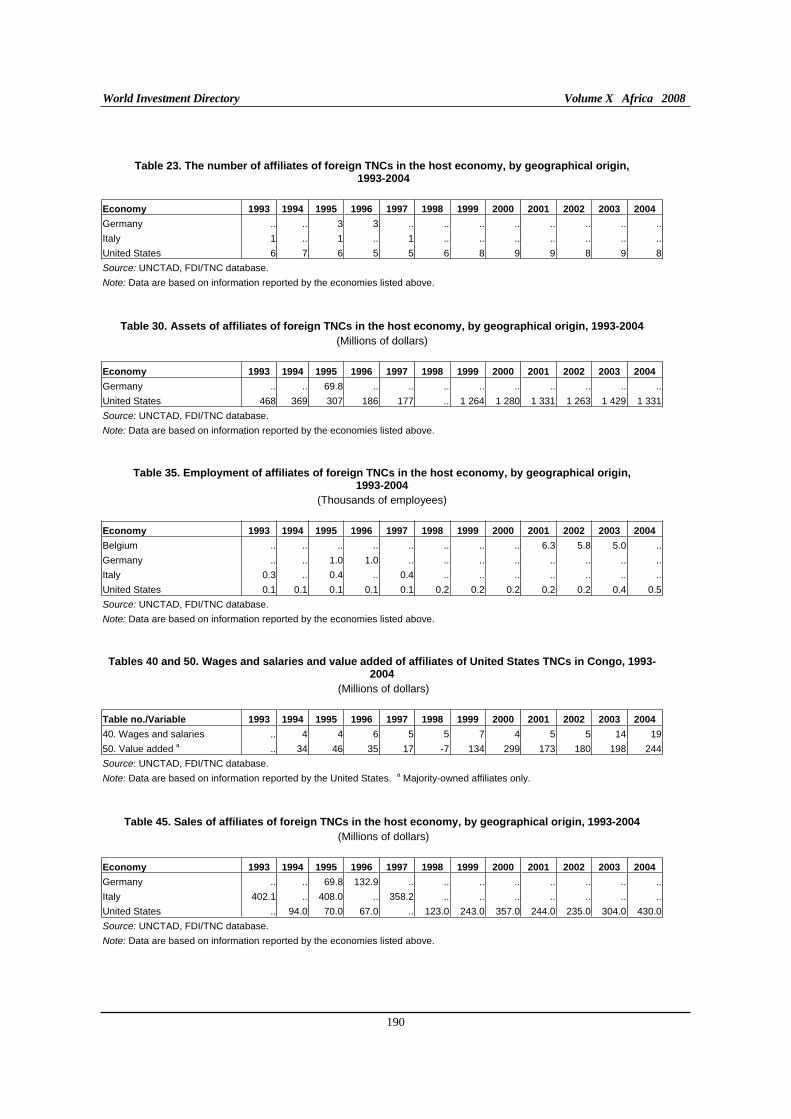
World Investment Directory Volume X Africa 2008
190
Table 23. The number of affiliates of foreign TNCs in the host economy, by geographical origin, 1993-2004
Economy 1993 1994 1995 1996 1997 1998 1999 2000 2001 2002 2003 2004
Germany .. .. 3 3 .. .. .. .. .. .. .. ..
Italy 1 .. 1 .. 1 .. .. .. .. .. .. ..
United States 6 7 6 5 5 6 8 9 9 8 9 8
Source: UNCTAD, FDI/TNC database.
Note: Data are based on information reported by the economies listed above.
Table 30. Assets of affiliates of foreign TNCs in the host economy, by geographical origin, 1993-2004
(Millions of dollars)
Economy 1993 1994 1995 1996 1997 1998 1999 2000 2001 2002 2003 2004
Germany .. .. 69.8 .. .. .. .. .. .. .. .. ..
United States 468 369 307 186 177 .. 1 264 1 280 1 331 1 263 1 429 1 331
Source: UNCTAD, FDI/TNC database.
Note: Data are based on information reported by the economies listed above.
Table 35. Employment of affiliates of foreign TNCs in the host economy, by geographical origin, 1993-2004
(Thousands of employees)
Economy 1993 1994 1995 1996 1997 1998 1999 2000 2001 2002 2003 2004
Belgium .. .. .. .. .. .. .. .. 6.3 5.8 5.0 ..
Germany .. .. 1.0 1.0 .. .. .. .. .. .. .. ..
Italy 0.3 .. 0.4 .. 0.4 .. .. .. .. .. .. ..
United States 0.1 0.1 0.1 0.1 0.1 0.2 0.2 0.2 0.2 0.2 0.4 0.5
Source: UNCTAD, FDI/TNC database.
Note: Data are based on information reported by the economies listed above.
Tables 40 and 50. Wages and salaries and value added of affiliates of United States TNCs in Congo, 1993-
2004
(Millions of dollars)
Table no./Variable 1993 1994 1995 1996 1997 1998 1999 2000 2001 2002 2003 2004
40. Wages and salaries .. 4 4 6 5 5 7 4 5 5 14 19
50. Value added a .. 34 46 35 17 -7 134 299 173 180 198 244
Source: UNCTAD, FDI/TNC database.
Note: Data are based on information reported by the United States. a Majority-owned affiliates only.
Table 45. Sales of affiliates of foreign TNCs in the host economy, by geographical origin, 1993-2004
(Millions of dollars)
Economy 1993 1994 1995 1996 1997 1998 1999 2000 2001 2002 2003 2004
Germany .. .. 69.8 132.9 .. .. .. .. .. .. .. ..
Italy 402.1 .. 408.0 .. 358.2 .. .. .. .. .. .. ..
United States .. 94.0 70.0 67.0 .. 123.0 243.0 357.0 244.0 235.0 304.0 430.0
Source: UNCTAD, FDI/TNC database. Note: Data are based on information reported by the economies listed above.
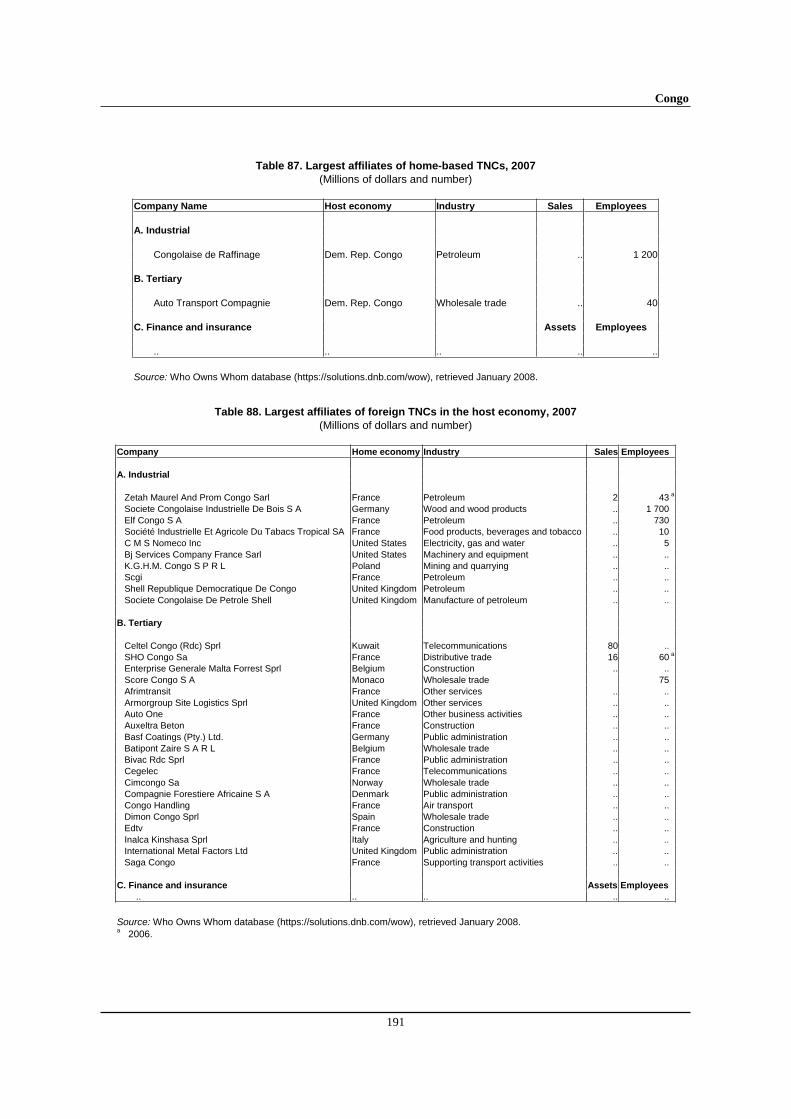
Congo
191
Table 87. Largest affiliates of home-based TNCs, 2007
(Millions of dollars and number) Company Name Host economy Industry Sales Employees
A. Industrial
Congolaise de Raffinage Dem. Rep. Congo Petroleum .. 1 200
B. Tertiary
Auto Transport Compagnie Dem. Rep. Congo Wholesale trade .. 40
C. Finance and insurance Assets Employees
.. .. .. .. ..
Source: Who Owns Whom database (https://solutions.dnb.com/wow), retrieved January 2008.
Table 88. Largest affiliates of foreign TNCs in the host economy, 2007
(Millions of dollars and number) Company Home economy Industry Sales Employees
A. Industrial
Zetah Maurel And Prom Congo Sarl France Petroleum 2 43 a
Societe Congolaise Industrielle De Bois S A Germany Wood and wood products .. 1 700 Elf Congo S A France Petroleum .. 730 Société Industrielle Et Agricole Du Tabacs Tropical SA France Food products, beverages and tobacco .. 10 C M S Nomeco Inc United States Electricity, gas and water .. 5 Bj Services Company France Sarl United States Machinery and equipment .. .. K.G.H.M. Congo S P R L Poland Mining and quarrying .. .. Scgi France Petroleum .. .. Shell Republique Democratique De Congo United Kingdom Petroleum .. .. Societe Congolaise De Petrole Shell United Kingdom Manufacture of petroleum .. .. B. Tertiary
Celtel Congo (Rdc) Sprl Kuwait Telecommunications 80 .. SHO Congo Sa France Distributive trade 16 60 a
Enterprise Generale Malta Forrest Sprl Belgium Construction .. .. Score Congo S A Monaco Wholesale trade 75 Afrimtransit France Other services .. .. Armorgroup Site Logistics Sprl United Kingdom Other services .. .. Auto One France Other business activities .. .. Auxeltra Beton France Construction .. .. Basf Coatings (Pty.) Ltd. Germany Public administration .. .. Batipont Zaire S A R L Belgium Wholesale trade .. .. Bivac Rdc Sprl France Public administration .. .. Cegelec France Telecommunications .. .. Cimcongo Sa Norway Wholesale trade .. .. Compagnie Forestiere Africaine S A Denmark Public administration .. .. Congo Handling France Air transport .. .. Dimon Congo Sprl Spain Wholesale trade .. .. Edtv France Construction .. .. Inalca Kinshasa Sprl Italy Agriculture and hunting .. .. International Metal Factors Ltd United Kingdom Public administration .. .. Saga Congo France Supporting transport activities .. .. C. Finance and insurance Assets Employees
.. .. .. .. ..
Source: Who Owns Whom database (https://solutions.dnb.com/wow), retrieved January 2008.a 2006.
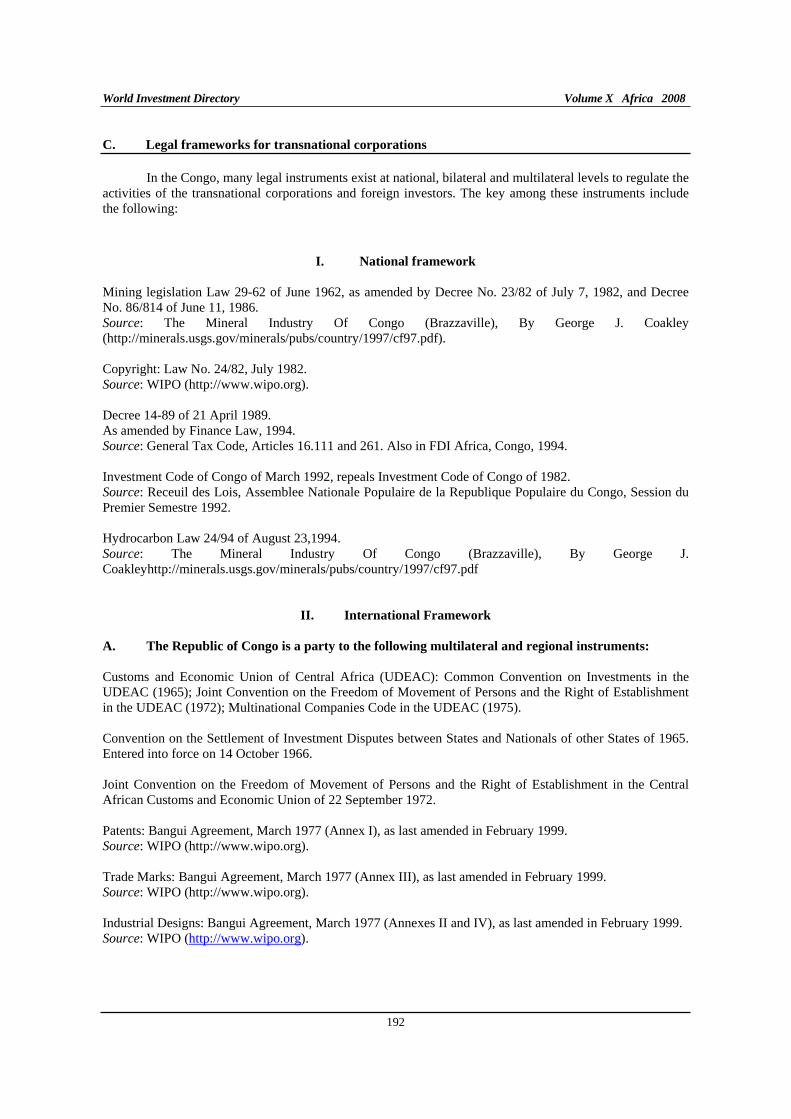
World Investment Directory Volume X Africa 2008
192
C. Legal frameworks for transnational corporations
In the Congo, many legal instruments exist at national, bilateral and multilateral levels to regulate the activities of the transnational corporations and foreign investors. The key among these instruments include the following:
I. National framework
Mining legislation Law 29-62 of June 1962, as amended by Decree No. 23/82 of July 7, 1982, and Decree No. 86/814 of June 11, 1986. Source: The Mineral Industry Of Congo (Brazzaville), By George J. Coakley (http://minerals.usgs.gov/minerals/pubs/country/1997/cf97.pdf).
Copyright: Law No. 24/82, July 1982. Source: WIPO (http://www.wipo.org).
Decree 14-89 of 21 April 1989. As amended by Finance Law, 1994. Source: General Tax Code, Articles 16.111 and 261. Also in FDI Africa, Congo, 1994.
Investment Code of Congo of March 1992, repeals Investment Code of Congo of 1982. Source: Receuil des Lois, Assemblee Nationale Populaire de la Republique Populaire du Congo, Session du Premier Semestre 1992.
Hydrocarbon Law 24/94 of August 23,1994. Source: The Mineral Industry Of Congo (Brazzaville), By George J. Coakleyhttp://minerals.usgs.gov/minerals/pubs/country/1997/cf97.pdf
II. International Framework
A. The Republic of Congo is a party to the following multilateral and regional instruments:
Customs and Economic Union of Central Africa (UDEAC): Common Convention on Investments in the UDEAC (1965); Joint Convention on the Freedom of Movement of Persons and the Right of Establishment in the UDEAC (1972); Multinational Companies Code in the UDEAC (1975).
Convention on the Settlement of Investment Disputes between States and Nationals of other States of 1965. Entered into force on 14 October 1966.
Joint Convention on the Freedom of Movement of Persons and the Right of Establishment in the Central African Customs and Economic Union of 22 September 1972.
Patents: Bangui Agreement, March 1977 (Annex I), as last amended in February 1999. Source: WIPO (http://www.wipo.org).
Trade Marks: Bangui Agreement, March 1977 (Annex III), as last amended in February 1999. Source: WIPO (http://www.wipo.org).
Industrial Designs: Bangui Agreement, March 1977 (Annexes II and IV), as last amended in February 1999. Source: WIPO (http://www.wipo.org).
Congo
193
Treaty for the Establishment of the Economic Community of Central African States of 18 October 1983; entered into force in member 1984.
Convention Establishing the Multilateral Investment Guarantee Agency of 1985, entered into force on 12 April 1988.
Fourth ACP - EEC Convention (Lome IV) of 1989, entered into force on 1st March 1990.
Paris Convention for the Protection of Industrial Property of 1883 (Revised at Brussels in 1900, Washington in 1911, The Hague in 1925, London in 1934, Lisbon in 1958 and Stockholm in 1967, and as amended in 1979). Signed in 1994.
Marrakesh Agreement Establishing the World Trade Organisation of 15 April 1994. Entered into force on 1 January 1995. Agreement on Trade-Related Investment Measures. General Agreement on Trade in Services. Agreement on Trade Related Aspects of Intellectual Property Rights.
Partnership Agreement between the Members of The African, Caribbean and Pacific Group of States, of the one part and the European Community and its member states, of the other part signed in Cotonou, Benin on 23 June 2000.
B. Bilateral treaties
1. Bilateral investment treaties for the protection and promotion of investments: France 1960, Switzerland 1962, Germany 1965, United Kingdom 1989, United States 1990, Italy 1994, China 2005, South Africa 2005, Tunisia 2005, Korea, Republic of 2006.
2. Bilateral treaties for the avoidance of double taxation: United Kingdom 1976, France 1987.
World Investment Directory Volume X Africa 2008
194
D. Sources of information
Official
Banque des Etats de l’Afrique Centrale (www.beac.int).
Secondary
Economist Intelligence Unit (EIU) (various years). Country Profile: Democratic Republic of Congo
(London: EIU Ltd.).
______________ (various years). Country Report: Democratic Republic of Congo (London: EIU Ltd.).
International Monetary Fund (IMF) (1996). Aftermath of the CFA Franc Devaluation (Washington D.C.: IMF).
MacGaffey, Janet et al (2000). Congo-Paris: Transnational Traders on the Margins of the Law (Paris: International African Institute).
MacGaffey, Janet and Vwakyanakazi Mukohya (1991). The Real Economy of Zaire: The Contribution of
Smuggling and Other Unofficial Activities to National Wealth (Pennsylvania:University of Pennsylvania Press, Philadelphia).
Morisset, J. (2001). "Foreign direct investment in Africa: policies also matter", OECD Global Forum on International Investment (Paris: OECD).
OECD (2002). FDI from Developing Countries: A Vector for Trade and Development (Paris: OECD).
Meditz, Sandra and Tim, Merrill (eds.) (1994). Zaire: A Country Study, Library of Congress Research Division (Washington D.C.: Area handbook series).
Soderbom, M. and F. Teal (2004). "Size and Efficiency in Africa Manufacturing firms: Evidence from Firm-Level Panel Data." Journal of Development Economics, 73. pp 369 - 394.
United Nations Conference on Trade and Development (UNCTAD) (2002). FDI in Least Developed
Countries at a Glance (Geneva: UNCTAD) (www.unctad.org/en/subsites/dite/LDCs/ pdfs/Countries/chad.pdf).
United States Department of State, Bureau of African Affairs (1995). "Investment climate report: sub-Saharan Africa" (Washington D.C.: United States Department of State).
World Bank (1995). A Continent in Transition: Sub-Saharan Africa in the mid-1990s (Washington D.C.: World Bank).
World Bank/International Finance Corporation (2007). Doing Business 2008 Democratic Republic of Congo
(Washington D.C.: The World Bank Group).
Democratic Republic of the Congo
195
Congo, Democratic Rep. of
A. Definitions and sources of data
Data on the annual foreign direct investment (FDI) in the Democratic Republic of Congo (DRC) are gathered from the tapes provided by the Organization for Economic Cooperation and Development, Development Assistance Committee and International Development Statistics On-line databases. The country does not provide FDI statistics. The International Monetary Fund does not provide data on FDI in the country in its balance-of-payment statistics either. The Investment Code of (Ordinance-Law No. 86-028 of 1986) of the DRC (former Zaire) does not define FDI, specifically.
The investment climate in the DRC is improving. Rampant company nationalizations that were instituted in the 1970's and the two wars fought in the country during the past years have caused a sharp drop in economic activities. Large reserve of natural resources has kept the economy going and attracted some FDI. The formal economy is dominated by copper and cobalt mining, with exploiting of diamonds. Also, there is timber in the Equateur province, immense hydroelectric potential in Bas-Congo, gold and coffee in Oriental and Nord-Kivu. The mining industry is strapped for cash and in serious need of new investment.
DRC also has extensive energy resources including hydroelectric potential estimated at 100,000 megawatts. The Inga dam alone, on the Congo River, posses potential capacity of 40,000-45,000 megawatts, enough to supply Southern Africa’s electricity needs. Only a fraction of this amount has been developed at Inga. Production is estimated at no more than 650-750 megawatts, largely because two-thirds of the turbines are not working. The country exports hydroelectricity to Congo (Brazzaville) and South Africa through the Southern African electricity grid. A proposal has been developed to increase production at Inga and export this to the region. A South African utility company, Eskom, has been involved in rehabilitating the Inga dam for this goal.
The Government of DRC signed to the Convention on the Settlement of Investment Disputes between State and Nationals of other States on October 29, 1968, cooperates with many African countries and considers regional integration as an important for its economic success. The country participates in integration schemes such as: the Communauté Economique et Monétaire de l’Afrique Centrale, the Union Economique et Monétaire Ouest-Africaine, Southern African Development Community, New Partnership for Africa's Development and the African Union. DRC is also an eligible member of the Cotonou agreement for renegotiating the Lomé Convention offering a group of African, Caribbean and Pacific countries preferential trade and aid links with the European Union and the United States market access initiative for African countries - the African Growth and Opportunity Act. DRC is signatory to the convention that established the multilateral investment guarantee agency and a member of the World Trade Organization.
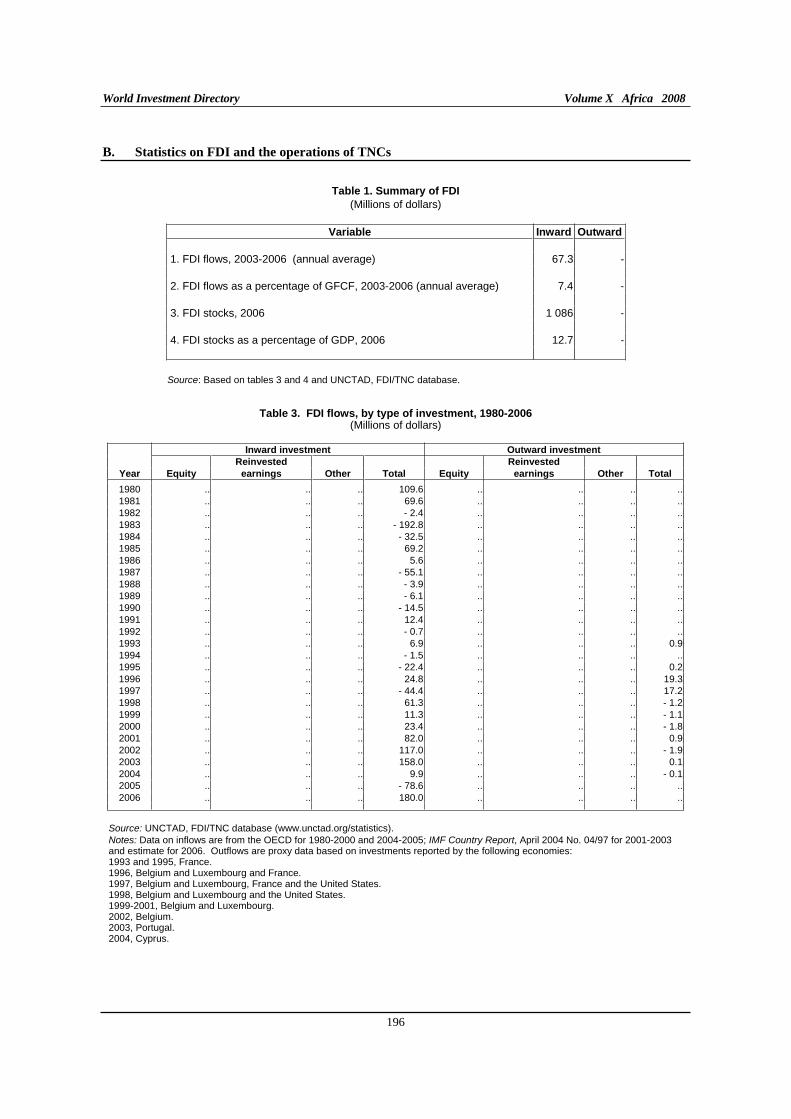
World Investment Directory Volume X Africa 2008
196
B. Statistics on FDI and the operations of TNCs
Table 1. Summary of FDI
(Millions of dollars)
Variable Inward Outward
1. FDI flows, 2003-2006 (annual average) 67.3 -
2. FDI flows as a percentage of GFCF, 2003-2006 (annual average) 7.4 -
3. FDI stocks, 2006 1 086 -
4. FDI stocks as a percentage of GDP, 2006 12.7 -
Source: Based on tables 3 and 4 and UNCTAD, FDI/TNC database.
Table 3. FDI flows, by type of investment, 1980-2006 (Millions of dollars)
Inward investment Outward investment
Reinvested Reinvested Year Equity earnings Other Total Equity earnings Other Total
1980 .. .. .. 109.6 .. .. .. ..1981 .. .. .. 69.6 .. .. .. ..1982 .. .. .. - 2.4 .. .. .. ..1983 .. .. .. - 192.8 .. .. .. ..1984 .. .. .. - 32.5 .. .. .. ..1985 .. .. .. 69.2 .. .. .. ..1986 .. .. .. 5.6 .. .. .. ..1987 .. .. .. - 55.1 .. .. .. ..1988 .. .. .. - 3.9 .. .. .. ..1989 .. .. .. - 6.1 .. .. .. ..1990 .. .. .. - 14.5 .. .. .. ..1991 .. .. .. 12.4 .. .. .. ..1992 .. .. .. - 0.7 .. .. .. ..1993 .. .. .. 6.9 .. .. .. 0.91994 .. .. .. - 1.5 .. .. .. ..1995 .. .. .. - 22.4 .. .. .. 0.21996 .. .. .. 24.8 .. .. .. 19.31997 .. .. .. - 44.4 .. .. .. 17.21998 .. .. .. 61.3 .. .. .. - 1.21999 .. .. .. 11.3 .. .. .. - 1.12000 .. .. .. 23.4 .. .. .. - 1.82001 .. .. .. 82.0 .. .. .. 0.92002 .. .. .. 117.0 .. .. .. - 1.92003 .. .. .. 158.0 .. .. .. 0.12004 .. .. .. 9.9 .. .. .. - 0.12005 .. .. .. - 78.6 .. .. .. ..2006 .. .. .. 180.0 .. .. .. ..
Source: UNCTAD, FDI/TNC database (www.unctad.org/statistics). Notes: Data on inflows are from the OECD for 1980-2000 and 2004-2005; IMF Country Report, April 2004 No. 04/97 for 2001-2003 and estimate for 2006. Outflows are proxy data based on investments reported by the following economies: 1993 and 1995, France. 1996, Belgium and Luxembourg and France. 1997, Belgium and Luxembourg, France and the United States. 1998, Belgium and Luxembourg and the United States. 1999-2001, Belgium and Luxembourg. 2002, Belgium. 2003, Portugal. 2004, Cyprus.
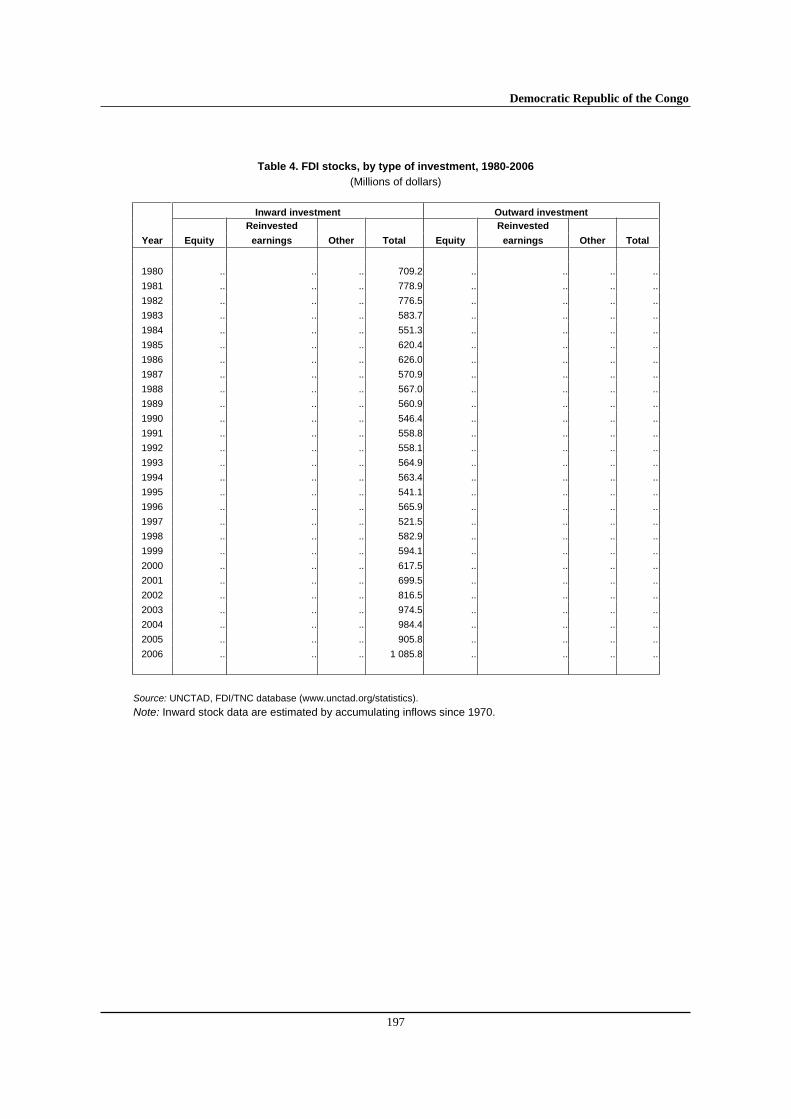
Democratic Republic of the Congo
197
Table 4. FDI stocks, by type of investment, 1980-2006
(Millions of dollars)
Inward investment Outward investment
Reinvested Reinvested
Year Equity earnings Other Total Equity earnings Other Total
1980 .. .. .. 709.2 .. .. .. ..
1981 .. .. .. 778.9 .. .. .. ..
1982 .. .. .. 776.5 .. .. .. ..
1983 .. .. .. 583.7 .. .. .. ..
1984 .. .. .. 551.3 .. .. .. ..
1985 .. .. .. 620.4 .. .. .. ..
1986 .. .. .. 626.0 .. .. .. ..
1987 .. .. .. 570.9 .. .. .. ..
1988 .. .. .. 567.0 .. .. .. ..
1989 .. .. .. 560.9 .. .. .. ..
1990 .. .. .. 546.4 .. .. .. ..
1991 .. .. .. 558.8 .. .. .. ..
1992 .. .. .. 558.1 .. .. .. ..
1993 .. .. .. 564.9 .. .. .. ..
1994 .. .. .. 563.4 .. .. .. ..
1995 .. .. .. 541.1 .. .. .. ..
1996 .. .. .. 565.9 .. .. .. ..
1997 .. .. .. 521.5 .. .. .. ..
1998 .. .. .. 582.9 .. .. .. ..
1999 .. .. .. 594.1 .. .. .. ..
2000 .. .. .. 617.5 .. .. .. ..
2001 .. .. .. 699.5 .. .. .. ..
2002 .. .. .. 816.5 .. .. .. ..
2003 .. .. .. 974.5 .. .. .. ..
2004 .. .. .. 984.4 .. .. .. ..
2005 .. .. .. 905.8 .. .. .. ..
2006 .. .. .. 1 085.8 .. .. .. ..
Source: UNCTAD, FDI/TNC database (www.unctad.org/statistics).
Note: Inward stock data are estimated by accumulating inflows since 1970.
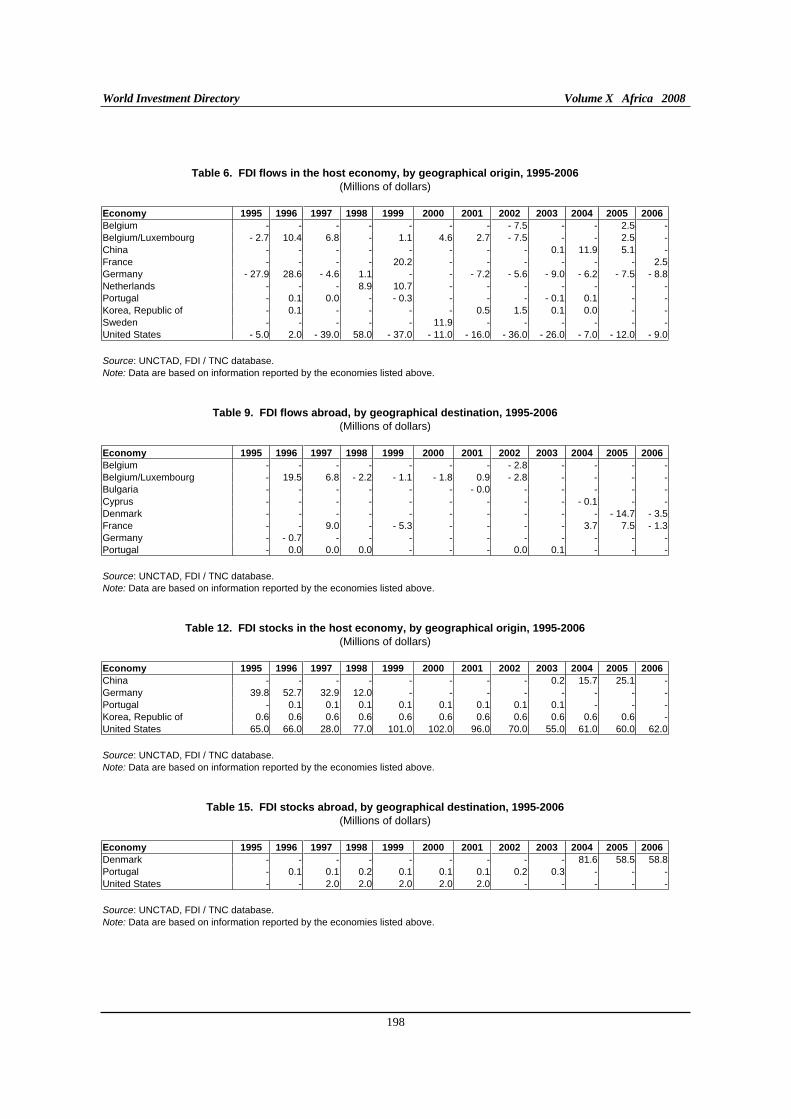
World Investment Directory Volume X Africa 2008
198
Table 6. FDI flows in the host economy, by geographical origin, 1995-2006
(Millions of dollars) Economy 1995 1996 1997 1998 1999 2000 2001 2002 2003 2004 2005 2006
Belgium - - - - - - - - 7.5 - - 2.5 -Belgium/Luxembourg - 2.7 10.4 6.8 - 1.1 4.6 2.7 - 7.5 - - 2.5 -China - - - - - - - - 0.1 11.9 5.1 -France - - - - 20.2 - - - - - - 2.5Germany - 27.9 28.6 - 4.6 1.1 - - - 7.2 - 5.6 - 9.0 - 6.2 - 7.5 - 8.8Netherlands - - - 8.9 10.7 - - - - - - -Portugal - 0.1 0.0 - - 0.3 - - - - 0.1 0.1 - -Korea, Republic of - 0.1 - - - - 0.5 1.5 0.1 0.0 - -Sweden - - - - - 11.9 - - - - - -United States - 5.0 2.0 - 39.0 58.0 - 37.0 - 11.0 - 16.0 - 36.0 - 26.0 - 7.0 - 12.0 - 9.0
Source: UNCTAD, FDI / TNC database. Note: Data are based on information reported by the economies listed above.
Table 9. FDI flows abroad, by geographical destination, 1995-2006
(Millions of dollars) Economy 1995 1996 1997 1998 1999 2000 2001 2002 2003 2004 2005 2006
Belgium - - - - - - - - 2.8 - - - -Belgium/Luxembourg - 19.5 6.8 - 2.2 - 1.1 - 1.8 0.9 - 2.8 - - - -Bulgaria - - - - - - - 0.0 - - - - -Cyprus - - - - - - - - - - 0.1 - -Denmark - - - - - - - - - - - 14.7 - 3.5France - - 9.0 - - 5.3 - - - - 3.7 7.5 - 1.3Germany - - 0.7 - - - - - - - - - -Portugal - 0.0 0.0 0.0 - - - 0.0 0.1 - - -
Source: UNCTAD, FDI / TNC database. Note: Data are based on information reported by the economies listed above.
Table 12. FDI stocks in the host economy, by geographical origin, 1995-2006
(Millions of dollars) Economy 1995 1996 1997 1998 1999 2000 2001 2002 2003 2004 2005 2006
China - - - - - - - - 0.2 15.7 25.1 -Germany 39.8 52.7 32.9 12.0 - - - - - - - -Portugal - 0.1 0.1 0.1 0.1 0.1 0.1 0.1 0.1 - - -Korea, Republic of 0.6 0.6 0.6 0.6 0.6 0.6 0.6 0.6 0.6 0.6 0.6 -United States 65.0 66.0 28.0 77.0 101.0 102.0 96.0 70.0 55.0 61.0 60.0 62.0
Source: UNCTAD, FDI / TNC database. Note: Data are based on information reported by the economies listed above.
Table 15. FDI stocks abroad, by geographical destination, 1995-2006
(Millions of dollars) Economy 1995 1996 1997 1998 1999 2000 2001 2002 2003 2004 2005 2006
Denmark - - - - - - - - - 81.6 58.5 58.8Portugal - 0.1 0.1 0.2 0.1 0.1 0.1 0.2 0.3 - - -United States - - 2.0 2.0 2.0 2.0 2.0 - - - - -
Source: UNCTAD, FDI / TNC database. Note: Data are based on information reported by the economies listed above.
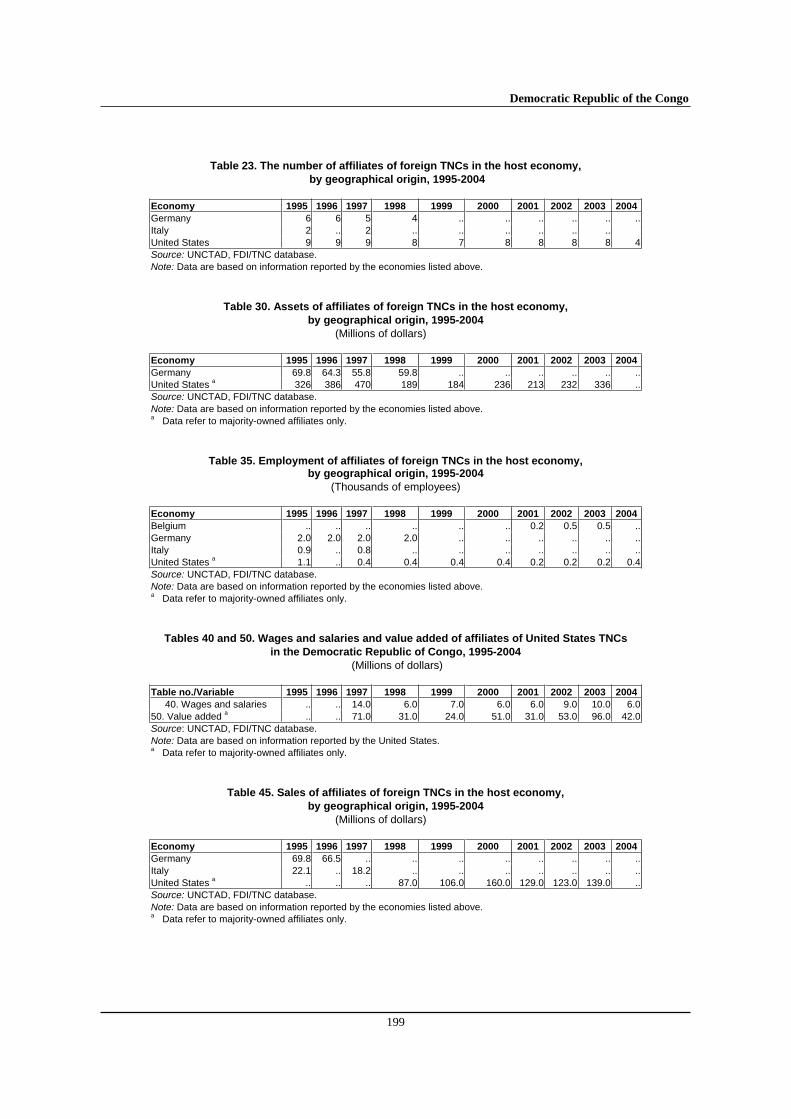
Democratic Republic of the Congo
199
Table 23. The number of affiliates of foreign TNCs in the host economy,
by geographical origin, 1995-2004
Economy 1995 1996 1997 1998 1999 2000 2001 2002 2003 2004
Germany 6 6 5 4 .. .. .. .. .. ..Italy 2 .. 2 .. .. .. .. .. .. United States 9 9 9 8 7 8 8 8 8 4Source: UNCTAD, FDI/TNC database. Note: Data are based on information reported by the economies listed above.
Table 30. Assets of affiliates of foreign TNCs in the host economy,
by geographical origin, 1995-2004
(Millions of dollars) Economy 1995 1996 1997 1998 1999 2000 2001 2002 2003 2004
Germany 69.8 64.3 55.8 59.8 .. .. .. .. .. ..United States a 326 386 470 189 184 236 213 232 336 ..Source: UNCTAD, FDI/TNC database. Note: Data are based on information reported by the economies listed above. a Data refer to majority-owned affiliates only.
Table 35. Employment of affiliates of foreign TNCs in the host economy, by geographical origin, 1995-2004
(Thousands of employees) Economy 1995 1996 1997 1998 1999 2000 2001 2002 2003 2004
Belgium .. .. .. .. .. .. 0.2 0.5 0.5 ..Germany 2.0 2.0 2.0 2.0 .. .. .. .. .. ..Italy 0.9 .. 0.8 .. .. .. .. .. .. ..United States a 1.1 .. 0.4 0.4 0.4 0.4 0.2 0.2 0.2 0.4Source: UNCTAD, FDI/TNC database. Note: Data are based on information reported by the economies listed above. a Data refer to majority-owned affiliates only.
Tables 40 and 50. Wages and salaries and value added of affiliates of United States TNCs
in the Democratic Republic of Congo, 1995-2004
(Millions of dollars)
Table no./Variable 1995 1996 1997 1998 1999 2000 2001 2002 2003 2004
40. Wages and salaries .. .. 14.0 6.0 7.0 6.0 6.0 9.0 10.0 6.050. Value added a .. .. 71.0 31.0 24.0 51.0 31.0 53.0 96.0 42.0Source: UNCTAD, FDI/TNC database. Note: Data are based on information reported by the United States. a Data refer to majority-owned affiliates only.
Table 45. Sales of affiliates of foreign TNCs in the host economy,
by geographical origin, 1995-2004
(Millions of dollars) Economy 1995 1996 1997 1998 1999 2000 2001 2002 2003 2004
Germany 69.8 66.5 .. .. .. .. .. .. .. ..Italy 22.1 .. 18.2 .. .. .. .. .. .. ..United States a .. .. .. 87.0 106.0 160.0 129.0 123.0 139.0 ..Source: UNCTAD, FDI/TNC database. Note: Data are based on information reported by the economies listed above. a Data refer to majority-owned affiliates only.
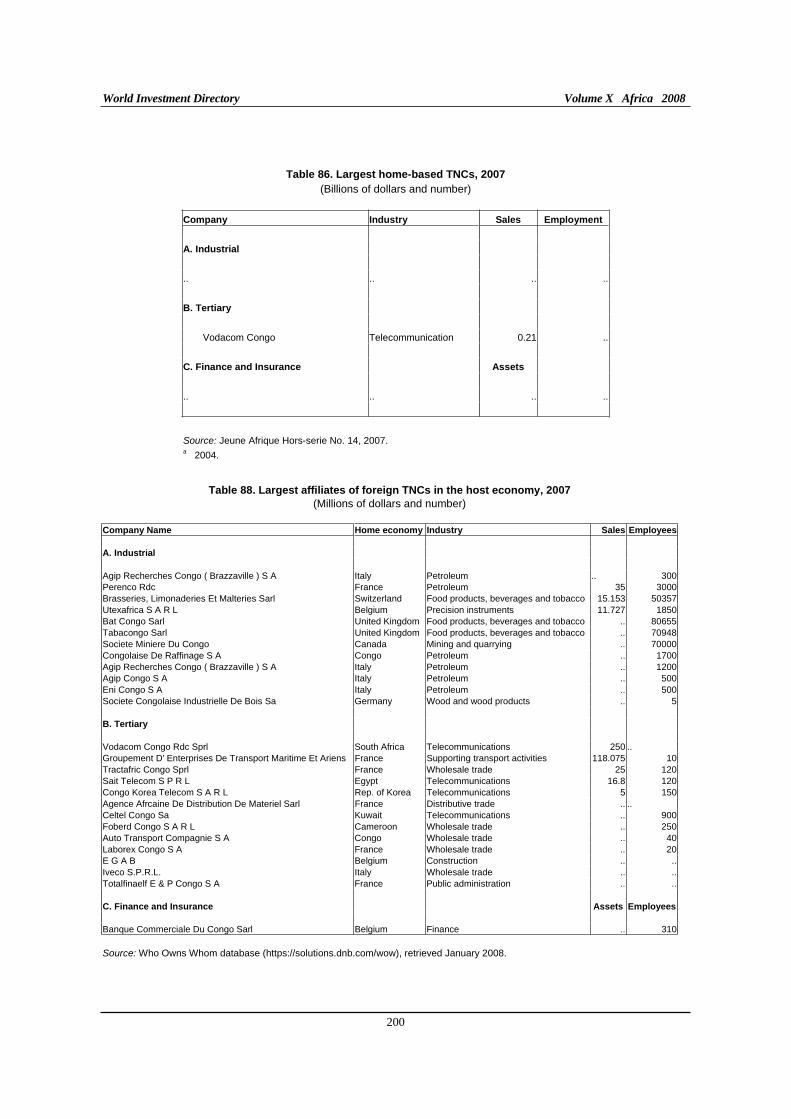
World Investment Directory Volume X Africa 2008
200
Table 86. Largest home-based TNCs, 2007
(Billions of dollars and number)
Company Industry Sales Employment
A. Industrial
.. .. .. ..
B. Tertiary
Vodacom Congo Telecommunication 0.21 ..
C. Finance and Insurance Assets
.. .. .. ..
Source: Jeune Afrique Hors-serie No. 14, 2007.a 2004.
Table 88. Largest affiliates of foreign TNCs in the host economy, 2007
(Millions of dollars and number) Company Name Home economy Industry Sales Employees
A. Industrial
Agip Recherches Congo ( Brazzaville ) S A Italy Petroleum .. 300Perenco Rdc France Petroleum 35 3000Brasseries, Limonaderies Et Malteries Sarl Switzerland Food products, beverages and tobacco 15.153 50357Utexafrica S A R L Belgium Precision instruments 11.727 1850Bat Congo Sarl United Kingdom Food products, beverages and tobacco .. 80655Tabacongo Sarl United Kingdom Food products, beverages and tobacco .. 70948Societe Miniere Du Congo Canada Mining and quarrying .. 70000Congolaise De Raffinage S A Congo Petroleum .. 1700Agip Recherches Congo ( Brazzaville ) S A Italy Petroleum .. 1200Agip Congo S A Italy Petroleum .. 500Eni Congo S A Italy Petroleum .. 500Societe Congolaise Industrielle De Bois Sa Germany Wood and wood products .. 5 B. Tertiary
Vodacom Congo Rdc Sprl South Africa Telecommunications 250 .. Groupement D' Enterprises De Transport Maritime Et Ariens France Supporting transport activities 118.075 10Tractafric Congo Sprl France Wholesale trade 25 120Sait Telecom S P R L Egypt Telecommunications 16.8 120Congo Korea Telecom S A R L Rep. of Korea Telecommunications 5 150Agence Afrcaine De Distribution De Materiel Sarl France Distributive trade .. .. Celtel Congo Sa Kuwait Telecommunications .. 900Foberd Congo S A R L Cameroon Wholesale trade .. 250Auto Transport Compagnie S A Congo Wholesale trade .. 40Laborex Congo S A France Wholesale trade .. 20E G A B Belgium Construction .. ..Iveco S.P.R.L. Italy Wholesale trade .. ..Totalfinaelf E & P Congo S A France Public administration .. ..
C. Finance and Insurance Assets Employees
Banque Commerciale Du Congo Sarl Belgium Finance .. 310
Source: Who Owns Whom database (https://solutions.dnb.com/wow), retrieved January 2008.
Democratic Republic of the Congo
201
C. Legal frameworks for transnational corporations
The Democratic Republic of Congo has adopted a number of legal instruments at national, bilateral and multilateral levels to regulate the activities of transnational corporations and foreign direct investors in the country. The key instruments include the following:
I. National framework
Corporations: Décret du 23 Juin 1960 sur les sociétés commerciales.
Land Property: Loi n° 80-008 du 18 Juillet 1980 modifiant et complétant la loi n° 73-021 du 20 juillet 1973 portant régime général des biens, régime foncier et immobilier et régime des sûretés. Source : Journal Officiel de la RDC, Numéro 15 du 1er Août 1980.
Ordinance-Law No. 81-010 creating a Free Zone Regime of Industrial Development; effective on 2 April 1981. Amendment: Ordinance Law No. 83-008, effective on 21 February 1983. Source: Journal Official de la Republique du Zaire, 15 April 1981.
Administration of the INGA Free Zones Regime, Ordinance Law No. 81-066; effective on 30 April 1981. Amendment: Ordinance No. 83-060; effective on 21 February 1983. Source: Journal Official de la Republique du Zaire, 1 May 1981.
Protection of Industrial property :- Loi n° 001 de 07 Janvier 1982 régissant la propriété industrielle. Source : CEPI, Législation et réglementation économiques et commerciales, 3ème éd., Kinshasa 2003, Ordonnance n° 89-173 du 31 Août 1989 portant mesures d’exécution de la Loi n° 001 de 07 Janvier 1982 régissant la propriété industrielle. Source : CEPI, Législation et réglementation économiques et commerciales, 3ème éd, Kinshasa 2003.
Appellations of Origin / Geographical Indications / Indications of Source: Law No. 82-001, January 1982, as above, under Patents (Geographical and Commercial Denominations: arts. 153 to 163). Source: WIPO (http://www.wipo.org).
Industrial Designs: As above, under Patents, Law No. 82-001, (Industrial Designs: arts 106 to 126). Source: WIPO (http://www.wipo.org).
The Investment Code of Zaire, Ordinance-Law No. 86-028; effective on 5 April 1986. Source: Journal Official de la Republique du Zaire, Numero special, April 1986.
Copyright: Ordonnance-Loi No. 86-033 d’avril 1986 portant protection des droits d’auteur et des droits voisins. Legislative Ordinance No. 86-033, April 1986. Source: WIPO (http://www.wipo.org).
Patents : Ordonnance-loi n° 86-033 du 5 Avril 1986 portant Protection des droits d’auteurs et des droits voisins. Source : Journal Officiel de la RDC, Numéro spécial, Avril 1986.
Ordonnance No. 89-173 d’août 1989 portant mesures d’exécution de la Loi No. 82-001. Ordinance No. 89-173, August 1989, implementing Law No. 82-001. Source: WIPO (http://www.wipo.org).
The Investment Code, Law n° 004/2002, of February 21, 2002. Source: Journal Officiel de la RDC, Numéro 6, 15 mars 2002 The Mining Code, Law n° 007/2002 of July 11, 2002. Source: Journal Officiel de la RDC, Numéro Spécial du 15 juillet 2002
World Investment Directory Volume X Africa 2008
202
The Forest Code, Law n° 011/2002, of August 29, 2002. Source: Journal Officiel de la RDC, Numéro Spécial du 31 Août 2002
The Labour Code, Law n° 015/2002, of October 16, 2002. Source: Journal Officiel de la RDC, Numéro Spécial du 25Octobre 2002
Exchange: New Regulation of exchange of February 13, 2003
II. International Framework
A. Democratic Republic of Congo is a party to the following multilateral and regional instruments:
Convention on the Recognition and Enforcement of Foreign Arbitral Awards of 1958, which entered into force on 7th June 1959.
Convention on the Settlement of Investment Disputes between States and Nationals of others States of 1965, entered into force on 14 October 1966.
Treaty for the Establishment of the Economic Community of Central African States ECCAS), 1982
Investment Code of the Economic Community of the Great Lakes Countries (CEPGL); 1982.
Convention Establishing the Multilateral Investment Guarantee Agency (MIGA) of 1985, entered into force on 12 April 1988.
Fourth ACP-EEC Convention (Lomé IV) of 1989, entered into force on 1st March 1990.
Southern Africa Development Community (SADC), signed on 17 August, 1992.Source: http://www.sadc.int/about_sadc/history.php
Common Market for Eastern and Southern Africa (COMESA) in 1994. Replaced the Preferential Trade Area for Eastern and Southern Africa (PTA). Source: http://www.comesa.int/about/Multi-language_content.2007-06-14.1154/en
Paris Convention for the Protection of Industrial Property of 1883 (Revised at Brussels in 1900, Washington in 1911, The Hague in 1925, London in 1934, Lisbon in 1958 and Stockholm in 1967, and as amended in 1979). Signed in 1994.
Agreement establishing the Trade Insurance Agency in Africa of 18 May 2000.
Partnership Agreement between the Members of The African, Caribbean and Pacific Group of States, of the one part and the European Community and its member states, of the other part signed in Cotonou, Benin on 23 June 2000.
B. Bilateral treaties
1. Bilateral investment treaties for the protection and promotion of investments: Germany 1969, France 1972, Switzerland 1972, United States 1984, Israel 1985, , Greece 1991, China 1997, Egypt 1998, Jordan 2004, South Africa 2004, Belgium / Luxembourg 2005, Korea, Republic of 2005, Italy 2006.
2. Bilateral treaties for the avoidance of double taxation: Spain 1969, South Africa 2005.
C. Other treaties:
Investment agreement for the COMESA Common Investment Area (2007).
Democratic Republic of the Congo
203
D. Sources of information
Official
Banque Central du Congo (www.bcc.cd).
Secondary
Economist Intelligence Unit (EIU) (various years). Country Profile: Democratic Republic of Congo
(London: EIU Ltd.).
_______________ (various years). Country Report: Democratic Republic of Congo (London: EIU Ltd.).
International Monetary Fund (IMF) (1996). Aftermath of the CFA Franc Devaluation (Washington D.C.: MF).
________________(2006). IMF's Sub-Saharan Africa Regional Economic Outlook, March 10, 2006. (Washington D.C.: IMF).
MacGaffey, Janet et al (2000). Congo-Paris: Transnational Traders on the Margins of the Law (Paris: International African Institute).
MacGaffey, Janet and Vwakyanakazi Mukohya (1991). The Real Economy of Zaire: The Contribution of
Smuggling and Other Unofficial Activities to National Wealth (Pennsylvania:University of Pennsylvania Press, Philadelphia).
Morisset, J. (2001). "Foreign direct investment in Africa: policies also matter", OECD Global Forum on International Investment (Paris: OECD).
OECD (2002). FDI from Developing Countries: A Vector for Trade and Development (Paris: OECD).
Meditz, Sandra and Tim, Merrill (eds.) (1994). Zaire: A Country Study, Library of Congress Research Division (Washington D.C.: Area handbook series).
United Nations Conference on Trade and Development (UNCTAD) (2002). FDI in Least Developed
Countries at a Glance (Geneva: UNCTAD) (www.unctad.org/en/subsites/dite/LDCs/ pdfs/Countries/chad.pdf).
______________(2005a). Investor-Disputes Arising from Investment Treaties: A Review. UNCTAD Series of International Investment Policies for Development (UNCTAD/ITE/IIT/2005/4).
_______________(2005b). A Survey of Support by Investment Promotion Agencies to Linkages. Advisory Studies No. 18 (UNCTAD/ITE/IPC/2005/12).
_______________(2005c). FDI in least developed countries at a glance: 2005/2006
(UNCTAD/ITE/IIA/2005/17).
United States Department of State, Bureau of African Affairs (1995). "Investment climate report: sub-Saharan Africa" (Washington D.C.: United States Department of State).
United States Trade Representative (2006). 2006 Comprehensive Report on U.S. Trade and Investment
Policy Toward Sub-Saharan Africa and Implementation of the Africa Growth and Opportunity Act:
The Sixth of Eight Annual Reports, May 2006. (Washington D.C.: US Government).
World Bank (1995). A Continent in Transition: Sub-Saharan Africa in the mid-1990s (Washington D.C.: World Bank).
World Investment Directory Volume X Africa 2008
204
World Bank/International Finance Corporation (2007). Doing Business 2008 Democratic Republic of Congo
(Washington D.C.: The World Bank Group).
Côte d’Ivoire
205
Côte d'Ivoire
A. Definitions and sources of data
Data on foreign direct investment (FDI) in Côte d'Ivoire can be obtained from the Banque Centrale des Etats de l'Afrique de l'Ouest. Additional data are provided by the International Monetary Fund in its balance-of-payments statistics. The Code of Investment (Law No 95-620 of 3 August 1995) does not provide specific definition of FDI.
The Government of Côte d'Ivoire encourages FDI, especially the type that contributes to the country's economic development. It provides exemption from tax and custom duties for such investors. There are no significant limits on foreign investment or difference in the treatment of foreign and national investors in terms of level of foreign ownership or sector of investment. Investments from outside the Franc zone require government approval. Purchases of real estate are permitted, but they must be reported to the government if they involve investment in an enterprise, branch, or corporation. The government must approve foreign exchange accounts and transfers to countries other than France, Monaco, West African Economic and Monetary Union (WAEMU), members of the Central African Economic and Monetary Community and Comoros. Other transfers are subject to many requirements, controls, and authorization depending on the transaction.
Besides oil reserves, Côte d'Ivoire has fertile agricultural land. The area is rich for producing oil palm, coconut, pineapple and banana plantations, and important rubber plantations. Further inland and to the west, occupying much of the southern half of the country, are the rich forest lands, where mostly cocoa and coffee are grown with domestic food staples such as rice, cassava, plantain, yams and maize. The infrastructure in the country is improving. The telecommunications industry has experienced extremely rapid growth since the granting of a first GSM license and the government’s sale of the national telecommunications company, Citelcom, to France Télécom. By 2001, Côte d'Ivoire Télécom was operating thousand of lines, much higher than at the time of privatization. There are three mobile-phone companies operating in the country: Société ivoirienne de mobiles (SIM, otherwise known as Ivoris), pan-African Telecel, and Cora de Comstar.
Ties with the rest of the world are good. The Côte d'Ivoire signed to the Convention on the Settlement of Investment Disputes between State and Nationals of other States on June 30, 1965 and is a member of other regional integration schemes. Among them are WAEMU, which imposes a common external tariff, the African Union, New Partnership for Africa's Development and the Economic Community of West African States. The country is eligible for the Cotonou Agreement for re-negotiating the trade partnership agreement between the African, Caribbean and Pacific countries with the European Union. Côte d'Ivoire is member of the Multilateral Investment Guarantee Agency and the World Trade Organization.
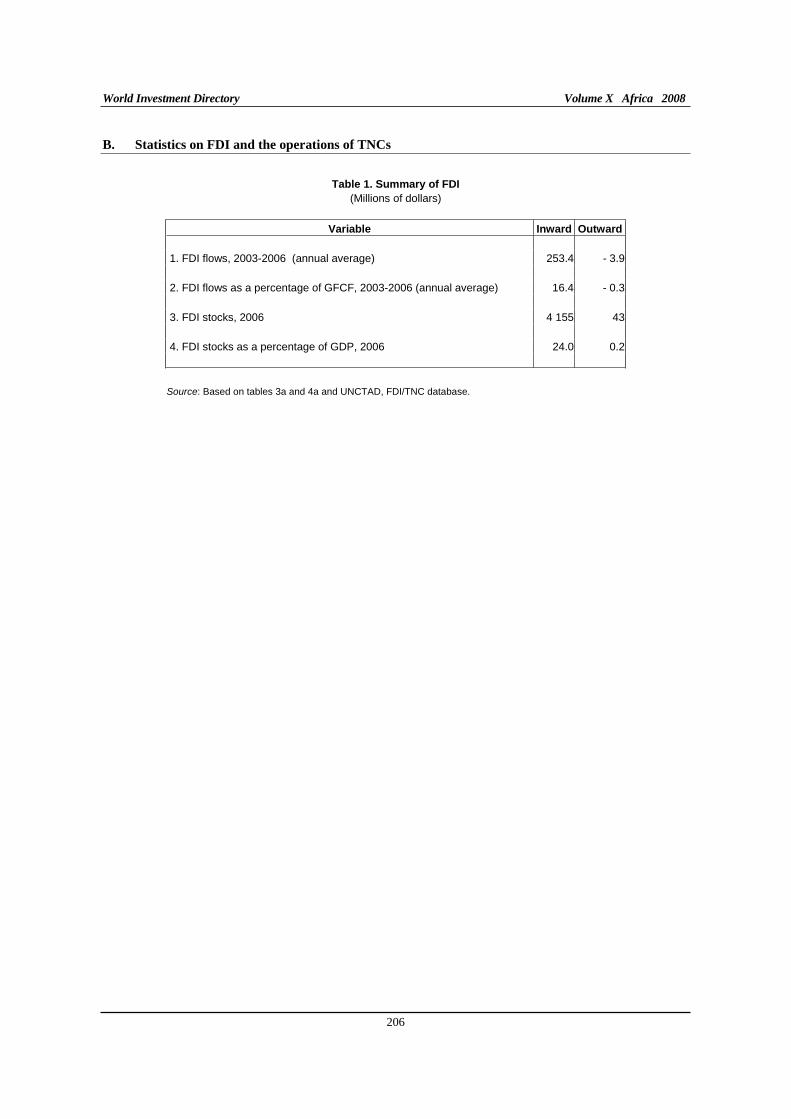
World Investment Directory Volume X Africa 2008
206
B. Statistics on FDI and the operations of TNCs
Table 1. Summary of FDI
(Millions of dollars)
Variable Inward Outward
1. FDI flows, 2003-2006 (annual average) 253.4 - 3.9
2. FDI flows as a percentage of GFCF, 2003-2006 (annual average) 16.4 - 0.3
3. FDI stocks, 2006 4 155 43
4. FDI stocks as a percentage of GDP, 2006 24.0 0.2
Source: Based on tables 3a and 4a and UNCTAD, FDI/TNC database.
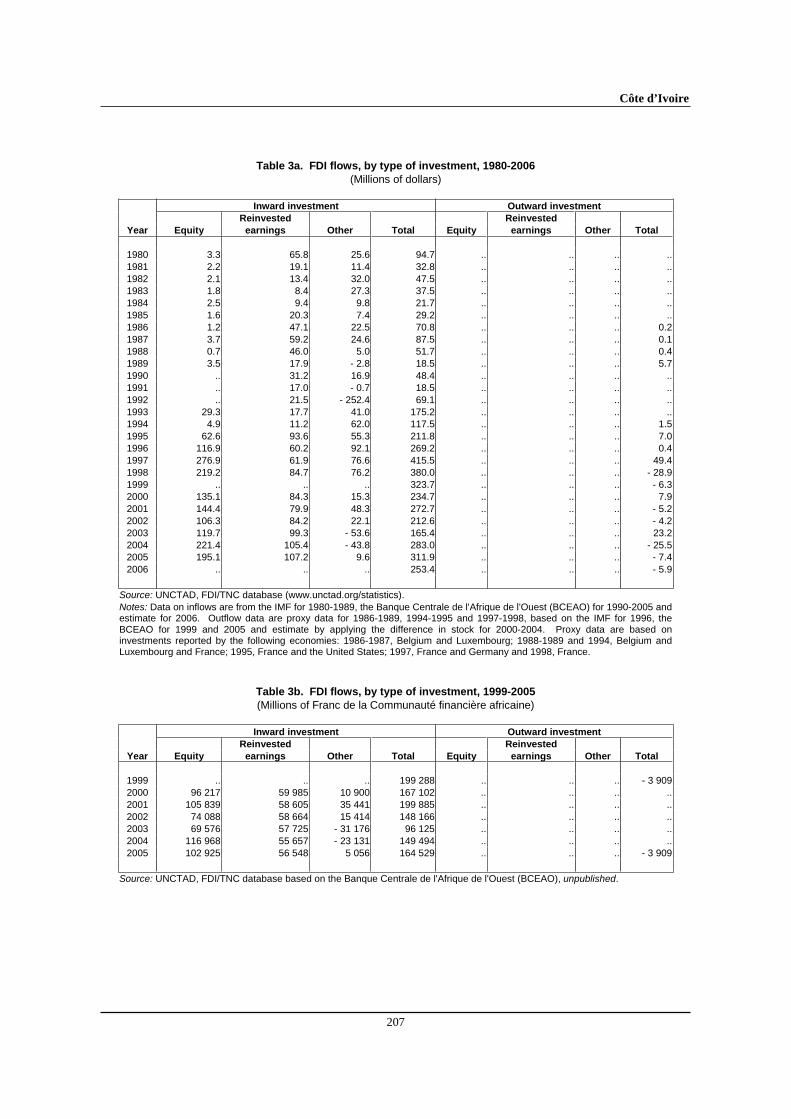
Côte d’Ivoire
207
Table 3a. FDI flows, by type of investment, 1980-2006
(Millions of dollars)
Inward investment Outward investment
Reinvested Reinvested
Year Equity earnings Other Total Equity earnings Other Total
1980 3.3 65.8 25.6 94.7 .. .. .. ..1981 2.2 19.1 11.4 32.8 .. .. .. ..1982 2.1 13.4 32.0 47.5 .. .. .. ..1983 1.8 8.4 27.3 37.5 .. .. .. ..1984 2.5 9.4 9.8 21.7 .. .. .. ..1985 1.6 20.3 7.4 29.2 .. .. .. ..1986 1.2 47.1 22.5 70.8 .. .. .. 0.21987 3.7 59.2 24.6 87.5 .. .. .. 0.11988 0.7 46.0 5.0 51.7 .. .. .. 0.41989 3.5 17.9 - 2.8 18.5 .. .. .. 5.71990 .. 31.2 16.9 48.4 .. .. .. ..1991 .. 17.0 - 0.7 18.5 .. .. .. ..1992 .. 21.5 - 252.4 69.1 .. .. .. ..1993 29.3 17.7 41.0 175.2 .. .. .. ..1994 4.9 11.2 62.0 117.5 .. .. .. 1.51995 62.6 93.6 55.3 211.8 .. .. .. 7.01996 116.9 60.2 92.1 269.2 .. .. .. 0.41997 276.9 61.9 76.6 415.5 .. .. .. 49.41998 219.2 84.7 76.2 380.0 .. .. .. - 28.91999 .. .. .. 323.7 .. .. .. - 6.32000 135.1 84.3 15.3 234.7 .. .. .. 7.92001 144.4 79.9 48.3 272.7 .. .. .. - 5.22002 106.3 84.2 22.1 212.6 .. .. .. - 4.22003 119.7 99.3 - 53.6 165.4 .. .. .. 23.22004 221.4 105.4 - 43.8 283.0 .. .. .. - 25.52005 195.1 107.2 9.6 311.9 .. .. .. - 7.42006 .. .. .. 253.4 .. .. .. - 5.9
Source: UNCTAD, FDI/TNC database (www.unctad.org/statistics). Notes: Data on inflows are from the IMF for 1980-1989, the Banque Centrale de l'Afrique de l'Ouest (BCEAO) for 1990-2005 and estimate for 2006. Outflow data are proxy data for 1986-1989, 1994-1995 and 1997-1998, based on the IMF for 1996, the BCEAO for 1999 and 2005 and estimate by applying the difference in stock for 2000-2004. Proxy data are based on investments reported by the following economies: 1986-1987, Belgium and Luxembourg; 1988-1989 and 1994, Belgium and Luxembourg and France; 1995, France and the United States; 1997, France and Germany and 1998, France.
Table 3b. FDI flows, by type of investment, 1999-2005
(Millions of Franc de la Communauté financière africaine)
Inward investment Outward investment
Reinvested Reinvested
Year Equity earnings Other Total Equity earnings Other Total
1999 .. .. .. 199 288 .. .. .. - 3 9092000 96 217 59 985 10 900 167 102 .. .. .. ..2001 105 839 58 605 35 441 199 885 .. .. .. ..2002 74 088 58 664 15 414 148 166 .. .. .. ..2003 69 576 57 725 - 31 176 96 125 .. .. .. ..2004 116 968 55 657 - 23 131 149 494 .. .. .. ..2005 102 925 56 548 5 056 164 529 .. .. .. - 3 909
Source: UNCTAD, FDI/TNC database based on the Banque Centrale de l'Afrique de l'Ouest (BCEAO), unpublished.
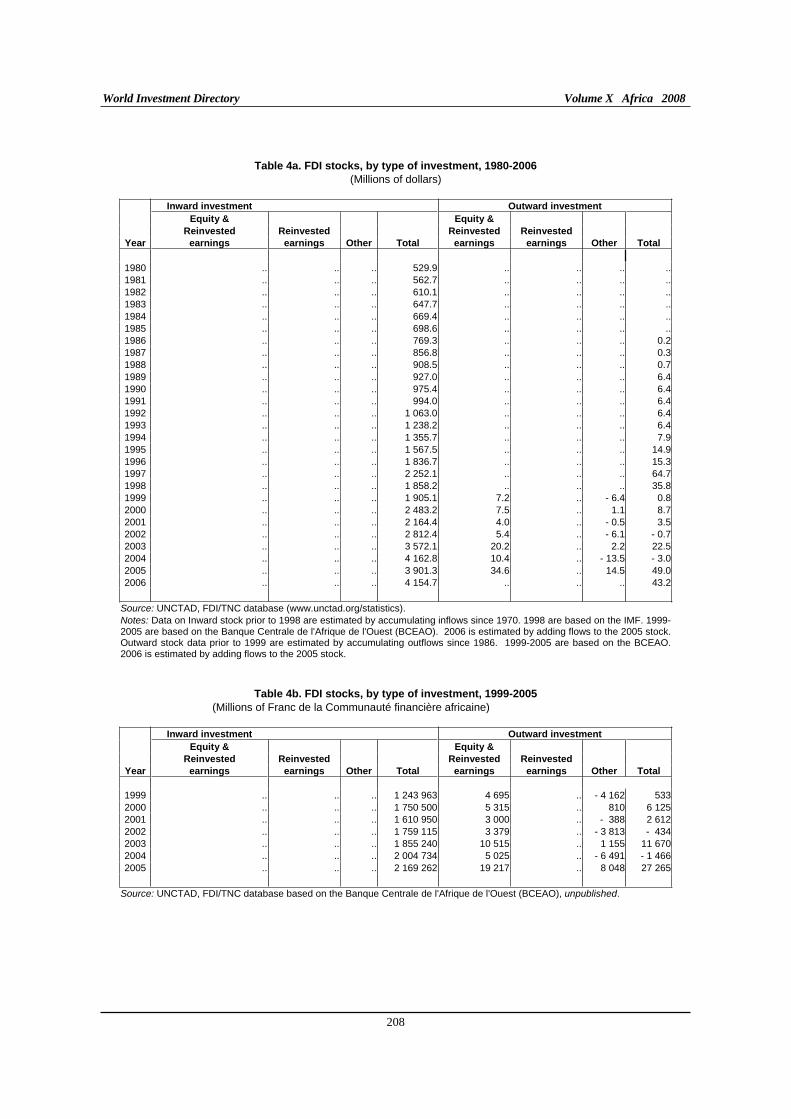
World Investment Directory Volume X Africa 2008
208
Table 4a. FDI stocks, by type of investment, 1980-2006
(Millions of dollars)
Inward investment Outward investment
Equity & Equity &
Reinvested Reinvested Reinvested Reinvested
Year earnings earnings Other Total earnings earnings Other Total
1980 .. .. .. 529.9 .. .. .. ..1981 .. .. .. 562.7 .. .. .. ..1982 .. .. .. 610.1 .. .. .. ..1983 .. .. .. 647.7 .. .. .. ..1984 .. .. .. 669.4 .. .. .. ..1985 .. .. .. 698.6 .. .. .. ..1986 .. .. .. 769.3 .. .. .. 0.21987 .. .. .. 856.8 .. .. .. 0.31988 .. .. .. 908.5 .. .. .. 0.71989 .. .. .. 927.0 .. .. .. 6.41990 .. .. .. 975.4 .. .. .. 6.41991 .. .. .. 994.0 .. .. .. 6.41992 .. .. .. 1 063.0 .. .. .. 6.41993 .. .. .. 1 238.2 .. .. .. 6.41994 .. .. .. 1 355.7 .. .. .. 7.91995 .. .. .. 1 567.5 .. .. .. 14.91996 .. .. .. 1 836.7 .. .. .. 15.31997 .. .. .. 2 252.1 .. .. .. 64.71998 .. .. .. 1 858.2 .. .. .. 35.81999 .. .. .. 1 905.1 7.2 .. - 6.4 0.82000 .. .. .. 2 483.2 7.5 .. 1.1 8.72001 .. .. .. 2 164.4 4.0 .. - 0.5 3.52002 .. .. .. 2 812.4 5.4 .. - 6.1 - 0.72003 .. .. .. 3 572.1 20.2 .. 2.2 22.52004 .. .. .. 4 162.8 10.4 .. - 13.5 - 3.02005 .. .. .. 3 901.3 34.6 .. 14.5 49.02006 .. .. .. 4 154.7 .. .. .. 43.2
Source: UNCTAD, FDI/TNC database (www.unctad.org/statistics). Notes: Data on Inward stock prior to 1998 are estimated by accumulating inflows since 1970. 1998 are based on the IMF. 1999-2005 are based on the Banque Centrale de l'Afrique de l'Ouest (BCEAO). 2006 is estimated by adding flows to the 2005 stock. Outward stock data prior to 1999 are estimated by accumulating outflows since 1986. 1999-2005 are based on the BCEAO. 2006 is estimated by adding flows to the 2005 stock.
Table 4b. FDI stocks, by type of investment, 1999-2005
(Millions of Franc de la Communauté financière africaine)
Inward investment Outward investment
Equity & Equity &
Reinvested Reinvested Reinvested Reinvested
Year earnings earnings Other Total earnings earnings Other Total
1999 .. .. .. 1 243 963 4 695 .. - 4 162 5332000 .. .. .. 1 750 500 5 315 .. 810 6 1252001 .. .. .. 1 610 950 3 000 .. - 388 2 6122002 .. .. .. 1 759 115 3 379 .. - 3 813 - 4342003 .. .. .. 1 855 240 10 515 .. 1 155 11 6702004 .. .. .. 2 004 734 5 025 .. - 6 491 - 1 4662005 .. .. .. 2 169 262 19 217 .. 8 048 27 265
Source: UNCTAD, FDI/TNC database based on the Banque Centrale de l'Afrique de l'Ouest (BCEAO), unpublished.
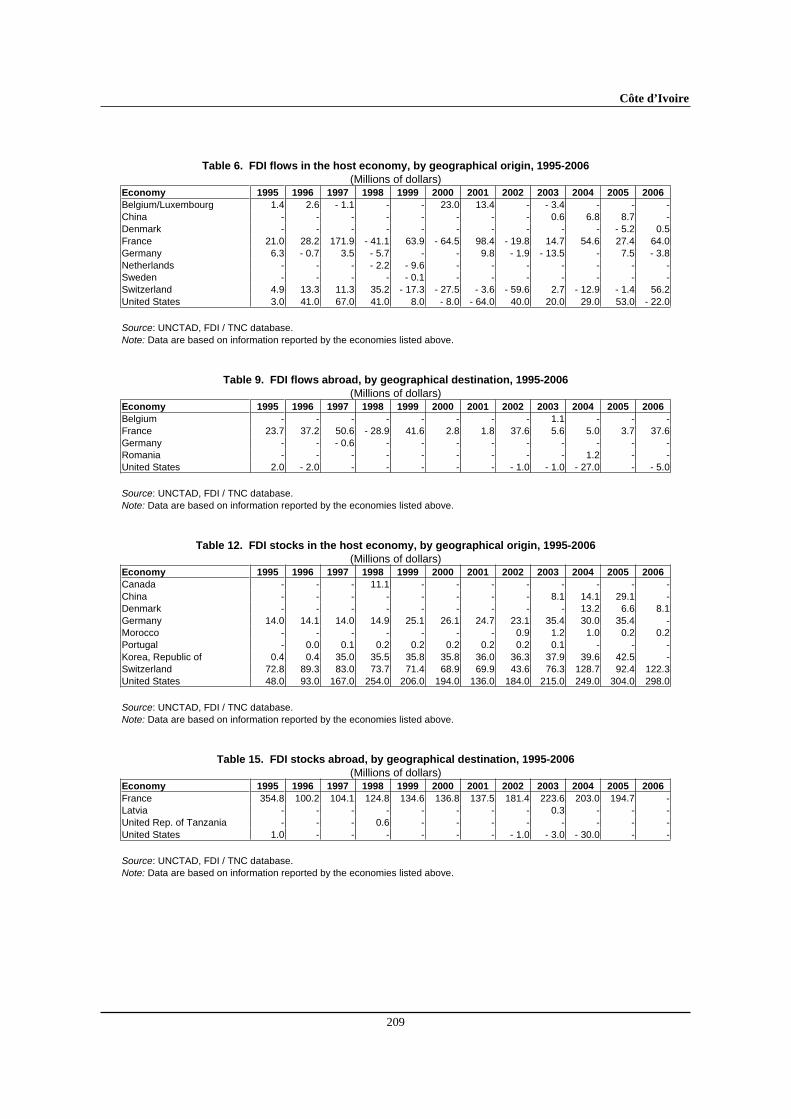
Côte d’Ivoire
209
Table 6. FDI flows in the host economy, by geographical origin, 1995-2006
(Millions of dollars) Economy 1995 1996 1997 1998 1999 2000 2001 2002 2003 2004 2005 2006
Belgium/Luxembourg 1.4 2.6 - 1.1 - - 23.0 13.4 - - 3.4 - - -China - - - - - - - - 0.6 6.8 8.7 -Denmark - - - - - - - - - - - 5.2 0.5France 21.0 28.2 171.9 - 41.1 63.9 - 64.5 98.4 - 19.8 14.7 54.6 27.4 64.0Germany 6.3 - 0.7 3.5 - 5.7 - - 9.8 - 1.9 - 13.5 - 7.5 - 3.8Netherlands - - - - 2.2 - 9.6 - - - - - - -Sweden - - - - - 0.1 - - - - - - -Switzerland 4.9 13.3 11.3 35.2 - 17.3 - 27.5 - 3.6 - 59.6 2.7 - 12.9 - 1.4 56.2United States 3.0 41.0 67.0 41.0 8.0 - 8.0 - 64.0 40.0 20.0 29.0 53.0 - 22.0
Source: UNCTAD, FDI / TNC database. Note: Data are based on information reported by the economies listed above.
Table 9. FDI flows abroad, by geographical destination, 1995-2006
(Millions of dollars) Economy 1995 1996 1997 1998 1999 2000 2001 2002 2003 2004 2005 2006
Belgium - - - - - - - - 1.1 - - -France 23.7 37.2 50.6 - 28.9 41.6 2.8 1.8 37.6 5.6 5.0 3.7 37.6Germany - - - 0.6 - - - - - - - - -Romania - - - - - - - - - 1.2 - -United States 2.0 - 2.0 - - - - - - 1.0 - 1.0 - 27.0 - - 5.0
Source: UNCTAD, FDI / TNC database. Note: Data are based on information reported by the economies listed above.
Table 12. FDI stocks in the host economy, by geographical origin, 1995-2006
(Millions of dollars) Economy 1995 1996 1997 1998 1999 2000 2001 2002 2003 2004 2005 2006
Canada - - - 11.1 - - - - - - - -China - - - - - - - - 8.1 14.1 29.1 -Denmark - - - - - - - - - 13.2 6.6 8.1Germany 14.0 14.1 14.0 14.9 25.1 26.1 24.7 23.1 35.4 30.0 35.4 -Morocco - - - - - - - 0.9 1.2 1.0 0.2 0.2Portugal - 0.0 0.1 0.2 0.2 0.2 0.2 0.2 0.1 - - -Korea, Republic of 0.4 0.4 35.0 35.5 35.8 35.8 36.0 36.3 37.9 39.6 42.5 -Switzerland 72.8 89.3 83.0 73.7 71.4 68.9 69.9 43.6 76.3 128.7 92.4 122.3United States 48.0 93.0 167.0 254.0 206.0 194.0 136.0 184.0 215.0 249.0 304.0 298.0
Source: UNCTAD, FDI / TNC database. Note: Data are based on information reported by the economies listed above.
Table 15. FDI stocks abroad, by geographical destination, 1995-2006
(Millions of dollars) Economy 1995 1996 1997 1998 1999 2000 2001 2002 2003 2004 2005 2006
France 354.8 100.2 104.1 124.8 134.6 136.8 137.5 181.4 223.6 203.0 194.7 -Latvia - - - - - - - - 0.3 - - -United Rep. of Tanzania - - - 0.6 - - - - - - - -United States 1.0 - - - - - - - 1.0 - 3.0 - 30.0 - -
Source: UNCTAD, FDI / TNC database. Note: Data are based on information reported by the economies listed above.
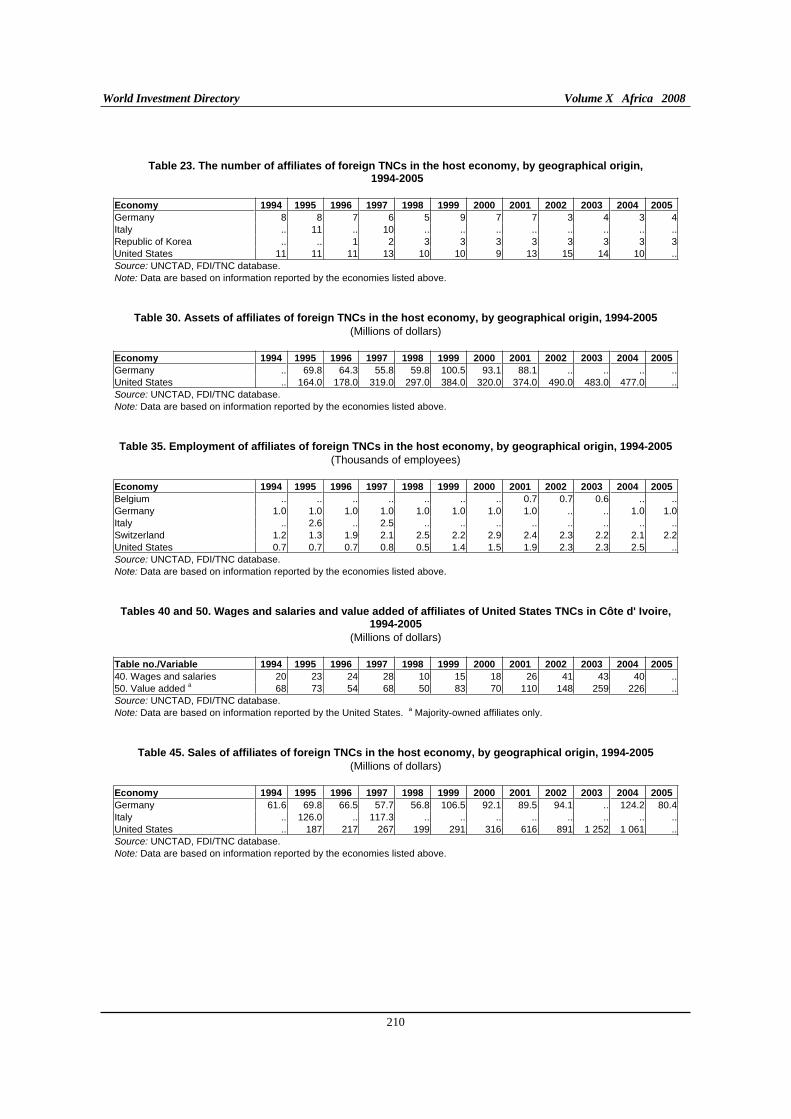
World Investment Directory Volume X Africa 2008
210
Table 23. The number of affiliates of foreign TNCs in the host economy, by geographical origin, 1994-2005
Economy 1994 1995 1996 1997 1998 1999 2000 2001 2002 2003 2004 2005
Germany 8 8 7 6 5 9 7 7 3 4 3 4Italy .. 11 .. 10 .. .. .. .. .. .. .. ..Republic of Korea .. .. 1 2 3 3 3 3 3 3 3 3United States 11 11 11 13 10 10 9 13 15 14 10 ..Source: UNCTAD, FDI/TNC database. Note: Data are based on information reported by the economies listed above.
Table 30. Assets of affiliates of foreign TNCs in the host economy, by geographical origin, 1994-2005
(Millions of dollars) Economy 1994 1995 1996 1997 1998 1999 2000 2001 2002 2003 2004 2005
Germany .. 69.8 64.3 55.8 59.8 100.5 93.1 88.1 .. .. .. ..United States .. 164.0 178.0 319.0 297.0 384.0 320.0 374.0 490.0 483.0 477.0 ..Source: UNCTAD, FDI/TNC database. Note: Data are based on information reported by the economies listed above. Table 35. Employment of affiliates of foreign TNCs in the host economy, by geographical origin, 1994-2005
(Thousands of employees) Economy 1994 1995 1996 1997 1998 1999 2000 2001 2002 2003 2004 2005
Belgium .. .. .. .. .. .. .. 0.7 0.7 0.6 .. ..Germany 1.0 1.0 1.0 1.0 1.0 1.0 1.0 1.0 .. .. 1.0 1.0Italy .. 2.6 .. 2.5 .. .. .. .. .. .. .. ..Switzerland 1.2 1.3 1.9 2.1 2.5 2.2 2.9 2.4 2.3 2.2 2.1 2.2United States 0.7 0.7 0.7 0.8 0.5 1.4 1.5 1.9 2.3 2.3 2.5 ..Source: UNCTAD, FDI/TNC database. Note: Data are based on information reported by the economies listed above. Tables 40 and 50. Wages and salaries and value added of affiliates of United States TNCs in Côte d' Ivoire,
1994-2005
(Millions of dollars) Table no./Variable 1994 1995 1996 1997 1998 1999 2000 2001 2002 2003 2004 2005
40. Wages and salaries 20 23 24 28 10 15 18 26 41 43 40 ..50. Value added a 68 73 54 68 50 83 70 110 148 259 226 ..Source: UNCTAD, FDI/TNC database. Note: Data are based on information reported by the United States. a Majority-owned affiliates only.
Table 45. Sales of affiliates of foreign TNCs in the host economy, by geographical origin, 1994-2005
(Millions of dollars) Economy 1994 1995 1996 1997 1998 1999 2000 2001 2002 2003 2004 2005
Germany 61.6 69.8 66.5 57.7 56.8 106.5 92.1 89.5 94.1 .. 124.2 80.4Italy .. 126.0 .. 117.3 .. .. .. .. .. .. .. ..United States .. 187 217 267 199 291 316 616 891 1 252 1 061 ..Source: UNCTAD, FDI/TNC database. Note: Data are based on information reported by the economies listed above.
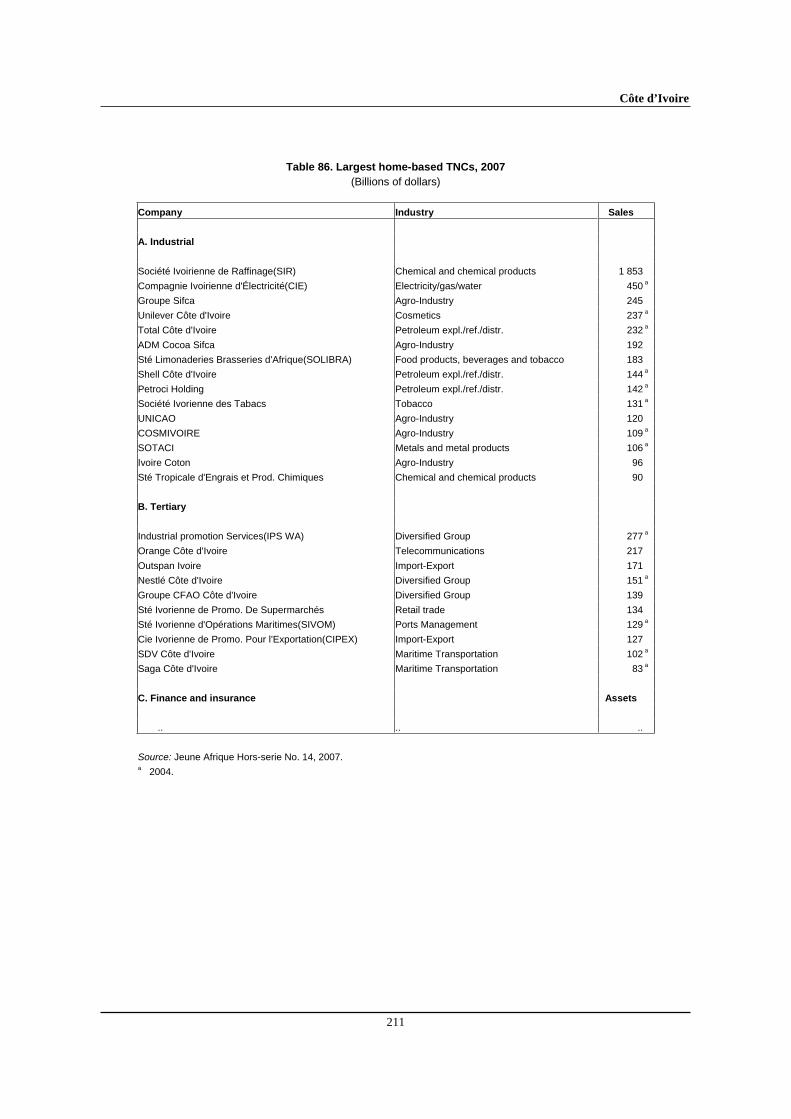
Côte d’Ivoire
211
Table 86. Largest home-based TNCs, 2007
(Billions of dollars)
Company Industry Sales
A. Industrial
Société Ivoirienne de Raffinage(SIR) Chemical and chemical products 1 853
Compagnie Ivoirienne d'Électricité(CIE) Electricity/gas/water 450 a
Groupe Sifca Agro-Industry 245
Unilever Côte d'Ivoire Cosmetics 237 a
Total Côte d'Ivoire Petroleum expl./ref./distr. 232 a
ADM Cocoa Sifca Agro-Industry 192
Sté Limonaderies Brasseries d'Afrique(SOLIBRA) Food products, beverages and tobacco 183
Shell Côte d'Ivoire Petroleum expl./ref./distr. 144 a
Petroci Holding Petroleum expl./ref./distr. 142 a
Société Ivorienne des Tabacs Tobacco 131 a
UNICAO Agro-Industry 120
COSMIVOIRE Agro-Industry 109 a
SOTACI Metals and metal products 106 a
Ivoire Coton Agro-Industry 96
Sté Tropicale d'Engrais et Prod. Chimiques Chemical and chemical products 90
B. Tertiary
Industrial promotion Services(IPS WA) Diversified Group 277 a
Orange Côte d'Ivoire Telecommunications 217
Outspan Ivoire Import-Export 171
Nestlé Côte d'Ivoire Diversified Group 151 a
Groupe CFAO Côte d'Ivoire Diversified Group 139
Sté Ivorienne de Promo. De Supermarchés Retail trade 134
Sté Ivorienne d'Opérations Maritimes(SIVOM) Ports Management 129 a
Cie Ivorienne de Promo. Pour l'Exportation(CIPEX) Import-Export 127
SDV Côte d'Ivoire Maritime Transportation 102 a
Saga Côte d'Ivoire Maritime Transportation 83 a
C. Finance and insurance Assets
.. .. ..
Source: Jeune Afrique Hors-serie No. 14, 2007. a 2004.
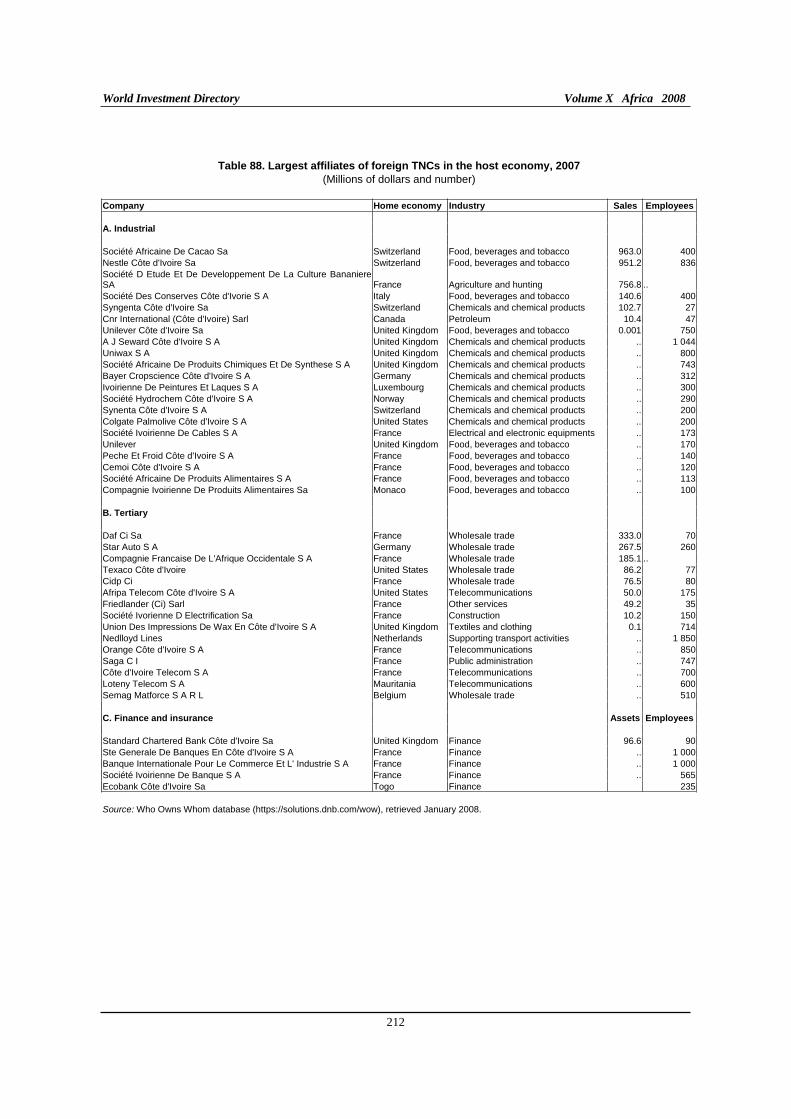
World Investment Directory Volume X Africa 2008
212
Table 88. Largest affiliates of foreign TNCs in the host economy, 2007
(Millions of dollars and number) Company Home economy Industry Sales Employees
A. Industrial
Société Africaine De Cacao Sa Switzerland Food, beverages and tobacco 963.0 400Nestle Côte d'Ivoire Sa Switzerland Food, beverages and tobacco 951.2 836Société D Etude Et De Developpement De La Culture Bananiere SA France Agriculture and hunting 756.8 .. Société Des Conserves Côte d'Ivorie S A Italy Food, beverages and tobacco 140.6 400Syngenta Côte d'Ivoire Sa Switzerland Chemicals and chemical products 102.7 27Cnr International (Côte d'Ivoire) Sarl Canada Petroleum 10.4 47Unilever Côte d'Ivoire Sa United Kingdom Food, beverages and tobacco 0.001 750A J Seward Côte d'Ivoire S A United Kingdom Chemicals and chemical products .. 1 044Uniwax S A United Kingdom Chemicals and chemical products .. 800Société Africaine De Produits Chimiques Et De Synthese S A United Kingdom Chemicals and chemical products .. 743Bayer Cropscience Côte d'Ivoire S A Germany Chemicals and chemical products .. 312Ivoirienne De Peintures Et Laques S A Luxembourg Chemicals and chemical products .. 300Société Hydrochem Côte d'Ivoire S A Norway Chemicals and chemical products .. 290Synenta Côte d'Ivoire S A Switzerland Chemicals and chemical products .. 200Colgate Palmolive Côte d'Ivoire S A United States Chemicals and chemical products .. 200Société Ivoirienne De Cables S A France Electrical and electronic equipments .. 173Unilever United Kingdom Food, beverages and tobacco .. 170Peche Et Froid Côte d'Ivoire S A France Food, beverages and tobacco .. 140Cemoi Côte d'Ivoire S A France Food, beverages and tobacco .. 120Société Africaine De Produits Alimentaires S A France Food, beverages and tobacco .. 113Compagnie Ivoirienne De Produits Alimentaires Sa Monaco Food, beverages and tobacco .. 100 B. Tertiary
Daf Ci Sa France Wholesale trade 333.0 70Star Auto S A Germany Wholesale trade 267.5 260Compagnie Francaise De L'Afrique Occidentale S A France Wholesale trade 185.1 .. Texaco Côte d'Ivoire United States Wholesale trade 86.2 77Cidp Ci France Wholesale trade 76.5 80Afripa Telecom Côte d'Ivoire S A United States Telecommunications 50.0 175Friedlander (Ci) Sarl France Other services 49.2 35Société Ivorienne D Electrification Sa France Construction 10.2 150Union Des Impressions De Wax En Côte d'Ivoire S A United Kingdom Textiles and clothing 0.1 714Nedlloyd Lines Netherlands Supporting transport activities .. 1 850Orange Côte d'Ivoire S A France Telecommunications .. 850Saga C I France Public administration .. 747Côte d'Ivoire Telecom S A France Telecommunications .. 700Loteny Telecom S A Mauritania Telecommunications .. 600Semag Matforce S A R L Belgium Wholesale trade .. 510 C. Finance and insurance Assets Employees
Standard Chartered Bank Côte d'Ivoire Sa United Kingdom Finance 96.6 90Ste Generale De Banques En Côte d'Ivoire S A France Finance .. 1 000Banque Internationale Pour Le Commerce Et L' Industrie S A France Finance .. 1 000Société Ivoirienne De Banque S A France Finance .. 565Ecobank Côte d'Ivoire Sa Togo Finance 235
Source: Who Owns Whom database (https://solutions.dnb.com/wow), retrieved January 2008.
Côte d’Ivoire
213
C. Legal frameworks for transnational corporations
The legal instrument for the regulation of the activities of transnational corporations and foreign direct investment in Côte d'Ivoire include a range of national, bilateral and international measures. They are as follows:
I. National framework
Decree No. 64-292 of 1 August 1964 involving accounting rules for commercial enterprises. Source: Official Gazette of 20 August 1964.
Labour Law No. 64-290 of 1 August 1964. Source: Official Gazette of 17 April 1964.
Law No. 70-489 of 3 August 1970 which sets forth the Petroleum Code. Source: Official Gazette of 12 August 1970, p. 1275.
Law No. 73-368 of 26 July 1973 on the Private Investment Regime in the Tourist Industry. Source: ICSID, p. 63 (French) and p. 67 (English translation).
Decree No. 73-401 of 22 August 1973 implementing Law No. 73-368. Source: Ministere de l'Economie, des Finances et du Plan, "La Côte d'Ivoire en Chiffre", Edition 1970-80, Abidjan, pp. 314-315.
Law No. 84-1238 of 8 November 1984 concerning export grants for products manufactured in Côte d'Ivoire. Source: Official Gazette of 22 November 1984, p. 616.
Law No. 90- 589 of 25 July 1990 regulating Banking in Côte d'Ivoire. Source: FIDAfrica-Core d'Ivoire 1990.
Code of Investment-Law No 95-620 of 3 August 1995, repeals Law No. 84-1230 of 8 November 1984. Sources: Ministry of Industry and Trade, Investir en Côte d'Ivoire - Code des Investissements. Not published in the Journal Official de la Republique de Côte d'Ivoire at the date of the present publication. Also in CEPICI-27/10/95, August 1995.
Copyright: Loi No. 96-564, sur la protection des oeuvres de l’esprit et aux droits des auteurs, des artistes-interprètes et des producteurs de phonogrammes et vidéogrammes, juillet 1996. Law No. 96-564, July 1996. Source: WIPO (http://www.wipo.org).
II. International Framework
A. Côte d'Ivoire is a party to the following multilateral and regional instruments:
Convention on the Recognition and Enforcement of Foreign Arbitral Awards of 1958, which entered into force on 7th June 1959.
Convention on the Settlement of Investment Disputes between States and Nationals of other States of 1965. Entered into force on 14 October 1966.
Patents: Bangui Agreement, March 1977 (Annex I), as last amended in February 1999.
World Investment Directory Volume X Africa 2008
214
Source: WIPO (http://www.wipo.org).
Industrial Designs: Bangui Agreement, March 1977 (Annexes II and IV), as last amended in February 1999. Source: WIPO (http://www.wipo.org).
Trade Marks: Bangui Agreement, March 1977 (Annex III), as last amended in February 1999. Source: WIPO (http://www.wipo.org).
Bangui Agreement, March 1977 (Annex VII), as last amended in February 1999. Source: WIPO (http://www.wipo.org).
Convention Establishing the Multilateral Investment Guarantee Agency of 1985, entered into force on 12 April 1988.
Paris Convention for the Protection of Industrial Property of 1883 (Revised at Brussels in 1900, Washington in 1911, The Hague in 1925, London in 1934, Lisbon in 1958 and Stockholm in 1967, and as amended in 1979). Signed in 1994.
Marrakesh Agreement Establishing the World Trade Organisation of 15 April 1994. Entered into force on 1 January 1995. Agreement on Trade-Related Investment Measures. General Agreement on Trade in Services. Agreement on Trade Related Aspects of Intellectual Property Rights.
Revised Treaty of the Economic Community of West African States (ECOWAS) signed 24 July 1993. Source: http://www.worldtradelaw.net/fta/agreements/ecowasfta.pdf.
B. Bilateral treaties
1. Bilateral investment treaties for the protection and promotion of investments: Switzerland 1962, Netherlands 1965, Sweden 1965, Germany 1966, Italy 1969, Tunisia 1995, United Kingdom 1995, Ghana 1997, Belgium/Luxembourg 1999, China 2002.
2. Bilateral treaties for the avoidance of double taxation: France 1966, Belgium 1977, Norway 1978, Germany 1979, Italy 1982, Canada 1983, United Kingdom 1985, Switzerland 1987, Tunisia 1999, Morocco 2006.
Côte d’Ivoire
215
D. Sources of information
Official
Banque Centrale des Etats de l'Afrique de l'Ouest (www.bceao.int)
Secondary
Alschuler, L.R. (1980). "Multinationals and the development of periphery capitalism in the Ivory Coast, 1960-1975", Discussion Paper No. 808 (Ottawa, International development studies group, University of Ottawa).
Economist Intelligence Unit (EIU) (various years). Country Profile: Côte d'Ivoire (London: EIU Ltd.).
_____________ (various years). Country Report: Côte d'Ivoire (London: EIU Ltd.).
Harrison, A., (1994). "The role of multinationals in economic development: the benefits of FDI", Columbia
Journal of World Business, 29(4), Winter, pp 6-11.
International Monetary Fund (IMF) (2006). IMF's Sub-Saharan Africa Regional Economic Outlook, March 10, 2006. (Washington D.C.: IMF).
Ogunleye, Eric Kehinde (2008) "Exchange rate volatility and foreign direct investment inflows in selected Sub-Saharan African Countries" (PhD Thesis, University of Ibadan).
Soderbom, M. and F. Teal (2004). "Size and Efficiency in Africa Manufacturing firms: Evidence from Firm-Level Panel Data." Journal of Development Economics, 73. pp 369 - 394.
United Nations Conference on Trade and Development (UNCTAD) (2005a). Investor-Disputes Arising
from Investment Treaties: A Review. UNCTAD Series of International Investment Policies for Development (UNCTAD/ITE/IIT/2005/4).
__________(2005b). A Survey of Support by Investment Promotion Agencies to Linkages. Advisory Studies No. 18 (UNCTAD/ITE/IPC/2005/12).
United States Trade Representative (2006). 2006 Comprehensive Report on U.S. Trade and Investment
Policy Toward Sub-Saharan Africa and Implementation of the Africa Growth and Opportunity Act:
The Sixth of Eight Annual Reports, May 2006. (Washington D.C.: US Government).
World Bank/International Finance Corporation (2007). Doing Business 2008 Côte d'Ivoire (Washington D.C.: The World Bank Group).

Djibouti
217
Djibouti
A. Definitions and sources of data
According to the Chambre Internationale de Commerce et d'Industrie de Djibouti, there is no official definition of foreign direct investment (FDI). The country's Investment Code of 1988 (Law 88/AN/84), however, contains a general definition of foreign investment. Data on FDI in the country were obtained from Banque Centrale de Djibouti.
In Djibouti inward FDI is allowed without restriction except for small crafts industries. The government grants equal treatment to investments regardless of origin. In principle there is no screening of investment or other discriminatory mechanisms. Particular sectors, most notably public utilities, are state-owned and not open to investors. The Finance Ministry issues a license only to investors that possess an approved investor visa. Djibouti has no restrictions on foreign exchange or on the inflow and outflow of cash. Residents and non-residents may hold foreign exchange accounts and there are no restrictions on payments or transfers.
Djibouti belongs to many regional integration schemes. It has vigorously promoted the seven-member Intergovernmental Authority on Development. It is also a member of the Common Market for Eastern and Southern Africa, African Union, New Partnership for Africa's Development and an eligible member of the United States' market access for African countries - the African Growth and Opportunity Act initiative, the Cotonou Agreement for renegotiating the partnership trade agreement between the African, Caribbean and Pacific countries with the European Union (EU) and the Everything But Arms initiative. Djibouti is among the 34 African least developed countries that have the option of entering the EU generalized system of preferences and is a member of the World Trade Organization.
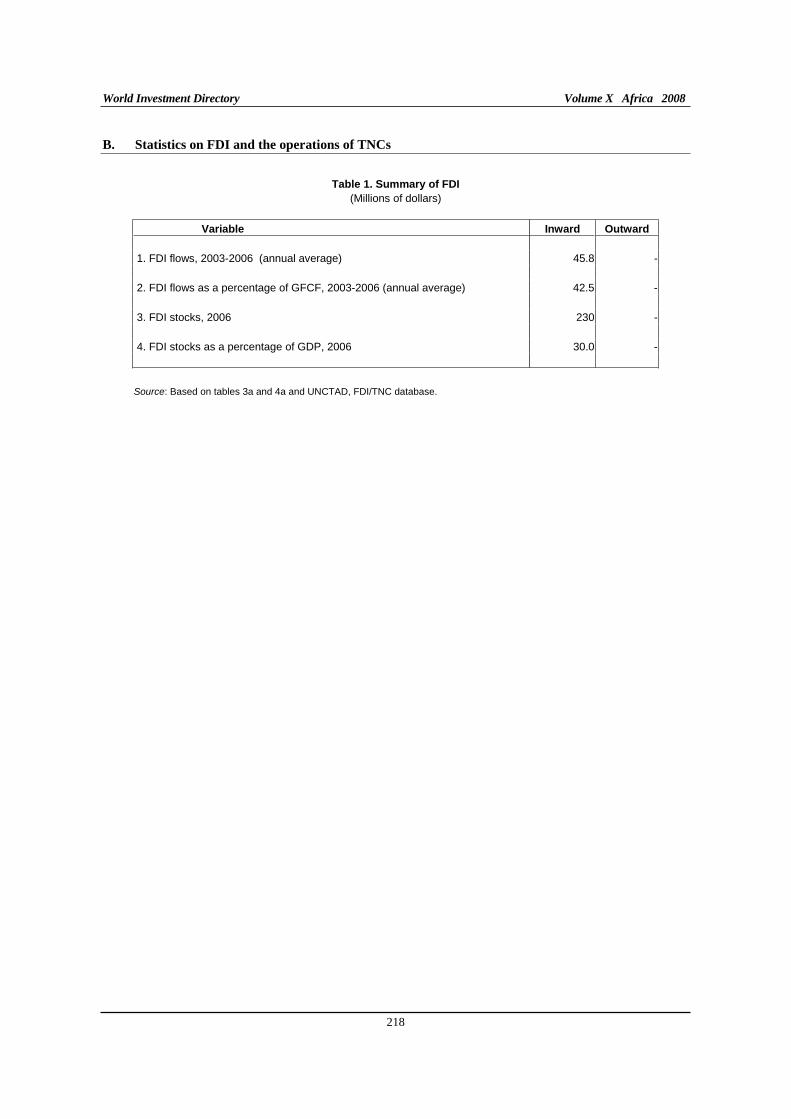
World Investment Directory Volume X Africa 2008
218
B. Statistics on FDI and the operations of TNCs
Table 1. Summary of FDI
(Millions of dollars)
Variable Inward Outward
1. FDI flows, 2003-2006 (annual average) 45.8 - 2. FDI flows as a percentage of GFCF, 2003-2006 (annual average) 42.5 - 3. FDI stocks, 2006 230 - 4. FDI stocks as a percentage of GDP, 2006 30.0 - Source: Based on tables 3a and 4a and UNCTAD, FDI/TNC database.
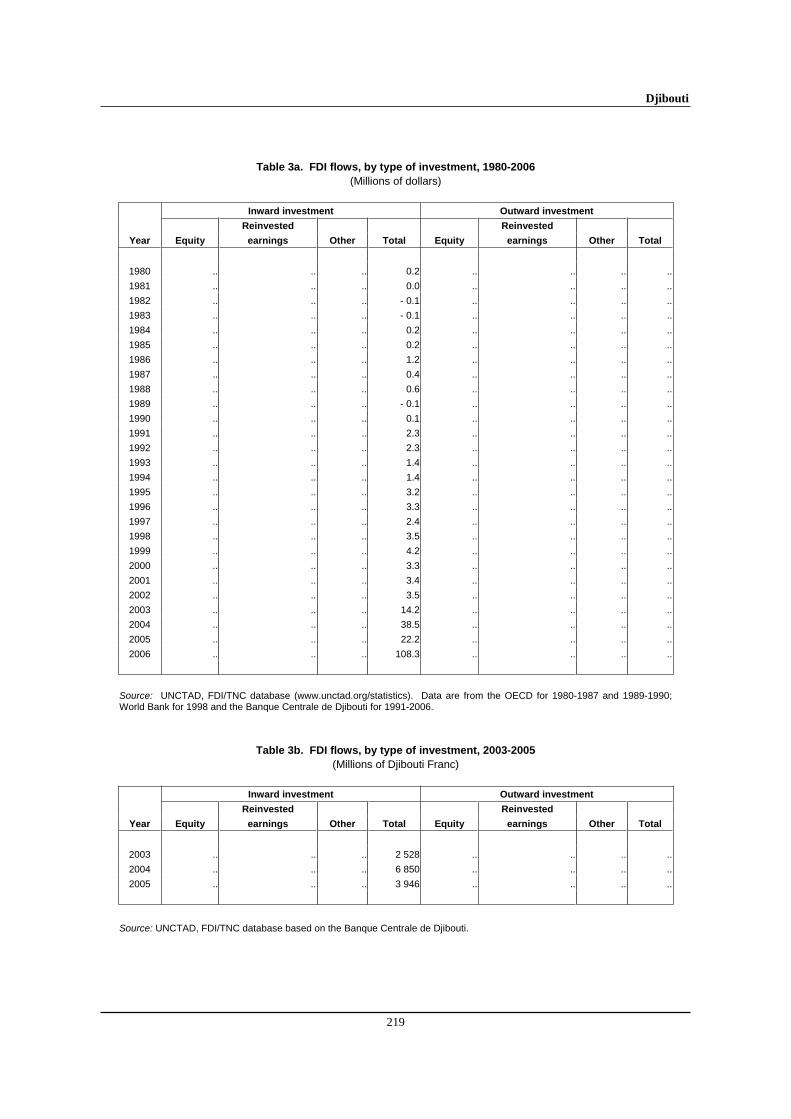
Djibouti
219
Table 3a. FDI flows, by type of investment, 1980-2006
(Millions of dollars)
Inward investment Outward investment
Reinvested Reinvested
Year Equity earnings Other Total Equity earnings Other Total
1980 .. .. .. 0.2 .. .. .. ..
1981 .. .. .. 0.0 .. .. .. ..
1982 .. .. .. - 0.1 .. .. .. ..
1983 .. .. .. - 0.1 .. .. .. ..
1984 .. .. .. 0.2 .. .. .. ..
1985 .. .. .. 0.2 .. .. .. ..
1986 .. .. .. 1.2 .. .. .. ..
1987 .. .. .. 0.4 .. .. .. ..
1988 .. .. .. 0.6 .. .. .. ..
1989 .. .. .. - 0.1 .. .. .. ..
1990 .. .. .. 0.1 .. .. .. ..
1991 .. .. .. 2.3 .. .. .. ..
1992 .. .. .. 2.3 .. .. .. ..
1993 .. .. .. 1.4 .. .. .. ..
1994 .. .. .. 1.4 .. .. .. ..
1995 .. .. .. 3.2 .. .. .. ..
1996 .. .. .. 3.3 .. .. .. ..
1997 .. .. .. 2.4 .. .. .. ..
1998 .. .. .. 3.5 .. .. .. ..
1999 .. .. .. 4.2 .. .. .. ..
2000 .. .. .. 3.3 .. .. .. ..
2001 .. .. .. 3.4 .. .. .. ..
2002 .. .. .. 3.5 .. .. .. ..
2003 .. .. .. 14.2 .. .. .. ..
2004 .. .. .. 38.5 .. .. .. ..
2005 .. .. .. 22.2 .. .. .. ..
2006 .. .. .. 108.3 .. .. .. ..
Source: UNCTAD, FDI/TNC database (www.unctad.org/statistics). Data are from the OECD for 1980-1987 and 1989-1990; World Bank for 1998 and the Banque Centrale de Djibouti for 1991-2006.
Table 3b. FDI flows, by type of investment, 2003-2005
(Millions of Djibouti Franc)
Inward investment Outward investment
Reinvested Reinvested
Year Equity earnings Other Total Equity earnings Other Total
2003 .. .. .. 2 528 .. .. .. ..
2004 .. .. .. 6 850 .. .. .. ..
2005 .. .. .. 3 946 .. .. .. ..
Source: UNCTAD, FDI/TNC database based on the Banque Centrale de Djibouti.
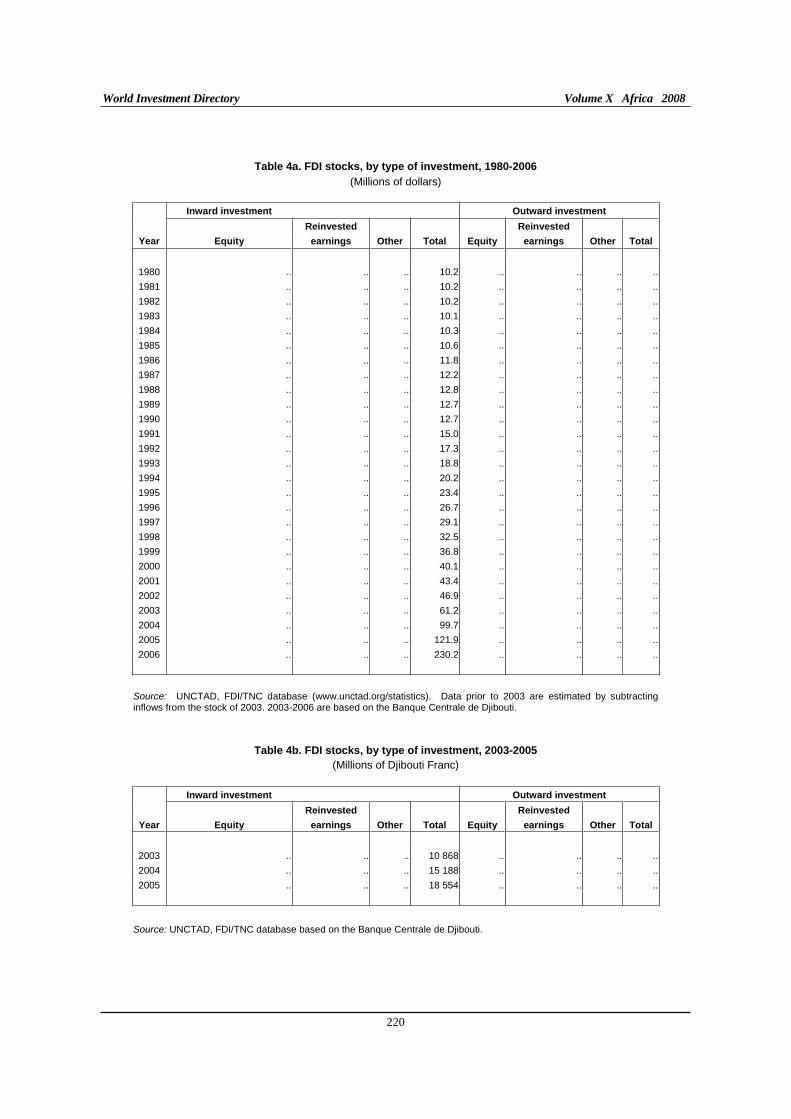
World Investment Directory Volume X Africa 2008
220
Table 4a. FDI stocks, by type of investment, 1980-2006
(Millions of dollars)
Inward investment Outward investment
Reinvested Reinvested
Year Equity earnings Other Total Equity earnings Other Total
1980 .. .. .. 10.2 .. .. .. ..
1981 .. .. .. 10.2 .. .. .. ..
1982 .. .. .. 10.2 .. .. .. ..
1983 .. .. .. 10.1 .. .. .. ..
1984 .. .. .. 10.3 .. .. .. ..
1985 .. .. .. 10.6 .. .. .. ..
1986 .. .. .. 11.8 .. .. .. ..
1987 .. .. .. 12.2 .. .. .. ..
1988 .. .. .. 12.8 .. .. .. ..
1989 .. .. .. 12.7 .. .. .. ..
1990 .. .. .. 12.7 .. .. .. ..
1991 .. .. .. 15.0 .. .. .. ..
1992 .. .. .. 17.3 .. .. .. ..
1993 .. .. .. 18.8 .. .. .. ..
1994 .. .. .. 20.2 .. .. .. ..
1995 .. .. .. 23.4 .. .. .. ..
1996 .. .. .. 26.7 .. .. .. ..
1997 .. .. .. 29.1 .. .. .. ..
1998 .. .. .. 32.5 .. .. .. ..
1999 .. .. .. 36.8 .. .. .. ..
2000 .. .. .. 40.1 .. .. .. ..
2001 .. .. .. 43.4 .. .. .. ..
2002 .. .. .. 46.9 .. .. .. ..
2003 .. .. .. 61.2 .. .. .. ..
2004 .. .. .. 99.7 .. .. .. ..
2005 .. .. .. 121.9 .. .. .. ..
2006 .. .. .. 230.2 .. .. .. ..
Source: UNCTAD, FDI/TNC database (www.unctad.org/statistics). Data prior to 2003 are estimated by subtracting inflows from the stock of 2003. 2003-2006 are based on the Banque Centrale de Djibouti.
Table 4b. FDI stocks, by type of investment, 2003-2005
(Millions of Djibouti Franc)
Inward investment Outward investment
Reinvested Reinvested
Year Equity earnings Other Total Equity earnings Other Total
2003 .. .. .. 10 868 .. .. .. ..
2004 .. .. .. 15 188 .. .. .. ..
2005 .. .. .. 18 554 .. .. .. ..
Source: UNCTAD, FDI/TNC database based on the Banque Centrale de Djibouti.
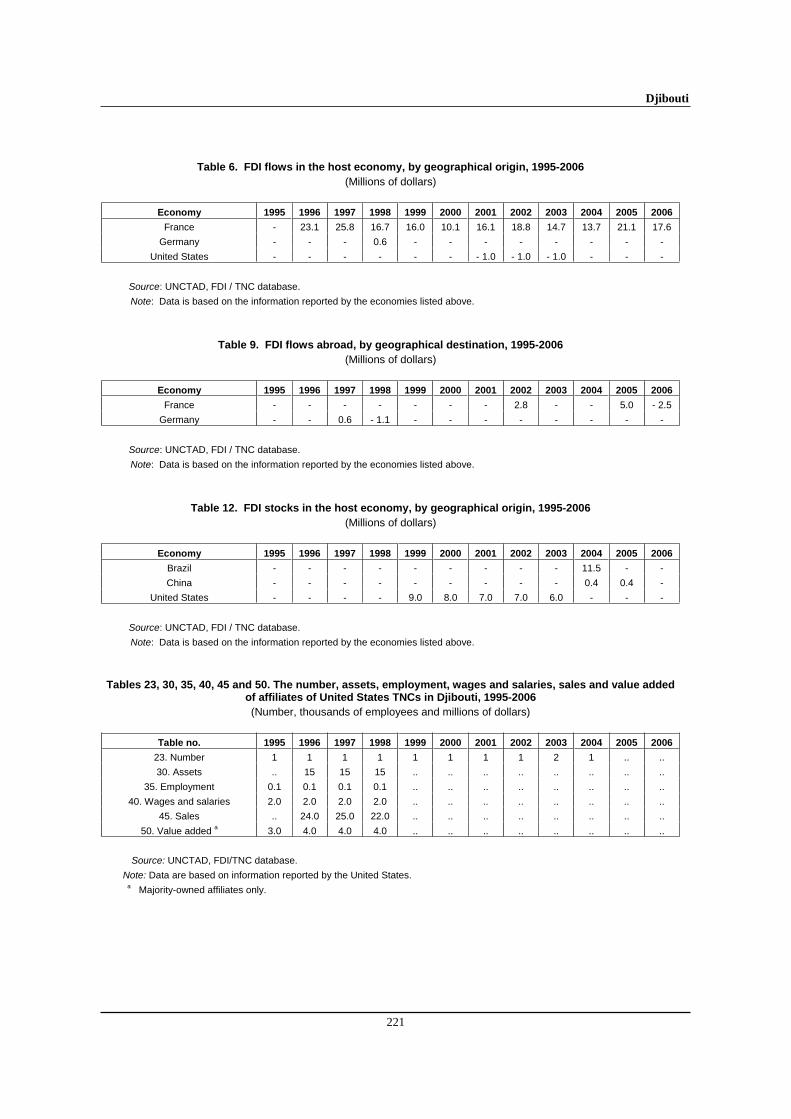
Djibouti
221
Table 6. FDI flows in the host economy, by geographical origin, 1995-2006
(Millions of dollars)
Economy 1995 1996 1997 1998 1999 2000 2001 2002 2003 2004 2005 2006
France - 23.1 25.8 16.7 16.0 10.1 16.1 18.8 14.7 13.7 21.1 17.6
Germany - - - 0.6 - - - - - - - -
United States - - - - - - - 1.0 - 1.0 - 1.0 - - -
Source: UNCTAD, FDI / TNC database.
Note: Data is based on the information reported by the economies listed above.
Table 9. FDI flows abroad, by geographical destination, 1995-2006
(Millions of dollars)
Economy 1995 1996 1997 1998 1999 2000 2001 2002 2003 2004 2005 2006
France - - - - - - - 2.8 - - 5.0 - 2.5
Germany - - 0.6 - 1.1 - - - - - - - -
Source: UNCTAD, FDI / TNC database.
Note: Data is based on the information reported by the economies listed above.
Table 12. FDI stocks in the host economy, by geographical origin, 1995-2006
(Millions of dollars)
Economy 1995 1996 1997 1998 1999 2000 2001 2002 2003 2004 2005 2006
Brazil - - - - - - - - - 11.5 - -
China - - - - - - - - - 0.4 0.4 -
United States - - - - 9.0 8.0 7.0 7.0 6.0 - - -
Source: UNCTAD, FDI / TNC database.
Note: Data is based on the information reported by the economies listed above.
Tables 23, 30, 35, 40, 45 and 50. The number, assets, employment, wages and salaries, sales and value added of affiliates of United States TNCs in Djibouti, 1995-2006
(Number, thousands of employees and millions of dollars)
Table no. 1995 1996 1997 1998 1999 2000 2001 2002 2003 2004 2005 2006
23. Number 1 1 1 1 1 1 1 1 2 1 .. ..
30. Assets .. 15 15 15 .. .. .. .. .. .. .. ..
35. Employment 0.1 0.1 0.1 0.1 .. .. .. .. .. .. .. ..
40. Wages and salaries 2.0 2.0 2.0 2.0 .. .. .. .. .. .. .. ..
45. Sales .. 24.0 25.0 22.0 .. .. .. .. .. .. .. ..
50. Value added a 3.0 4.0 4.0 4.0 .. .. .. .. .. .. .. ..
Source: UNCTAD, FDI/TNC database.
Note: Data are based on information reported by the United States.a Majority-owned affiliates only.
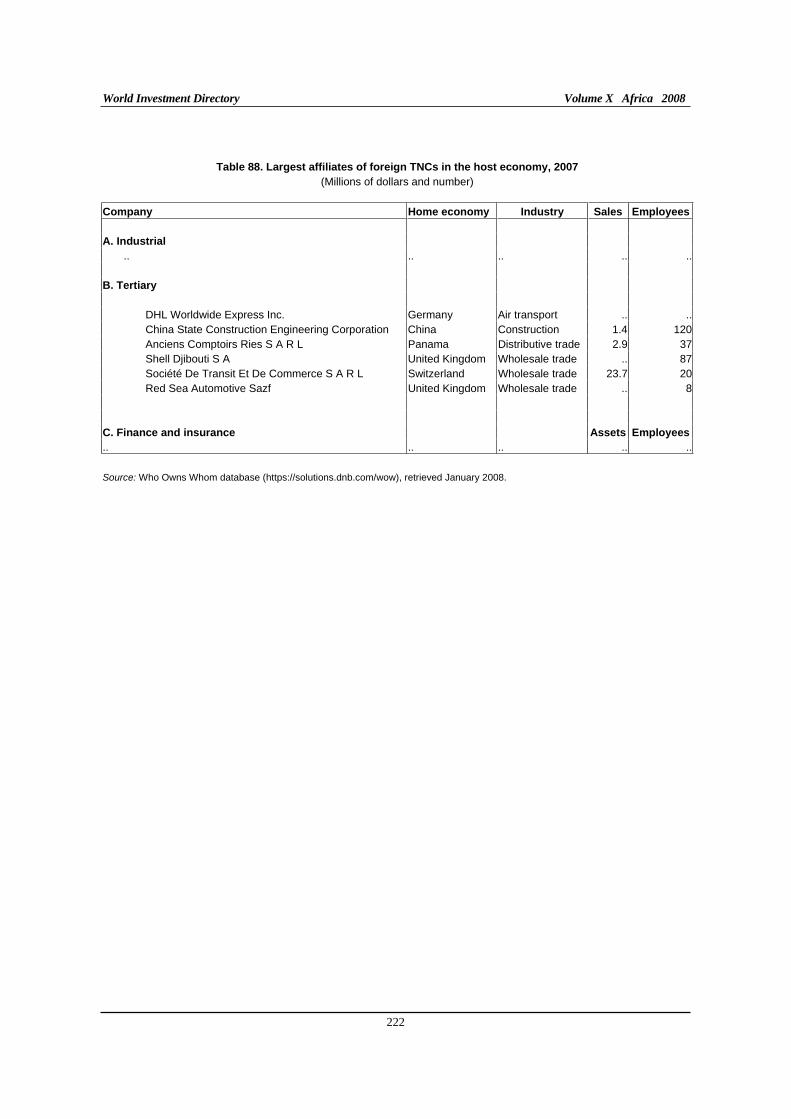
World Investment Directory Volume X Africa 2008
222
Table 88. Largest affiliates of foreign TNCs in the host economy, 2007
(Millions of dollars and number)
Company Home economy Industry Sales Employees
A. Industrial
.. .. .. .. ..
B. Tertiary
DHL Worldwide Express Inc. Germany Air transport .. ..China State Construction Engineering Corporation China Construction 1.4 120Anciens Comptoirs Ries S A R L Panama Distributive trade 2.9 37Shell Djibouti S A United Kingdom Wholesale trade .. 87Société De Transit Et De Commerce S A R L Switzerland Wholesale trade 23.7 20Red Sea Automotive Sazf United Kingdom Wholesale trade .. 8
C. Finance and insurance Assets Employees
.. .. .. .. ..
Source: Who Owns Whom database (https://solutions.dnb.com/wow), retrieved January 2008.
Djibouti
223
C. Legal frameworks for transnational corporations
The legal instruments for the regulation of the activities of transnational corporations and foreign investors at national, bilateral and multilateral levels in Djibouti include:
I. National framework
Law No. 52/AN/78 of 9 January 1979 concerning territorial sea, contiguous zone. EEZ, maritime boundaries and fishing Source: http://www.fao.org/docrep/V9982E/v9982e16.htm
Ordinance No. 80-018/PR of 14 February 1980 together with Ordinance No. 82-71/PR of July 1982 on the Limited Liability Companies in the Free Zone. Source: Republique de Djibouti. Chambre Internationale de Commerce et d'Industrie de Djibouti.
Law No. 2121AN/82 of 18 January 1982 establishing Code of Maritime Affairs Source: http://www.fao.org/docrep/V9982E/v9982e16.htm
Law No. 2517AN71982 on the Social and Economic Orientations of the Republic of Djibouti. Source: Marches Tropicaux, Fourth Trimester of 1982.
Investment Code. Law 88/AN/84. 1er. L. of 13 February 1984 concerning the Investment Code. Source:Official Journal of the Republic of Djibouti of 29 February 1984.
Law 65/AN/94. 3eme. L. concerning the Regime for Industrial Free Zones. Source: Official Journal of the Republic of Djibouti of 7 December 1994.
Restrictive Law on Port Operations, 2003. Source: http://www.ethioguide.com/aa-ethioguide/ethioguide/Fortune/Fortune%2049.htm
II. International Framework
A. Djibouti is a party to the following multilateral and regional instruments:
Convention on the Recognition and Enforcement of Foreign Arbitral Awards of 1958, which entered into force on 7th June 1959.
Convention Establishing the Inter-Arab Investment Guarantee Corporation of May 1971. Entered into force in April 1974.
Agreement for the Promotion, Protection and Guarantee of Investment Among Member States of the Organization of Islamic Conference of I June 1981; entered into force on 23 September 1986.
Unified Agreement for the Investment of Arab Capital in the Arab States of 1982.
Fourth ACP - EEC Convention (Lome IV) of 1989, entered into force on 1st March 1990.
Charter on a Regime of Multinational Industrial Enterprises (MIEs) in the Preferential Trade Area for Eastern and Southern African States (PTA), signed on 21 November 1990, entered into force August 1995. Source: Preferential Trade Area for Eastern ans Southern African States: Report of the Sixteenth Meeting of the Council of Ministers, 17-19 November, 1990, Mbabane, Swaziland (PTA/CM/XVI/2).
World Investment Directory Volume X Africa 2008
224
Articles of Agreement of the Islamic Corporation for the Insurance of Investment and Export Credit of 19 February 1992. Entered into force on 1 August 1994.
Treaty Establishing the Market for Eastern and Southern Africa (COMESA), 1993.
Paris Convention for the Protection of Industrial Property of 1883 (Revised at Brussels in 1900, Washington in 1911, The Hague in 1925, London in 1934, Lisbon in 1958 and Stockholm in 1967, and as amended in 1979). Signed in 1994.
Marrakesh Agreement Establishing the World Trade Organisation of 15 April 1994. Entered into force on 1 January 1995. Agreement on Trade-Related Investment Measures. General Agreement on Trade in Services. Agreement on Trade Related Aspects of Intellectual Property Rights.
Treaty for the Establishment of the East African Community, 30 November 1999.
Partnership Agreement between the Members of The African, Caribbean and Pacific Group of States, of the one part and the European Community and its member states, of the other part signed in Cotonou, Benin on 23 June 2000.
B. Bilateral treaties
1. Bilateral investment treaties for the protection and promotion of investments: Egypt 1998, Malaysia 1998, Switzerland 2001, China 2003, India 2003, Italy 2006.
2. Bilateral treaties for the avoidance of double taxation: ..
C. Other treaties:
Investment agreement for the COMESA Common Investment Area (2007).
Djibouti
225
D. Sources of information
Official
Ministry of Finance (www.ministere-finances.dj).
Chambre Internationale de Commerce et d'Industrie de Djibouti (www.djiboutichamber.com).
Secondary
Economist Intelligence Unit (EIU) (various years). Country Profile: Djibouti (London: EIU Ltd.).
____________ (various years). Country Report: Djibouti (London: EIU Ltd.).
International Monetary Fund (IMF) (2006). IMF's Sub-Saharan Africa Regional Economic Outlook, March 10, 2006. (Washington D.C.: IMF).
Morisset, J. (2001). "Foreign direct investment in Africa: policies also matter", OECD Global Forum on International Investment (Paris: OECD).
Nabli, K., Mustapha (2003). "Challenges to private investments in the middle East, North Africa Region (MENA)" (Washington D.C.: World Bank-MENA).
Soderbom, M. and F. Teal (2004). "Size and Efficiency in Africa Manufacturing firms: Evidence from Firm-Level Panel Data." Journal of Development Economics, 73. pp 369 - 394.
United Nations Conference on Trade and Development (UNCTAD) (2002). FDI in Least Developed
Countries at a Glance (Geneva: UNCTAD) (www.unctad.org/en/subsites/dite/LDCs/ pdfs/Countries/chad.pdf).
____________(2005a). Investor-Disputes Arising from Investment Treaties: A Review. UNCTAD Series of International Investment Policies for Development (UNCTAD/ITE/IIT/2005/4).
____________(2005b). A Survey of Support by Investment Promotion Agencies to Linkages. Advisory Studies No. 18 (UNCTAD/ITE/IPC/2005/12).
____________(2005c). FDI in least developed countries at a glance: 2005/2006
(UNCTAD/ITE/IIA/2005/17).
United States Department of State, Bureau of African Affairs (1995). "Investment climate report: sub-Saharan Africa" (Washington D.C.: United States Department of State).
United States Trade Representative (2006). 2006 Comprehensive Report on U.S. Trade and Investment
Policy Toward Sub-Saharan Africa and Implementation of the Africa Growth and Opportunity Act:
The Sixth of Eight Annual Reports, May 2006. (Washington D.C.: US Government).
World Bank (2002a). Global Economic Prospects and the Developing Countries 2003: Investing to Unlock
Opportunities (Washington D.C.: World Bank).
_____________(2002b). Global Development Finance: International Finance and the Poorest Developing
Countries (Washington D.C.: World Bank).
_____________(2003). "Djibouti: Les progrès du développement", Note de presentation – Middle East and North Africa Region (Washington D.C.: World Bank-MENA).
World Investment Directory Volume X Africa 2008
226
World Bank/International Finance Corporation (2007). Doing Business 2008 Djibouti (Washington D.C.: The World Bank Group).

Egypt
227
Egypt
A. Definitions and sources of data
The Egyptian Investment Code (Investment Law No. 230/1989) does not provide an explicit definition of foreign direct investment (FDI). The code, however, defines foreign capital as the invested funds owned by a natural person enjoying the nationality of a foreign country except the Arab countries, or by a juridical person of which the majority of the capital is owned by persons enjoying the nationality of a foreign country. The Central Bank of Egypt and the General Authority for Free Zones and Investment (GAFI) provide data on FDI in the country. The International Monetary Fund also provides FDI data in its balance-of-payment statistics.
Historically petroleum attracted a large bulk of FDI into Egypt, although privatization and liberalization that picked up in the 1990s have prompted FDI in a range of industries such as cement, telecommunications and tourism. The Government of Egypt has completed the sale of many public enterprises slated for privatization but the programme is still on-going. The government plans to accelerate the programme in the "strategic" areas, including telecommunications and other utilities (for example, the Egyptian Electricity Authority).
FDI continues to be at the heart of the economic strategy for sustaining high growth rates. GAFI, a one-stop shop for foreign investors in Egypt was incorporated into the Ministry of Economy and Foreign Trade in October 1999. The Egyptian Government implemented Law 8 of 1997 to help foreign investment by creating a unified and clear package of guarantees and incentives. The Investment Code amended in 1995 has ended pre-incorporation approval and replaced it with a notification requirement for investment, directing investment to targeted economic sectors and promoting decentralization of industry from crowded geographical areas. The law allows full foreign ownership and guarantees the right to remit income earned in Egypt and to repatriate capital. Other key provisions include: the guarantee against confiscation, sequestration and nationalization; the right to own land; the right to maintain foreign currency bank accounts; freedom from administrative attachment; the right to repatriate capital and profits; and equal treatment regardless of nationality. Under this law, approval is nearly automatic for specified sectors. The Egyptian legal system provides protection for real and personal property, but laws on real estate ownership are complex and titles to real property may be difficult to set up.
Egypt signed to the Convention on the Settlement of Investment Disputes between State and Nationals of other States on February 11, 1972 and association agreements with many countries and regional groupings. It has signed the Euro-Mediterranean Association Agreement with the European Union (EU). This agreement will improve bilateral relations with its largest trading partner, raise Egyptian exports to EU and encourage EU investment into Egypt. Progressive elimination of all tariffs on over a third of Egypt’s imports will significantly increase competition in domestic markets, resulting in lower costs and promoting productivity gains in local industries. Egypt has bilateral treaties with Albania, Argentina, Belgium-Luxembourg, China, Czech Republic, Finland, France, Germany, Greece, Hungary, Indonesia, Italy, Japan, Kazakhstan, Republic of Korea, Morocco, Netherlands, Poland, Romania, Spain, Sri Lanka, Sudan, Sweden, Switzerland, Tunisia, Turkmenistan, Uganda, Ukraine, United Kingdom, United States, Uzbekistan and Federal Republic of Yugoslavia. Egypt is a member of the Arab Maghreb Union, African Union, New Partnership for Africa's Development, Multilateral Investment Guarantee Agency and the World Trade Organization.
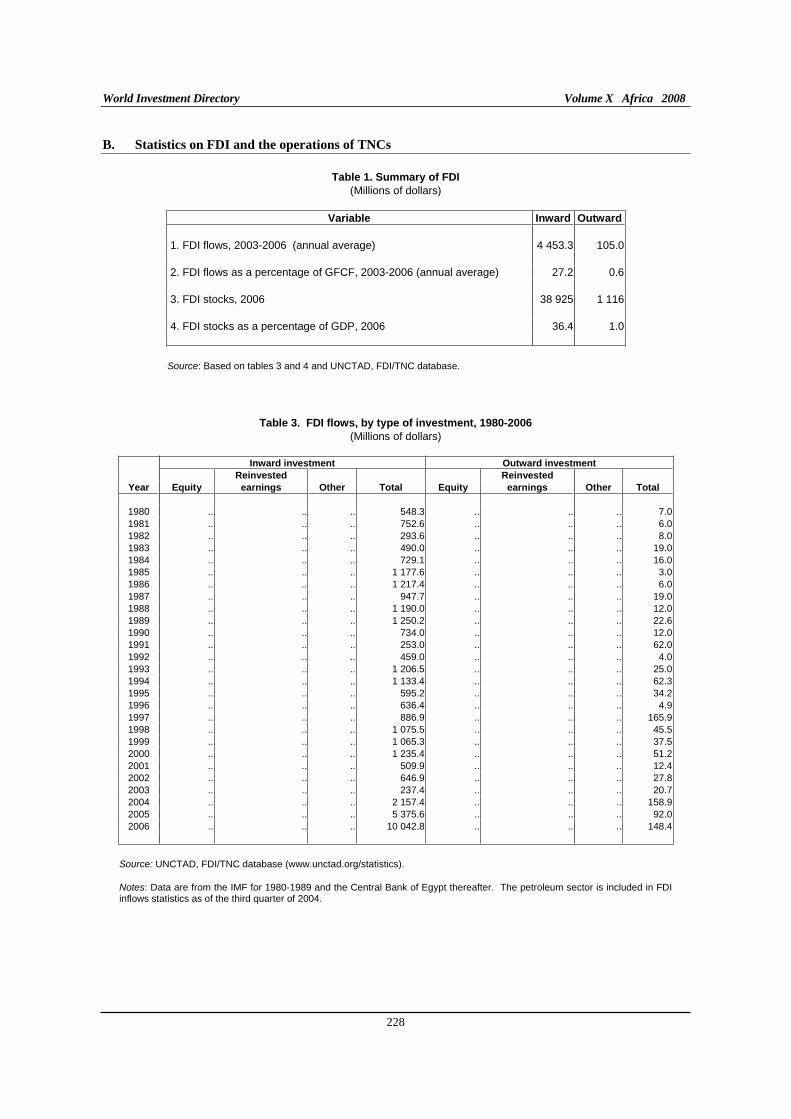
World Investment Directory Volume X Africa 2008
228
B. Statistics on FDI and the operations of TNCs
Table 1. Summary of FDI
(Millions of dollars)
Variable Inward Outward
1. FDI flows, 2003-2006 (annual average) 4 453.3 105.0
2. FDI flows as a percentage of GFCF, 2003-2006 (annual average) 27.2 0.6
3. FDI stocks, 2006 38 925 1 116
4. FDI stocks as a percentage of GDP, 2006 36.4 1.0
Source: Based on tables 3 and 4 and UNCTAD, FDI/TNC database.
Table 3. FDI flows, by type of investment, 1980-2006
(Millions of dollars)
Inward investment Outward investment
Reinvested Reinvested
Year Equity earnings Other Total Equity earnings Other Total
1980 .. .. .. 548.3 .. .. .. 7.01981 .. .. .. 752.6 .. .. .. 6.01982 .. .. .. 293.6 .. .. .. 8.01983 .. .. .. 490.0 .. .. .. 19.01984 .. .. .. 729.1 .. .. .. 16.01985 .. .. .. 1 177.6 .. .. .. 3.01986 .. .. .. 1 217.4 .. .. .. 6.01987 .. .. .. 947.7 .. .. .. 19.01988 .. .. .. 1 190.0 .. .. .. 12.01989 .. .. .. 1 250.2 .. .. .. 22.61990 .. .. .. 734.0 .. .. .. 12.01991 .. .. .. 253.0 .. .. .. 62.01992 .. .. .. 459.0 .. .. .. 4.01993 .. .. .. 1 206.5 .. .. .. 25.01994 .. .. .. 1 133.4 .. .. .. 62.31995 .. .. .. 595.2 .. .. .. 34.21996 .. .. .. 636.4 .. .. .. 4.91997 .. .. .. 886.9 .. .. .. 165.91998 .. .. .. 1 075.5 .. .. .. 45.51999 .. .. .. 1 065.3 .. .. .. 37.52000 .. .. .. 1 235.4 .. .. .. 51.22001 .. .. .. 509.9 .. .. .. 12.42002 .. .. .. 646.9 .. .. .. 27.82003 .. .. .. 237.4 .. .. .. 20.72004 .. .. .. 2 157.4 .. .. .. 158.92005 .. .. .. 5 375.6 .. .. .. 92.02006 .. .. .. 10 042.8 .. .. .. 148.4
Source: UNCTAD, FDI/TNC database (www.unctad.org/statistics).
Notes: Data are from the IMF for 1980-1989 and the Central Bank of Egypt thereafter. The petroleum sector is included in FDI inflows statistics as of the third quarter of 2004.
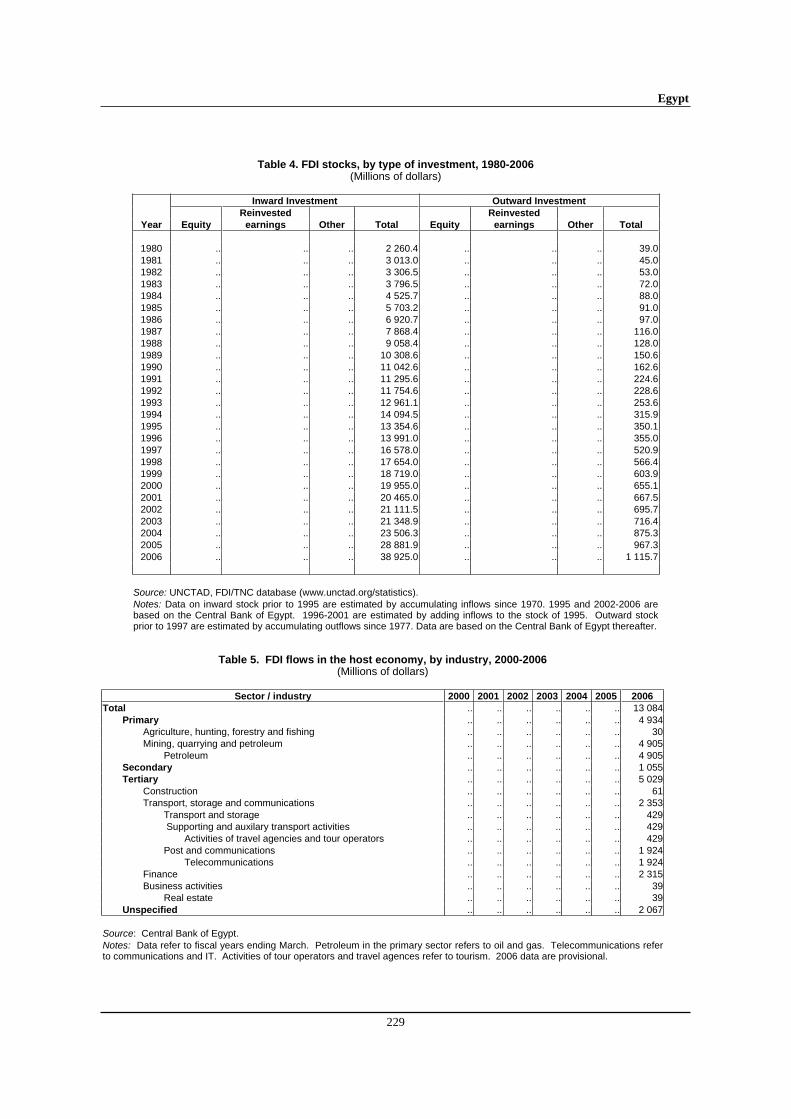
Egypt
229
Table 4. FDI stocks, by type of investment, 1980-2006 (Millions of dollars)
Inward Investment Outward Investment
Reinvested Reinvested Year Equity earnings Other Total Equity earnings Other Total
1980 .. .. .. 2 260.4 .. .. .. 39.01981 .. .. .. 3 013.0 .. .. .. 45.01982 .. .. .. 3 306.5 .. .. .. 53.01983 .. .. .. 3 796.5 .. .. .. 72.01984 .. .. .. 4 525.7 .. .. .. 88.01985 .. .. .. 5 703.2 .. .. .. 91.01986 .. .. .. 6 920.7 .. .. .. 97.01987 .. .. .. 7 868.4 .. .. .. 116.01988 .. .. .. 9 058.4 .. .. .. 128.01989 .. .. .. 10 308.6 .. .. .. 150.61990 .. .. .. 11 042.6 .. .. .. 162.61991 .. .. .. 11 295.6 .. .. .. 224.61992 .. .. .. 11 754.6 .. .. .. 228.61993 .. .. .. 12 961.1 .. .. .. 253.61994 .. .. .. 14 094.5 .. .. .. 315.91995 .. .. .. 13 354.6 .. .. .. 350.11996 .. .. .. 13 991.0 .. .. .. 355.01997 .. .. .. 16 578.0 .. .. .. 520.91998 .. .. .. 17 654.0 .. .. .. 566.41999 .. .. .. 18 719.0 .. .. .. 603.92000 .. .. .. 19 955.0 .. .. .. 655.12001 .. .. .. 20 465.0 .. .. .. 667.52002 .. .. .. 21 111.5 .. .. .. 695.72003 .. .. .. 21 348.9 .. .. .. 716.42004 .. .. .. 23 506.3 .. .. .. 875.32005 .. .. .. 28 881.9 .. .. .. 967.32006 .. .. .. 38 925.0 .. .. .. 1 115.7
Source: UNCTAD, FDI/TNC database (www.unctad.org/statistics). Notes: Data on inward stock prior to 1995 are estimated by accumulating inflows since 1970. 1995 and 2002-2006 are based on the Central Bank of Egypt. 1996-2001 are estimated by adding inflows to the stock of 1995. Outward stock prior to 1997 are estimated by accumulating outflows since 1977. Data are based on the Central Bank of Egypt thereafter.
Table 5. FDI flows in the host economy, by industry, 2000-2006 (Millions of dollars)
Sector / industry 2000 2001 2002 2003 2004 2005 2006
Total .. .. .. .. .. .. 13 084Primary .. .. .. .. .. .. 4 934
Agriculture, hunting, forestry and fishing .. .. .. .. .. .. 30Mining, quarrying and petroleum .. .. .. .. .. .. 4 905
Petroleum .. .. .. .. .. .. 4 905Secondary .. .. .. .. .. .. 1 055Tertiary .. .. .. .. .. .. 5 029
Construction .. .. .. .. .. .. 61Transport, storage and communications .. .. .. .. .. .. 2 353
Transport and storage .. .. .. .. .. .. 429 Supporting and auxilary transport activities .. .. .. .. .. .. 429
Activities of travel agencies and tour operators .. .. .. .. .. .. 429Post and communications .. .. .. .. .. .. 1 924
Telecommunications .. .. .. .. .. .. 1 924Finance .. .. .. .. .. .. 2 315Business activities .. .. .. .. .. .. 39
Real estate .. .. .. .. .. .. 39Unspecified .. .. .. .. .. .. 2 067
Source: Central Bank of Egypt. Notes: Data refer to fiscal years ending March. Petroleum in the primary sector refers to oil and gas. Telecommunications refer to communications and IT. Activities of tour operators and travel agences refer to tourism. 2006 data are provisional.
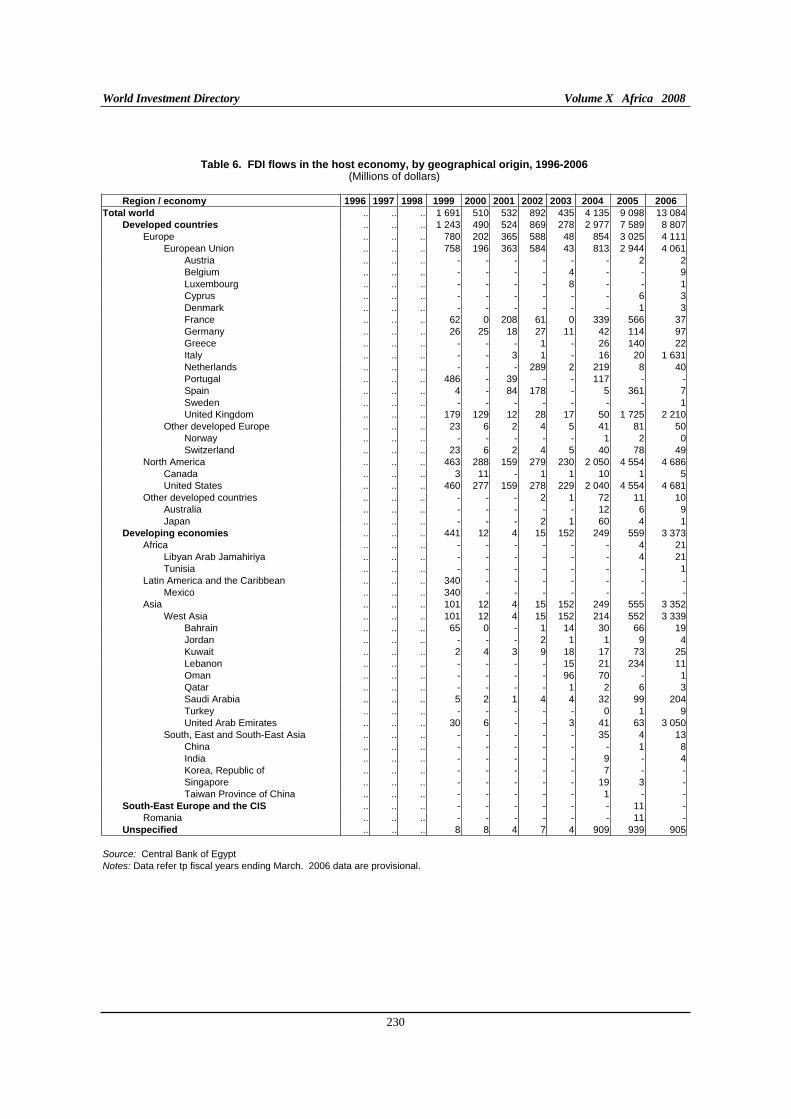
World Investment Directory Volume X Africa 2008
230
Table 6. FDI flows in the host economy, by geographical origin, 1996-2006 (Millions of dollars)
Region / economy 1996 1997 1998 1999 2000 2001 2002 2003 2004 2005 2006
Total world .. .. .. 1 691 510 532 892 435 4 135 9 098 13 084Developed countries .. .. .. 1 243 490 524 869 278 2 977 7 589 8 807
Europe .. .. .. 780 202 365 588 48 854 3 025 4 111European Union .. .. .. 758 196 363 584 43 813 2 944 4 061
Austria .. .. .. - - - - - - 2 2Belgium .. .. .. - - - - 4 - - 9Luxembourg .. .. .. - - - - 8 - - 1Cyprus .. .. .. - - - - - - 6 3Denmark .. .. .. - - - - - - 1 3France .. .. .. 62 0 208 61 0 339 566 37Germany .. .. .. 26 25 18 27 11 42 114 97Greece .. .. .. - - - 1 - 26 140 22Italy .. .. .. - - 3 1 - 16 20 1 631Netherlands .. .. .. - - - 289 2 219 8 40Portugal .. .. .. 486 - 39 - - 117 - -Spain .. .. .. 4 - 84 178 - 5 361 7Sweden .. .. .. - - - - - - - 1United Kingdom .. .. .. 179 129 12 28 17 50 1 725 2 210
Other developed Europe .. .. .. 23 6 2 4 5 41 81 50Norway .. .. .. - - - - - 1 2 0Switzerland .. .. .. 23 6 2 4 5 40 78 49
North America .. .. .. 463 288 159 279 230 2 050 4 554 4 686Canada .. .. .. 3 11 - 1 1 10 1 5United States .. .. .. 460 277 159 278 229 2 040 4 554 4 681
Other developed countries .. .. .. - - - 2 1 72 11 10Australia .. .. .. - - - - - 12 6 9Japan .. .. .. - - - 2 1 60 4 1
Developing economies .. .. .. 441 12 4 15 152 249 559 3 373Africa .. .. .. - - - - - - 4 21
Libyan Arab Jamahiriya .. .. .. - - - - - - 4 21Tunisia .. .. .. - - - - - - - 1
Latin America and the Caribbean .. .. .. 340 - - - - - - -Mexico .. .. .. 340 - - - - - - -
Asia .. .. .. 101 12 4 15 152 249 555 3 352West Asia .. .. .. 101 12 4 15 152 214 552 3 339
Bahrain .. .. .. 65 0 - 1 14 30 66 19Jordan .. .. .. - - - 2 1 1 9 4Kuwait .. .. .. 2 4 3 9 18 17 73 25Lebanon .. .. .. - - - - 15 21 234 11Oman .. .. .. - - - - 96 70 - 1Qatar .. .. .. - - - - 1 2 6 3Saudi Arabia .. .. .. 5 2 1 4 4 32 99 204Turkey .. .. .. - - - - - 0 1 9United Arab Emirates .. .. .. 30 6 - - 3 41 63 3 050
South, East and South-East Asia .. .. .. - - - - - 35 4 13China .. .. .. - - - - - - 1 8India .. .. .. - - - - - 9 - 4Korea, Republic of .. .. .. - - - - - 7 - -Singapore .. .. .. - - - - - 19 3 -Taiwan Province of China .. .. .. - - - - - 1 - -
South-East Europe and the CIS .. .. .. - - - - - - 11 -Romania .. .. .. - - - - - - 11 -
Unspecified .. .. .. 8 8 4 7 4 909 939 905 Source: Central Bank of Egypt Notes: Data refer tp fiscal years ending March. 2006 data are provisional.
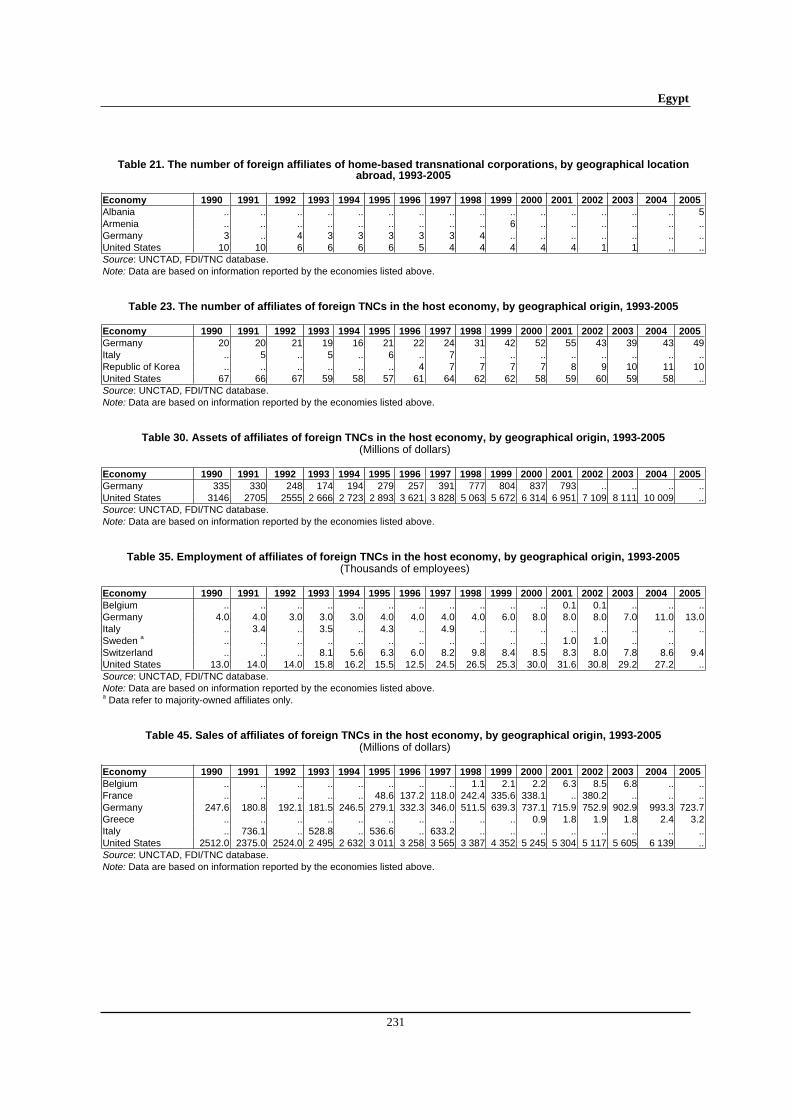
Egypt
231
Table 21. The number of foreign affiliates of home-based transnational corporations, by geographical location abroad, 1993-2005
Economy 1990 1991 1992 1993 1994 1995 1996 1997 1998 1999 2000 2001 2002 2003 2004 2005Albania .. .. .. .. .. .. .. .. .. .. .. .. .. .. .. 5Armenia .. .. .. .. .. .. .. .. .. 6 .. .. .. .. .. ..Germany 3 .. 4 3 3 3 3 3 4 .. .. .. .. .. .. ..United States 10 10 6 6 6 6 5 4 4 4 4 4 1 1 .. ..Source: UNCTAD, FDI/TNC database. Note: Data are based on information reported by the economies listed above.
Table 23. The number of affiliates of foreign TNCs in the host economy, by geographical origin, 1993-2005
Economy 1990 1991 1992 1993 1994 1995 1996 1997 1998 1999 2000 2001 2002 2003 2004 2005Germany 20 20 21 19 16 21 22 24 31 42 52 55 43 39 43 49Italy .. 5 .. 5 .. 6 .. 7 .. .. .. .. .. .. .. ..Republic of Korea .. .. .. .. .. .. 4 7 7 7 7 8 9 10 11 10United States 67 66 67 59 58 57 61 64 62 62 58 59 60 59 58 ..Source: UNCTAD, FDI/TNC database. Note: Data are based on information reported by the economies listed above.
Table 30. Assets of affiliates of foreign TNCs in the host economy, by geographical origin, 1993-2005 (Millions of dollars)
Economy 1990 1991 1992 1993 1994 1995 1996 1997 1998 1999 2000 2001 2002 2003 2004 2005Germany 335 330 248 174 194 279 257 391 777 804 837 793 .. .. .. ..United States 3146 2705 2555 2 666 2 723 2 893 3 621 3 828 5 063 5 672 6 314 6 951 7 109 8 111 10 009 ..Source: UNCTAD, FDI/TNC database. Note: Data are based on information reported by the economies listed above.
Table 35. Employment of affiliates of foreign TNCs in the host economy, by geographical origin, 1993-2005 (Thousands of employees)
Economy 1990 1991 1992 1993 1994 1995 1996 1997 1998 1999 2000 2001 2002 2003 2004 2005
Belgium .. .. .. .. .. .. .. .. .. .. .. 0.1 0.1 .. .. ..Germany 4.0 4.0 3.0 3.0 3.0 4.0 4.0 4.0 4.0 6.0 8.0 8.0 8.0 7.0 11.0 13.0Italy .. 3.4 .. 3.5 .. 4.3 .. 4.9 .. .. .. .. .. .. .. ..Sweden a .. .. .. .. .. .. .. .. .. .. .. 1.0 1.0 .. .. Switzerland .. .. .. 8.1 5.6 6.3 6.0 8.2 9.8 8.4 8.5 8.3 8.0 7.8 8.6 9.4United States 13.0 14.0 14.0 15.8 16.2 15.5 12.5 24.5 26.5 25.3 30.0 31.6 30.8 29.2 27.2 ..Source: UNCTAD, FDI/TNC database. Note: Data are based on information reported by the economies listed above. a Data refer to majority-owned affiliates only.
Table 45. Sales of affiliates of foreign TNCs in the host economy, by geographical origin, 1993-2005 (Millions of dollars)
Economy 1990 1991 1992 1993 1994 1995 1996 1997 1998 1999 2000 2001 2002 2003 2004 2005
Belgium .. .. .. .. .. .. .. .. 1.1 2.1 2.2 6.3 8.5 6.8 .. ..France .. .. .. .. .. 48.6 137.2 118.0 242.4 335.6 338.1 .. 380.2 .. .. ..Germany 247.6 180.8 192.1 181.5 246.5 279.1 332.3 346.0 511.5 639.3 737.1 715.9 752.9 902.9 993.3 723.7Greece .. .. .. .. .. .. .. .. .. .. 0.9 1.8 1.9 1.8 2.4 3.2Italy .. 736.1 .. 528.8 .. 536.6 .. 633.2 .. .. .. .. .. .. .. ..United States 2512.0 2375.0 2524.0 2 495 2 632 3 011 3 258 3 565 3 387 4 352 5 245 5 304 5 117 5 605 6 139 ..Source: UNCTAD, FDI/TNC database. Note: Data are based on information reported by the economies listed above.
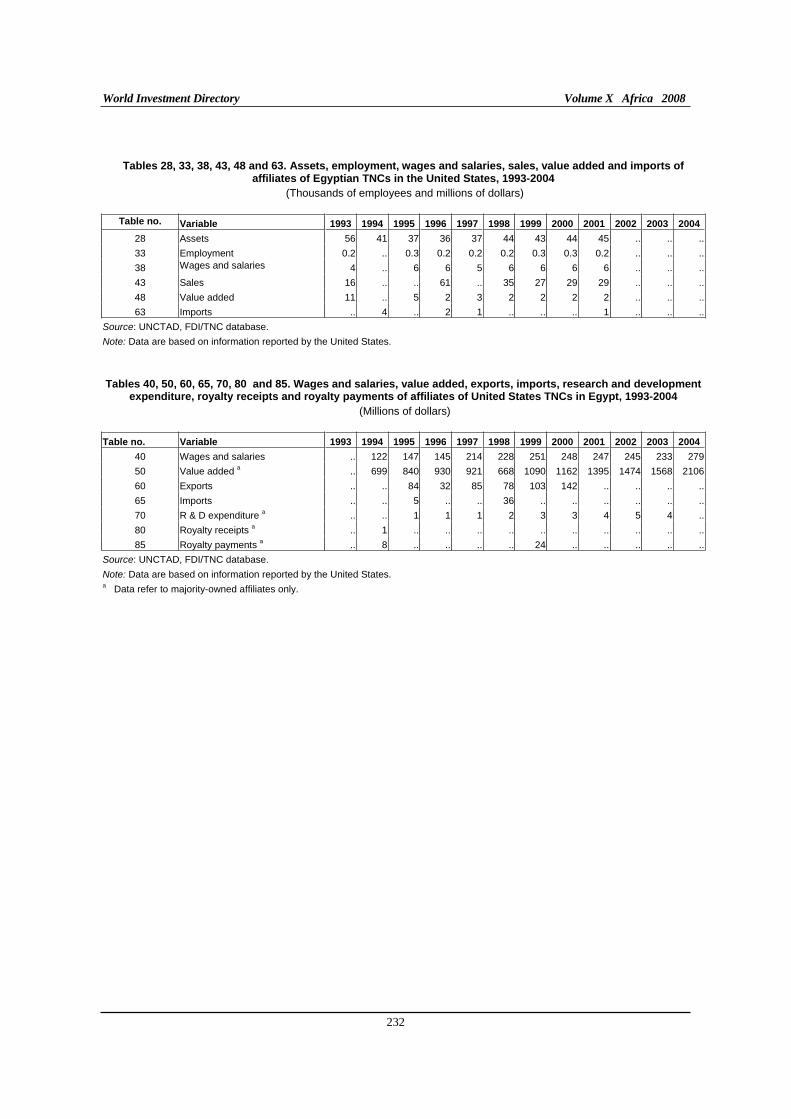
World Investment Directory Volume X Africa 2008
232
Tables 28, 33, 38, 43, 48 and 63. Assets, employment, wages and salaries, sales, value added and imports of affiliates of Egyptian TNCs in the United States, 1993-2004
(Thousands of employees and millions of dollars)
Table no. Variable 1993 1994 1995 1996 1997 1998 1999 2000 2001 2002 2003 2004
28 Assets 56 41 37 36 37 44 43 44 45 .. .. ..
33 Employment 0.2 .. 0.3 0.2 0.2 0.2 0.3 0.3 0.2 .. .. ..
38 Wages and salaries 4 .. 6 6 5 6 6 6 6 .. .. ..
43 Sales 16 .. .. 61 .. 35 27 29 29 .. .. ..
48 Value added 11 .. 5 2 3 2 2 2 2 .. .. ..
63 Imports .. 4 .. 2 1 .. .. .. 1 .. .. ..
Source: UNCTAD, FDI/TNC database.
Note: Data are based on information reported by the United States.
Tables 40, 50, 60, 65, 70, 80 and 85. Wages and salaries, value added, exports, imports, research and development
expenditure, royalty receipts and royalty payments of affiliates of United States TNCs in Egypt, 1993-2004
(Millions of dollars)
Table no. Variable 1993 1994 1995 1996 1997 1998 1999 2000 2001 2002 2003 2004
40 Wages and salaries .. 122 147 145 214 228 251 248 247 245 233 279
50 Value added a .. 699 840 930 921 668 1090 1162 1395 1474 1568 2106
60 Exports .. .. 84 32 85 78 103 142 .. .. .. ..
65 Imports .. .. 5 .. .. 36 .. .. .. .. .. ..
70 R & D expenditure a .. .. 1 1 1 2 3 3 4 5 4 ..
80 Royalty receipts a .. 1 .. .. .. .. .. .. .. .. .. ..
85 Royalty payments a .. 8 .. .. .. .. 24 .. .. .. .. ..
Source: UNCTAD, FDI/TNC database.
Note: Data are based on information reported by the United States. a Data refer to majority-owned affiliates only.
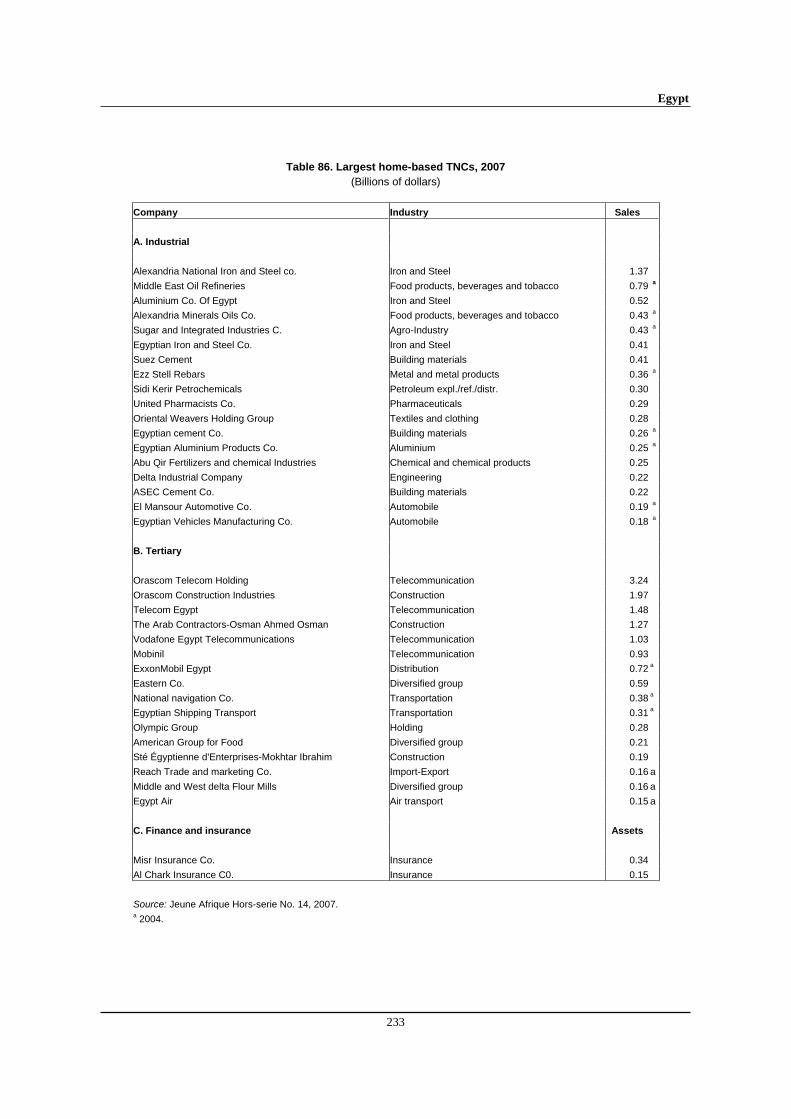
Egypt
233
Table 86. Largest home-based TNCs, 2007
(Billions of dollars)
Company Industry Sales
A. Industrial
Alexandria National Iron and Steel co. Iron and Steel 1.37
Middle East Oil Refineries Food products, beverages and tobacco 0.79 a
Aluminium Co. Of Egypt Iron and Steel 0.52
Alexandria Minerals Oils Co. Food products, beverages and tobacco 0.43 a
Sugar and Integrated Industries C. Agro-Industry 0.43 a
Egyptian Iron and Steel Co. Iron and Steel 0.41
Suez Cement Building materials 0.41
Ezz Stell Rebars Metal and metal products 0.36 a
Sidi Kerir Petrochemicals Petroleum expl./ref./distr. 0.30
United Pharmacists Co. Pharmaceuticals 0.29
Oriental Weavers Holding Group Textiles and clothing 0.28
Egyptian cement Co. Building materials 0.26 a
Egyptian Aluminium Products Co. Aluminium 0.25 a
Abu Qir Fertilizers and chemical Industries Chemical and chemical products 0.25
Delta Industrial Company Engineering 0.22
ASEC Cement Co. Building materials 0.22
El Mansour Automotive Co. Automobile 0.19 a
Egyptian Vehicles Manufacturing Co. Automobile 0.18 a
B. Tertiary
Orascom Telecom Holding Telecommunication 3.24
Orascom Construction Industries Construction 1.97
Telecom Egypt Telecommunication 1.48
The Arab Contractors-Osman Ahmed Osman Construction 1.27
Vodafone Egypt Telecommunications Telecommunication 1.03
Mobinil Telecommunication 0.93
ExxonMobil Egypt Distribution 0.72 a
Eastern Co. Diversified group 0.59
National navigation Co. Transportation 0.38 a
Egyptian Shipping Transport Transportation 0.31 a
Olympic Group Holding 0.28
American Group for Food Diversified group 0.21
Sté Égyptienne d'Enterprises-Mokhtar Ibrahim Construction 0.19
Reach Trade and marketing Co. Import-Export 0.16 a
Middle and West delta Flour Mills Diversified group 0.16 a
Egypt Air Air transport 0.15 a
C. Finance and insurance Assets
Misr Insurance Co. Insurance 0.34
Al Chark Insurance C0. Insurance 0.15
Source: Jeune Afrique Hors-serie No. 14, 2007. a 2004.
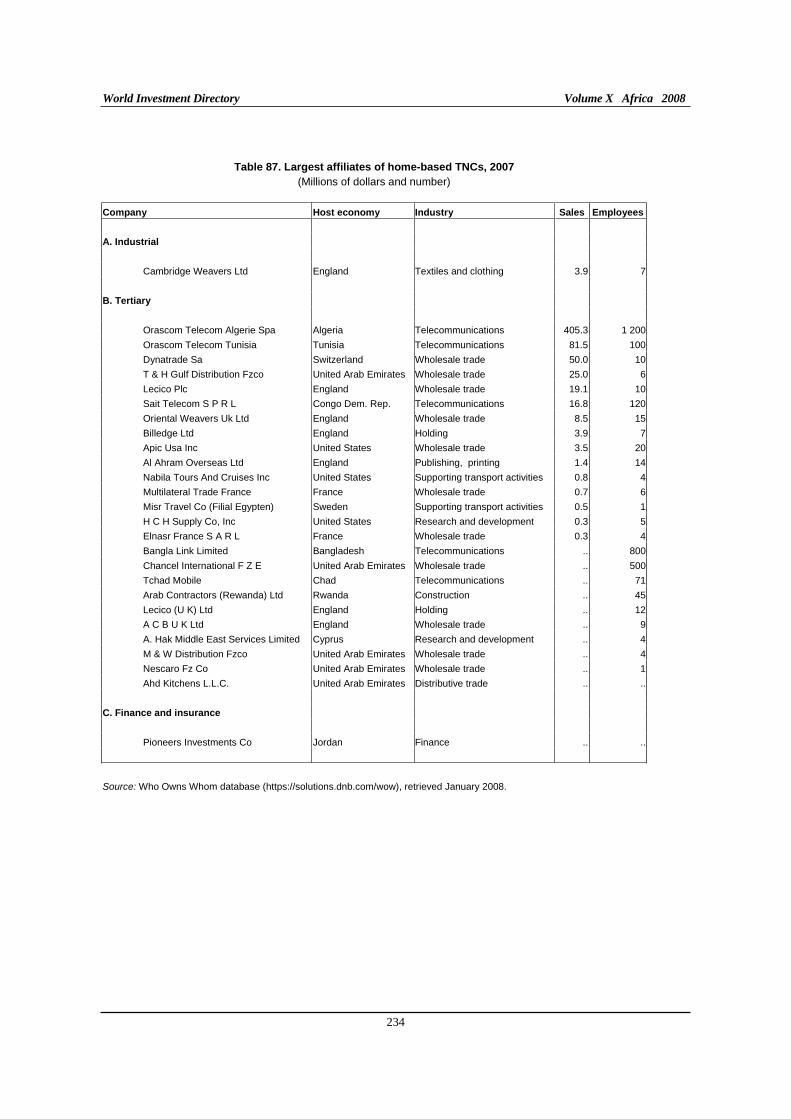
World Investment Directory Volume X Africa 2008
234
Table 87. Largest affiliates of home-based TNCs, 2007
(Millions of dollars and number)
Company Host economy Industry Sales Employees
A. Industrial
Cambridge Weavers Ltd England Textiles and clothing 3.9 7
B. Tertiary
Orascom Telecom Algerie Spa Algeria Telecommunications 405.3 1 200
Orascom Telecom Tunisia Tunisia Telecommunications 81.5 100
Dynatrade Sa Switzerland Wholesale trade 50.0 10
T & H Gulf Distribution Fzco United Arab Emirates Wholesale trade 25.0 6
Lecico Plc England Wholesale trade 19.1 10
Sait Telecom S P R L Congo Dem. Rep. Telecommunications 16.8 120
Oriental Weavers Uk Ltd England Wholesale trade 8.5 15
Billedge Ltd England Holding 3.9 7
Apic Usa Inc United States Wholesale trade 3.5 20
Al Ahram Overseas Ltd England Publishing, printing 1.4 14
Nabila Tours And Cruises Inc United States Supporting transport activities 0.8 4
Multilateral Trade France France Wholesale trade 0.7 6
Misr Travel Co (Filial Egypten) Sweden Supporting transport activities 0.5 1
H C H Supply Co, Inc United States Research and development 0.3 5
Elnasr France S A R L France Wholesale trade 0.3 4
Bangla Link Limited Bangladesh Telecommunications .. 800
Chancel International F Z E United Arab Emirates Wholesale trade .. 500
Tchad Mobile Chad Telecommunications .. 71
Arab Contractors (Rewanda) Ltd Rwanda Construction .. 45
Lecico (U K) Ltd England Holding .. 12
A C B U K Ltd England Wholesale trade .. 9
A. Hak Middle East Services Limited Cyprus Research and development .. 4
M & W Distribution Fzco United Arab Emirates Wholesale trade .. 4
Nescaro Fz Co United Arab Emirates Wholesale trade .. 1
Ahd Kitchens L.L.C. United Arab Emirates Distributive trade .. ..
C. Finance and insurance
Pioneers Investments Co Jordan Finance .. ..
Source: Who Owns Whom database (https://solutions.dnb.com/wow), retrieved January 2008.
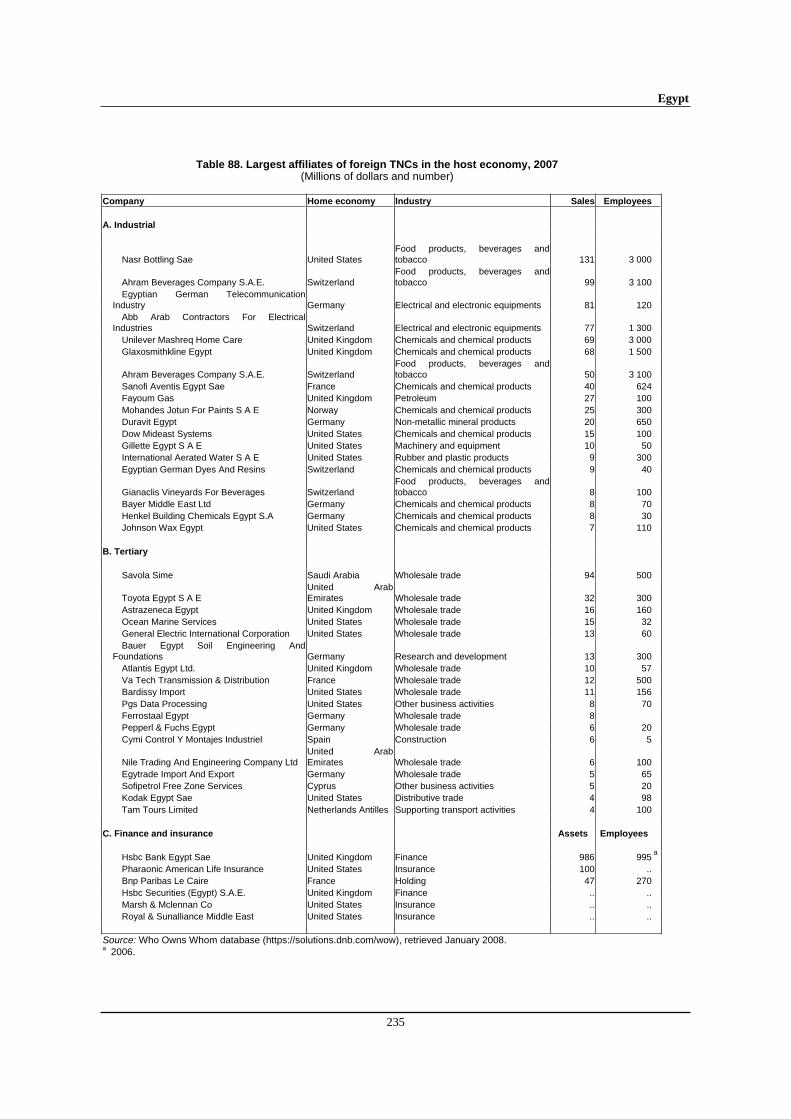
Egypt
235
Table 88. Largest affiliates of foreign TNCs in the host economy, 2007 (Millions of dollars and number)
Company Home economy Industry Sales Employees
A. Industrial
Nasr Bottling Sae United States Food products, beverages and tobacco 131 3 000
Ahram Beverages Company S.A.E. Switzerland Food products, beverages and tobacco 99 3 100
Egyptian German Telecommunication Industry Germany Electrical and electronic equipments 81 120
Abb Arab Contractors For Electrical Industries Switzerland Electrical and electronic equipments 77 1 300
Unilever Mashreq Home Care United Kingdom Chemicals and chemical products 69 3 000Glaxosmithkline Egypt United Kingdom Chemicals and chemical products 68 1 500
Ahram Beverages Company S.A.E. Switzerland Food products, beverages and tobacco 50 3 100
Sanofi Aventis Egypt Sae France Chemicals and chemical products 40 624Fayoum Gas United Kingdom Petroleum 27 100Mohandes Jotun For Paints S A E Norway Chemicals and chemical products 25 300Duravit Egypt Germany Non-metallic mineral products 20 650Dow Mideast Systems United States Chemicals and chemical products 15 100Gillette Egypt S A E United States Machinery and equipment 10 50International Aerated Water S A E United States Rubber and plastic products 9 300Egyptian German Dyes And Resins Switzerland Chemicals and chemical products 9 40
Gianaclis Vineyards For Beverages Switzerland Food products, beverages and tobacco 8 100
Bayer Middle East Ltd Germany Chemicals and chemical products 8 70Henkel Building Chemicals Egypt S.A Germany Chemicals and chemical products 8 30Johnson Wax Egypt United States Chemicals and chemical products 7 110
B. Tertiary
Savola Sime Saudi Arabia Wholesale trade 94 500
Toyota Egypt S A E United Arab Emirates Wholesale trade 32 300
Astrazeneca Egypt United Kingdom Wholesale trade 16 160Ocean Marine Services United States Wholesale trade 15 32General Electric International Corporation United States Wholesale trade 13 60Bauer Egypt Soil Engineering And
Foundations Germany Research and development 13 300Atlantis Egypt Ltd. United Kingdom Wholesale trade 10 57Va Tech Transmission & Distribution France Wholesale trade 12 500Bardissy Import United States Wholesale trade 11 156Pgs Data Processing United States Other business activities 8 70Ferrostaal Egypt Germany Wholesale trade 8 Pepperl & Fuchs Egypt Germany Wholesale trade 6 20Cymi Control Y Montajes Industriel Spain Construction 6 5
Nile Trading And Engineering Company Ltd United Arab Emirates Wholesale trade 6 100
Egytrade Import And Export Germany Wholesale trade 5 65Sofipetrol Free Zone Services Cyprus Other business activities 5 20Kodak Egypt Sae United States Distributive trade 4 98Tam Tours Limited Netherlands Antilles Supporting transport activities 4 100
C. Finance and insurance Assets Employees
Hsbc Bank Egypt Sae United Kingdom Finance 986 995a
Pharaonic American Life Insurance United States Insurance 100 ..Bnp Paribas Le Caire France Holding 47 270Hsbc Securities (Egypt) S.A.E. United Kingdom Finance .. ..Marsh & Mclennan Co United States Insurance .. ..Royal & Sunalliance Middle East United States Insurance .. ..
Source: Who Owns Whom database (https://solutions.dnb.com/wow), retrieved January 2008.a 2006.
World Investment Directory Volume X Africa 2008
236
C. Legal frameworks for transnational corporations
Egypt has adopted a number of legal instruments for regulating the activities of transnational corporations and foreign investors. The key among these instruments include:
I. National framework
Decree No. 3 of 9 February 1976 Instituting an Agency for the Development of Innovations and Inventions. Source: World Intellectual Property Organisation, Industrial Property Laws and Treaties, No. 12. December 1976 (English translation).
Law No. 56 off 17 November 1979 regulating ownership of real estate property by non-Egyptians Source: Official Gazette, No. 48 of 29 November 1979, and Graham & Trotman Ltd., (ed.), Business Laws of Egypt (BLE), vol. III, 1985, p. 3.7-1 - 3.8-23 (loose-leaf edition, English translation).
Labor Law No. 137 of 1981. Source: Official Gazette, No. 33, 13 August 1981 (supplement).
Income Tax Law No. 157 of 1981. Source: Official Gazette, No. 37, Supplement, and Business Laws of Egypt, vol. III, 10 September 1981, pp. 3.3-1 - 3.3-120, (English translation).
Company Law No. 159 of 1981. Source: Business Laws of Egypt, vol. I, pp. 1.2-1 - 1.2-74 (English translation).
Decision No. 7 of 1982 by the Minister of Investment Affairs and International Co-operation. Source: Official Gazette, No. 214, 16 September 1982.
Ministerial Decision No. 96 of 1982 regarding Executive Regulations to Company Law No. 159 of 1981 Source: Business Laws of Egypt, vol. I, pp. 1.2-75 - 1.2-226 (English translation).
Law No. 120 of 1982 regulating Activities of Commercial Agents and Certain Activities of Commercial Intermediaries, effective on 4 May 1983. Source: Official Gazette, No. 31 of 5 August 1982, and Business Laws of Egypt, vol. I, pp. 1.4-1 - 1.4-24 (English translation).
Executive Regulations No. 164 of 1982 to Income Tax Law No. 157 of 1981. Source: Official Gazette, No. 186 (supplement) and Business Laws of Egypt, vol. 11, 15 August 1982, pp. 2.4-1 - 2.4-54, (English translation).
Decision No. 342 of 1982, Ministry of Economy and Foreign Trade Implementing Law No. 120 of 1982, effective on 5 August 1983. Source: Official Gazette, May 1983.
Decree No. 27 of 1986 concerning Industrial Investment in New Cities. Source: International Bureau of Fiscal Documentation ATS, suppl. No. 91/92 of July 1994.
Law No. 230 of 20 July 1989 promulgating the Investment Code, effective: 21 July 1989. Source: Al Jaridah al Rasmiyah, Official Gazette No. 29 of 20 July 1989, and International Center for Settlement of Investment Disputes (ICSID), Investment Laws of the World, Release 90-2, June 1990, p. 1 (English Translation), and Official Publication - A.R Egypt. General Authority for Investment (Cairo) - "Investment Law No. 230/1989." As amended by Decree No. 9 of 23 March 1995.
Egypt
237
Source: Official Publication - A.R Egypt. General Authority for Investment, Cairo.
Privileges and Exemptions Granted by Investment Law No. 230/1989. Source: Official Publication - A.R. Egypt. General Authority for Investment, "Privileges and Exemptions Granted by Investment Law No. 230/1989", Cairo.
Executive Regulations concerning Investment Law No. 230/1989. Decree of the Prime Minister No. 363 of 31 January 1995. Amends and replaces Decree No. 1531 of 1989. Source: General Authority for Investment, 8 Adly Street, Cairo.
Law No. 203 on Public-Sector Business Enterprises of 1991. Source: World Bank, Technical Paper No. 186, "Divestiture of State Enterprises". An overviews of the legal framework.
Prime Minister Decree No. 1590/1991 on the implementing regulations for law No. 203/1991 of 1991. Source: World Bank,_ Technical Paper No. 186, "Divestiture of State Enterprises". An overviews of the legal framework.
Decree issued by the General Authority for Investment and Free Zones of April 1992- to streamline investment procedures. Source: General Authority for Investment, "Egypt's Free Zones", Cairo.
Banking Law No. 37 and 95/1992 of 1 June 1992. Source: Capital Market Authority, Cairo.
Law No. 82 of 2002 Pertaining to the Protection of Intellectual Property Rights, repealing the following legislations: Patents: Patent and Industrial Models Act No. 132 of 1949. Ministerial Decree No. 132 of 1949, as amended by Ministerial Decrees Nos. 271 of 1953, 39 of 1955, and 49 of 1958. Trade Marks: Act No. 57 of 1939, as amended by Acts Nos. 143 of 1949, 353 and 531 of 1953, 569 of 1954, 205 of 1956 and 59 of 1969.Copyright: Law No. 354 of 1954, as amended by laws Nos. 14 of 1968, 34 of 1975 and 38 of 1992. Source: Abu-Ghazaleh Intellectual Property, (http://www.agip.com).
Law on special economic zones, May 2002. Source: The Economist Intelligence Unit (http://db.eiu.com).
Prime Ministerial Decree 506 on foreign exchange from exports, passed in March 2003. Source: The Economist Intelligence Unit (http://db.eiu.com).
National Committee for Upgrading Economic Legislation, April 2006 Source: www.eiu.com, EIU Country report Main report May 2006
Amendment to tax code, 2005/2006 Source: www.eiu.com, Country forecast Main report July 2006.
II. International Framework
A. Egypt is a party to the following multilateral and regional instruments:
Convention on the Recognition and Enforcement of Foreign Arbitral Awards of 1958, which entered into force on 7 June 1959.
Convention on the Settlement of Investment Disputes between States and Nationals of other States of 1965. Entered into force on 14 October 1966.
World Investment Directory Volume X Africa 2008
238
Convention Establishing the Inter-Arab Investment Guarantee Corporation of May 1971. Entered into force in April 1974.
Agreement for the Promotion, Protection and Guarantee of Investment Among Member States of the Organisation of Islamic Conference of t June 1981, entered into force on 23 September 1986.
Unified Agreement for the Investment of Arab Capital in the Arab States of 1982.
Convention Establishing the Multilateral Investment Guarantee Agency of 1985, entered into force on 12 April 1988.
Articles of Agreement of the Islamic Corporation for the Insurance of Investment and Export Credit of 19 February 1992, entered into force on 1 August 1994.
Paris Convention for the Protection of Industrial Property of 1883 (Revised at Brussels in 1900, Washington in 1911, The Hague in 1925, London in 1934, Lisbon in 1958 and Stockholm in 1967, and as amended in 1979). Signed in 1994.
Marrakesh Agreement Establishing the World Trade Organisation of 15 April 1994. Entered into force on 1 January 1995. Agreement on Trade-Related Investment Measures. General Agreement on Trade in Services. Agreement on Trade Related Aspects of Intellectual Property Rights.
B. Bilateral treaties
1. Bilateral investment treaties for the protection and promotion of investments: Kuwait 1966, Switzerland 1973, France 1974, Germany 1974, United Kingdom 1975, Morocco 1976, Netherlands 1976, Belgium/Luxembourg 1977, Iran, Islamic Republic of 1977, Japan 1977, Sudan 1977, Serbia and Montenegro 1977, Sweden 1978, Finland 1980, Somalia 1982, Oman 1985, United States 1986, United Arab Emirates 1988, Yemen 1988, Italy 1989, Tunisia 1989, Libyan Arab Jamahiriya 1990, Saudi Arabia 1990, Tunisia 1990, Argentina 1992, Ecuador 1992, Spain 1992, Ukraine 1992, Uzbekistan 1992, Albania 1993, Czech Republic 1993, Greece 1993, Kazakhstan 1993, China 1994, Comoros 1994, Indonesia 1994, Romania 1994, Armenia 1995, Hungary 1995, Poland 1995, Turkmenistan 1995, Uganda 1995, Canada 1996, Denmark 1996, Jordan 1996, Korea, Republic of 1996, Lebanon 1996, Netherlands 1996, Sri Lanka 1996, Turkey 1996, Yemen 1996, Algeria 1997, Bahrain 1997, Belarus 1997, Croatia 1997, Gabon 1997, India 1997, Latvia 1997, Malawi 1997, Malaysia 1997, Morocco 1997, Russian Federation 1997, Singapore 1997, Slovakia 1997, Syrian Arab Republic 1997, Tanzania, United Republic of 1997, United Arab Emirates 1997, Viet Nam 1997, Bosnia and Herzegovina 1998, Bulgaria 1998, Chad 1998, Congo, Democratic Republic of 1998, Cyprus 1998, Djibouti 1998, Ghana 1998, Guinea 1998, Mali 1998, Mozambique 1998, Niger 1998, Oman 1998, Palestine Territory 1998, Senegal 1998, Slovenia 1998, South Africa 1998, Belgium/Luxembourg 1999, Chile 1999, Denmark 1999, Georgia 1999, Jamaica 1999, Korea, Democratic People's Republic of, 1999, The Former Yugoslav Republic of Macedonia, 1999, Malta 1999, Portugal 1999, Qatar 1999, Zimbabwe 1999, Cameroon 2000, Central African Republic 2000, Nigeria 2000, Pakistan 2000, Swaziland 2000, Thailand 2000, Zambia 2000, Australia 2001, Austria 2001, Kuwait 2001, Sudan 2001, Azerbaijan 2002, Seychelles 2002, Botswana 2003, Finland 2004, Mongolia 2004, Germany 2005, Serbia and Montenegro 2005, Ethiopia 2006.
2. Bilateral treaties for the avoidance of double taxation: Sweden 1958, Germany 1959, Austria 1962, Norway 1964, Finland 1965, Iraq 1968, Japan 1968, India 1969, Sudan 1970, United Kingdom 1977, Italy 1979, Romania 1979, France 1980, United States 1980, Canada 1983, Germany 1987, Switzerland 1987, Yugoslav(Former) 1987, Denmark 1989, Morocco 1989, Tunisia 1989, Belgium 1991, Hungary 1991, Syrian Arab Republic 1991, Korea, Republic of 1992, Cyprus 1993, Turkey 1993, Sweden 1994, United Arab Emirates 1994, Czech Republic 1995, Lebanon 1996, Poland 1996, China 1997, Malaysia 1997,
Egypt
239
Armenia 1998, Indonesia 1998, Mongolia 1998, The Former Yugoslav Republic of Macedonia, 1999, Malta 1999, Netherlands 1999, Uzbekistan 1999, Korea, Democratic People's Republic of 2000, Oman 2000, Senegal 2001, Bulgaria 2003, Slovakia 2004, Armenia 2005, Croatia 2005, Serbia and Montenegro 2005, Spain 2005, Thailand 2006.
C. Other treaties:
Agreement with the United States of America concerning the development of trade and investment relations (1999).
Euro-Mediterranean agreement establishing association with the European Communities and their member states (1977 and 2001).
Framework agreement with MERCOSUR (2004).
Free trade agreement with Turkey (2005).
Free Trade Agreement with the European Free Trade Association (EFTA) states (2007).
Investment agreement for the COMESA Common Investment Area (2007).
World Investment Directory Volume X Africa 2008
240
D. Sources of information
Official
Ministry of Economy and Foreign Trade.
General Authority for Investment and Free Zones http://www.gafi.gov.eg/.
Secondary
Africa Development Bank (ADB) (2005). "Egypt: 2000 - 2002 Country Strategy Paper, 2005 Update." Country Operations Department - ADB, July 2005.
Amin, Galal (2000). Whatever Happened to the Egyptians? (Cairo:American University in Cairo Press).
Commander, Simon (2003). "What explains the growth of a software industry in some emerging markets", Development Research Center (DRC) working paper No. 22 (London: DRC).
Dong-Joo Joo (1996). "An assessment of the foreign direct investment environment of Egypt in a Korean perspective". Paper presented at the International Seminar between Korea and Egypt, Port Said, October.
Economist Intelligence Unit (EIU) (various years). Country Profile: Egypt (London: EIU Ltd.).
___________ (various years). Country Report: Egypt (London: EIU Ltd.).
El – Shinnawy, Azza and Handoussa, Hebba (2003). "Case studies of foreign direct investment in Egypt", Development Research Center (DRC) working paper No. 2. (London: DRC).
Estrin, Saul (2003). "Foreign direct investment in Egypt, India, South Africa and Vietnam: an overview", Development Research Center (DRC) working paper No. 17 (London: DRC).
Guabr, Ahmed Ali (1997). "A survey of public opinion", Kitab Al-Aktisadi, Ah-Ahram Institution, No. 116, September.
Handoussa, Heba (2003). "Survey of foreign investment firms in Egypt", Development Research Center (DRC) working paper No. 3 (London: DRC).
Kamar, Bassem and Bakardzhieva, Damyana (2002). "The reforms needed to attract more FDI in Egypt: Lessons from the CEEC experience", communication presented at the Ninth Annual Conference of the Economic Research Forum for Arab countries, Turkey and Iran, 26 – 28 October.
Louis, Maryse, K and Handoussa, Heba (2003). "Brownfield investment in emerging markets: the case of Egypt", Development Research Center (DRC) working paper No.1 (London: DRC).
Mahboub, Abdelhamid (1997). "Foreign direct investment in Egypt: How to encourage and maximize the benefits" (Zagzig University Department of Economics).
Rodenbeck, Max (1998). Cairo: The City Victorious (Picador).
Sobhi, Yasser (2003). "Casualities of conflict", Al-Ahram Weekly on-line, No. 630, March.
Soderbom, M. and F. Teal (2004). "Size and Efficiency in Africa Manufacturing firms: Evidence from Firm-Level Panel Data." Journal of Development Economics, 73. pp 369 - 394.
United Nations Conference on Trade and Development (UNCTAD) (1999). Investment Policy Review Egypt
(Geneva and New York: United Nations), United Nations publication, Sales No. E.03.II.D.20.
Egypt
241
_____________(2005a). Investor-Disputes Arising from Investment Treaties: A Review. UNCTAD Series of International Investment Policies for Development (UNCTAD/ITE/IIT/2005/4).
_____________(2005b). A Survey of Support by Investment Promotion Agencies to Linkages. Advisory Studies No. 18 (UNCTAD/ITE/IPC/2005/12).
United States Commercial Service (2006). Doing Business in Egypt: A country Commercial Guide for US
Companies. (Washington D.C.: US Government).
US–Egypt Business Council (2000). "Trade and investment resources: overview of US investment in Egypt, 2000" (US-Egypt Business Council).
World Bank/International Finance Corporation (2007). Doing Business 2008 Egypt (Washington D.C.: The World Bank Group).

Equatorial Guinea
243
Equatorial Guinea
A. Definitions and sources of data
The data on annual flows of foreign direct investment (FDI) in Equatorial Guinea are gathered from the Banque des États de l’Afrique Centrale (BEAC). Additional data are provided by the International Monetary Fund in its balance-of-payment statistics. The country's Investment Code (Investment Code of April 1992, as amended in April 1994) does not contain specific definition of FDI.
In Equatorial Guinea, commercial oil and gas reserves are the major attraction for FDI. There has been growing and substantial investment in exploiting the reserves with significant new expansion planned for years to follow. This has transformed the country into Africa's fastest growing economy and one of the main destinations of United States investment in the region. Among the major companies operating in the country are: CMS Nomeco (United States), ExxonMobil (United States), Marathon (United States), TotalFinaElf (France) and United Meridian Corporation (United States). Oil and gas exploration has also led to the expansion of the hitherto tiny services sector. Recent foreign investments in forestry and growing demand from Asia have also boosted economic expansion in the non-oil sector, modestly. Equatorial Guinea possesses deposits of gold, diamonds, bauxite, iron ore, titanium, copper, manganese and uranium. Artisanal gold mining is reported to be taking place in parts of the mainland.
Equatorial Guinea is engaged in the regional integration schemes and other international arrangements. It is a member of the Communaute Economique et Monetaire de l'Afrique Centrale, New Partnership for Africa's Development and the African Union. It is an eligible member of the Cotonou agreement for renegotiating the trade links between the European Union (EU) and the Africa, Caribbean and Pacific countries and the Everything But Arms initiative. Equatorial Guinea is also among the 34 African least developed countries that have the option of entering the EU generalized system of preferences and has an observer status at the World Trade Organization.
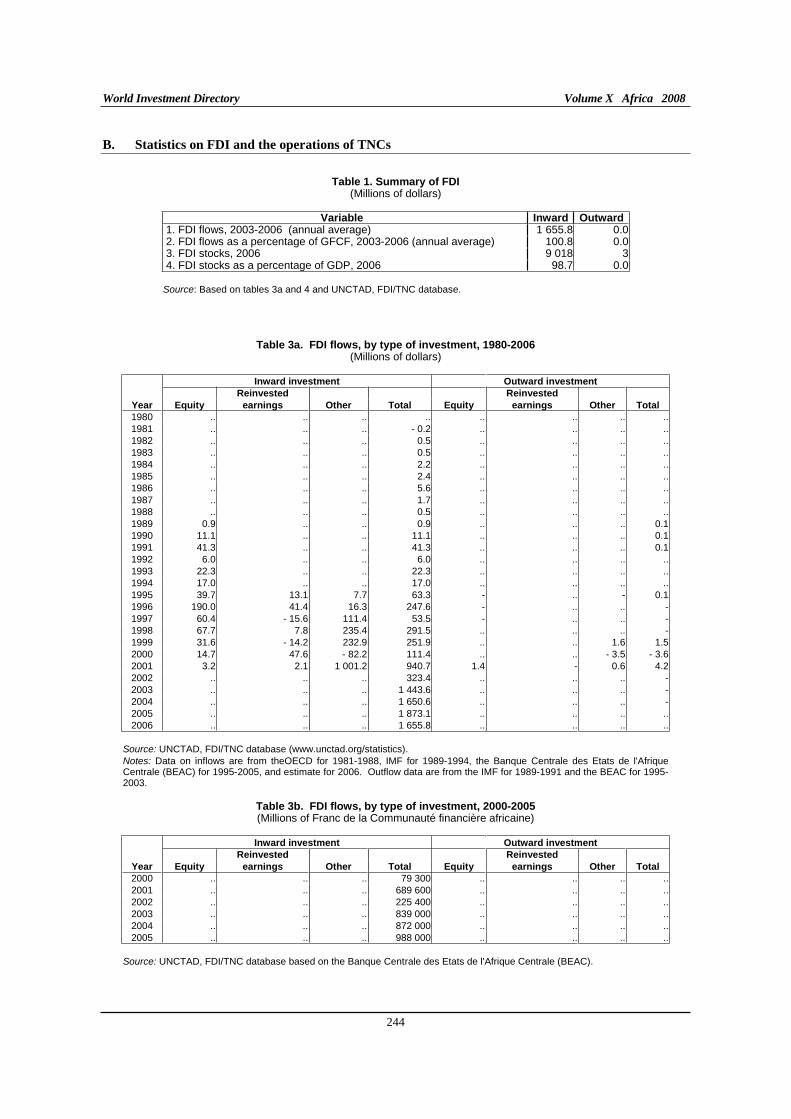
World Investment Directory Volume X Africa 2008
244
B. Statistics on FDI and the operations of TNCs
Table 1. Summary of FDI (Millions of dollars)
Variable Inward Outward 1. FDI flows, 2003-2006 (annual average) 1 655.8 0.0 2. FDI flows as a percentage of GFCF, 2003-2006 (annual average) 100.8 0.0 3. FDI stocks, 2006 9 018 3 4. FDI stocks as a percentage of GDP, 2006 98.7 0.0
Source: Based on tables 3a and 4 and UNCTAD, FDI/TNC database.
Table 3a. FDI flows, by type of investment, 1980-2006 (Millions of dollars)
Inward investment Outward investment
Reinvested Reinvested
Year Equity earnings Other Total Equity earnings Other Total 1980 .. .. .. .. .. .. .. ..1981 .. .. .. - 0.2 .. .. .. ..1982 .. .. .. 0.5 .. .. .. ..1983 .. .. .. 0.5 .. .. .. ..1984 .. .. .. 2.2 .. .. .. ..1985 .. .. .. 2.4 .. .. .. ..1986 .. .. .. 5.6 .. .. .. ..1987 .. .. .. 1.7 .. .. .. ..1988 .. .. .. 0.5 .. .. .. ..1989 0.9 .. .. 0.9 .. .. .. 0.11990 11.1 .. .. 11.1 .. .. .. 0.11991 41.3 .. .. 41.3 .. .. .. 0.11992 6.0 .. .. 6.0 .. .. .. ..1993 22.3 .. .. 22.3 .. .. .. ..1994 17.0 .. .. 17.0 .. .. .. ..1995 39.7 13.1 7.7 63.3 - .. - 0.11996 190.0 41.4 16.3 247.6 - .. .. -1997 60.4 - 15.6 111.4 53.5 - .. .. -1998 67.7 7.8 235.4 291.5 .. .. .. -1999 31.6 - 14.2 232.9 251.9 .. .. 1.6 1.52000 14.7 47.6 - 82.2 111.4 .. .. - 3.5 - 3.62001 3.2 2.1 1 001.2 940.7 1.4 - 0.6 4.22002 .. .. .. 323.4 .. .. .. -2003 .. .. .. 1 443.6 .. .. .. -2004 .. .. .. 1 650.6 .. .. .. -2005 .. .. .. 1 873.1 .. .. .. ..2006 .. .. .. 1 655.8 .. .. .. ..
Source: UNCTAD, FDI/TNC database (www.unctad.org/statistics). Notes: Data on inflows are from theOECD for 1981-1988, IMF for 1989-1994, the Banque Centrale des Etats de l'Afrique Centrale (BEAC) for 1995-2005, and estimate for 2006. Outflow data are from the IMF for 1989-1991 and the BEAC for 1995-2003.
Table 3b. FDI flows, by type of investment, 2000-2005 (Millions of Franc de la Communauté financière africaine)
Inward investment Outward investment
Reinvested Reinvested
Year Equity earnings Other Total Equity earnings Other Total 2000 .. .. .. 79 300 .. .. .. ..2001 .. .. .. 689 600 .. .. .. ..2002 .. .. .. 225 400 .. .. .. ..2003 .. .. .. 839 000 .. .. .. ..2004 .. .. .. 872 000 .. .. .. ..2005 .. .. .. 988 000 .. .. .. ..
Source: UNCTAD, FDI/TNC database based on the Banque Centrale des Etats de l'Afrique Centrale (BEAC).
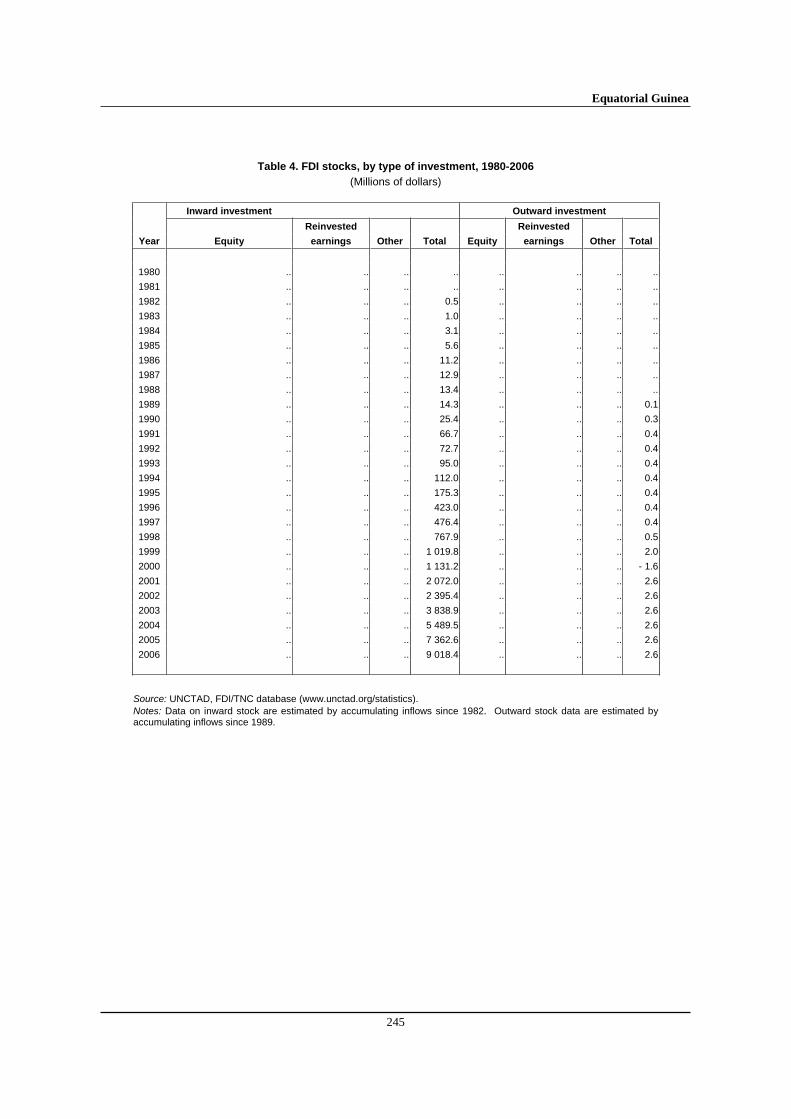
Equatorial Guinea
245
Table 4. FDI stocks, by type of investment, 1980-2006
(Millions of dollars)
Inward investment Outward investment
Reinvested Reinvested
Year Equity earnings Other Total Equity earnings Other Total
1980 .. .. .. .. .. .. .. ..
1981 .. .. .. .. .. .. .. ..
1982 .. .. .. 0.5 .. .. .. ..
1983 .. .. .. 1.0 .. .. .. ..
1984 .. .. .. 3.1 .. .. .. ..
1985 .. .. .. 5.6 .. .. .. ..
1986 .. .. .. 11.2 .. .. .. ..
1987 .. .. .. 12.9 .. .. .. ..
1988 .. .. .. 13.4 .. .. .. ..
1989 .. .. .. 14.3 .. .. .. 0.1
1990 .. .. .. 25.4 .. .. .. 0.3
1991 .. .. .. 66.7 .. .. .. 0.4
1992 .. .. .. 72.7 .. .. .. 0.4
1993 .. .. .. 95.0 .. .. .. 0.4
1994 .. .. .. 112.0 .. .. .. 0.4
1995 .. .. .. 175.3 .. .. .. 0.4
1996 .. .. .. 423.0 .. .. .. 0.4
1997 .. .. .. 476.4 .. .. .. 0.4
1998 .. .. .. 767.9 .. .. .. 0.5
1999 .. .. .. 1 019.8 .. .. .. 2.0
2000 .. .. .. 1 131.2 .. .. .. - 1.6
2001 .. .. .. 2 072.0 .. .. .. 2.6
2002 .. .. .. 2 395.4 .. .. .. 2.6
2003 .. .. .. 3 838.9 .. .. .. 2.6
2004 .. .. .. 5 489.5 .. .. .. 2.6
2005 .. .. .. 7 362.6 .. .. .. 2.6
2006 .. .. .. 9 018.4 .. .. .. 2.6
Source: UNCTAD, FDI/TNC database (www.unctad.org/statistics). Notes: Data on inward stock are estimated by accumulating inflows since 1982. Outward stock data are estimated by accumulating inflows since 1989.
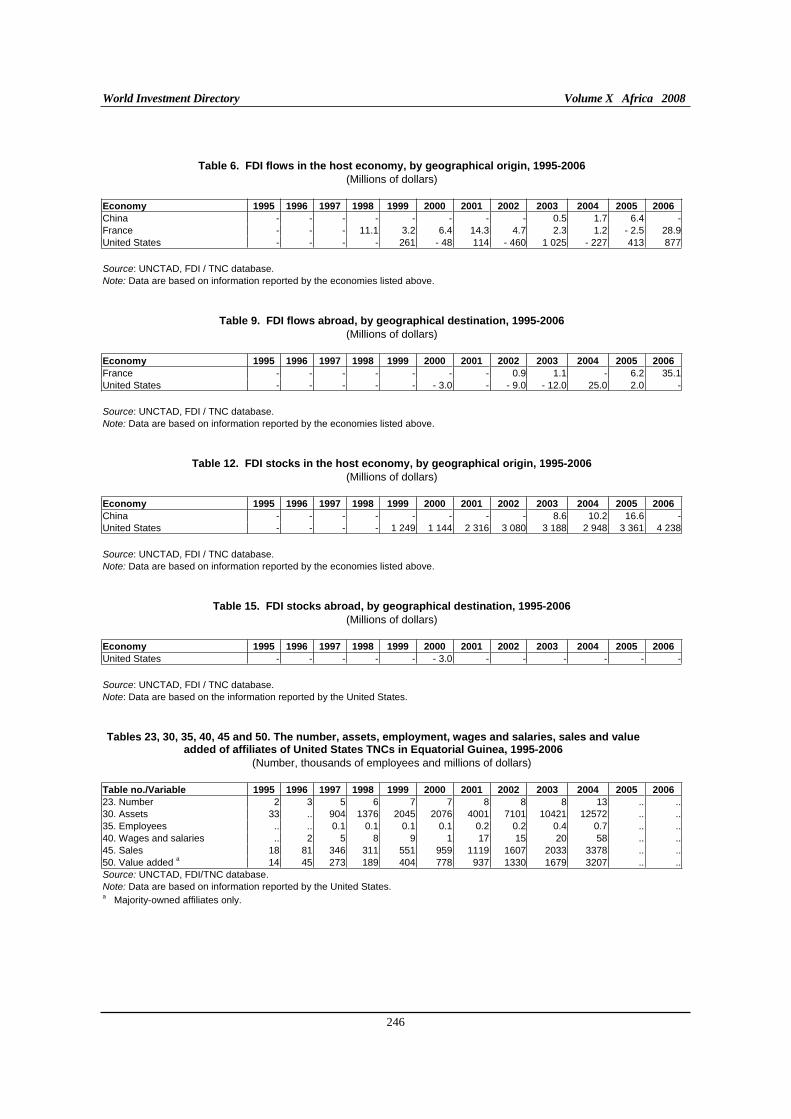
World Investment Directory Volume X Africa 2008
246
Table 6. FDI flows in the host economy, by geographical origin, 1995-2006
(Millions of dollars) Economy 1995 1996 1997 1998 1999 2000 2001 2002 2003 2004 2005 2006
China - - - - - - - - 0.5 1.7 6.4 -France - - - 11.1 3.2 6.4 14.3 4.7 2.3 1.2 - 2.5 28.9United States - - - - 261 - 48 114 - 460 1 025 - 227 413 877
Source: UNCTAD, FDI / TNC database. Note: Data are based on information reported by the economies listed above.
Table 9. FDI flows abroad, by geographical destination, 1995-2006
(Millions of dollars) Economy 1995 1996 1997 1998 1999 2000 2001 2002 2003 2004 2005 2006
France - - - - - - - 0.9 1.1 - 6.2 35.1United States - - - - - - 3.0 - - 9.0 - 12.0 25.0 2.0 -
Source: UNCTAD, FDI / TNC database. Note: Data are based on information reported by the economies listed above.
Table 12. FDI stocks in the host economy, by geographical origin, 1995-2006
(Millions of dollars) Economy 1995 1996 1997 1998 1999 2000 2001 2002 2003 2004 2005 2006
China - - - - - - - - 8.6 10.2 16.6 -United States - - - - 1 249 1 144 2 316 3 080 3 188 2 948 3 361 4 238
Source: UNCTAD, FDI / TNC database. Note: Data are based on information reported by the economies listed above.
Table 15. FDI stocks abroad, by geographical destination, 1995-2006
(Millions of dollars) Economy 1995 1996 1997 1998 1999 2000 2001 2002 2003 2004 2005 2006
United States - - - - - - 3.0 - - - - - -
Source: UNCTAD, FDI / TNC database.Note: Data are based on the information reported by the United States. Tables 23, 30, 35, 40, 45 and 50. The number, assets, employment, wages and salaries, sales and value
added of affiliates of United States TNCs in Equatorial Guinea, 1995-2006
(Number, thousands of employees and millions of dollars) Table no./Variable 1995 1996 1997 1998 1999 2000 2001 2002 2003 2004 2005 2006
23. Number 2 3 5 6 7 7 8 8 8 13 .. ..30. Assets 33 .. 904 1376 2045 2076 4001 7101 10421 12572 .. ..35. Employees .. .. 0.1 0.1 0.1 0.1 0.2 0.2 0.4 0.7 .. ..40. Wages and salaries .. 2 5 8 9 1 17 15 20 58 .. ..45. Sales 18 81 346 311 551 959 1119 1607 2033 3378 .. ..50. Value added a 14 45 273 189 404 778 937 1330 1679 3207 .. ..Source: UNCTAD, FDI/TNC database. Note: Data are based on information reported by the United States. a Majority-owned affiliates only.
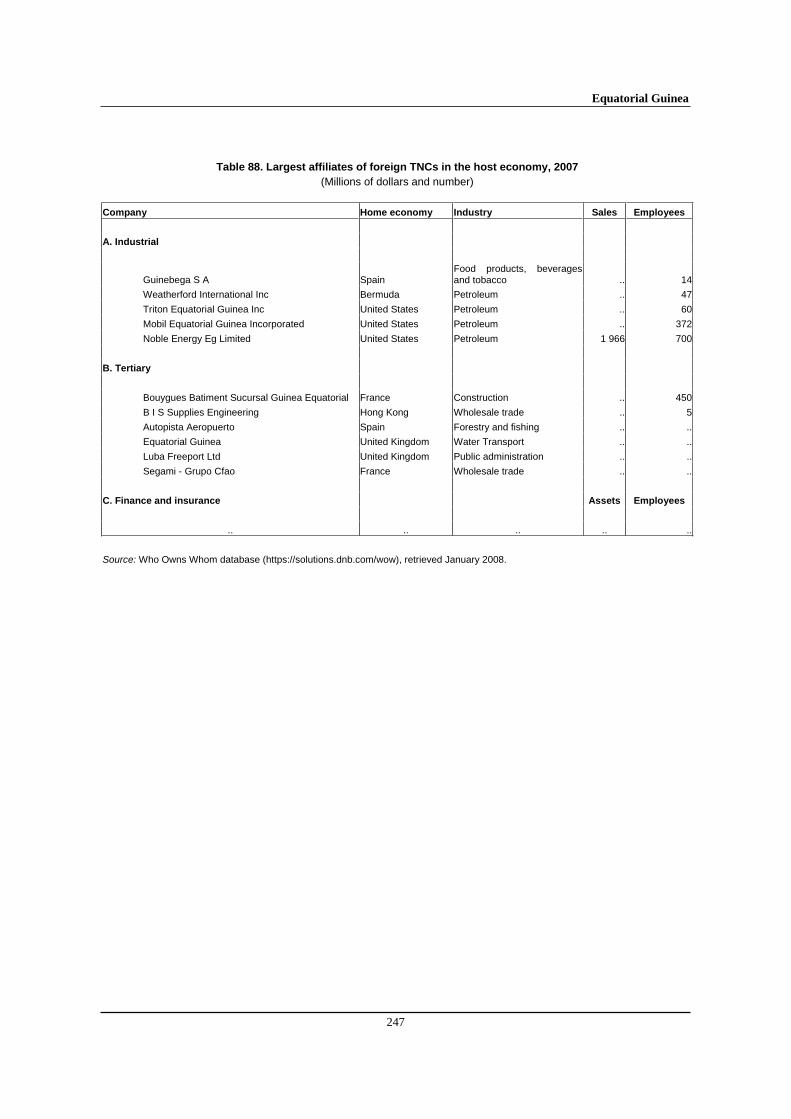
Equatorial Guinea
247
Table 88. Largest affiliates of foreign TNCs in the host economy, 2007
(Millions of dollars and number)
Company Home economy Industry Sales Employees
A. Industrial
Guinebega S A Spain Food products, beverages and tobacco .. 14
Weatherford International Inc Bermuda Petroleum .. 47
Triton Equatorial Guinea Inc United States Petroleum .. 60
Mobil Equatorial Guinea Incorporated United States Petroleum .. 372
Noble Energy Eg Limited United States Petroleum 1 966 700
B. Tertiary
Bouygues Batiment Sucursal Guinea Equatorial France Construction .. 450
B I S Supplies Engineering Hong Kong Wholesale trade .. 5
Autopista Aeropuerto Spain Forestry and fishing .. ..
Equatorial Guinea United Kingdom Water Transport .. ..
Luba Freeport Ltd United Kingdom Public administration .. ..
Segami - Grupo Cfao France Wholesale trade .. ..
C. Finance and insurance Assets Employees
.. .. .. .. ..
Source: Who Owns Whom database (https://solutions.dnb.com/wow), retrieved January 2008.
World Investment Directory Volume X Africa 2008
248
C. Legal frameworks for transnational corporations
The legal instruments for regulating the activities of the transnational corporations and foreign investors in Equatorial Guinea varied. The key instruments were adopted at national, bilateral and multilateral levels, including the following:
I. National framework
Patents: Decreto-Ley No. 7/1987, por el que se crea el Consejo de Investigaciones Científicas y Tecnológicas, August 1987. Decreto No. 56/1990, por el que se aprueba el Reglamento Orgánico del Consejo de Investigaciones Científicas y Tecnológicas (CICTE), September 1990. Decreto No. 38/1991, por el que se crean los Institutos Especializados del Consejo de Investigaciones Científicas y Tecnológicas (CICTE), May 1991. Source: WIPO (http://www.wipo.org).
Investment Code of April 1992, as amended in April 1994. Source: Institutional Web Site of Equatorial Guinea http://www.ceiba-guinea-ecuatorial.org/guineeangl/finv_codeinvest.htm
II. International Framework
A. Equatorial Guinea is a party to the following multilateral and regional instruments:
Customs and Economic Union of Central Africa (UDEAC): Common Convention on Investments in the UDEAC (1965); Joint Convention on the Freedom of Movement of Persons and the Right of Establishment in the UDEAC (1972); Multinational Companies Code in the UDEAC (1975).
Treaty for the Establishment of the Economic Community of Central African States (ECCAS) 1983.
Convention Establishing the Multilateral Investment Guarantee Agency of 1985, entered into force on 12 April 1988.
Fourth ACP - EEC Convention (Lome IV) of 1989, entered into force on 1st March 1990.
Paris Convention for the Protection of Industrial Property of 1883 (Revised at Brussels in 1900, Washington in 1911, The Hague in 1925, London in 1934, Lisbon in 1958 and Stockholm in 1967, and as amended in 1979). Signed in 1994.
New Hydrocarbons Law No. 8/2006 of 3 November 2006 Source: Government of Republic of Equatorial Guinea.
B. Bilateral treaties
1. Bilateral investment treaties for the protection and promotion of investments: France 1982, Spain 2003, South Africa 2004, China 2005, Morocco 2005.
2. Bilateral treaties for the avoidance of double taxation:
Equatorial Guinea
249
D. Sources of information
Official
Bank of Central African States (www.beac.int).
Secondary
Asiedu, E. (2002). "On the determinant of foreign direct investment to developing countries: is Africa different?", World Development, 30. pp 107 – 119.
Basu, A and K., Srinivasan (2002). "Foreign direct investment in Africa: some case studies", IMF working paper number WP/02/61 (Washington D.C.:IMF).
Bennell, Paul (1997). "Foreign direct investment in Africa: rhetoric and reality", SAIS Review(Summer/Fall) pp. 127-139.
Development Finance International (DFI) (2002). "Monitoring private capital flows to developing countries: capacity-building for codes, standards and analysis", (London: DFI) mimeo.
Economist Intelligence Unit (EIU) (various years). Country Profile: Equatorial Guinea (London:EIU Ltd.).
____________ (various years). Country Report: Equatorial Guinea (London: EIU Ltd.).
International Monetary Fund (IMF) (2006). IMF's Sub-Saharan Africa Regional Economic
Outlook, March 10, 2006. (Washington D.C.: IMF).
Kandiero, Tonia and Magaret Chitiga (2003). "Trade openness and foreign direct investment in Africa". Paper presented at the Economic Society of Southern Africa 2003 Annual Conference, Cape Town, South Africa.
Kronsten, Gregory (2002). "Mobilising external resources for domestic investment in Africa". Paper presented at the panel discussion at African Center, August.
Max Liniger-Goumaz (1988). Small is Not Always Beautiful: The Story of Equatorial Guinea
(London: Christopher Hurst).
Mbendi (2003). "Equatorial Guinea: oil and gas industry", Mbendi information for Africa
(www.mbendi.co.za/indy/oilg/af/eq/p0005.htm).
Soderbom, M. and F. Teal (2004). "Size and Efficiency in Africa Manufacturing firms: Evidence from Firm-Level Panel Data." Journal of Development Economics, 73. pp 369 - 394.
United Nations Conference on Trade and Development (UNCTAD) (2002). FDI in Least
Developed Countries at a Glance (Geneva: UNCTAD) (www.unctad.org/en/subsites/dite/LDCs/ pdfs/Countries/benin.pdf).
___________(2005a). Investor-Disputes Arising from Investment Treaties: A Review. UNCTAD Series of International Investment Policies for Development (UNCTAD/ITE/IIT/2005/4).
World Investment Directory Volume X Africa 2008
250
____________(2005b). A Survey of Support by Investment Promotion Agencies to Linkages.
Advisory Studies No. 18 (UNCTAD/ITE/IPC/2005/12).
____________(2005c). FDI in least developed countries at a glance: 2005/2006
(UNCTAD/ITE/IIA/2005/17).
United States Trade Representative (2006). 2006 Comprehensive Report on U.S. Trade and
Investment Policy Toward Sub-Saharan Africa and Implementation of the Africa Growth and
Opportunity Act: The Sixth of Eight Annual Reports, May 2006. (Washington D.C.: US Government).
World Bank/International Finance Corporation (2007). Doing Business 2008 Equatorial Guinea
(Washington D.C.: The World Bank Group).
Eritrea
251
Eritrea
A. Definitions and sources of data
Eritrea become independent in 1993 and introduced its own currency in 1996. It was only then that the government was able to exercise monetary and fiscal control. Data on foreign direct investment (FDI) are still not available from the Central Bank. The Eritrean Investment Proclamation (No. 59/1994) governs all foreign investment in the country but is silent on specific definition of FDI.
As a way of encouraging private investment, the Eritrean Government is ending all subsidies for state-run enterprises and is divesting its shares from many of these enterprises. The enterprises being privatized include those that process salt, glass, leather, processed foods, cotton, knitwear and sweaters, beverages and liquors. The Government of Eritrea is divesting shares in its previously publicly-owned ventures, particularly hotels. Sales had attracted significant private interest and FDI. Also, several new factories were opened to produce marble, recycled plastics and rubber goods. Tourism, formerly a small but growing sector was the subject of a promotional drive launched by the Ministry of Tourism. The main export items are salt, semi-processed leather goods, flowers, livestock and textiles.
Eritrea has gold reserves. Artisanal gold mining plays an important role in revealing new potential areas for mining companies. The country recently announced a high-grade borehole results at its Bisha project, west of Asmara. Eritrea also has substantial reserves of barite, feldspar and kaolin, and deposits of potash, rock salt, gypsum, asbestos and marble. The marble is of high quality and the Government is encouraging investments for the export of finished or semi-finished products to the Middle East and Europe.
Since independence Eritrea belonged to the seven-member Intergovernmental Authority on Development (IGAD). Eritrea is also a member of the Common Market for Eastern and Southern Africa, New Partnership for Africa's Development and the African Union. The country is an eligible member of the Cotonou Agreement for renegotiating the trade and aid links between the African, Caribbean and Pacific countries with the European Union and the Everything But Arms initiative. Eritrea is also among the 34 African least developed countries that have the option of exploiting the EU generalized system of preferences.
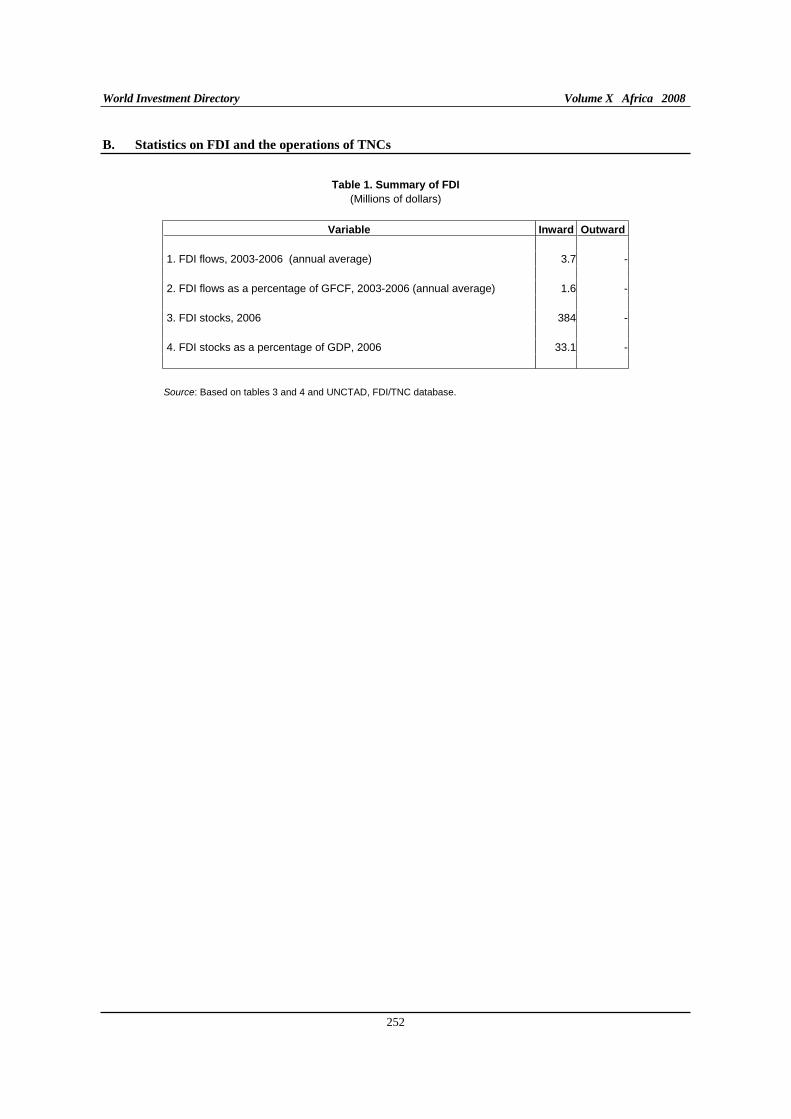
World Investment Directory Volume X Africa 2008
252
B. Statistics on FDI and the operations of TNCs
Table 1. Summary of FDI
(Millions of dollars)
Variable Inward Outward
1. FDI flows, 2003-2006 (annual average) 3.7 -
2. FDI flows as a percentage of GFCF, 2003-2006 (annual average) 1.6 -
3. FDI stocks, 2006 384 -
4. FDI stocks as a percentage of GDP, 2006 33.1 -
Source: Based on tables 3 and 4 and UNCTAD, FDI/TNC database.
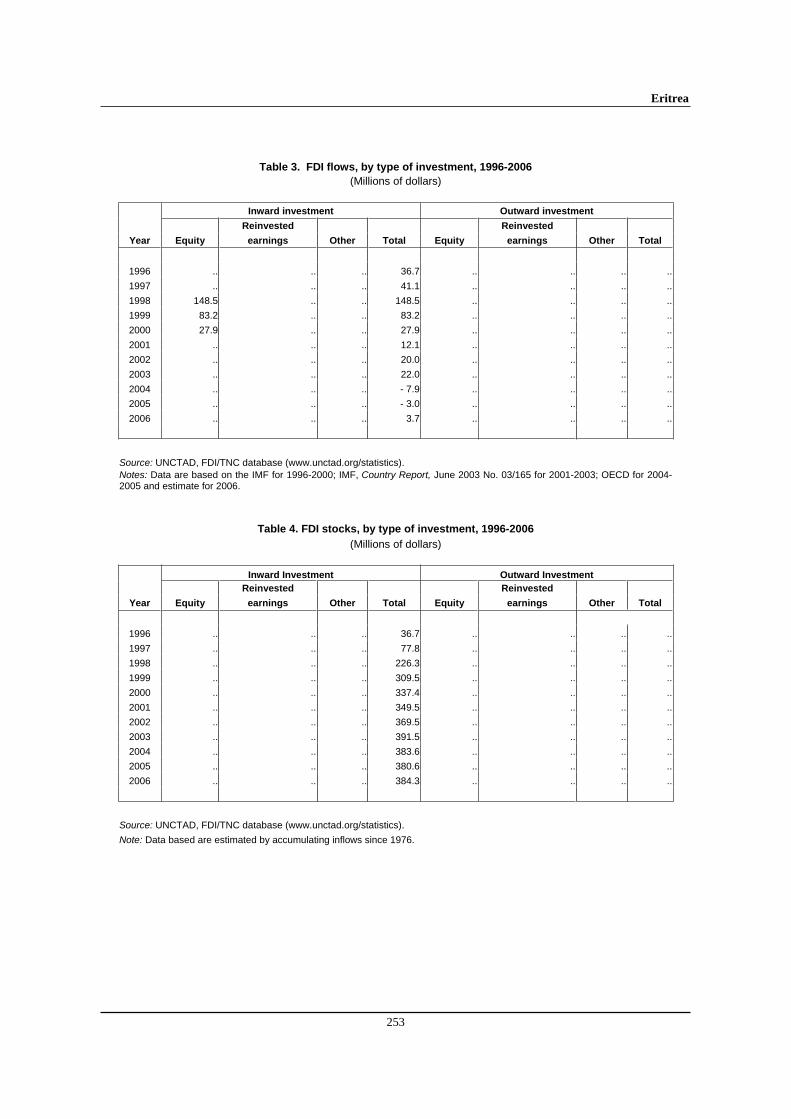
Eritrea
253
Table 3. FDI flows, by type of investment, 1996-2006
(Millions of dollars)
Inward investment Outward investment
Reinvested Reinvested
Year Equity earnings Other Total Equity earnings Other Total
1996 .. .. .. 36.7 .. .. .. ..
1997 .. .. .. 41.1 .. .. .. ..
1998 148.5 .. .. 148.5 .. .. .. ..
1999 83.2 .. .. 83.2 .. .. .. ..
2000 27.9 .. .. 27.9 .. .. .. ..
2001 .. .. .. 12.1 .. .. .. ..
2002 .. .. .. 20.0 .. .. .. ..
2003 .. .. .. 22.0 .. .. .. ..
2004 .. .. .. - 7.9 .. .. .. ..
2005 .. .. .. - 3.0 .. .. .. ..
2006 .. .. .. 3.7 .. .. .. ..
Source: UNCTAD, FDI/TNC database (www.unctad.org/statistics). Notes: Data are based on the IMF for 1996-2000; IMF, Country Report, June 2003 No. 03/165 for 2001-2003; OECD for 2004-2005 and estimate for 2006.
Table 4. FDI stocks, by type of investment, 1996-2006
(Millions of dollars)
Inward Investment Outward Investment
Reinvested Reinvested
Year Equity earnings Other Total Equity earnings Other Total
1996 .. .. .. 36.7 .. .. .. ..
1997 .. .. .. 77.8 .. .. .. ..
1998 .. .. .. 226.3 .. .. .. ..
1999 .. .. .. 309.5 .. .. .. ..
2000 .. .. .. 337.4 .. .. .. ..
2001 .. .. .. 349.5 .. .. .. ..
2002 .. .. .. 369.5 .. .. .. ..
2003 .. .. .. 391.5 .. .. .. ..
2004 .. .. .. 383.6 .. .. .. ..
2005 .. .. .. 380.6 .. .. .. ..
2006 .. .. .. 384.3 .. .. .. ..
Source: UNCTAD, FDI/TNC database (www.unctad.org/statistics).
Note: Data based are estimated by accumulating inflows since 1976.
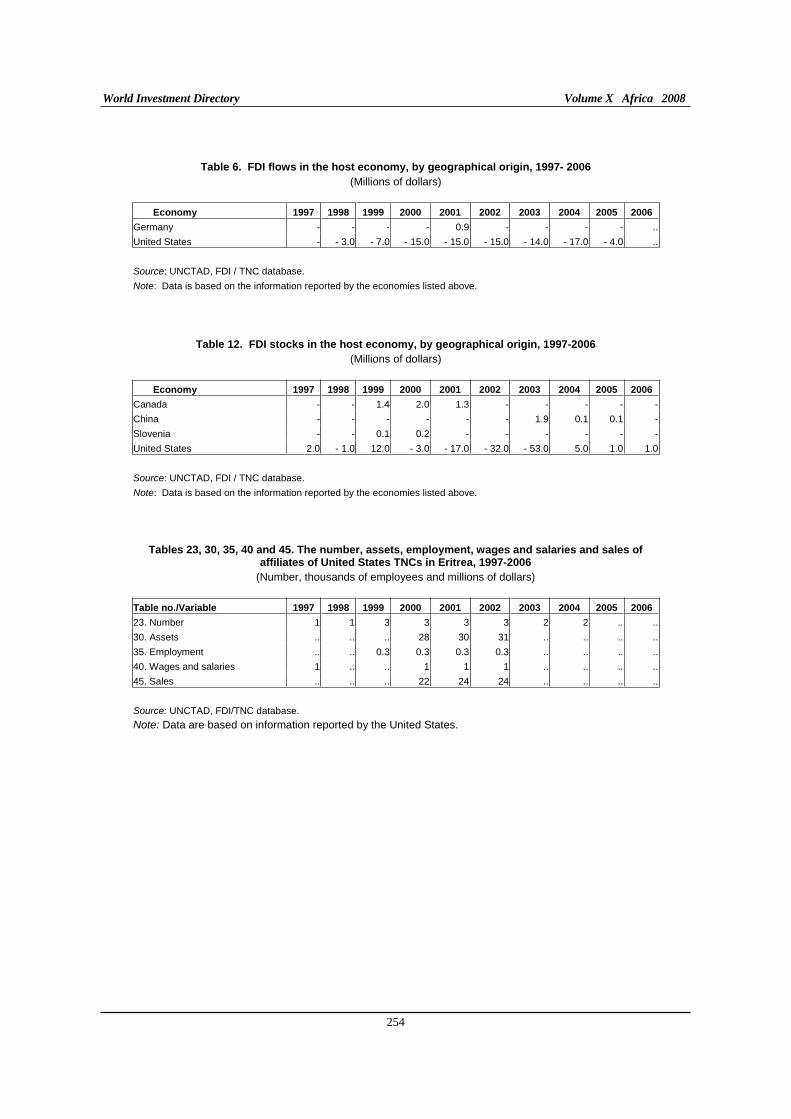
World Investment Directory Volume X Africa 2008
254
Table 6. FDI flows in the host economy, by geographical origin, 1997- 2006
(Millions of dollars)
Economy 1997 1998 1999 2000 2001 2002 2003 2004 2005 2006
Germany - - - - 0.9 - - - - ..
United States - - 3.0 - 7.0 - 15.0 - 15.0 - 15.0 - 14.0 - 17.0 - 4.0 ..
Source: UNCTAD, FDI / TNC database.
Note: Data is based on the information reported by the economies listed above.
Table 12. FDI stocks in the host economy, by geographical origin, 1997-2006
(Millions of dollars)
Economy 1997 1998 1999 2000 2001 2002 2003 2004 2005 2006
Canada - - 1.4 2.0 1.3 - - - - -
China - - - - - - 1.9 0.1 0.1 -
Slovenia - - 0.1 0.2 - - - - - -
United States 2.0 - 1.0 12.0 - 3.0 - 17.0 - 32.0 - 53.0 5.0 1.0 1.0
Source: UNCTAD, FDI / TNC database.
Note: Data is based on the information reported by the economies listed above.
Tables 23, 30, 35, 40 and 45. The number, assets, employment, wages and salaries and sales of affiliates of United States TNCs in Eritrea, 1997-2006
(Number, thousands of employees and millions of dollars)
Table no./Variable 1997 1998 1999 2000 2001 2002 2003 2004 2005 2006
23. Number 1 1 3 3 3 3 2 2 .. ..
30. Assets .. .. .. 28 30 31 .. .. .. ..
35. Employment .. .. 0.3 0.3 0.3 0.3 .. .. .. ..
40. Wages and salaries 1 .. .. 1 1 1 .. .. .. ..
45. Sales .. .. .. 22 24 24 .. .. .. ..
Source: UNCTAD, FDI/TNC database.
Note: Data are based on information reported by the United States.
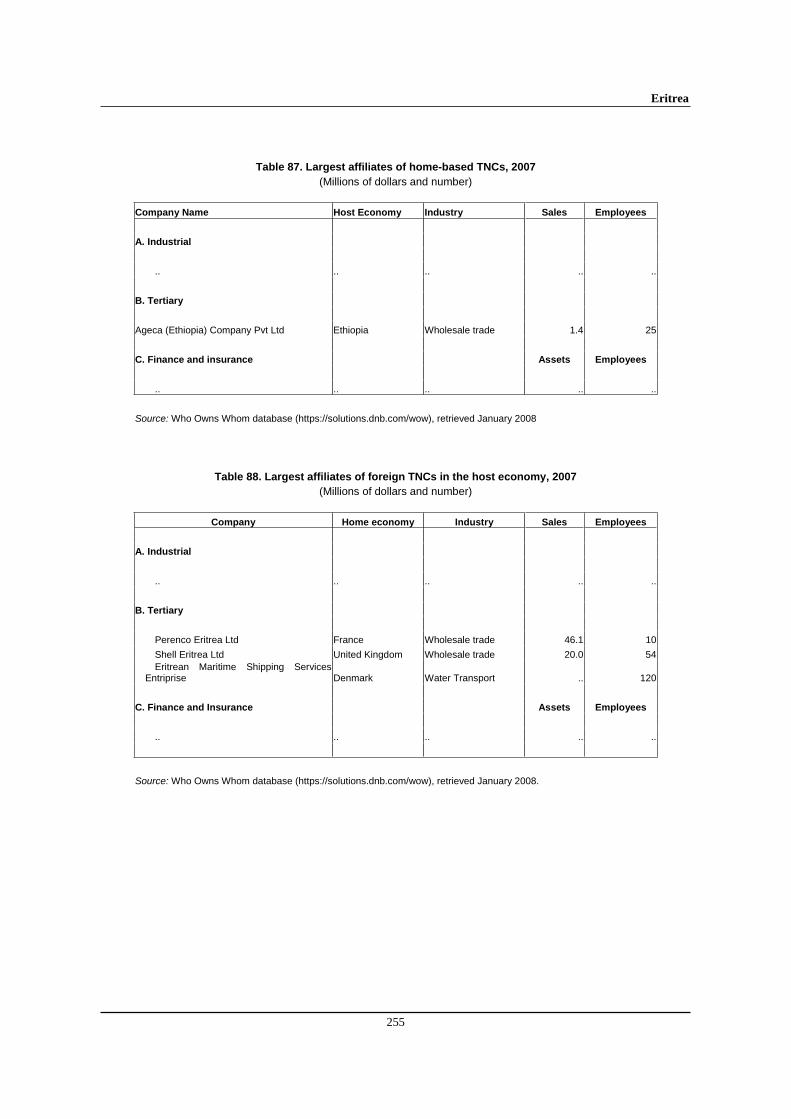
Eritrea
255
Table 87. Largest affiliates of home-based TNCs, 2007
(Millions of dollars and number)
Company Name Host Economy Industry Sales Employees
A. Industrial
.. .. .. .. ..
B. Tertiary
Ageca (Ethiopia) Company Pvt Ltd Ethiopia Wholesale trade 1.4 25
C. Finance and insurance Assets Employees
.. .. .. .. ..
Source: Who Owns Whom database (https://solutions.dnb.com/wow), retrieved January 2008
Table 88. Largest affiliates of foreign TNCs in the host economy, 2007
(Millions of dollars and number)
Company Home economy Industry Sales Employees
A. Industrial
.. .. .. .. ..
B. Tertiary
Perenco Eritrea Ltd France Wholesale trade 46.1 10
Shell Eritrea Ltd United Kingdom Wholesale trade 20.0 54Eritrean Maritime Shipping Services
Entriprise Denmark Water Transport .. 120
C. Finance and Insurance Assets Employees
.. .. .. .. ..
Source: Who Owns Whom database (https://solutions.dnb.com/wow), retrieved January 2008.
World Investment Directory Volume X Africa 2008
256
C. Legal frameworks for transnational corporations
The national instruments that regulate the activities of the foreign direct investors and transnational corporations in Eritrea include:
I. National framework
Transitional Commercial Code, effective 15 September 1991 Source: Gazette of Eritrean Laws published by the Government of Eritrea in1991.
Transitional Maritime Code, effective 15 September 1991 Source: Gazette of Eritrean Laws published by the Government of Eritrea in 1991.
Transitional Civil Procedure Code, effective 15 September 1991 Source: Gazette of Eritrean Laws published by the Government of Eritrea in 1991.
Transitional Civil Code of Eritrea, 15 September 1991 Source: Gazette of Eritrean Laws published by the Government of Eritrea in 1991.
Land Proclamation, No. 58/1994 of 24 August 1994. Source: Gazette of Eritrean Laws published by the Government of Eritrea on 24 August1994.
Investment Proclamation, No. 59/1994. Source: Gazette of Eritrean Laws published by the Government of Eritrea on 24 August1994.
Income Tax Proclamation, No. 62/1994 Source: Gazette of Eritrean Laws published by the Government of Eritrea in 1994.
Income Tax Regulations, Legal Notice No.20 (1995). Source: Gazette of Eritrean Laws published by the Government of Eritrea in 1995.
Business Licensing Proclamation No.72/1995. Source: Gazette of Eritrean Laws published by the Government of Eritrea in 1995.
Proclamation to Regulate the Registration of Eritrean Ships, No. 77 (1995). Source: Gazette of Eritrean Laws published by the Government of Eritrea on in 1995. Communications Proclamation, No. 102 (1998).
Advocates Proclamation, No. 88 (1996), Source: Gazette of Eritrean Laws published by the Government of Eritrea in 1996.
II. International Framework
A. Eritrea is a party to the following multilateral and regional instruments:
Convention Establishing the Multilateral Investment Guarantee Agency of 1985, entered into force on 12 April 1988.
Treaty Establishing the Market for Eastern and Southern Africa (COMESA), 1993.
Eritrea
257
Partnership Agreement between the Members of The African, Caribbean and Pacific Group of States, of the one part and the European Community and its member states, of the other part signed in Cotonou, Benin on 23 June 2000.
B. Bilateral treaties
1. Bilateral investment treaties for the protection and promotion of investments: Italy 1996, Qatar 2000, Uganda 2001, Netherlands 2003.
2. Bilateral treaties for the avoidance of double taxation: Qatar 2000.
C. Other treaties:
Investment agreement for the COMESA Common Investment Area (2007).
World Investment Directory Volume X Africa 2008
258
D. Sources of information
Official
..
Secondary
Bennell, Paul (1997). "Foreign direct investment in Africa: rhetoric and reality", SAIS Review
(Summer/Fall), pp. 127-139.
_____________(1997). "Privatization in Sub-Saharan Africa: progress and prospects during the 1990s", World Development, vol. 25, no. 11, pp. 1785-1803.
Broll, U. (2003). "Foreign direct investment, credible policy: the role of risk sharing", International Trade
Journal, vol. XVII, No. 2., pp. 165 – 176.
Economist Intelligence Unit (EIU) (various years). Country Profile: Eritrea (London: EIU Ltd.).
_____________ (various years). Country Report: Eritrea (London: EIU Ltd.).
International Finance Corporation (IFC) (1997). "Foreign direct investment", IFC: Lessons of Experience
Series, No. 5 (Washington, D.C.: World Bank).
Rogoff, Kenneth and Carmen, Reinhart (2002). "FDI to Africa: the role of price stability and currency instability", International Monetary Fund Working Paper, (Washington D.C.: International Monetary Fund).
Soderbom, M. and F. Teal (2004). "Size and Efficiency in Africa Manufacturing firms: Evidence from Firm-Level Panel Data." Journal of Development Economics, 73. pp 369 - 394.
United Nations Conference on Trade and Development (UNCTAD) (2005a). Investor-Disputes Arising from
Investment Treaties: A Review. UNCTAD Series of International Investment Policies for Development (UNCTAD/ITE/IIT/2005/4).
_____________(2005b). A Survey of Support by Investment Promotion Agencies to Linkages. Advisory Studies No. 18 (UNCTAD/ITE/IPC/2005/12).
_____________(2005c). FDI in least developed countries at a glance: 2005/2006
(UNCTAD/ITE/IIA/2005/17).
United States Foreign Commercial Service and United States Department of State (1998). "Eritrea: Investment Climate" (strategis.ic.gc.ca).
United Nations Conference on Trade and Development (UNCTAD) (2002). FDI in Least Developed
Countries at a Glance 2002 (Geneva: UNCTAD/ITE/IIA/6).
World Bank (2002). "Pilot investment climate assessment: obstacles to the expansion of Eritrea's manufacturing sector", mimeo. (Washington D. C.: World Bank).
World Bank/International Finance Corporation (2007). Doing Business 2008 Eritrea (Washington D.C.: The World Bank Group).
Ethiopia
259
Ethiopia
A. Definitions and sources of data
The Ethiopia investment code defines a foreign investor as "… a physical or juridical person of foreign nationality which has invested imported capital" (Investment Proclamation No. 15/1992, article 2). The responsible organ for collecting data on foreign direct investment (FDI) is the statistic and information technology service which is part of Ethiopian Investment Authority (EIA). The EIA is the institution responsible for approving FDI projects for the pre and post-investment phases. Detailed data on outward investment from Ethiopia are not available. The International Monetary Fund (IMF) also provides data on FDI in Ethiopia in its balance-of-payments statistics.
FDI into Ethiopia started to grow since liberalizing control of the economy in 1992. The new regime sought to eliminate the constraints on FDI and to establish an enabling environment for foreign investors. The authorities began to promote Ethiopia more vigorously as a location for FDI in early 1998. In 1999, a new investment guide for potential foreign investors in Ethiopia was published.
The liberalizing of the economy prompted improved incentives and more efficient marketing in the country. The gradual shift to private ownership which is being overseen by two government agencies, the Ethiopian Investment Authority and the Ethiopian Privatization Agency began with the sale of small retail outlets and medium-sized hotels and restaurants. The telecommunications and energy sectors were thrown open to foreign investors later. The disposal of state farms and agro-industrial plants was a little more problematic, partly because of continued wrangles over allocating land titles by regional authorities. Further state-owned enterprises, notably hotel chains, state farms and plantations are slated for sale in the economic programme agreed with the IMF.
Ethiopia is endowed with a geological environment, hosting a wide variety of promising mineral resources. Initial explorations have confirmed deposits of gold, platinum, tantalite, soda ash and phosphate. Dimension stones, geothermal, petroleum and other metallic, industrial, and chemical minerals have also been found. Despite all these occurrences, mineral development remained limited. The Government of Ethiopia is taking steps to attract foreign investment in these areas.
Ethiopia signed to the Convention on the Settlement of Investment Disputes between State and Nationals of other States on September 21, 1965 and improved its position in providing excellent market access for many products. Ethiopia is a member of the African Union, New Partnership for Africa's Development, Common Market for Eastern and Southern Africa, the Cotonou Agreement for renegotiating the trade links between the European Union and the African, Caribbean and Pacific countries - the Lomé convention, the United States' African Growth and Opportunity Act and the European Union led Everything But Arms initiatives. It is also a beneficiary of the generalized system of preferences and is party to the Convention for the Multilateral Investment Guarantee Agency. Since the inception of the new regime and gradual liberalization of the economy, interest had been shown by foreign investors in the country.
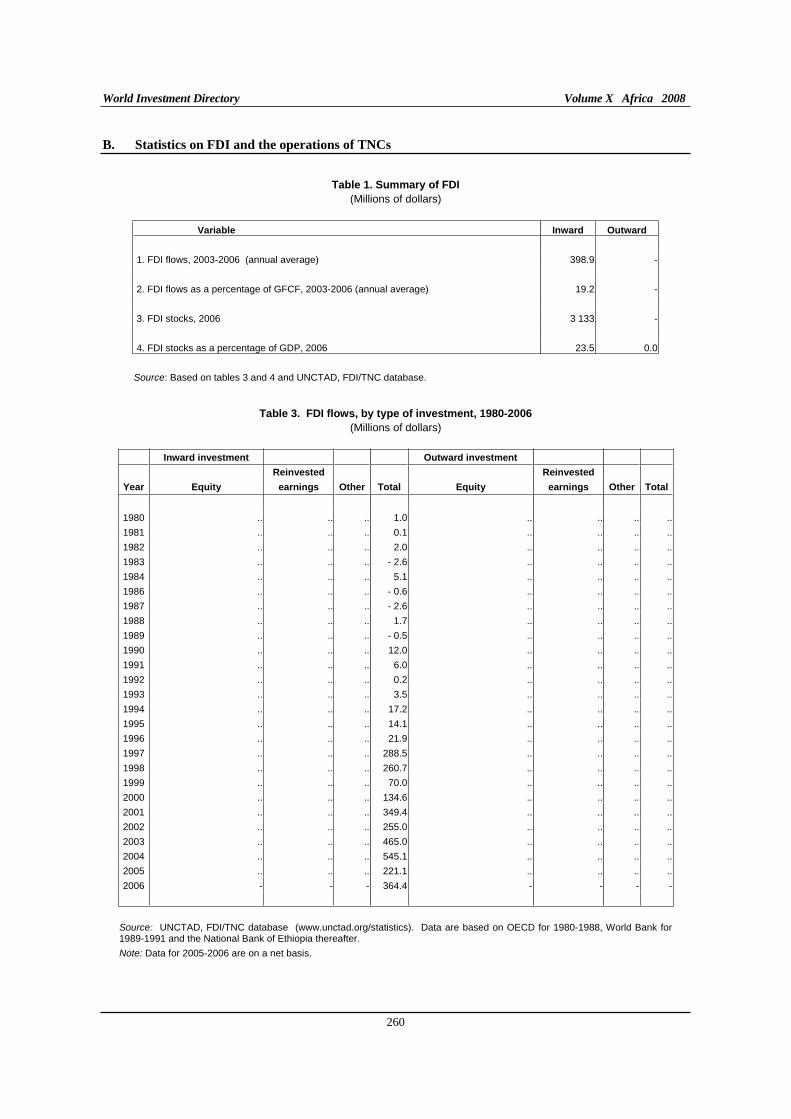
World Investment Directory Volume X Africa 2008
260
B. Statistics on FDI and the operations of TNCs
Table 1. Summary of FDI
(Millions of dollars)
Variable Inward Outward
1. FDI flows, 2003-2006 (annual average) 398.9 -
2. FDI flows as a percentage of GFCF, 2003-2006 (annual average) 19.2 -
3. FDI stocks, 2006 3 133 -
4. FDI stocks as a percentage of GDP, 2006 23.5 0.0
Source: Based on tables 3 and 4 and UNCTAD, FDI/TNC database.
Table 3. FDI flows, by type of investment, 1980-2006
(Millions of dollars)
Inward investment Outward investment
Reinvested Reinvested
Year Equity earnings Other Total Equity earnings Other Total
1980 .. .. .. 1.0 .. .. .. ..
1981 .. .. .. 0.1 .. .. .. ..
1982 .. .. .. 2.0 .. .. .. ..
1983 .. .. .. - 2.6 .. .. .. ..
1984 .. .. .. 5.1 .. .. .. ..
1986 .. .. .. - 0.6 .. .. .. ..
1987 .. .. .. - 2.6 .. .. .. ..
1988 .. .. .. 1.7 .. .. .. ..
1989 .. .. .. - 0.5 .. .. .. ..
1990 .. .. .. 12.0 .. .. .. ..
1991 .. .. .. 6.0 .. .. .. ..
1992 .. .. .. 0.2 .. .. .. ..
1993 .. .. .. 3.5 .. .. .. ..
1994 .. .. .. 17.2 .. .. .. ..
1995 .. .. .. 14.1 .. .. .. ..
1996 .. .. .. 21.9 .. .. .. ..
1997 .. .. .. 288.5 .. .. .. ..
1998 .. .. .. 260.7 .. .. .. ..
1999 .. .. .. 70.0 .. .. .. ..
2000 .. .. .. 134.6 .. .. .. ..
2001 .. .. .. 349.4 .. .. .. ..
2002 .. .. .. 255.0 .. .. .. ..
2003 .. .. .. 465.0 .. .. .. ..
2004 .. .. .. 545.1 .. .. .. ..
2005 .. .. .. 221.1 .. .. .. ..
2006 - - - 364.4 - - - -
Source: UNCTAD, FDI/TNC database (www.unctad.org/statistics). Data are based on OECD for 1980-1988, World Bank for 1989-1991 and the National Bank of Ethiopia thereafter.
Note: Data for 2005-2006 are on a net basis.
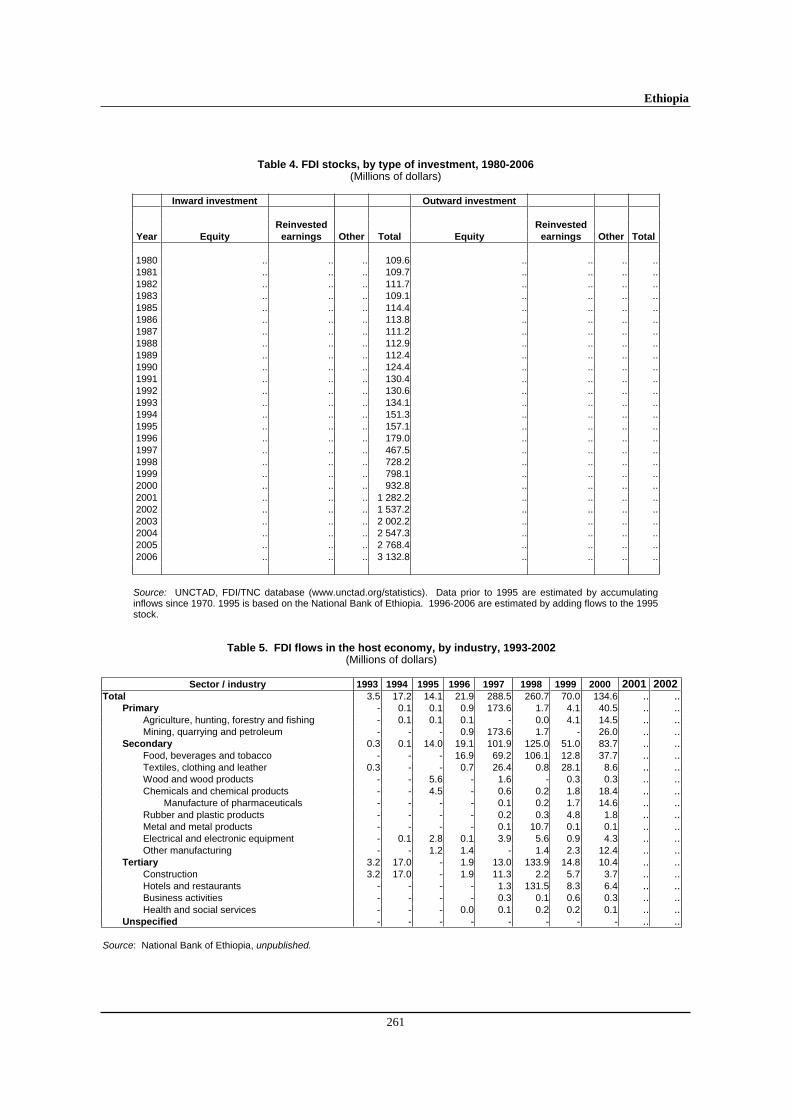
Ethiopia
261
Table 4. FDI stocks, by type of investment, 1980-2006 (Millions of dollars)
Inward investment Outward investment
Reinvested Reinvested
Year Equity earnings Other Total Equity earnings Other Total 1980 .. .. .. 109.6 .. .. .. ..1981 .. .. .. 109.7 .. .. .. ..1982 .. .. .. 111.7 .. .. .. ..1983 .. .. .. 109.1 .. .. .. ..1985 .. .. .. 114.4 .. .. .. ..1986 .. .. .. 113.8 .. .. .. ..1987 .. .. .. 111.2 .. .. .. ..1988 .. .. .. 112.9 .. .. .. ..1989 .. .. .. 112.4 .. .. .. ..1990 .. .. .. 124.4 .. .. .. ..1991 .. .. .. 130.4 .. .. .. ..1992 .. .. .. 130.6 .. .. .. ..1993 .. .. .. 134.1 .. .. .. ..1994 .. .. .. 151.3 .. .. .. ..1995 .. .. .. 157.1 .. .. .. ..1996 .. .. .. 179.0 .. .. .. ..1997 .. .. .. 467.5 .. .. .. ..1998 .. .. .. 728.2 .. .. .. ..1999 .. .. .. 798.1 .. .. .. ..2000 .. .. .. 932.8 .. .. .. ..2001 .. .. .. 1 282.2 .. .. .. ..2002 .. .. .. 1 537.2 .. .. .. ..2003 .. .. .. 2 002.2 .. .. .. ..2004 .. .. .. 2 547.3 .. .. .. ..2005 .. .. .. 2 768.4 .. .. .. ..2006 .. .. .. 3 132.8 .. .. .. .. Source: UNCTAD, FDI/TNC database (www.unctad.org/statistics). Data prior to 1995 are estimated by accumulating inflows since 1970. 1995 is based on the National Bank of Ethiopia. 1996-2006 are estimated by adding flows to the 1995 stock.
Table 5. FDI flows in the host economy, by industry, 1993-2002 (Millions of dollars)
Sector / industry 1993 1994 1995 1996 1997 1998 1999 2000 2001 2002
Total 3.5 17.2 14.1 21.9 288.5 260.7 70.0 134.6 .. ..Primary - 0.1 0.1 0.9 173.6 1.7 4.1 40.5 .. ..
Agriculture, hunting, forestry and fishing - 0.1 0.1 0.1 - 0.0 4.1 14.5 .. ..Mining, quarrying and petroleum - - - 0.9 173.6 1.7 - 26.0 .. ..
Secondary 0.3 0.1 14.0 19.1 101.9 125.0 51.0 83.7 .. ..Food, beverages and tobacco - - - 16.9 69.2 106.1 12.8 37.7 .. ..Textiles, clothing and leather 0.3 - - 0.7 26.4 0.8 28.1 8.6 .. ..Wood and wood products - - 5.6 - 1.6 - 0.3 0.3 .. ..Chemicals and chemical products - - 4.5 - 0.6 0.2 1.8 18.4 .. ..
Manufacture of pharmaceuticals - - - - 0.1 0.2 1.7 14.6 .. ..Rubber and plastic products - - - - 0.2 0.3 4.8 1.8 .. ..Metal and metal products - - - - 0.1 10.7 0.1 0.1 .. ..Electrical and electronic equipment - 0.1 2.8 0.1 3.9 5.6 0.9 4.3 .. ..Other manufacturing - - 1.2 1.4 - 1.4 2.3 12.4 .. ..
Tertiary 3.2 17.0 - 1.9 13.0 133.9 14.8 10.4 .. ..Construction 3.2 17.0 - 1.9 11.3 2.2 5.7 3.7 .. ..Hotels and restaurants - - - - 1.3 131.5 8.3 6.4 .. ..Business activities - - - - 0.3 0.1 0.6 0.3 .. ..Health and social services - - - 0.0 0.1 0.2 0.2 0.1 .. ..
Unspecified - - - - - - - - .. .. Source: National Bank of Ethiopia, unpublished.
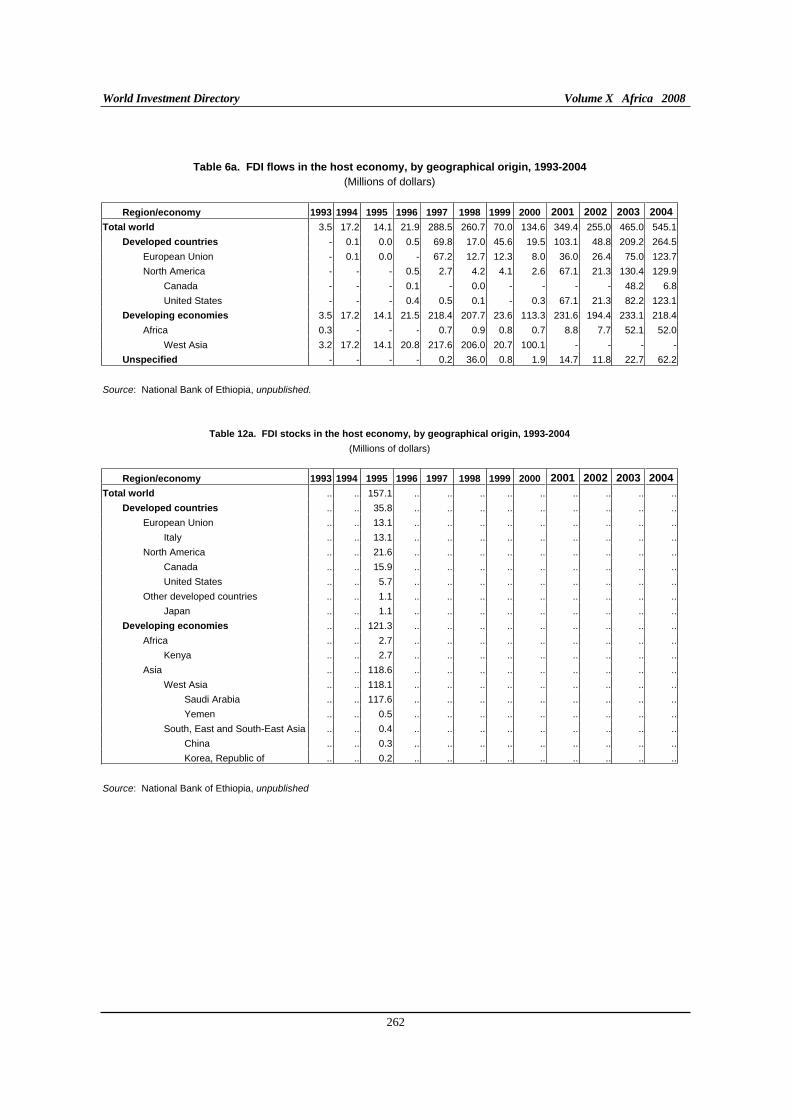
World Investment Directory Volume X Africa 2008
262
Table 6a. FDI flows in the host economy, by geographical origin, 1993-2004
(Millions of dollars)
Region/economy 1993 1994 1995 1996 1997 1998 1999 2000 2001 2002 2003 2004
Total world 3.5 17.2 14.1 21.9 288.5 260.7 70.0 134.6 349.4 255.0 465.0 545.1
Developed countries - 0.1 0.0 0.5 69.8 17.0 45.6 19.5 103.1 48.8 209.2 264.5
European Union - 0.1 0.0 - 67.2 12.7 12.3 8.0 36.0 26.4 75.0 123.7
North America - - - 0.5 2.7 4.2 4.1 2.6 67.1 21.3 130.4 129.9
Canada - - - 0.1 - 0.0 - - - - 48.2 6.8
United States - - - 0.4 0.5 0.1 - 0.3 67.1 21.3 82.2 123.1
Developing economies 3.5 17.2 14.1 21.5 218.4 207.7 23.6 113.3 231.6 194.4 233.1 218.4
Africa 0.3 - - - 0.7 0.9 0.8 0.7 8.8 7.7 52.1 52.0
West Asia 3.2 17.2 14.1 20.8 217.6 206.0 20.7 100.1 - - - -
Unspecified - - - - 0.2 36.0 0.8 1.9 14.7 11.8 22.7 62.2
Source: National Bank of Ethiopia, unpublished.
Table 12a. FDI stocks in the host economy, by geographical origin, 1993-2004
(Millions of dollars)
Region/economy 1993 1994 1995 1996 1997 1998 1999 2000 2001 2002 2003 2004
Total world .. .. 157.1 .. .. .. .. .. .. .. .. ..
Developed countries .. .. 35.8 .. .. .. .. .. .. .. .. ..
European Union .. .. 13.1 .. .. .. .. .. .. .. .. ..
Italy .. .. 13.1 .. .. .. .. .. .. .. .. ..
North America .. .. 21.6 .. .. .. .. .. .. .. .. ..
Canada .. .. 15.9 .. .. .. .. .. .. .. .. ..
United States .. .. 5.7 .. .. .. .. .. .. .. .. ..
Other developed countries .. .. 1.1 .. .. .. .. .. .. .. .. ..
Japan .. .. 1.1 .. .. .. .. .. .. .. .. ..
Developing economies .. .. 121.3 .. .. .. .. .. .. .. .. ..
Africa .. .. 2.7 .. .. .. .. .. .. .. .. ..
Kenya .. .. 2.7 .. .. .. .. .. .. .. .. ..
Asia .. .. 118.6 .. .. .. .. .. .. .. .. ..
West Asia .. .. 118.1 .. .. .. .. .. .. .. .. ..
Saudi Arabia .. .. 117.6 .. .. .. .. .. .. .. .. ..
Yemen .. .. 0.5 .. .. .. .. .. .. .. .. ..
South, East and South-East Asia .. .. 0.4 .. .. .. .. .. .. .. .. ..
China .. .. 0.3 .. .. .. .. .. .. .. .. ..
Korea, Republic of .. .. 0.2 .. .. .. .. .. .. .. .. ..
Source: National Bank of Ethiopia, unpublished
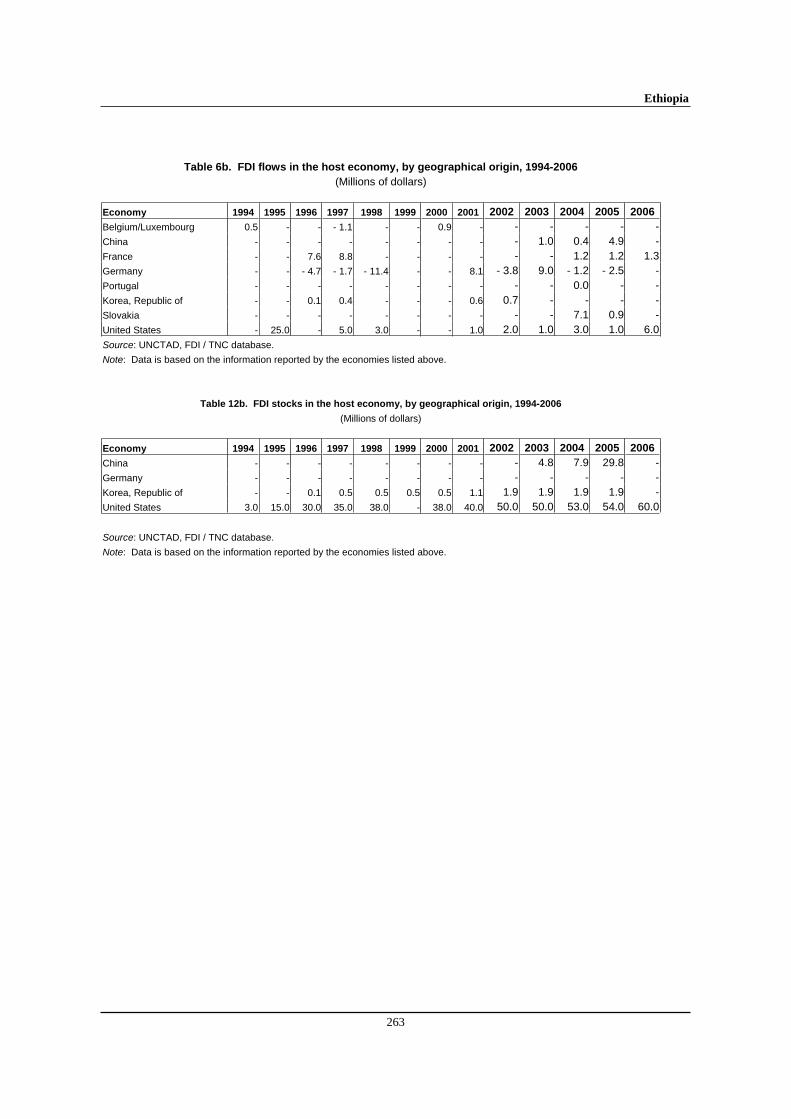
Ethiopia
263
Table 6b. FDI flows in the host economy, by geographical origin, 1994-2006
(Millions of dollars)
Economy 1994 1995 1996 1997 1998 1999 2000 2001 2002 2003 2004 2005 2006
Belgium/Luxembourg 0.5 - - - 1.1 - - 0.9 - - - - - -China - - - - - - - - - 1.0 0.4 4.9 -France - - 7.6 8.8 - - - - - - 1.2 1.2 1.3Germany - - - 4.7 - 1.7 - 11.4 - - 8.1 - 3.8 9.0 - 1.2 - 2.5 -Portugal - - - - - - - - - - 0.0 - -Korea, Republic of - - 0.1 0.4 - - - 0.6 0.7 - - - -Slovakia - - - - - - - - - - 7.1 0.9 -United States - 25.0 - 5.0 3.0 - - 1.0 2.0 1.0 3.0 1.0 6.0Source: UNCTAD, FDI / TNC database.
Note: Data is based on the information reported by the economies listed above.
Table 12b. FDI stocks in the host economy, by geographical origin, 1994-2006
(Millions of dollars)
Economy 1994 1995 1996 1997 1998 1999 2000 2001 2002 2003 2004 2005 2006
China - - - - - - - - - 4.8 7.9 29.8 -Germany - - - - - - - - - - - - -Korea, Republic of - - 0.1 0.5 0.5 0.5 0.5 1.1 1.9 1.9 1.9 1.9 -United States 3.0 15.0 30.0 35.0 38.0 - 38.0 40.0 50.0 50.0 53.0 54.0 60.0
Source: UNCTAD, FDI / TNC database.
Note: Data is based on the information reported by the economies listed above.
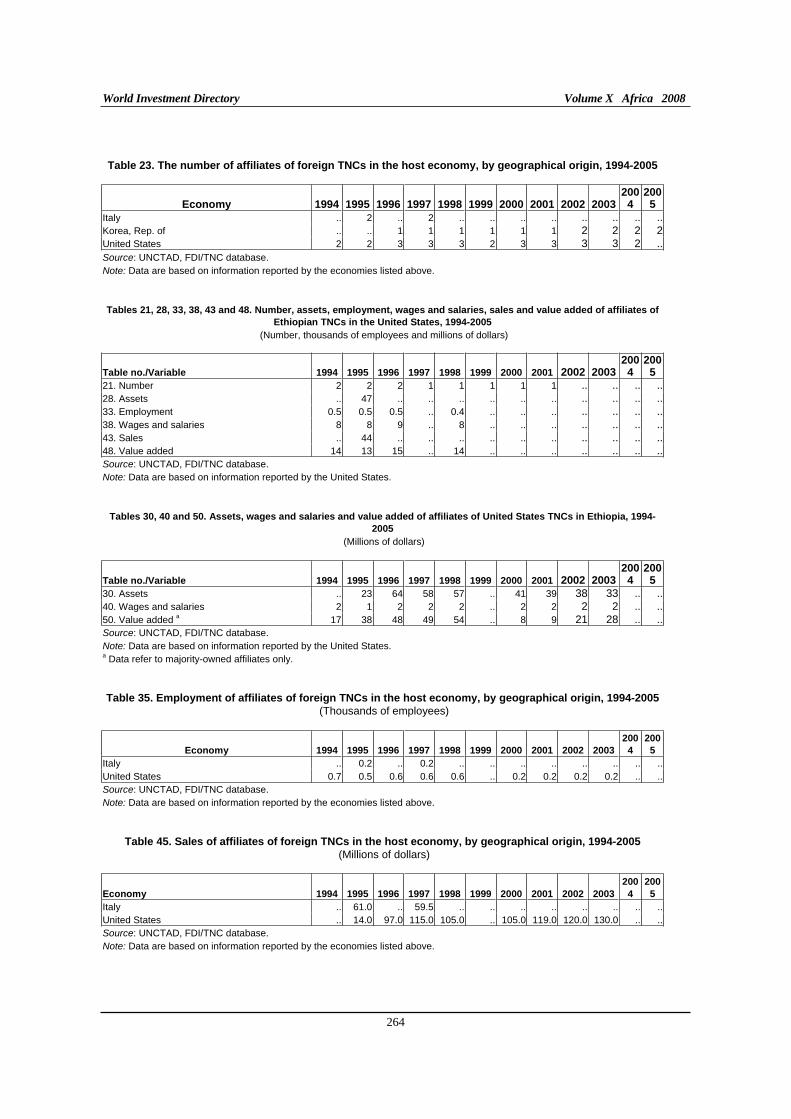
World Investment Directory Volume X Africa 2008
264
Table 23. The number of affiliates of foreign TNCs in the host economy, by geographical origin, 1994-2005
Economy 1994 1995 1996 1997 1998 1999 2000 2001 2002 2003 2004
2005
Italy .. 2 .. 2 .. .. .. .. .. .. .. ..Korea, Rep. of .. .. 1 1 1 1 1 1 2 2 2 2United States 2 2 3 3 3 2 3 3 3 3 2 ..Source: UNCTAD, FDI/TNC database. Note: Data are based on information reported by the economies listed above. Tables 21, 28, 33, 38, 43 and 48. Number, assets, employment, wages and salaries, sales and value added of affiliates of
Ethiopian TNCs in the United States, 1994-2005
(Number, thousands of employees and millions of dollars)
Table no./Variable 1994 1995 1996 1997 1998 1999 2000 2001 2002 2003 2004
2005
21. Number 2 2 2 1 1 1 1 1 .. .. .. ..28. Assets .. 47 .. .. .. .. .. .. .. .. .. ..33. Employment 0.5 0.5 0.5 .. 0.4 .. .. .. .. .. .. ..38. Wages and salaries 8 8 9 .. 8 .. .. .. .. .. .. ..43. Sales .. 44 .. .. .. .. .. .. .. .. .. ..48. Value added 14 13 15 .. 14 .. .. .. .. .. .. ..Source: UNCTAD, FDI/TNC database. Note: Data are based on information reported by the United States.
Tables 30, 40 and 50. Assets, wages and salaries and value added of affiliates of United States TNCs in Ethiopia, 1994-
2005
(Millions of dollars)
Table no./Variable 1994 1995 1996 1997 1998 1999 2000 2001 2002 2003 2004
2005
30. Assets .. 23 64 58 57 .. 41 39 38 33 .. ..40. Wages and salaries 2 1 2 2 2 .. 2 2 2 2 .. ..50. Value added a 17 38 48 49 54 .. 8 9 21 28 .. ..Source: UNCTAD, FDI/TNC database. Note: Data are based on information reported by the United States. a Data refer to majority-owned affiliates only. Table 35. Employment of affiliates of foreign TNCs in the host economy, by geographical origin, 1994-2005
(Thousands of employees)
Economy 1994 1995 1996 1997 1998 1999 2000 2001 2002 2003
200
4
200
5
Italy .. 0.2 .. 0.2 .. .. .. .. .. .. .. ..United States 0.7 0.5 0.6 0.6 0.6 .. 0.2 0.2 0.2 0.2 .. ..Source: UNCTAD, FDI/TNC database. Note: Data are based on information reported by the economies listed above.
Table 45. Sales of affiliates of foreign TNCs in the host economy, by geographical origin, 1994-2005 (Millions of dollars)
Economy 1994 1995 1996 1997 1998 1999 2000 2001 2002 2003
200
4
200
5
Italy .. 61.0 .. 59.5 .. .. .. .. .. .. .. ..United States .. 14.0 97.0 115.0 105.0 .. 105.0 119.0 120.0 130.0 .. ..Source: UNCTAD, FDI/TNC database. Note: Data are based on information reported by the economies listed above.
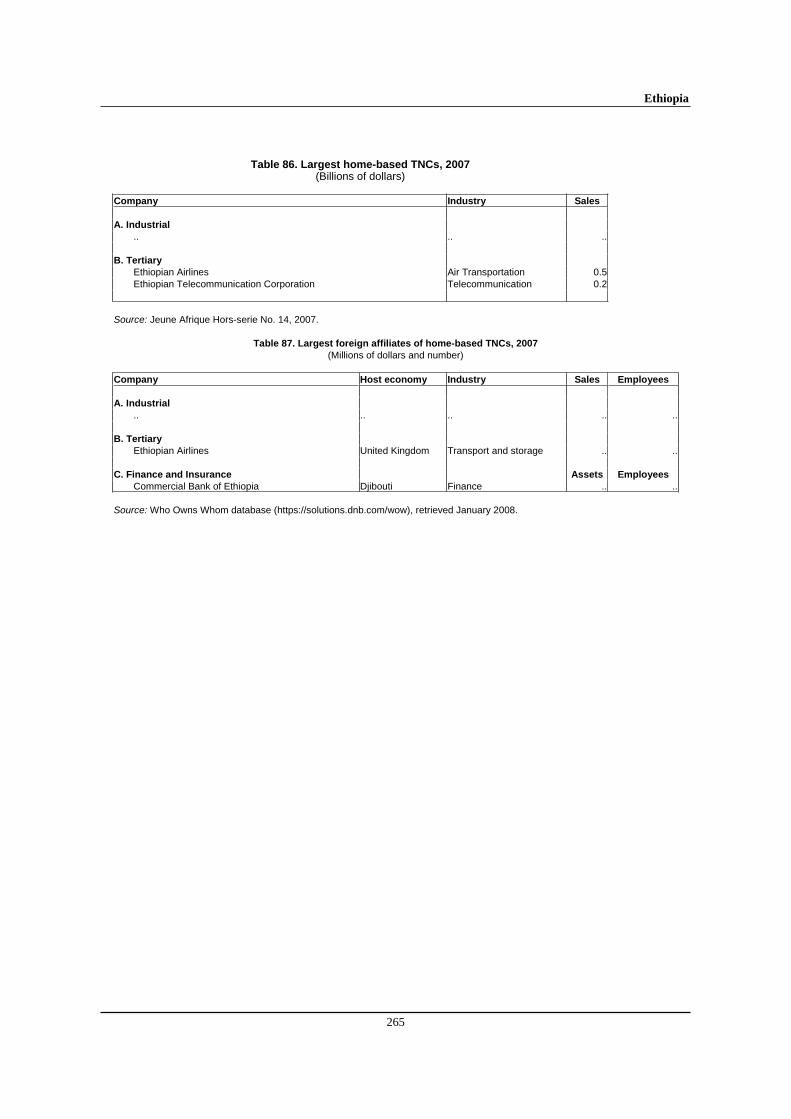
Ethiopia
265
Table 86. Largest home-based TNCs, 2007 (Billions of dollars)
Company Industry Sales
A. Industrial
.. .. .. B. Tertiary
Ethiopian Airlines Air Transportation 0.5 Ethiopian Telecommunication Corporation Telecommunication 0.2
Source: Jeune Afrique Hors-serie No. 14, 2007.
Table 87. Largest foreign affiliates of home-based TNCs, 2007 (Millions of dollars and number)
Company Host economy Industry Sales Employees
A. Industrial
.. .. .. .. .. B. Tertiary
Ethiopian Airlines United Kingdom Transport and storage .. .. C. Finance and Insurance Assets Employees
Commercial Bank of Ethiopia Djibouti Finance .. .. Source: Who Owns Whom database (https://solutions.dnb.com/wow), retrieved January 2008.
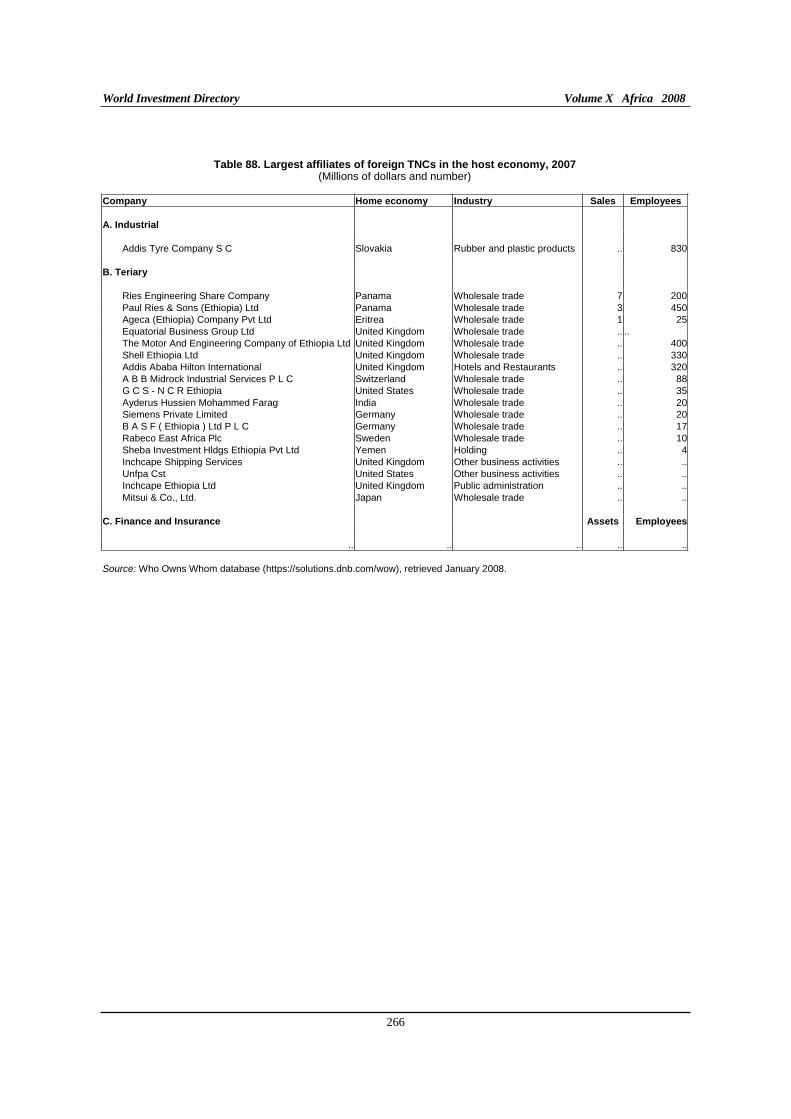
World Investment Directory Volume X Africa 2008
266
Table 88. Largest affiliates of foreign TNCs in the host economy, 2007 (Millions of dollars and number)
Company Home economy Industry Sales Employees
A. Industrial
Addis Tyre Company S C Slovakia Rubber and plastic products .. 830
B. Teriary
Ries Engineering Share Company Panama Wholesale trade 7 200Paul Ries & Sons (Ethiopia) Ltd Panama Wholesale trade 3 450Ageca (Ethiopia) Company Pvt Ltd Eritrea Wholesale trade 1 25Equatorial Business Group Ltd United Kingdom Wholesale trade .. .. The Motor And Engineering Company of Ethiopia Ltd United Kingdom Wholesale trade .. 400Shell Ethiopia Ltd United Kingdom Wholesale trade .. 330Addis Ababa Hilton International United Kingdom Hotels and Restaurants .. 320A B B Midrock Industrial Services P L C Switzerland Wholesale trade .. 88G C S - N C R Ethiopia United States Wholesale trade .. 35Ayderus Hussien Mohammed Farag India Wholesale trade .. 20Siemens Private Limited Germany Wholesale trade .. 20B A S F ( Ethiopia ) Ltd P L C Germany Wholesale trade .. 17Rabeco East Africa Plc Sweden Wholesale trade .. 10Sheba Investment Hldgs Ethiopia Pvt Ltd Yemen Holding .. 4Inchcape Shipping Services United Kingdom Other business activities .. ..Unfpa Cst United States Other business activities .. ..Inchcape Ethiopia Ltd United Kingdom Public administration .. ..Mitsui & Co., Ltd. Japan Wholesale trade .. ..
C. Finance and Insurance Assets Employees
.. .. .. .. .. Source: Who Owns Whom database (https://solutions.dnb.com/wow), retrieved January 2008.
Ethiopia
267
C. Legal frameworks for transnational corporations
In Ethiopia, a number of legal instruments adopted at national, bilateral and international levels exist to facilitate and regulate the activities of foreign direct investors and transnational corporations. The key among these instruments include:
I. National framework
The Maritime Code Proclamation No. 164/1960. Source: Negarit Gazeta of the Empire of Ethiopia, 19th year Extraordinary Issue No.1.
Civil Code Proclamation No. 165/1960. Source: Negarit Gazeta of the Empire of Ethiopia, 19th year Extraordinary Issue No.2.
Commercial Code Proclamation No. 166/1960. Source: Negarit Gazeta of the Empire of Ethiopia, 19th year Extraordinary Issue No.3.
Labour Proclamation No. 42/1993. Source: Federal Negarit Gazeta of the Transitional Government of Ethiopia, 53rd year, No. 27, page 268.
Mining Proclamation No. 52/1993. Source: Negarit Gazeta of the Transitional Government of Ethiopia, 52nd year, No. 42, page 368.
Monetary and Banking Proclamation No. 83/1994. Source: Federal Negarit Gazeta of the Transitional Government of Ethiopia, 53rd year, No. 43, page 226.
Licensing and Supervision of Banking Business Proclamation No. 84/1994. Source: Federal Negarit Gazeta of the Transitional Government of Ethiopia, 53rd year, No. 44, page 244.
Development Bank of Ethiopia Establishment Council of Ministers Regulation No. 200/1994. Source: Federal Negarit Gazeta of the Transitional Government of Ethiopia, 52nd year, No. 109, page 483.
Commercial Registration and Business Licensing Proclamation No.67/1997. Source: Federal Negarit Gazeta of the Federal Democratic Republic of Ethiopia, 3rd year, No. 25, page 367.
Federal Government Commercial Registration and Licensing Regulation No. 67/1997. Source: Federal Negarit Gazeta of the Federal Democratic Republic of Ethiopia, 3rd year, No. 28, page 433.
Export Trade Duty Incentive Scheme Proclamation No. 249/2001. Source: Federal Negarit Gazeta of the Federal Democratic Republic of Ethiopia, 7th year, No. 39, page 1591.
Investment Proclamation No. 280/2002 as amended by the Investment (Amendment) Proclamation, ratified by the People's Representatives Council on 27 October 2003. Source: Federal Negarit Gazeta of the Federal Democratic Republic of Ethiopia, 8th year, No. 27, page 1768.
Value Added Tax Proclamation No. 283/2002. Source: Federal Negarit Gazeta of the Federal Democratic Republic of Ethiopia, 8th year, No. 33, page 1832, as amended.
Investment Incentives and Investment Areas Reserved or Domestic Investors Council of Ministers Regulations No. 84/2003. Source: Federal Negarit Gazeta of the Federal Democratic Republic of Ethiopia, 9th year, No. 34, page 2092.
World Investment Directory Volume X Africa 2008
268
Income Tax Proclamation No. 286/2003-12-04. Source: Federal Negarit Gazeta of the Federal Democratic Republic of Ethiopia, 8th year, page 867.
National Foreign Investment Promotion Advisory Council established 2006. Source: http://www.buyusainfo.net/docs/x_7373050.pdf.
II. International Framework
A. Ethiopia is a party to the following multilateral and regional instruments:
Convention on the Settlement of Investment Disputes Between States and Nationals of Other States of 18 March 1965. Entered into force on 14 October 1966.
Convention Establishing the Multilateral Investment Guarantee Agency of 11 October 1985. Entered into force on 12 April 1988.
Fourth ACP-EEC Convention signed at Lomé on 15 December 1989, Official Journal L 229, 17/08/1991 p. 0003 – 0280.
Treaty Establishing the Market for Eastern and Southern Africa (COMESA), 1993.
Partnership Agreement Between the Members of the African, Caribbean and Pacific Group of States of the one Part, and the European Community and Its Member States, of the Other Part, Signed in Cotonou, Benin on 23 June 2000
B. Bilateral treaties
1. Bilateral investment treaties for the protection and promotion of investments: Italy 1994, Kuwait 1996, China 1998, Malaysia 1998, Switzerland 1998, Yemen 1999, Russian Federation 2000, Sudan 2000, Tunisia 2000, Turkey 2000, Denmark 2001, Algeria 2002 and France 2003, Israel 2003, Iran, Islamic Republic of 2003, Netherlands 2003, Austria 2004, Germany 2004, Libyan Arab Jamahiriya 2004, Sweden 2004, Belgium and Luxembourg 2006, Egypt 2006, Finland 2006.
2. Bilateral treaties for the avoidance of double taxation: United Kingdom 1977, Algeria 2002, Tunisia 2003, Israel 2004, South Africa 2004, Iran, Islamic Republic of 2005, Turkey 2005.
C. Other treaties:
Investment agreement for the COMESA Common Investment Area (2007).
Ethiopia
269
D. Sources of information
Official
Ethiopian Investment Agency
Ethiopian Privatisation Agency (ethiomarket.com/epa).
Secondary
Bahru, Zewde (1991). A Modern History of Ethiopia (James Currey).
Befekadu, Degefe and Berhanu Nega (eds) (1999). Annual Report on the Ethiopian Economy, Vol. 1. 1999/2000 (Addis Ababa: Ethiopian Economics Association).
Bereket, Kebede and Mekonen Tadesse (1996). The Ethiopian Economy: Poverty and Poverty Alleviation
(Addis Ababa).
Christopher, Clapham (1988). Continuity and Change in Revolutionary Ethiopia (Cambridge: Cambridge University Press).
Economist Intelligence Unit (EIU) (various years). Country Profile: Ethiopia (London: EIU Ltd.).
_______________ (various years). Country Report: Ethiopia (London: EIU Ltd.).
Getachew, Yared and Abdulhamid, Bedri Kello (eds) (1994). The Ethiopian Economy: Problems and
Prospects of Private-Sector Development (Addis Ababa).
Graham, Hancock (1993). Sign and the seal (New York: Touchstone Books).
International Monetary Fund (IMF) (2001). HIPC Decision Point Document for the Enhanced Heavily
Indebted Poor Countries (HIPC) Initiative (Washington D.C.: IMF).
______________(2002). Ethiopia: 2002 Article IV Consultation and Third Review Under the Poverty
Reduction and Growth Facility Arrangement—Staff Report; Staff Statement; and Public Information Notice and News Brief on the Executive Board Discussion, October. K. Griffin (ed) (1992). The
Economy of Ethiopia (London: St Martin’s Press).
_______________(2006). IMF's Sub-Saharan Africa Regional Economic Outlook, March 10, 2006. (Washington D.C.: IMF).
Martin, R. Doornboos et al (eds) (1992). Beyond Conflict in the Horn (James Currey).
Markakis, John (1987). National Class Conflict in the Horn of Africa (Cambridge: Cambridge University Press).
Mekonen, Tadesse and Abdulhamid, Bedri Kello (eds) (1994). The Ethiopian Economy: Problems of
Adjustment (Addis Ababa).
Soderbom, M. and F. Teal (2004). "Size and Efficiency in Africa Manufacturing firms: Evidence from Firm-Level Panel Data." Journal of Development Economics, 73. pp 369 - 394.
United Nations Conference on Trade and Development (UNCTAD) (1999). Investment Guide to Ethiopia(Geneva: UNCTAD/PricewaterhouseCoopers/International Chamber of Commerce).
World Investment Directory Volume X Africa 2008
270
________________(2002a). FDI in the Least Developed Countries at a Glance (Geneva: UNCTAD/ITE/IIA/6).
________________(2002b). Investment and Innovation Policy Review: Ethiopia (Geneva: UNCTAD/ITE/IIA/6).
________________(2005a). Investor-Disputes Arising from Investment Treaties: A Review. UNCTAD Series of International Investment Policies for Development (UNCTAD/ITE/IIT/2005/4).
________________(2005b). A Survey of Support by Investment Promotion Agencies to Linkages. Advisory Studies No. 18 (UNCTAD/ITE/IPC/2005/12).
________________(2005c). FDI in least developed countries at a glance: 2005/2006(UNCTAD/ITE/IIA/2005/17).
United Nations Industrial Development Organisation (UNIDO) (1996). Ethiopia: New Directions of
Industrial Policy, Geneva, 1991; Ethiopia: Accelerating Industrial Growth Through Market Reforms
(Vienna: UNIDO).
United States Trade Representative (2006). 2006 Comprehensive Report on U.S. Trade and Investment
Policy Toward Sub-Saharan Africa and Implementation of the Africa Growth and Opportunity Act:
The Sixth of Eight Annual Reports, May 2006. (Washington D.C.: US Government).
World Bank/International Finance Corporation (2007). Doing Business 2008 Ethiopia (Washington D.C.: The World Bank Group).
Gabon
271
Gabon
A. Definitions and sources of data
The Investment Law in Gabon (Law 015/98) does not contain a specific definition of foreign direct investment (FDI). Data on FDI in Gabon is gathered from Banque Centrale des Etats d'Afrique Centrale (BEAC). The International Monetary Fund also provides data on FDI in the country in its balance-of-payments statistics.
In Gabon, foreign investors face few restrictions in most areas and foreign businesses may compete with local businesses. The new investment charter streamlines and liberalizes the foreign investment climate in the country; for example, it grants foreign companies with head offices in Gabon the same rights as Gabonese companies. The government dominates the most lucrative economic sectors, most notably oil. Residents may hold foreign exchange accounts and non-residents may hold them if they receive prior approval from the government. Transfers and payments, including repatriation of profits, to countries outside of France, Monaco, members of the West African Economic and Monetary Union, members of the Communauté Economique et Monétaire de l'Afrique Centrale (CEMAC) and Comoros must be approved by the Government. Capital transactions are subject to various requirements, controls and official authorization. Private property is moderately well-protected in Gabon. The judiciary is also generally independent.
Gabon's FDI strategy is developing. Ties between Gabon and France have remained strong. As a result, Gabon's oil sector has been dominated by large French companies, particularly TotalFinaElf which gained exclusive access to Gabon's oil exploration. Since the 1990s, Gabon introduced new oil production-sharing contracts to attract new entrants and prefers to focus less on seeking big new discoveries and more on attracting companies skilled in extracting more from older fields and exploiting smaller but more marginal fields. Gabon also has one of the world's largest remaining pristine ecosystems and possesses minerals including manganese ore, uranium, iron ore, gold, niobium and phosphates. Some prospecting for diamonds and other minerals is taking place, and deposits of lead, gold, zinc, titanium, niobium, iron and copper have been identified, although commercial production has not yet begun.
To increase its outreach to the world and expand trading opportunities, Gabon signed to the Convention on the Settlement of Investment Disputes between State and Nationals of other States on 21 September 1965 and is a member of the regional integration schemes in Africa and other international market access arrangements. It is a member of the CEMAC, New Partnership for Africa's Development and the African Union. It is an eligible member of the United States' market access initiative for African countries – the African Growth and Opportunity Act, the Cotonou Agreement for renegotiating the trade links between the European Union and the African, Caribbean and Pacific countries - the Lomé convention and the Everything But Arms initiative. It is a member of the World Trade Organization.
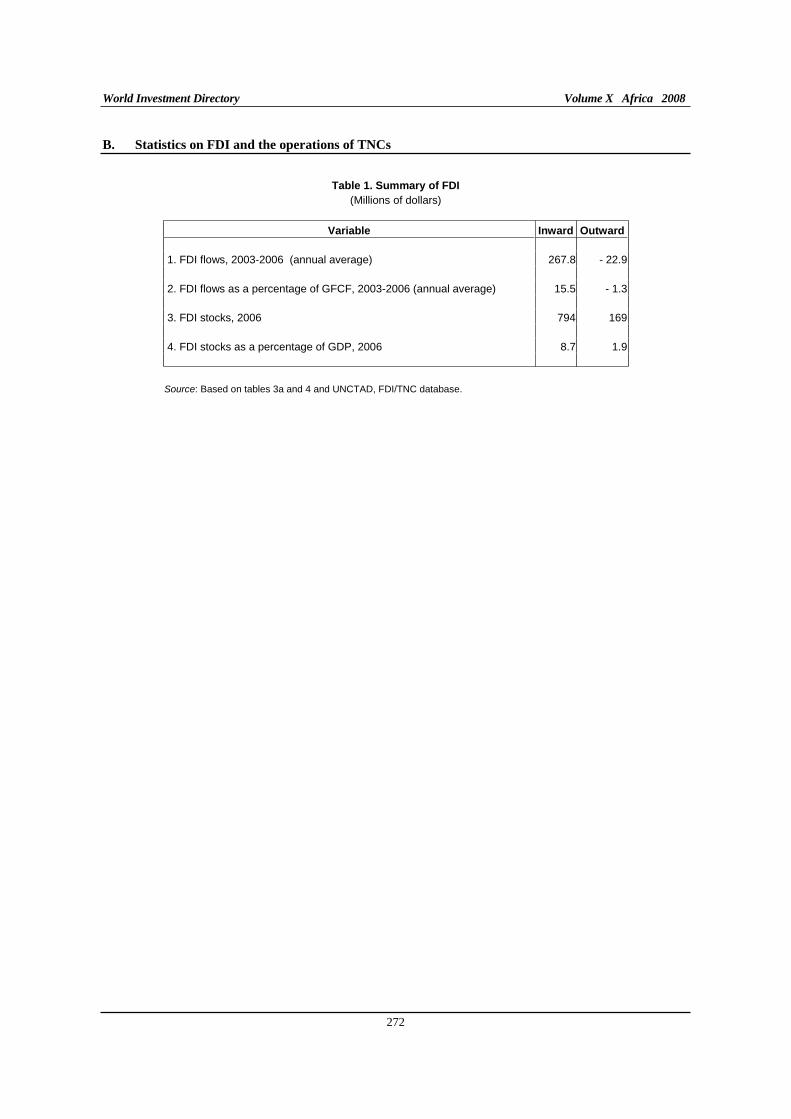
World Investment Directory Volume X Africa 2008
272
B. Statistics on FDI and the operations of TNCs
Table 1. Summary of FDI
(Millions of dollars)
Variable Inward Outward
1. FDI flows, 2003-2006 (annual average) 267.8 - 22.9
2. FDI flows as a percentage of GFCF, 2003-2006 (annual average) 15.5 - 1.3
3. FDI stocks, 2006 794 169
4. FDI stocks as a percentage of GDP, 2006 8.7 1.9
Source: Based on tables 3a and 4 and UNCTAD, FDI/TNC database.
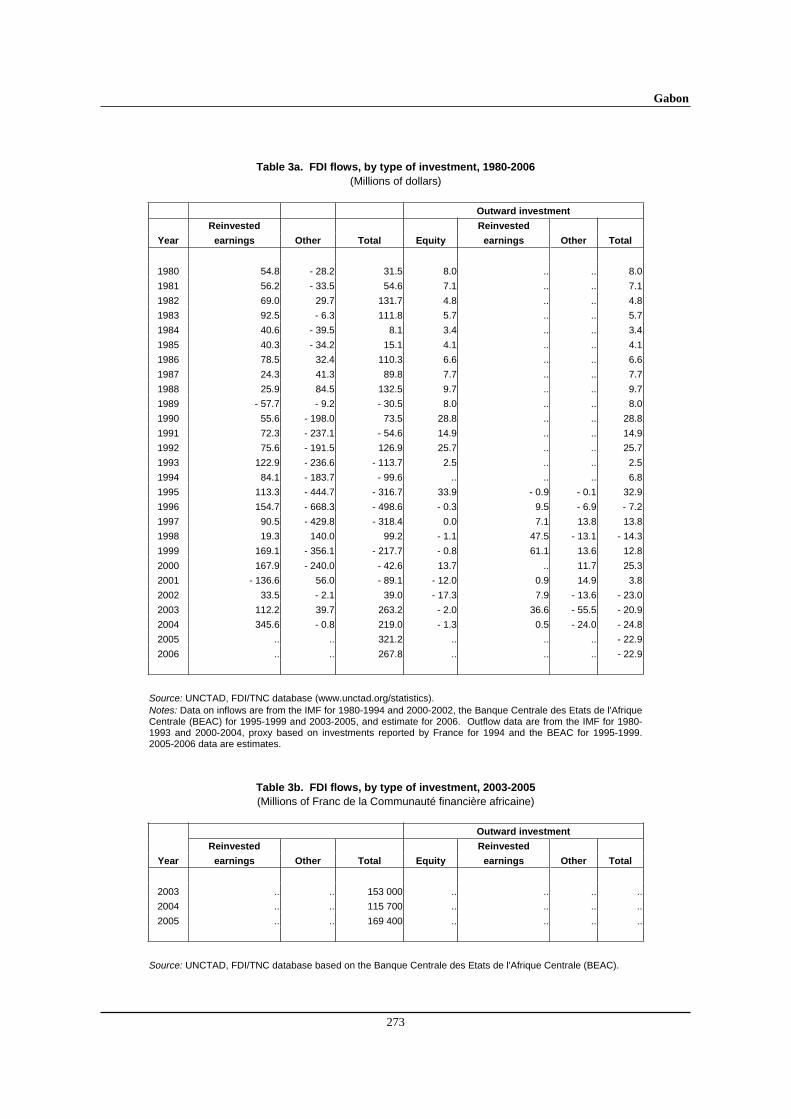
Gabon
273
Table 3a. FDI flows, by type of investment, 1980-2006
(Millions of dollars)
Outward investment
Reinvested Reinvested
Year earnings Other Total Equity earnings Other Total
1980 54.8 - 28.2 31.5 8.0 .. .. 8.0
1981 56.2 - 33.5 54.6 7.1 .. .. 7.1
1982 69.0 29.7 131.7 4.8 .. .. 4.8
1983 92.5 - 6.3 111.8 5.7 .. .. 5.7
1984 40.6 - 39.5 8.1 3.4 .. .. 3.4
1985 40.3 - 34.2 15.1 4.1 .. .. 4.1
1986 78.5 32.4 110.3 6.6 .. .. 6.6
1987 24.3 41.3 89.8 7.7 .. .. 7.7
1988 25.9 84.5 132.5 9.7 .. .. 9.7
1989 - 57.7 - 9.2 - 30.5 8.0 .. .. 8.0
1990 55.6 - 198.0 73.5 28.8 .. .. 28.8
1991 72.3 - 237.1 - 54.6 14.9 .. .. 14.9
1992 75.6 - 191.5 126.9 25.7 .. .. 25.7
1993 122.9 - 236.6 - 113.7 2.5 .. .. 2.5
1994 84.1 - 183.7 - 99.6 .. .. .. 6.8
1995 113.3 - 444.7 - 316.7 33.9 - 0.9 - 0.1 32.9
1996 154.7 - 668.3 - 498.6 - 0.3 9.5 - 6.9 - 7.2
1997 90.5 - 429.8 - 318.4 0.0 7.1 13.8 13.8
1998 19.3 140.0 99.2 - 1.1 47.5 - 13.1 - 14.3
1999 169.1 - 356.1 - 217.7 - 0.8 61.1 13.6 12.8
2000 167.9 - 240.0 - 42.6 13.7 .. 11.7 25.3
2001 - 136.6 56.0 - 89.1 - 12.0 0.9 14.9 3.8
2002 33.5 - 2.1 39.0 - 17.3 7.9 - 13.6 - 23.0
2003 112.2 39.7 263.2 - 2.0 36.6 - 55.5 - 20.9
2004 345.6 - 0.8 219.0 - 1.3 0.5 - 24.0 - 24.8
2005 .. .. 321.2 .. .. .. - 22.9
2006 .. .. 267.8 .. .. .. - 22.9
Source: UNCTAD, FDI/TNC database (www.unctad.org/statistics). Notes: Data on inflows are from the IMF for 1980-1994 and 2000-2002, the Banque Centrale des Etats de l'Afrique Centrale (BEAC) for 1995-1999 and 2003-2005, and estimate for 2006. Outflow data are from the IMF for 1980-1993 and 2000-2004, proxy based on investments reported by France for 1994 and the BEAC for 1995-1999. 2005-2006 data are estimates.
Table 3b. FDI flows, by type of investment, 2003-2005
(Millions of Franc de la Communauté financière africaine)
Outward investment
Reinvested Reinvested
Year earnings Other Total Equity earnings Other Total
2003 .. .. 153 000 .. .. .. ..
2004 .. .. 115 700 .. .. .. ..
2005 .. .. 169 400 .. .. .. ..
Source: UNCTAD, FDI/TNC database based on the Banque Centrale des Etats de l'Afrique Centrale (BEAC).
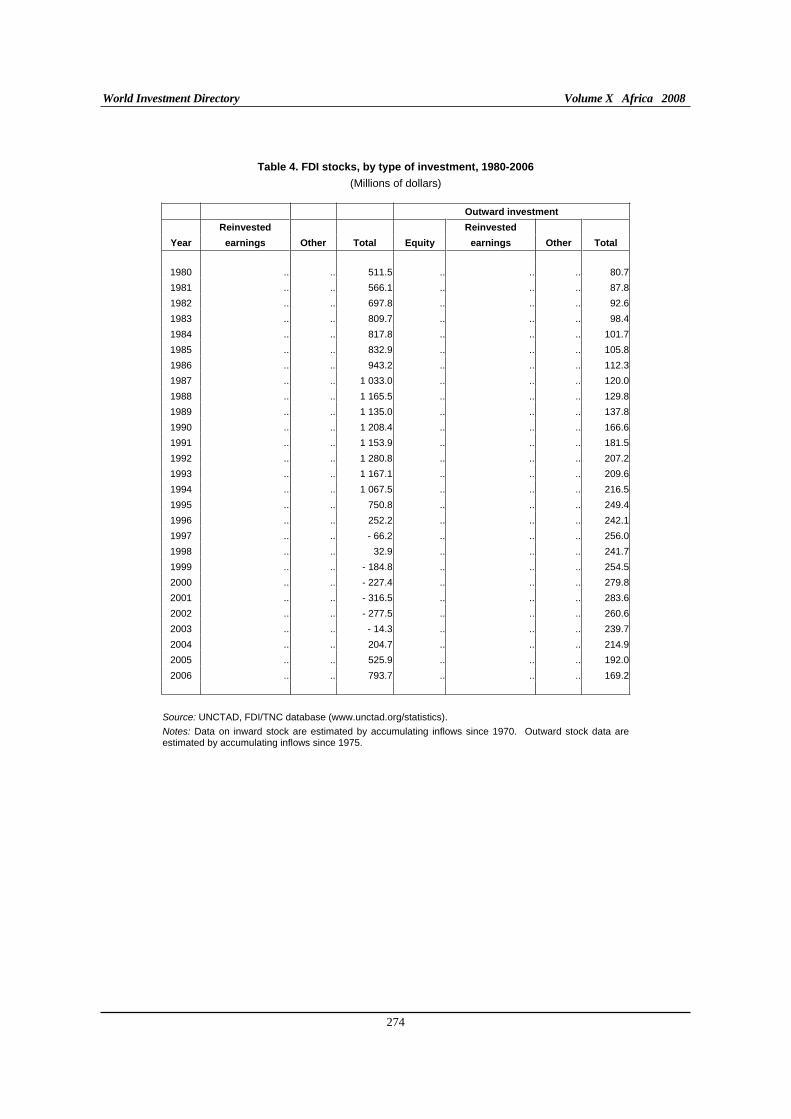
World Investment Directory Volume X Africa 2008
274
Table 4. FDI stocks, by type of investment, 1980-2006
(Millions of dollars)
Outward investment
Reinvested Reinvested
Year earnings Other Total Equity earnings Other Total
1980 .. .. 511.5 .. .. .. 80.7
1981 .. .. 566.1 .. .. .. 87.8
1982 .. .. 697.8 .. .. .. 92.6
1983 .. .. 809.7 .. .. .. 98.4
1984 .. .. 817.8 .. .. .. 101.7
1985 .. .. 832.9 .. .. .. 105.8
1986 .. .. 943.2 .. .. .. 112.3
1987 .. .. 1 033.0 .. .. .. 120.0
1988 .. .. 1 165.5 .. .. .. 129.8
1989 .. .. 1 135.0 .. .. .. 137.8
1990 .. .. 1 208.4 .. .. .. 166.6
1991 .. .. 1 153.9 .. .. .. 181.5
1992 .. .. 1 280.8 .. .. .. 207.2
1993 .. .. 1 167.1 .. .. .. 209.6
1994 .. .. 1 067.5 .. .. .. 216.5
1995 .. .. 750.8 .. .. .. 249.4
1996 .. .. 252.2 .. .. .. 242.1
1997 .. .. - 66.2 .. .. .. 256.0
1998 .. .. 32.9 .. .. .. 241.7
1999 .. .. - 184.8 .. .. .. 254.5
2000 .. .. - 227.4 .. .. .. 279.8
2001 .. .. - 316.5 .. .. .. 283.6
2002 .. .. - 277.5 .. .. .. 260.6
2003 .. .. - 14.3 .. .. .. 239.7
2004 .. .. 204.7 .. .. .. 214.9
2005 .. .. 525.9 .. .. .. 192.0
2006 .. .. 793.7 .. .. .. 169.2 Source: UNCTAD, FDI/TNC database (www.unctad.org/statistics).
Notes: Data on inward stock are estimated by accumulating inflows since 1970. Outward stock data are estimated by accumulating inflows since 1975.
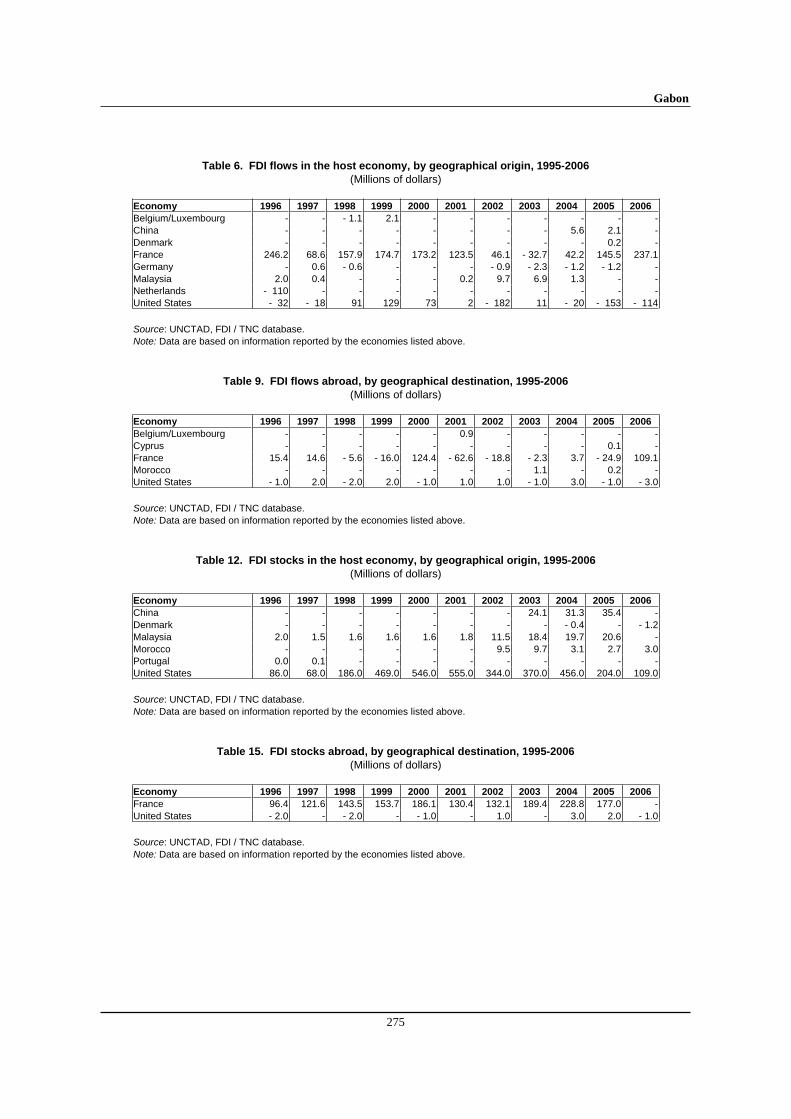
Gabon
275
Table 6. FDI flows in the host economy, by geographical origin, 1995-2006
(Millions of dollars) Economy 1996 1997 1998 1999 2000 2001 2002 2003 2004 2005 2006
Belgium/Luxembourg - - - 1.1 2.1 - - - - - - -China - - - - - - - - 5.6 2.1 -Denmark - - - - - - - - - 0.2 -France 246.2 68.6 157.9 174.7 173.2 123.5 46.1 - 32.7 42.2 145.5 237.1Germany - 0.6 - 0.6 - - - - 0.9 - 2.3 - 1.2 - 1.2 -Malaysia 2.0 0.4 - - - 0.2 9.7 6.9 1.3 - -Netherlands - 110 - - - - - - - - - -United States - 32 - 18 91 129 73 2 - 182 11 - 20 - 153 - 114
Source: UNCTAD, FDI / TNC database. Note: Data are based on information reported by the economies listed above.
Table 9. FDI flows abroad, by geographical destination, 1995-2006
(Millions of dollars) Economy 1996 1997 1998 1999 2000 2001 2002 2003 2004 2005 2006
Belgium/Luxembourg - - - - - 0.9 - - - - -Cyprus - - - - - - - - - 0.1 -France 15.4 14.6 - 5.6 - 16.0 124.4 - 62.6 - 18.8 - 2.3 3.7 - 24.9 109.1Morocco - - - - - - - 1.1 - 0.2 -United States - 1.0 2.0 - 2.0 2.0 - 1.0 1.0 1.0 - 1.0 3.0 - 1.0 - 3.0
Source: UNCTAD, FDI / TNC database. Note: Data are based on information reported by the economies listed above.
Table 12. FDI stocks in the host economy, by geographical origin, 1995-2006
(Millions of dollars) Economy 1996 1997 1998 1999 2000 2001 2002 2003 2004 2005 2006
China - - - - - - - 24.1 31.3 35.4 -Denmark - - - - - - - - - 0.4 - - 1.2Malaysia 2.0 1.5 1.6 1.6 1.6 1.8 11.5 18.4 19.7 20.6 -Morocco - - - - - - 9.5 9.7 3.1 2.7 3.0Portugal 0.0 0.1 - - - - - - - - -United States 86.0 68.0 186.0 469.0 546.0 555.0 344.0 370.0 456.0 204.0 109.0
Source: UNCTAD, FDI / TNC database. Note: Data are based on information reported by the economies listed above.
Table 15. FDI stocks abroad, by geographical destination, 1995-2006
(Millions of dollars) Economy 1996 1997 1998 1999 2000 2001 2002 2003 2004 2005 2006
France 96.4 121.6 143.5 153.7 186.1 130.4 132.1 189.4 228.8 177.0 -United States - 2.0 - - 2.0 - - 1.0 - 1.0 - 3.0 2.0 - 1.0
Source: UNCTAD, FDI / TNC database. Note: Data are based on information reported by the economies listed above.
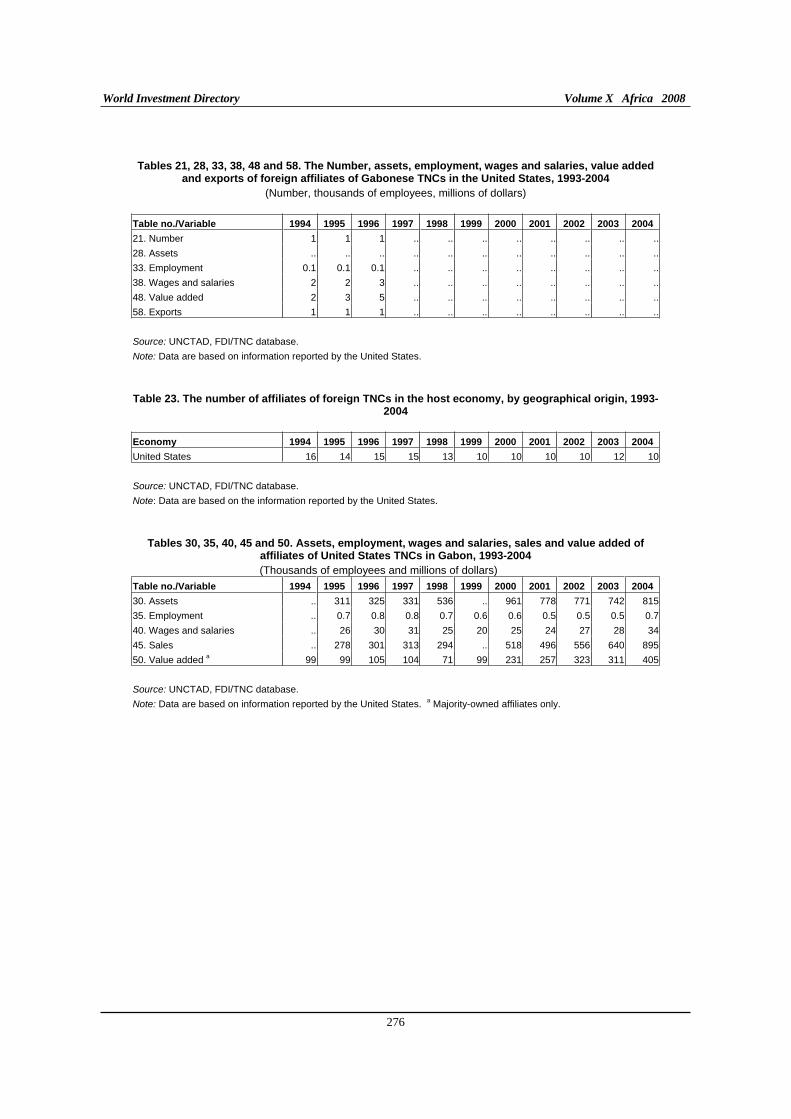
World Investment Directory Volume X Africa 2008
276
Tables 21, 28, 33, 38, 48 and 58. The Number, assets, employment, wages and salaries, value added and exports of foreign affiliates of Gabonese TNCs in the United States, 1993-2004
(Number, thousands of employees, millions of dollars)
Table no./Variable 1994 1995 1996 1997 1998 1999 2000 2001 2002 2003 2004
21. Number 1 1 1 .. .. .. .. .. .. .. ..
28. Assets .. .. .. .. .. .. .. .. .. .. ..
33. Employment 0.1 0.1 0.1 .. .. .. .. .. .. .. ..
38. Wages and salaries 2 2 3 .. .. .. .. .. .. .. ..
48. Value added 2 3 5 .. .. .. .. .. .. .. ..
58. Exports 1 1 1 .. .. .. .. .. .. .. ..
Source: UNCTAD, FDI/TNC database.
Note: Data are based on information reported by the United States.
Table 23. The number of affiliates of foreign TNCs in the host economy, by geographical origin, 1993-2004
Economy 1994 1995 1996 1997 1998 1999 2000 2001 2002 2003 2004
United States 16 14 15 15 13 10 10 10 10 12 10
Source: UNCTAD, FDI/TNC database.
Note: Data are based on the information reported by the United States.
Tables 30, 35, 40, 45 and 50. Assets, employment, wages and salaries, sales and value added of affiliates of United States TNCs in Gabon, 1993-2004
(Thousands of employees and millions of dollars)
Table no./Variable 1994 1995 1996 1997 1998 1999 2000 2001 2002 2003 2004
30. Assets .. 311 325 331 536 .. 961 778 771 742 815
35. Employment .. 0.7 0.8 0.8 0.7 0.6 0.6 0.5 0.5 0.5 0.7
40. Wages and salaries .. 26 30 31 25 20 25 24 27 28 34
45. Sales .. 278 301 313 294 .. 518 496 556 640 895
50. Value added a 99 99 105 104 71 99 231 257 323 311 405
Source: UNCTAD, FDI/TNC database.
Note: Data are based on information reported by the United States. a Majority-owned affiliates only.
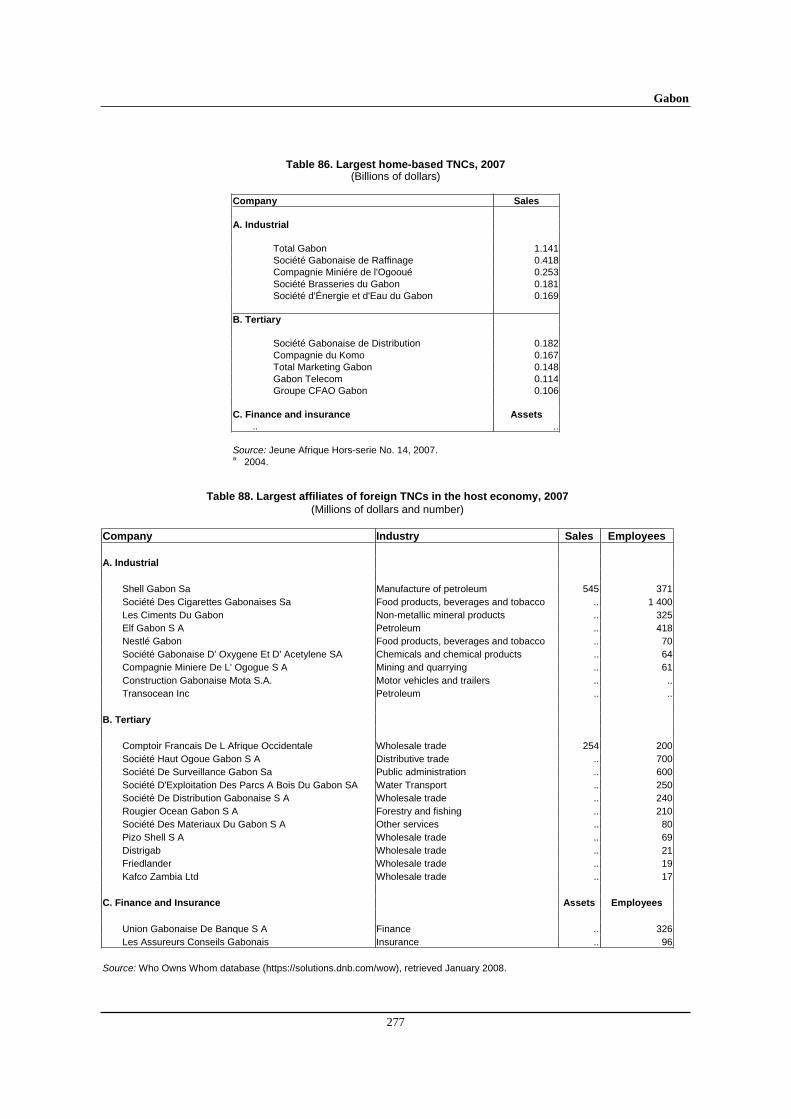
Gabon
277
Table 86. Largest home-based TNCs, 2007 (Billions of dollars)
Company Sales
A. Industrial
Total Gabon 1.141 Société Gabonaise de Raffinage 0.418 Compagnie Miniére de l'Ogooué 0.253 Société Brasseries du Gabon 0.181 Société d'Énergie et d'Eau du Gabon 0.169
B. Tertiary
Société Gabonaise de Distribution 0.182 Compagnie du Komo 0.167 Total Marketing Gabon 0.148 Gabon Telecom 0.114 Groupe CFAO Gabon 0.106
C. Finance and insurance Assets
.. ..
Source: Jeune Afrique Hors-serie No. 14, 2007.a 2004.
Table 88. Largest affiliates of foreign TNCs in the host economy, 2007 (Millions of dollars and number)
Company Industry Sales Employees A. Industrial
Shell Gabon Sa Manufacture of petroleum 545 371Société Des Cigarettes Gabonaises Sa Food products, beverages and tobacco .. 1 400Les Ciments Du Gabon Non-metallic mineral products .. 325Elf Gabon S A Petroleum .. 418Nestlé Gabon Food products, beverages and tobacco .. 70Société Gabonaise D' Oxygene Et D' Acetylene SA Chemicals and chemical products .. 64Compagnie Miniere De L' Ogogue S A Mining and quarrying .. 61Construction Gabonaise Mota S.A. Motor vehicles and trailers .. ..Transocean Inc Petroleum .. ..
B. Tertiary
Comptoir Francais De L Afrique Occidentale Wholesale trade 254 200Société Haut Ogoue Gabon S A Distributive trade .. 700Société De Surveillance Gabon Sa Public administration .. 600Société D'Exploitation Des Parcs A Bois Du Gabon SA Water Transport .. 250Société De Distribution Gabonaise S A Wholesale trade .. 240Rougier Ocean Gabon S A Forestry and fishing .. 210Société Des Materiaux Du Gabon S A Other services .. 80Pizo Shell S A Wholesale trade .. 69Distrigab Wholesale trade .. 21Friedlander Wholesale trade .. 19Kafco Zambia Ltd Wholesale trade .. 17
C. Finance and Insurance Assets Employees
Union Gabonaise De Banque S A Finance .. 326Les Assureurs Conseils Gabonais Insurance .. 96
Source: Who Owns Whom database (https://solutions.dnb.com/wow), retrieved January 2008.
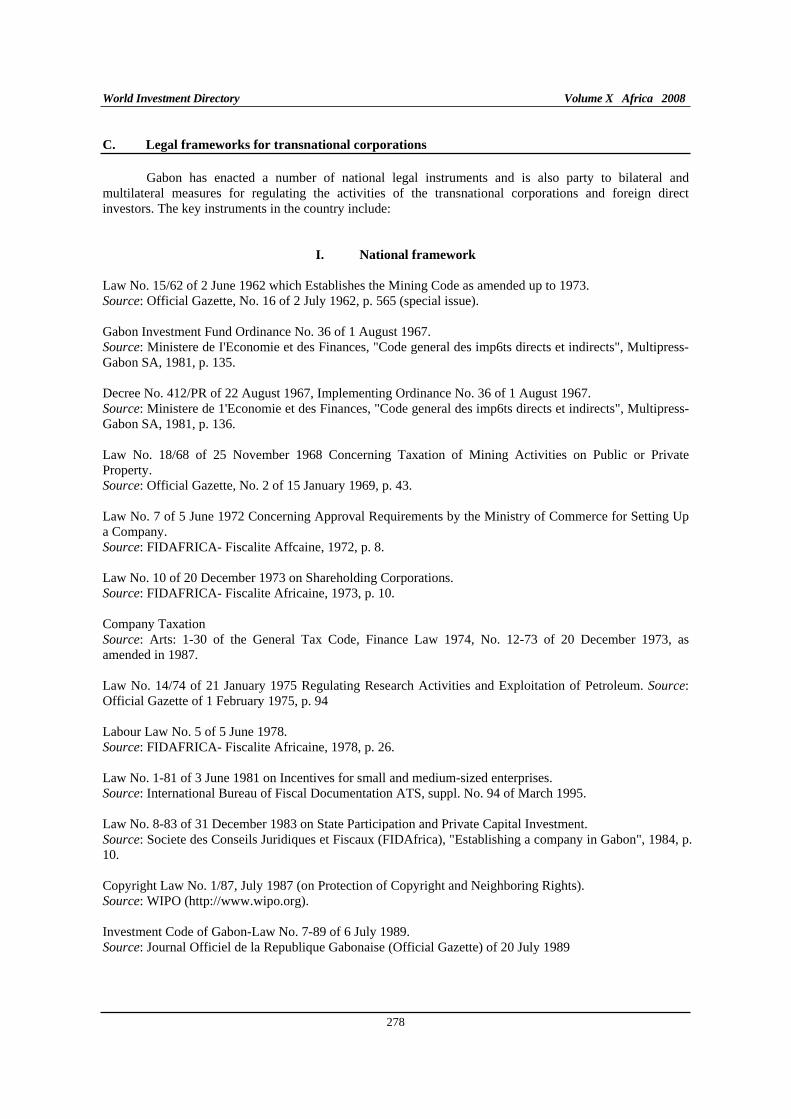
World Investment Directory Volume X Africa 2008
278
C. Legal frameworks for transnational corporations
Gabon has enacted a number of national legal instruments and is also party to bilateral and multilateral measures for regulating the activities of the transnational corporations and foreign direct investors. The key instruments in the country include:
I. National framework
Law No. 15/62 of 2 June 1962 which Establishes the Mining Code as amended up to 1973. Source: Official Gazette, No. 16 of 2 July 1962, p. 565 (special issue).
Gabon Investment Fund Ordinance No. 36 of 1 August 1967. Source: Ministere de I'Economie et des Finances, "Code general des imp6ts directs et indirects", Multipress-Gabon SA, 1981, p. 135.
Decree No. 412/PR of 22 August 1967, Implementing Ordinance No. 36 of 1 August 1967. Source: Ministere de 1'Economie et des Finances, "Code general des imp6ts directs et indirects", Multipress-Gabon SA, 1981, p. 136.
Law No. 18/68 of 25 November 1968 Concerning Taxation of Mining Activities on Public or Private Property. Source: Official Gazette, No. 2 of 15 January 1969, p. 43.
Law No. 7 of 5 June 1972 Concerning Approval Requirements by the Ministry of Commerce for Setting Up a Company. Source: FIDAFRICA- Fiscalite Affcaine, 1972, p. 8.
Law No. 10 of 20 December 1973 on Shareholding Corporations. Source: FIDAFRICA- Fiscalite Africaine, 1973, p. 10.
Company Taxation Source: Arts: 1-30 of the General Tax Code, Finance Law 1974, No. 12-73 of 20 December 1973, as amended in 1987.
Law No. 14/74 of 21 January 1975 Regulating Research Activities and Exploitation of Petroleum. Source:Official Gazette of 1 February 1975, p. 94
Labour Law No. 5 of 5 June 1978. Source: FIDAFRICA- Fiscalite Africaine, 1978, p. 26.
Law No. 1-81 of 3 June 1981 on Incentives for small and medium-sized enterprises. Source: International Bureau of Fiscal Documentation ATS, suppl. No. 94 of March 1995.
Law No. 8-83 of 31 December 1983 on State Participation and Private Capital Investment. Source: Societe des Conseils Juridiques et Fiscaux (FIDAfrica), "Establishing a company in Gabon", 1984, p. 10.
Copyright Law No. 1/87, July 1987 (on Protection of Copyright and Neighboring Rights). Source: WIPO (http://www.wipo.org).
Investment Code of Gabon-Law No. 7-89 of 6 July 1989. Source: Journal Officiel de la Republique Gabonaise (Official Gazette) of 20 July 1989
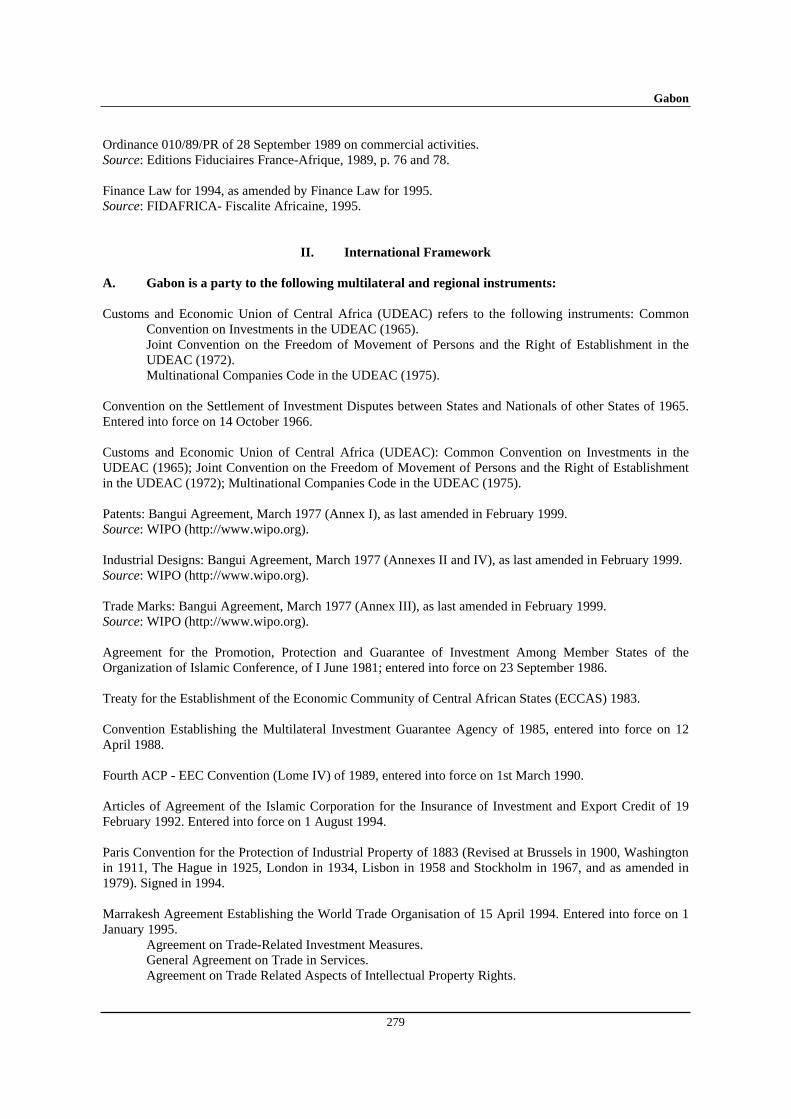
Gabon
279
Ordinance 010/89/PR of 28 September 1989 on commercial activities. Source: Editions Fiduciaires France-Afrique, 1989, p. 76 and 78.
Finance Law for 1994, as amended by Finance Law for 1995. Source: FIDAFRICA- Fiscalite Africaine, 1995.
II. International Framework
A. Gabon is a party to the following multilateral and regional instruments:
Customs and Economic Union of Central Africa (UDEAC) refers to the following instruments: Common Convention on Investments in the UDEAC (1965). Joint Convention on the Freedom of Movement of Persons and the Right of Establishment in the UDEAC (1972).
Multinational Companies Code in the UDEAC (1975).
Convention on the Settlement of Investment Disputes between States and Nationals of other States of 1965. Entered into force on 14 October 1966.
Customs and Economic Union of Central Africa (UDEAC): Common Convention on Investments in the UDEAC (1965); Joint Convention on the Freedom of Movement of Persons and the Right of Establishment in the UDEAC (1972); Multinational Companies Code in the UDEAC (1975).
Patents: Bangui Agreement, March 1977 (Annex I), as last amended in February 1999. Source: WIPO (http://www.wipo.org).
Industrial Designs: Bangui Agreement, March 1977 (Annexes II and IV), as last amended in February 1999. Source: WIPO (http://www.wipo.org).
Trade Marks: Bangui Agreement, March 1977 (Annex III), as last amended in February 1999. Source: WIPO (http://www.wipo.org).
Agreement for the Promotion, Protection and Guarantee of Investment Among Member States of the Organization of Islamic Conference, of I June 1981; entered into force on 23 September 1986.
Treaty for the Establishment of the Economic Community of Central African States (ECCAS) 1983.
Convention Establishing the Multilateral Investment Guarantee Agency of 1985, entered into force on 12 April 1988.
Fourth ACP - EEC Convention (Lome IV) of 1989, entered into force on 1st March 1990.
Articles of Agreement of the Islamic Corporation for the Insurance of Investment and Export Credit of 19 February 1992. Entered into force on 1 August 1994.
Paris Convention for the Protection of Industrial Property of 1883 (Revised at Brussels in 1900, Washington in 1911, The Hague in 1925, London in 1934, Lisbon in 1958 and Stockholm in 1967, and as amended in 1979). Signed in 1994.
Marrakesh Agreement Establishing the World Trade Organisation of 15 April 1994. Entered into force on 1 January 1995. Agreement on Trade-Related Investment Measures. General Agreement on Trade in Services. Agreement on Trade Related Aspects of Intellectual Property Rights.
World Investment Directory Volume X Africa 2008
280
Partnership Agreement between the Members of The African, Caribbean and Pacific Group of States, of the one part and the European Community and its member states, of the other part signed in Cotonou, Benin on 23 June 2000.
B. Bilateral treaties
1. Bilateral investment treaties for the protection and promotion of investments: Italy 1968, Germany 1969, Switzerland 1972, France 1974, Romania 1979, Spain 1995, China 1997, Egypt 1997, Belgium/Luxembourg 1998, Germany 1998, Lebanon 2001, Portugal 2001, Morocco 2004, Mali 2005.
2. Bilateral treaties for the avoidance of double taxation: France 1966, Italy 1999, Lebanon 2001, Canada 2002, South Africa 2005.
Gabon
281
D. Sources of information
Official
Bank of Central African States (www.beac.int).
Secondary
Albert Schweitzer (1998). The Primeval Forest, including On the Edge of the Primeval Forest (Washington D.C.: Albert Schweitzer Institute for the Humanities).
Douglas A Yates (1996). The Rentier State in Africa: Oil Rent Dependency and Neocolonialism in the
Republic of Gabon, (Jerusalem: Red Sea Press).
Economist Intelligence Unit (EIU) (various years). Country Profile: Gabon (London: EIU Ltd.).
______________ (various years). Country Report: Gabon (London: EIU Ltd.).
International Monetary Fund (IMF) (1996). Aftermath of the CFA Franc Devaluation (Washington D.C.: IMF).
_______________(2002). Gabon: Selected Issues and Statistical Annex (Washington D.C.: IMF).
_______________(2006). IMF's Sub-Saharan Africa Regional Economic Outlook, March 10, 2006. (Washington D.C.: IMF).
Marc Aicardi de Saint-Paul (1987). Du roi Denis a Omar Bongo (Paris: Albatros).
Morisset, J. (2001). "Foreign direct investment in Africa: policies also matter", OECD Global Forum on International Investment (Paris: OECD).
Multilateral Investment Guarantee Agency (MIGA) (2003). "Doing business in Africa: potential returns and improving conditions helps shape investor perceptions", MIGA news, vol. II, No. 1, p. 8.
OECD (2002). FDI from developing countries: A vector for trade and development (Paris: OECD).
Soderbom, M. and F. Teal (2004). "Size and Efficiency in Africa Manufacturing firms: Evidence from Firm-Level Panel Data." Journal of Development Economics, 73. pp 369 - 394.
United Nations Conference on Trade and Development (UNCTAD) (2005a). Investor-Disputes Arising from
Investment Treaties: A Review. UNCTAD Series of International Investment Policies for Development (UNCTAD/ITE/IIT/2005/4).
_____________(2005b). A Survey of Support by Investment Promotion Agencies to Linkages. Advisory Studies No. 18 (UNCTAD/ITE/IPC/2005/12).
_____________(2005c). FDI in least developed countries at a glance: 2005/2006
(UNCTAD/ITE/IIA/2005/17).
United States Department of State, Bureau of African Affairs (1995). "Investment climate report: sub-Saharan Africa" (Washington D.C.: United States Department of State).
United States Trade Representative (2006). 2006 Comprehensive Report on U.S. Trade and Investment
Policy Toward Sub-Saharan Africa and Implementation of the Africa Growth and Opportunity Act:
The Sixth of Eight Annual Reports, May 2006. (Washington D.C.: US Government).

World Investment Directory Volume X Africa 2008
282
Walter, Andrew (1998). Globalization and policy convergence: the case of direct investment rules (London School of Economics - http://personal.lse.ac.uk/wyattwal/Beiler-Higgott%20final%202.pdf).
Warburg, S. G. (1996). Republic of Gabon (Libreville), December.
World Bank/International Finance Corporation (2007). Doing Business 2008 Gabon (Washington D.C.: The World Bank Group).
Gambia
283
The Gambia
A. Definitions and sources of data
In The Gambia, the Development Act of 1973 (Act No. 15 of 1973) and its revision in the Act of 1988 (Act No. 1 of 10 May 1988) do not provide an explicit definition of foreign direct investment (FDI). The Act rather defines "company" as any company incorporated or registered under any law in force in The Gambia and any company which, although incorporated or registered outside The Gambia, carries on business or has an office or place of business therein. The Central Bank of The Gambia provides data on FDI in the country. Data reported by the Central Bank refer only to investments in hotels and fisheries. Some FDI inflows may have been included under items "drawings and repayments on other long-term loans received by other sectors" or under "other short-term liabilities of deposit money banks" in capital account of the balance-of-payments. The International Monetary Fund also provides the county's FDI data in its balance-of-payment statistics.
The Gambia Investment Promotion and Free Zones Agency (GIPFZA) is the Government agency mandated to promote foreign investment. The Government merged two legislative instruments - the Gambia Investment Promotion Act and the Gambia Free Zones Act to set up GIPFZA. GIPFZA serves as the link between investors and national authorities connected with business registration, administration of incentive and other support facilities associated with investing in The Gambia. The Agency has instituted a one-stop-shop service to provide all the information and help investors at the first stage of establishment and to continue rendering assistance to ensure the smooth functioning and sustainability of such business ventures.
In The Gambia, there are two separate but complementary environments for FDI: the free zones and outside the free zones. Separate and different activities take place in these two environments and the activities are governed by respective rules. Different incentives and responsibilities go with each environment. Investment activities in the free zones may include: warehousing, bulk breaking, labeling and packaging, financial and offshore services. Investments here should contribute positively to domestic capital formation and about 70% of the output of companies here should be for export markets. Investment outside the free zones should aim to set up companies and partnership under the laws of The Gambia and in the priority sectors such as agriculture, fisheries, tourism and manufacturing. Outside free zones, investment in The Gambia require at least US $100,000 in fixed assets.
Incentives for investment are different in or out of the free zones. But all foreign investment in The Gambia benefit from exemptions from withholding tax and tax on dividends, exemption from customs duty on imported capital equipment, machinery and approved quantities of semi-finished products. They may or may not be exempted from sales taxation.
The Gambia signed to the Convention on the Settlement of Investment Disputes between State and Nationals of other States on 1 October 1974 and has membership of several international bodies and organizations which provide market-cushion for the outputs of international investors. The Gambia is a member of the Economic Community of West African States, New Partnership for Africa's Development and the African Union. The country is an eligible member of the United States' market access initiative for African countries – the African Growth and Opportunity Act, the Cotonou Agreement for renegotiating the trade links between the European Union (EU) and the African, Caribbean and Pacific countries and the EU's Everything But Arms initiative. The Gambia is also among the thirty-four African least developed countries that have the option of entering the EU generalized system of preferences and is a member of the World Trade Organization.
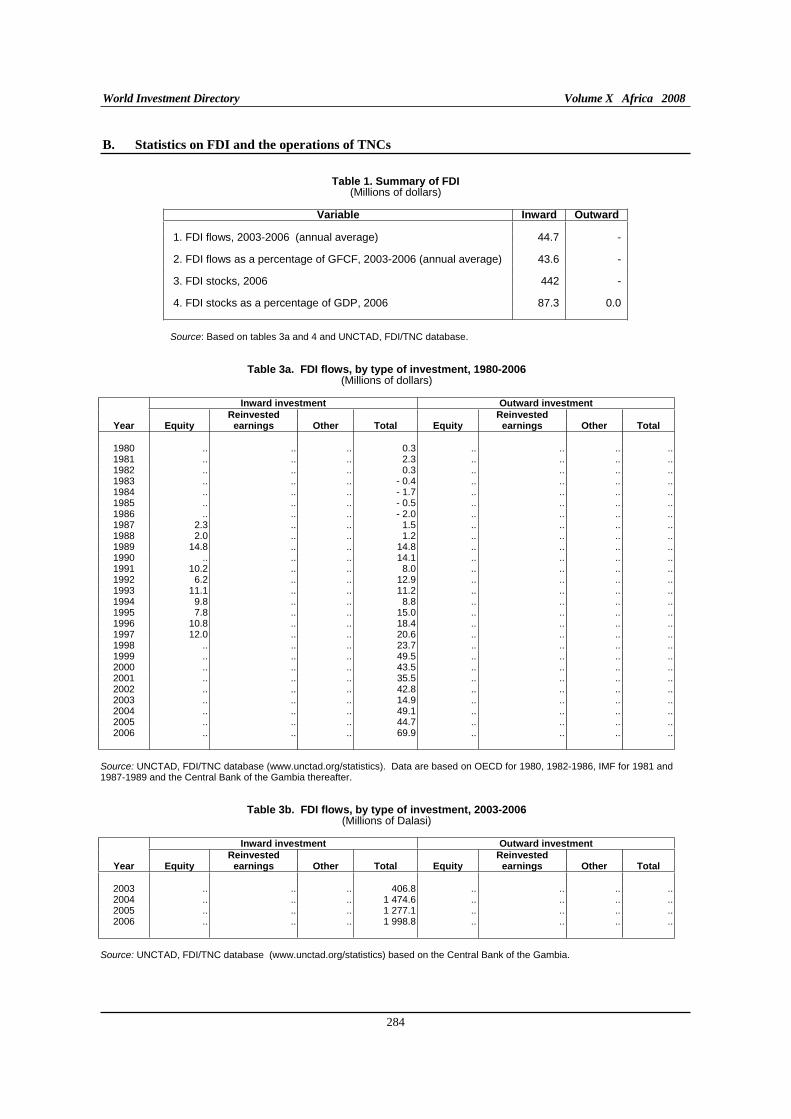
World Investment Directory Volume X Africa 2008
284
B. Statistics on FDI and the operations of TNCs
Table 1. Summary of FDI (Millions of dollars)
Variable Inward Outward
1. FDI flows, 2003-2006 (annual average) 44.7 - 2. FDI flows as a percentage of GFCF, 2003-2006 (annual average) 43.6 - 3. FDI stocks, 2006 442 - 4. FDI stocks as a percentage of GDP, 2006 87.3 0.0 Source: Based on tables 3a and 4 and UNCTAD, FDI/TNC database.
Table 3a. FDI flows, by type of investment, 1980-2006 (Millions of dollars)
Inward investment Outward investment
Reinvested Reinvested Year Equity earnings Other Total Equity earnings Other Total
1980 .. .. .. 0.3 .. .. .. ..1981 .. .. .. 2.3 .. .. .. ..1982 .. .. .. 0.3 .. .. .. ..1983 .. .. .. - 0.4 .. .. .. ..1984 .. .. .. - 1.7 .. .. .. ..1985 .. .. .. - 0.5 .. .. .. ..1986 .. .. .. - 2.0 .. .. .. ..1987 2.3 .. .. 1.5 .. .. .. ..1988 2.0 .. .. 1.2 .. .. .. ..1989 14.8 .. .. 14.8 .. .. .. ..1990 .. .. .. 14.1 .. .. .. ..1991 10.2 .. .. 8.0 .. .. .. ..1992 6.2 .. .. 12.9 .. .. .. ..1993 11.1 .. .. 11.2 .. .. .. ..1994 9.8 .. .. 8.8 .. .. .. ..1995 7.8 .. .. 15.0 .. .. .. ..1996 10.8 .. .. 18.4 .. .. .. ..1997 12.0 .. .. 20.6 .. .. .. ..1998 .. .. .. 23.7 .. .. .. ..1999 .. .. .. 49.5 .. .. .. ..2000 .. .. .. 43.5 .. .. .. ..2001 .. .. .. 35.5 .. .. .. ..2002 .. .. .. 42.8 .. .. .. ..2003 .. .. .. 14.9 .. .. .. ..2004 .. .. .. 49.1 .. .. .. ..2005 .. .. .. 44.7 .. .. .. ..2006 .. .. .. 69.9 .. .. .. ..
Source: UNCTAD, FDI/TNC database (www.unctad.org/statistics). Data are based on OECD for 1980, 1982-1986, IMF for 1981 and 1987-1989 and the Central Bank of the Gambia thereafter.
Table 3b. FDI flows, by type of investment, 2003-2006 (Millions of Dalasi)
Inward investment Outward investment
Reinvested Reinvested Year Equity earnings Other Total Equity earnings Other Total
2003 .. .. .. 406.8 .. .. .. ..2004 .. .. .. 1 474.6 .. .. .. ..2005 .. .. .. 1 277.1 .. .. .. ..2006 .. .. .. 1 998.8 .. .. .. ..
Source: UNCTAD, FDI/TNC database (www.unctad.org/statistics) based on the Central Bank of the Gambia.
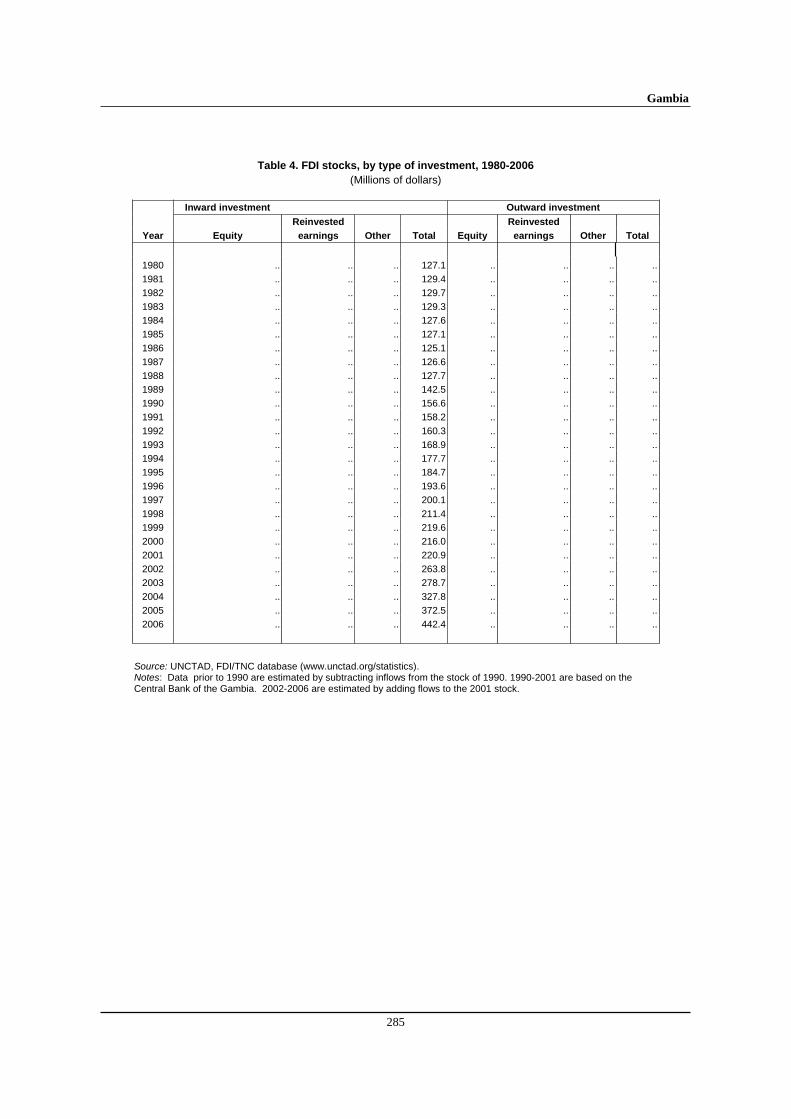
Gambia
285
Table 4. FDI stocks, by type of investment, 1980-2006
(Millions of dollars)
Inward investment Outward investment
Reinvested Reinvested
Year Equity earnings Other Total Equity earnings Other Total
1980 .. .. .. 127.1 .. .. .. ..
1981 .. .. .. 129.4 .. .. .. ..
1982 .. .. .. 129.7 .. .. .. ..
1983 .. .. .. 129.3 .. .. .. ..
1984 .. .. .. 127.6 .. .. .. ..
1985 .. .. .. 127.1 .. .. .. ..
1986 .. .. .. 125.1 .. .. .. ..
1987 .. .. .. 126.6 .. .. .. ..
1988 .. .. .. 127.7 .. .. .. ..
1989 .. .. .. 142.5 .. .. .. ..
1990 .. .. .. 156.6 .. .. .. ..
1991 .. .. .. 158.2 .. .. .. ..
1992 .. .. .. 160.3 .. .. .. ..
1993 .. .. .. 168.9 .. .. .. ..
1994 .. .. .. 177.7 .. .. .. ..
1995 .. .. .. 184.7 .. .. .. ..
1996 .. .. .. 193.6 .. .. .. ..
1997 .. .. .. 200.1 .. .. .. ..
1998 .. .. .. 211.4 .. .. .. ..
1999 .. .. .. 219.6 .. .. .. ..
2000 .. .. .. 216.0 .. .. .. ..
2001 .. .. .. 220.9 .. .. .. ..
2002 .. .. .. 263.8 .. .. .. ..
2003 .. .. .. 278.7 .. .. .. ..
2004 .. .. .. 327.8 .. .. .. ..
2005 .. .. .. 372.5 .. .. .. ..
2006 .. .. .. 442.4 .. .. .. ..
Source: UNCTAD, FDI/TNC database (www.unctad.org/statistics). Notes: Data prior to 1990 are estimated by subtracting inflows from the stock of 1990. 1990-2001 are based on the Central Bank of the Gambia. 2002-2006 are estimated by adding flows to the 2001 stock.
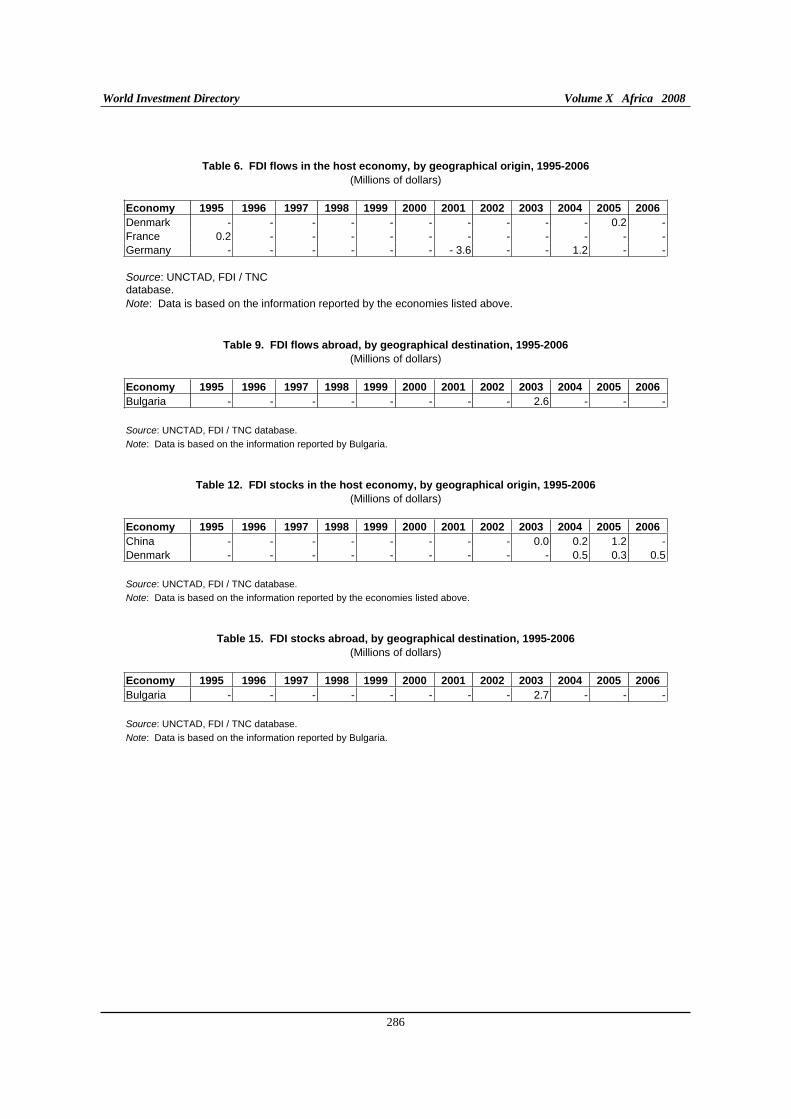
World Investment Directory Volume X Africa 2008
286
Table 6. FDI flows in the host economy, by geographical origin, 1995-2006
(Millions of dollars) Economy 1995 1996 1997 1998 1999 2000 2001 2002 2003 2004 2005 2006
Denmark - - - - - - - - - - 0.2 -France 0.2 - - - - - - - - - - -Germany - - - - - - - 3.6 - - 1.2 - - Source: UNCTAD, FDI / TNC database. Note: Data is based on the information reported by the economies listed above.
Table 9. FDI flows abroad, by geographical destination, 1995-2006
(Millions of dollars) Economy 1995 1996 1997 1998 1999 2000 2001 2002 2003 2004 2005 2006
Bulgaria - - - - - - - - 2.6 - - - Source: UNCTAD, FDI / TNC database.
Note: Data is based on the information reported by Bulgaria.
Table 12. FDI stocks in the host economy, by geographical origin, 1995-2006
(Millions of dollars) Economy 1995 1996 1997 1998 1999 2000 2001 2002 2003 2004 2005 2006
China - - - - - - - - 0.0 0.2 1.2 -Denmark - - - - - - - - - 0.5 0.3 0.5 Source: UNCTAD, FDI / TNC database.
Note: Data is based on the information reported by the economies listed above.
Table 15. FDI stocks abroad, by geographical destination, 1995-2006
(Millions of dollars) Economy 1995 1996 1997 1998 1999 2000 2001 2002 2003 2004 2005 2006
Bulgaria - - - - - - - - 2.7 - - - Source: UNCTAD, FDI / TNC database.
Note: Data is based on the information reported by Bulgaria.
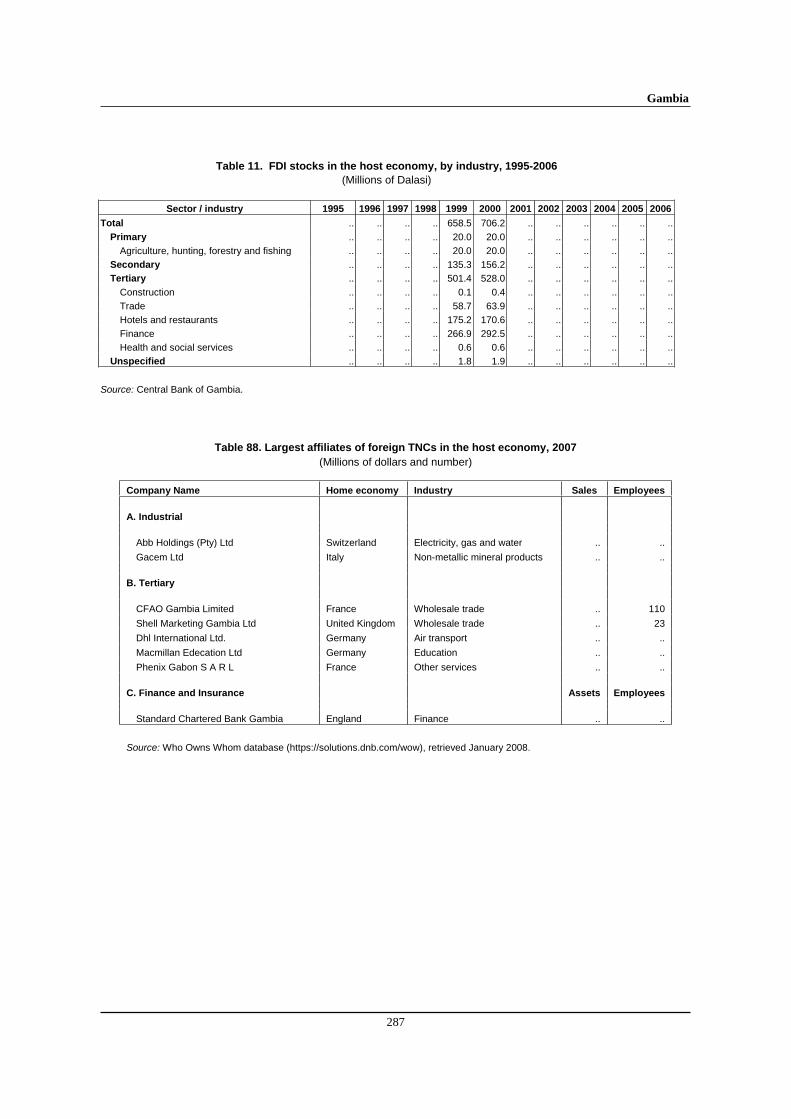
Gambia
287
Table 11. FDI stocks in the host economy, by industry, 1995-2006
(Millions of Dalasi)
Sector / industry 1995 1996 1997 1998 1999 2000 2001 2002 2003 2004 2005 2006
Total .. .. .. .. 658.5 706.2 .. .. .. .. .. ..
Primary .. .. .. .. 20.0 20.0 .. .. .. .. .. ..
Agriculture, hunting, forestry and fishing .. .. .. .. 20.0 20.0 .. .. .. .. .. ..
Secondary .. .. .. .. 135.3 156.2 .. .. .. .. .. ..
Tertiary .. .. .. .. 501.4 528.0 .. .. .. .. .. ..
Construction .. .. .. .. 0.1 0.4 .. .. .. .. .. ..
Trade .. .. .. .. 58.7 63.9 .. .. .. .. .. ..
Hotels and restaurants .. .. .. .. 175.2 170.6 .. .. .. .. .. ..
Finance .. .. .. .. 266.9 292.5 .. .. .. .. .. ..
Health and social services .. .. .. .. 0.6 0.6 .. .. .. .. .. ..
Unspecified .. .. .. .. 1.8 1.9 .. .. .. .. .. ..
Source: Central Bank of Gambia.
Table 88. Largest affiliates of foreign TNCs in the host economy, 2007
(Millions of dollars and number)
Company Name Home economy Industry Sales Employees
A. Industrial
Abb Holdings (Pty) Ltd Switzerland Electricity, gas and water .. ..
Gacem Ltd Italy Non-metallic mineral products .. ..
B. Tertiary
CFAO Gambia Limited France Wholesale trade .. 110
Shell Marketing Gambia Ltd United Kingdom Wholesale trade .. 23
Dhl International Ltd. Germany Air transport .. ..
Macmillan Edecation Ltd Germany Education .. ..
Phenix Gabon S A R L France Other services .. ..
C. Finance and Insurance Assets Employees
Standard Chartered Bank Gambia England Finance .. ..
Source: Who Owns Whom database (https://solutions.dnb.com/wow), retrieved January 2008.
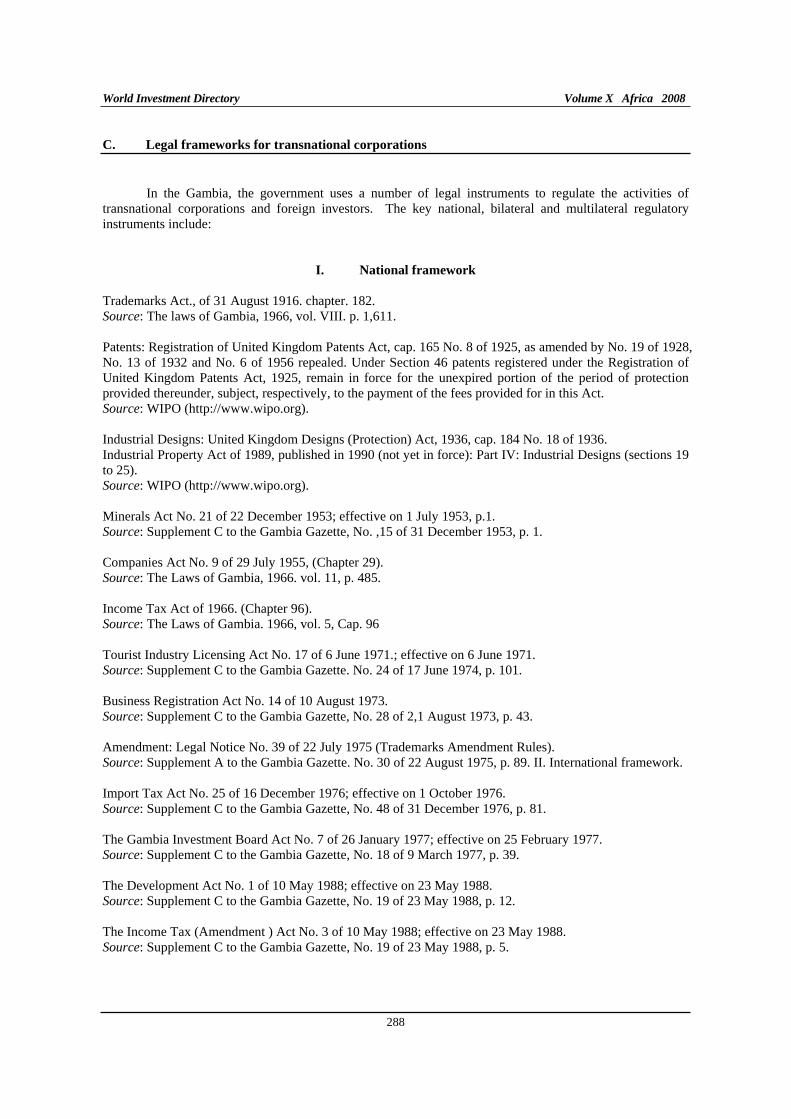
World Investment Directory Volume X Africa 2008
288
C. Legal frameworks for transnational corporations
In the Gambia, the government uses a number of legal instruments to regulate the activities of transnational corporations and foreign investors. The key national, bilateral and multilateral regulatory instruments include:
I. National framework
Trademarks Act., of 31 August 1916. chapter. 182. Source: The laws of Gambia, 1966, vol. VIII. p. 1,611.
Patents: Registration of United Kingdom Patents Act, cap. 165 No. 8 of 1925, as amended by No. 19 of 1928, No. 13 of 1932 and No. 6 of 1956 repealed. Under Section 46 patents registered under the Registration of United Kingdom Patents Act, 1925, remain in force for the unexpired portion of the period of protection provided thereunder, subject, respectively, to the payment of the fees provided for in this Act. Source: WIPO (http://www.wipo.org).
Industrial Designs: United Kingdom Designs (Protection) Act, 1936, cap. 184 No. 18 of 1936. Industrial Property Act of 1989, published in 1990 (not yet in force): Part IV: Industrial Designs (sections 19 to 25). Source: WIPO (http://www.wipo.org).
Minerals Act No. 21 of 22 December 1953; effective on 1 July 1953, p.1. Source: Supplement C to the Gambia Gazette, No. ,15 of 31 December 1953, p. 1.
Companies Act No. 9 of 29 July 1955, (Chapter 29). Source: The Laws of Gambia, 1966. vol. 11, p. 485.
Income Tax Act of 1966. (Chapter 96). Source: The Laws of Gambia. 1966, vol. 5, Cap. 96
Tourist Industry Licensing Act No. 17 of 6 June 1971.; effective on 6 June 1971. Source: Supplement C to the Gambia Gazette. No. 24 of 17 June 1974, p. 101.
Business Registration Act No. 14 of 10 August 1973. Source: Supplement C to the Gambia Gazette, No. 28 of 2,1 August 1973, p. 43.
Amendment: Legal Notice No. 39 of 22 July 1975 (Trademarks Amendment Rules). Source: Supplement A to the Gambia Gazette. No. 30 of 22 August 1975, p. 89. II. International framework.
Import Tax Act No. 25 of 16 December 1976; effective on 1 October 1976. Source: Supplement C to the Gambia Gazette, No. 48 of 31 December 1976, p. 81.
The Gambia Investment Board Act No. 7 of 26 January 1977; effective on 25 February 1977. Source: Supplement C to the Gambia Gazette, No. 18 of 9 March 1977, p. 39.
The Development Act No. 1 of 10 May 1988; effective on 23 May 1988. Source: Supplement C to the Gambia Gazette, No. 19 of 23 May 1988, p. 12.
The Income Tax (Amendment ) Act No. 3 of 10 May 1988; effective on 23 May 1988. Source: Supplement C to the Gambia Gazette, No. 19 of 23 May 1988, p. 5.
Gambia
289
Industrial Property Act of 1989, published in 1990 (not yet in force): Part II: Patents (sections 3-15). Source: WIPO (http://www.wipo.org).
Employees’ Inventions: Industrial Property Act of 1989, published in 1990 (not yet in force): Part II: Employees’ inventions section 5(5) and (6) and (21). Source: WIPO (http://www.wipo.org).
Utility Models: Industrial Property Act of 1989, published in 1990 (not yet in force): Part III: Utility Model Certificates (sections 16 to 18). Source: WIPO (http://www.wipo.org).
Industrial Property Act of 1989, published in 1990 (not yet in force): Part V: Marks, Collective Marks, Trade Names and Unfair Competition (sections 26 to 36). Source: WIPO (http://www.wipo.org).
II. International Framework
A. The Gambia is a party to the following multilateral and regional instruments:
Convention on the Settlement of Investment Disputes between States and Nationals of other States of 1965. Entered into force on 14 October 1966.
Agreement for the Promotion, Protection and Guarantee of Investment Among Member States of the Organization of Islamic Conference, of I June 1981; entered into force on 23 September 1986.
Revised Treaty of the Economic Community of West African States (ECOWAS) 1983.
Convention Establishing the Multilateral Investment Guarantee Agency of 1985, entered into force on 12 April 1988.
Fourth ACP - EEC Convention (Lome IV) of 1989, entered into force on 1st March 1990.
Articles of Agreement of the Islamic Corporation for the Insurance of Investment and Export Credit of 19 February 1992. Entered into force on 1 August 1994.
Paris Convention for the Protection of Industrial Property of 1883 (Revised at Brussels in 1900, Washington in 1911, The Hague in 1925, London in 1934, Lisbon in 1958 and Stockholm in 1967, and as amended in 1979). Signed in 1994.
Marrakesh Agreement Establishing the World Trade Organisation of 15 April 1994. Entered into force on 1 January 1995. Agreement on Trade-Related Investment Measures. General Agreement on Trade in Services. Agreement on Trade Related Aspects of Intellectual Property Rights.
Partnership Agreement between the Members of The African, Caribbean and Pacific Group of States, of the one part and the European Community and its member states, of the other part signed in Cotonou, Benin on 23 June 2000.
World Investment Directory Volume X Africa 2008
290
B. Bilateral treaties
1. Bilateral investment treaties for the protection and promotion of investments: Switzerland 1993, Mauritania 2001, Netherlands 2002, United Kingdom 2002, Qatar 2002, Morocco 2006, .
2. Bilateral treaties for the avoidance of double taxation: Switzerland 1963, United Kingdom 1980, Sweden 1993, Norway 1994, Taiwan Province of China 1997.
Gambia
291
D. Sources of information
Official
Central Bank of The Gambia.
Gambia Investment Promotion and Free Zones Agency (www.investinginthe Gambia.gm).
Secondary
Bennell, Paul (1997). "Foreign direct investment in Africa: rhetoric and reality", SAIS Review
(Summer/Fall), pp. 127-139.
Bennell, Paul (1997). "Privatization in Sub-Saharan Africa: progress and prospects during the 1990s", World
Development, vol. 25, no. 11, pp. 1785-1803.
Broll, U. (2003). "Foreign direct investment, credible policy: the role of risk sharing". International trade
journal, vol. XVII, No. 2., pp. 165 – 176.
Economist Intelligence Unit (EIU) (various years). Country Profile: Gambia (London: EIU Ltd.).
___________ (various years). Country Report: Gambia (London: EIU Ltd.).
International Finance Corporation (IFC) (1997). "Foreign direct investment", IFC: Lessons of Experience Series No. 5, (Washington, D.C.: World Bank).
International Monetary Fund (IMF) (2006). IMF's Sub-Saharan Africa Regional Economic Outlook, March 10, 2006. (Washington D.C.: IMF).
Razin, Assaf (2003). "The contribution of FDI flows to domestic investment in capacity, and vice versa", mimeo.
Rogoff, Kenneth and Reinhart, Carmen (2002). "FDI to Africa: The role of price stability and currency instability", International Monetary Fund working paper, (Washington D.C.: International Monetary Fund).
Ruffer, Tim, S. Jones and S. Akroyd (2002). "Development box proposals and their potential effect on developing countries." Mimeo, (London: U.K. Department for International Development).
Soderbom, M. and F. Teal (2004). "Size and Efficiency in Africa Manufacturing firms: Evidence from Firm-Level Panel Data." Journal of Development Economics, 73. pp 369 - 394.
World Investment Directory Volume X Africa 2008
292
United Nations Conference on Trade and Development (UNCTAD) (2002). FDI in Least Developed
Countries at a Glance 2002 (Geneva: UNCTAD/ITE/IIA/6).
_____________(2005a). Investor-Disputes Arising from Investment Treaties: A Review. UNCTAD Series of International Investment Policies for Development (UNCTAD/ITE/IIT/2005/4).
_____________(2005b). A Survey of Support by Investment Promotion Agencies to Linkages. Advisory Studies No. 18 (UNCTAD/ITE/IPC/2005/12).
_____________(2005c). FDI in least developed countries at a glance: 2005/2006
(UNCTAD/ITE/IIA/2005/17).
United States Trade Representative (2006). 2006 Comprehensive Report on U.S. Trade and Investment
Policy Toward Sub-Saharan Africa and Implementation of the Africa Growth and Opportunity Act:
The Sixth of Eight Annual Reports, May 2006. (Washington D.C.: US Government).
World Bank/International Finance Corporation (2007). Doing Business 2008 Gambia (Washington D.C.: The World Bank Group).
Ghana
293
Ghana
A. Definitions and sources of data
Five main institutions are responsible for collection of foreign direct investment (FDI) data in Ghana. Bank of Ghana provides information on the cash investments that pass through the Banking System. Data on the inward FDI are also derived from the records of the Ghana Investment Promotion Centre (GIPC), the Ghana Minerals Commission and the Energy Board/Ghana National Petroleum Corporation of the Ministry of Mines and Energy. These institutions are responsible for coordinating and monitoring investment in their respective sectors. Divestiture Implementation Committee collects information on foreign participation in diversified state enterprises. But comprehensive data on FDI in Ghana, compiled in line with the international Monetary Fund (IMF) balance-of-payments manual (5th
edition) and Organization for Economic Cooperation and Development (OECD) benchmark definition standards, are not available from these sources. Data are also provided by the IMF in its balance-of-payment statistics, the World Bank Group and the database of the OECD. FDI stock data were estimated as an accumulation of flows.
Under the GIPC Act, 1994 (Act 478), the Ghana Investment Promotion Centre started registering and recording information on FDI-related projects in September 1994. But GIPC does not include projects in the minerals and petroleum sector, and reports information on registered projects. These project-specific data are subject to validation by the Bank of Ghana and the Ghana Customs and Preventive Service. Recently, GIPC embarked on an exercise to determine which of the registered projects are operational.
In 1995, the Ghanaian Parliament enacted the country's Free Zone Act (FZA) which created attractive packages of incentives for hassle-free business operation for exporting firms. These incentives amplify business in what is already a centre for international business. The FZA allows production, manufacturing, and services, including financial services, exemption from taxes on profits for 10 years; up to 30% of the annual production can be sold in the national customs zone; a foreign investor may take hold of 100% of shares in Free Zone property; income tax after 10 years does not exceed 8%; and foreign and domestic investors have equal status.
Ghana signed to the Convention on the Settlement of Investment Disputes between State and Nationals of other States on 26 November 1965 and is a member of integration schemes that include the African Union, New Partnership for Africa's Development and Economic Community for West African States. Ghana is an eligible member of the United States' market access initiative for African countries - the African Growth and Opportunity Act and the Cotonou Agreement for renegotiating the partnership between the African, Caribbean and Pacific countries with the European Union. Ghana is also a member of the Multilateral Investment Guarantee Agency and the World Trade Organization.
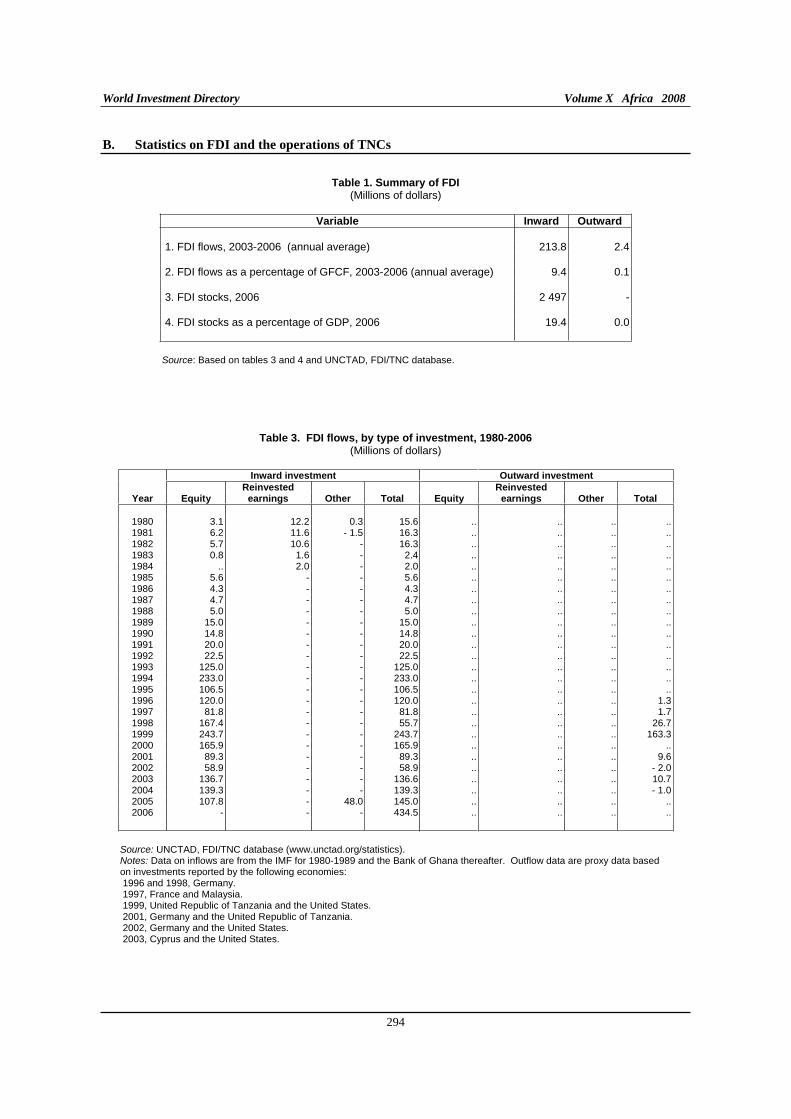
World Investment Directory Volume X Africa 2008
294
B. Statistics on FDI and the operations of TNCs
Table 1. Summary of FDI (Millions of dollars)
Variable Inward Outward
1. FDI flows, 2003-2006 (annual average) 213.8 2.4 2. FDI flows as a percentage of GFCF, 2003-2006 (annual average) 9.4 0.1 3. FDI stocks, 2006 2 497 - 4. FDI stocks as a percentage of GDP, 2006 19.4 0.0
Source: Based on tables 3 and 4 and UNCTAD, FDI/TNC database.
Table 3. FDI flows, by type of investment, 1980-2006 (Millions of dollars)
Inward investment Outward investment
Reinvested Reinvested Year Equity earnings Other Total Equity earnings Other Total
1980 3.1 12.2 0.3 15.6 .. .. .. ..1981 6.2 11.6 - 1.5 16.3 .. .. .. ..1982 5.7 10.6 - 16.3 .. .. .. ..1983 0.8 1.6 - 2.4 .. .. .. ..1984 .. 2.0 - 2.0 .. .. .. ..1985 5.6 - - 5.6 .. .. .. ..1986 4.3 - - 4.3 .. .. .. ..1987 4.7 - - 4.7 .. .. .. ..1988 5.0 - - 5.0 .. .. .. ..1989 15.0 - - 15.0 .. .. .. ..1990 14.8 - - 14.8 .. .. .. ..1991 20.0 - - 20.0 .. .. .. ..1992 22.5 - - 22.5 .. .. .. ..1993 125.0 - - 125.0 .. .. .. ..1994 233.0 - - 233.0 .. .. .. ..1995 106.5 - - 106.5 .. .. .. ..1996 120.0 - - 120.0 .. .. .. 1.31997 81.8 - - 81.8 .. .. .. 1.71998 167.4 - - 55.7 .. .. .. 26.71999 243.7 - - 243.7 .. .. .. 163.32000 165.9 - - 165.9 .. .. .. ..2001 89.3 - - 89.3 .. .. .. 9.62002 58.9 - - 58.9 .. .. .. - 2.02003 136.7 - - 136.6 .. .. .. 10.72004 139.3 - - 139.3 .. .. .. - 1.02005 107.8 - 48.0 145.0 .. .. .. ..2006 - - - 434.5 .. .. .. ..
Source: UNCTAD, FDI/TNC database (www.unctad.org/statistics). Notes: Data on inflows are from the IMF for 1980-1989 and the Bank of Ghana thereafter. Outflow data are proxy data based on investments reported by the following economies: 1996 and 1998, Germany. 1997, France and Malaysia. 1999, United Republic of Tanzania and the United States. 2001, Germany and the United Republic of Tanzania. 2002, Germany and the United States. 2003, Cyprus and the United States.

Ghana
295
Table 4. FDI stocks, by type of investment, 1980-2006
(Millions of dollars)
Inward investment Outward investment
Reinvested Reinvested
Year Equity earnings Other Total Equity earnings Other Total
1980 .. .. .. 232.9 .. .. .. ..
1981 .. .. .. 249.2 .. .. .. ..
1982 .. .. .. 265.5 .. .. .. ..
1983 .. .. .. 267.9 .. .. .. ..
1984 .. .. .. 269.9 .. .. .. ..
1985 .. .. .. 275.5 .. .. .. ..
1986 .. .. .. 279.8 .. .. .. ..
1987 .. .. .. 284.5 .. .. .. ..
1988 .. .. .. 289.5 .. .. .. ..
1989 .. .. .. 304.5 .. .. .. ..
1990 .. .. .. 319.3 .. .. .. ..
1991 .. .. .. 339.3 .. .. .. ..
1992 .. .. .. 361.8 .. .. .. ..
1993 .. .. .. 486.8 .. .. .. ..
1994 .. .. .. 719.8 .. .. .. ..
1995 .. .. .. 826.3 .. .. .. ..
1996 .. .. .. 946.3 .. .. .. ..
1997 .. .. .. 1 028.1 .. .. .. ..
1998 .. .. .. 1 083.8 .. .. .. ..
1999 .. .. .. 1 327.5 .. .. .. ..
2000 .. .. .. 1 493.4 .. .. .. ..
2001 .. .. .. 1 582.7 .. .. .. ..
2002 .. .. .. 1 641.6 .. .. .. ..
2003 .. .. .. 1 778.2 .. .. .. ..
2004 .. .. .. 1 917.4 .. .. .. ..
2005 .. .. .. 2 062.4 .. .. .. ..
2006 .. .. .. 2 496.9 .. .. .. .. Source: UNCTAD, FDI/TNC database (www.unctad.org/statistics).
Note: Data are estimated by accumulating inflows since 1970.
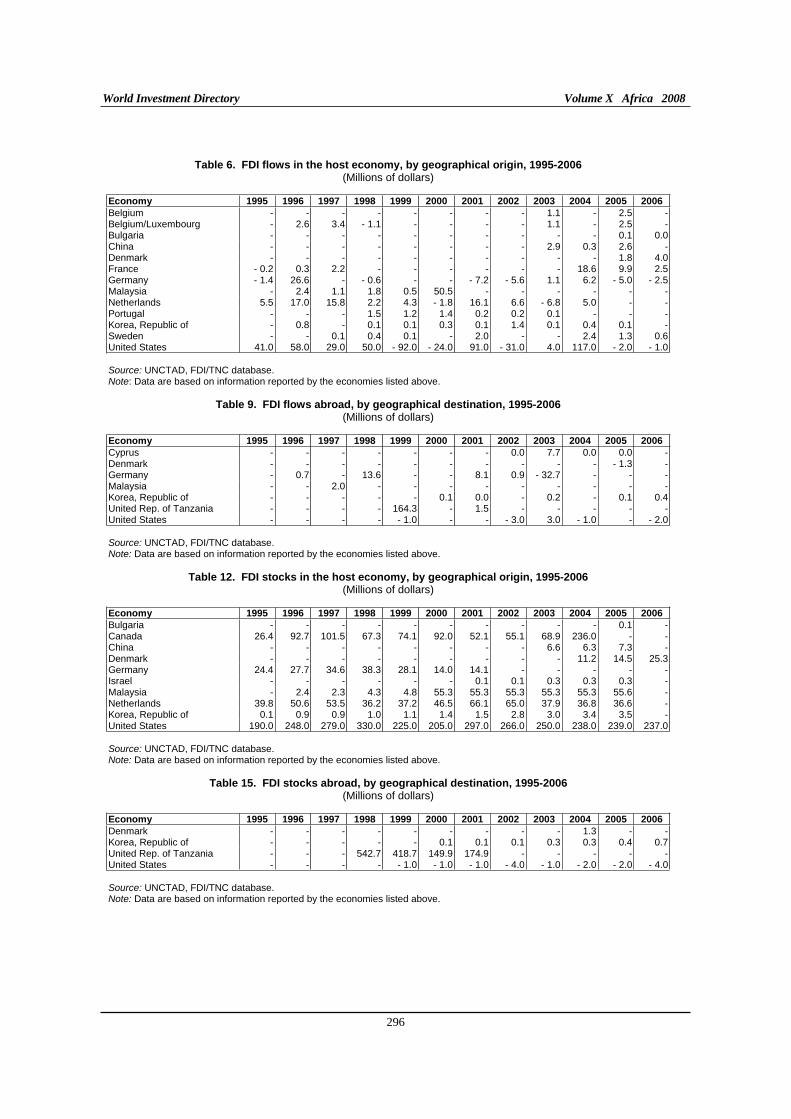
World Investment Directory Volume X Africa 2008
296
Table 6. FDI flows in the host economy, by geographical origin, 1995-2006 (Millions of dollars)
Economy 1995 1996 1997 1998 1999 2000 2001 2002 2003 2004 2005 2006 Belgium - - - - - - - - 1.1 - 2.5 -Belgium/Luxembourg - 2.6 3.4 - 1.1 - - - - 1.1 - 2.5 -Bulgaria - - - - - - - - - - 0.1 0.0China - - - - - - - - 2.9 0.3 2.6 -Denmark - - - - - - - - - - 1.8 4.0France - 0.2 0.3 2.2 - - - - - - 18.6 9.9 2.5Germany - 1.4 26.6 - - 0.6 - - - 7.2 - 5.6 1.1 6.2 - 5.0 - 2.5Malaysia - 2.4 1.1 1.8 0.5 50.5 - - - - - -Netherlands 5.5 17.0 15.8 2.2 4.3 - 1.8 16.1 6.6 - 6.8 5.0 - -Portugal - - - 1.5 1.2 1.4 0.2 0.2 0.1 - - -Korea, Republic of - 0.8 - 0.1 0.1 0.3 0.1 1.4 0.1 0.4 0.1 -Sweden - - 0.1 0.4 0.1 - 2.0 - - 2.4 1.3 0.6United States 41.0 58.0 29.0 50.0 - 92.0 - 24.0 91.0 - 31.0 4.0 117.0 - 2.0 - 1.0 Source: UNCTAD, FDI/TNC database. Note: Data are based on information reported by the economies listed above.
Table 9. FDI flows abroad, by geographical destination, 1995-2006 (Millions of dollars)
Economy 1995 1996 1997 1998 1999 2000 2001 2002 2003 2004 2005 2006 Cyprus - - - - - - - 0.0 7.7 0.0 0.0 -Denmark - - - - - - - - - - - 1.3 -Germany - 0.7 - 13.6 - - 8.1 0.9 - 32.7 - - -Malaysia - - 2.0 - - - - - - - - -Korea, Republic of - - - - - 0.1 0.0 - 0.2 - 0.1 0.4United Rep. of Tanzania - - - - 164.3 - 1.5 - - - - -United States - - - - - 1.0 - - - 3.0 3.0 - 1.0 - - 2.0 Source: UNCTAD, FDI/TNC database. Note: Data are based on information reported by the economies listed above.
Table 12. FDI stocks in the host economy, by geographical origin, 1995-2006 (Millions of dollars)
Economy 1995 1996 1997 1998 1999 2000 2001 2002 2003 2004 2005 2006 Bulgaria - - - - - - - - - - 0.1 -Canada 26.4 92.7 101.5 67.3 74.1 92.0 52.1 55.1 68.9 236.0 - -China - - - - - - - - 6.6 6.3 7.3 -Denmark - - - - - - - - - 11.2 14.5 25.3Germany 24.4 27.7 34.6 38.3 28.1 14.0 14.1 - - - - -Israel - - - - - - 0.1 0.1 0.3 0.3 0.3 -Malaysia - 2.4 2.3 4.3 4.8 55.3 55.3 55.3 55.3 55.3 55.6 -Netherlands 39.8 50.6 53.5 36.2 37.2 46.5 66.1 65.0 37.9 36.8 36.6 -Korea, Republic of 0.1 0.9 0.9 1.0 1.1 1.4 1.5 2.8 3.0 3.4 3.5 -United States 190.0 248.0 279.0 330.0 225.0 205.0 297.0 266.0 250.0 238.0 239.0 237.0 Source: UNCTAD, FDI/TNC database. Note: Data are based on information reported by the economies listed above.
Table 15. FDI stocks abroad, by geographical destination, 1995-2006 (Millions of dollars)
Economy 1995 1996 1997 1998 1999 2000 2001 2002 2003 2004 2005 2006 Denmark - - - - - - - - - 1.3 - -Korea, Republic of - - - - - 0.1 0.1 0.1 0.3 0.3 0.4 0.7United Rep. of Tanzania - - - 542.7 418.7 149.9 174.9 - - - - -United States - - - - - 1.0 - 1.0 - 1.0 - 4.0 - 1.0 - 2.0 - 2.0 - 4.0 Source: UNCTAD, FDI/TNC database. Note: Data are based on information reported by the economies listed above.
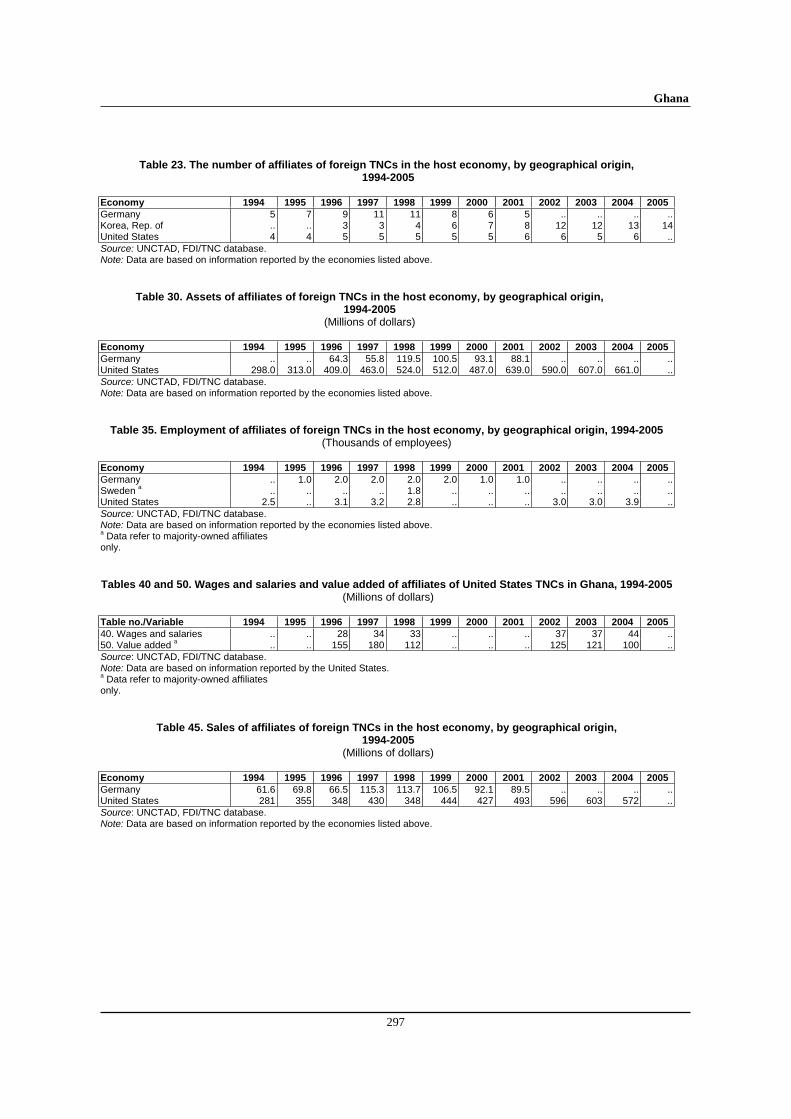
Ghana
297
Table 23. The number of affiliates of foreign TNCs in the host economy, by geographical origin, 1994-2005
Economy 1994 1995 1996 1997 1998 1999 2000 2001 2002 2003 2004 2005 Germany 5 7 9 11 11 8 6 5 .. .. .. ..Korea, Rep. of .. .. 3 3 4 6 7 8 12 12 13 14United States 4 4 5 5 5 5 5 6 6 5 6 ..Source: UNCTAD, FDI/TNC database. Note: Data are based on information reported by the economies listed above.
Table 30. Assets of affiliates of foreign TNCs in the host economy, by geographical origin, 1994-2005
(Millions of dollars) Economy 1994 1995 1996 1997 1998 1999 2000 2001 2002 2003 2004 2005 Germany .. .. 64.3 55.8 119.5 100.5 93.1 88.1 .. .. .. ..United States 298.0 313.0 409.0 463.0 524.0 512.0 487.0 639.0 590.0 607.0 661.0 ..Source: UNCTAD, FDI/TNC database. Note: Data are based on information reported by the economies listed above.
Table 35. Employment of affiliates of foreign TNCs in the host economy, by geographical origin, 1994-2005 (Thousands of employees)
Economy 1994 1995 1996 1997 1998 1999 2000 2001 2002 2003 2004 2005 Germany .. 1.0 2.0 2.0 2.0 2.0 1.0 1.0 .. .. .. ..Sweden a .. .. .. .. 1.8 .. .. .. .. .. .. ..United States 2.5 .. 3.1 3.2 2.8 .. .. .. 3.0 3.0 3.9 ..Source: UNCTAD, FDI/TNC database. Note: Data are based on information reported by the economies listed above. a Data refer to majority-owned affiliates only. Tables 40 and 50. Wages and salaries and value added of affiliates of United States TNCs in Ghana, 1994-2005
(Millions of dollars) Table no./Variable 1994 1995 1996 1997 1998 1999 2000 2001 2002 2003 2004 2005 40. Wages and salaries .. .. 28 34 33 .. .. .. 37 37 44 ..50. Value added a .. .. 155 180 112 .. .. .. 125 121 100 ..Source: UNCTAD, FDI/TNC database. Note: Data are based on information reported by the United States. a Data refer to majority-owned affiliates only.
Table 45. Sales of affiliates of foreign TNCs in the host economy, by geographical origin, 1994-2005
(Millions of dollars) Economy 1994 1995 1996 1997 1998 1999 2000 2001 2002 2003 2004 2005 Germany 61.6 69.8 66.5 115.3 113.7 106.5 92.1 89.5 .. .. .. ..United States 281 355 348 430 348 444 427 493 596 603 572 ..Source: UNCTAD, FDI/TNC database. Note: Data are based on information reported by the economies listed above.
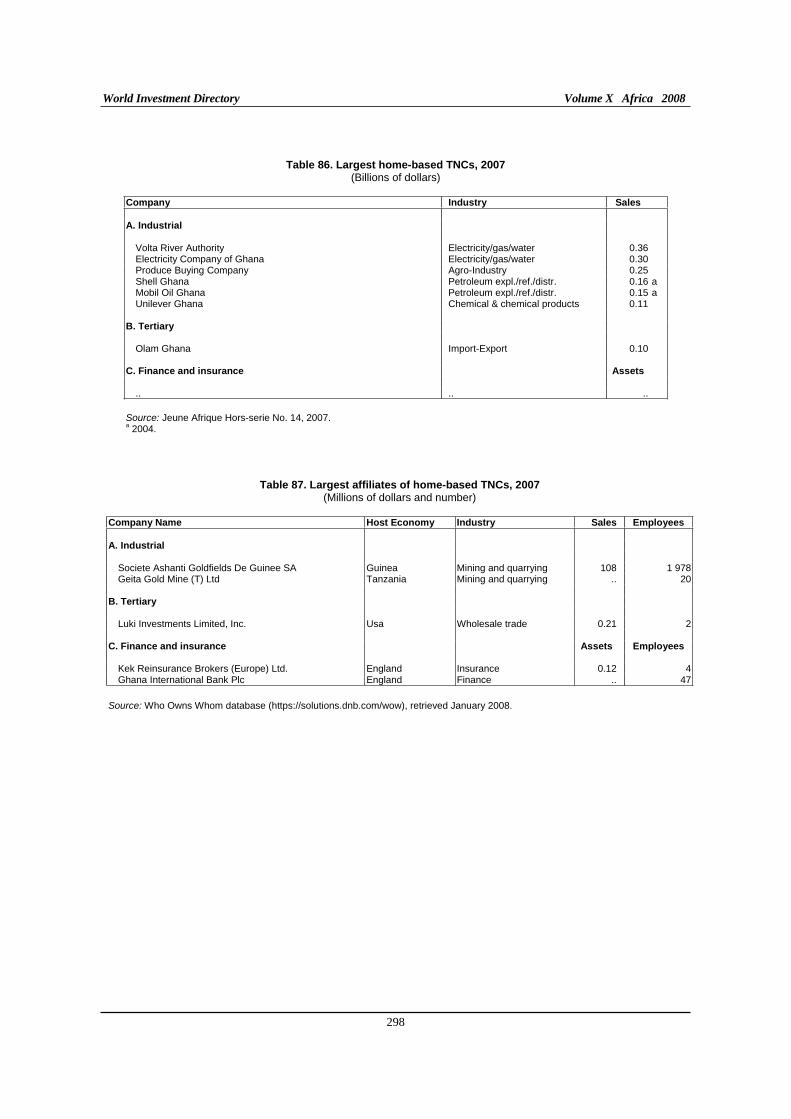
World Investment Directory Volume X Africa 2008
298
Table 86. Largest home-based TNCs, 2007 (Billions of dollars)
Company Industry Sales
A. Industrial
Volta River Authority Electricity/gas/water 0.36 Electricity Company of Ghana Electricity/gas/water 0.30 Produce Buying Company Agro-Industry 0.25 Shell Ghana Petroleum expl./ref./distr. 0.16 a Mobil Oil Ghana Petroleum expl./ref./distr. 0.15 a Unilever Ghana Chemical & chemical products 0.11
B. Tertiary
Olam Ghana Import-Export 0.10
C. Finance and insurance Assets
.. .. ..
Source: Jeune Afrique Hors-serie No. 14, 2007. a 2004.
Table 87. Largest affiliates of home-based TNCs, 2007 (Millions of dollars and number)
Company Name Host Economy Industry Sales Employees
A. Industrial
Societe Ashanti Goldfields De Guinee SA Guinea Mining and quarrying 108 1 978Geita Gold Mine (T) Ltd Tanzania Mining and quarrying .. 20
B. Tertiary
Luki Investments Limited, Inc. Usa Wholesale trade 0.21 2
C. Finance and insurance Assets Employees
Kek Reinsurance Brokers (Europe) Ltd. England Insurance 0.12 4Ghana International Bank Plc England Finance .. 47
Source: Who Owns Whom database (https://solutions.dnb.com/wow), retrieved January 2008.
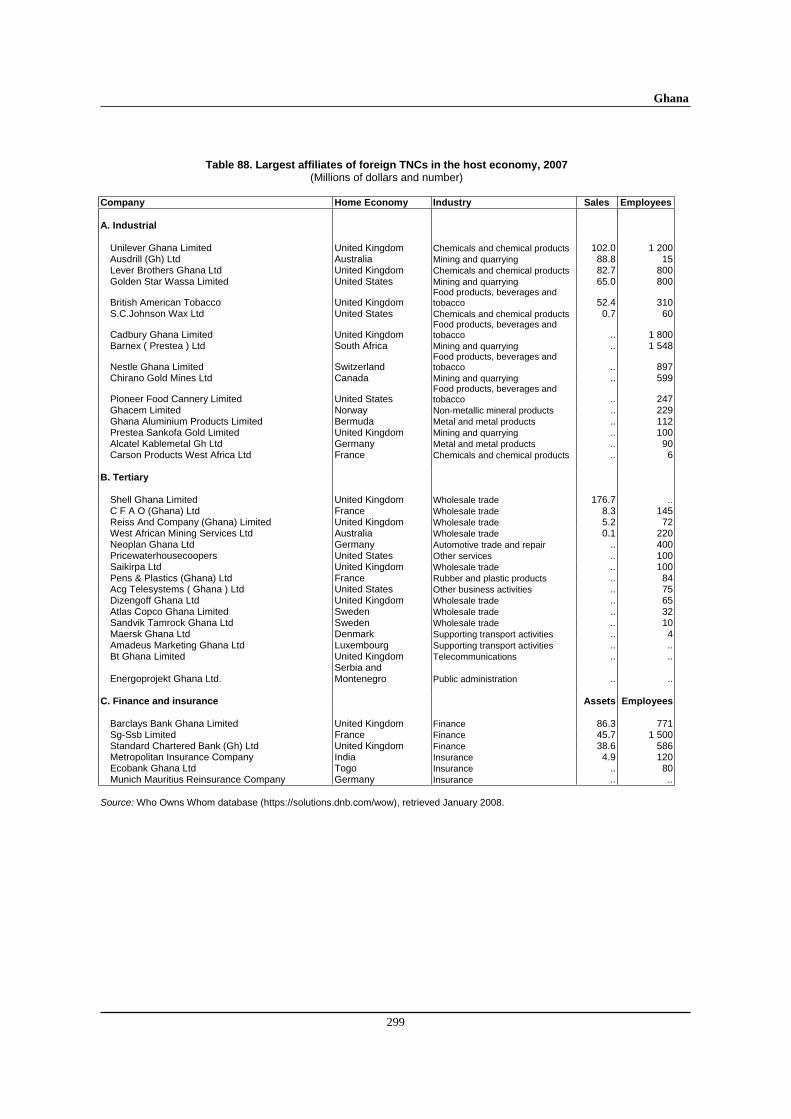
Ghana
299
Table 88. Largest affiliates of foreign TNCs in the host economy, 2007 (Millions of dollars and number)
Company Home Economy Industry Sales Employees A. Industrial
Unilever Ghana Limited United Kingdom Chemicals and chemical products 102.0 1 200Ausdrill (Gh) Ltd Australia Mining and quarrying 88.8 15Lever Brothers Ghana Ltd United Kingdom Chemicals and chemical products 82.7 800Golden Star Wassa Limited United States Mining and quarrying 65.0 800
British American Tobacco United Kingdom Food products, beverages and tobacco 52.4 310
S.C.Johnson Wax Ltd United States Chemicals and chemical products 0.7 60
Cadbury Ghana Limited United Kingdom Food products, beverages and tobacco .. 1 800
Barnex ( Prestea ) Ltd South Africa Mining and quarrying .. 1 548
Nestle Ghana Limited Switzerland Food products, beverages and tobacco .. 897
Chirano Gold Mines Ltd Canada Mining and quarrying .. 599
Pioneer Food Cannery Limited United States Food products, beverages and tobacco .. 247
Ghacem Limited Norway Non-metallic mineral products .. 229Ghana Aluminium Products Limited Bermuda Metal and metal products .. 112Prestea Sankofa Gold Limited United Kingdom Mining and quarrying .. 100Alcatel Kablemetal Gh Ltd Germany Metal and metal products .. 90Carson Products West Africa Ltd France Chemicals and chemical products .. 6
B. Tertiary
Shell Ghana Limited United Kingdom Wholesale trade 176.7 ..C F A O (Ghana) Ltd France Wholesale trade 8.3 145Reiss And Company (Ghana) Limited United Kingdom Wholesale trade 5.2 72West African Mining Services Ltd Australia Wholesale trade 0.1 220Neoplan Ghana Ltd Germany Automotive trade and repair .. 400Pricewaterhousecoopers United States Other services .. 100Saikirpa Ltd United Kingdom Wholesale trade .. 100Pens & Plastics (Ghana) Ltd France Rubber and plastic products .. 84Acg Telesystems ( Ghana ) Ltd United States Other business activities .. 75Dizengoff Ghana Ltd United Kingdom Wholesale trade .. 65Atlas Copco Ghana Limited Sweden Wholesale trade .. 32Sandvik Tamrock Ghana Ltd Sweden Wholesale trade .. 10Maersk Ghana Ltd Denmark Supporting transport activities .. 4Amadeus Marketing Ghana Ltd Luxembourg Supporting transport activities .. ..Bt Ghana Limited United Kingdom Telecommunications .. ..
Energoprojekt Ghana Ltd. Serbia and Montenegro Public administration .. ..
C. Finance and insurance Assets Employees
Barclays Bank Ghana Limited United Kingdom Finance 86.3 771Sg-Ssb Limited France Finance 45.7 1 500Standard Chartered Bank (Gh) Ltd United Kingdom Finance 38.6 586Metropolitan Insurance Company India Insurance 4.9 120Ecobank Ghana Ltd Togo Insurance .. 80Munich Mauritius Reinsurance Company Germany Insurance .. ..
Source: Who Owns Whom database (https://solutions.dnb.com/wow), retrieved January 2008.
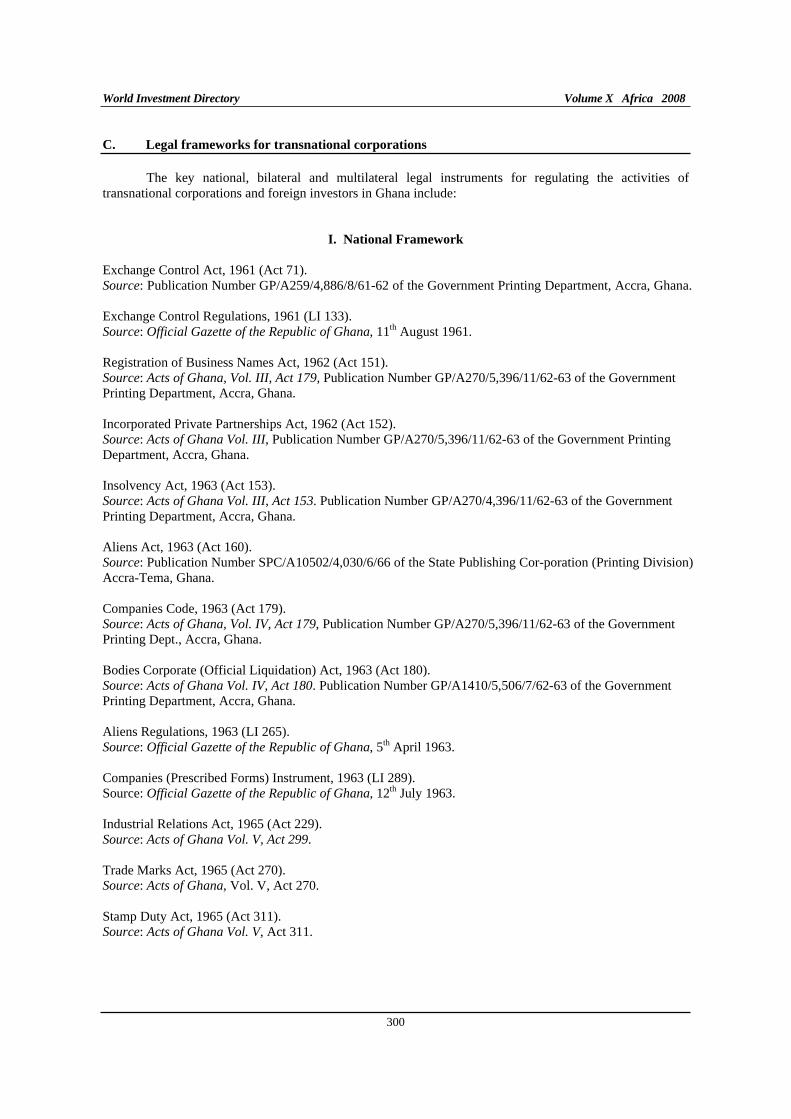
World Investment Directory Volume X Africa 2008
300
C. Legal frameworks for transnational corporations
The key national, bilateral and multilateral legal instruments for regulating the activities of transnational corporations and foreign investors in Ghana include:
I. National Framework
Exchange Control Act, 1961 (Act 71). Source: Publication Number GP/A259/4,886/8/61-62 of the Government Printing Department, Accra, Ghana.
Exchange Control Regulations, 1961 (LI 133).Source: Official Gazette of the Republic of Ghana, 11th August 1961.
Registration of Business Names Act, 1962 (Act 151).Source: Acts of Ghana, Vol. III, Act 179, Publication Number GP/A270/5,396/11/62-63 of the Government Printing Department, Accra, Ghana.
Incorporated Private Partnerships Act, 1962 (Act 152). Source: Acts of Ghana Vol. III, Publication Number GP/A270/5,396/11/62-63 of the Government Printing Department, Accra, Ghana.
Insolvency Act, 1963 (Act 153). Source: Acts of Ghana Vol. III, Act 153. Publication Number GP/A270/4,396/11/62-63 of the Government Printing Department, Accra, Ghana.
Aliens Act, 1963 (Act 160). Source: Publication Number SPC/A10502/4,030/6/66 of the State Publishing Cor-poration (Printing Division) Accra-Tema, Ghana.
Companies Code, 1963 (Act 179). Source: Acts of Ghana, Vol. IV, Act 179, Publication Number GP/A270/5,396/11/62-63 of the Government Printing Dept., Accra, Ghana.
Bodies Corporate (Official Liquidation) Act, 1963 (Act 180). Source: Acts of Ghana Vol. IV, Act 180. Publication Number GP/A1410/5,506/7/62-63 of the Government Printing Department, Accra, Ghana.
Aliens Regulations, 1963 (LI 265).Source: Official Gazette of the Republic of Ghana, 5th April 1963.
Companies (Prescribed Forms) Instrument, 1963 (LI 289). Source: Official Gazette of the Republic of Ghana, 12th July 1963.
Industrial Relations Act, 1965 (Act 229). Source: Acts of Ghana Vol. V, Act 299.
Trade Marks Act, 1965 (Act 270). Source: Acts of Ghana, Vol. V, Act 270.
Stamp Duty Act, 1965 (Act 311). Source: Acts of Ghana Vol. V, Act 311.
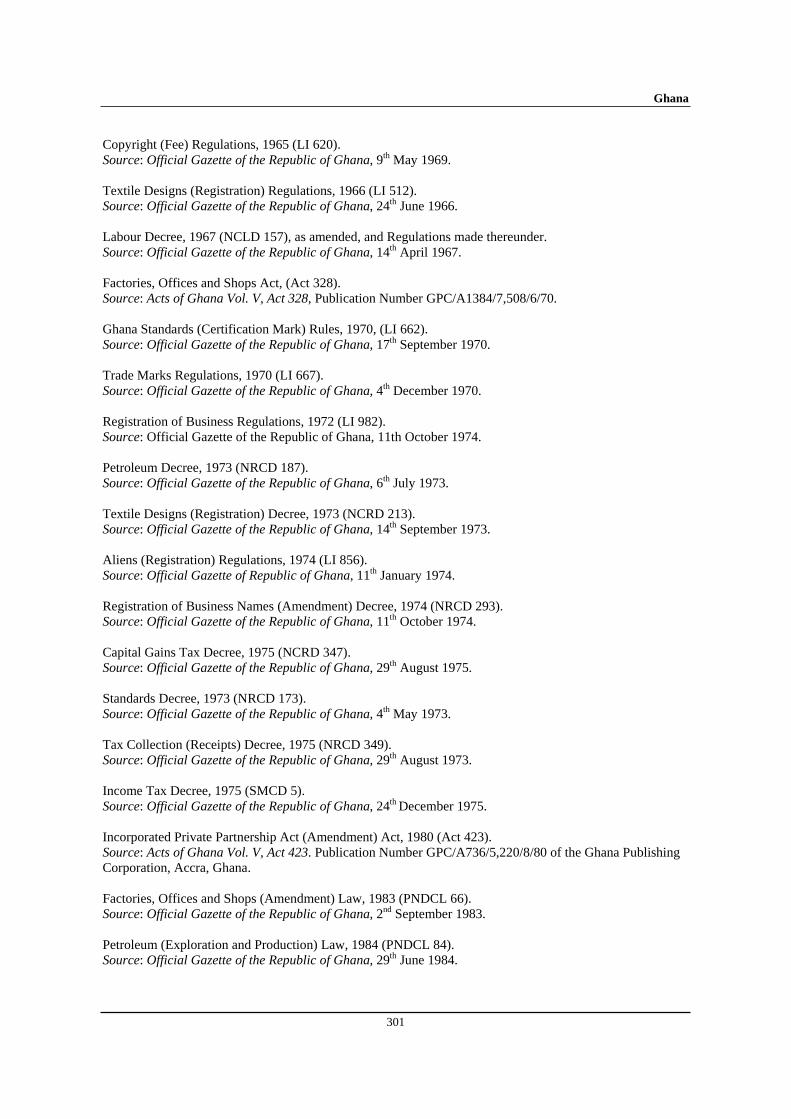
Ghana
301
Copyright (Fee) Regulations, 1965 (LI 620). Source: Official Gazette of the Republic of Ghana, 9th May 1969.
Textile Designs (Registration) Regulations, 1966 (LI 512). Source: Official Gazette of the Republic of Ghana, 24th June 1966.
Labour Decree, 1967 (NCLD 157), as amended, and Regulations made thereunder. Source: Official Gazette of the Republic of Ghana, 14th April 1967.
Factories, Offices and Shops Act, (Act 328). Source: Acts of Ghana Vol. V, Act 328, Publication Number GPC/A1384/7,508/6/70.
Ghana Standards (Certification Mark) Rules, 1970, (LI 662). Source: Official Gazette of the Republic of Ghana, 17th September 1970.
Trade Marks Regulations, 1970 (LI 667). Source: Official Gazette of the Republic of Ghana, 4th December 1970.
Registration of Business Regulations, 1972 (LI 982).Source: Official Gazette of the Republic of Ghana, 11th October 1974.
Petroleum Decree, 1973 (NRCD 187). Source: Official Gazette of the Republic of Ghana, 6th July 1973.
Textile Designs (Registration) Decree, 1973 (NCRD 213). Source: Official Gazette of the Republic of Ghana, 14th September 1973.
Aliens (Registration) Regulations, 1974 (LI 856).Source: Official Gazette of Republic of Ghana, 11th January 1974.
Registration of Business Names (Amendment) Decree, 1974 (NRCD 293). Source: Official Gazette of the Republic of Ghana, 11th October 1974.
Capital Gains Tax Decree, 1975 (NCRD 347). Source: Official Gazette of the Republic of Ghana, 29th August 1975.
Standards Decree, 1973 (NRCD 173). Source: Official Gazette of the Republic of Ghana, 4th May 1973.
Tax Collection (Receipts) Decree, 1975 (NRCD 349). Source: Official Gazette of the Republic of Ghana, 29th August 1973.
Income Tax Decree, 1975 (SMCD 5). Source: Official Gazette of the Republic of Ghana, 24th December 1975.
Incorporated Private Partnership Act (Amendment) Act, 1980 (Act 423). Source: Acts of Ghana Vol. V, Act 423. Publication Number GPC/A736/5,220/8/80 of the Ghana Publishing Corporation, Accra, Ghana.
Factories, Offices and Shops (Amendment) Law, 1983 (PNDCL 66). Source: Official Gazette of the Republic of Ghana, 2nd September 1983.
Petroleum (Exploration and Production) Law, 1984 (PNDCL 84). Source: Official Gazette of the Republic of Ghana, 29th June 1984.
World Investment Directory Volume X Africa 2008
302
Copyright Law, 1985 (PNDCL 110). Source: Official Gazette of the Republic of Ghana, 21st June 1985.
Additional Profits Tax Law, 1985 (PNDCL 122). Source: Official Gazette of the Republic of Ghana, 25th October 1985.
Internal Revenue Service Law, 1986 (PNDCL 143). Source: Official Gazette of the Republic of Ghana, 4th April 1986.
External Companies and Diplomatic Missions (Acquisition and Rental of Immovable Property) Law, 1986 (PNDCL 150). Source: Official Gazette of the Republic of Ghana, 13th June 1986.
Minerals & Mining Law, 1986 (PNDCL 153). Source: Official Gazette of the Republic of Ghana, 18th July 1986.
Minerals (Royalties) Regulations, 1986 (LI 1340). Source: Official Gazette of the Republic of Ghana, 24th December 1986.
Workmen’s Compensation Law, 1987 (PNDCL 187). Source: Official Gazette of the Republic of Ghana, 21st August 1987.
Petroleum Income Tax Law, 1987 (PNDCL 188). Source: Official Gazette of the Republic of Ghana, 4th September 1987.
Minerals (Royalties) Regulations, 1987 (LI 1348). Source: Official Gazette of the Republic of Ghana, 28th August 1987.
Income Tax (Registration of Trade, etc.) Law, 1988 (PNDCL 201). Source: Official Gazette of the Republic of Ghana, 9th September 1988.
Banking Law, 1989 (PNDCL 225). Source: Official Gazette of the Republic of Ghana, 2nd December 1989.
Insurance Law, 1989 (PNDCL 227) and Regulations. Source: Official Gazette of the Republic of Ghana, 29th December 1989.
Stock Exchange (Ghana Stock Exchange) Listing Regulations, 1990 (LI 1509). Source: Official Gazette of the Republic of Ghana, 11th January 1991.
Social Security Law, 1991 (PNDCL 247). Source: Official Gazette of the Republic of Ghana, 15th February 1991.
Patent Law, 1992 (PNDCL 332). Source: Official Gazette of the Republic of Ghana, 18th June 1993.
Technology Transfer Regulations, 1992 (LI 1547).Source: Official Gazette of the Republic of Ghana, 18th December 1992.
Customs Excise and Preventive Service (Management) Law, 1993 (PNDCL 330). Source: Official Gazette of the Republic of Ghana, 11th May 1998.
Finance Lease Law, 1993 (PNDCL 331). Source: Official Gazette of the Republic of Ghana, 18th June 1993.
Ghana
303
Securities Industry Law, 1992 (PNDCL 333). Source: Official Gazette of the Republic of Ghana, 19th November 1993.
Ghana Standards Board (Food, Drugs and Other Goods) General Labelling Rules, 1992 (LI 1541). Source: Official Gazette of the Republic of Ghana, 11th September 1992.
Minerals and Mining (Amendment) Act, 1994 (Act 475). Source: Official Gazette of Republic of Ghana, 25th February 1994.
Ghana Investment Promotion Centre Act, 1994 (Act 478). Source: Official Gazette of the Republic of Ghana, 2nd September 1994.
Environmental Protection Agency Act, 1994 (Act 490). Source: Official Gazette of the Republic of Ghana, 30th December 1994.
Export and Import Act, 1995 (Act 503). Source: Official Gazette of the Republic of Ghana, 11th August 1995.
Free Zones Act, 1995 (Act 504). Source: Official Gazette of the Republic of Ghana, 15th September 1995.
Stamp Duty (Amendment) Act, 1996 (Act 510). Source: Official Gazette of the Republic of Ghana, 22nd March, 1996.
Capital Gains Tax (Amendment) Act, 1996 (Act 513). Source: Official Gazette of the Republic of Ghana, 22nd March 1996.
Value Added Tax Service Act, 1998 (Act 546). Source: Official Gazette of the Republic of Ghana, 18th March 1998.
Income Tax (Amendment) Act 1998 (Act 551). Source: Official Gazette of the Republic of Ghana, 8th May 1998.
Customs Excise and Preventive Service (Management) (Amendment) Act, 1998 (Act 552). Source: Official Gazette of the Republic of Ghana, 8th May 1998.
Value Added Tax Regulations, 1998 (LI 1646).Source: Official Gazette of the Republic of Ghana, 12th June 1998.
II. International Framework
A. Ghana is a party to the following bi-lateral, multilateral, unilateral and regional instruments:
Convention on the Recognition and Enforcement of Foreign Arbitral Awards of June 10, 1958, entered into force on 7 June 1959. Source: United Nations, Treaty Series, Vol. 330, p. 3. International Development Association Act, 1960 (Act 11) Source: Acts of Ghana, Vol. I. Act 11.
World Investment Directory Volume X Africa 2008
304
International Bank, Fund and Finance Corporation (Amendment ) Act, 1960 (Act 12) Source: Acts of Ghana, Vol. I Act 12.
Arbitration Act, 1961 (Act 38), (including the U.N. Convention on the Recognition and Enforcement of Foreign Arbitral Awards) Source: Acts of Ghana, Vol. II, Act 38.
Paris Convention for the Protection of Industrial Property of 20 March 1883 (revised at Brussels on 14 December 1900, Washington on 2 June 1911, The Hague on 6 November 1925, London on 2 June 1934, Lisbon on 31 October 1958, Stockholm on 14 July 1967, and as amended on 2 October 1979), signed in 1963. Sources: World Intellectual Property Organisation: Depository of the original convention and revisions
and United Nations, Treaty Series, vol. 828, p. 107 (Lisbon Revision); vol. 828, p. 305 (Stockholm Revision).
Convention on the Settlement of Investment Disputes Between States and Nationals of Other States of 18 March 1965. Entered into force on 14 October 1966. Source: World Bank, Depository of the Original convention. The convention was published under document ICSID/2.
African Development Bank (Immunities and Privileges) Decree, 1967 (NLCD 173) Source: Official Gazette of the Republic of Ghana, 2nd June 1967.
Convention Establishing Multilateral Investment Guarantee Agency of 11 October 1985. Entered into force on 12 April 1988.
Source: Multilateral Investment Guarantee Agency. Convention Establishing the multilateral Investment Guarantee Agency and Commentary on the Convention (Washington D.C., MIGA, 1985), pp. 365-403.
Protocol on Patents and Industrial Designs within the Framework of the Industrial Property Organization for English-speaking Africa (ESARIPO) (Ratification) Law, 1985 (PNDCL 137) Source: Official Gazette of the Republic of Ghana, 24th December 1986.
Marrakesh Agreement Establishing the World Trade Organisation of 15 April 1994. Entered into force on 1 January 1995. Agreement on Trade-Related Investment Measures. General Agreement on Trade in Services. Agreement on Trade Related Aspects of Intellectual Property Rights.
Partnership Agreement Between the Members of the African, Caribbean and Pacific Group of States of the One Part, and the European Community and Its Member States, of the Other Part, signed in Cotonou, Benin on 23 June 2000. Source: African, Caribbean and the Pacific States and the European Community (2000).
B. Bilateral Treaties
1. Bilateral investment treaties for the protection and promotion of investments: Bulgaria 1989,,China 1989, Netherlands 1989, Romania 1989, United Kingdom 1989, Switzerland 1991, Denmark 1992, Germany 1995, Malaysia 1996, Cote d'Ivoire 1997, Egypt 1998, Italy 1998, South Africa 1998, Cuba 1999, France 1999, United Kingdom 1999,,Serbia and Montenegro 2000, Benin 2001, Burkina Faso 2001, Guinea 2001, Mauritania 2001, Mauritius 2001, Zambia 2001, India 2002, Botswana 2003, Spain 2006.
2. Bilateral treaties for the avoidance of double taxation: France 1993, United Kingdom 1993, Serbia and Montenegro 2000, Italy 2004, South Africa 2004, Belgium 2005.
Ghana
305
C. Other treaties:
Agreement with the United States of American government concerning the development of trade and investment relations (1999).
World Investment Directory Volume X Africa 2008
306
D. Sources of information
Official
Bank of Ghana (www.bog.gov.gh).
Secondary
Ahiakpor, James C. W. (1986). “The Profits of Foreign firms in a Less Developed Country: Ghana”, Journal
of Development Economics, 22(2), Amsterdam, Jul/Aug, pp. 321-335.
Bannerman, Reginald E. (1986). “Foreign Investment in Ghana”, International Financial Law Review, 5(3), London, March, pp. 37-38.
Bannerman, Reginald E. (1985). “Ghana Enacts Investment Law Reform”, International Financial Law
Review, 14(3), London, March, pp. 23-25.
Besley, T. (1995). “Property Rights and Investment Incentives: Theory and Evidence from Ghana”, Journal
of Political Economy, 103(5), October, pp. 903-937.
Boateng A. and Keith W. Glaister (1999). “Foreign Direct Investment in Ghana: Patterns of Activity, Distribution and the Role of Government Policy”, Journal of Euro-Marketing, 8(4), New York, pp. 51-74.
Economist Intelligence Unit (EIU) (various years). Country Profile: Ghana (London: EIU Ltd.).
___________ (various years). Country Report: Ghana (London: EIU Ltd.).
International Monetary Fund (IMF) (2006). IMF's Sub-Saharan Africa Regional Economic Outlook, March 10, 2006. (Washington D.C.: IMF).
Ogunleye, Eric Kehinde (2008) "Exchange rate volatility and foreign direct investment inflows in selected Sub-Saharan African Countries" (PhD Thesis, University of Ibadan).
Soderbom, M. and F. Teal (2004). "Size and Efficiency in Africa Manufacturing firms: Evidence from Firm-Level Panel Data." Journal of Development Economics, 73. pp 369 - 394.
United Nations Conference on Trade and Development (UNCTAD) (2005a). Investor-Disputes Arising
from Investment Treaties: A Review. UNCTAD Series of International Investment Policies for Development (UNCTAD/ITE/IIT/2005/4).
___________(2005b). A Survey of Support by Investment Promotion Agencies to Linkages. Advisory Studies No. 18 (UNCTAD/ITE/IPC/2005/12).
___________(2006). Blue Book on Best Practice in Investment Promotion and Facilitation: Ghana
(UNCTAD/ITE/IPC/2006/13).
United States Trade Representative (2006). 2006 Comprehensive Report on U.S. Trade and Investment
Policy Toward Sub-Saharan Africa and Implementation of the Africa Growth and Opportunity Act:
The Sixth of Eight Annual Reports, May 2006. (Washington D.C.: US Government).
Willem Dirk te Velde and Oliver Morrissey (2002). "Foreign ownership and wages: evidence from five African countries (Cameroon, Ghana, Kenya, Zambia and Zimbabwe) (Nothingham: Center for
Ghana
307
Research in Economic Development and International Trade, University of Nothingham; Research paper No. 01/19).
World Bank (2002). Global Economic Prospects and the Developing Countries 2003: Investing to Unlock
Opportunities (Washington D.C.: World Bank).
World Bank/International Finance Corporation (2007). Doing Business 2008 Ghana (Washington D.C.: The World Bank Group).
World Economic Forum (2000/2001). Africa competitiveness report (New York: Oxford University Press).

Guinea
309
Guinea
A. Definitions and sources of data
In the Republic of Guinea, the Investment Code (Ordonance No. 001/PRG/87) does not contain a specific definition of foreign direct investment (FDI). The code rather defines "investment of foreign capital" in three forms: 1) as the contribution to any business duly established in Guinea of foreign currency or new capital goods acquired abroad, in return for the granting of company stock or shares, such stock or shares entitling the contributor to an interest in the profits and proceeds of liquidating the business, provided the value of any contribution other than a foreign currency contribution has been determined by independent certified public accountants; 2) the reinvestment of earnings from the business that could have been transferred abroad; and 3) the purchase of existing businesses or acquisition of holdings in such businesses through a contribution of foreign currency. The data on annual inflows of FDI were gathered from the Central Bank of Guinea (Banque Centrale de la République de Guinée). The International Monetary Fund also provides data on FDI in Guinea in its annual balance-of-payment statistics publication.
Guinea established an investment code in 1995 to update the code of October 1984. More recently the Government provided a wide range of investment incentives. Industrial exploitation of diamonds is a subject of intense interest. Guinea has almost half the world's stock of bauxite and is the second largest global producer of the ore, with known reserves of 12 billion tones and as much in probable deposits. The country also has proven large deposits of iron ore and other known reserves include chrome, cobalt, copper, lead, manganese, molybdenum, nickel, platinum, titanium, uranium, zinc, chalk, graphite and granite (the only mineral exploited on an industrial scale).
Guinea signed to the Convention on the Settlement of Investment Disputes between State and Nationals of other States on 27 August 1968 and benefits from a wide range of market access. It is a member of the Economic Community of West African States, the West African Economic and Monetary Union, New Partnership for Africa's Development and the African Union. Also, Guinea benefits from the United States' market access initiative - the Africa Growth and Opportunity Act and the Cotonou Agreement between the African, Caribbean and Pacific countries and the European Union for renegotiating the Lomé Convention. It is also a member of the World Trade Organization.
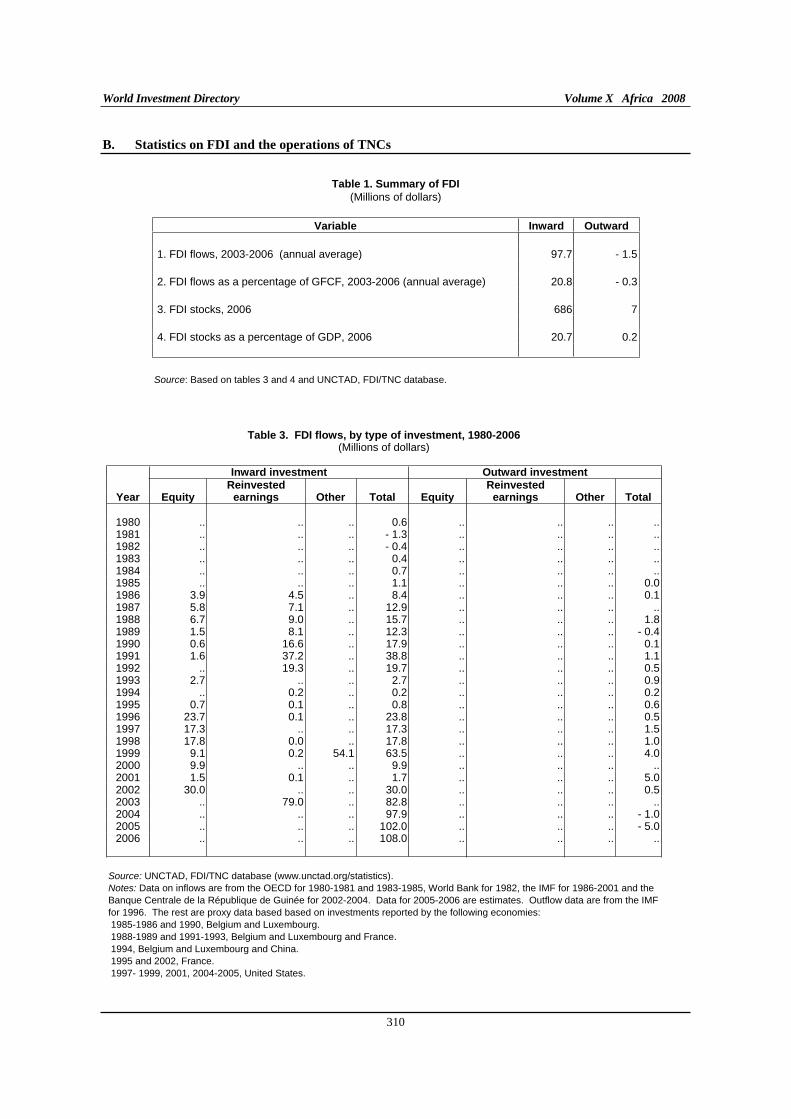
World Investment Directory Volume X Africa 2008
310
B. Statistics on FDI and the operations of TNCs
Table 1. Summary of FDI (Millions of dollars)
Variable Inward Outward
1. FDI flows, 2003-2006 (annual average) 97.7 - 1.5
2. FDI flows as a percentage of GFCF, 2003-2006 (annual average) 20.8 - 0.3
3. FDI stocks, 2006 686 7
4. FDI stocks as a percentage of GDP, 2006 20.7 0.2
Source: Based on tables 3 and 4 and UNCTAD, FDI/TNC database.
Table 3. FDI flows, by type of investment, 1980-2006 (Millions of dollars)
Inward investment Outward investment
Reinvested Reinvested Year Equity earnings Other Total Equity earnings Other Total
1980 .. .. .. 0.6 .. .. .. ..1981 .. .. .. - 1.3 .. .. .. ..1982 .. .. .. - 0.4 .. .. .. ..1983 .. .. .. 0.4 .. .. .. ..1984 .. .. .. 0.7 .. .. .. ..1985 .. .. .. 1.1 .. .. .. 0.01986 3.9 4.5 .. 8.4 .. .. .. 0.11987 5.8 7.1 .. 12.9 .. .. .. ..1988 6.7 9.0 .. 15.7 .. .. .. 1.81989 1.5 8.1 .. 12.3 .. .. .. - 0.41990 0.6 16.6 .. 17.9 .. .. .. 0.11991 1.6 37.2 .. 38.8 .. .. .. 1.11992 .. 19.3 .. 19.7 .. .. .. 0.51993 2.7 .. .. 2.7 .. .. .. 0.91994 .. 0.2 .. 0.2 .. .. .. 0.21995 0.7 0.1 .. 0.8 .. .. .. 0.61996 23.7 0.1 .. 23.8 .. .. .. 0.51997 17.3 .. .. 17.3 .. .. .. 1.51998 17.8 0.0 .. 17.8 .. .. .. 1.01999 9.1 0.2 54.1 63.5 .. .. .. 4.02000 9.9 .. .. 9.9 .. .. .. ..2001 1.5 0.1 .. 1.7 .. .. .. 5.02002 30.0 .. .. 30.0 .. .. .. 0.52003 .. 79.0 .. 82.8 .. .. .. ..2004 .. .. .. 97.9 .. .. .. - 1.02005 .. .. .. 102.0 .. .. .. - 5.02006 .. .. .. 108.0 .. .. .. ..
Source: UNCTAD, FDI/TNC database (www.unctad.org/statistics). Notes: Data on inflows are from the OECD for 1980-1981 and 1983-1985, World Bank for 1982, the IMF for 1986-2001 and the Banque Centrale de la République de Guinée for 2002-2004. Data for 2005-2006 are estimates. Outflow data are from the IMF for 1996. The rest are proxy data based based on investments reported by the following economies: 1985-1986 and 1990, Belgium and Luxembourg. 1988-1989 and 1991-1993, Belgium and Luxembourg and France. 1994, Belgium and Luxembourg and China. 1995 and 2002, France. 1997- 1999, 2001, 2004-2005, United States.
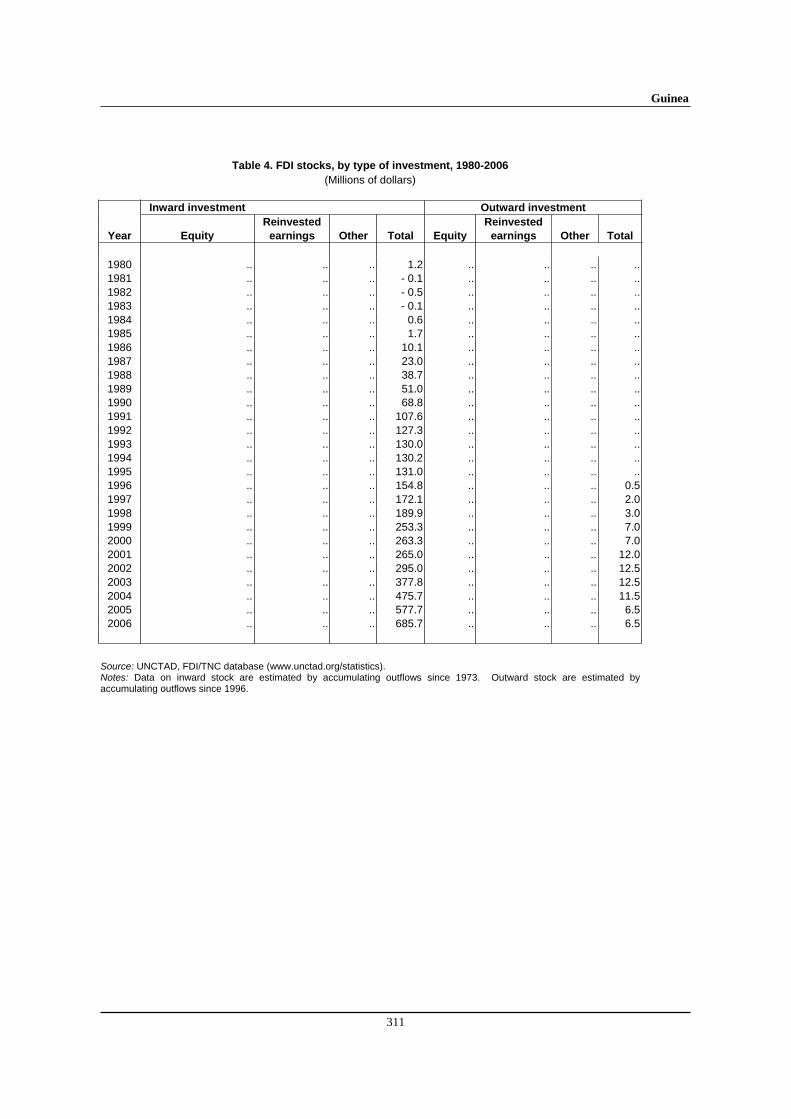
Guinea
311
Table 4. FDI stocks, by type of investment, 1980-2006
(Millions of dollars)
Inward investment Outward investment
Reinvested Reinvested
Year Equity earnings Other Total Equity earnings Other Total
1980 .. .. .. 1.2 .. .. .. ..1981 .. .. .. - 0.1 .. .. .. ..1982 .. .. .. - 0.5 .. .. .. ..1983 .. .. .. - 0.1 .. .. .. ..1984 .. .. .. 0.6 .. .. .. ..1985 .. .. .. 1.7 .. .. .. ..1986 .. .. .. 10.1 .. .. .. ..1987 .. .. .. 23.0 .. .. .. ..1988 .. .. .. 38.7 .. .. .. ..1989 .. .. .. 51.0 .. .. .. ..1990 .. .. .. 68.8 .. .. .. ..1991 .. .. .. 107.6 .. .. .. ..1992 .. .. .. 127.3 .. .. .. ..1993 .. .. .. 130.0 .. .. .. ..1994 .. .. .. 130.2 .. .. .. ..1995 .. .. .. 131.0 .. .. .. ..1996 .. .. .. 154.8 .. .. .. 0.51997 .. .. .. 172.1 .. .. .. 2.01998 .. .. .. 189.9 .. .. .. 3.01999 .. .. .. 253.3 .. .. .. 7.02000 .. .. .. 263.3 .. .. .. 7.02001 .. .. .. 265.0 .. .. .. 12.02002 .. .. .. 295.0 .. .. .. 12.52003 .. .. .. 377.8 .. .. .. 12.52004 .. .. .. 475.7 .. .. .. 11.52005 .. .. .. 577.7 .. .. .. 6.52006 .. .. .. 685.7 .. .. .. 6.5
Source: UNCTAD, FDI/TNC database (www.unctad.org/statistics). Notes: Data on inward stock are estimated by accumulating outflows since 1973. Outward stock are estimated by accumulating outflows since 1996.
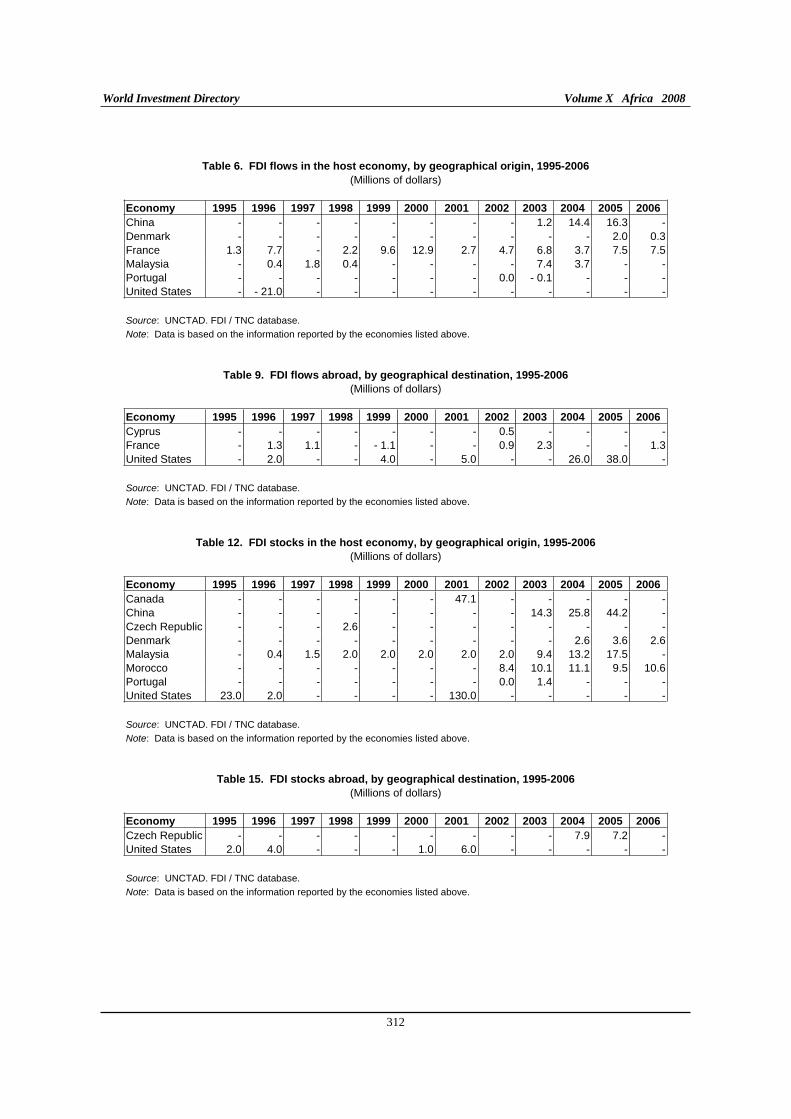
World Investment Directory Volume X Africa 2008
312
Table 6. FDI flows in the host economy, by geographical origin, 1995-2006
(Millions of dollars) Economy 1995 1996 1997 1998 1999 2000 2001 2002 2003 2004 2005 2006
China - - - - - - - - 1.2 14.4 16.3 -Denmark - - - - - - - - - - 2.0 0.3France 1.3 7.7 - 2.2 9.6 12.9 2.7 4.7 6.8 3.7 7.5 7.5Malaysia - 0.4 1.8 0.4 - - - - 7.4 3.7 - -Portugal - - - - - - - 0.0 - 0.1 - - -United States - - 21.0 - - - - - - - - - - Source: UNCTAD. FDI / TNC database.
Note: Data is based on the information reported by the economies listed above.
Table 9. FDI flows abroad, by geographical destination, 1995-2006
(Millions of dollars) Economy 1995 1996 1997 1998 1999 2000 2001 2002 2003 2004 2005 2006
Cyprus - - - - - - - 0.5 - - - -France - 1.3 1.1 - - 1.1 - - 0.9 2.3 - - 1.3United States - 2.0 - - 4.0 - 5.0 - - 26.0 38.0 - Source: UNCTAD. FDI / TNC database.
Note: Data is based on the information reported by the economies listed above.
Table 12. FDI stocks in the host economy, by geographical origin, 1995-2006
(Millions of dollars) Economy 1995 1996 1997 1998 1999 2000 2001 2002 2003 2004 2005 2006
Canada - - - - - - 47.1 - - - - -China - - - - - - - - 14.3 25.8 44.2 -Czech Republic - - - 2.6 - - - - - - - -Denmark - - - - - - - - - 2.6 3.6 2.6Malaysia - 0.4 1.5 2.0 2.0 2.0 2.0 2.0 9.4 13.2 17.5 -Morocco - - - - - - - 8.4 10.1 11.1 9.5 10.6Portugal - - - - - - - 0.0 1.4 - - -United States 23.0 2.0 - - - - 130.0 - - - - - Source: UNCTAD. FDI / TNC database.
Note: Data is based on the information reported by the economies listed above.
Table 15. FDI stocks abroad, by geographical destination, 1995-2006
(Millions of dollars) Economy 1995 1996 1997 1998 1999 2000 2001 2002 2003 2004 2005 2006
Czech Republic - - - - - - - - - 7.9 7.2 -United States 2.0 4.0 - - - 1.0 6.0 - - - - - Source: UNCTAD. FDI / TNC database.
Note: Data is based on the information reported by the economies listed above.
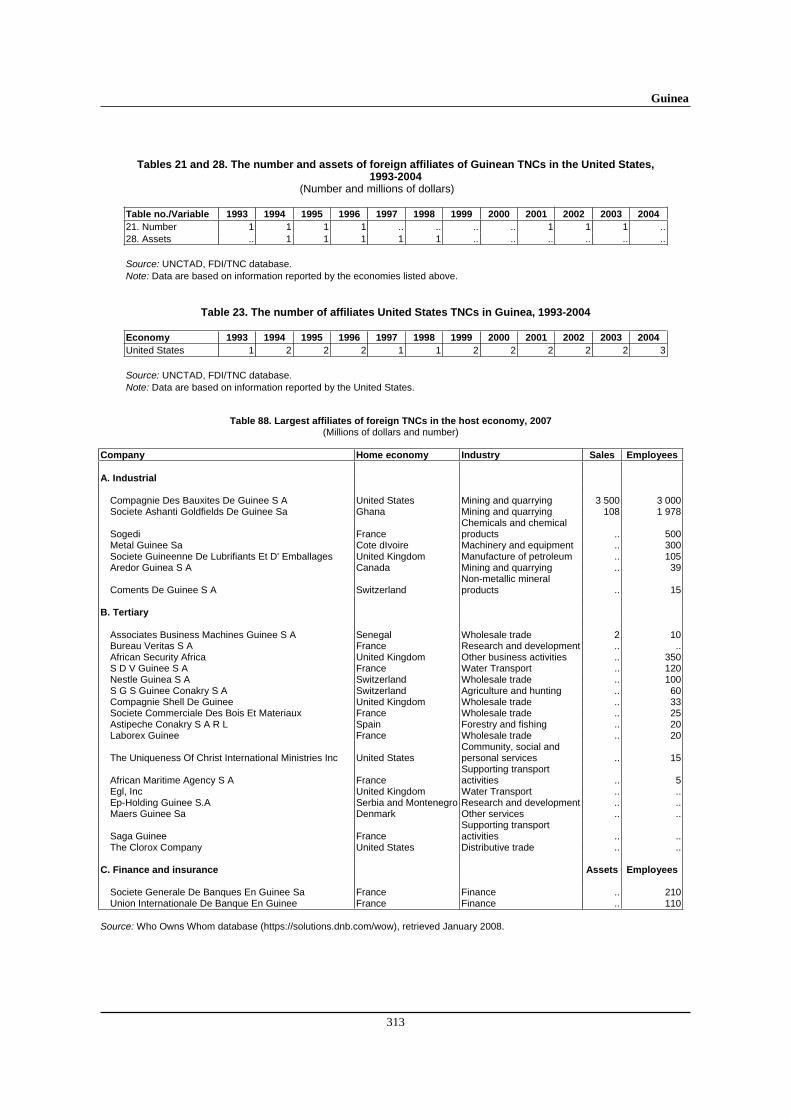
Guinea
313
Tables 21 and 28. The number and assets of foreign affiliates of Guinean TNCs in the United States, 1993-2004
(Number and millions of dollars) Table no./Variable 1993 1994 1995 1996 1997 1998 1999 2000 2001 2002 2003 2004
21. Number 1 1 1 1 .. .. .. .. 1 1 1 ..28. Assets .. 1 1 1 1 1 .. .. .. .. .. .. Source: UNCTAD, FDI/TNC database. Note: Data are based on information reported by the economies listed above.
Table 23. The number of affiliates United States TNCs in Guinea, 1993-2004
Economy 1993 1994 1995 1996 1997 1998 1999 2000 2001 2002 2003 2004
United States 1 2 2 2 1 1 2 2 2 2 2 3 Source: UNCTAD, FDI/TNC database. Note: Data are based on information reported by the United States.
Table 88. Largest affiliates of foreign TNCs in the host economy, 2007 (Millions of dollars and number)
Company Home economy Industry Sales Employees A. Industrial
Compagnie Des Bauxites De Guinee S A United States Mining and quarrying 3 500 3 000Societe Ashanti Goldfields De Guinee Sa Ghana Mining and quarrying 108 1 978
Sogedi France Chemicals and chemical products .. 500
Metal Guinee Sa Cote dIvoire Machinery and equipment .. 300Societe Guineenne De Lubrifiants Et D' Emballages United Kingdom Manufacture of petroleum .. 105Aredor Guinea S A Canada Mining and quarrying .. 39
Coments De Guinee S A Switzerland Non-metallic mineral products .. 15
B. Tertiary
Associates Business Machines Guinee S A Senegal Wholesale trade 2 10Bureau Veritas S A France Research and development .. ..African Security Africa United Kingdom Other business activities .. 350S D V Guinee S A France Water Transport .. 120Nestle Guinea S A Switzerland Wholesale trade .. 100S G S Guinee Conakry S A Switzerland Agriculture and hunting .. 60Compagnie Shell De Guinee United Kingdom Wholesale trade .. 33Societe Commerciale Des Bois Et Materiaux France Wholesale trade .. 25Astipeche Conakry S A R L Spain Forestry and fishing .. 20Laborex Guinee France Wholesale trade .. 20
The Uniqueness Of Christ International Ministries Inc United States Community, social and personal services .. 15
African Maritime Agency S A France Supporting transport activities .. 5
Egl, Inc United Kingdom Water Transport .. ..Ep-Holding Guinee S.A Serbia and Montenegro Research and development .. ..Maers Guinee Sa Denmark Other services .. ..
Saga Guinee France Supporting transport activities .. ..
The Clorox Company United States Distributive trade .. .. C. Finance and insurance Assets Employees
Societe Generale De Banques En Guinee Sa France Finance .. 210Union Internationale De Banque En Guinee France Finance .. 110
Source: Who Owns Whom database (https://solutions.dnb.com/wow), retrieved January 2008.
World Investment Directory Volume X Africa 2008
314
C. Legal frameworks for transnational corporations
In Guinea, a number of legal instruments exist to regulate the activities of the transnational corporations and foreign direct investors. Some of these instruments are international treaties. The others are enacted at national and bilateral levels. The key ones are:
I. National framework
Law No. 043/APN/CP/80, August 1980 regulating Copyright and Neighboring Rights Protection. Source: WIPO (http://www.wipo.org).
Investment Code - Ordinance No. 001/PRG/87 concerning the Investment Code of 3 January 1987. Source: Ministry of Planning and International Cooperation (official copy); National Investment Commission. As amended by Law L/95/029/CTRN of 30 June 1995, amending the Investment code. Source: Official Journal of the Republic of Guinea of 10 July 1995.
Code du Travail. Ordinance No. 008/PRG/88 of 28 January 1988 on Labour Law. Source: Journal Official de la Republique de Guinee of 1 February 1988.
Code foncier et Domanial. Ordinance No. 0/92/019 of 30 March 1992 on the Land Law. Source: Journal Official de la Republique de Guinee. Trente Huitieme annee, May 1992 -Hors Serie.
Code des Activites Economiques -Iere et IIeme parties. Promulgated by Law L/92/043/CTRN of 8 December 1992, after correction of material errors by Ministry of Justice Atrete A/94/0503I/MJ/CAB of 19 December 1994. Source: Journal Official de la Republique de Guinee. Trente Huitieme annee, Octobre 1995 -Hors Serie.
Code des Activites Economiques IIIeme partie. Promulgated by Law L/94/020/CTRN of July 1994. Source:Journal Official de la Republique de Guinee. Trente Huitieme annee, Octobre 1995 -Hors Serie.
II. International Framework
A. Guinea is a party to the following multilateral and regional instruments:
Convention on the Recognition and Enforcement of Foreign Arbitral Awards of 1958, which entered into force on 7 June 1959.
Convention on the Settlement of Investment Disputes between States and Nationals of other States of 1965. Entered into force on 14 October 1966.
Patents: Bangui Agreement, March 1977 (Annex I), as last amended in February 1999. Source: WIPO (http://www.wipo.org).
Industrial Designs: Bangui Agreement, March 1977 (Annexes II and IV), as last amended in February 1999. Source: WIPO (http://www.wipo.org).
Trade Marks: Bangui Agreement, March 1977 (Annex III), as last amended in February 1999. Source: WIPO (http://www.wipo.org).
Agreement for the Promotion, Protection and Guarantee of Investment Among Member States of the Organisation of Islamic Conference of I June 1981; entered into force on 23 September 1986.
Guinea
315
Convention Establishing the Multilateral Investment Guarantee Agency of 1985, entered into force on 12 April 1988.
Fourth ACP - EEC Convention (Lome IV) of 1989, entered into force on 1st March 1990.
Articles of Agreement of the Islamic Corporation for the Insurance of Investment and Export Credit of 19 February 1992; entered into force on 1 August 1994.
Revised Treaty of the Economic Community of West African States (ECOWAS) 1993.
Paris Convention for the Protection of Industrial Property of 1883 (Revised at Brussels in 1900, Washington in 1911, The Hague in 1925, London in 1934, Lisbon in 1958 and Stockholm in 1967, and as amended in 1979). Signed in 1994.
Marrakesh Agreement Establishing the World Trade Organisation of 15 April 1994. Entered into force on 1 January 1995. Agreement on Trade-Related Investment Measures. General Agreement on Trade in Services. Agreement on Trade Related Aspects of Intellectual Property Rights.
Partnership Agreement between the Members of The African, Caribbean and Pacific Group of States, of the one part and the European Community and its member states, of the other part signed in Cotonou, Benin on 23 June 2000.
B. Bilateral treaties
1. Bilateral investment treaties for the protection and promotion of investments: Switzerland 1962, Italy 1964, Tunisia 1990, Malaysia 1996, Serbia and Montenegro 1996, Egypt 1998, Benin 2001, Cameroon 2001, Ghana 2001, Mali 2001, Mauritania 2001, Mauritius 2001, Morocco 2002, Burkina Faso 2003, Chad 2004, Lebanon 2004, China 2005, Germany 2006.
2. Bilateral treaties for the avoidance of double taxation: Serbia and Montenegro 1996.
World Investment Directory Volume X Africa 2008
316
D. Sources of information
Official
Central Bank of the Republic of Guinea (www.bcrg.gov.gn).
Secondary
Condé, Julien and Diallo, A. B. (2002). Une ambition pour la Guinée (Paris: L’Harmattan, Paris).
Economist Intelligence Unit (EIU) (various years). Country Profile: Guinea (London: EIU Ltd.).
___________ (various years). Country Report: Guinea (London: EIU Ltd.).
International Monetary Fund (IMF) (2006). IMF's Sub-Saharan Africa Regional Economic Outlook, March 10, 2006. (Washington D.C.: IMF).
Jennifer Clapp (1997). Adjustment and agriculture in Africa: Farmers, the state and the World Bank in
Guinea (London: Macmillan Press).
Republic of Guinea and International Monetary Fund (2002). Letter of Intent, Memorandum of Economic and Financial Policies and Technical Memorandum of Understanding, Conakry, July.
Soderbom, M. and F. Teal (2004). "Size and Efficiency in Africa Manufacturing firms: Evidence from Firm-Level Panel Data." Journal of Development Economics, 73. pp 369 - 394.
United Nations Conference on Trade and Development (UNCTAD) (2002). FDI in Least Developed
Countries at a Glance (Geneva: UNCTAD) (www.unctad.org/en/subsites/dite/LDCs/ pdfs/Countries/chad.pdf).
____________(2005a). Investor-Disputes Arising from Investment Treaties: A Review. UNCTAD Series of International Investment Policies for Development (UNCTAD/ITE/IIT/2005/4).
_____________(2005b). A Survey of Support by Investment Promotion Agencies to Linkages. Advisory Studies No. 18 (UNCTAD/ITE/IPC/2005/12).
______________(2005c). FDI in least developed countries at a glance: 2005/2006
(UNCTAD/ITE/IIA/2005/17).
United States Department of State, Bureau of African Affairs (1995). "Investment climate report: sub-Saharan Africa" (Washington D.C.: United States Department of State).
Guinea
317
United States Trade Representative (2006). 2006 Comprehensive Report on U.S. Trade and Investment
Policy Toward Sub-Saharan Africa and Implementation of the Africa Growth and Opportunity Act:
The Sixth of Eight Annual Reports, May 2006. (Washington D.C.: US Government).
World Bank (2002). Global Economic Prospects and the Developing Countries 2003: Investing to Unlock
Opportunities (Washington D.C.: World Bank).
World Bank/International Finance Corporation (2007). Doing Business 2008 Guinea (Washington D.C.: The World Bank Group).
World Trade Organisation (WTO) (2000). Trade policy review: Republic of Guinea (Geneva: WTO).

Guinea-Bissau
319
Guinea Bissau
A. Definitions and sources of data
In the Republic of Guinea-Bissau, foreign direct investment (FDI) is defined as any contribution calculable in financial terms brought into the country from an external source by individuals or corporate bodies not domiciled or headquartered within the national territory, either for the purposes of their own commercial activities or for the purpose of participating in the capital of companies that are already established or that is intended to establish in the Republic of Guinea-Bissau (Decree-Law No. 2/85). Data on the annual inflows of FDI in Guinea-Bissau were gathered from the Banque Centrale des Etats De L'Afrique De L'Ouest (BCEAO). The International Monetary Fund also provides data on FDI in the country in its balance-of-payment statistics.
The Investment Code of the Republic of Guinea-Bissau provides incentives for investment and guarantees against nationalization and expropriation. Residents and non-residents may hold foreign exchange accounts with permission of the Central Bank of West African States – the BCEAO. Payments and transfers are generally free of restrictions. The Government must authorize outward capital transactions. Capital transfers to members of the West African Economic and Monetary Union are unrestricted, aside from direct investments. The Government must approve most personal capital movements between residents and non-residents, such as personal loans, gifts or inheritances, or transfer of assets. Barriers are moderate by global standards.
The country has some capacity for attracting FDI in the tourism industry. The sector has some potential that includes deep-sea fishing and scuba diving operations on the Bijagos archipelago. The country also has some historical and architectural interest. The sector is yet to be developed.
To increase its outreach to the world market and expand trading opportunities, Guinea-Bissau signed the Convention on the Settlement of Investment Disputes between State and Nationals of other States on 4 September 1991 and is a member of Economic Community of West African States and the Inter-State Sahelien Committee (known by its French acronym, CILSS - Comite permanent inter-Etats de lutte contre la secheresse dans le Sahel), BCEAO, the Union economique et monetaire ouest- Africaine, New Partnership for Africa's Development, African Union and is a signatory of the Cotonou Agreement for renegotiating the partnership links between the African, Caribbean and Pacific countries with the European Union. It also belongs to the Lusophone community, Comunidade dos Paises de Lingua Portuguesa. Most recently, the country was declared an eligible member stated of the United States' market access initiative for African countries - the African Growth and Opportunity Act and is a member of the World Trade Organization.
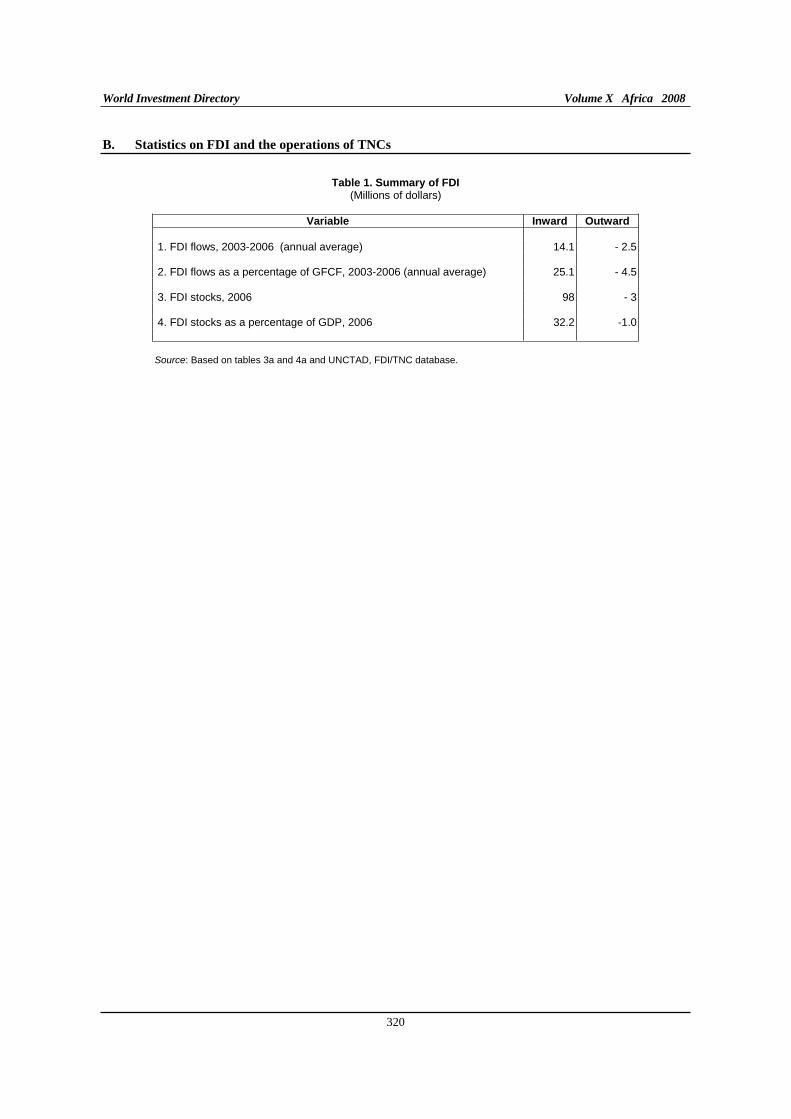
World Investment Directory Volume X Africa 2008
320
B. Statistics on FDI and the operations of TNCs
Table 1. Summary of FDI (Millions of dollars)
Variable Inward Outward
1. FDI flows, 2003-2006 (annual average) 14.1 - 2.5 2. FDI flows as a percentage of GFCF, 2003-2006 (annual average) 25.1 - 4.5 3. FDI stocks, 2006 98 - 3 4. FDI stocks as a percentage of GDP, 2006 32.2 -1.0 Source: Based on tables 3a and 4a and UNCTAD, FDI/TNC database.
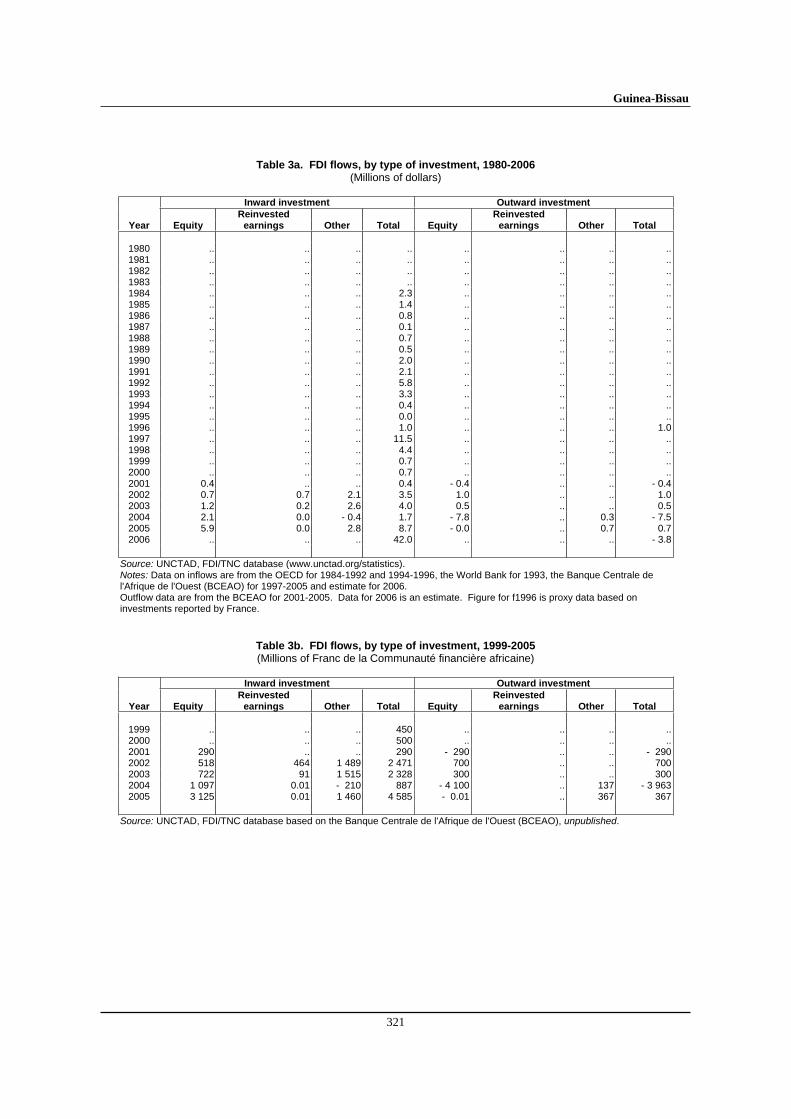
Guinea-Bissau
321
Table 3a. FDI flows, by type of investment, 1980-2006 (Millions of dollars)
Inward investment Outward investment
Reinvested Reinvested Year Equity earnings Other Total Equity earnings Other Total
1980 .. .. .. .. .. .. .. ..1981 .. .. .. .. .. .. .. ..1982 .. .. .. .. .. .. .. ..1983 .. .. .. .. .. .. .. ..1984 .. .. .. 2.3 .. .. .. ..1985 .. .. .. 1.4 .. .. .. ..1986 .. .. .. 0.8 .. .. .. ..1987 .. .. .. 0.1 .. .. .. ..1988 .. .. .. 0.7 .. .. .. ..1989 .. .. .. 0.5 .. .. .. ..1990 .. .. .. 2.0 .. .. .. ..1991 .. .. .. 2.1 .. .. .. ..1992 .. .. .. 5.8 .. .. .. ..1993 .. .. .. 3.3 .. .. .. ..1994 .. .. .. 0.4 .. .. .. ..1995 .. .. .. 0.0 .. .. .. ..1996 .. .. .. 1.0 .. .. .. 1.01997 .. .. .. 11.5 .. .. .. ..1998 .. .. .. 4.4 .. .. .. ..1999 .. .. .. 0.7 .. .. .. ..2000 .. .. .. 0.7 .. .. .. ..2001 0.4 .. .. 0.4 - 0.4 .. .. - 0.42002 0.7 0.7 2.1 3.5 1.0 .. .. 1.02003 1.2 0.2 2.6 4.0 0.5 .. .. 0.52004 2.1 0.0 - 0.4 1.7 - 7.8 .. 0.3 - 7.52005 5.9 0.0 2.8 8.7 - 0.0 .. 0.7 0.72006 .. .. .. 42.0 .. .. .. - 3.8
Source: UNCTAD, FDI/TNC database (www.unctad.org/statistics). Notes: Data on inflows are from the OECD for 1984-1992 and 1994-1996, the World Bank for 1993, the Banque Centrale de l'Afrique de l'Ouest (BCEAO) for 1997-2005 and estimate for 2006. Outflow data are from the BCEAO for 2001-2005. Data for 2006 is an estimate. Figure for f1996 is proxy data based on investments reported by France.
Table 3b. FDI flows, by type of investment, 1999-2005 (Millions of Franc de la Communauté financière africaine)
Inward investment Outward investment
Reinvested Reinvested Year Equity earnings Other Total Equity earnings Other Total
1999 .. .. .. 450 .. .. .. ..2000 .. .. .. 500 .. .. .. ..2001 290 .. .. 290 - 290 .. .. - 2902002 518 464 1 489 2 471 700 .. .. 7002003 722 91 1 515 2 328 300 .. .. 3002004 1 097 0.01 - 210 887 - 4 100 .. 137 - 3 9632005 3 125 0.01 1 460 4 585 - 0.01 .. 367 367
Source: UNCTAD, FDI/TNC database based on the Banque Centrale de l'Afrique de l'Ouest (BCEAO), unpublished.
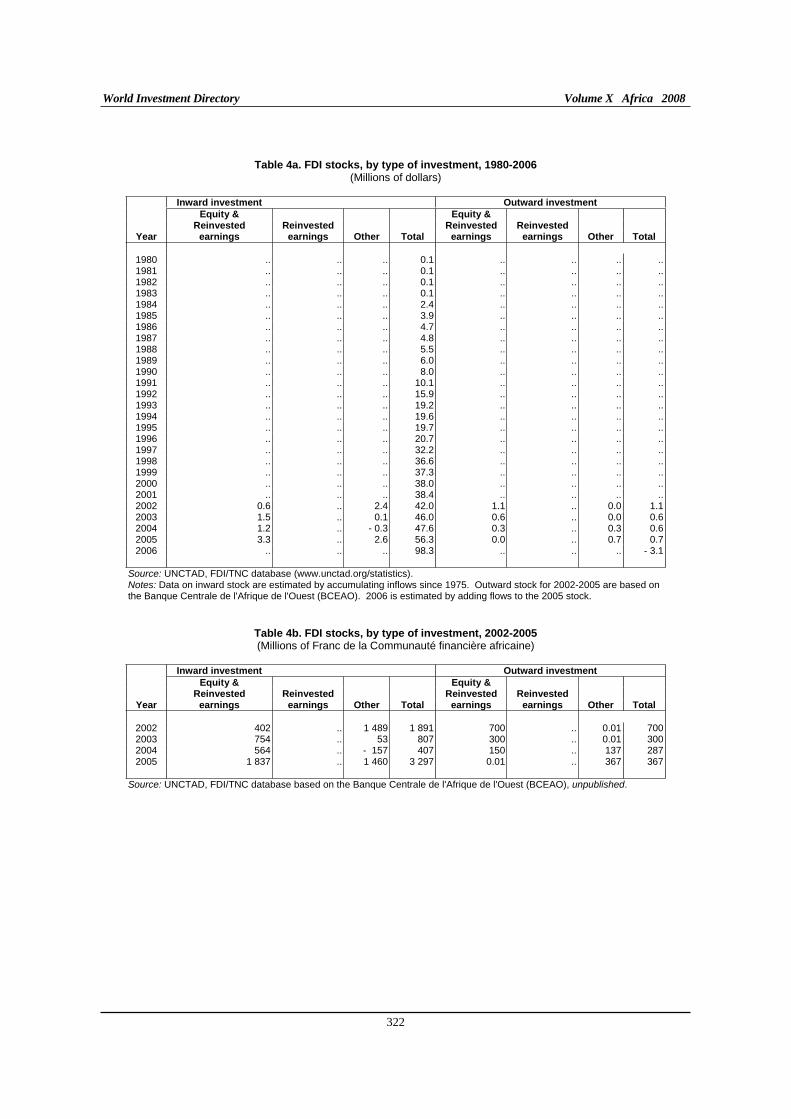
World Investment Directory Volume X Africa 2008
322
Table 4a. FDI stocks, by type of investment, 1980-2006 (Millions of dollars)
Inward investment Outward investment
Equity & Equity & Reinvested Reinvested Reinvested Reinvested
Year earnings earnings Other Total earnings earnings Other Total
1980 .. .. .. 0.1 .. .. .. ..1981 .. .. .. 0.1 .. .. .. ..1982 .. .. .. 0.1 .. .. .. ..1983 .. .. .. 0.1 .. .. .. ..1984 .. .. .. 2.4 .. .. .. ..1985 .. .. .. 3.9 .. .. .. ..1986 .. .. .. 4.7 .. .. .. ..1987 .. .. .. 4.8 .. .. .. ..1988 .. .. .. 5.5 .. .. .. ..1989 .. .. .. 6.0 .. .. .. ..1990 .. .. .. 8.0 .. .. .. ..1991 .. .. .. 10.1 .. .. .. ..1992 .. .. .. 15.9 .. .. .. ..1993 .. .. .. 19.2 .. .. .. ..1994 .. .. .. 19.6 .. .. .. ..1995 .. .. .. 19.7 .. .. .. ..1996 .. .. .. 20.7 .. .. .. ..1997 .. .. .. 32.2 .. .. .. ..1998 .. .. .. 36.6 .. .. .. ..1999 .. .. .. 37.3 .. .. .. ..2000 .. .. .. 38.0 .. .. .. ..2001 .. .. .. 38.4 .. .. .. ..2002 0.6 .. 2.4 42.0 1.1 .. 0.0 1.12003 1.5 .. 0.1 46.0 0.6 .. 0.0 0.62004 1.2 .. - 0.3 47.6 0.3 .. 0.3 0.62005 3.3 .. 2.6 56.3 0.0 .. 0.7 0.72006 .. .. .. 98.3 .. .. .. - 3.1
Source: UNCTAD, FDI/TNC database (www.unctad.org/statistics). Notes: Data on inward stock are estimated by accumulating inflows since 1975. Outward stock for 2002-2005 are based on the Banque Centrale de l'Afrique de l'Ouest (BCEAO). 2006 is estimated by adding flows to the 2005 stock.
Table 4b. FDI stocks, by type of investment, 2002-2005 (Millions of Franc de la Communauté financière africaine)
Inward investment Outward investment
Equity & Equity & Reinvested Reinvested Reinvested Reinvested
Year earnings earnings Other Total earnings earnings Other Total
2002 402 .. 1 489 1 891 700 .. 0.01 7002003 754 .. 53 807 300 .. 0.01 3002004 564 .. - 157 407 150 .. 137 2872005 1 837 .. 1 460 3 297 0.01 .. 367 367
Source: UNCTAD, FDI/TNC database based on the Banque Centrale de l'Afrique de l'Ouest (BCEAO), unpublished.
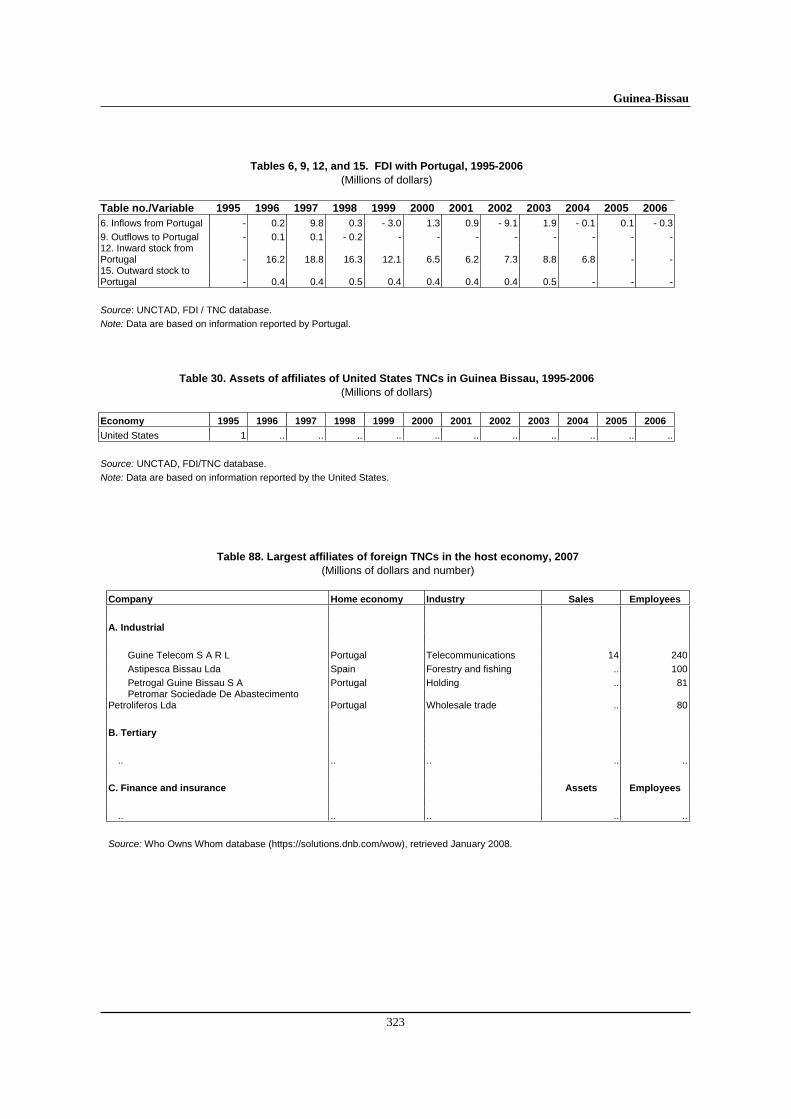
Guinea-Bissau
323
Tables 6, 9, 12, and 15. FDI with Portugal, 1995-2006
(Millions of dollars) Table no./Variable 1995 1996 1997 1998 1999 2000 2001 2002 2003 2004 2005 2006
6. Inflows from Portugal - 0.2 9.8 0.3 - 3.0 1.3 0.9 - 9.1 1.9 - 0.1 0.1 - 0.3
9. Outflows to Portugal - 0.1 0.1 - 0.2 - - - - - - - -12. Inward stock from Portugal - 16.2 18.8 16.3 12.1 6.5 6.2 7.3 8.8 6.8 - -15. Outward stock to Portugal - 0.4 0.4 0.5 0.4 0.4 0.4 0.4 0.5 - - -
Source: UNCTAD, FDI / TNC database.
Note: Data are based on information reported by Portugal.
Table 30. Assets of affiliates of United States TNCs in Guinea Bissau, 1995-2006
(Millions of dollars) Economy 1995 1996 1997 1998 1999 2000 2001 2002 2003 2004 2005 2006
United States 1 .. .. .. .. .. .. .. .. .. .. ..
Source: UNCTAD, FDI/TNC database.
Note: Data are based on information reported by the United States.
Table 88. Largest affiliates of foreign TNCs in the host economy, 2007
(Millions of dollars and number) Company Home economy Industry Sales Employees
A. Industrial
Guine Telecom S A R L Portugal Telecommunications 14 240
Astipesca Bissau Lda Spain Forestry and fishing .. 100
Petrogal Guine Bissau S A Portugal Holding .. 81Petromar Sociedade De Abastecimento
Petroliferos Lda Portugal Wholesale trade .. 80
B. Tertiary
.. .. .. .. ..
C. Finance and insurance Assets Employees
.. .. .. .. ..
Source: Who Owns Whom database (https://solutions.dnb.com/wow), retrieved January 2008.
World Investment Directory Volume X Africa 2008
324
C. Legal frameworks for transnational corporations
In Guinea-Bissau, there are a number of national, bilateral and multilateral legal instruments for regulating the activities of transnational corporations and foreign direct investors. The key ones among them are:
I. National framework
Patents: Decreto lei No. 6/96, Capitulo I, February 1997. Source: WIPO (http://www.wipo.org).
Industrial Designs: Decreto lei No. 6/96, Capitulo III, February 1997. Source: WIPO (http://www.wipo.org).
Trade Marks: Decreto lei No. 6/96, Capitulo IV, February 1997. Source: WIPO (http://www.wipo.org).
II. International Framework
A. Guinea Bissau is a party to the following multilateral and regional instruments:
Convention on the Recognition and Enforcement of Foreign Arbitral Awards of 1958, which entered into force on 7th June 1959.
Agreement for the Promotion, Protection and Guarantee of Investment Among Member States of the Organization of Islamic Conference, of I June 1981; entered into force on 23 September 1986.
Convention Establishing the Multilateral Investment Guarantee Agency of 1985, entered into force on 12 April 1988.
Fourth ACP - EEC Convention (Lome IV) of 1989, entered into force on 1st March 1990.
Articles of Agreement of the Islamic Corporation for the Insurance of Investment and Export Credit of 19 February 1992. Entered into force on 1 August 1994.
Paris Convention for the Protection of Industrial Property of 1883 (Revised at Brussels in 1900, Washington in 1911, The Hague in 1925, London in 1934, Lisbon in 1958 and Stockholm in 1967, and as amended in 1979). Signed in 1994.
Marrakesh Agreement Establishing the World Trade Organisation of 15 April 1994. Entered into force on 1 January 1995. Agreement on Trade-Related Investment Measures. General Agreement on Trade in Services. Agreement on Trade Related Aspects of Intellectual Property Rights.
Partnership Agreement between the Members of The African, Caribbean and Pacific Group of States, of the one part and the European Community and its member states, of the other part signed in Cotonou, Benin on 23 June 2000.
B. Bilateral treaties
1. Bilateral investment treaties for the protection and promotion of investments: Portugal 1991. 2. Bilateral treaties for the avoidance of double taxation: ..
Guinea-Bissau
325
D. Sources of information
Official
Banque Centrale des Etats De L'Afrique De L'Ouest (www.bceao.int).
Secondary
Collier, Paul and Anke, Hoeffler (1995). "War, peace and private portfolio", in World Development, vol. 23, no 2, pp. 233-41.
Cooper, Neil (2002). "The role of demilitarisation in promoting democracy and prosperity in Africa", Chapter 6 in Brauer and Dunne (2000).
Economist Intelligence Unit (EIU) (various years). Country Profile: Guinea-Bissau (London: EIU Ltd.).
_____________ (various years). Country Report: Guinea-Bissau (London: EIU Ltd.).
Hugh Finlay (2001). Africa on a Shoestring, 9th Edition (London: Lonely Planet Publications).
International Monetary Fund (IMF) (2006). IMF's Sub-Saharan Africa Regional Economic Outlook, March 10, 2006. (Washington D.C.: IMF).
Mbendi (2001). "Guinea-Bissau: Oil and gas industry" (Cape Town: Mbendi information for Africa).
Renato Aguilar and Mario Zejan (1991). Guinea-Bissau, a Fresh Start? (Gothengurg: Gothenburg University).
Rogoff, Keneth, S. and Reinhart, Carmen, M. (1992). Guinea-Bissau: Getting off the Track (Gothenburg University).
_____________(2002). FDI to Africa: The role of price stability and currency instability (Washington D.C.: IMF).
Soderbom, M. and F. Teal (2004). "Size and Efficiency in Africa Manufacturing firms: Evidence from Firm-Level Panel Data." Journal of Development Economics, 73. pp 369 - 394.
United Nations Conference on Development and Trade (UNCTAD) (2002). FDI in the Least Developed
Countries at a Glance (Geneva: UNCTAD/ITE/IIA/6).
____________(2005a). Investor-Disputes Arising from Investment Treaties: A Review. UNCTAD Series of International Investment Policies for Development (UNCTAD/ITE/IIT/2005/4).
____________(2005b). A Survey of Support by Investment Promotion Agencies to Linkages. Advisory Studies No. 18 (UNCTAD/ITE/IPC/2005/12).
____________(2005c). FDI in least developed countries at a glance: 2005/2006
(UNCTAD/ITE/IIA/2005/17).
United States Trade Representative (2006). 2006 Comprehensive Report on U.S. Trade and Investment
Policy Toward Sub-Saharan Africa and Implementation of the Africa Growth and Opportunity Act:
The Sixth of Eight Annual Reports, May 2006. (Washington D.C.: US Government).
World Bank (1998). Foreign direct investment spillover in developing countries (Washington D.C.: World Bank).

World Investment Directory Volume X Africa 2008
326
______________(2002). Global Development Finance 2002: Financing the poorest countries (Washington D.C.: World Bank).
World Bank/International Finance Corporation (2007). Doing Business 2008 Guinea-Bissau (Washington D.C.: The World Bank Group).
Kenya
327
Kenya
A. Definitions and sources of data
Foreign direct investment (FDI) in Kenya is defined as investment in foreign assets, such as foreign currency, credits, rights, benefits or property, undertaken by a foreign national (for example, a person who is not a Kenyan citizen) for the purpose of production of goods and services, which are to be sold either in the domestic market or exported overseas (Investment Promotion Center Act, chapter 518). The Central Bank of Kenya keeps records of FDI transactions. Until 1995, all foreign investments flowing into the country were subject to approval by the Central Bank. After this point all restrictions were removed, including exchange control. More data are collected by the Kenyan Investment Promotion Center (KIPC), established under the Investment Promotion Center Act, 1987. Information collected by the Center, however, is not complete since it is not obligatory for firms to be registered in the KIPC and some investments are undertaken unreported to the agency. Investors are welcome to contact the KIPC as a source of information on investment rules and procedures, opportunities and possible financing sources in the country.
Kenya has put in place measures to attract foreign investors. The legal framework for FDI in Kenya is provided by the Companies Ordinance (chapter 486), the Partnership Act (chapters 20 and 30) and the Foreign Investment Protection Act. The economic liberalization programme that, also, started first with the manufacturing sector was recently extended to agriculture and communication, bringing to an end the monopolies enjoyed by many companies and commodity marketing boards. Kenya has five export processing zones. The Government of Kenya owns two of them (Mombasa and Athi) and the private industry owns the remaining three (Nairobi, Della Rue and Nakuru). The zones offer considerable advantages such as a ten-year tax holiday followed by a 25% tax rate for the next ten years, exemption from import duties, exemption on value added and sales taxes and no restriction on management or technical agreement. Special incentives are given to transnational corporations that invest in lesser developed areas. The legal investment regime in Kenya provides protection and non-discrimination against foreign investors, and the investment environment is mostly based on a sound principle. For instance, in 2006, the Communications Commission of Kenya announced regulatory reform where all players in the industry are allowed to offer the entire range of telecoms services.
Kenya has increased its outreach to the global economy, signed to the Convention on the Settlement of Investment Disputes between State and Nationals of other States on 24 May 1966 and was an active participant in the work on a framework for regional co-operation that led to a treaty for the establishment of the East African Community. It is also a member of the African Union, New Partnership for Africa's Development, Common Market for Eastern and Southern Africa countries, Indian Ocean Rim Association for Regional Co-operation, the Intergovernmental Authority on Drought and Development and eligible for the United States' market access initiative for African countries - the African Growth and Opportunity Act; and the Cotonou Agreement for renegotiating the partnership links between the Africa, Caribbean and Pacific countries with the European Union, under the Lomé Convention. The country is also a member of the Multilateral Investment Guarantee Agency and the World Trade Organization.
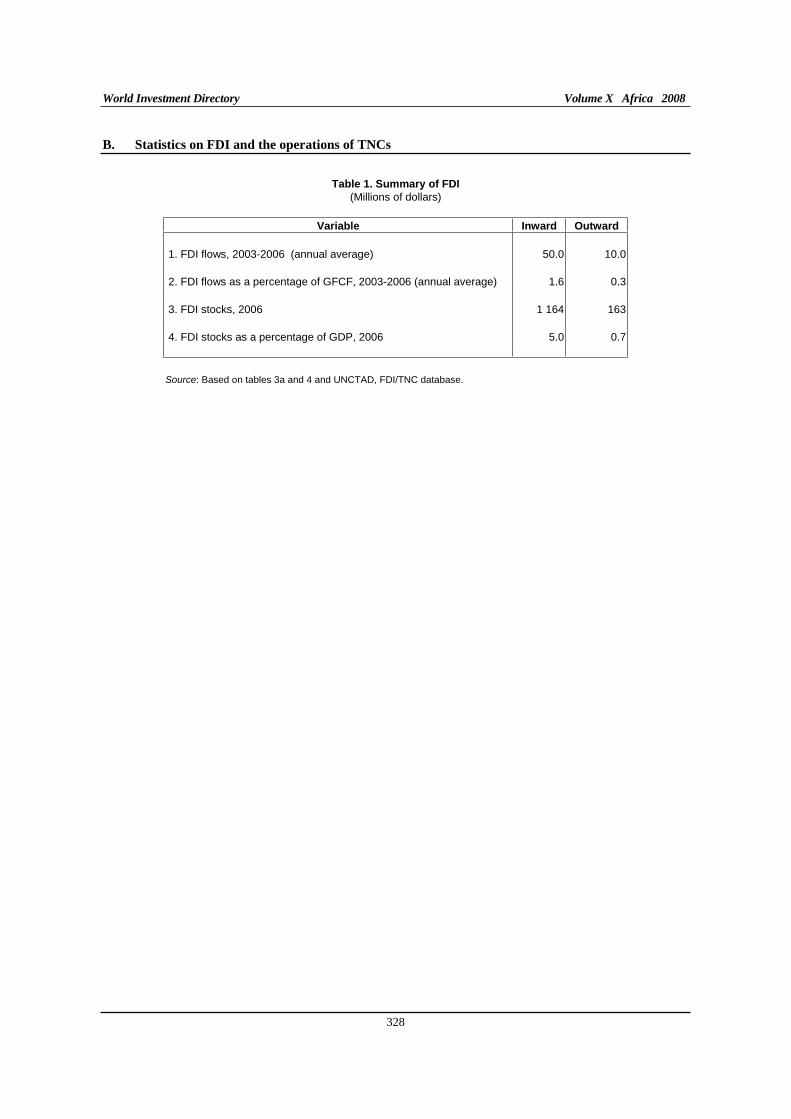
World Investment Directory Volume X Africa 2008
328
B. Statistics on FDI and the operations of TNCs
Table 1. Summary of FDI (Millions of dollars)
Variable Inward Outward
1. FDI flows, 2003-2006 (annual average) 50.0 10.0 2. FDI flows as a percentage of GFCF, 2003-2006 (annual average) 1.6 0.3 3. FDI stocks, 2006 1 164 163 4. FDI stocks as a percentage of GDP, 2006 5.0 0.7 Source: Based on tables 3a and 4 and UNCTAD, FDI/TNC database.
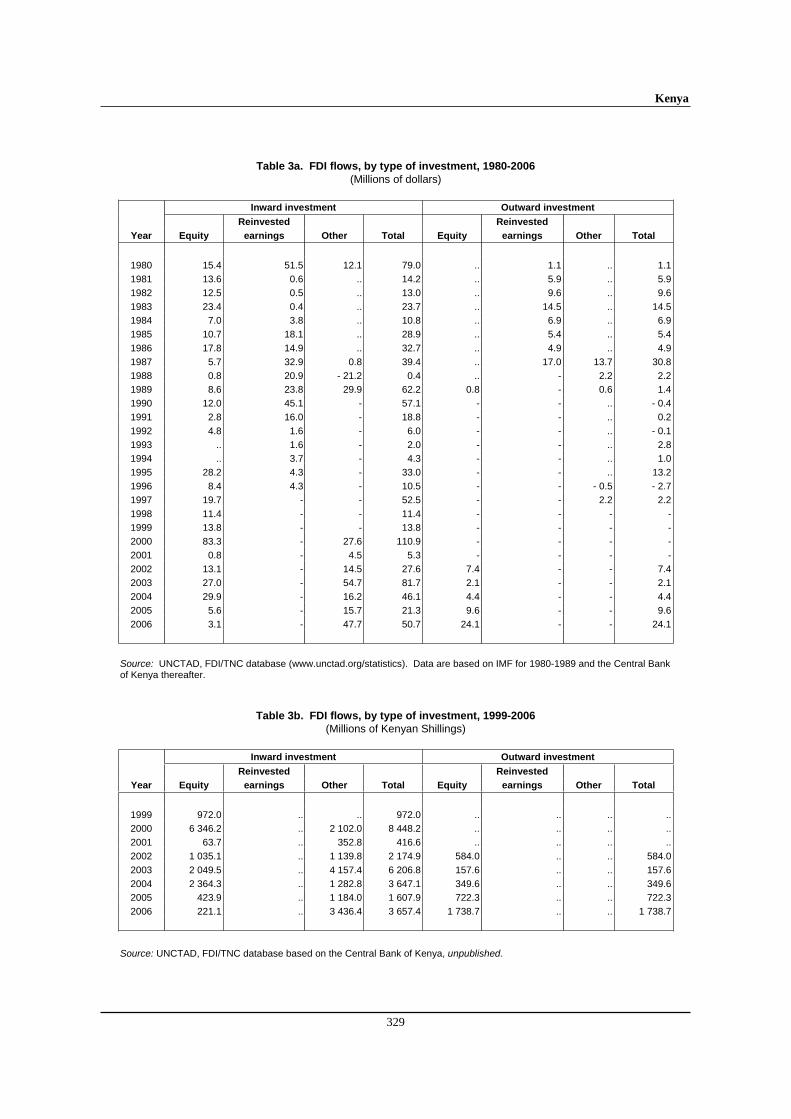
Kenya
329
Table 3a. FDI flows, by type of investment, 1980-2006 (Millions of dollars)
Inward investment Outward investment
Reinvested Reinvested
Year Equity earnings Other Total Equity earnings Other Total
1980 15.4 51.5 12.1 79.0 .. 1.1 .. 1.1
1981 13.6 0.6 .. 14.2 .. 5.9 .. 5.9
1982 12.5 0.5 .. 13.0 .. 9.6 .. 9.6
1983 23.4 0.4 .. 23.7 .. 14.5 .. 14.5
1984 7.0 3.8 .. 10.8 .. 6.9 .. 6.9
1985 10.7 18.1 .. 28.9 .. 5.4 .. 5.4
1986 17.8 14.9 .. 32.7 .. 4.9 .. 4.9
1987 5.7 32.9 0.8 39.4 .. 17.0 13.7 30.8
1988 0.8 20.9 - 21.2 0.4 .. - 2.2 2.2
1989 8.6 23.8 29.9 62.2 0.8 - 0.6 1.4
1990 12.0 45.1 - 57.1 - - .. - 0.4
1991 2.8 16.0 - 18.8 - - .. 0.2
1992 4.8 1.6 - 6.0 - - .. - 0.1
1993 .. 1.6 - 2.0 - - .. 2.8
1994 .. 3.7 - 4.3 - - .. 1.0
1995 28.2 4.3 - 33.0 - - .. 13.2
1996 8.4 4.3 - 10.5 - - - 0.5 - 2.7
1997 19.7 - - 52.5 - - 2.2 2.2
1998 11.4 - - 11.4 - - - -
1999 13.8 - - 13.8 - - - -
2000 83.3 - 27.6 110.9 - - - -
2001 0.8 - 4.5 5.3 - - - -
2002 13.1 - 14.5 27.6 7.4 - - 7.4
2003 27.0 - 54.7 81.7 2.1 - - 2.1
2004 29.9 - 16.2 46.1 4.4 - - 4.4
2005 5.6 - 15.7 21.3 9.6 - - 9.6
2006 3.1 - 47.7 50.7 24.1 - - 24.1
Source: UNCTAD, FDI/TNC database (www.unctad.org/statistics). Data are based on IMF for 1980-1989 and the Central Bank of Kenya thereafter.
Table 3b. FDI flows, by type of investment, 1999-2006 (Millions of Kenyan Shillings)
Inward investment Outward investment
Reinvested Reinvested
Year Equity earnings Other Total Equity earnings Other Total
1999 972.0 .. .. 972.0 .. .. .. ..
2000 6 346.2 .. 2 102.0 8 448.2 .. .. .. ..
2001 63.7 .. 352.8 416.6 .. .. .. ..
2002 1 035.1 .. 1 139.8 2 174.9 584.0 .. .. 584.0
2003 2 049.5 .. 4 157.4 6 206.8 157.6 .. .. 157.6
2004 2 364.3 .. 1 282.8 3 647.1 349.6 .. .. 349.6
2005 423.9 .. 1 184.0 1 607.9 722.3 .. .. 722.3
2006 221.1 .. 3 436.4 3 657.4 1 738.7 .. .. 1 738.7
Source: UNCTAD, FDI/TNC database based on the Central Bank of Kenya, unpublished.
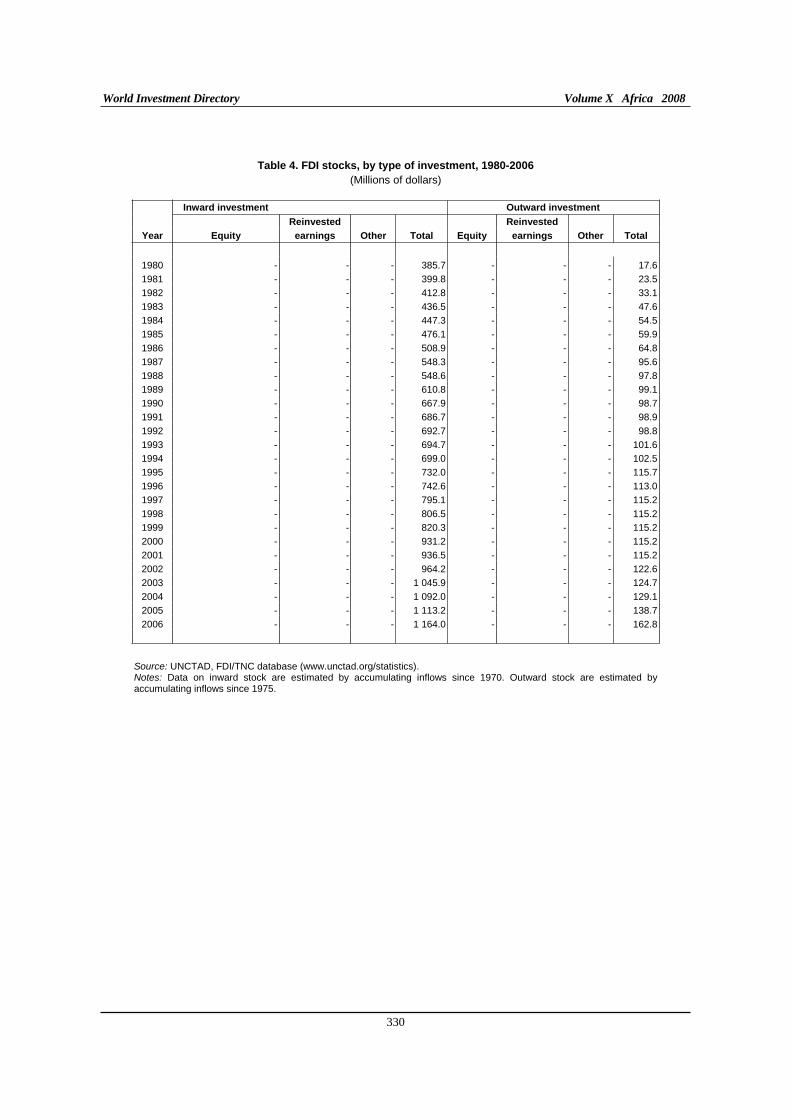
World Investment Directory Volume X Africa 2008
330
Table 4. FDI stocks, by type of investment, 1980-2006
(Millions of dollars)
Inward investment Outward investment
Reinvested Reinvested
Year Equity earnings Other Total Equity earnings Other Total
1980 - - - 385.7 - - - 17.6
1981 - - - 399.8 - - - 23.5
1982 - - - 412.8 - - - 33.1
1983 - - - 436.5 - - - 47.6
1984 - - - 447.3 - - - 54.5
1985 - - - 476.1 - - - 59.9
1986 - - - 508.9 - - - 64.8
1987 - - - 548.3 - - - 95.6
1988 - - - 548.6 - - - 97.8
1989 - - - 610.8 - - - 99.1
1990 - - - 667.9 - - - 98.7
1991 - - - 686.7 - - - 98.9
1992 - - - 692.7 - - - 98.8
1993 - - - 694.7 - - - 101.6
1994 - - - 699.0 - - - 102.5
1995 - - - 732.0 - - - 115.7
1996 - - - 742.6 - - - 113.0
1997 - - - 795.1 - - - 115.2
1998 - - - 806.5 - - - 115.2
1999 - - - 820.3 - - - 115.2
2000 - - - 931.2 - - - 115.2
2001 - - - 936.5 - - - 115.2
2002 - - - 964.2 - - - 122.6
2003 - - - 1 045.9 - - - 124.7
2004 - - - 1 092.0 - - - 129.1
2005 - - - 1 113.2 - - - 138.7
2006 - - - 1 164.0 - - - 162.8 Source: UNCTAD, FDI/TNC database (www.unctad.org/statistics). Notes: Data on inward stock are estimated by accumulating inflows since 1970. Outward stock are estimated by accumulating inflows since 1975.
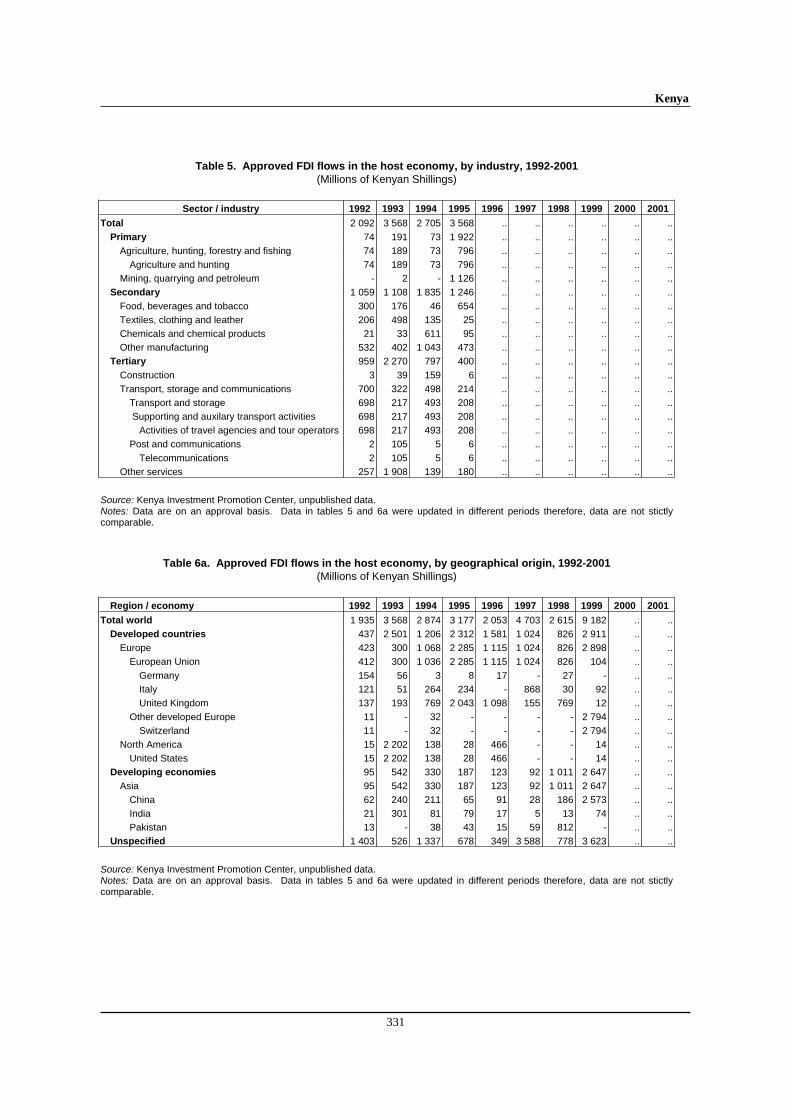
Kenya
331
Table 5. Approved FDI flows in the host economy, by industry, 1992-2001 (Millions of Kenyan Shillings)
Sector / industry 1992 1993 1994 1995 1996 1997 1998 1999 2000 2001
Total 2 092 3 568 2 705 3 568 .. .. .. .. .. ..
Primary 74 191 73 1 922 .. .. .. .. .. ..
Agriculture, hunting, forestry and fishing 74 189 73 796 .. .. .. .. .. ..
Agriculture and hunting 74 189 73 796 .. .. .. .. .. ..
Mining, quarrying and petroleum - 2 - 1 126 .. .. .. .. .. ..
Secondary 1 059 1 108 1 835 1 246 .. .. .. .. .. ..
Food, beverages and tobacco 300 176 46 654 .. .. .. .. .. ..
Textiles, clothing and leather 206 498 135 25 .. .. .. .. .. ..
Chemicals and chemical products 21 33 611 95 .. .. .. .. .. ..
Other manufacturing 532 402 1 043 473 .. .. .. .. .. ..
Tertiary 959 2 270 797 400 .. .. .. .. .. ..
Construction 3 39 159 6 .. .. .. .. .. ..
Transport, storage and communications 700 322 498 214 .. .. .. .. .. ..
Transport and storage 698 217 493 208 .. .. .. .. .. ..
Supporting and auxilary transport activities 698 217 493 208 .. .. .. .. .. ..
Activities of travel agencies and tour operators 698 217 493 208 .. .. .. .. .. ..
Post and communications 2 105 5 6 .. .. .. .. .. ..
Telecommunications 2 105 5 6 .. .. .. .. .. ..
Other services 257 1 908 139 180 .. .. .. .. .. ..
Source: Kenya Investment Promotion Center, unpublished data. Notes: Data are on an approval basis. Data in tables 5 and 6a were updated in different periods therefore, data are not stictly comparable.
Table 6a. Approved FDI flows in the host economy, by geographical origin, 1992-2001 (Millions of Kenyan Shillings)
Region / economy 1992 1993 1994 1995 1996 1997 1998 1999 2000 2001
Total world 1 935 3 568 2 874 3 177 2 053 4 703 2 615 9 182 .. ..
Developed countries 437 2 501 1 206 2 312 1 581 1 024 826 2 911 .. ..
Europe 423 300 1 068 2 285 1 115 1 024 826 2 898 .. ..
European Union 412 300 1 036 2 285 1 115 1 024 826 104 .. ..
Germany 154 56 3 8 17 - 27 - .. ..
Italy 121 51 264 234 - 868 30 92 .. ..
United Kingdom 137 193 769 2 043 1 098 155 769 12 .. ..
Other developed Europe 11 - 32 - - - - 2 794 .. ..
Switzerland 11 - 32 - - - - 2 794 .. ..
North America 15 2 202 138 28 466 - - 14 .. ..
United States 15 2 202 138 28 466 - - 14 .. ..
Developing economies 95 542 330 187 123 92 1 011 2 647 .. ..
Asia 95 542 330 187 123 92 1 011 2 647 .. ..
China 62 240 211 65 91 28 186 2 573 .. ..
India 21 301 81 79 17 5 13 74 .. ..
Pakistan 13 - 38 43 15 59 812 - .. ..
Unspecified 1 403 526 1 337 678 349 3 588 778 3 623 .. ..
Source: Kenya Investment Promotion Center, unpublished data. Notes: Data are on an approval basis. Data in tables 5 and 6a were updated in different periods therefore, data are not stictly comparable.
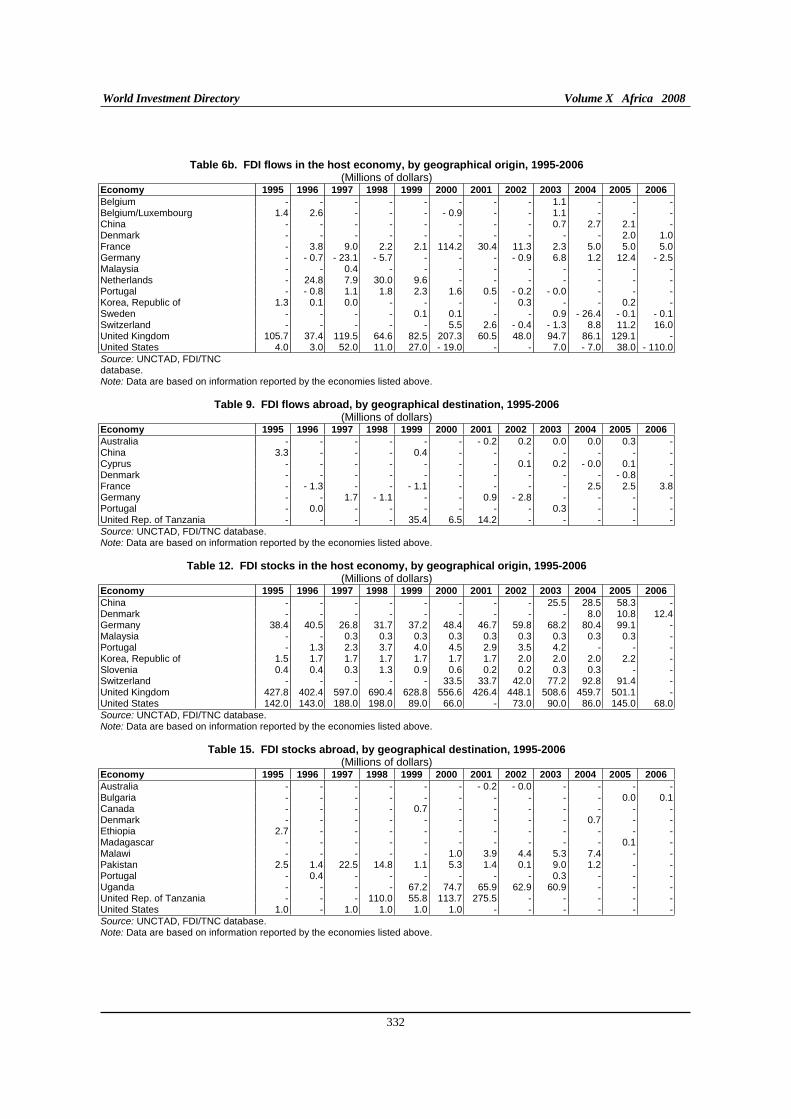
World Investment Directory Volume X Africa 2008
332
Table 6b. FDI flows in the host economy, by geographical origin, 1995-2006 (Millions of dollars)
Economy 1995 1996 1997 1998 1999 2000 2001 2002 2003 2004 2005 2006
Belgium - - - - - - - - 1.1 - - -Belgium/Luxembourg 1.4 2.6 - - - - 0.9 - - 1.1 - - -China - - - - - - - - 0.7 2.7 2.1 -Denmark - - - - - - - - - - 2.0 1.0France - 3.8 9.0 2.2 2.1 114.2 30.4 11.3 2.3 5.0 5.0 5.0Germany - - 0.7 - 23.1 - 5.7 - - - - 0.9 6.8 1.2 12.4 - 2.5Malaysia - - 0.4 - - - - - - - - -Netherlands - 24.8 7.9 30.0 9.6 - - - - - - -Portugal - - 0.8 1.1 1.8 2.3 1.6 0.5 - 0.2 - 0.0 - - -Korea, Republic of 1.3 0.1 0.0 - - - - 0.3 - - 0.2 -Sweden - - - - 0.1 0.1 - - 0.9 - 26.4 - 0.1 - 0.1Switzerland - - - - - 5.5 2.6 - 0.4 - 1.3 8.8 11.2 16.0United Kingdom 105.7 37.4 119.5 64.6 82.5 207.3 60.5 48.0 94.7 86.1 129.1 -United States 4.0 3.0 52.0 11.0 27.0 - 19.0 - - 7.0 - 7.0 38.0 - 110.0Source: UNCTAD, FDI/TNC database. Note: Data are based on information reported by the economies listed above.
Table 9. FDI flows abroad, by geographical destination, 1995-2006 (Millions of dollars)
Economy 1995 1996 1997 1998 1999 2000 2001 2002 2003 2004 2005 2006 Australia - - - - - - - 0.2 0.2 0.0 0.0 0.3 -China 3.3 - - - 0.4 - - - - - - -Cyprus - - - - - - - 0.1 0.2 - 0.0 0.1 -Denmark - - - - - - - - - - - 0.8 -France - - 1.3 - - - 1.1 - - - - 2.5 2.5 3.8Germany - - 1.7 - 1.1 - - 0.9 - 2.8 - - - -Portugal - 0.0 - - - - - - 0.3 - - -United Rep. of Tanzania - - - - 35.4 6.5 14.2 - - - - -Source: UNCTAD, FDI/TNC database. Note: Data are based on information reported by the economies listed above.
Table 12. FDI stocks in the host economy, by geographical origin, 1995-2006 (Millions of dollars)
Economy 1995 1996 1997 1998 1999 2000 2001 2002 2003 2004 2005 2006
China - - - - - - - - 25.5 28.5 58.3 -Denmark - - - - - - - - - 8.0 10.8 12.4Germany 38.4 40.5 26.8 31.7 37.2 48.4 46.7 59.8 68.2 80.4 99.1 -Malaysia - - 0.3 0.3 0.3 0.3 0.3 0.3 0.3 0.3 0.3 -Portugal - 1.3 2.3 3.7 4.0 4.5 2.9 3.5 4.2 - - -Korea, Republic of 1.5 1.7 1.7 1.7 1.7 1.7 1.7 2.0 2.0 2.0 2.2 -Slovenia 0.4 0.4 0.3 1.3 0.9 0.6 0.2 0.2 0.3 0.3 - -Switzerland - - - - - 33.5 33.7 42.0 77.2 92.8 91.4 -United Kingdom 427.8 402.4 597.0 690.4 628.8 556.6 426.4 448.1 508.6 459.7 501.1 -United States 142.0 143.0 188.0 198.0 89.0 66.0 - 73.0 90.0 86.0 145.0 68.0Source: UNCTAD, FDI/TNC database. Note: Data are based on information reported by the economies listed above.
Table 15. FDI stocks abroad, by geographical destination, 1995-2006 (Millions of dollars)
Economy 1995 1996 1997 1998 1999 2000 2001 2002 2003 2004 2005 2006 Australia - - - - - - - 0.2 - 0.0 - - - -Bulgaria - - - - - - - - - - 0.0 0.1Canada - - - - 0.7 - - - - - - -Denmark - - - - - - - - - 0.7 - -Ethiopia 2.7 - - - - - - - - - - -Madagascar - - - - - - - - - - 0.1 -Malawi - - - - - 1.0 3.9 4.4 5.3 7.4 - -Pakistan 2.5 1.4 22.5 14.8 1.1 5.3 1.4 0.1 9.0 1.2 - -Portugal - 0.4 - - - - - - 0.3 - - -Uganda - - - - 67.2 74.7 65.9 62.9 60.9 - - -United Rep. of Tanzania - - - 110.0 55.8 113.7 275.5 - - - - -United States 1.0 - 1.0 1.0 1.0 1.0 - - - - - -Source: UNCTAD, FDI/TNC database. Note: Data are based on information reported by the economies listed above.
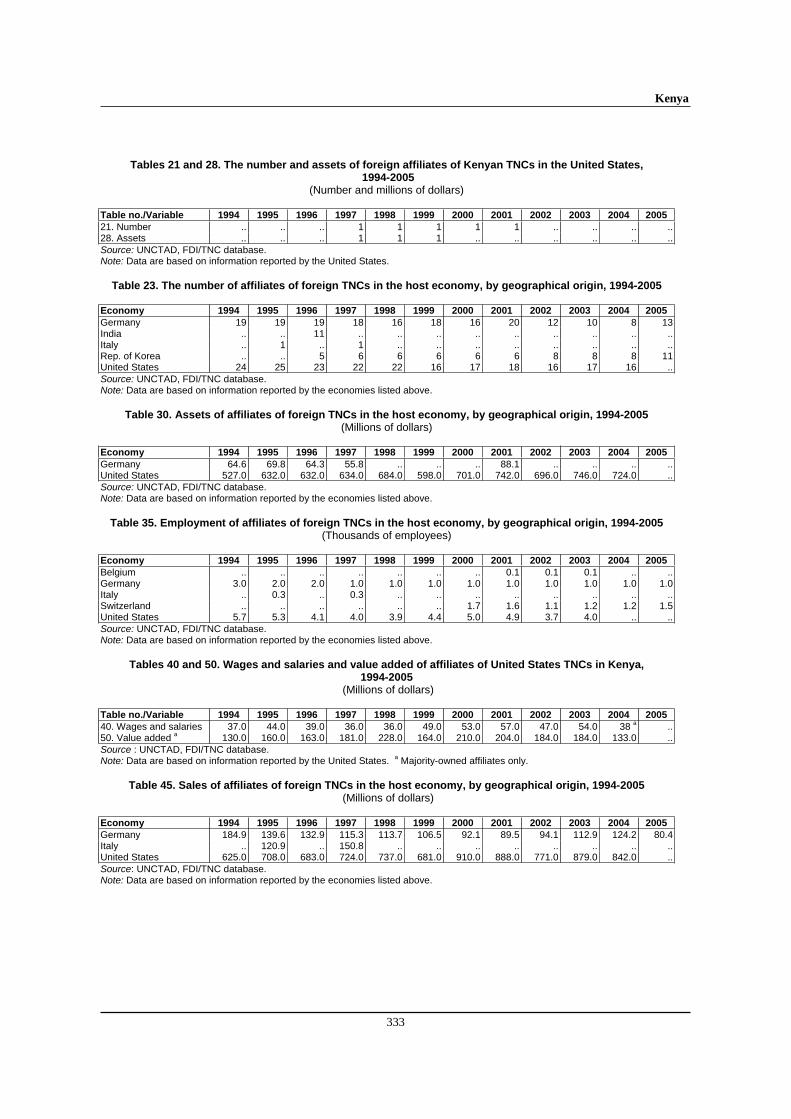
Kenya
333
Tables 21 and 28. The number and assets of foreign affiliates of Kenyan TNCs in the United States, 1994-2005
(Number and millions of dollars) Table no./Variable 1994 1995 1996 1997 1998 1999 2000 2001 2002 2003 2004 2005 21. Number .. .. .. 1 1 1 1 1 .. .. .. ..28. Assets .. .. .. 1 1 1 .. .. .. .. .. ..Source: UNCTAD, FDI/TNC database. Note: Data are based on information reported by the United States.
Table 23. The number of affiliates of foreign TNCs in the host economy, by geographical origin, 1994-2005
Economy 1994 1995 1996 1997 1998 1999 2000 2001 2002 2003 2004 2005
Germany 19 19 19 18 16 18 16 20 12 10 8 13India .. .. 11 .. .. .. .. .. .. .. .. ..Italy .. 1 .. 1 .. .. .. .. .. .. .. ..Rep. of Korea .. .. 5 6 6 6 6 6 8 8 8 11United States 24 25 23 22 22 16 17 18 16 17 16 ..Source: UNCTAD, FDI/TNC database. Note: Data are based on information reported by the economies listed above.
Table 30. Assets of affiliates of foreign TNCs in the host economy, by geographical origin, 1994-2005 (Millions of dollars)
Economy 1994 1995 1996 1997 1998 1999 2000 2001 2002 2003 2004 2005
Germany 64.6 69.8 64.3 55.8 .. .. .. 88.1 .. .. .. ..United States 527.0 632.0 632.0 634.0 684.0 598.0 701.0 742.0 696.0 746.0 724.0 ..Source: UNCTAD, FDI/TNC database. Note: Data are based on information reported by the economies listed above.
Table 35. Employment of affiliates of foreign TNCs in the host economy, by geographical origin, 1994-2005 (Thousands of employees)
Economy 1994 1995 1996 1997 1998 1999 2000 2001 2002 2003 2004 2005 Belgium .. .. .. .. .. .. .. 0.1 0.1 0.1 .. ..Germany 3.0 2.0 2.0 1.0 1.0 1.0 1.0 1.0 1.0 1.0 1.0 1.0Italy .. 0.3 .. 0.3 .. .. .. .. .. .. .. ..Switzerland .. .. .. .. .. .. 1.7 1.6 1.1 1.2 1.2 1.5United States 5.7 5.3 4.1 4.0 3.9 4.4 5.0 4.9 3.7 4.0 .. ..Source: UNCTAD, FDI/TNC database. Note: Data are based on information reported by the economies listed above.
Tables 40 and 50. Wages and salaries and value added of affiliates of United States TNCs in Kenya, 1994-2005
(Millions of dollars) Table no./Variable 1994 1995 1996 1997 1998 1999 2000 2001 2002 2003 2004 2005 40. Wages and salaries 37.0 44.0 39.0 36.0 36.0 49.0 53.0 57.0 47.0 54.0 38 a ..50. Value added a 130.0 160.0 163.0 181.0 228.0 164.0 210.0 204.0 184.0 184.0 133.0 ..Source : UNCTAD, FDI/TNC database. Note: Data are based on information reported by the United States. a Majority-owned affiliates only.
Table 45. Sales of affiliates of foreign TNCs in the host economy, by geographical origin, 1994-2005
(Millions of dollars) Economy 1994 1995 1996 1997 1998 1999 2000 2001 2002 2003 2004 2005 Germany 184.9 139.6 132.9 115.3 113.7 106.5 92.1 89.5 94.1 112.9 124.2 80.4Italy .. 120.9 .. 150.8 .. .. .. .. .. .. .. ..United States 625.0 708.0 683.0 724.0 737.0 681.0 910.0 888.0 771.0 879.0 842.0 ..Source: UNCTAD, FDI/TNC database. Note: Data are based on information reported by the economies listed above.
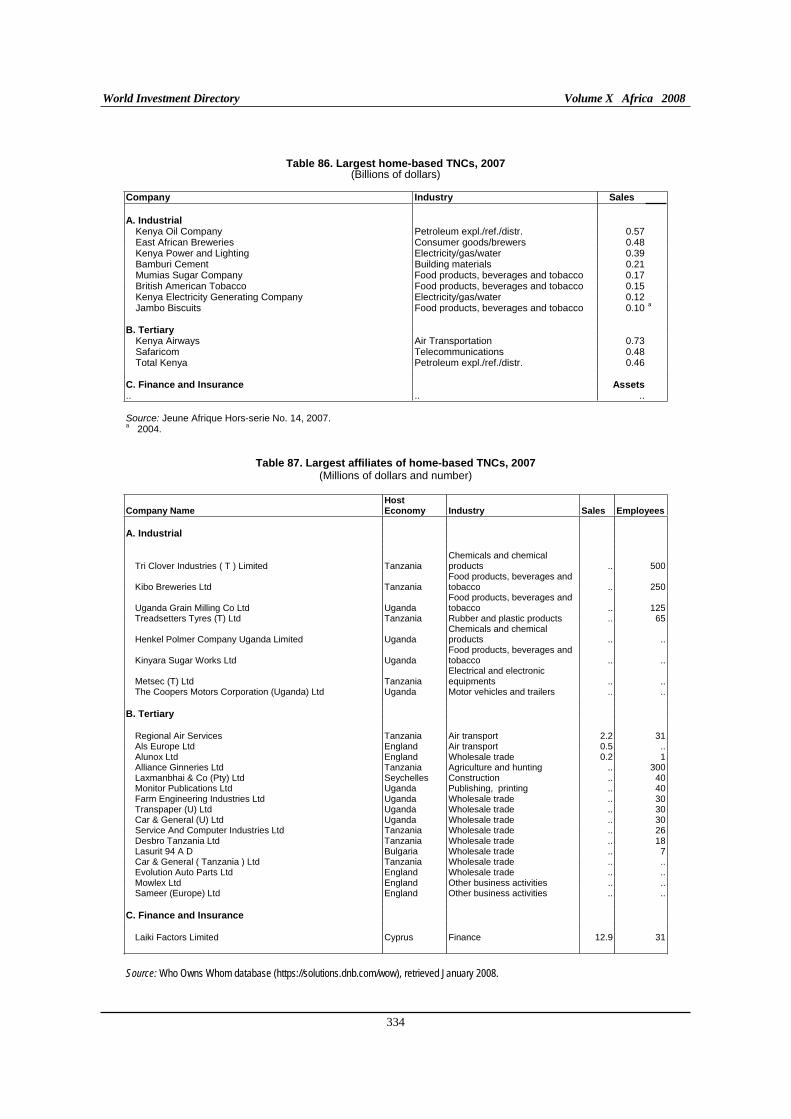
World Investment Directory Volume X Africa 2008
334
Table 86. Largest home-based TNCs, 2007 (Billions of dollars)
Company Industry Sales
A. Industrial
Kenya Oil Company Petroleum expl./ref./distr. 0.57East African Breweries Consumer goods/brewers 0.48Kenya Power and Lighting Electricity/gas/water 0.39Bamburi Cement Building materials 0.21Mumias Sugar Company Food products, beverages and tobacco 0.17British American Tobacco Food products, beverages and tobacco 0.15Kenya Electricity Generating Company Electricity/gas/water 0.12Jambo Biscuits Food products, beverages and tobacco 0.10 a
B. Tertiary
Kenya Airways Air Transportation 0.73Safaricom Telecommunications 0.48Total Kenya Petroleum expl./ref./distr. 0.46
C. Finance and Insurance Assets.. .. .. Source: Jeune Afrique Hors-serie No. 14, 2007.a 2004.
Table 87. Largest affiliates of home-based TNCs, 2007 (Millions of dollars and number)
Company Name Host Economy Industry Sales Employees
A. Industrial
Tri Clover Industries ( T ) Limited Tanzania Chemicals and chemical products .. 500
Kibo Breweries Ltd Tanzania Food products, beverages and tobacco .. 250
Uganda Grain Milling Co Ltd Uganda Food products, beverages and tobacco .. 125
Treadsetters Tyres (T) Ltd Tanzania Rubber and plastic products .. 65
Henkel Polmer Company Uganda Limited Uganda Chemicals and chemical products .. ..
Kinyara Sugar Works Ltd Uganda Food products, beverages and tobacco .. ..
Metsec (T) Ltd Tanzania Electrical and electronic equipments .. ..
The Coopers Motors Corporation (Uganda) Ltd Uganda Motor vehicles and trailers .. .. B. Tertiary
Regional Air Services Tanzania Air transport 2.2 31Als Europe Ltd England Air transport 0.5 ..Alunox Ltd England Wholesale trade 0.2 1Alliance Ginneries Ltd Tanzania Agriculture and hunting .. 300Laxmanbhai & Co (Pty) Ltd Seychelles Construction .. 40Monitor Publications Ltd Uganda Publishing, printing .. 40Farm Engineering Industries Ltd Uganda Wholesale trade .. 30Transpaper (U) Ltd Uganda Wholesale trade .. 30Car & General (U) Ltd Uganda Wholesale trade .. 30Service And Computer Industries Ltd Tanzania Wholesale trade .. 26Desbro Tanzania Ltd Tanzania Wholesale trade .. 18Lasurit 94 A D Bulgaria Wholesale trade .. 7Car & General ( Tanzania ) Ltd Tanzania Wholesale trade .. ..Evolution Auto Parts Ltd England Wholesale trade .. ..Mowlex Ltd England Other business activities .. ..Sameer (Europe) Ltd England Other business activities .. ..
C. Finance and Insurance
Laiki Factors Limited Cyprus Finance 12.9 31 Source: Who Owns Whom database (https://solutions.dnb.com/wow), retrieved January 2008.
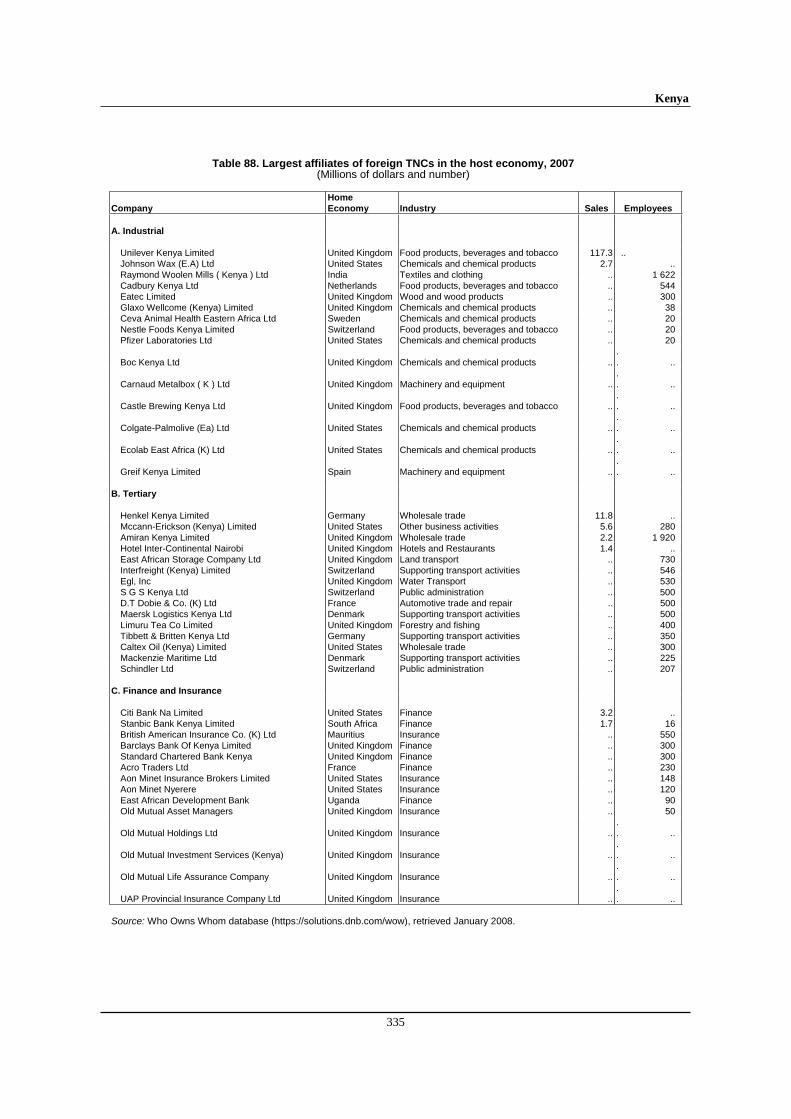
Kenya
335
Table 88. Largest affiliates of foreign TNCs in the host economy, 2007 (Millions of dollars and number)
Company Home Economy Industry Sales Employees
A. Industrial
Unilever Kenya Limited United Kingdom Food products, beverages and tobacco 117.3 .. Johnson Wax (E.A) Ltd United States Chemicals and chemical products 2.7 .. Raymond Woolen Mills ( Kenya ) Ltd India Textiles and clothing .. 1 622 Cadbury Kenya Ltd Netherlands Food products, beverages and tobacco .. 544 Eatec Limited United Kingdom Wood and wood products .. 300 Glaxo Wellcome (Kenya) Limited United Kingdom Chemicals and chemical products .. 38 Ceva Animal Health Eastern Africa Ltd Sweden Chemicals and chemical products .. 20 Nestle Foods Kenya Limited Switzerland Food products, beverages and tobacco .. 20 Pfizer Laboratories Ltd United States Chemicals and chemical products .. 20
Boc Kenya Ltd United Kingdom Chemicals and chemical products .. .. ..
Carnaud Metalbox ( K ) Ltd United Kingdom Machinery and equipment .. .. ..
Castle Brewing Kenya Ltd United Kingdom Food products, beverages and tobacco .. .. ..
Colgate-Palmolive (Ea) Ltd United States Chemicals and chemical products .. .. ..
Ecolab East Africa (K) Ltd United States Chemicals and chemical products .. .. ..
Greif Kenya Limited Spain Machinery and equipment .. .. ..
B. Tertiary
Henkel Kenya Limited Germany Wholesale trade 11.8 .. Mccann-Erickson (Kenya) Limited United States Other business activities 5.6 280 Amiran Kenya Limited United Kingdom Wholesale trade 2.2 1 920 Hotel Inter-Continental Nairobi United Kingdom Hotels and Restaurants 1.4 .. East African Storage Company Ltd United Kingdom Land transport .. 730 Interfreight (Kenya) Limited Switzerland Supporting transport activities .. 546 Egl, Inc United Kingdom Water Transport .. 530 S G S Kenya Ltd Switzerland Public administration .. 500 D.T Dobie & Co. (K) Ltd France Automotive trade and repair .. 500 Maersk Logistics Kenya Ltd Denmark Supporting transport activities .. 500 Limuru Tea Co Limited United Kingdom Forestry and fishing .. 400 Tibbett & Britten Kenya Ltd Germany Supporting transport activities .. 350 Caltex Oil (Kenya) Limited United States Wholesale trade .. 300 Mackenzie Maritime Ltd Denmark Supporting transport activities .. 225 Schindler Ltd Switzerland Public administration .. 207
C. Finance and Insurance
Citi Bank Na Limited United States Finance 3.2 ..Stanbic Bank Kenya Limited South Africa Finance 1.7 16 British American Insurance Co. (K) Ltd Mauritius Insurance .. 550 Barclays Bank Of Kenya Limited United Kingdom Finance .. 300 Standard Chartered Bank Kenya United Kingdom Finance .. 300 Acro Traders Ltd France Finance .. 230 Aon Minet Insurance Brokers Limited United States Insurance .. 148 Aon Minet Nyerere United States Insurance .. 120 East African Development Bank Uganda Finance .. 90 Old Mutual Asset Managers United Kingdom Insurance .. 50
Old Mutual Holdings Ltd United Kingdom Insurance .. .. ..
Old Mutual Investment Services (Kenya) United Kingdom Insurance .. .. ..
Old Mutual Life Assurance Company United Kingdom Insurance .. .. ..
UAP Provincial Insurance Company Ltd United Kingdom Insurance .. .. ..
Source: Who Owns Whom database (https://solutions.dnb.com/wow), retrieved January 2008.
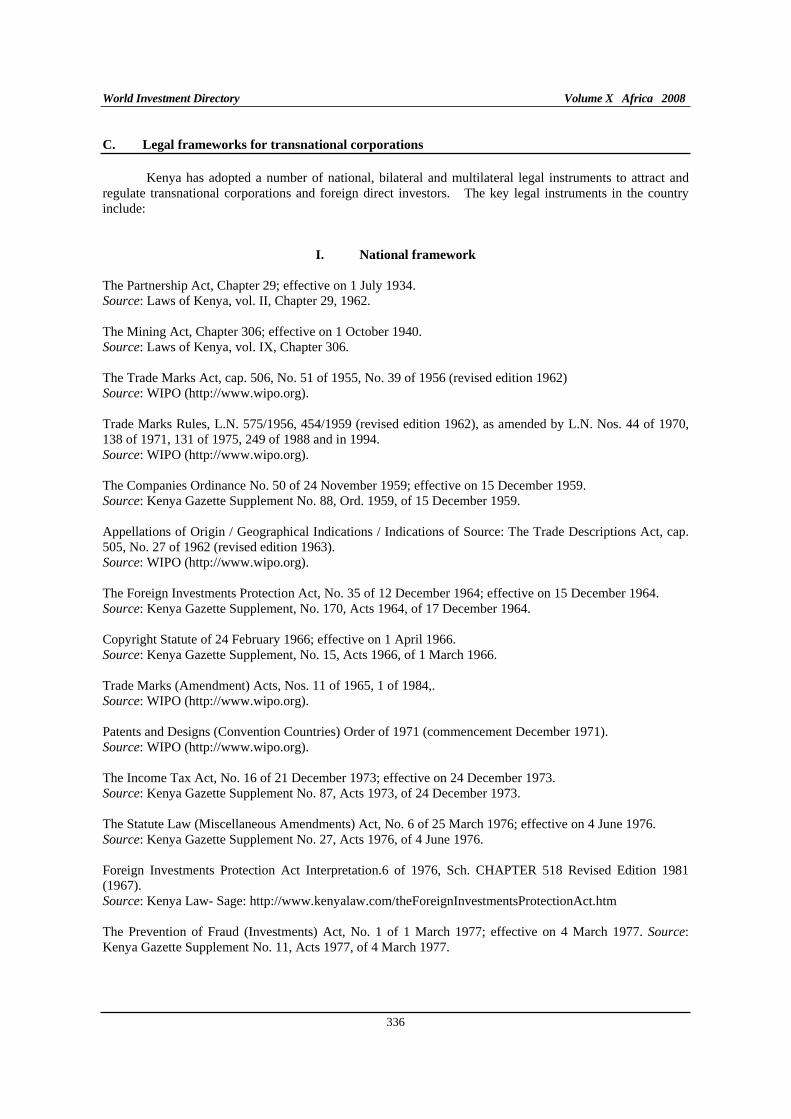
World Investment Directory Volume X Africa 2008
336
C. Legal frameworks for transnational corporations
Kenya has adopted a number of national, bilateral and multilateral legal instruments to attract and regulate transnational corporations and foreign direct investors. The key legal instruments in the country include:
I. National framework
The Partnership Act, Chapter 29; effective on 1 July 1934. Source: Laws of Kenya, vol. II, Chapter 29, 1962.
The Mining Act, Chapter 306; effective on 1 October 1940. Source: Laws of Kenya, vol. IX, Chapter 306.
The Trade Marks Act, cap. 506, No. 51 of 1955, No. 39 of 1956 (revised edition 1962) Source: WIPO (http://www.wipo.org).
Trade Marks Rules, L.N. 575/1956, 454/1959 (revised edition 1962), as amended by L.N. Nos. 44 of 1970, 138 of 1971, 131 of 1975, 249 of 1988 and in 1994. Source: WIPO (http://www.wipo.org).
The Companies Ordinance No. 50 of 24 November 1959; effective on 15 December 1959. Source: Kenya Gazette Supplement No. 88, Ord. 1959, of 15 December 1959.
Appellations of Origin / Geographical Indications / Indications of Source: The Trade Descriptions Act, cap. 505, No. 27 of 1962 (revised edition 1963). Source: WIPO (http://www.wipo.org).
The Foreign Investments Protection Act, No. 35 of 12 December 1964; effective on 15 December 1964. Source: Kenya Gazette Supplement, No. 170, Acts 1964, of 17 December 1964.
Copyright Statute of 24 February 1966; effective on 1 April 1966. Source: Kenya Gazette Supplement, No. 15, Acts 1966, of 1 March 1966.
Trade Marks (Amendment) Acts, Nos. 11 of 1965, 1 of 1984,. Source: WIPO (http://www.wipo.org).
Patents and Designs (Convention Countries) Order of 1971 (commencement December 1971). Source: WIPO (http://www.wipo.org).
The Income Tax Act, No. 16 of 21 December 1973; effective on 24 December 1973. Source: Kenya Gazette Supplement No. 87, Acts 1973, of 24 December 1973.
The Statute Law (Miscellaneous Amendments) Act, No. 6 of 25 March 1976; effective on 4 June 1976. Source: Kenya Gazette Supplement No. 27, Acts 1976, of 4 June 1976.
Foreign Investments Protection Act Interpretation.6 of 1976, Sch. CHAPTER 518 Revised Edition 1981 (1967). Source: Kenya Law- Sage: http://www.kenyalaw.com/theForeignInvestmentsProtectionAct.htm
The Prevention of Fraud (Investments) Act, No. 1 of 1 March 1977; effective on 4 March 1977. Source:Kenya Gazette Supplement No. 11, Acts 1977, of 4 March 1977.
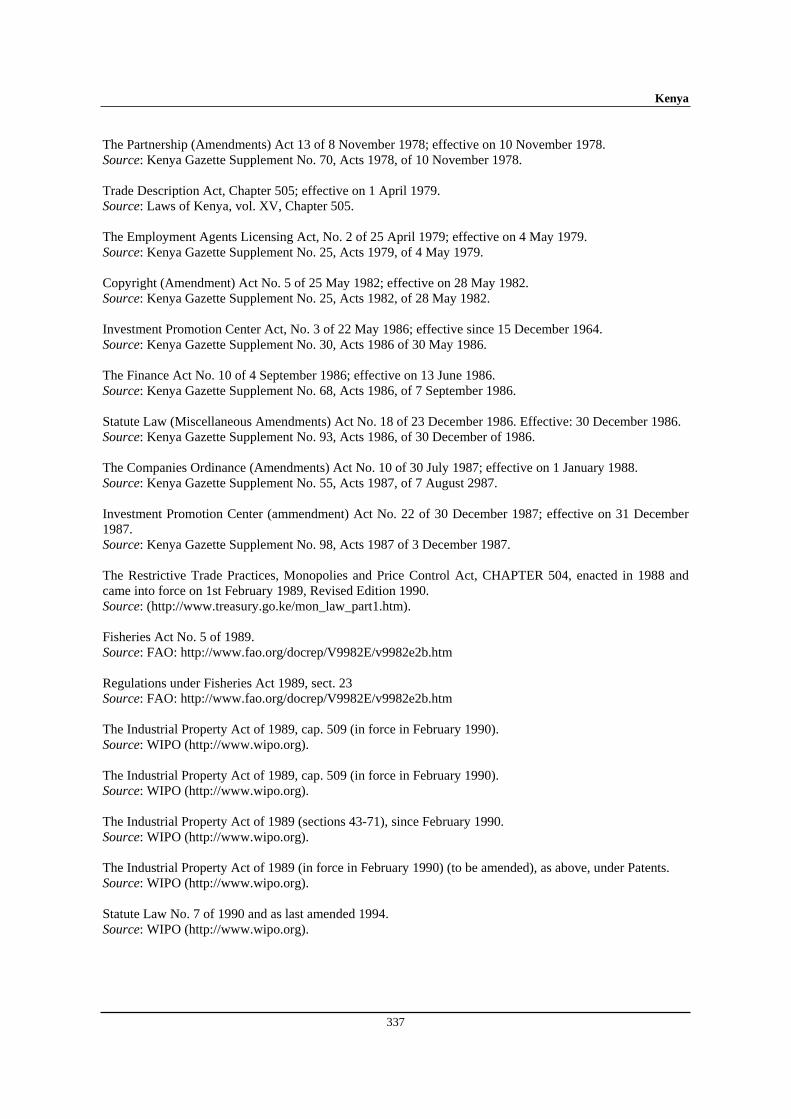
Kenya
337
The Partnership (Amendments) Act 13 of 8 November 1978; effective on 10 November 1978. Source: Kenya Gazette Supplement No. 70, Acts 1978, of 10 November 1978.
Trade Description Act, Chapter 505; effective on 1 April 1979. Source: Laws of Kenya, vol. XV, Chapter 505.
The Employment Agents Licensing Act, No. 2 of 25 April 1979; effective on 4 May 1979. Source: Kenya Gazette Supplement No. 25, Acts 1979, of 4 May 1979.
Copyright (Amendment) Act No. 5 of 25 May 1982; effective on 28 May 1982. Source: Kenya Gazette Supplement No. 25, Acts 1982, of 28 May 1982.
Investment Promotion Center Act, No. 3 of 22 May 1986; effective since 15 December 1964. Source: Kenya Gazette Supplement No. 30, Acts 1986 of 30 May 1986.
The Finance Act No. 10 of 4 September 1986; effective on 13 June 1986. Source: Kenya Gazette Supplement No. 68, Acts 1986, of 7 September 1986.
Statute Law (Miscellaneous Amendments) Act No. 18 of 23 December 1986. Effective: 30 December 1986. Source: Kenya Gazette Supplement No. 93, Acts 1986, of 30 December of 1986.
The Companies Ordinance (Amendments) Act No. 10 of 30 July 1987; effective on 1 January 1988. Source: Kenya Gazette Supplement No. 55, Acts 1987, of 7 August 2987.
Investment Promotion Center (ammendment) Act No. 22 of 30 December 1987; effective on 31 December 1987. Source: Kenya Gazette Supplement No. 98, Acts 1987 of 3 December 1987.
The Restrictive Trade Practices, Monopolies and Price Control Act, CHAPTER 504, enacted in 1988 and came into force on 1st February 1989, Revised Edition 1990. Source: (http://www.treasury.go.ke/mon_law_part1.htm).
Fisheries Act No. 5 of 1989. Source: FAO: http://www.fao.org/docrep/V9982E/v9982e2b.htm
Regulations under Fisheries Act 1989, sect. 23 Source: FAO: http://www.fao.org/docrep/V9982E/v9982e2b.htm
The Industrial Property Act of 1989, cap. 509 (in force in February 1990). Source: WIPO (http://www.wipo.org).
The Industrial Property Act of 1989, cap. 509 (in force in February 1990). Source: WIPO (http://www.wipo.org).
The Industrial Property Act of 1989 (sections 43-71), since February 1990. Source: WIPO (http://www.wipo.org).
The Industrial Property Act of 1989 (in force in February 1990) (to be amended), as above, under Patents. Source: WIPO (http://www.wipo.org).
Statute Law No. 7 of 1990 and as last amended 1994. Source: WIPO (http://www.wipo.org).
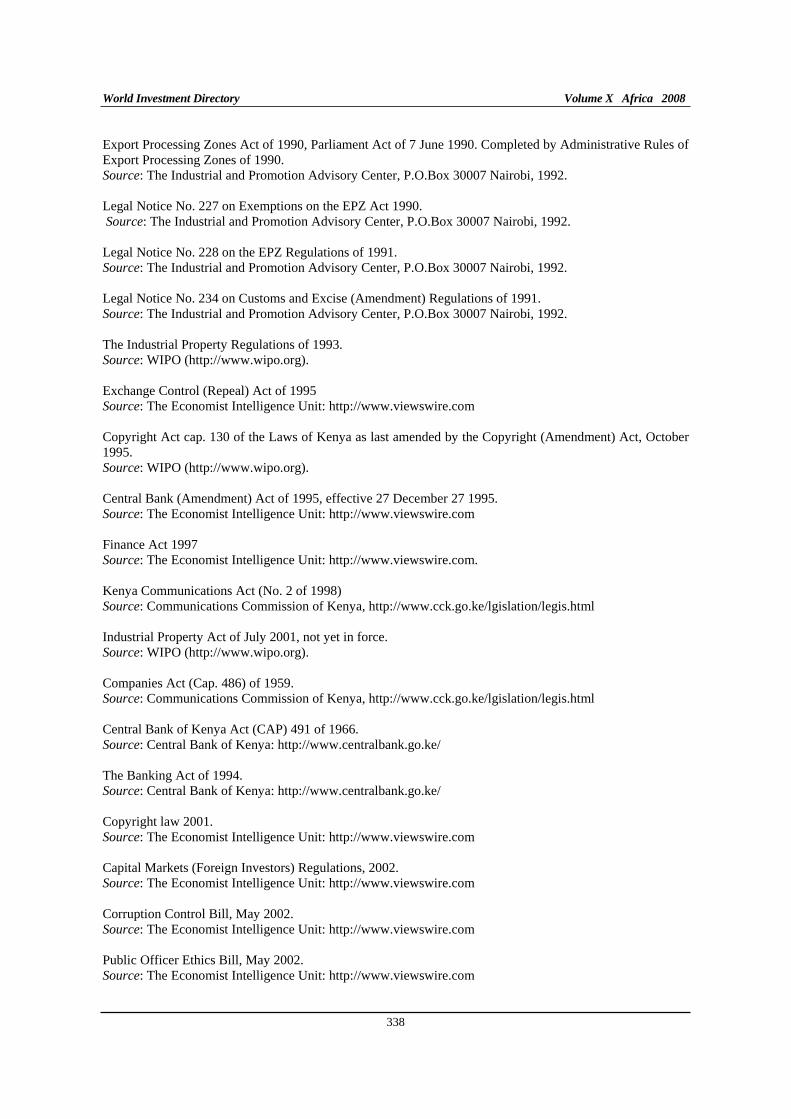
World Investment Directory Volume X Africa 2008
338
Export Processing Zones Act of 1990, Parliament Act of 7 June 1990. Completed by Administrative Rules of Export Processing Zones of 1990. Source: The Industrial and Promotion Advisory Center, P.O.Box 30007 Nairobi, 1992.
Legal Notice No. 227 on Exemptions on the EPZ Act 1990. Source: The Industrial and Promotion Advisory Center, P.O.Box 30007 Nairobi, 1992.
Legal Notice No. 228 on the EPZ Regulations of 1991. Source: The Industrial and Promotion Advisory Center, P.O.Box 30007 Nairobi, 1992.
Legal Notice No. 234 on Customs and Excise (Amendment) Regulations of 1991. Source: The Industrial and Promotion Advisory Center, P.O.Box 30007 Nairobi, 1992.
The Industrial Property Regulations of 1993. Source: WIPO (http://www.wipo.org).
Exchange Control (Repeal) Act of 1995 Source: The Economist Intelligence Unit: http://www.viewswire.com
Copyright Act cap. 130 of the Laws of Kenya as last amended by the Copyright (Amendment) Act, October 1995. Source: WIPO (http://www.wipo.org).
Central Bank (Amendment) Act of 1995, effective 27 December 27 1995. Source: The Economist Intelligence Unit: http://www.viewswire.com
Finance Act 1997 Source: The Economist Intelligence Unit: http://www.viewswire.com.
Kenya Communications Act (No. 2 of 1998) Source: Communications Commission of Kenya, http://www.cck.go.ke/lgislation/legis.html
Industrial Property Act of July 2001, not yet in force. Source: WIPO (http://www.wipo.org).
Companies Act (Cap. 486) of 1959. Source: Communications Commission of Kenya, http://www.cck.go.ke/lgislation/legis.html
Central Bank of Kenya Act (CAP) 491 of 1966. Source: Central Bank of Kenya: http://www.centralbank.go.ke/
The Banking Act of 1994.Source: Central Bank of Kenya: http://www.centralbank.go.ke/
Copyright law 2001. Source: The Economist Intelligence Unit: http://www.viewswire.com
Capital Markets (Foreign Investors) Regulations, 2002. Source: The Economist Intelligence Unit: http://www.viewswire.com
Corruption Control Bill, May 2002. Source: The Economist Intelligence Unit: http://www.viewswire.com
Public Officer Ethics Bill, May 2002. Source: The Economist Intelligence Unit: http://www.viewswire.com
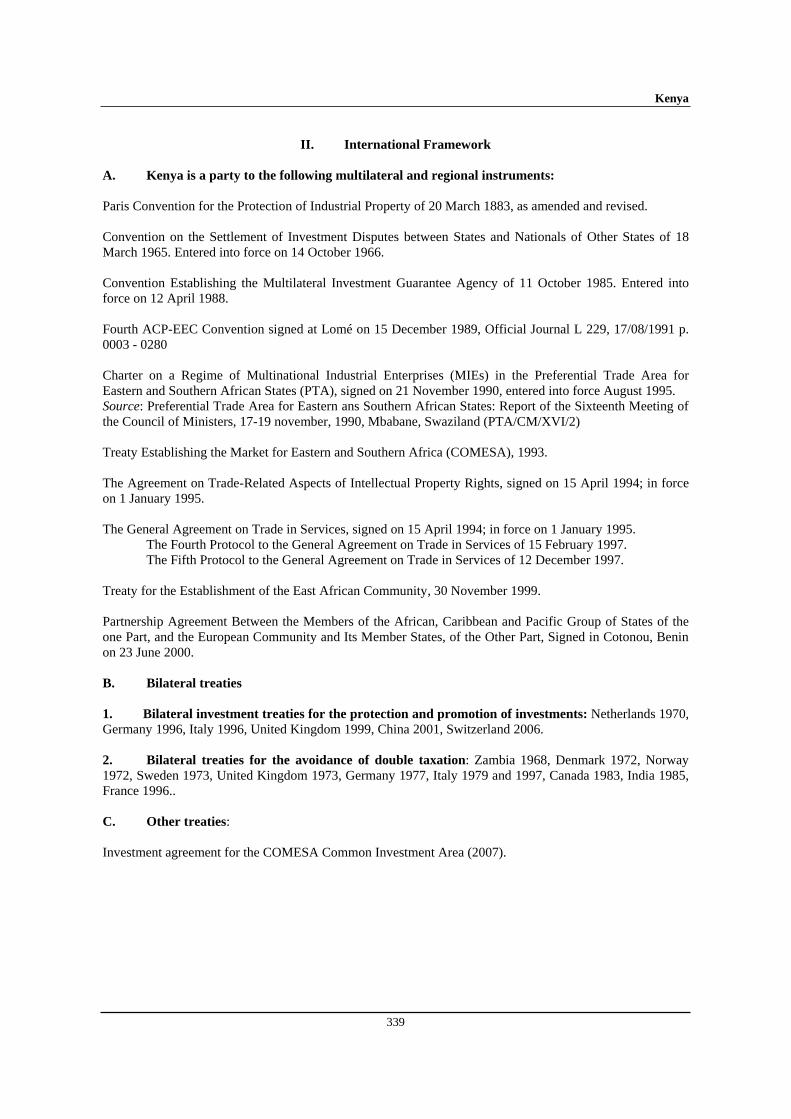
Kenya
339
II. International Framework
A. Kenya is a party to the following multilateral and regional instruments:
Paris Convention for the Protection of Industrial Property of 20 March 1883, as amended and revised.
Convention on the Settlement of Investment Disputes between States and Nationals of Other States of 18 March 1965. Entered into force on 14 October 1966.
Convention Establishing the Multilateral Investment Guarantee Agency of 11 October 1985. Entered into force on 12 April 1988.
Fourth ACP-EEC Convention signed at Lomé on 15 December 1989, Official Journal L 229, 17/08/1991 p. 0003 - 0280
Charter on a Regime of Multinational Industrial Enterprises (MIEs) in the Preferential Trade Area for Eastern and Southern African States (PTA), signed on 21 November 1990, entered into force August 1995. Source: Preferential Trade Area for Eastern ans Southern African States: Report of the Sixteenth Meeting of the Council of Ministers, 17-19 november, 1990, Mbabane, Swaziland (PTA/CM/XVI/2)
Treaty Establishing the Market for Eastern and Southern Africa (COMESA), 1993.
The Agreement on Trade-Related Aspects of Intellectual Property Rights, signed on 15 April 1994; in force on 1 January 1995.
The General Agreement on Trade in Services, signed on 15 April 1994; in force on 1 January 1995. The Fourth Protocol to the General Agreement on Trade in Services of 15 February 1997. The Fifth Protocol to the General Agreement on Trade in Services of 12 December 1997.
Treaty for the Establishment of the East African Community, 30 November 1999.
Partnership Agreement Between the Members of the African, Caribbean and Pacific Group of States of the one Part, and the European Community and Its Member States, of the Other Part, Signed in Cotonou, Benin on 23 June 2000.
B. Bilateral treaties
1. Bilateral investment treaties for the protection and promotion of investments: Netherlands 1970, Germany 1996, Italy 1996, United Kingdom 1999, China 2001, Switzerland 2006.
2. Bilateral treaties for the avoidance of double taxation: Zambia 1968, Denmark 1972, Norway 1972, Sweden 1973, United Kingdom 1973, Germany 1977, Italy 1979 and 1997, Canada 1983, India 1985, France 1996..
C. Other treaties:
Investment agreement for the COMESA Common Investment Area (2007).
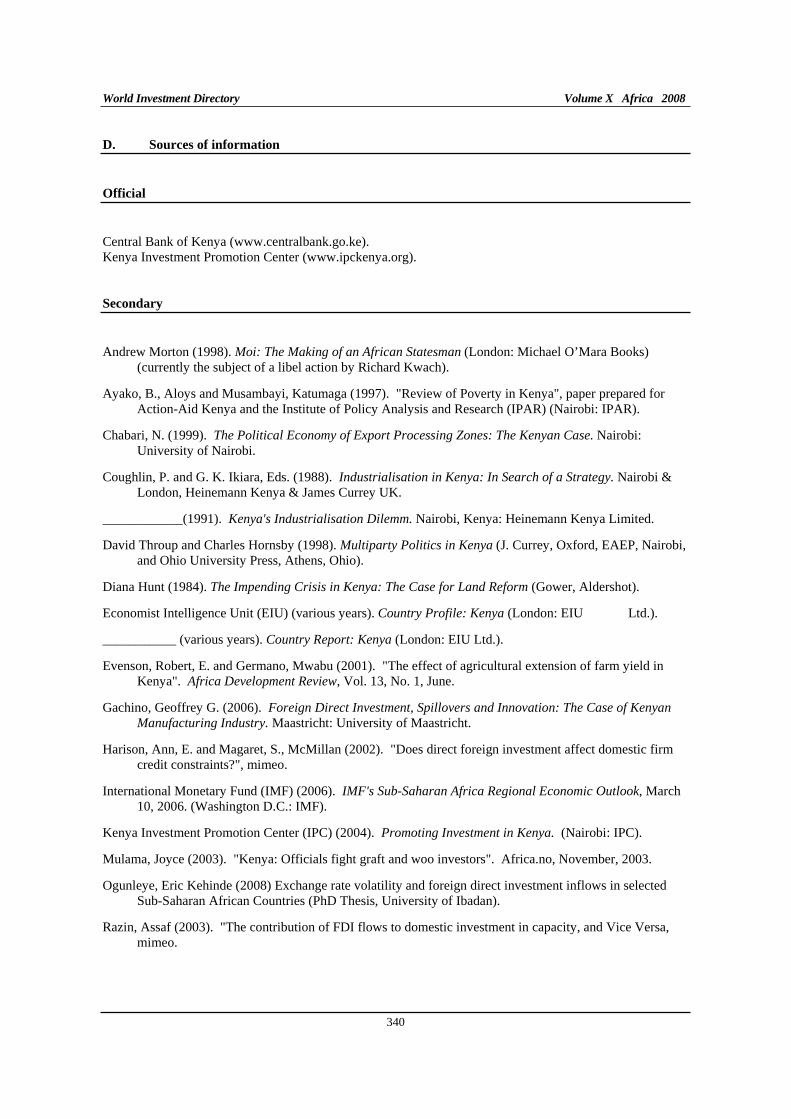
World Investment Directory Volume X Africa 2008
340
D. Sources of information
Official
Central Bank of Kenya (www.centralbank.go.ke). Kenya Investment Promotion Center (www.ipckenya.org).
Secondary
Andrew Morton (1998). Moi: The Making of an African Statesman (London: Michael O’Mara Books) (currently the subject of a libel action by Richard Kwach).
Ayako, B., Aloys and Musambayi, Katumaga (1997). "Review of Poverty in Kenya", paper prepared for Action-Aid Kenya and the Institute of Policy Analysis and Research (IPAR) (Nairobi: IPAR).
Chabari, N. (1999). The Political Economy of Export Processing Zones: The Kenyan Case. Nairobi: University of Nairobi.
Coughlin, P. and G. K. Ikiara, Eds. (1988). Industrialisation in Kenya: In Search of a Strategy. Nairobi & London, Heinemann Kenya & James Currey UK.
____________(1991). Kenya's Industrialisation Dilemm. Nairobi, Kenya: Heinemann Kenya Limited.
David Throup and Charles Hornsby (1998). Multiparty Politics in Kenya (J. Currey, Oxford, EAEP, Nairobi, and Ohio University Press, Athens, Ohio).
Diana Hunt (1984). The Impending Crisis in Kenya: The Case for Land Reform (Gower, Aldershot).
Economist Intelligence Unit (EIU) (various years). Country Profile: Kenya (London: EIU Ltd.).
___________ (various years). Country Report: Kenya (London: EIU Ltd.).
Evenson, Robert, E. and Germano, Mwabu (2001). "The effect of agricultural extension of farm yield in Kenya". Africa Development Review, Vol. 13, No. 1, June.
Gachino, Geoffrey G. (2006). Foreign Direct Investment, Spillovers and Innovation: The Case of Kenyan
Manufacturing Industry. Maastricht: University of Maastricht.
Harison, Ann, E. and Magaret, S., McMillan (2002). "Does direct foreign investment affect domestic firm credit constraints?", mimeo.
International Monetary Fund (IMF) (2006). IMF's Sub-Saharan Africa Regional Economic Outlook, March 10, 2006. (Washington D.C.: IMF).
Kenya Investment Promotion Center (IPC) (2004). Promoting Investment in Kenya. (Nairobi: IPC).
Mulama, Joyce (2003). "Kenya: Officials fight graft and woo investors". Africa.no, November, 2003.
Ogunleye, Eric Kehinde (2008) Exchange rate volatility and foreign direct investment inflows in selected Sub-Saharan African Countries (PhD Thesis, University of Ibadan).
Razin, Assaf (2003). "The contribution of FDI flows to domestic investment in capacity, and Vice Versa, mimeo.
Kenya
341
Republic of Kenya (1998). National Poverty Eradication Plan (Nairobi: Republic of Kenya).
____________(2002). National Assessment Report, prepared for the World Summit on Sustainable Development (RIO +10), Johannesburg, South Africa.
Smith Hempstone (1997). Rogue Ambassador (Sewanee, Tennessee: University of the South Press).
Soderbom, M. and F. Teal (2004). "Size and Efficiency in Africa Manufacturing firms: Evidence from Firm-Level Panel Data." Journal of Development Economics, 73. pp 369 - 394.
United Nations Conference on Trade and Development (UNCTAD) (2005a). Investor-Disputes Arising
from Investment Treaties: A Review. UNCTAD Series of International Investment Policies for Development (UNCTAD/ITE/IIT/2005/4).
__________(2005b). A Survey of Support by Investment Promotion Agencies to Linkages. Advisory Studies No. 18 (UNCTAD/ITE/IPC/2005/12).
University of Missouri-St. Louis (1993). Overseas Business Reports (Kenya) (OBR9301).
United States Commercial Service (2006). Doing Business in Kenya: A country Commercial Guide for US
Companies. (Washington D.C.: US Government).
United States Trade Representative (2006). 2006 Comprehensive Report on U.S. Trade and Investment
Policy Toward Sub-Saharan Africa and Implementation of the Africa Growth and Opportunity Act:
The Sixth of Eight Annual Reports, May 2006. (Washington D.C.: US Government).
World Bank (1995). Kenya Poverty Assessment (Washington D.C.: World Bank).
World Bank (2004). Kenya: Enhancing the Competitiveness of Kenya's Manufacturing Sector: The Role of
the Investment Climate. November, 2004.
World Bank/International Finance Corporation (2007). Doing Business 2008 Kenya (Washington D.C.: The World Bank Group).

Lesotho
343
Lesotho
A. Definitions and sources of data
The Central Bank of Lesotho is the only agency that collects data on foreign direct investment (FDI) in the country. The Central Bank defines FDI in line with the fourth edition of the balance-of-payment manuals published by the International Monetary Fund (IMF). The IMF also provides data on FDI in Lesotho in its balance-of-payment statistics.
Lesotho adheres to a strong commitment to private investment and is generally welcoming to FDI, especially in export manufacturing; labour-intensive manufacturing and import substitution activities. In 2006, the Government cut the standard rate of company tax from 35% to 25%, while the concession rate for manufacturing was cut from 15% to 10% and, provided that they held a tax clearance certificate from the Lesotho Revenue Authority, no tax would be levied on companies' exports of manufactured goods outside the Southern African Customs Union SACU. Additional sectors have been opened to FDI as steady progress is made in privatizing State-owned enterprises. Lesotho has neither foreign investment law nor foreign ownership restrictions in the sectoral licensing laws. There is no performance requirements imposed solely on foreign investors. But there are foreign investment restrictions in licensing of consumer services and in a de-facto form of FDI screening for small-scale manufacturing.
FDI entry restrictions in business and consumer services were introduced in 1999 into Lesotho's trade licensing system. Trading licenses are required for a wide range of services. FDI is not permitted in designated services that require a reserved trading license. No foreign ownership of any level or even board directorship by a non-citizen is permitted in reserved trading license businesses. All manufacturing businesses employing over 10 people or utilizing machinery of more than 25 horsepower require an industry license. Lesotho has a standard and good practice of treatment and protection of foreign investors. The country has some bilateral investment treaties (BITs). The specific standard of treatment and protection afforded to foreign investors are: national treatment, non-discrimination, funds transfer, expropriation and dispute settlement.
Lesotho signed to the Convention on the Settlement of Investment Disputes between State and Nationals of other States on 19 September 1995. Lesotho is a member of a Common Monetary Area through a trilateral Agreement with South Africa, Swaziland and recently Namibia. There are no restrictions on imports from members of SACU - Botswana, Namibia, South Africa and Swaziland. Licensing of imports from outside SACU is similar to that of the Republic of South Africa. There are no controls on exports, except for diamonds for which a license is required. Lesotho is a member of the African Union, New Partnership for Africa's Development and the Southern Africa Development Community. Lesotho is also eligible for the market access initiative for African countries by the United States - the African Growth and Opportunity Act, European Union (EU) led Everything But Arms (EBA) and the Cotonou Agreement for renegotiating the trade links between the African, Caribbean and Pacific countries with the EU. It is a member of the Multilateral Investment Guarantee Agency and the World Trade Organization.
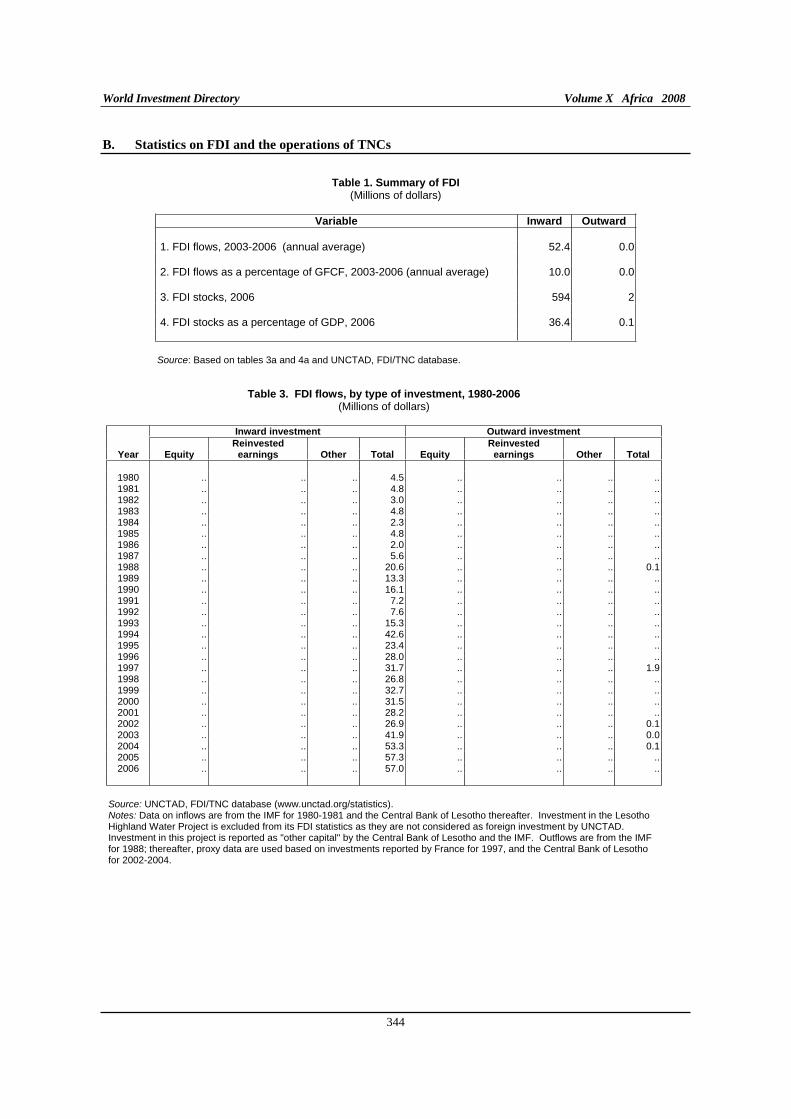
World Investment Directory Volume X Africa 2008
344
B. Statistics on FDI and the operations of TNCs
Table 1. Summary of FDI (Millions of dollars)
Variable Inward Outward
1. FDI flows, 2003-2006 (annual average) 52.4 0.0
2. FDI flows as a percentage of GFCF, 2003-2006 (annual average) 10.0 0.0
3. FDI stocks, 2006 594 2
4. FDI stocks as a percentage of GDP, 2006 36.4 0.1
Source: Based on tables 3a and 4a and UNCTAD, FDI/TNC database.
Table 3. FDI flows, by type of investment, 1980-2006 (Millions of dollars)
Inward investment Outward investment
Reinvested Reinvested Year Equity earnings Other Total Equity earnings Other Total
1980 .. .. .. 4.5 .. .. .. ..1981 .. .. .. 4.8 .. .. .. ..1982 .. .. .. 3.0 .. .. .. ..1983 .. .. .. 4.8 .. .. .. ..1984 .. .. .. 2.3 .. .. .. ..1985 .. .. .. 4.8 .. .. .. ..1986 .. .. .. 2.0 .. .. .. ..1987 .. .. .. 5.6 .. .. .. ..1988 .. .. .. 20.6 .. .. .. 0.11989 .. .. .. 13.3 .. .. .. ..1990 .. .. .. 16.1 .. .. .. ..1991 .. .. .. 7.2 .. .. .. ..1992 .. .. .. 7.6 .. .. .. ..1993 .. .. .. 15.3 .. .. .. ..1994 .. .. .. 42.6 .. .. .. ..1995 .. .. .. 23.4 .. .. .. ..1996 .. .. .. 28.0 .. .. .. ..1997 .. .. .. 31.7 .. .. .. 1.91998 .. .. .. 26.8 .. .. .. ..1999 .. .. .. 32.7 .. .. .. ..2000 .. .. .. 31.5 .. .. .. ..2001 .. .. .. 28.2 .. .. .. ..2002 .. .. .. 26.9 .. .. .. 0.12003 .. .. .. 41.9 .. .. .. 0.02004 .. .. .. 53.3 .. .. .. 0.12005 .. .. .. 57.3 .. .. .. ..2006 .. .. .. 57.0 .. .. .. ..
Source: UNCTAD, FDI/TNC database (www.unctad.org/statistics). Notes: Data on inflows are from the IMF for 1980-1981 and the Central Bank of Lesotho thereafter. Investment in the Lesotho Highland Water Project is excluded from its FDI statistics as they are not considered as foreign investment by UNCTAD. Investment in this project is reported as "other capital" by the Central Bank of Lesotho and the IMF. Outflows are from the IMFfor 1988; thereafter, proxy data are used based on investments reported by France for 1997, and the Central Bank of Lesotho for 2002-2004.
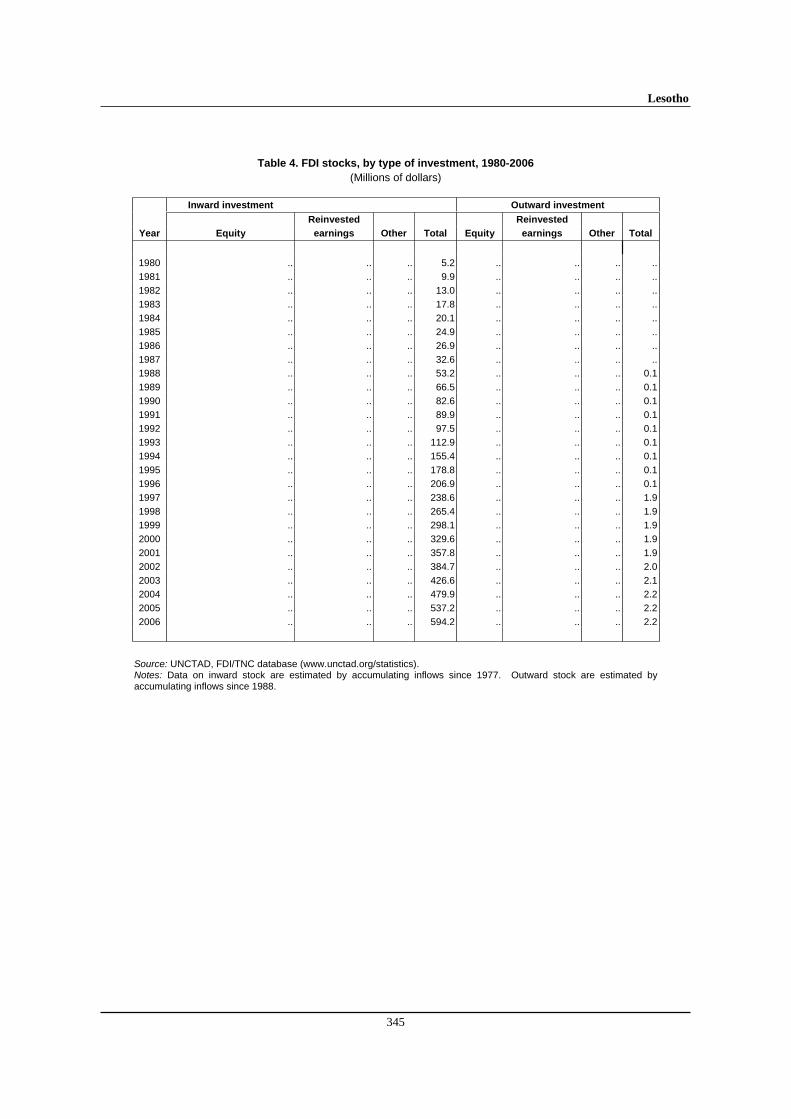
Lesotho
345
Table 4. FDI stocks, by type of investment, 1980-2006
(Millions of dollars)
Inward investment Outward investment
Reinvested Reinvested
Year Equity earnings Other Total Equity earnings Other Total
1980 .. .. .. 5.2 .. .. .. ..
1981 .. .. .. 9.9 .. .. .. ..
1982 .. .. .. 13.0 .. .. .. ..
1983 .. .. .. 17.8 .. .. .. ..
1984 .. .. .. 20.1 .. .. .. ..
1985 .. .. .. 24.9 .. .. .. ..
1986 .. .. .. 26.9 .. .. .. ..
1987 .. .. .. 32.6 .. .. .. ..
1988 .. .. .. 53.2 .. .. .. 0.1
1989 .. .. .. 66.5 .. .. .. 0.1
1990 .. .. .. 82.6 .. .. .. 0.1
1991 .. .. .. 89.9 .. .. .. 0.1
1992 .. .. .. 97.5 .. .. .. 0.1
1993 .. .. .. 112.9 .. .. .. 0.1
1994 .. .. .. 155.4 .. .. .. 0.1
1995 .. .. .. 178.8 .. .. .. 0.1
1996 .. .. .. 206.9 .. .. .. 0.1
1997 .. .. .. 238.6 .. .. .. 1.9
1998 .. .. .. 265.4 .. .. .. 1.9
1999 .. .. .. 298.1 .. .. .. 1.9
2000 .. .. .. 329.6 .. .. .. 1.9
2001 .. .. .. 357.8 .. .. .. 1.9
2002 .. .. .. 384.7 .. .. .. 2.0
2003 .. .. .. 426.6 .. .. .. 2.1
2004 .. .. .. 479.9 .. .. .. 2.2
2005 .. .. .. 537.2 .. .. .. 2.2
2006 .. .. .. 594.2 .. .. .. 2.2
Source: UNCTAD, FDI/TNC database (www.unctad.org/statistics). Notes: Data on inward stock are estimated by accumulating inflows since 1977. Outward stock are estimated by accumulating inflows since 1988.
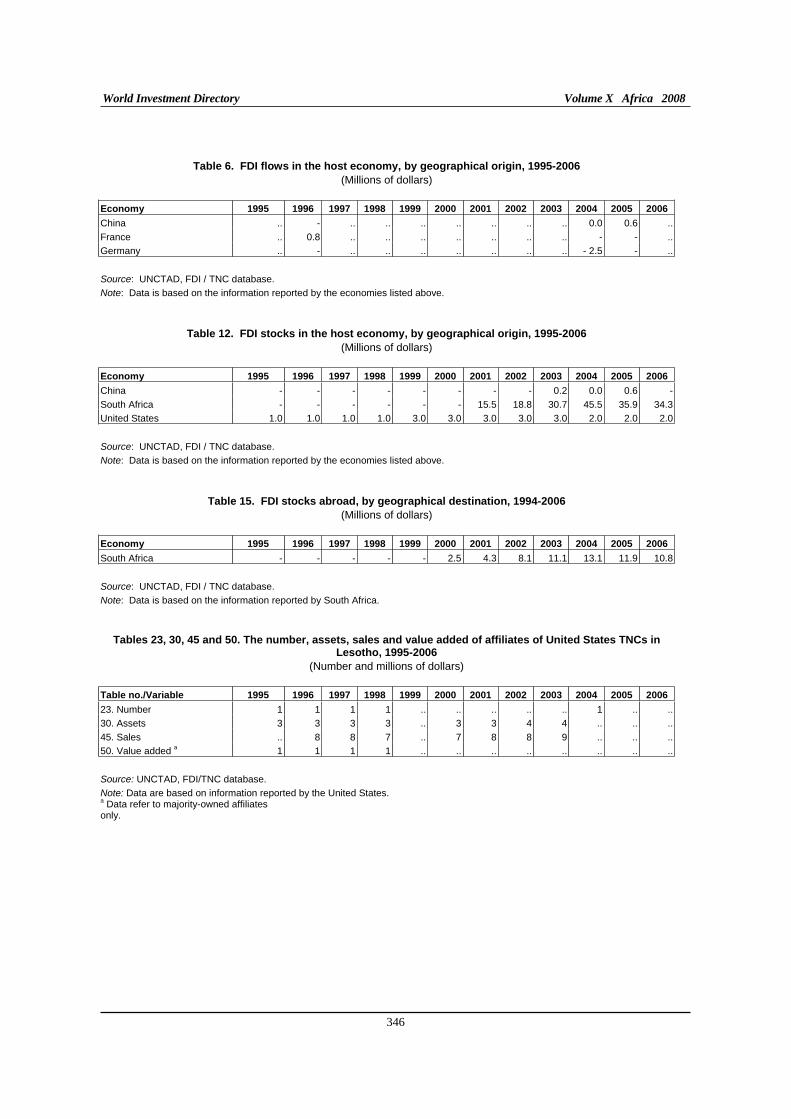
World Investment Directory Volume X Africa 2008
346
Table 6. FDI flows in the host economy, by geographical origin, 1995-2006
(Millions of dollars) Economy 1995 1996 1997 1998 1999 2000 2001 2002 2003 2004 2005 2006
China .. - .. .. .. .. .. .. .. 0.0 0.6 ..
France .. 0.8 .. .. .. .. .. .. .. - - ..
Germany .. - .. .. .. .. .. .. .. - 2.5 - ..
Source: UNCTAD, FDI / TNC database.
Note: Data is based on the information reported by the economies listed above.
Table 12. FDI stocks in the host economy, by geographical origin, 1995-2006
(Millions of dollars) Economy 1995 1996 1997 1998 1999 2000 2001 2002 2003 2004 2005 2006
China - - - - - - - - 0.2 0.0 0.6 -
South Africa - - - - - - 15.5 18.8 30.7 45.5 35.9 34.3
United States 1.0 1.0 1.0 1.0 3.0 3.0 3.0 3.0 3.0 2.0 2.0 2.0
Source: UNCTAD, FDI / TNC database.
Note: Data is based on the information reported by the economies listed above.
Table 15. FDI stocks abroad, by geographical destination, 1994-2006
(Millions of dollars) Economy 1995 1996 1997 1998 1999 2000 2001 2002 2003 2004 2005 2006
South Africa - - - - - 2.5 4.3 8.1 11.1 13.1 11.9 10.8
Source: UNCTAD, FDI / TNC database.
Note: Data is based on the information reported by South Africa.
Tables 23, 30, 45 and 50. The number, assets, sales and value added of affiliates of United States TNCs in Lesotho, 1995-2006
(Number and millions of dollars) Table no./Variable 1995 1996 1997 1998 1999 2000 2001 2002 2003 2004 2005 2006
23. Number 1 1 1 1 .. .. .. .. .. 1 .. ..
30. Assets 3 3 3 3 .. 3 3 4 4 .. .. ..
45. Sales .. 8 8 7 .. 7 8 8 9 .. .. ..
50. Value added a 1 1 1 1 .. .. .. .. .. .. .. ..
Source: UNCTAD, FDI/TNC database.
Note: Data are based on information reported by the United States. a Data refer to majority-owned affiliates only.
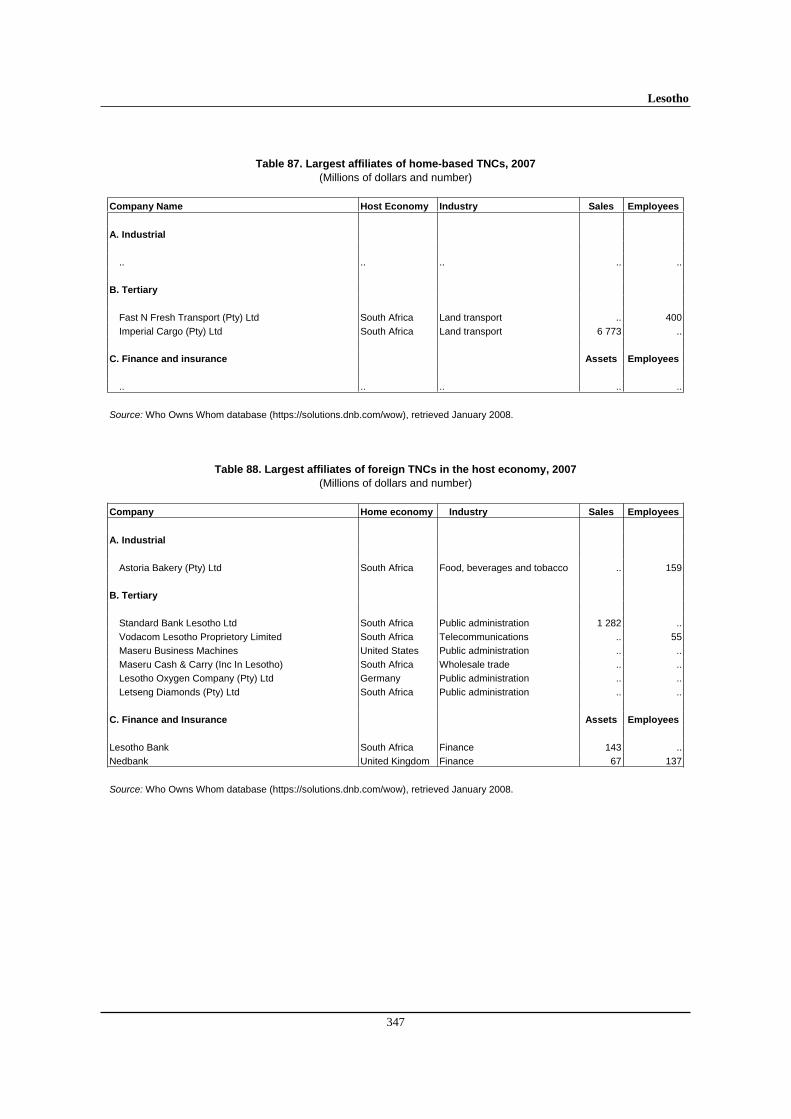
Lesotho
347
Table 87. Largest affiliates of home-based TNCs, 2007
(Millions of dollars and number) Company Name Host Economy Industry Sales Employees
A. Industrial
.. .. .. .. ..
B. Tertiary
Fast N Fresh Transport (Pty) Ltd South Africa Land transport .. 400
Imperial Cargo (Pty) Ltd South Africa Land transport 6 773 ..
C. Finance and insurance Assets Employees
.. .. .. .. ..
Source: Who Owns Whom database (https://solutions.dnb.com/wow), retrieved January 2008.
Table 88. Largest affiliates of foreign TNCs in the host economy, 2007
(Millions of dollars and number) Company Home economy Industry Sales Employees
A. Industrial
Astoria Bakery (Pty) Ltd South Africa Food, beverages and tobacco .. 159
B. Tertiary
Standard Bank Lesotho Ltd South Africa Public administration 1 282 ..
Vodacom Lesotho Proprietory Limited South Africa Telecommunications .. 55
Maseru Business Machines United States Public administration .. ..
Maseru Cash & Carry (Inc In Lesotho) South Africa Wholesale trade .. ..
Lesotho Oxygen Company (Pty) Ltd Germany Public administration .. ..
Letseng Diamonds (Pty) Ltd South Africa Public administration .. ..
C. Finance and Insurance Assets Employees
Lesotho Bank South Africa Finance 143 ..
Nedbank United Kingdom Finance 67 137
Source: Who Owns Whom database (https://solutions.dnb.com/wow), retrieved January 2008.
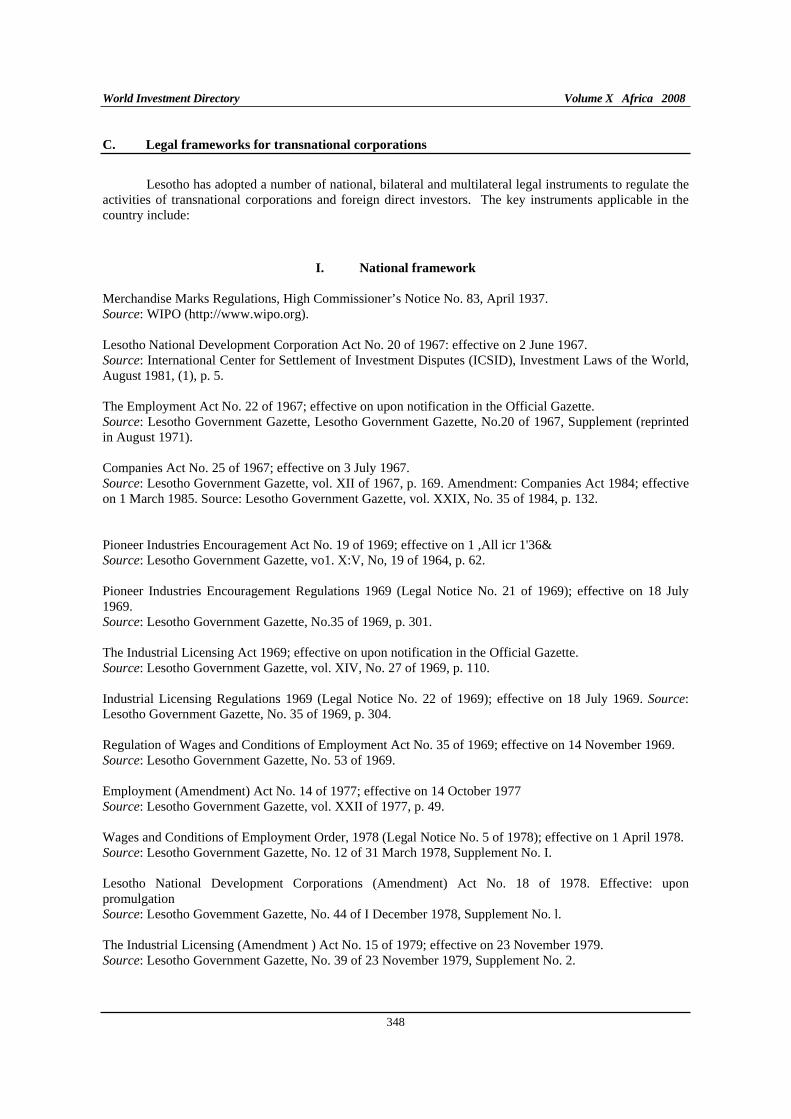
World Investment Directory Volume X Africa 2008
348
C. Legal frameworks for transnational corporations
Lesotho has adopted a number of national, bilateral and multilateral legal instruments to regulate the activities of transnational corporations and foreign direct investors. The key instruments applicable in the country include:
I. National framework
Merchandise Marks Regulations, High Commissioner’s Notice No. 83, April 1937. Source: WIPO (http://www.wipo.org).
Lesotho National Development Corporation Act No. 20 of 1967: effective on 2 June 1967. Source: International Center for Settlement of Investment Disputes (ICSID), Investment Laws of the World, August 1981, (1), p. 5.
The Employment Act No. 22 of 1967; effective on upon notification in the Official Gazette. Source: Lesotho Government Gazette, Lesotho Government Gazette, No.20 of 1967, Supplement (reprinted in August 1971).
Companies Act No. 25 of 1967; effective on 3 July 1967. Source: Lesotho Government Gazette, vol. XII of 1967, p. 169. Amendment: Companies Act 1984; effective on 1 March 1985. Source: Lesotho Government Gazette, vol. XXIX, No. 35 of 1984, p. 132.
Pioneer Industries Encouragement Act No. 19 of 1969; effective on 1 ,All icr 1'36& Source: Lesotho Government Gazette, vo1. X:V, No, 19 of 1964, p. 62.
Pioneer Industries Encouragement Regulations 1969 (Legal Notice No. 21 of 1969); effective on 18 July 1969. Source: Lesotho Government Gazette, No.35 of 1969, p. 301.
The Industrial Licensing Act 1969; effective on upon notification in the Official Gazette. Source: Lesotho Government Gazette, vol. XIV, No. 27 of 1969, p. 110.
Industrial Licensing Regulations 1969 (Legal Notice No. 22 of 1969); effective on 18 July 1969. Source:Lesotho Government Gazette, No. 35 of 1969, p. 304.
Regulation of Wages and Conditions of Employment Act No. 35 of 1969; effective on 14 November 1969. Source: Lesotho Government Gazette, No. 53 of 1969.
Employment (Amendment) Act No. 14 of 1977; effective on 14 October 1977 Source: Lesotho Government Gazette, vol. XXII of 1977, p. 49.
Wages and Conditions of Employment Order, 1978 (Legal Notice No. 5 of 1978); effective on 1 April 1978. Source: Lesotho Government Gazette, No. 12 of 31 March 1978, Supplement No. I.
Lesotho National Development Corporations (Amendment) Act No. 18 of 1978. Effective: upon promulgation Source: Lesotho Govemment Gazette, No. 44 of I December 1978, Supplement No. l.
The Industrial Licensing (Amendment ) Act No. 15 of 1979; effective on 23 November 1979. Source: Lesotho Government Gazette, No. 39 of 23 November 1979, Supplement No. 2.
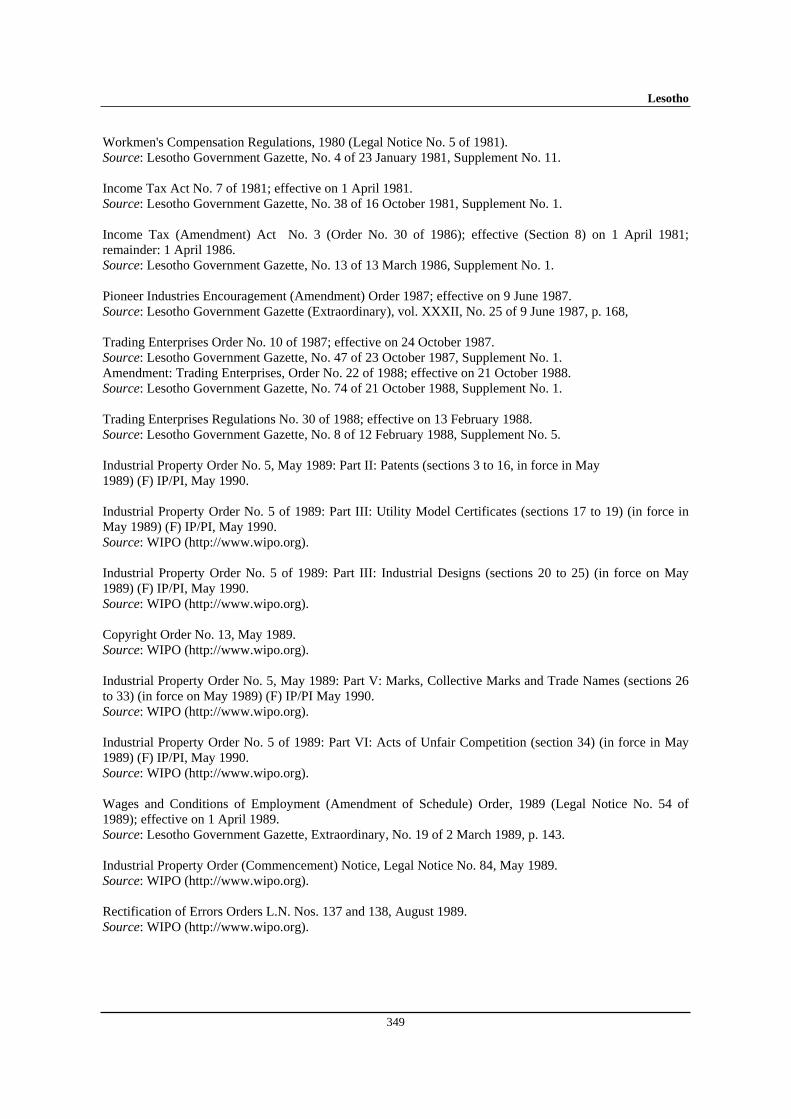
Lesotho
349
Workmen's Compensation Regulations, 1980 (Legal Notice No. 5 of 1981). Source: Lesotho Government Gazette, No. 4 of 23 January 1981, Supplement No. 11.
Income Tax Act No. 7 of 1981; effective on 1 April 1981. Source: Lesotho Government Gazette, No. 38 of 16 October 1981, Supplement No. 1.
Income Tax (Amendment) Act No. 3 (Order No. 30 of 1986); effective (Section 8) on 1 April 1981; remainder: 1 April 1986. Source: Lesotho Government Gazette, No. 13 of 13 March 1986, Supplement No. 1.
Pioneer Industries Encouragement (Amendment) Order 1987; effective on 9 June 1987. Source: Lesotho Government Gazette (Extraordinary), vol. XXXII, No. 25 of 9 June 1987, p. 168,
Trading Enterprises Order No. 10 of 1987; effective on 24 October 1987. Source: Lesotho Government Gazette, No. 47 of 23 October 1987, Supplement No. 1. Amendment: Trading Enterprises, Order No. 22 of 1988; effective on 21 October 1988. Source: Lesotho Government Gazette, No. 74 of 21 October 1988, Supplement No. 1.
Trading Enterprises Regulations No. 30 of 1988; effective on 13 February 1988. Source: Lesotho Government Gazette, No. 8 of 12 February 1988, Supplement No. 5.
Industrial Property Order No. 5, May 1989: Part II: Patents (sections 3 to 16, in force in May 1989) (F) IP/PI, May 1990.
Industrial Property Order No. 5 of 1989: Part III: Utility Model Certificates (sections 17 to 19) (in force in May 1989) (F) IP/PI, May 1990. Source: WIPO (http://www.wipo.org).
Industrial Property Order No. 5 of 1989: Part III: Industrial Designs (sections 20 to 25) (in force on May 1989) (F) IP/PI, May 1990. Source: WIPO (http://www.wipo.org).
Copyright Order No. 13, May 1989. Source: WIPO (http://www.wipo.org).
Industrial Property Order No. 5, May 1989: Part V: Marks, Collective Marks and Trade Names (sections 26 to 33) (in force on May 1989) (F) IP/PI May 1990. Source: WIPO (http://www.wipo.org).
Industrial Property Order No. 5 of 1989: Part VI: Acts of Unfair Competition (section 34) (in force in May 1989) (F) IP/PI, May 1990. Source: WIPO (http://www.wipo.org).
Wages and Conditions of Employment (Amendment of Schedule) Order, 1989 (Legal Notice No. 54 of 1989); effective on 1 April 1989. Source: Lesotho Government Gazette, Extraordinary, No. 19 of 2 March 1989, p. 143.
Industrial Property Order (Commencement) Notice, Legal Notice No. 84, May 1989. Source: WIPO (http://www.wipo.org).
Rectification of Errors Orders L.N. Nos. 137 and 138, August 1989. Source: WIPO (http://www.wipo.org).
World Investment Directory Volume X Africa 2008
350
Industrial Property Regulations, Legal Notice No. 85, May 1989(in force in January 1990) (F) IP/PI, May 1990. Source: WIPO (http://www.wipo.org).
Industrial Property Regulations (Commencement) Notice, Legal Notice No. 1, January 1990. Source: WIPO (http://www.wipo.org).
Industrial Property (Amendment) Order No. 22, April 1993. Source: WIPO (http://www.wipo.org).
Industrial Property Amendment Act of 1995. Source: WIPO (http://www.wipo.org).
Industrial Property Amendment Act 1997, June 1997, Sections 3 and 4 came into force in April 1998. Source: WIPO (http://www.wipo.org).
Monopoly extended, 2006 Source: www.eiu.com EIU Country report Main report April 2006
II. International Framework
A. Lesotho is a party to the following multilateral and regional instruments:
Convention on the Recognition and Enforcement of Foreign Arbitral Awards of 1958, which entered into force on 7th June 1959.
Convention on the Settlement of Investment Disputes between States and Nationals of other States of 1965. Entered into force on 14 October 1966
Convention Establishing the Multilateral Investment Guarantee Agency of 1985, entered into force on 12 April 1988.
Fourth ACP - EEC Convention (Lome IV) of 1989, entered into force on 1st March 1990.
Charter on a Regime of Multinational Industrial Enterprises (MIEs) in the Preferential Trade Area for Eastern and Southern African States (PTA), signed on 21 November 1990, entered into force August 1995. Source: Preferential Trade Area for Eastern ans Southern African States: Report of the Sixteenth Meeting of the Council of Ministers, 17-19 november, 1990, Mbabane, Swaziland (PTA/CM/XVI/2)
Southern Africa Development Community (SADC), signed on 17 August, 1992.Source: http://www.sadc.int/about_sadc/history.php.
Treaty Establishing the Market for Eastern and Southern Africa (COMESA), 1993.
Paris Convention for the Protection of Industrial Property of 1883 (Revised at Brussels in 1900, Washington in 1911, The Hague in 1925, London in 1934, Lisbon in 1958 and Stockholm in 1967, and as amended in 1979). Signed in 1994.
Marrakesh Agreement Establishing the World Trade Organisation of 15 April 1994. Entered into force on 1 January 1995. Agreement on Trade-Related Investment Measures. General Agreement on Trade in Services. Agreement on Trade Related Aspects of Intellectual Property Rights.
Lesotho
351
Partnership Agreement between the Members of The African, Caribbean and Pacific Group of States, of the one part and the European Community and its member states, of the other part signed in Cotonou, Benin on 23 June 2000.
B. Bilateral treaties
1. Bilateral investment treaties for the protection and promotion of investments: United Kingdom 1981, Germany 1982, Switzerland 2004.
2. Bilateral treaties for the avoidance of double taxation: South Africa 1995, Mauritius 1997, United Kingdom 1997.
World Investment Directory Volume X Africa 2008
352
D. Sources of information
Official
Central Bank of Lesotho (www.centralbank.org.ls).
Secondary
Auetragual, A. (2002). Kingdom of Lesotho: Mushroom Production (Geneva).
Economist Intelligence Unit (EIU) (various years). Country Profile: Lesotho (London: EIU Ltd.).
____________ (various years). Country Report: Lesotho (London: EIU Ltd.).
Government of Lesotho (2001). Lesotho Letter of Intent, Memorandum of Economic and Financial Policies, and Technical Memorandum of Understanding, February.
Hyvarinen, A. (2002). "The garment industry in Lesotho: International competitiveness (Geneva: International Trade Center).
International Monetary Fund (IMF) (2006). IMF's Sub-Saharan Africa Regional Economic Outlook,March 10, 2006. (Washington D.C.: IMF).
Lall, Sanjaya (2003). "FDI, AGOA and manufactured exports from a land-locked, least developed African economy: Lesotho", QEH Working paper series – QEHWPS109.
Mapetla, E and Rembe, S. (1989). Decentralisation and Development in Lesotho (Maseru: National University of Lesotho).
Multilateral Investment Guarantee Agency (MIGA) (1999). "Report of mission to Lesotho on Investment Promotion Unit", draft (Washington D.C.: MIGA).
Salm, A., W.J. Grant, T. J. Green, J. R. Haycock and J. Raimondo (2002). Lesotho garment industry
subsector study for the development of Lesotho (London: UK Department of International Development), January.
Schwab, K. et al. (2000). The Africa competitiveness Report 2000/2001 (Oxford: Oxford University Press for the World Economic Forum).
Sechaba Consultants (2000). Poverty and Livelihoods in Lesotho (Sechaba: Maseru).
Soderbom, M. and F. Teal (2004). "Size and Efficiency in Africa Manufacturing firms: Evidence from Firm-Level Panel Data." Journal of Development Economics, 73. pp 369 - 394.
Tan, H. W. and Batra, G. (1995). Enterprise training in developing countries: Incidence, productivity effects, and policy implications (Washington D.C.: World Bank, Private Sector Development Department).
United Nations Conference on Development and Trade (UNCTAD) (2002). FDI in the Least
Developed Countries at a Glance (Geneva: UNCTAD/ITE/IIA/6).
___________(2003). Investment Policy Review: Lesotho (Geneva: UNCTAD/ITE/IPC/MISC.25/Corr. 1).
Lesotho
353
____________(2005a). Investor-Disputes Arising from Investment Treaties: A Review. UNCTAD Series of International Investment Policies for Development (UNCTAD/ITE/IIT/2005/4).
____________(2005b). A Survey of Support by Investment Promotion Agencies to Linkages. Advisory Studies No. 18 (UNCTAD/ITE/IPC/2005/12).
____________(2005c). FDI in least developed countries at a glance: 2005/2006
(UNCTAD/ITE/IIA/2005/17).
United States Trade Representative (2006). 2006 Comprehensive Report on U.S. Trade and Investment
Policy Toward Sub-Saharan Africa and Implementation of the Africa Growth and Opportunity
Act: The Sixth of Eight Annual Reports, May 2006. (Washington D.C.: US Government).
World Bank (2002). Lesotho Integrated Framework: Diagnostic trade integration study (Washington D.C.: World Bank).
World Bank/International Finance Corporation (2007). Doing Business 2008 Lesotho (Washington D.C.: The World Bank Group).
World Trade Organization (WTO) (1998). "Trade-Related Technical Assistance Needs-Assessment presented by Lesotho", integrated responses by IMF, ITC, UNCTAD, UNDP, World Bank and WTO (Geneva: WTO/COMTD/IF/21, committee on Trade and Development, integrated framework for Trade-Related Technical Assistance) February.
____________(2002). "Tariff analysis of Lesotho under the Southern African Customs Union", background paper for Lesotho Diagnostic Integrated Framework Study (Geneva: WTO), May.