Embed Size (px)
Citation preview
1
World Energy Resources Geothermal | 2016

TITLE OF DOCUMENT
1
TABLE OF CONTENTS
KEY FINDINGS 2
INTRODUCTION 3
Resource potential 3
Types of geothermal resources 3
Size distribution of developed geothermal resources 5
History of geothermal use 6
Global status in 2015 8
1. TECHNOLOGIES 15 Power generation technology and performance 15
Steamfield technology 17
Advances in reservoir technology 18
Direct use technologies 19
Ground source geoexchange technology 20
2. ECONOMICS & MARKETS 22 Owner-operators 22
Investment 24
Comparative cost economics 25
3. SOCIO-ECONOMICS 28 Government incentives 28
Land access and use 29
Utility paradigm shift 29
4. ENVIRONMENTAL IMPACTS 31 Greenhouse gas emissions from geothermal plants 33
Sustainability 34
5. OUTLOOK 36
6. GLOBAL TABLE 42
List of Figures and Tables 48
References 49
Acknowledgements 52

Global geothermal power
capacity expected to double
and grow by 12.5 GW
Japan announces $10 bn African Infrastructure Plan and
support for geothermal
European investors propose $445m geothermal project in Argentina
European-Mexican research project
exploring ultra-deep geothermal resources
El Salvador plans 40% of energy to come from geothermal by 2020
Geothermal energy giving Iceland lowest heating costs
in the Nordics
Feed-in-tariffs possible option for geothermal development in Philippines
India sets ambitious target for
geothermal development by 2030
Geothermal
New drilling technology could
drive advances in America’s
geothermal energy industry
2017 starts with new record
for geothermal energy
production in Tuscany

WORLD ENERGY COUNCIL | WORLD ENERGY RESOURCES 2016
2
KEY FINDINGS
1. Geothermal energy contributes a tiny proportion of the world’s primary energy
consumption. Even in electricity generation, geothermal produces less than 1% of the
world’s output.
2. There were 315 MW of new geothermal power capacity installed in 2015, raising the
total capacity to 13.2 GW.
3. Turkey accounted for half of the new global capacity additions, followed by the United
States, Mexico, Kenya, Japan and Germany.
4. In terms of direct use of geothermal heat, the countries with the largest utilisation that
accounted for roughly 70% of direct geothermal in 2015 are China, Turkey, Iceland,
Japan, Hungary, USA and New Zealand.
5. In 2015, total power output totalled 75 TWh, the same number being also valid for total
heat output from geothermal energy (excluding ground heat pumps).
6. World geothermal heat use (direct & storage) reached 563 PJs in 2014.
7. Global investment in 2015 was US$2 billion, a 23% setback from 2014. During the
period 2010-2014, around US$20 billion were invested in geothermal energy by 49
countries for both direct use and electric power.
8. The pace of geothermal development has been conditioned by legal frameworks and
particularly by conservation legislation. However, the pace of development might
accelerate due to climate change concerns and increasing need to decarbonise the
energy sector.
9. Geothermal energy currently finds itself burdened by a higher installed costs and
longer development periods relative to solar and wind. As a result, in many countries,
geothermal energy projects have been and are reliant on government incentives to
compete against both natural gas and other renewable generation.

WORLD ENERGY COUNCIL | GEOTHERMAL
3
INTRODUCTION
Geothermal energy refers to the use of heat energy or thermal properties within the earth.
The earth’s heat engine is driven by cooling of the crust and heating of the lower crust and
mantle by thermal decay of radioactive isotopes. So, the deeper beneath the surface, the
hotter the temperature is. Over most of the earth, the rate of temperature increase with
depth is too low to provide sufficient energy to undertake useful work. However, some
parts of the crust have abnormally high heat flow and these can provide heat energy at
depths that can be economically exploited.
This review summarises the current use of geothermal energy around the world and
prospects for further growth in the near future. With international concerns regarding air
quality, water quality, and greenhouse gas emissions, policy analysts and planners are
increasingly recognising the potential of geothermal energy to displace fossil fuels and help
meet clean air and decarbonisation obligations.
RESOURCE POTENTIAL The earth’s natural heat reserves are immense. EPRI (1978) estimated the stored thermal
energy down to 3 km within continental crust to be roughly 43 x106 EJ. This is considerably
greater than the world’s total primary energy consumption of 560 EJ in 20121. Estimates by
Bertani (2003), Stefansson (2005) and Tester et al (2005) of the accessible electrical
potential range from 35 to 200 GW. This is 16 times the current installed generation
capacity.
Although geothermal resources emit low levels of greenhouse gases, international energy
agencies classify geothermal energy as renewable because energy is continuously
restored by the upwards flow of heat from the earth’s interior. While in detail, the rate of
heat extraction may, for a period, exceed the rate of recovery, direct experience (Larderello
geothermal field has operated continually since 1946) and reservoir modelling
demonstrates that some geothermal systems can supply power for over a century without
fatally disrupting the heat flow that sustains them.
TYPES OF GEOTHERMAL RESOURCES Over most of the earth, the heat flow rising from the mantle through the crust is insufficient
to create reservoirs of extractible heat close enough to the surface to be economic. The
average geothermal gradient is 30oC per km2. In thick crust, the gradient can be as low as
16oC/km3. In thin crust, the regional gradient can exceed 90oC/km4. Geothermal resources
are therefore anomalous features arising from localised high heat flows from shallow 1 EIA 2 Grant and Bixley (2011) 3 Lund and Zoback (1998) 4 Saemundsson (2007)

WORLD ENERGY COUNCIL | WORLD ENERGY RESOURCES 2016
4
intrusive bodies combined with the ability of surrounding rocks to transmit fluids
(permeability).
Geothermal resources provide both heat and heat storage over a wide spectrum of
conditions. While these resources are complex and diverse, they can be classified based
on their temperature and heat flow mechanisms.
Temperature is the most fundamental measure of energy available for work. While differing
in detail, the industry recognises three grades of extractive geothermal energy: high
temperature (> 180oC), intermediate temperature (101 to 180oC) and low temperature
(30 to 100oC).
Geothermal resources can be further classified based on the mechanisms that control the
movement and concentration of heat as well as their common geologic settlings. The two
main heating mechanisms, convection and conduction really comprise end members in a
heat transfer spectrum. Elements of each are present in many geothermal resources.
Convective hydrothermal systems represent zones where the Earth’s heat rises towards
the surface predominately by the convective circulation of buoyant, naturally occurring
liquids or steam. The heat source driving convection is the presence of magma within the
crust or high heat flow from the mantle surging through thinned crust.
Most of the world’s high temperature geothermal fields are convective hydrothermal
systems with a magmatic heat source. These igneous systems include the vapour (steam)
dominated fields such as Kamojang (IDA) and Larderello (ITA) as well as the liquid
dominated reservoirs prevalent in New Zealand, Iceland, Kenya, the Philippines, and
Japan. Typically, these systems contain high temperatures.
Hydrothermal convection may also occur within tensional faults associated with high rates
of crustal extension (fault-hosted systems). These resources have predominately
intermediate temperatures and comprise the geothermal systems of the Basin-and-Range
(USA) and Western Anatolia (TUR).
Conductive geothermal systems arise where relatively high heat flow and insulation
combine to create anomalously hot rock. In some cases, the normal conductive heat flow
is boosted by radioactive decay and trapped by insulating sedimentary layers (Hot
Crystalline Rock). In other configurations (Hot Aquifers), conductive heat may be
transferred to circulating ground water creating artesian warm springs such as Bath (GBR)
or regional aquifers such as the Malm Limestone (DEU). In rapidly subsiding sedimentary
basins, over-pressured mudstones caused by rapid sedimentation may create thermal
blankets that trap conductive heat in strata (Geopressured Aquifers) such as the East Java
(Porong) sub-basin.

WORLD ENERGY COUNCIL | GEOTHERMAL
5
The vast majority of conductive geothermal resources have low to intermediate
temperatures. However, deep exploration wells at Habanero (AUS) and Luttlelgeest (NLD)
have encountered temperatures and fluids exceeding 200oC at 4,000 metres depth. While
these resources are not yet economic, they do illustrate the vast potential of deep
resources.
Over the past 30 years, the geothermal industry has attempted to both improve the
productivity of conventional geothermal fields and exploit new (unconventional) resources
by developing techniques that improve the permeability of hot rocks. For convenience, this
report will refer to such endeavours as engineered geothermal systems (EGS). Although
much of the work to date has focused on recovering heat from impermeable hot rock, the
techniques can be applied to conventional fields as well.
SIZE DISTRIBUTION OF DEVELOPED GEOTHERMAL RESOURCES Like many mineral resources, the distribution of convective geothermal resources
resembles a log-normal distribution (Figure 1). The largest 12 fields (10% of the
population) contain 46% of the total installed generation capacity. The presence of large
fields played a pivotal role in stimulating the development of national geothermal industries
in Italy, New Zealand, USA, the Philippines, and now Kenya due to the availability of
economies of scale.
Fault-hosted systems are rarer (25% of all convection systems) and smaller than igneous
systems (mean size of 39 MWe vs 103 MWe). However, these fields may be
geographically clustered (as in the Carson Sink, Basin and Range Province, western USA)
and therefore provide the economies of scale necessary for building a geothermal industry.
FIGURE 1 : CONVECTIVE GEOTHERMAL SYSTEMS - FIELD SIZE DISTRIBUTION
0
100
200
300
400
500
600
700
800
900
1000
0 20 40 60 80 100 120
MW
e
Field Rank

WORLD ENERGY COUNCIL | WORLD ENERGY RESOURCES 2016
6
Source: IGA Power Plant Database, Bertani (2015), Daiz A. R. et al (2015), Contact Energy Ltd
In terms of power generation, conductive systems comprise just 3% of the total power
generation capacity. The low to intermediate temperatures typical of these resources make
them less favourable for power generation but economical for direct use.
Geographically, 72% of installed generation capacity resides along tectonic plate
boundaries or hot spot features of the Pacific Rim. All of these are igneous convective
resources. In contrast, only 20% of total installed generation capacity resides in convection
fields situated along spreading centres and convergent margins within the Atlantic Basin.
A disproportional percentage of installed generation capacity resides on island nations or
regions (43%). Virtually all these resources occupy positions either at the junction of
tectonic plates (such as Iceland) or within a “hot spot” (as per Hawaii).
The small size of the overall population of geothermal resources reflects their recent
creation. Geologically, geothermal systems are ephemeral phenomena. Virtually all high
temperature fields are no older the Quaternary (2 million years old). Convection resources
display a cycle of birth, maturity and death as the sustaining heat flux waxes and wanes.
HISTORY OF GEOTHERMAL USE While geothermal hot springs and associated mineral by-products have been used since
antiquity, the first industrial use of geothermal resources did not occur until the early 1900s
where electricity was first generated at Larderello, Italy. Due to the abundance of available
hydro generation, geothermal development remained dormant until after the Second World
War when economic expansion and fewer remaining hydro development sites presented an
economic opportunity.
WORLD ENERGY COUNCIL | GEOTHERMAL
7
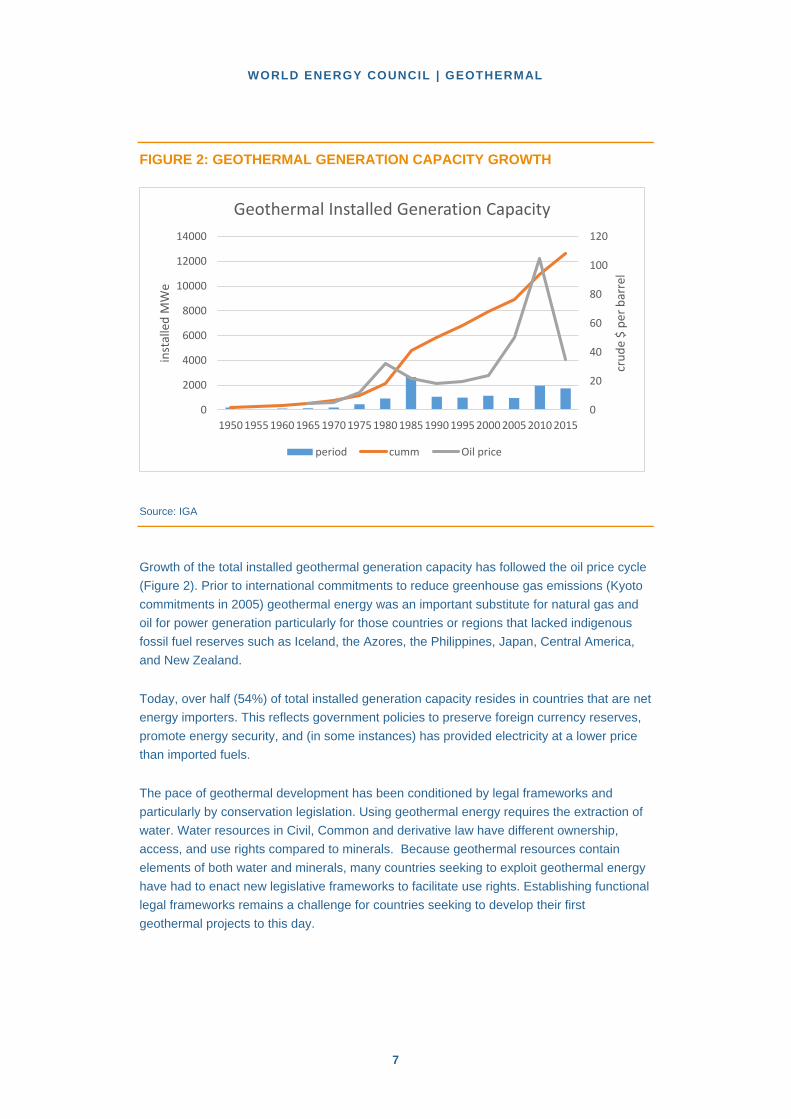
FIGURE 2: GEOTHERMAL GENERATION CAPACITY GROWTH
Source: IGA
Growth of the total installed geothermal generation capacity has followed the oil price cycle
(Figure 2). Prior to international commitments to reduce greenhouse gas emissions (Kyoto
commitments in 2005) geothermal energy was an important substitute for natural gas and
oil for power generation particularly for those countries or regions that lacked indigenous
fossil fuel reserves such as Iceland, the Azores, the Philippines, Japan, Central America,
and New Zealand.
Today, over half (54%) of total installed generation capacity resides in countries that are net
energy importers. This reflects government policies to preserve foreign currency reserves,
promote energy security, and (in some instances) has provided electricity at a lower price
than imported fuels.
The pace of geothermal development has been conditioned by legal frameworks and
particularly by conservation legislation. Using geothermal energy requires the extraction of
water. Water resources in Civil, Common and derivative law have different ownership,
access, and use rights compared to minerals. Because geothermal resources contain
elements of both water and minerals, many countries seeking to exploit geothermal energy
have had to enact new legislative frameworks to facilitate use rights. Establishing functional
legal frameworks remains a challenge for countries seeking to develop their first
geothermal projects to this day.
0
20
40
60
80
100
120
0
2000
4000
6000
8000
10000
12000
14000
1950 1955 1960 1965 1970 1975 1980 1985 1990 1995 2000 2005 2010 2015
cru
de
$ p
er b
arre
l
inst
alle
d M
We
Geothermal Installed Generation Capacity
period cumm Oil price

WORLD ENERGY COUNCIL | WORLD ENERGY RESOURCES 2016
8
In addition, the amenity and cultural values are commonly associated with surface
geothermal features (hot springs, geysers, fumaroles, mud pots, etc.). This has often
resulted in legal protection of the surface features before technology permitted exploitation
of the underlying geothermal resource for electricity generation. The protection of
geothermal springs was particularly prevalent in Common Law countries. In Australia and
New Zealand, provincial and colonial governments enacted provisions bringing hot springs
under the Crown’s protection in the 1860’s. In Canada, hot springs were vested to the
Canadian Government in 1885. The United States established a system of national parks
and monuments in 1872 bringing many geothermal features (notably those at Yellowstone)
under the protection of the Federal Government.
Today, many countries struggle to balance the protection of surface features with
development. An example would be the fluctuating status of El Tatio in Chile. Once
gazetted for development, the field is now protected as a tourist attraction. Development
has been further complicated by the increasing recognition of aboriginal rights around water
and geothermal resources. Obtaining access to geothermal resources will usually require
extensive negotiations, recognising cultural aspects and the rights of indigenous peoples,
with appropriate compensation for the potential impacts of development, together with any
land that may be alienated.
Geothermal energy currently finds itself burdened by a higher installed costs and longer
development periods relative to solar and wind. This results, in part, from a commodities
boom driving up the cost of materials, access to land, and drilling costs from 2004 through
2014. The generous investment subsidies provided by many countries allowed these high
costs to be passed onto the consumers. As a result, in many countries, geothermal energy
projects have been and are reliant on government incentives to compete against both
natural gas and other renewable generation.
So, while the cost of geothermal development rose, new technology facilitated a fall in the
capacity cost for solar and wind. This cost gap has consequential economic and policy
implications that will influence the deployment of geothermal energy in the future.
GLOBAL STATUS IN 2015
Contribution to World Energy Supply
Geothermal energy contributes a tiny proportion of the world’s primary energy consumption.
Even in electricity generation, geothermal produces less than 1% of the world’s output.
However, for individual countries, such as the Philippines, which lacks indigenous fossil
fuels, geothermal energy contributes materially to the nation’s energy supply and wellbeing.
There were 315 MW of new geothermal power capacity installed in 2015, raising the total
capacity to 13.2 GW. More specifically, new additions came from 11 binary power plants
totalling 129 MW and 8 single-flash plants totalling 186 MW. Turkey accounted for half of
the new global capacity additions, followed by the United States, Mexico, Kenya, Japan and

WORLD ENERGY COUNCIL | GEOTHERMAL
9
Germany. Figure 3 below illustrates the share by country of global geothermal capacity
additions in 2015.
FIGURE 3: GEOTHERMAL GLOBAL CAPACITY ADDITIONS IN 2015, BY COUNTRY
Source: Ren21 (2016) Global Status Report
Figure 4 below shows the top countries with the largest amounts of geothermal power
generating capacity at the end of 2015.
FIGURE 4: TOP COUNTRIES PER GEOTHERMAL GENERATING CAPACITY AT END-2015 (GW)
50%
22%
17%
6%
2% 2%
Turkey
United States
Mexico
Kenya
Japan
Germany
0
0.5
1
1.5
2
2.5
3
3.5
4
Total generating capacity GW

WORLD ENERGY COUNCIL | WORLD ENERGY RESOURCES 2016
10
Source: Ren21 (2016) Global status report
In terms of direct use of geothermal heat, the countries with the largest utilisation that
accounted for roughly 70% of direct geothermal in 2015 are China, Turkey, Iceland,
Japan, Hungary, USA and New Zealand, as shown in Figure 5 below.
FIGURE 5: TOP COUNTRIES THAT UTILISE THE MOST DIRECT GEOTHERMAL HEAT IN 2015
Source: Ren21 (2016)
Moreover, global direct use of geothermal energy can be further divided into categories of
energy utilisation. Some of the categories include: geothermal heat pumps, space heating,
greenhouse heating, aquaculture pond heating, agricultural drying, industrial uses, bathing
and swimming, cooling/snow melting and others. Figures 6 and 7 below show the installed
capacity of geothermal direct utilisation (MWt) and worldwide utilisation (TJ/year) by the
aforementioned categories.
0
5
10
15
20
25
China Turkey Iceland Japan Hungary United States New Zealand
TWh

WORLD ENERGY COUNCIL | GEOTHERMAL
11
FIGURE 6: GEOTHERMAL DIRECT APPLICATIONS WORLDWIDE IN 2015, DISTRIBUTED BY PERCENTAGE OF TOTAL INSTALLED CAPACITY (MWT)
Source: Lund and Boyd (2015)
FIGURE 7: GEOTHERMAL DIRECT APPLICATIONS WORLDWIDE IN 2015, DISTRIBUTED BY PERCENTAGE OF TOTAL ENERGY USED (TJ/YEAR)
Source: Lund and Boyd (2015)
70.95%
10.74%
2.60%
0.99%
0.23%
0.87%
13%
0.51% 0.11%Geothermal HeatPumps
Space Heating
Greenhouse Heating
Aquaculture PondHeating
Agricultural Drying
Industrial Uses
55.30%
15.01%
4.54%2.03%
0.35%
1.78%
20.31%
0.44% 0.25%
Geothermal Heat Pumps
Space Heating
Greenhouse Heating
Aquaculture Pond Heating
Agricultural Drying
Industrial Uses
Bathing and Swimming
Cooling / Snow Melting
Others

WORLD ENERGY COUNCIL | WORLD ENERGY RESOURCES 2016
12
Distribution
World electricity generation in 2014 totalled 73.3 TWh, spread among 24 counties5. In
2015, total power output totalled 75 TWh, the same number being also valid for total heat
output from geothermal energy (excluding ground heat pumps)6. The Asia Pacific region
(40%) generated the most electricity followed by North America (30%). Despite the high
capacity growth among developing nations in recent years, OECD countries still account for
over 63% of the output.
FIGURE 8: WORLD GEOTHERMAL GENERATION BY REGION
Sources: EIA, IEA, DOE Philippines, company annual reports, Contact Energy Ltd.
World geothermal heat use (direct & storage) reached in 2014 563 PJs7. Roughly 40%
represents direct use; the balance comprises energy used from heat pumps. China
dominates heat usage with over half of the world’s consumption. Europe is the second
largest user with 30% of world consumption. Direct heat use is geographically concentrated
in regions above 35o latitude due to heating requirements during winter.
5 Bertani (2015) 6 Ren21 (2016) 7 Lund and Boyd (2015)
0
10,000
20,000
30,000
40,000
50,000
60,000
70,000
80,000
20
05
20
06
20
07
20
08
20
09
20
10
20
11
20
12
20
13
20
14
GW
h p
er A
nn
um
World Geothermal Generation
North America South & Central America Europe
Continental Asia Africa Asia Pac

WORLD ENERGY COUNCIL | GEOTHERMAL
13
Total Potential
As noted in the Introduction, the Earth’s interior supplies an enormous quantity of heat to
the crust. Various studies suggest the electrical potential of geothermal resources is 10 to
100 times the current generation. Direct use potential has similar multiples to current use.
While estimating geothermal energy potential is difficult, the industry consensus is that
growth will not be resource constrained over the next half century.
Growth and Growth Factors
Over the past decade, world geothermal generation capacity grew at a rate of 3 to 4% per
year, roughly in line with the rate of world economic growth. Most of this growth took place
in Kenya (392 MWe), the USA (352 MWe), New Zealand (400 MWe), and Turkey (306
MWe); together accounting for 60% of world capacity growth.
Economic growth coupled with high fossil fuel prices has driven much of the recent capacity
investment. New development is increasingly focused in non OECD countries with rising
electricity consumption. In contrast, the OECD economies are experiencing falling energy
usage relative to GDP, lower economic growth, and the recent collapse in fossil fuel prices.
So, geothermal development must displace existing capacity in some way to be viable.
Looking forward, committed projects will add almost 2,000 MWe (a 16% capacity increase)
between January 2015 and December 2018 (Figure 9). Most of this new capacity will be
installed in Indonesia (636 MWe), Turkey (298 MWe) and Kenya (255 MWe). Geothermal
generation will expand to Iran, Croatia, Chile, and Honduras.
FIGURE 9: GEOTHERMAL GENERATION CAPACITY GROWTH – FROM COMMITTED PROJECTS
0.0
100.0
200.0
300.0
400.0
500.0
600.0
700.0
2015 2016 2017 2018
Inst
alle
d M
We
gro
ss
Geothermal Generation Capacity Growth
North America Europe Indonesia Turkey Kenya Other

WORLD ENERGY COUNCIL | WORLD ENERGY RESOURCES 2016
14
Source: Contact Energy Ltd.
While statistics for direct use are less systematic, the surveys completed by the
International Geothermal Association suggest overall direct heat use grew at 7.8% annually
between 2004 and 2014. Heat pump installations account for most of this growth. New
district heating schemes in Europe accounts for balance of the rest.
The main drivers for investment are clean air regulations and decarbonisation incentives.
Energy security coupled with the high cost or absence of natural gas may also stimulate
investment for northern European countries. Growth, particularly for district heating from
deep wells will be reliant on price supports. This dependence on subsidies makes
investments vulnerable to regulatory shifts. Recently both Spain and Germany have
reduced price supports for renewables such as solar, eliminating the economic returns for
some existing schemes.
Geothermal energy growth has lagged behind the explosive growth in wind and solar
generation. Starting from practically nothing, solar and wind generation in the USA overtook
geothermal output in a decade (Figure 7). This result reflects both the limited distribution of
geothermal resources and the deteriorating cost position relative to solar and wind. The
future of the geothermal industry, may well depend on how well geothermal technology can
drive down the costs of capacity.
FIGURE 10: USA SOLAR, WIND AND GEOTHERMAL GENERATION
Source: EIA
0
50,000
100,000
150,000
200,000
250,000
2005 2006 2007 2008 2009 2010 2011 2012 2013 2014 2015
GW
h
USA Utility Scale Renewable Generation
Geoth Wind Solar PV

WORLD ENERGY COUNCIL | GEOTHERMAL
15
1. TECHNOLOGIES
Geothermal energy is used in power generation, for direct heating, and for storage-retrieval
(ground-source heat pumps). The technologies employed are well proven, some of them
ancient. However, the industry’s inability to evolve standard designs and incorporate new
technologies has harmed its cost competitiveness.
POWER GENERATION TECHNOLOGY AND PERFORMANCE Geothermal power generation is valued for its high reliability, independence from short term
weather fluctuations, and long operating life. Individual plants, such as Wairakei (NZL), the
Geysers (USA), Larderello (ITA), Bulalo (PHL) and Oita (JPN) have reliably generated
electricity for over 40 to 50 years. Geothermal generation typically has low operating costs
(making them easy to dispatch) but suffers from high up front capital costs and associated
resource risks.
Geothermal operators generate electricity by either using the steam extracted from
geothermal fields directly in a turbine or by using hot pressurised fluid to vaporise a low
boiling point fluid for use in a binary turbine. Steam turbines are typically used in high
temperature resources while binary plants are used in intermediate temperature systems.
In both these generation systems, pressurised vapour passes through a turbine and is
subsequently condensed. The passage of vapour spins the turbine which turns a generator
to produce electricity.
The efficiency of the conversion from heat to electrical energy depends, in part, on the
condensation process. Most steam turbine systems use water (once-through or in a closed
loop) to quench the steam, producing a partial vacuum. The colder the water, the better the
quench; the lower the vacuum pressure, the higher the generation. In contrast, binary
turbine systems commonly use air driven by fans to cool and condense the vapour. The
principle remains the same: the colder the air, the greater the output from the plant.
Like other Rankin cycle plants, the condensing process affects the electrical output. This
affect is significant because the temperature and pressure of the steam or fluids feeding the
turbines is significantly lower than for fossil-fuelled thermal plants. So, geothermal
generation will vary with the ambient air temperature during day and season. Nameplate
plant output may vary by 5% to 20% throughout the year depending on the ambient
temperature. In some small scale applications, such as the Azores, this variation may have
important consequences for system supply. In continental environments where the summer
cooling load is large, the lower effective capacity of air cooled geothermal plant reduces its
value to system supply (and consequently lowers the power price).
WORLD ENERGY COUNCIL | WORLD ENERGY RESOURCES 2016
16
Over the last decade, geothermal steam plant designers/manufacturers have made modest
improvements to the efficiency of their units by increasing turbine sizes (up to 138 MW) and
raising the inlet steam pressure (up to 20 bar.a.). Similarly, the largest binary units have
more than doubled in size from 7 to 24 MWe. Importantly, this increase in scale has
moderated the installed unit cost of capacity.
Binary plant manufacturers have also improved thermal efficiencies through employing
radial turbines, using different working fluids such as ammonia, and employing supercritical
pressure systems. However, these improvements remain in the developmental stage. In
some cases, the increase in efficiency has been offset by a decline in availability. For
example, despite extensive development investments, only four small Kalina cycle plants
have been built at Husavik (ISL), Unterhatching and Bruchsal (DEU) and Matsunoyama
Onsen Hot Spring (JPN).
Depending on fluid temperature and separation pressure, some binary plants, like Ngawha
and Ngatamariki (NZL), have boosted performance by utilising both flashed steam and
separated fluid in the binary process. This configuration also improves the ability to
minimise fluid loss (pressure decline) from the reservoir.
Recently, operators have experimented with hybrid plants that combine geothermal and
other renewable technologies. At Stillwater (USA), Enel Green Power increased the
performance of its 48 MWe binary plant by employing a thermal-solar trough to increase the
enthalpy of the secondary loop working fluid. Similarly, at Cornia 2, Enel uses a biomass
boiler to increase the inlet steam temperature from 160o C to 370o C and the capacity by 5
MWe.
In financial terms, geothermal plant performance depends on the factors controlling output
(revenue): plant life, availability, and the reliability of geothermal supply.
Annual plant availability in individual years can reach as high as 97% as at Hellisheidi (ICL)
but typically range from 90% to 94%. Occasionally, plant availabilities slip to 85% for
several years due to extended refurbishments as at Cerro Prieto (MEX).
Maintaining geothermal energy supply to the generating plant is one of the major operating
risks of a geothermal project. Annual plant capacity factors typically range from over 95% at
Wyang Windu (IDN) to 36% at Momotobabo (NIC), with the median lying between 80% and
90%. However, the difference between maintaining an 88% vs 92% capacity factor is highly
material to the project meeting its financial objectives.
There is a common tendency for geothermal energy supply to decline over the life of a
project. This may be caused by falling temperatures and/or pressures in the geothermal
reservoir as well as a reduction in the water saturation (in some dry steam resources). A
good example is Coso Field (USA) where annual production over the past decade has
declined at 5% per year due mainly to “dry out”. In contrast, some fields such as Kizildere

WORLD ENERGY COUNCIL | GEOTHERMAL
17
(TUR) or Beowawe (USA) have managed falling temperatures and pressures for more than
20 years without sustained output declines.
Employing generating technology also affects capital costs. The highly variable conditions
of geothermal resources have hindered the employment of standard turbines. Every design
is optimised to a particular resource and changes to temperature and pressure over time.
This keeps costs high. United Technologies attempted to produce and market standard
binary units (Purecycle) but the additional capital costs in the cooling cycle (to make up for
the lower conversion efficiency) devoured any cost savings rendered from standardisation.
To decrease construction time, binary OEMs have moved to container-sized, scalable
modular designs for power plant components. The size of these modular binary units has
increased over time, greatly improving economies of scale.
Another important factor influencing geothermal power’s economic performance is the
ancillary electrical load required to run the supporting systems around a geothermal plant.
For favourably located, high grade resources, ancillary factors can be as low at 3.5% such
as Reykjanes (ISL); in hot dry climates with pumped, moderate temperature reservoirs, the
parasitic load my reach 20% of capacity as reported at Blue Mountain (USA). Most field
have ancillary loads ranging between 5 and 10%.
Geothermal output can also vary markedly with the composition of the reservoir fluids. The
amount of work available is a function of the heat available for conversion. The amount of
heat extracted from geothermal fluid depends on the mineralisation level. All things being
equal, the higher the mineralisation the lower the amount of heat available. So, geothermal
fields characterised by briny fluids are more difficult to economically exploit than similar
fields containing relatively fresh reservoir fluid (typically with silica or carbonate scaling).
STEAMFIELD TECHNOLOGY Roughly half the capital costs of a geothermal energy system derive from supplying hot
fluid or steam from the geothermal field. In addition, the steamfield tends to consume most
of the ongoing capital expenditure to sustain operations.
The steamfield typically comprises a steam/fluid supply system and a re-injection system to
dispose geothermal fluid after heat extraction. The supply system contains production
wells, separation vessels, conveyance pipe-work, conditioning vessels (to regulate the
properties of steam/fluid) and controls. Reinjection systems commonly contain fluid
conveyance pipe-work, pumps, mineral scale inhibitors, injection wells, and associated
controls.
The technologies for steam flashing, conditioning, and conveyance are over 50 years old.
Still, steam quality remains an issue at many steam turbine plants where long-established
design rules are not followed – or replaced by modern steam-washing technology. Poor

WORLD ENERGY COUNCIL | WORLD ENERGY RESOURCES 2016
18
steam quality can erode or corrode turbines blades. This lowers turbine performance,
increases outage time, and lifts maintenance costs.
Production wells are typically 1 to 3 km deep and produce high to intermediate temperature
two-phase fluids or steam. While oil and gas wells have reached over 9,000 m, there are
only a small number of geothermal wells producing from zones deeper than 4,500 m.
Production flow rates are highly variable; meaning that tight wells may produce energy
sufficient for only 1 MWe while exceptional wells can produce more than 25 MWe. Typical
high temperature production wells attain 5 to 12 MWe.
Injection wells display variable performance, because they tend to be drilled into the
periphery of geothermal resources where permeability is low. The field operator’s objective
is to position wells so that the injected fluid provides some degree of pressure support but
does not re-enter and cool the high temperature reservoir. Consequently, the number of
production wells relative to rejection wells varies from 1:1 at Berlin (SVL) to 6 or 7 to 1 at
Svartsengi (ISL). At steam dominated fields like Kamojang (IDN) the ratio may be 10 to 1 at
commissioning. For intermediate temperature resources, the number of injection wells may
even exceed the number of production wells as at San Emidio (USA).
Most production well-flows decline with time, with rates varying from 3-10% per year,
depending on changes in reservoir pressure and temperature and formation of scale in the
wellbore. To sustain production, field operators typically must perform workovers and drill
makeup production and injection wells. As a result, on-going drilling costs partly determine
the field’s economic returns. Drilling costs are high relative to oil and gas wells because the
number of casing strings is higher, the drilling rate-of-penetration is lower, and the cost of
mobilising and operating a rig in remote locations is higher than for established oil and gas
provinces. In addition, drilling services are commonly denominated in US dollars and the
resulting exchange rate can significantly add to drilling costs.
To remain competitive, the geothermal industry has tried to improve drilling performance
through employing more automated rigs, drilling multiple wells from pads, employing larger
diameter completions, and completing multiple legs from one well. More recently, the
industry is experimenting with percussion drilling and water jet technology. The results to
date are mixed.
ADVANCES IN RESERVOIR TECHNOLOGY Another way to increase system yield (other than drilling new wells) is to improve the
performance of existing wells by reservoir stimulation and conditioning. Over the last
decade, the industry has completed hydrologic stimulation trials at Habanero (AUS), Desert
Peak, Newberry, and Raft River (USA) and Soultz (FRA). While the results have been
encouraging, the technology needs further development before it can be deployed in
producing geothermal fields economically.

WORLD ENERGY COUNCIL | GEOTHERMAL
19
Similarly, individual field operators have experimented with improving permeability using
chemical stimulation as at Alasehir (TUR), thermal cracking, and deflagration. The results
have proved interesting but to date not economically compelling.
Conjointly with the development of stimulation methods, field operators have adapted coiled
tube and wireline techniques to replace the role of drilling rigs. In some cases, this has
significantly lowered the cost of well conditioning (work-overs) to clean out mineral scale or
repair casing damage. Remote island locations, such as Hawaii or Guadeloupe are
particularly vulnerable to the costs of importing drilling rigs for well conditioning.
National regulators are increasingly concerned with well integrity, particularly after the Lusi
blowout in Indonesia and potable water contamination concerns in the USA. Service
companies can now provide wireline-based, high temperature casing condition monitoring
tools to help field operators manage well integrity risks.
As the number of mature geothermal fields has risen with time, reservoir modelling has
become an indispensable tool for production planning and reservoir management. The
standard simulation code is TOUGH-2, developed by Lawrence Berkeley National
laboratories in California. Other research groups such as the University of Auckland
Geothermal Institute have incrementally improved code output and interfaces. Other
analytical software for specialist analysis like well bore simulation (TETRAD with Petrosim
interface) has also emerged along with visual packages for geoscience modelling
(Leapfrog). Such tools have increased the field management and exploration capabilities.
DIRECT USE TECHNOLOGIES People have been using geothermal springs for heating, cooking, and bathing for
thousands of years. The development of drilling techniques in the 20th century facilitated the
utilisation of underground geothermal resources for an array of direct uses. In practice, well
depths vary from a few hundred metres to over 4 km deep. While drilling technology has
improved, the basic technology of heat conveyance and use dates back to the 19th century.
Direct-use applications use reservoir temperatures between 40oC and 180°C in the form of
heated (liquid) water, or low pressure saturated steam. The uses vary greatly in energy
intensity from timber drying to spa pools and greenhouse heating.
Geothermal fluids contain dissolved minerals that make them inappropriate for many
process uses. So, applications commonly employ a heat exchanger to separate the
geothermal cycle from a clean water/steam process cycle.
The geothermal cycle comprises a circulating loop of geothermal fluid from the production
well(s) through a heat exchanger or steam generator, and back to an injection well(s). The
process cycle circulates air or water through the heat exchanger to the application and back
again. In the case of clean steam, the process cycle condenses the steam before re-cycling
the condensate back to the clean steam generator.

WORLD ENERGY COUNCIL | WORLD ENERGY RESOURCES 2016
20
Most geothermal direct applications use low temperature fluids for low intensity heating.
Facility investments are modest; consequently, substantially more money and effort has
been directed into technical improvements for electricity production.
Designing system controls to match variable heat process loads or narrow heat
specifications with geothermal well operating characteristics can be difficult. While modern
sensors and control systems allow some load fluctuation, the primary system commonly
needs a mechanism to shed heat in the event of a forced outage or sudden change in heat
load.
GROUND SOURCE GEOEXCHANGE TECHNOLOGY The term ‘geoexchange’ is a term used to describe heat exchange processes using stable
temperatures present at shallow depths below the ground surface. These stable
temperatures result from solar radiation rather than radiogenic decay within the earth.
Thus, geoexchange resources are distinct from true ‘geothermal’ resources.
The earth’s surface temperature varies with the season; in high latitudes, the difference
between summer and winter can exceed 40o C. However, a few metres below the earth's
surface, the ground remains at a relatively constant temperature within the range of 7°C to
21°C.
Several technologies use these heat sink and transfer properties of the shallow subsurface
to provide heating and cooling for residential and commercial scale buildings. Such
applications mainly transfer existing heat (rather than produce heat); in some applications
the subsurface is used to store heat.
The most common underground thermal application is ground-sourced heat pumps (GHP).
These installations provide both cooling and heating and comprise three main components.
A Ground Loop: an underground, closed network of pipes that collect and dispose
heat; such loops reside besides the building they service.
A Heat Pump: a device using vapour-compression refrigeration technology to
move heat. In heating mode, the heat pump transfers heat collected in the ground
loop and delivers it to the building; in cooling mode, the process is reversed and
heat in the building is removed and disposed in the ground loop.
Distribution System: this duct network distributes heat to or removes heat from
the building or application.
Sorption chilling is another, similar technology using the thermal properties of the shallow
subsurface for cooling (only). A sorption chiller uses the vaporisation and condensation of
a working fluid, like a heat pump, but achieves condensation via a chemical process rather
than mechanical compression.

WORLD ENERGY COUNCIL | GEOTHERMAL
21
Ground-sourced heat pumps can be combined with other technologies, such as solar
heating, to create hybrid systems for greater performance. It is possible to integrate these
components with solar PV, batteries, and water use through home energy management
systems (HEMS) that facilitate automated smart homes and buildings.
GHPs can be installed almost anywhere but are more practical in higher latitude locations.
The installation cost is generally higher than conventional central heating systems, or air-
sourced heat pumps. The working life is 25 years for the indoor components and 50 years
for the ground loop.
According to the IGA8, world GHP capacity has been growing at a rate of 12.5% per annum
over the past decade. This is widely expected to continue as the economies in Western
Europe, North America and China decarbonise.
8 Lund and Boyd (2015)

WORLD ENERGY COUNCIL | WORLD ENERGY RESOURCES 2016
22
2. ECONOMICS & MARKETS
OWNER-OPERATORS Electricity market reforms have reshaped the market structure of geothermal energy
profoundly since the mid-1990s.
National utilities with substantial geothermal operations such as Enel Green
Power, the Philippines National Oil Company and Electricity Corporation of NZL
have been privatised, transferring much of the world’s geothermal capacity into
private ownership.
The integrated oil companies, who pioneered geothermal development in the USA,
the Philippines, and Indonesia, have almost entirely exited the industry (the last
remaining company, Chevron, has announced its intention to sell all its geothermal
assets).
The common ownership split between the resource and the power station was
largely removed by privatisation. However, this model has re-emerged as
developing nations attempt to attract foreign investors by taking on the resource
risk.
Over 70% of geothermal electrical generation is controlled by just 20 operators (Table 1).
Interestingly, several of the top operators such as Calpine, Chevron, BH Energy (formally
Cal Energy), and CFE have essentially just maintained their existing assets since 2010.
The operators most active in developing new capacity have been Ormat, Mighty River
Power, and Pertamina Geothermal Energy. In addition, new entrants like GEODESA
(MEX) and Zorlu Energi (TUR) are developing a significant quantity of the new capacity.
To manage risk, joint venture partnerships or consortiums have returned to favour. PT
Supreme (IDN), Maibarara (PHL), Sarulla Operations Ltd. (IDN), and Tawau Green Energy
(MAL) are all recently founded and are now operating, constructing and developing
projects.
New entrants also include passive investors such as Energy Capital Partners (USA) who
have purchased interests solely in operating geothermal projects as part of a wider
renewable energy portfolio.

WORLD ENERGY COUNCIL | GEOTHERMAL
23
TABLE 1: LARGEST GEOTHERMAL PLANT/FIELD OPERATORS
Operator Country Class Capacity (MWe)
Energy Development Corporation
(EDC)
PHL IPP 1,159
ENEL Green Power ITA IPP 1031
Comision Federal de Electricadad
(CFE)
MEX Nat Utility 839
Calpine Corporation USA IPP 725
Ormat Industries ISR IPP 697
Perusahaan Listrik Negara (PLN) IDN Nat Utility 562
Kenya Electricity Generating Company KEN Nat Generator 474
Mighty River Power NZL Nat Generator 466
Chevron Corporation USA Oil & Gas - IPP 435
Aboitiz Power PHL Public Utility 430
Contact Energy NZL IPP 423
Reykjavik Energy ISL Nat Utility 409
Pertamina Geothermal Energy (PGE) IDN Nat Generator 402
Berkshire Hathaway Energy USA IPP 317
Star Energy IDN IPP 230
La Geo SLV Nat Generator 191
HS Orka ISL Public Utility 170
ICE CRI Nat Utility 162

WORLD ENERGY COUNCIL | WORLD ENERGY RESOURCES 2016
24
Kyushu Electric Power JPN Public Utility 122
Gurmat TUR IPP 112
Total 9,356
In contrast, the owners of direct-use facilities tend to be small enterprises (greenhouses,
hotel/baths), municipalities (district heating), or individual homes. There are a few large
scale district heating utilities in Iceland, France, Turkey and China. There are also a handful
of large industrial users of steam such as Norske Skog (NZL) and Mitsubishi Materials
(JPN).
INVESTMENT Global investment in 2015 was US$2 billion, a 23% setback from 20149. During the period
2010-2014, around US$20 billion were invested in geothermal energy by 49 countries for
both direct use and electric power. Figure 11 illustrates the trajectory of yearly new
investment in geothermal energy from 2004 to 2015.
FIGURE 11: YEARLY NEW INVESTMENT IN GEOTHERMAL ENERGY, 2004-2015 (USD BILLION)
Source: Bloomberg New Energy Finance, UNEP (2016)
9 BNEF (2016)
0
0.5
1
1.5
2
2.5
3
3.5
4
2004 2005 2006 2007 2008 2009 2010 2011 2012 2013 2014 2015

WORLD ENERGY COUNCIL | GEOTHERMAL
25
The countries with the highest investments include: Turkey, Kenya, China, Thailand, USA,
Switzerland, New Zealand, Australia, Italy and South Korea. Investments by category
include: 28.3% for electricity utilisation in 16 countries, 21.8% for direct use in 32 countries,
25.6% for field development and production drilling in 32 countries, and 24.4% for R&D
which includes surface exploration and exploratory drilling in 48 countries. In addition,
regional investments have been identified as follows: 10.8% in Africa by 2 countries
(US$2,160 billion), 13.4% in the Americas by 9 countries (US$ 2,669 billion), 44% in Asia
by 9 countries (US$8,765 billion), 19.9% in Europe by 27 countries (US$3,953 billion) and
11.9% in Oceania by 2 countries (US$2,375 bln) (Figure 12).
FIGURE 12: GLOBAL INVESTMENT FROM 2010-2014 BY REGION, IN PERCENTAGE
Source: Lund & Boyd (2015)
COMPARATIVE COST ECONOMICS A number of international energy consultancies (Bloomberg, Lazard) and agencies (IEA,
EIA) have assessed the levelised cost of geothermal generation plant compared with its
rivals. While in detail these costs differ depending on the present value of the currency
used, capacity factors assumed, and the countries of origin, the relative ranking remains
consistent. Figure 13 presents the average levelised cost of electricity (LCOE) for
geothermal in 2014 by region.
10.80%
13.40%
44%
19.90%
11.90%
Africa
America
Asia
Europe
Oceania

WORLD ENERGY COUNCIL | WORLD ENERGY RESOURCES 2016
26
FIGURE 13: AVERAGE LEVELISED COST OF ELECTRICITY FOR GEOTHERMAL IN 2014, BY REGION
Source: IRENA (2016)
Geothermal generation is generally ranked as costlier than either gas-fired, combined cycle
or coal-fired steam plants (conventional or fluidised bed) (see Table 2). In addition, in some
applications utility scale solar PV and wind have materially lower levelised costs and can be
located closer to the load centres. The perceived lower project risk for solar PV means that
projects will proceed with internal rates of return (IRRs) as low as 5%.
TABLE 2: INDICATIVE LEVELISED COSTS FOR GENERATION PLANT (USD/MWH, 2014 BASIS)
Plant/Fuel Type Low Median High
Solar PV rooftop 150 190 265
Solar PV utility 60 90 150
Wind onshore 40 87 150
Geothermal 85 96 200
Gas Combined Cycle 65 80 125
Coal Steam (conventional) 65 85 150
0.080.07 0.07
0.12
0.08 0.08 0.08
0
0.02
0.04
0.06
0.08
0.1
0.12
0.14
Africa Asia Eurasia Europe NorthAmerica
Oceania SouthAmerica
20
14
US
D/k
Wh

WORLD ENERGY COUNCIL | GEOTHERMAL
27
Note: cost figures do not include carbon charges
In practice, geothermal developers report a very wide range of installed capacity costs
(Table 3). Since company reports do not include associated scopes of work, it is unclear
whether the costs reported include all the components. Notwithstanding these
uncertainties, the figures suggest greenfield developments will range from US$4,500 to
US$5,100 per kW. These installed costs are consistent with recent power purchase
agreements (PPA) tariff awards in Indonesia that are in the US$95/MWh to US$110/MWh
range.
TABLE 3: REPORTED PROJECT CAPITAL COSTS
Project Country Capacity MW Year US$ per kw
Ngatamariki NZL 82 2013 4,487
Neal Hot Springs USA 22 2012 4,827
Wyang Windu II IDN 120 2009 2,200
San Jacinto I NIC 36 2009 5,117
Thermo USA 11 2009 8,810
Bagnore 4 ITA 40 2014 4,060
Note: Wyang Windu II was a brownfield development on an existing field
Sources: Mighty River Power, US Geothermal, Star Energy, Ram Power, Racer Technologies, and Enel
annual reports

WORLD ENERGY COUNCIL | WORLD ENERGY RESOURCES 2016
28
3. SOCIO-ECONOMICS
GOVERNMENT INCENTIVES A survey of practices completed by the WEC shows that geothermal energy does not enjoy
the incentives available to other renewable energy projects like solar and wind. The survey
also shows that incentives vary depending on whether the primary objective is to grow
electricity supply or reduce greenhouse emissions.
Renewable portfolio standards (RPS) are the cost common mechanism to displace fossil
fuel and nuclear energy with renewable energy10. These renewable energy consumption
targets vary widely. The European standards have specific targets for electricity,
heating/cooling and transport. In North America, the individual states/provinces targets vary
from none at all to the full suite of energy sectors. Central and South America tend to target
electricity generation only. The Asia Pacific Region also preferentially targets electricity
generation. Because RPS standards are broad and indirect, it is difficult to assess what, if
any, impact they have in promoting geothermal energy.
Feed-in tariffs are the most common direct incentive for geothermal investment. Countries
in Europe such as Germany, Austria, and Turkey use this mechanism to reduce
greenhouse emissions. Feed-in tariffs range from US cents 10.4 per KWh (TUR) to 23 per
kWh (DEU). While prices represent a significant premium over wholesale power prices,
they are subject to change as with the recent removal of solar price supports in Spain and
Germany.
In contrast, countries such as Indonesia and Kenya rely on feed-in tariffs to stimulate
capacity investment by removing price risk and providing a premium to cover resource and
country risks. These tariffs, commonly issued under competitive tenders, are embedded
into 30 year PPAs with a national utility and so have far less risk and higher bankability than
the European renewable tariffs.
It is worth noting that tax exclusions on import duties and value added levies are also
important mechanisms to attract geothermal investment in many developing countries.
In North America, the preferred direct incentives include tax credits, government
guaranteed debt, and in a few cases, direct government grants (for EGS). The main
advantage seems to be that wholesale power prices are not distorted. However, the
increased incentives for solar and wind have disadvantaged geothermal development.
10 IRENA (2015)

WORLD ENERGY COUNCIL | GEOTHERMAL
29
Cap and trade schemes (emission trading systems) have been trialled in Europe, Canada,
China, Korea, California, and New Zealand. To date, traded carbon prices have been too
low (US$10 to $15 per tonne) to provide any real advantage to geothermal energy relative
to natural gas.
Within the OEDC, renewable energy policies also seek to advance geothermal energy use
through direct funding of research and development. To date government funding has
focused on technology related to geothermal resources principally EGS demonstration
projects such as Soultz (FRA) and Desert Peak (USA). Equipment manufacturers have
focused on improving the reliability and efficiency of electricity generating and balance-of-
plant equipment. Many of the large operators spend relatively little on research but focus on
incremental improvements to their existing operations.
LAND ACCESS AND USE Geothermal developments, particularly for power stations, require a substantial land area.
Access to the resource depends on firm land rights. In many countries seeking to expand
geothermal generation, occupiers of the land may lack formal titles, the right to land having
originated from continued occupation for long periods (in some cases hundreds, if not
thousands of years). Geothermal developers must work through the legal processes to
formalise land rights and suitable compensation for access. In practice, these necessary
social/political frameworks may delay projects for several years. This is a material risk for
countries looking to attract independent power producers to invest in geothermal
generation.
In countries having an established geothermal industry, rival claims on water and land for
other uses can restrict geothermal energy use or development. In particular, local
infrastructure claims on land beside or overlying geothermal resources are difficult for
operators to defend. National guidelines to protect geothermal resources for extraction and
conservation may be required to prevent the erosion of beneficial use.
UTILITY PARADIGM SHIFT The emergence of new energy and systems technologies is altering the scope and
economics of the traditional electric utility. The centralised, unidirectional flow from
generation to local use via a transmission/distribution system is giving way to network
platforms supporting local generation, balancing, pricing, storage, consumption and
associated services.
Both the technology pull and policy push towards local electricity networks favours the
adaptation of smaller-scale, local geoexchange technologies relative to the central
generating role of geothermal electricity generation. While long the poor cousin to electric
generation, ground sourced heat pumps may be entering a golden age.

WORLD ENERGY COUNCIL | WORLD ENERGY RESOURCES 2016
30
Similarly, growth in district heating systems has propelled interest in “smart” thermal grids.
These systems integrate deep geothermal heat extraction and other local energy sources
with the storage and cooling capabilities of geoexchange systems.
The social and political economy is changing the energy technology and application
preferences of communities and customers. So future geothermal use will depend on how
geothermal energy conforms to these new imperatives.
GEOTHERMAL PROJECT IN INDIA
Geothermal resources are present in 7 provinces in India, however there is no
geothermal power plant yet, but only a number of projects. One of the projects is
the result of a recent collaboration between India and Norway in the north-
western Himalayas. Tow pilot demonstration projects investigating the utilisation
of low and medium temperature geothermal resources for heating purposes,
successfully improved the livelihood of the local population. The area has a very
short supply of electricity of about 3 hours per day, and temperatures drop in the
winter season to below 20ºC. In addition, natural resources such as wood are in
short supply and people rely on fossil fuels like coal for heating their homes.
The researchers assessed the resource potential and heat load for heating up a
hotel and restaurant, and successfully managed to install heating systems that
keep the indoor temperature at about 20ºC. Due to the shortage of electricity
available, solar panels have been installed to make possible the continuous
operation of the heat pumps. These kinds of projects play a key role in improving
the life expectancy and overall standard of living of people living in areas
characterised by fuel-poverty, relative isolation and geothermal resource
potential11.
At the country level, India announced plans to develop 10,000 MW of geothermal
energy by 2030 in partnership with countries that are top producers of
geothermal power generation: USA, Philippines, Mexico and New Zealand. There
are already some sites in the country where geothermal energy is explored,
namely Cambay Graben in Gujarat, Puga and Chhumathang in Jammu and
Kashmir, Tattapani in Chhattisgarh, Manikaran in Himachal Pradesh, Ratnagiri in
Maharashtra and Rajgir in Bihar. The plan is part of the government’s pledge to
increase the share of renewable power to 350 GW by 203012.
11 Richter (2016) Geothermal project successful in providing heat to community in the Himalaya 12 Richter (2016) India sets ambitious target for geothermal development by 2030

WORLD ENERGY COUNCIL | GEOTHERMAL
31
4. ENVIRONMENTAL IMPACTS
Geothermal extraction results in a number of discharges and impacts on the environment.
These include gas discharges to air, chemicals to land and water, noise, and the potential
for induced seismicity.
Geothermal fluids contain dissolved gasses, commonly carbon dioxide and nitrogen with
trace amounts of ammonia and hydrogen sulphide. In Table 4 below it is presented the
typical composition of geothermal gas. When two-phase geothermal fluid is separated into
steam and water, or cooled in a heat exchanger, these gases emerge from the solution and
are commonly vented to the atmosphere without adverse effects. However, hydrogen
sulphide is a hazardous substance and many countries now regulate the management of
H2S discharges. The USA and Italy have both mandated the installation of scrubbers to
remove hydrogen sulphide from air discharges. Other countries place strict limits on H2S
levels in air emissions.
TABLE 4: TYPICAL COMPOSITION OF GEOTHERMAL GAS (WEIGHT % DRY GAS)
CO2 H2S H2 CH4 NH3 N2 AR
Median 95.4 3.0 0.012 0.15 0.29 0.84 0.02
Maximum 99.8 21.2 2.2 1.7 1.8 3.0 0.04
Minimum 75.7 0.1 0.001 0.0045 0.005 0.17 0.004
Source: ESMAP (2016)
The level of potential adverse environmental effects varies with the intensity of gas
emissions. Low and moderate temperature fluids have significantly lower concentrations of
dissolved gases than the high temperature, resources. Some of the district heating systems
using low grade fluids from sedimentary basins are able to extract and inject geothermal
fluids without any venting of gases.

WORLD ENERGY COUNCIL | WORLD ENERGY RESOURCES 2016
32
Primary or separated geothermal fluids also contain dissolved cations of potential
environmental concern such as mercury, arsenic, antimony, and boron. These may also
precipitate out as scale, commonly in the form of silica or metal silicates but stibnite,
cinnabar, or (rarely) orpiment may also occur. The cleaning of pipes or heat exchangers
commonly results in material quantities of precipitate. Some regulators now require that
operators dispose such mineral scale as a hazardous substance.
Similarly, geothermal fluids, once the heat has been removed, are usually reinjected back
into geothermal reservoir below the potable water level. This avoids potential contamination
of potable water supplies. In a few locations, geothermal fluid is disposed into evaporation
ponds or discharged to the ocean or rivers but these practices are waning. In recent years,
community concerns regarding the integrity of geothermal, oil and gas wells have induced
mandatory casing inspections, and plug and abandonment practices to avoid accidental
contamination of shallow potable aquifers.
If geothermal power plants are operated close to settlements, they will impact the local
community. The most common complaints are noise, odour, rights to fresh groundwater,
and sometimes ground subsidence. Many jurisdictions now have strict noise and odour
limits on operating geothermal power stations. In arid regions like the Altiplano or the
western USA, geothermal operators must compete with other interests for the use of
groundwater for drilling and occasionally injection for reservoir pressure stabilisation. This
rivalry can provoke litigation and community opposition to geothermal development.
It is well known that depleting shallow aquifers can result in ground subsidence. There are
well documented cases of ground subsidence (Steamboat Springs, USA, and Wairakei-
Tauhara, NZL). Such subsidence has the potential to damage surface facilities and
regulatory authorities may require surface monitoring to manage and avoid these effects.
Over the last 30 years, nearly all geothermal developments have included reinjection of the
used process fluids. Such injection has the potential to induce seismic activity. There are
emerging community concerns regarding induced seismicity. Several geothermal fields
such as Coso (USA), Rotokawa (NZL), Wairakei (NZL), and Reykjanes (ISL) display micro
seismicity that is likely induced by production and injection. In addition, engineered
geothermal systems (EGS) purposely induce micro earthquakes to increase permeability.
Oil and gas operations demonstrate a correlation between the high pressure injection of
fluids into known fault zones and seismic activity. To date, there are few, if any, examples
of material damage caused by induced seismicity from geothermal operations. However,
the disposal of fluids in sedimentary basins as a result of oil and gas extraction (USA)
triggers noticeable seismic swarms. In Europe, the threat of induced seismicity has halted
operations at the Basel (CHE) Enhanced Geothermal System plant. Several countries
(USA, NZL, DEU) require seismic monitoring to better understand underground processes
and to provide the opportunity to manage seismic effects.

WORLD ENERGY COUNCIL | GEOTHERMAL
33
In summary, geothermal operations have widely varying impacts on the environment.
Many countries regulate practices to manage these effects as geothermal activities
increasing take place close to population centres. The result is that geothermal energy
development faces increasing environmental costs relative to its rival renewable energy
sources.
GREENHOUSE GAS EMISSIONS FROM GEOTHERMAL POWER PLANTS Power production from intermediate to high temperature geothermal resources does result
in the emission of some greenhouse gases (GHG), although the quantity emitted is much
lower in comparison with traditional fossil fuelled power generation units. This is mainly
because GHGs are naturally present in the geothermal fluid, and thus their emission in the
atmosphere occurs without any drilling or power production taking place. The non-
condensable gas (NCG) present in the geothermal fluid is mainly composed of carbon
dioxide (CO2), around 95% and methane (CH4), up to 1.5% in rare cases. The way in which
these kinds of emissions are regarded and reflected in national regulatory frameworks
varies among the countries of the world. Accordingly, some countries do not count
geothermal emissions as anthropogenic, while others require annual monitoring and
reporting if a specific emission limit is surpassed. The expansion of geothermal industry
and increased exploitation of resources can result in higher than usual amount of
emissions, especially when the reservoir has a higher concentration of GHGs13.
The global average estimate for operational GHG emissions in 2001 was 122 g CO2/kWh.
Other countries reported emissions in line with the global average, for example the United
States (106 g CO2/ kWh in 2002) and New Zealand (123 g CO2/kWh in 2012). Extremes
can be found in Iceland with as low as 34 g CO2/kWh and Italy with as high as 330 g
CO2/kWh. Excessive emissions have been registered in South West Turkey to range
between 900 g to 1,300 g CO2/kWh, higher values than for fossil-fuelled power plants which
can go up to 1,030 g CO2/kWh for a circulating fluidised bed coal plant and 580 g CO2/kWh
for open-cycle gas plant. However, the circumstances (high temperature geothermal
reservoirs located in carbonate rich rocks) that favour such high level of emissions are
rare14.
Geothermal CO2 can be effectively captured and utilised in a number of ways, but it is not a
common practice worldwide. NCG from geothermal power plants is captured in Turkey at
Kizildere, Dora I and II, and Gumusköy. The CO2 captured is commercialised for dry ice
production and for the production of carbonated beverages, but also for enhancing
photosynthesis in greenhouses, production of paint and fertiliser, fuel synthesis and
enhanced oil recovery. Moreover, the gas can also be reinjected back into the system, and
two examples where this is practiced is at the Puna plant in Hawaii and Hellisheidi power
plant in Southwest Iceland. The economic feasibility of CO2 capture from NCG depends on 13 ESMAP (2016) 14 Ibid

WORLD ENERGY COUNCIL | WORLD ENERGY RESOURCES 2016
34
factors such as the composition of the gas, total gas flow, the gas to liquid ratio and size of
demand relative to the volume produced. The opportunities or constraints of NCG capture
and utilisation are defined by market conditions as well as technology15.
SUSTAINABILITY As a policy matter, governments and international energy agencies generally classify
geothermal energy as “renewable” because the heat withdrawn may be replaced over time
by the natural heat flux. Usually the rate of heat withdrawal is at least an order of magnitude
greater than the rate of replacement.
Operating a field sustainably can present challenges to the operator. The time required to
rejuvenate a geothermal system will depend on its particular characteristics including the
enthalpy, rate of pressure decline, extraction rate, and re-injection strategy. The pressure
decline in the reservoir due to fluid extraction may induce an influx of cold water into the
geothermal reservoir, where suitable permeability exists. For example, at Momotombo
(NIC), where production is reduced to preserve the convective forces in the reservoir or at
Wairakei (NZL) or Tiwi (PHL) where influx of cool fluids prematurely cooled significant parts
of the resource to the extent that production could not be sustained.
ENEL’S STILLWATER SOLAR-GEOTHERMAL HYBRID PLANT
Enel Green Power commissioned in 2011 the 33 MW Stillwater geothermal
power station in Nevada, USA. The plant operated from the beginning with 26
MW of PV capacity, translating into 89,000 solar panels covering 240 acres.
However, the utility company decided to add in 2014 17 MW of Concentrated
Solar Power (CSP) capacity, making the plant the first in the world to integrate
these three renewable technologies. The hybrid power plant combines the
continuous generating capacity of binary-cycle, medium-enthalpy geothermal
power with solar thermodynamic. One important benefit of combining CSP with
geothermal is the possibility to increase the capacity factor of the plant without
increasing the nominal power. The CSP system in binary geothermal plants can
heat the working fluid to a higher temperature to produce more output.
Other important advantages of CSP integration includes the life extension of
geothermal reservoir, as it reduces the need to drill additional production wells or
relocate injection wells; offsetting the parasitic load, especially useful in dry
climates where water is scarce, as it reduces the costs of buying and treating
water and reduces the rate of reservoir depletion due to evaporation loss; and
also reheating of the spent brine in binary power plants, which allows the brine to
be recycled back into the power plant and re-injected into the reservoir at higher
temperature.
15 ESMAP (2016)

WORLD ENERGY COUNCIL | GEOTHERMAL
35
Hybrid systems that are properly designed as such from the planning phase can
increase the performance of geothermal reservoirs, thus can help enhance the
overall sustainability of the project16.
16 Hashem (2016)

WORLD ENERGY COUNCIL | WORLD ENERGY RESOURCES 2016
36
5. OUTLOOK
The World Energy Council notes that energy sustainability relies on three pillars: energy
security, energy equity (access and affordability), and environmental sustainability. The
future of geothermal energy investment growth will depend on how well this technology and
the associated regulatory framework can blend with these objectives.
Historically, harnessing geothermal energy has enhanced national energy security,
particularly for island nations/regions. The rural locations of many high grade geothermal
resources have also improved public access to electricity. However, the biggest challenge
going forward will be providing affordable energy.
The short and medium term outlook is quite different for OECD and developing countries.
For OECD countries with established geothermal industries, decreasing intensity of
electricity use and the lower cost of alternatives is suppressing greenfield development and
encouraging brownfield development, repowering, and refurbishments. For these countries,
geothermal energy output will grow at a rate less than national economic growth.
Most of the growth in geothermal electricity generation will take place in developing
economies such as Kenya and Indonesia where energy demand is rising, geothermal
resources are plentiful, and development bank capital can be employed to facilitate
construction.
However, to survive in the 21st century, the geothermal industry needs to innovate. The
existing steamfield and drilling costs structure is simply not sustainable. Cost and health &
safety pressures will continue to drive the de-manning of plant and drilling operations,
incentivising innovation in controls, instrumentation, process modelling, and condition
monitoring.
Over the last decade, the geothermal industry’s centre-of-gravity has pivoted away from the
USA towards Europe and Asia. Already many of the largest geothermal operators reside in
the Asia-Pacific region. Other centres of geothermal excellence are emerging in Kenya,
Mexico (with privatisation) and Turkey. Europe and China dominate growth in direct use
and district heating technology. Financing will continue to be dominated by the Multilateral
Development Banks. Expertise will steadily migrate towards countries with large
geothermal operators.
New, non-geothermal technology will continue to drive the use of geothermal in unexpected
directions. The application of smart networks, electrical storage, electric vehicles, and
energy management technology will shape new roles for geothermal power and energy.

WORLD ENERGY COUNCIL | GEOTHERMAL
37
The high grade, easily accessible geothermal resources have mostly been developed. The
average size of projects will continue to decline and utilise lower grade resources,
particularly in Europe and the USA.
THE INFLUENCE OF COP21 TO GEOTHERMAL DEVELOPMENT The climate change conference from Paris at the end of 2015 managed to bring together
161 countries of the world to sign a global agreement to mitigate climate change. These
countries submitted Intended Nationally Determined Contributions (INDC) pledges to cut
carbon emissions, and one way of achieving this goal is by increasing the share of
renewables in the energy mix. Geothermal energy is included in the INDC pledges of
several countries, and the Table 4 below lists the countries that have made climate
mitigation commitments in which geothermal power is explicitly mentioned.
TABLE 5: COUNTRY INDC COMMITMENTS THAT MENTION GEOTHERMAL POWER
Country Geothermal information in pledge
Bolivia Pledges to increase renewables including geothermal power.
Costa Rica To achieve and maintain a 100% renewable energy mix by 2030
with geothermal power as part of the portfolio.
Canada Pledges investments to encourage the generation of electricity
from renewable energy sources such as wind, low-impact hydro,
biomass, photovoltaic and geothermal energy.
China Plans to proactively develop geothermal energy.
Djibouti Pledges to develop renewable energy including geothermal
power
Dominica Made commitments to reduce emissions in energy sector using
geothermal power.
Eritrea Pledges to develop geothermal as part of its commitment.
Ethiopia Pledges to develop geothermal as part of its commitment.
Fiji Pledges to develop geothermal as part of its commitment.

WORLD ENERGY COUNCIL | WORLD ENERGY RESOURCES 2016
38
Grenada Pledges to build 15 MW of geothermal power in the near-term.
Kenya Expansion in geothermal and other renewables as part of its
emissions mitigation strategy.
Papua New Guinea Pledges to develop geothermal as part of its commitment.
St Lucia 35% Renewable Energy Target by 2025 and 50% by 2030
based on a mix of geothermal, wind and solar energy sources.
St Vincent and
Grenadines
The largest contributor to reducing emissions will be the
installation of a geothermal electricity generation facility, which
when operational will provide over 50% of the country’s
electricity needs.
Solomon Islands Geothermal listed as mitigation opportunity.
Uganda Geothermal listed as mitigation opportunity.
Vanuatu Pledges to build 8 MWs of geothermal by 2030.
St. Kitts and Nevis Commitment to geothermal as part of its INDCs.
Source: Geothermal Energy Association (2016)
These INDC commitments will have a positive influence on geothermal development, so
much so that it is estimated that capacity will double by 2030. In addition, Global
Geothermal Alliance pledged to increase fourfold the global geothermal capacity to around
65 GW by 2030.
It is important to note that the realisation of the pledges will require substantial financial
investment, with an estimated public investment increase 7 to 10 fold, from US$7.4 billion
currently to US$56-73 billion. Developing countries are facing a number of difficulties in
geothermal development related not only to lack of sufficient public funding and insurance,
but also to challenging private investment markets, modest experience with geothermal and
project risk mitigation barriers. However, there are some international efforts to mitigate
geothermal project risk in developing countries such as US$31.2 million drilling programme
at Lake Assal, Djibouti and US$115 million resource exploration and drilling at Casita-San

WORLD ENERGY COUNCIL | GEOTHERMAL
39
Cristobal, Nicaragua. The World Bank’s Geothermal Development Plan endeavours to
supply US$500 million to help tackle these issues and more17.
GLOBAL MARKET According to a GEA (2016) report, the global market for geothermal energy is forecasted to
reach 18.4 GW by 2021. In a conservative forecast, where only projects under construction
and with definite completion dates have been taken into account, the increase is projected
to be around 14.8 GW. The industry has seen a steady growth within the past few years,
and it is believed that this trend will not only most likely continue, but maybe accelerate due
to climate change concerns and an increasing need to decarbonise the energy sector18.
Figure 14 below shows planned capacity additions updated in 2015.
FIGURE 14: CAPACITY UNDER DEVELOPMENT BY COUNTRY (MW)
Source: GEA (2016)
Furthermore, some projections go even further than that to see the power capacity growth
to around 21 GW by 2020. The Figure below presents a breakdown of total projected
capacity by region in 2020.
17 Geothermal Energy Association (2016) 18 Ibid
0
500
1,000
1,500
2,000
2,500
3,000
3,500
4,000
4,500
Pla
nn
ed
Ca
pa
cit
y A
dd
itio
ns

WORLD ENERGY COUNCIL | WORLD ENERGY RESOURCES 2016
40
FIGURE 15: PROJECTED INSTALLED GEOTHERMAL POWER CAPACITY WORLDWIDE IN 2020, BY REGION (MW)
Source: Statista (216)
Lastly, Table 6 below lists the countries that have specific targets for geothermal power
installed capacity and/or generation up to year 2030.
TABLE 6: COUNTRIES WITH SPECIFIC TARGETS FOR GEOTHERMAL INSTALLED CAPACITY AND/OR GENERATION
Country Geothermal Target
Algeria 15 MW by 2030
Argentina 30 MW by 2016
Armenia 50 MW by 2020; 100 MW by 2025
Chinese Taipei 10 MW by 2020; 150 MW by 2025; 200 MW by 2030
Ethiopia 75 MW by 2015; 450 MW by 2018; 1 GW by 2030
Grenada 15 MW (no date)
0
1,000
2,000
3,000
4,000
5,000
6,000
7,000
8,000
9,000
America Asia Europe Africa Oceania

WORLD ENERGY COUNCIL | GEOTHERMAL
41
Indonesia 12.6 GW by 2025
Italy 6,759 GWh/year generation from 920 MW capacity by 2020
Kenya 1.9 GW by 2016; 5 GW by 2030
Korea, Dem.
Republic
2,046 GWh/year by 2030
Philippines 1.5 GW added 2010–2030
Portugal 29 MW by 2020
Rwanda 310 MW by 2017
Solomon Islands 20–40 MW (no date)
Spain 50 MW by 2020
Thailand 1 MW by 2021
Turkey 1 GW by 2023
Uganda 45 MW by 2017
Source: REN21 (2016)

WORLD ENERGY COUNCIL | WORLD ENERGY RESOURCES 2016
42
6. GLOBAL TABLE
TABLE 7: GEOTHERMAL ENERGY GLOBAL TABLE
Country Total Electricity
Generating
Capacity (MW)
in 2015
Total
Electricity
Generation
(GWh) in 2014
Geothermal
Direct-use
Installed
Capacity
(MWt) in 2014
Geothermal Direct-
use Energy
Utilisation
(GWh) in 2014
Albania - - 16.23 29.89
Algeria - - 54.64 472.25
Argentina - - 163.60 277.81
Armenia - - 1.50 6.25
Australia 2.1*** 0.5* 16.09 53.99
Austria 1.4*** 2.2* 903.40 1 816.26
Belarus - - 4.73 31.54
Belgium - - 206.08 24.01
Bosnia &
Herzegovina - -
23.92 70.10
Brazil - - 360.10 1 839.70
Bulgaria - - 93.11 340.14
Canada - - 1 466.78 3 226.65
Caribbean Is - - 0.10 0.77

WORLD ENERGY COUNCIL | GEOTHERMAL
43
Country Total Electricity
Generating
Capacity (MW)
in 2015
Total
Electricity
Generation
(GWh) in 2014
Geothermal
Direct-use
Installed
Capacity
(MWt) in 2014
Geothermal Direct-
use Energy
Utilisation
(GWh) in 2014
Chile - - 19.91 51.70
China 27 145 17 870.00 48 434.99
Colombia - - 18.00 80.50
Costa Rica 202 1 538 1.00 5.83
Croatia - - 79.94 190.15
Czech Rep - - - -
Denmark - - 353.00 1 043.14
Ecuador - - 5.16 28.45
Egypt - - 6.80 24.45
El Salvador 204 1 558 3.36 15.56
Estonia - - 63.00 98.90
Ethiopia 7 17 2.20 11.56
Finland - - 1 560.00 5 000.40
France 16* 115* 2 346.90 4 407.85
Georgia - - 73.42 193.12
Germany 38 98 2 848.60 5 425.80
Greece - - 221.88 368.49

WORLD ENERGY COUNCIL | WORLD ENERGY RESOURCES 2016
44
Country Total Electricity
Generating
Capacity (MW)
in 2015
Total
Electricity
Generation
(GWh) in 2014
Geothermal
Direct-use
Installed
Capacity
(MWt) in 2014
Geothermal Direct-
use Energy
Utilisation
(GWh) in 2014
Greenland - - 1.00 5.83
Guadeloupe 15 75 - -
Guatemala 49 247 2.31 15.68
Honduras - - 1.93 12.50
Hungary - - 905.58 2 852.47
Iceland 665 5 238 2 040.00 7 422
India - - 986.00 1 195.10
Indonesia 1 404 10 038 2.30 11.83
Iran - - 81.50 306.45
Ireland - - 265.54 344.62
Israel - - 82.40 609.22
Italy 824 5 916 1 014.00 2411.90
Japan 533 2 602 2 186.17 7 258.94
Jordan - - 153.30 427.81
Kenya 607 3 178 22.40 50.73
Korea (South) - - 835.80 745.24
Latvia - - 1.63 8.84

WORLD ENERGY COUNCIL | GEOTHERMAL
45
Country Total Electricity
Generating
Capacity (MW)
in 2015
Total
Electricity
Generation
(GWh) in 2014
Geothermal
Direct-use
Installed
Capacity
(MWt) in 2014
Geothermal Direct-
use Energy
Utilisation
(GWh) in 2014
Lithuania - - 94.60 198.04
Macedonia - - 48.68 166.99
Madagascar - - 2.81 21.00
Mexico 1 069 6 000 155.82 1 158.70
Mongolia - - 20.16 94.58
Morocco - - 5.00 13.89
Nepal - - 3.32 22.53
Netherlands - - 790.00 1 785.14
New Zealand 979 7 258 487.45 2 394.91
Nicaragua 155 662 - -
Norway - - 1 300.00 2 294.63
Pakistan - - 0.54 0.68
Papua New
Guinea 53 400
0.10 0.28
Peru - - 3.00 16.95
Philippines 1 930 10 308 3.30 11.00
Poland - - 488.84 761.89

WORLD ENERGY COUNCIL | WORLD ENERGY RESOURCES 2016
46
Country Total Electricity
Generating
Capacity (MW)
in 2015
Total
Electricity
Generation
(GWh) in 2014
Geothermal
Direct-use
Installed
Capacity
(MWt) in 2014
Geothermal Direct-
use Energy
Utilisation
(GWh) in 2014
Portugal
25 205
35.20 132.84
Romania 0.1* 0.4* 245.13 529.30
Russia Fed 78 455 308.20 1 706.66
Saudi Arabia - - 44.00 42.47
Serbia - - 115.64 500.73
Slovakia - - 149.40 686.05
Slovenia - - 152.75 315.93
South Africa - - 2.30 10.28
Spain - - 64.13 95.80
Sweden - - 5 600.00 14 423.38
Switzerland - - 1 733.08 3 288.26
Tajikistan - - 2.93 15.39
Thailand 0.3* 1.2* 128.51 328.14
Tunisia - - 43.80 101.12
Turkey 624 2 364 2 886.30 12 536.00
Ukraine - - 10.90 33.00
UK - - 283.76 529.63

WORLD ENERGY COUNCIL | GEOTHERMAL
47
Country Total Electricity
Generating
Capacity (MW)
in 2015
Total
Electricity
Generation
(GWh) in 2014
Geothermal
Direct-use
Installed
Capacity
(MWt) in 2014
Geothermal Direct-
use Energy
Utilisation
(GWh) in 2014
USA 3 567 16 800** 17 415.91 21 074.52
Venezuela - - 0.70 3.89
Vietnam - - 31.20 25.65
Yemen - - 1.00 4.17
Source: IRENA (2016) Renewable Energy Statistics; Lund and Boyd (2015) Direct utilisation of geothermal
energy 2015 worldwide review.
*Data taken from Bertani (2015) Geothermal power generation in the world 2015-2014 update report. ** Data taken from REN21 (2016) Global Status Report. ***Data taken from BP Statistical Review of World Energy 2016 workbook

WORLD ENERGY COUNCIL | WORLD ENERGY RESOURCES 2016
48
LIST OF TABLES AND FIGURES
FIGURES
Figure 1 – Convective Geothermal Systems - Field Size Distribution ........................................... 5
Figure 2 – Geothermal generation capacity growth ...................................................................... 7
Figure 3 – Geothermal global capacity additions in 2015, by country ........................................... 9
Figure 4 – Top countries per geothermal generating capacity at end-2015 (GW) ......................... 9
Figure 5 – Top countries that utilise the most direct geothermal heat in 2015 ............................ 10
Figure 6 – Geothermal direct applications worldwide in 2015, distributed by percentage of total
installed capacity (MWt) .............................................................................................................. 11
Figure 7 – Geothermal direct applications worldwide in 2015, distributed by percentage of total
energy used (TJ/year) ................................................................................................................. 11
Figure 8 – World Geothermal Generation by Region .................................................................. 12
Figure 9 – Geothermal Generation Capacity Growth – from committed projects ........................ 13
Figure 10 – USA Solar, Wind and Geothermal Generation ......................................................... 14
Figure 11 – Yearly New investment in geothermal energy, 2004-2015 (USD Billion) ................ 24
Figure 12 – Global investment from 2010-2014 by region, in percentage ................................... 25
Figure 13 – Average levelised cost of electricity for geothermal in 2014, by region .................... 26
Figure 14 – Capacity under development by country (MW) ........................................................ 39
Figure 15 – Projected installed geothermal power capacity worldwide in 2020, by region (MW) 40
TABLES
Table 1 – Largest geothermal plant/field operators ..................................................................... 23
Table 2 – Indicative levelised costs for generation plant (USD/MWh, 2014 basis) ..................... 26
Table 3 – Reported project capital costs ..................................................................................... 27
Table 4 – Typical composition of geothermal gas (weight % dry gas) ......................................... 31
Table 5 – Country INDC commitments that mention geothermal power ..................................... 37
Table 6 – Countries with specific targets for geothermal installed capacity and/or generation ... 40
Table 7 – Geothermal energy global table .................................................................................. 42

WORLD ENERGY COUNCIL | GEOTHERMAL
49
REFERENCES
Axelsson, G. et al (2005) Sustainable Management of geothermal Resources and Utilisation for
100 – 300 Years, in Proceedings World Geothermal Congress 2005, Antalya Turkey.
Bertani (2015) Geothermal Power Generation in the World 2010-2014 Update Report; in World
Geothermal Congress 2015, Melbourne Australia.
Bertani (2003) What is Geothermal Potential? IGA News, 53, 1-3. http://iga.igg.cnr.it.
British Petroleum (2015) World Energy Statistics 2015, British Petroleum, London, UK.
Carey, B. et al. (2015) New Zealand country update, Proceedings World Geothermal Congress
2015, https://pangea.stanford.edu/ERE/db/WGC/papers/WGC/2015/01052.pdf
Delony, J. (2016) ‘2016 Outlook: Future of Geothermal Industry Becoming Clearer’, in
Renewable Energy World, January 27,
http://www.renewableenergyworld.com/articles/2016/01/2016-outlook-future-of-geothermal-
industry-becoming-clearer.html
Energy Information Administration EIA (2015) Indonesia has significant potential to increase
geothermal electricity production, October 19,
http://www.eia.gov/todayinenergy/detail.cfm?id=23392
EPRI (1978) Geothermal Energy Prospects for the Next 50 Years; special report ER-611-SR,
February 1978.
Energy Sector Management Assistance Program (ESMAP) (2016) Greenhouse gases from
geothermal power production,
http://documents.worldbank.org/curated/en/550871468184785413/pdf/106570-ESM-
P130625-PUBLIC.pdf
Fonda, A. D., Marasigan, M. C. and Lazaro, V. S. (2015) Geothermal development in the
Philippines: The country update, Proceedings World Geothermal Congress 2015,
https://pangea.stanford.edu/ERE/db/WGC/papers/WGC/2015/01053.pdf
Frankfurt School-UNEP Collaborating Centre for Climate & Sustainable Energy Finance and
Bloomberg New Energy Finance (2016) Global trends in renewable energy investment,
http://fs-unep-centre.org/publications/global-trends-renewable-energy-investment-2016
Geothermal Energy Association (2016) 2016 Annual US & Global geothermal power production
report, http://geo-
energy.org/reports/2016/2016%20Annual%20US%20Global%20Geothermal%20Power%20
Production.pdf
Goldstein, B. et al (2014) Chapter 4 Geothermal Energy, in Renewable Energy Resources and
Climate Change Mitigation, Cambridge University press, United Kingdom.
Grant M.A., and Bixley P.F., (2011) Geothermal Reservoir Engineering Second Edition, Elsevier,
New York

WORLD ENERGY COUNCIL | WORLD ENERGY RESOURCES 2016
50
Gutiérrez-Negrín, L. C. A. et al (2015) Present situation and perspectives of geothermal in
Mexico, Proceedings World Geothermal Congress 2015,
file:///C:/Users/radu/Downloads/Mexico%20country%20update%202015.pdf
Hance, C.N. (2005) Factors Affecting Costs of geothermal Power Development, Geothermal
energy Association, for the US Department of energy, Washington DC, USA.
Hashem, H. (2014) ‘World’s first commercial CSP-geothermal hybrid underway’, in CSP Today,
16 May, http://social.csptoday.com/technology/world%E2%80%99s-first-commercial-csp-
geothermal-hybrid-underway
IRENA (2015) Renewable Energy Target Setting; www.irena.org.
Lund and Boyd (2015) Direct Utilisation of Geothermal Energy 2015 Worldwide Review; in:
World Geothermal Congress 2015, Melbourne Australia.
Lund B. and Zoback M.D. (1998) Orientation and magnitude of in situ stress to 6.5 km depth in
the Baltic Shield, international Journal of Rock mechanics and Mining Sciences vol. 36
pages 969-190.
Mines, G., et al (2015) Geothermal Plant Capacity Factors, in Proceedings Fortieth Stamford
Geothermal Workshop, Stamford, CA, USA.
Omenda, P. and Simiyu, S. (2015) Country update report for Kenya 2010-2014, Proceedings
World Geothermal Congress 2015,
https://pangea.stanford.edu/ERE/db/WGC/papers/WGC/2015/01019.pdf
Ragnarsson, Á. (2015) Geothermal development in Iceland 2010-2014, Proceedings World
Geothermal Congress 2015, https://www.geothermal-
energy.org/pdf/IGAstandard/WGC/2015/01077.pdf
Razzano, F. and Cei, M. (2015) Geothermal power generation in Italy 2010-2014 update report,
Proceedings World Geothermal Congress 2015,
https://pangea.stanford.edu/ERE/db/WGC/papers/WGC/2015/01075.pdf
REN21 (2016) Renewables 2016: Global status report, http://www.ren21.net/wp-
content/uploads/2016/06/GSR_2016_Full_Report_REN21.pdf
Richter, A. (2016) ‘Geothermal project successful in providing heat to community in the
Himalaya’, in Think Geoenergy, 29 June, http://www.thinkgeoenergy.com/geothermal-
project-successful-in-providing-heat-to-community-in-the-himalaya/
Richter (2016) ‘India sets ambitious target for geothermal development by 2030’, in Think
Geoenergy, 9 June, http://www.thinkgeoenergy.com/india-sets-ambitious-target-for-
geothermal-development-by-2030/
Saemundsson K., (2007) Geology and Gradient Wells, in short Course on Surface Exploration
for Geothermal Resources, UNU-GTP and KenGen, Lake Naivasha, Kenya.
Santilano, A. et al (2015) Convective, Intrusive Geothermal Plays: What About Tectonics?
Geothermal Energy Science, Vol 3 pages 51-59.
Sanyal, S.K. et al (2007) Is EGS Commercially feasible? In: Transactions of the Geothermal
Resources Council, Vol 31 pp 313-322.

WORLD ENERGY COUNCIL | GEOTHERMAL
51
Sigfussion B. and Uihlein A., (2015) 2014 JRC Geothermal Energy Status Report, JRC report,
European Commission.
Statista (2016) Global geothermal capacity installations forecast by region 2020,
http://www.statista.com/statistics/495576/geothermal-installed-capacity-worldwide-by-region-
forecast/
Stefansson (2005) World Geothermal Assessment; in: proceedings World Geothermal Congress
2005, Antalya, Turkey.
Tester, J.W. et al (2005) Sustainable Energy – Choosing Among Options, MIT Press,
Cambridge, MA, USA (ISBN 0-262-20153-4)
Weber, J. et al (2015) Geothermal energy use in Germany, Proceedings World Geothermal
Congress 2015, https://pangea.stanford.edu/ERE/db/WGC/papers/WGC/2015/01045.pdf
Weber, J. et al (2014) Trends in Geothermal Applications 2013, International Energy Agency,
http://iea-gia.org.
Williams, C. F. et al (2011) Updating the Classification of Geothermal Resources, in Proceedings
thirty-sixth Stamford Geothermal Workshop, Stamford, CA, USA.
Yasukawa, K. and Sasada, M. (2015) Country update of Japan: renewed opportunities,
Proceedings World Geothermal Congress 2015,
https://pangea.stanford.edu/ERE/db/WGC/papers/WGC/2015/01042.pdf
WORLD ENERGY COUNCIL | WORLD ENERGY RESOURCES 2016
52
ACKNOWLEDGEMENTS
The project team would like to thank the individuals who informed the project’s approach,
supplied information, provided ideas, and reviewed drafts. Their support and insights have made
a major contribution to the development of the report.
WORLD ENERGY COUNCIL
Executive Chair
Hans-Wilhelm Schiffer RWE Germany
Deputy Director Scenarios & Resources
Zulandi Van der Westhuizen World Energy Council UK
Corina Radu World Energy Council UK
Lead Author
Ted Montague Contact Energy New Zealand