Embed Size (px)
Citation preview

1
World Energy Perspectives
Energy efficiency policies | 2016
ENERGY EFFICIENCY :
A STRAIGHT PATH
TOWARDS ENERGY
SUSTAINABILITY
In Partnership with ADEME

WORLD ENERGY COUNCIL | PERSPECTIVES
2
ABOUT THE WORLD ENERGY COUNCIL
The World Energy Council is the principal
impartial network of energy leaders and
practitioners promoting an affordable,
stable and environmentally sensitive energy
system for the greatest benefit of all.
Formed in 1923, the Council is the UN-
accredited global energy body,
representing the entire energy spectrum,
with over 3,000 member organisations in
over 90 countries, drawn from
governments, private and state
corporations, academia, NGOs and energy
stakeholders. We inform global, regional
and national energy strategies by hosting
high-level events including the World
Energy Congress and publishing
authoritative studies, and work through our
extensive member network to facilitate the
world’s energy policy dialogue.
Further details at www.worldenergy.org
and @WECouncil
ABOUT THE WORLD ENERGY
PERSPECTIVES
Energy Efficiency a Straight Path Towards
Energy Sustainability. François Moisan,
Chair of the World Energy Council
Knowledge Network on Energy Efficiency
Policies & Indicators and Director of
Strategy and Research, ADEME (France)
says: “The introduction of energy efficiency
policies and measures has been growing
fast around the world. The increasing
number of countries with an energy
efficiency law, ten more compared to the
2013 report, signifies a strengthening and
consolidation of the institutional
commitment to energy efficiency.”
This is the 8th report in the series of
triennial reports produced by the Council
together with ADEME and it is the most
comprehensive global publication in the
area of energy efficiency policies. Drawing
on the experiences and lessons from the
research conducted in more than 95
countries around the world, the report
presents and evaluates different
approaches to energy efficiency policies
adopted in these countries and helps
identify policies which work well and those
which do not.

ENERGY EFFICIENCY : A STRAIGHT PATH TOWARDS ENERGY
SUSTAINABILITY
3
TABLE OF CONTENTS
EXECUTIVE SUMMARY .......................................................................................................... 4
Key findings ........................................................................................................................... 4
CHAPTER 1 INTRODUCTION ........................................................................ 7
1.1 Energy Efficiency matters .................................................................................................... 8
1.2 The World Energy Council energy efficiency project in brief ............................................. 12
CHAPTER 2 ENERGY EFFICIENCY TRENDS ..............................................18
2.1 Overall energy efficiency trends ........................................................................................ 19
2.2 Energy efficiency achievements in the power sector ......................................................... 30
2.3 Energy efficiency achievements in industry ....................................................................... 33
2.4 Energy efficiency achievements in transport ..................................................................... 37
2.5 Energy efficiency achievements in buildings ..................................................................... 41
2.6 CO2 emissions from energy combustion ........................................................................... 44
CHAPTER 3 ENERGY EFFICIENCY POLICIES: COMMON, CURRENT AND
INNOVATIVE PRACTICES ............................................................................47
3.1 A stronger institutional context .......................................................................................... 48
3.1.1 More than 50% of countries have implemented national energy efficiency laws ........ 48
3.1.2 Targets: 90% of surveyed countries set quantitative objectives ................................. 49
3.1.3 60% of countries have set up a national energy efficiency agency ............................. 52
3.1.4. The policies and measures IMPLEMENTATION toolbox .......................................... 53
3.2 Large SCALE DEPLOYMENT of energy efficiency regulations to transform the market ... 59
3.2.1. Labels to guide consumers and motivate manufacturers .......................................... 59
3.2.2. MEPS to remove inefficient equipment or practices .................................................. 67
3.2.3. Effectiveness and compliance of standards and labels ............................................. 77
3.2.4 Other regulatory measures for consumers ................................................................. 82
3.2.1. Regulation with energy companies: energy savings obligation .................................. 85
3.3 Incentives are still necessary to support investments and regulations .............................. 90
3.3.1. Traditional incentives: financial and fiscal instruments .............................................. 90
3.3.1. Energy efficiency funds to support incentive programmes......................................... 97
3.3.2. ESCO and Public Private Partnerships to alleviate the public financings ................ 101
3.4 Information dissemination to motivate consumer to undertake actions ........................... 110
3.4.1. Energy efficiency platforms ...................................................................................... 110
3.4.2. Simplifying consumer access to information: one-stop shops ................................. 111
3.4.3. Innovative smart phone application ......................................................................... 113
3.5 Going beyond classical energy efficiency policies and measures ................................... 115
CHAPTER 4 THE INTERNATIONAL DIMENSION AND THE SPILL OVER
EFFECT OF ENERGY EFFICIENCY: MULTIPLE BENEFITS ..................... 121
4.1 The International dimension of energy efficiency ............................................................ 122
4.2 The spill over effect of energy efficiency: multiple benefits .............................................. 124
CHAPTER 5 CONCLUSIONS AND RECOMMENDATIONS ....................... 132
5.1 Energy efficiency trends .................................................................................................. 133
5.2 Energy efficiency policies and measures TO CONSIDER ............................................... 134
5.3 Recommendations .......................................................................................................... 136
CHAPTER 6 REFERENCES ........................................................................ 140
World Energy Council ........................................................................................................ 151

WORLD ENERGY COUNCIL | PERSPECTIVES
4
EXECUTIVE SUMMARY
The research conducted by the World Energy Council together with ADEME since 1992
concludes that energy efficiency continues to improve all over the world but despite the
significant advances, much more can and should be done to improve the efficiency of
energy production and use. Energy Efficiency policies play a fundamental role in supporting
the transition towards sustainable energy.
KEY FINDINGS
1. ENERGY PRODUCTIVITY IS IMPROVING IN MOST COUNTRIES AND REGIONS.
Energy consumption per unit GDP (primary energy intensity) is decreasing in 80% of
the surveyed countries and most regions, mainly due to the combination of a number of
factors, including high energy prices until 2014 and other economic factors, successful
energy efficiency programmes, expanding GHG emissions abatement regulations and
the transformation of economic activities with a growing share of services in the GDP in
countries around the world.
2. LARGE DIFFERENCES BETWEEN COUNTRIES. There are large disparities between
regions and countries, both in terms of industrial and household energy use. Europe
has the lowest primary energy intensity per unit GDP at Purchasing Power Parity
(PPP), followed closely by Latin America and OECD Asia, while China uses twice the
amount of energy per unit GDP compared to Europe. Oil producing countries, on the
other hand, have in general low energy prices which attract energy intensive industries
and hold back the deployment of efficient equipment and best practices. In the
household sector, the average consumption of electricity varies significantly between
countries depending on different factors, mainly the number of electrical appliances in
the household, and ranges from 1,000 kWh/household in India to 8,000 kWh in North
America, 2,000 kWh in Italy and 4,000 kWh in Japan.
3. GLOBAL CO2 EMISSIONS HAVE INCREASED BY 51% SINCE 1990 but the main
sources have changed. In Europe, CO2 emissions have dropped by 22% between
1990 and 2014, while strong economic growth in China and India resulted in tripling of
their CO2 emissions. However, per capita emissions are still significantly higher in the
developed countries with nearly 16 tonnes CO2 per year in North America compared to
2 tonnes CO2 in India and 6 tonnes CO2 in China.
4. SIGNIFICANT ACHIEVEMENTS DESPITE GLOBAL ECONOMIC CRISIS. In most
regions, annual improvement rate of energy efficiency has slowed down from 1.6%
between 2000 and 2008 to 1.3% in the following years. Despite this, the energy
efficiency improvements over the last 15 years saved the world 3.1 Gtoe of energy and
7 Gt of CO2, which corresponds to 23% of global energy consumption and 21% of
global CO2 emissions in 2015.

ENERGY EFFICIENCY : A STRAIGHT PATH TOWARDS ENERGY
SUSTAINABILITY
5
5. PRICE SIGNALS ARE KEY BUT ALONE ARE NOT ENOUGH TO IMPROVE
EFFICIENCY. Analysis of the country specific policies and measures around the world
indicates that clear and targeted policies are required to reinforce the role of energy
prices in market economies. These policies would support a wider deployment of
energy efficient equipment and services which would drive consumer choice towards
the most efficient and cost effective solutions.
ENERGY EFFICIENCY POLICIES AND MEASURES
Introduction of energy efficiency policies and measures has been growing fast around the
world. The increasing number of countries with an energy efficiency law signifies a
strengthening and consolidation of the institutional commitment to energy efficiency. Energy
efficiency policy measures (P&Ms) implemented by public stakeholders include a
combination of regulations, financial and fiscal instruments and information. P&M are
usually adapted for the different economic activities and end-uses. The target areas
include, for instance, phasing out and replacement programmes for old and inefficient
stocks.
The Minimum Energy Performance Standards (MEPS) set the minimum performance
criteria to be achieved by new appliances or buildings and efficiency labels guide
consumers towards more energy efficient appliances and buildings and motivate
manufacturers to supply energy efficient products. However, labels alone are not sufficient
to transform the market, they are just the first step and need to be complemented with
MEPS to remove inefficient equipment or introduce best practices. The improvement effect
of labels and MEPS is linked to the quantity of equipment which is replaced or the amount
of investment in new equipment.
MULTIPLE BENEFITS OF ENERGY EFFICIENCY
The main strategic benefits of improving energy efficiency are to enhance security of supply
and reduce CO2 emissions. In addition, there are associated benefits, including job
creation, productivity improvement and energy access.
CASE STUDY: INTERNATIONAL LABELLING OF ELECTRIC MOTORS
Industrial electric motors and electric motor-driven systems (EMDS) consume almost
half of the total electricity and account for 70% of the total electricity consumption in
the industry. The cost-effective potential to improve energy efficiency of motor
systems is roughly 20% to 30%, and such improvement would reduce the total global
electricity demand by about 10–15% per year. There are many policies and measures
to increase the efficiency of new motors, in particular through their better labelling.
The IEC (International Electrotechnical Commission) has put in place four energy
efficiency classes for electric motors (with IE4 corresponding to the highest
efficiency).

WORLD ENERGY COUNCIL | PERSPECTIVES
6
THE WAY FORWARD – RECOMMENDATIONS FOR FUTURE
The role of energy efficiency is well-understood and appreciated by the global community.
The potential for energy efficiency improvement is huge and moreover, it can be realised
quickly. On the path to energy sustainability, efficiency must come first, as it is the cheapest
and readily available “fuel source”.
The report suggests that the following considerations will help advance energy efficiency
improvements:
Energy prices should closely reflect the real cost of supply. The countries should
set deadlines for a gradual energy pricing reform.
Consumers need to be better informed. It is necessary to simplify messages on
energy efficiency to reach the majority of consumers.
New technologies, including smart meters and billing offer attractive benefits and
their wide introduction should be supported by policies.
Innovative financing tools need to be widely introduced to reduce the public
spending on financial and fiscal incentives.
Control over implementation and evaluation of policies and measures are
fundamental to the policies success.
Regulations must be regularly reviewed and strengthened if necessary, and
labelling and MEPS should be regularly revised and upgraded.
The development of international or multi-national standards can help enhance
international and regional cooperation, in addition to regional testing and
harmonisation of equipment testing standards and facilities. International energy
fora should be used to exchange experiences to benchmark policies and identify
best practices.
Overall energy efficiency trends through macro indicators, energy efficiency key
achievements in the power sector and indicators by end-use sectors (industry, transport
and buildings) as well as CO2 emissions from energy use are analysed in the first part of
this report. The results of the policies and measures (P&M) survey are presented in the
second part in different graphs showing the degree of implementation of the measures in
four world regions: Europe, Asia, America, Africa & Middle East.

ENERGY EFFICIENCY : A STRAIGHT PATH TOWARDS ENERGY
SUSTAINABILITY
7
Chapter 1 Introduction

WORLD ENERGY COUNCIL | PERSPECTIVES
8
1.1 ENERGY EFFICIENCY MATTERS
Energy efficiency is among the “first fuels” at world level
Energy efficiency can be considered an energy resource, and not a hidden energy resource
but the “first fuel” in the largest economies. At world level, the World Energy Council
indicators database shows that the share of energy efficiency in total primary energy
consumption (with avoided energy consumption taken into account) in 2014 was 38%,
ahead of oil at 19% and coal/lignite at 18% (Figure 1).
FIGURE 1: PRIMARY ENERGY CONSUMPTION, INCLUDING AVOIDED
CONSUMPTION (PERCENT AT WORLD LEVEL)
PART DES ÉNERGIES DANS LA CONSOMMATION PRIMAIRE PRENANT EN
COMPTE LES CONSOMMATIONS ÉVITÉES
* Avoided consumption is calculated as the difference between current consumption at 1980 energy intensity
levels and the actual energy consumption.
Source: Enerdata
All over the world, energy efficiency is becoming a top priority in energy policies as it is
competitive, cost effective to implement and widely available.
The World Energy Council energy efficiency indicators show that there is no antinomy
between economic development and energy efficiency. Quite the opposite: the best
improvements over time in energy intensity took place in China, where GDP growth was
high during the last decade.
The Sustainable Energy for All (SE4ALL) initiative launched by the UN Secretary-General
in 2011 has three interlinked objectives to be achieved by 2030, where the second
0
5000
10000
15000
20000
25000
1980
1982
1984
1986
1988
1990
1992
1994
1996
1998
2000
2002
2004
2006
2008
2010
2012
2014
Gto
e
Oil Natural gas ElectricityCoal and lignite Heat BiomassAvoided consumption
Oil19%
Natural gas13%
Electricity5%
Coal and lignite18%
Heat
0%
Biomass7%
Avoided consumption
38%
2014
ENERGY EFFICIENCY : A STRAIGHT PATH TOWARDS ENERGY
SUSTAINABILITY
9
objective is to “double the global rate of improvement in energy efficiency”1. This objective
was included as one of the 17 Sustainable Development Goals (SDGs) in the Agenda for
Sustainable Development adopted by world leaders in September 2015 at the UN
Sustainable Development Summit.
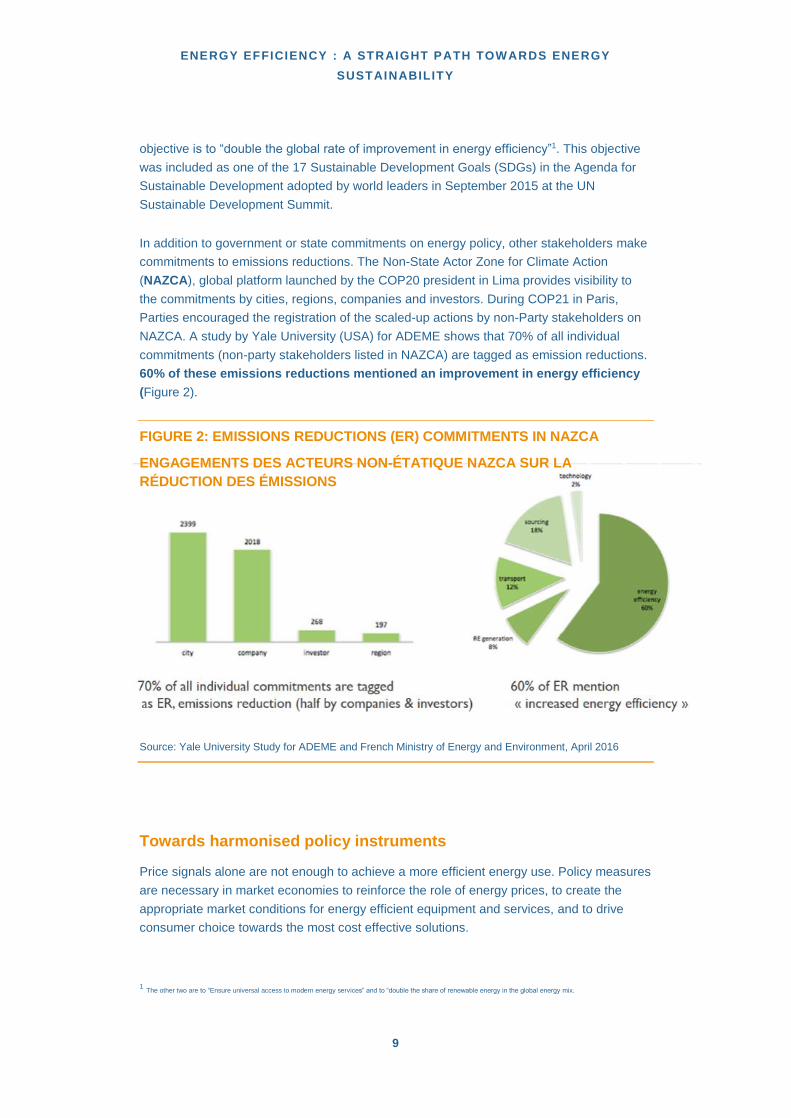
In addition to government or state commitments on energy policy, other stakeholders make
commitments to emissions reductions. The Non-State Actor Zone for Climate Action
(NAZCA), global platform launched by the COP20 president in Lima provides visibility to
the commitments by cities, regions, companies and investors. During COP21 in Paris,
Parties encouraged the registration of the scaled-up actions by non-Party stakeholders on
NAZCA. A study by Yale University (USA) for ADEME shows that 70% of all individual
commitments (non-party stakeholders listed in NAZCA) are tagged as emission reductions.
60% of these emissions reductions mentioned an improvement in energy efficiency
(Figure 2).
FIGURE 2: EMISSIONS REDUCTIONS (ER) COMMITMENTS IN NAZCA
ENGAGEMENTS DES ACTEURS NON-ÉTATIQUE NAZCA SUR LA
RÉDUCTION DES ÉMISSIONS
Source: Yale University Study for ADEME and French Ministry of Energy and Environment, April 2016
Towards harmonised policy instruments
Price signals alone are not enough to achieve a more efficient energy use. Policy measures
are necessary in market economies to reinforce the role of energy prices, to create the
appropriate market conditions for energy efficient equipment and services, and to drive
consumer choice towards the most cost effective solutions.
1 The other two are to “Ensure universal access to modern energy services” and to “double the share of renewable energy in the global energy mix.

WORLD ENERGY COUNCIL | PERSPECTIVES
10
The major reasons for failure in market mechanisms are often pinpointed to justify the
introduction of policy measures:
The information is either missing or partial;
The availability of efficient appliances and production devices in the domestic
market is limited;
The lack of technical, commercial and financial services;
Investment decision-makers are not always the final users who have to pay the
heating or cooling bills (“split incentives”);
Financial constraints faced by individual consumers are often more severe than
what is actually revealed by national discount rates or long-term interest rates. This
often leads consumers to over-emphasise the purchase cost of equipment and
devices2.
Energy efficiency policies are necessary to address these multiple barriers. The World
Energy Council energy efficiency Policies & Measures survey shows that there is a growing
interest in policy implementation worldwide, as the number of implemented measures is
increasing. Regulations are most often implemented measures, both to raise consumer
awareness using the energy efficiency labels, and to remove from the market the inefficient
equipment and buildings with MEPS (Minimum Energy Performance Standards). The report
shows that regulations tend to be harmonized across countries.
One survey shows that some recommendations set out in previous Council reports are
becoming a reality. For instance, the Council survey demonstrates a convergence in policy
implementation: e.g. MEPS for the largest appliances are implemented worldwide; building
codes are spreading in emerging economies. There is an increasing interest in harmonised
tests of minimum requirements (e.g. testing laboratory of MEPS for some electrical
appliances). Regulations alone have often a low rate of compliance and need incentives to
push the market toward “greener” practices. The financial constraints are increasingly
addressed in emerging economies by energy efficiency funds set up with the support of
regional and international banks (e.g. World Bank, ADB, etc.) as well as by development
banks in OECD countries (e.g. kfW for Germany, AFD for France); these funds aim at
providing resources to support economic incentives to finance energy efficiency
programmes.
2 Implicit discount rates in industry are over 20% compared to less than 10% for public discount rates, and 4-6% for long-term interest rates.

ENERGY EFFICIENCY : A STRAIGHT PATH TOWARDS ENERGY
SUSTAINABILITY
11
FIGURE 3: POTENTIAL OF IMPROVING ENERGY EFFICIENCY FOR TOP 6
HIGH CONSUMING PRODUCTS
POTENTIEL EN MATIÈRE D’AMÉLIORATION DE L’EFFICACITÉ
ÉNERGÉTIQUE POUR 6 PRODUITS ÉNERGIVORES
Source: UNEP, 2014 (estimated annual figure for 2030)
WORLD ENERGY COUNCIL | PERSPECTIVES
12
1.2 THE WORLD ENERGY COUNCIL ENERGY EFFICIENCY PROJECT IN BRIEF
Over the last two decades, the World Energy Council together with ADEME has been
conducting triennial global surveys to catalogue energy efficiency policies and measures
and to identify prevailing trends. This project is part of the activities of the Knowledge
Network on Energy Efficiency and it is supported by two online databases:
Energy Efficiency Indicators by country and region
Energy Efficiency Policies and Measures by country
Database on energy efficiency indicators
The database contains a list of 40 indicators by sector (macro, transformation, industry,
transport, residential, commercial and agriculture) and has a user-friendly interface. The
energy efficiency indicators are updated once a year and cover now the period up to 2014
(last update in May 2016). These indicators are available on the WORLD ENERGY
COUNCIL website (https://www.worldenergy.org/data/efficiency-indicators/)
The energy efficiency indicators are calculated for 96 countries and ten world regions:
Europe3, CIS4, North America (USA, Canada), Latin America (including Mexico), OECD
Asia5, China, India6, Other Asia, Africa and Middle East.
Database on energy efficiency policies and measures (P&Ms)
The data base provides an overview of energy efficiency policy measures. It can be
accessed on the WORLD ENERGY COUNCIL website by measure and/or country
https://www.worldenergy.org/data/energy-efficiency-policies-and-measures. As for the
indicator database, 96 countries are covered. To update the data base, a survey of P&Ms
has been conducted during summer 2015 through the WORLD ENERGY COUNCIL
National Member Committees. The survey was organised in four sections according to the
nature of measures: institutions and programmes; financial and fiscal measures;
regulations and others measures. In total, 56 countries participated in the survey
(participation rate of 58%). For the 40 remaining countries, only information on national
institutions and main regulations on labels, MEPS and building codes have been updated.
3 Europe, Albania, Bosnia, Croatia, Iceland, Macedonia, Norway, Serbia, Switzerland, and Turkey. 4 CIS (Commonwealth of Independent States): Azerbaijan, Armenia, Belarus, Georgia, Kazakhstan, Kyrgyzstan, Moldova, Russia, Tajikistan, Turkmenistan, Uzbekistan and Ukraine. 5 Japan, Korea, Australia, New Zealand. 6 India and China are treated as regions given their demographic weight.

ENERGY EFFICIENCY : A STRAIGHT PATH TOWARDS ENERGY
SUSTAINABILITY
13
The policy database includes policy case studies on selected topics. These case studies
have several objectives:
Provide a summary of the state of the art of selected implemented measures;
Compile standardised national case studies of ex-post evaluation for up to ten
countries with "good practices";
Provide lessons and recommendations for their implementation.
Three new case studies have been added in 2016 covering the following topics:
Electric motors;
Energy information centres and “one-stop” shops in buildings;
Building codes with a focus on emerging countries.
Energy efficiency trends
The evaluation of energy efficiency trends by world region in this report is based on a set of
homogeneous energy efficiency indicators covering the period 2000-2014. As there has
been a slowdown in the economic growth in most regions since 2008 following the financial
crisis, some comments refer to the period 2008-2014.
The data used for the calculation of the energy efficiency indicators come from ENERDATA
world energy database7. This database compiles harmonised data from international
organisations, industry associations and national institutions (Box 1). It provides a
consistent coverage of the world energy consumption, split by main regions, and is
regularly updated to take into account the most recent trends.
BOX 1: SOURCES OF DATA USED TO CALCULATE THE ENERGY
EFFICIENCY INDICATORS
Primary and final energy consumption by sector:
2000 to 2012/13: IEA, National sources
2013/2014: Enerdata from national energy ministries and utilities, EUROSTAT, IEA,
Cedigaz for gas
Economic data (GDP, Value added): World Bank, IMF, Asian Development Bank
7 The indicators are presented by country in a database developed and maintained by Enerdata: http://www.worldenergy.org/data/efficiency-indicators/

WORLD ENERGY COUNCIL | PERSPECTIVES
14
Other data:
Population, employment: World Bank
Households: Enerdata from national sources
Stock of vehicles: IRF (International Road Federation) for transport, Odyssee,
national sources
Industrial production: World Steel Association for steel, UNIDO & USGS for cement,
FAO for paper
Solar water heaters: Observer, IEA and national sources
To allow a meaningful comparison of energy efficiency between countries, these
indicators are based on common definitions, in particular with respect to the
definition of energy consumption and CO2 emissions8.
Energy efficiency policies
The evaluation of energy efficiency policies in this report covers the spread of selected
energy efficiency policy measures around the world and provides answers to the questions:
What is the importance of energy efficiency measures? What are the priorities? What are
the trends in policy implementation? What measures are being favoured? What are the
innovative measures?
This evaluation relies mainly on a comprehensive global survey. It also draws on the three
case studies on policy measures prepared by different experts. The main findings of these
case studies have been included in the relevant chapters of this report. The country case
studies are available in the Council’s policy database9.
Figure 4 presents the countries covered by the survey10 of energy efficiency policy
measures. As almost two thirds of countries do not belong to OECD, this sample shows a
good representation of non-OECD countries, especially in Latin America and Asia. The
results of the survey can be viewed by type of measure, by target (i.e. sector, type of
appliance) and by country in the World Energy Council policy data base11.
8 Electricity is converted to toe according to IEA methodology: 0.26 toe/ MWh (36 GJ) for nuclear; 0.086 toe/MWh (3.6 GJ) for hydro, wind and electricity consumption; 0.86 toe/MWh for geothermal. Final energy consumption excludes non-energy uses. CO2 emissions are calculated by Enerdata based on UNFCCC definitions. 9 http://www.wec-policies.enerdata.eu/case-studies.php; other case studies evaluated in the 2013 report are also included: good practice in the public sector, financial tools for households, measures for low income households, obligation of energy savings for energy utilities, regulation and compliance, and, finally, smart meters. 10 The survey is based on a questionnaire designed by ADEME and Enerdata and distributed to all Council’s Member Committees. 11 http://www.worldenergy.org/data/energy-efficiency-policies-and-measures/

ENERGY EFFICIENCY : A STRAIGHT PATH TOWARDS ENERGY
SUSTAINABILITY
15
Africa & Middle East: 13
Asia : 12
Europe: 23
America: 8
FIGURE 4: COUNTRIES COVERED BY THE WORLD ENERGY COUNCIL
SURVEY ON ENERGY EFFICIENCY POLICIES
PAYS COUVERTS PAR L’ENQUÊTE CME SUR LES POLITIQUES
D’EFFICACITÉ ÉNERGÉTIQUE
Source: World Energy Council - ADEME survey 2016
The survey covers institutional aspects, as well as existing regulations and financial
measures. The measures considered in the survey are12:
Institutions and programmes
Institutions: agencies (national, regional and local), Ministerial departments for
energy efficiency;
National programmes of energy efficiency with quantitative targets;
Energy efficiency laws;
12 Measures to promote renewable energies and fuel substitution were not included. R&D activities, although important in the long term, are also excluded from the survey, as they are less important in emerging and developing countries.

WORLD ENERGY COUNCIL | PERSPECTIVES
16
Regulations
Labels for 5 domestic appliances (refrigerators, washing machines, Air Conditioning
(AC) lamps, water heaters), cars, existing and new buildings (both in residential &
public/commercial sector) and electric motors;
Minimum efficiency standards for electrical appliances (refrigerators, washing
machines, AC, lamps, water heaters, electric motors), cars and buildings (new and
existing in residential or public/commercial sectors);
Other regulations for consumers: mandatory energy audits, mandatory energy
managers, mandatory energy consumption reporting, mandatory energy saving
plan; energy saving quotas;
Energy savings obligation for energy companies with their consumers;
Financial and fiscal measures
Energy efficiency funds
Economic incentives: subsidies for energy audits by sector (industry,
commercial/public/residential buildings, transport companies); subsidies or soft
loans (i.e. loans with subsidised interest rates) for energy efficiency investment and
equipment by sector;
Fiscal measures: - tax credit or deduction on certain cars, appliances and buildings;
- accelerated depreciation for industry, tertiary or transport
sectors,
- tax reduction by type of equipment (appliances, cars, lamps,
etc.);
Cross-cutting measures
Energy Service Companies (ESCO)
Voluntary agreements
Mandatory training of professionals
Although energy pricing is an important component of energy efficiency policies, it was not
addressed in the survey, as there is an international data base to monitor price level and
trends13. In the same way measures related to information campaigns, training or
communication were not included to avoid overloading the survey, as they are common
everywhere and in addition, they often rely on regional/local initiatives, which makes them 13 IEA provides energy prices for OECD countries; Enerdata covers a selection of non-OECD countries.

ENERGY EFFICIENCY : A STRAIGHT PATH TOWARDS ENERGY
SUSTAINABILITY
17
difficult to track comprehensively. Measures related to information and communication are
discussed later in the report.
Content and structure of the report
Overall energy efficiency trends through macro indicators, energy efficiency key
achievements in the power sector and indicators by end-use sectors (industry, transport
and buildings), including CO2 emissions from energy use are analysed in the first part of
this report. The results of the policies and measures (P&M) survey are presented in the
second part in graphs showing the degree of implementation of the measures in four world
regions: Europe, Asia, America, Africa & Middle East. Based on these results a set of
recommendations have been agreed by the Council’s Energy Efficiency Knowledge
Network.
ENERGY EFFICIENCY : A STRAIGHT PATH TOWARDS ENERGY
SUSTAINABILITY
18
Chapter 2 Energy efficiency trends

ENERGY EFFICIENCY : A STRAIGHT PATH TOWARDS ENERGY
SUSTAINABILITY
19
2.1 OVERALL ENERGY EFFICIENCY TRENDS
Three types of energy efficiency indicators are analysed below to monitor the changes in
energy efficiency and to compare the energy efficiency status amongst the various
countries and regions: economic ratios, techno-economic ratios and indicators of diffusion.
i. Economic ratios, referred to as “energy intensities” in this report, are defined as
ratios between energy consumption, measured in energy units - tonnes of oil
equivalent/(toe) - and indicators of economic activity, measured in monetary units
at constant prices, Gross Domestic Product (GDP), value added, etc. Intensities
are used each time energy efficiency is measured at a high level of aggregation,
i.e. at the level of the whole economy or of a sector. To make these energy
intensities more comparable, they are all converted to purchasing power parities at
2005 prices. (Box 2).
ii. Techno-economic ratios are calculated at a disaggregated level (by sub-sector or
end-use) by relating energy consumption to an indicator of activity measured in
physical terms (tonnes of steel, number of passenger-kilometres, etc.) or to a
consumption unit (e.g. vehicle, dwelling, etc.). These techno-economic ratios are
called unit or specific energy consumption.
iii. The indicators of diffusion aim at monitoring the market penetration of energy
efficient technologies (e.g. share of cogeneration in industry and in total per capita
power generation, share of electric steel, installed area of solar water heaters14)
and practices (e.g. per capita mobility by rail transport).
A general indication of energy efficiency performance is given by the primary energy
intensity, which relates the total energy consumption of a region or a country to its GDP.
Primary energy intensity measures how much energy is required to generate one unit of
GDP15. The energy intensity is more an indicator of “energy productivity” than a true
indicator of efficiency from a technical point of view, as it reflects the effect on many factors
that are not directly linked to energy efficiency. Indeed, the energy intensity level is
influenced by the nature of economic and industrial activities (“economic structure”, i.e. the
shares of various sectors in the GDP), the primary energy mix (i.e. the share of coal, oil,
gas, biomass, other renewables and nuclear), the climate, the level of development, the
organisation of transport sector (in particular the importance of public transport), the
diffusion of household equipment and more generally lifestyles.
14 Solar water heaters are usually considered as energy saving devices as they save energy in consumer premises. 15 The energy intensity is generally considered to be a reliable indicator, as it is based on usual statistics, and easy to calculate and understand: therefore, it is very commonly used. However, its interpretation is sometimes questionable for the countries where part of their economic activity is informal (i.e. not accounted by the GDP) and where the use of traditional fuels is significant, as their consumption is usually not well monitored.

WORLD ENERGY COUNCIL | PERSPECTIVES
20
In addition to energy efficiency improvements at end-use level (equipment and buildings)
and in the energy sector (power generation, other energy production or transmission
activities), trends in energy intensities are influenced by changes of all these factors and
energy efficiency is one among many drivers of energy intensity trends; it is however
generally the major driver.
BOX 2 : ENERGY INTENSITIES AT PURCHASING POWER PARITIES
GDP and value added data for all countries and regions are converted at purchasing
power parities (PPP) to reflect differences in general price levels. Using PPP instead
of exchange rates increases the value of GDP in regions with a low cost of living (i.e.
most emerging countries), and therefore decreases their energy intensities16
(Figure 5). Energy intensities at PPP are more relevant for comparisons as they
relate the energy consumption to the real level of economic activity and life styles.
The use of PPP narrows the gap of energy intensities between countries and regions
with different levels of economic development, compared to what would be shown
by any exchange rates. As the intensities are measured at constant prices and
parities, the use of PPP changes the intensities’ levels but does not affect their
trends at country level17
FIGURE 5 : PRIMARY ENERGY INTENSITY: PURCHASING POWER PARITIES
VS EXCHANGE RATES (2014)
INTENSITÉ ÉNERGÉTIQUE PRIMAIRE : PARITÉS DE POUVOIR D’ACHAT VS
TAUX DE CHANGE (2014)
* Data for 2013
Source: Enerdata based on PPP values from World Bank
16 On average, for non-OECD countries the GDP at 2005 purchasing power parties is 2.3 times higher than if it is expressed at 2005 exchange rates (factor 3 for India and 2.4 for China). 17 The trend at world or region level may be however affected by differences in the GDP growth of countries with different intensities.

ENERGY EFFICIENCY : A STRAIGHT PATH TOWARDS ENERGY
SUSTAINABILITY
21
The world economic crisis lowered the energy productivity
improvement in most regions
The primary energy intensity has been decreasing at world level in all regions, except the
Middle East. Since 2008, the world economic crisis had a strong impact on the overall
energy productivity improvement in most regions, except Other Asia and Europe: at world
level, the energy intensity has decreased less rapidly since 2008 (1.3% per annum versus
1.6% per annum between 2000 and 2008) (Figure 6). This is mainly due to the fact that part
of the energy consumption is not linked to the level of economic activity. In the Middle East,
energy consumption has always been increasing faster than GDP, mainly because of a
rapid development of energy intensive industries and air conditioning18.
FIGURE 6: VARIATION OF PRIMARY ENERGY INTENSITY BY WORLD
REGION
VARIATION DE L'INTENSITÉ ÉNERGÉTIQUE PRIMAIRE PAR RÉGION DU
MONDE
Source: Enerdata
CIS region and China experienced the strongest improvement in energy productivity, 3.3%
and 2.5% per annum on average since 2000. The improvement is the result of various
factors: more efficient use of coal, switch from coal to oil and gas, industry restructuring
(rapid growth of equipment manufacturing industries), closure of old facilities and higher
energy prices (until 2014). More than 80% of the countries in the world19 have increased
their energy productivity (i.e. decreased their energy intensity) (Figure 7). Since 2000 this
primary energy intensity decreased by more than 3% per annum in 11 countries (e.g. 17%
of surveyed countries).
18 This rapid growth of air conditioning is driving electricity use that leads to increased losses in thermal power plants. 19 Based on a sample of 96 countries.

WORLD ENERGY COUNCIL | PERSPECTIVES
22
Energy intensity trends over a given period can be influenced by climatic differences
between the first and last year of the period in countries where space heating or cooling
account for a significant share of the total consumption (e.g. Europe, North America, CIS).
For that reason, it is preferable to work with intensities in normal climate (Box 3). As the
data on temperature degree days are available for all countries only since 2005 it was not
possible to account for the impact of climate variations on the indicators.
FIGURE 7: TRENDS IN PRIMARY ENERGY INTENSITY (2000-2014) (PERCENT
PER ANNUM)
TENDANCES D’INTENSITÉ ÉNERGÉTIQUE PRIMAIRE (2000-2014)
Source: Enerdata
BOX 3 : INFLUENCE OF CLIMATIC CORRECTIONS
In countries with heating requirement, years with cold winters will have a higher
consumption than years with mild winters. This is the same for warm years for air
conditioning. Correcting energy consumption trends for the fluctuations due to
climate is achieved by adjusting the part of consumption used for space heating and
air conditioning. Such corrections are based on degree-days which measure for each
day of the heating or cooling period, the difference between the outdoor temperature
and a reference room temperature20. Over the period 2010-2014, the impact of climate
was mainly significant for Europe: the intensity at normal climate decreases 25%
less than the actual value (2.4% per annum compared to 3.4% per annum); indeed
2014 was much warmer than 2010 (Figure 8).
20 For instance, for heating the usual reference temperature is 18 °C and the number of heating degree days is defined as the sum of the difference 18 – T for each heating day, where T is the average temperature of the day.

ENERGY EFFICIENCY : A STRAIGHT PATH TOWARDS ENERGY
SUSTAINABILITY
23
0
2000
4000
6000
8000
10000
12000
14000
16000
18000
2000 2001 2002 2003 2004 2005 2006 2007 2008 2009 2010 2011 2012 2013 2014
Gto
e
Consumption Avoided consumption
FIGURE 8 : INFLUENCE OF CLIMATIC CORRECTIONS ON THE PRIMARY
ENERGY INTENSITY (2010-2014)
INFLUENCE DES CORRECTIONS CLIMATIQUES SUR L’INTENSITÉ
ÉNERGÉTIQUE PRIMAIRE
Source: Enerdata
Energy productivity improvements avoided 7 Gt CO2 in 2014 at the
world level
Energy productivity improvements since 2000 avoided an energy consumption of 3.1 Gtoe
in 201421 at world level, with China accounting for 40% (Figure 1). These improvements
also reduced CO2 emissions by 7 Gt CO2 in 2014.
FIGURE 9: AVOIDED ENERGY CONSUMPTION FROM ENERGY INTENSITY
DECREASE AT WORLD LEVEL
* Avoided consumption is calculated as the difference between a fictive consumption at 2000 (or 1990)
energy intensity and the actual energy consumption.
Source: Enerdata
21 At 2000 energy intensity by main region (i.e. at technologies and economic structure of 2000), world energy consumption would have been 3.1 Gtoe higher in 2014

WORLD ENERGY COUNCIL | PERSPECTIVES
24
Large disparities in the amount of energy used per unit of GDP
among regions
Europe22 is the region with the lowest primary energy intensity at purchasing power parities,
followed closely by Latin America and OECD Asia (Figure 10 and Figure 11). The CIS uses
almost 3 times more energy per unit of GDP than Europe, while in China the energy
intensity is almost twice higher than the average in Europe. Highest energy intensities can
be attributed to various factors, including the dominant role of energy intensive industries
(China and the Middle East), the fuel mix (especially for power generation) and energy
efficiency. Oil producing countries have generally low energy prices which attract energy
intensive industries and inefficient equipment and practices.
FIGURE 10: PRIMARY ENERGY INTENSITY LEVELS BY WORLD REGION
(2014)
INTENSITÉ ÉNERGÉTIQUE PRIMAIRE PAR RÉGION DU MONDE
Source: Enerdata
FIGURE 11: PRIMARY ENERGY INTENSITY LEVELS BY COUNTRY (2014)
INTENSITÉ ÉNERGÉTIQUE PRIMAIRE PAR PAYS
Source: Enerdata
22 Including in total 34 countries.

ENERGY EFFICIENCY : A STRAIGHT PATH TOWARDS ENERGY
SUSTAINABILITY
25
Figure 12 shows how much each economic activity sector contributes to the primary energy
intensity. The high contribution of energy transformation and industry explains part of the
higher energy intensity of CIS, China and Middle-East (transformation: 40% in CIS, 35% in
Middle-East and China; industry around 33% in China). In Africa, the dominant use of low
efficiency biomass in the residential sector explains the dominance of the building sector
and its high energy intensity. Surprisingly, transport has a lower influence on energy
intensity levels (except in The Middle-East and North America).
FIGURE 12 : CONTRIBUTION OF SECTORS TO PRIMARY ENERGY
INTENSITY (2014)*
CONTRIBUTION DES SECTEURS À L’INTENSITÉ ÉNERGÉTIQUE PRIMAIRE
* Energy consumption per sector related to GDP measured at purchasing power parities
** Data for 2013
Source: Enerdata
About 15% of energy productivity improvements at the final
consumer level offset by higher conversion losses
The final energy intensity corresponds to the energy consumed per unit of GDP by final
consumer uses. Compared to the primary intensity, it excludes consumption and losses in
energy conversion, mainly in power generation, and non-energy uses.
The final energy intensity at world level decreased more rapidly than the primary energy
intensity - 1.7% vs 1.5% per annum between 2000 and 2014 (Figure 13). In other words,
energy productivity improved 15% more rapidly at the level of final consumer than at the
overall level. This means that 15% of the energy productivity was offset by increasing
losses in energy conversion, mainly power generation. These growing losses in power
generation are not due to the fact that power generation is less efficient (see section below)
but rather to the rapid growth of electricity consumption, as electricity is predominantly
produced by thermal power plants, with 60-70% of losses. The share of electricity in final
energy consumption rose from 15% in 2000 to 18% in 2014 at world level; in China and
other Asia, the electricity penetration was even more rapid (from 10 to 20% in China or 10%
to 15% in other Asia).

WORLD ENERGY COUNCIL | PERSPECTIVES
26
In Europe and North America, trends in primary and final intensities were very similar due
to the fact that energy conversion losses were stabilised by the increasing share of more
combined-cycle plants and cogeneration.
FIGURE 13 : VARIATION OF PRIMARY AND FINAL ENERGY INTENSITY23
(2000-2014)
VARIATION DE L’INTENSITÉ PRIMAIRE ET FINALE (2000-2014)
Source: Enerdata
With the exception of CIS, the higher the Human Development Index24, the lower the
energy intensity (Figure 14).
Changes in the economic structure influence final energy
intensities
Changes in the economic structure influence variations in final energy intensities. For
example, all things being equal, the increasing share of services in the GDP will decrease
final energy intensities, as the energy intensity of services is six times lower than in industry
at world level25. In other words, it requires six times less energy to produce one unit of GDP
activity in services than in industry. The effect of structural changes is especially important
in countries with rapid economic growth. These structural changes are generally not the
result of energy efficiency policies and need to be excluded from the analysis to evaluate
the effect of energy efficiency policies more accurately.
23 Non energy uses are excluded from the final energy intensity. 24 The Human Development Index (HDI) from UNDP is a summary measure of average achievement in key dimensions of human development: a long and healthy life, being knowledgeable and having a decent standard of living. The HDI is the geometric mean of normalized indices for each of the three dimensions. 25 In OECD countries, the difference in these intensities is around 4.5 to 6 depending on the country or region. In non-OECD countries it is even higher, around or above 10.

ENERGY EFFICIENCY : A STRAIGHT PATH TOWARDS ENERGY
SUSTAINABILITY
27
Size of bubble = energy consumption/cap
CIS
North America
Latin America
China
India
Europe
Africa
Middle East
World
0.05
0.10
0.15
0.5
Fin
al in
ten
sity
(ko
e/$
20
05
at
pp
p)
Human Development Index (HDI)
OECD Asia
FIGURE 14 : FINAL ENERGY INTENSITY, HDI, ENERGY
CONSUMPTION/CAPITA (2014)
INTENSITÉ ÉNERGÉTIQUE FINALE, IDH ET CONSOMMATION FINALE PAR
HABITANT
Source: Enerdata; HDI averages by world region weighted by population calculated by Enerdata from UNDP
Correcting energy intensity trends for the influence of structural changes is done by
calculating final energy intensity at constant GDP structure26: the difference in the variations
of this actual final energy intensity and a theoretical intensity at constant GDP structure
shows the influence of structural changes in the economy.
In Africa, India and China, the final intensity decreased faster than the intensity at constant
structure (Figure 15). This means that part of the energy productivity improvement was due
to an increasing share of less energy intensive sectors in the economy. Thus, changes in
the GDP structure explain around 1/4 of the final energy intensity decrease in Africa and
around 20% in India and China, due to an increasing importance of services in the GDP (up
by 4% in Africa, 12% in India and 5% in China). At world level, the effect of structural
changes was marginal. In CIS, However, structural changes were in the opposite direction
and contributed to increase the final energy intensity.
26 The energy intensity at constant GDP structure is calculated by assuming a constant share of agriculture, industry and services in the GDP as well as of the private consumption for households in the GDP.

WORLD ENERGY COUNCIL | PERSPECTIVES
28
FIGURE 15 : ROLE OF STRUCTURAL CHANGES IN THE GDP (2000-2014)
RÔLE DES CHANGEMENTS STRUCTURELS DANS LE PIB
Source: Enerdata
Comparisons of primary energy intensities are more relevant after
adjustments
In the same way, differences in primary intensity levels can be explained by differences in
GDP structure. The share of industry in the GDP varies from 20% to 22% in North America
and Europe, to approximately 30% in other regions, and over 40% in China (2014). The
share of services varies from 39% in China, to around 50% in CIS, India and Africa, 65% in
Europe and 72% in North America.
Differences in the fuel mix can also contribute to the intensity level: the fuel mix varies
significantly with the share of coal and nuclear - the least efficient power generation
technologies27 - between 74% in China (whereof 71% from coal) or 64% in India to 5% in
Latin America, where hydropower plays a leading role.
Comparison of energy intensities can be easily improved by several adjustments that are
easy to quantify. After adjustment to the same GDP structure, same climate and same fuel
mix, the ranking of regions slightly changes: Other Asia becomes the region with the lowest
intensity followed by Europe and Latin America (Figure 16). The difference between regions
gets narrower (range of 2.3 between the highest and lowest values compared to a factor of
2.8 without adjustment). The remaining gaps are due to differences in industry structure,
lifestyles and, above all, energy efficiency.
27 The efficiency of nuclear power is 33% and coal around 35%.

ENERGY EFFICIENCY : A STRAIGHT PATH TOWARDS ENERGY
SUSTAINABILITY
29
FIGURE 16 : PRIMARY ENERGY INTENSITY ADJUSTED TO EU FUEL MIX
(2014)
INTENSITÉ PRIMAIRE AJUSTÉE AU MÊME MIX ÉLECTRIQUE QUE
L’EUROPE
Source: Enerdata

WORLD ENERGY COUNCIL | PERSPECTIVES
30
2.2 ENERGY EFFICIENCY ACHIEVEMENTS IN THE POWER SECTOR
Slow improvement of the average efficiency of thermal power
generation
Energy efficiency of thermal power generation improved by 0.9% since 2000 at world level
reaching an average value of 36.5% in 2014. This is far below the OECD Asia or North
America average (both above 40%) or world best practice: Spain with 45% due to a high
penetration of CCGT, combined cycle gas turbines (Figure 17). The greatest improvements
can be seen in China with the commissioning of new efficient coal plants, as well as in
North and Latin America with the spread of CCGT. At world level, CCGT represent 19% of
the installed thermal power generation capacity, a rise of 10% since 2000 (reaching 34% in
Europe and over 30% in Latin America).
FIGURE 17 : TRENDS IN THE AVERAGE EFFICIENCY OF THERMAL POWER
EVOLUTION DU RENDEMENT MOYEN DES CENTRALES THERMIQUES
Source: Enerdata

ENERGY EFFICIENCY : A STRAIGHT PATH TOWARDS ENERGY
SUSTAINABILITY
31
FIGURE 18 : AVERAGE EFFICIENCY OF THERMAL POWER PRODUCTION
BY COUNTRY (PERCENT IN 2014)
RENDEMENT MOYEN DES CENTRALES THERMIQUES PAR PAYS
Source: Enerdata
As hydro, wind and solar power generation are accounted for in energy statistics with an
efficiency of 100%, the penetration of renewables in electricity production is improving the
average efficiency of power generation. The share of renewables in electricity production is
increasing at world level thanks to wind and solar (Figure 19). Europe experienced the
highest penetration of wind and solar, which together reached almost 10% of power
generation capacity in 2014 (4% at world level).
FIGURE 19: SHARE OF RENEWABLE IN ELECTRICITY PRODUCTION
PART DES RENOUVELABLES DANS LA PRODUCTION D’ÉLECTRICITÉ
Source: Enerdata
WORLD ENERGY COUNCIL | PERSPECTIVES
32
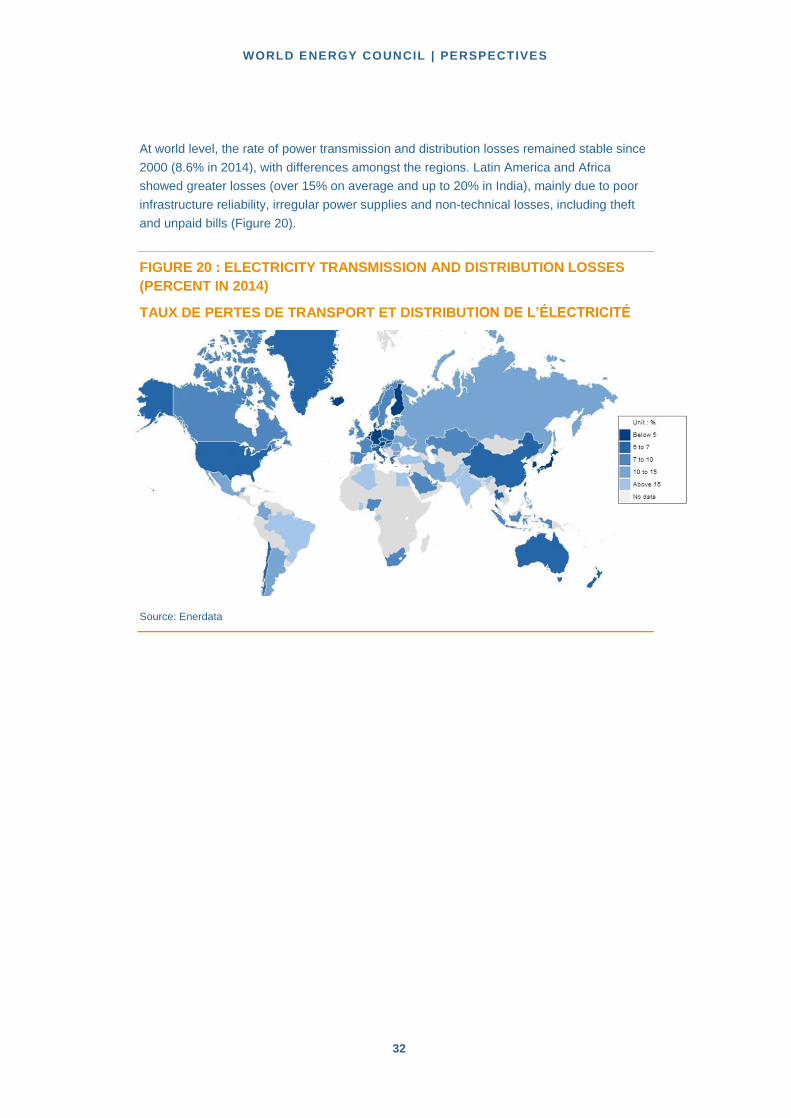
At world level, the rate of power transmission and distribution losses remained stable since
2000 (8.6% in 2014), with differences amongst the regions. Latin America and Africa
showed greater losses (over 15% on average and up to 20% in India), mainly due to poor
infrastructure reliability, irregular power supplies and non-technical losses, including theft
and unpaid bills (Figure 20).
FIGURE 20 : ELECTRICITY TRANSMISSION AND DISTRIBUTION LOSSES
(PERCENT IN 2014)
TAUX DE PERTES DE TRANSPORT ET DISTRIBUTION DE L’ÉLECTRICITÉ
Source: Enerdata

ENERGY EFFICIENCY : A STRAIGHT PATH TOWARDS ENERGY
SUSTAINABILITY
33
2.3 ENERGY EFFICIENCY ACHIEVEMENTS IN INDUSTRY
Towards a decrease in industrial intensity
Since 2000, the general trend in industry is towards a decrease in the energy required per
unit of value added (Figure 21). It is explained by a combined effect of energy efficiency
gains and structural changes towards less energy intensive industries, except in the Middle
East, where the increasing trend is mainly linked to an opposite structural change with a
greater role of energy intensive industries. Since 2008, there is a net slowdown in the
intensity reduction in most regions and at world level, because of the global crisis, from
1.6% per annum between 2000 and 2007 to about 1% per annum since 2007. In regions
the most hit by the economic slowdown, the energy consumption did not follow the
contraction of production, as industrial plants were not operating at full capacity and as part
of this consumption is independent of the level of production.
FIGURE 21: ENERGY CONSUMPTION OF INDUSTRY PER UNIT OF VALUE
ADDED
INTENSITÉ ÉNERGÉTIQUE DE L’INDUSTRIE PAR UNITÉ DE VALEUR
AJOUTÉE
** year 2013 for Other Asia
Source: Enerdata (index based on intensities at purchasing power parities in koe/$2005)
Trends in the energy intensities are first of all influenced by energy efficiency improvements
at the level of each individual branch e.g. steel, chemicals, non-metallic minerals.

WORLD ENERGY COUNCIL | PERSPECTIVES
34
They are also affected by structural changes in the industrial activity (i.e. changes in the
share of the different branches in the industrial value added). In countries or regions with a
growing importance of energy intensive industries (e.g. The Middle East28), such a trend
will, all things being equal, contributes to increase the energy intensity of the industry. On
the contrary, a greater specialisation of industrial activities on less intensive branches, such
as the production of electrical equipment or textiles, will lower the energy intensity. This
was the case for instance for the EU where around 20% of the intensity decrease in
manufacturing industry since 2000 was due to structural changes29.
Even if these intensities are converging because of the globalisation of industrial activities,
there are still large differences between regions due to differences in energy efficiency and
industry specialisation: for instance, intensities are around 2 to 2.5 times higher in CIS or
China compared to Europe, even though these two regions experienced a strong reduction
of their industrial intensity.
Most of the energy consumption in industry is concentrated on a few energy intensive
branches, such as steel, cement, paper and chemicals (typically 60-70%). Benchmarking of
energy efficiency performance for these branches is usually done on the basis of their
specific energy consumption. To be closer to energy efficiency, such comparison should be
done at similar process/product mix.
For instance, to compare the countries’ energy efficiency performance in steel production, it
is necessary to account for the differences in the process mix: countries with 100%
production with the electric furnace process will have, all things being equal, a much lower
specific energy consumption than countries with a large proportion of steel produced with
the energy intensive oxygen process.
Figure 22 indicates the average consumption per tonne of steel in relation to the share of
the electric process for selected countries. Only groups of countries with a similar process
mix can be compared. There are large gaps between countries with similar process mix:
Russia, Brazil, Japan, Australia and UK can be compared, with UK having the lowest
specific consumption. Best practices are not always in OECD countries because of
globalisation, as new more efficient plants are more often built in emerging countries. The
distance of each country to the world’s best practice (red line) gives an estimate of the
potential of energy efficiency improvement that can be achieved with the existing process
mix. An additional energy saving potential can be achieved by increasing the share of the
electric process.
28 This was also the case in Brazil and Uruguay as calculated in the BIEE project of UN ECLAC http://www.cepal.org/drni/biee. 29 Source: ODYSSEE data base.

ENERGY EFFICIENCY : A STRAIGHT PATH TOWARDS ENERGY
SUSTAINABILITY
35
FIGURE 22: AVERAGE ENERGY CONSUMPTION PER TONNE OF STEEL
(2014)
CONSOMMATION UNITAIRE PAR TONNE D’ACIER (2014)
Source: Enerdata
For cement, most of the energy consumption (more than 80%) goes to the fabrication of
clinker. As cement is produced by mixing clinker and additives (e.g. ashes), the energy
performance of cement production depends on the efficiency of clinker production, but also
on the composition of cement (share of additives) and the share of clinker produced in the
country. Thus the lower the ratio clinker/cement production, the lower the specific
consumption30. Comparisons should be made at similar ratios.
Figure 23 displays the specific energy consumption of cement as a function of the ratio
clinker/cement. Distance to the red line (world best practice) indicates the potential for
energy savings. Again, only countries with a similar ratio of clinker/cement can be
compared: for instance, among the countries with a ratio around 80%/85% which include
China, Poland, France, UK and EU, China demonstrates the best performance.
30 Case of countries with a high proportion of additives and/or importing part of the clinker.

WORLD ENERGY COUNCIL | PERSPECTIVES
36
France
GermanyBrazil
Canada
China
USA
Italy
UK
India
Italy
0.00
0.02
0.04
0.06
0.08
0.10
0.12
0.14
60% 65% 70% 75% 80% 85% 90% 95% 100%
toe/
t
Ratio clinker /cement
World
EU
Thailand
Poland
World best practice
FIGURE 23 : ENERGY CONSUMPTION PER TONNE OF CEMENT (2013)
CONSOMMATION UNITAIRE PAR TONNE DE CIMENT
Source: Enerdata based on data from WBCSD, Global Cement Database on CO₂ and Energy Information
"Getting the Numbers Right" (GNR), http://www.wbcsdcement.org/GNR-2013/index.html

ENERGY EFFICIENCY : A STRAIGHT PATH TOWARDS ENERGY
SUSTAINABILITY
37
2.4 ENERGY EFFICIENCY ACHIEVEMENTS IN TRANSPORT
The decrease in transport sector in OECD driven by lower
car ownership combined with improvement in specific
consumption of cars
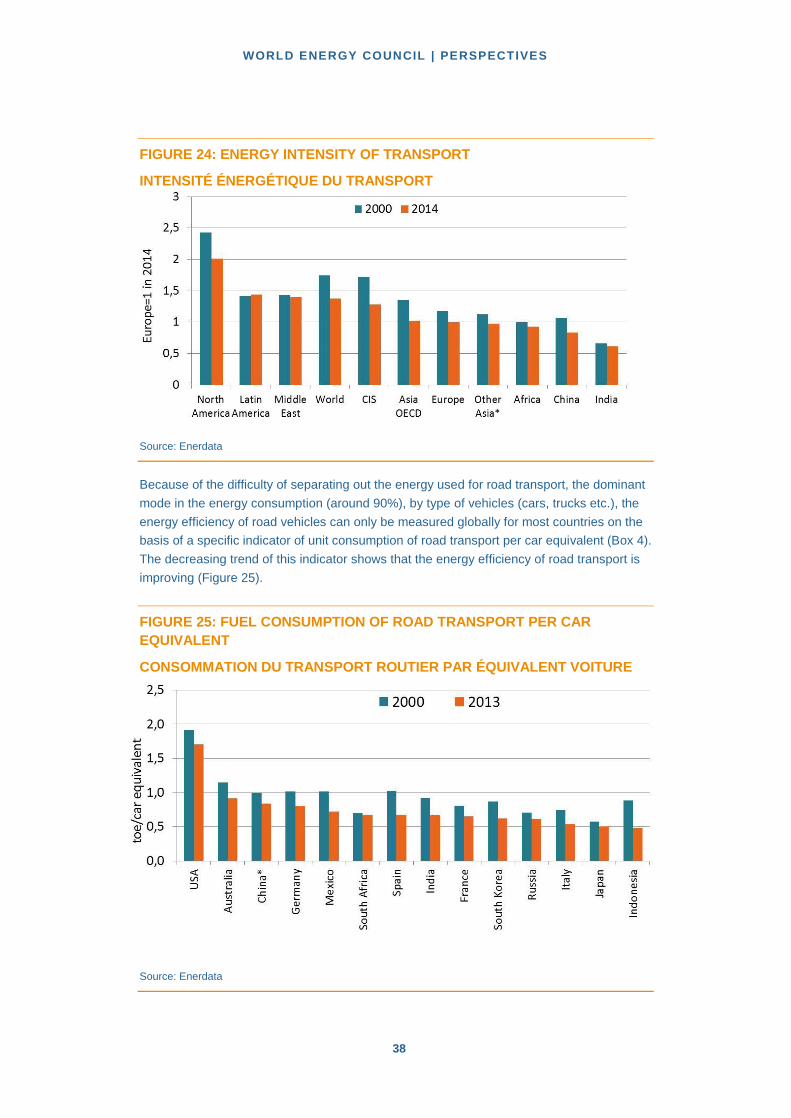
There is no good indicator to reflect the overall energy efficiency trend in the transport
sector, mainly because of the variety of transport modes. The most common indicator is the
energy intensity, i.e. the energy consumed in transport per unit of GDP, as transport
activities take place in all sectors. North America is the region with the highest intensity in
transport31: 80% over the world average and 2.5 times higher than in Europe, OECD Asia,
other Asia and Africa (Figure 24). The US situation results from a combination of factors,
such as the dominant role of cars for passenger transport with larger and less efficient cars,
the highly developed air transport linked to the size of the country etc. Latin America, the
Middle East and CIS are also above the world average: in these regions low motor fuel
prices and a lower development of public transport (at least in Latin America and the Middle
East) explain a higher intensity. In China and India, because of a lower car ownership and
the dominant role of rail transport for the transport of goods, the energy intensity is low
compared to the other regions.
In most regions and at world level, this energy intensity is decreasing over time, which
means that the energy consumption of transport is growing much slower than the GDP. In
OECD countries this trend is due to the combination of two main drivers: lower growth of
car ownership and traffic, due to the saturation, and significant improvement in cars’ energy
efficiency linked to the policy measures implemented for new cars. In other regions, the
introduction of standards on vehicles (e.g. China) and labelling schemes start to have an
impact.
31 In the ODYSSEE project for Europe, an alternative indicator is used, which combines in a single index the energy efficiency trends by mode (ODEX) (see www.odyssee.indicators.org).
WORLD ENERGY COUNCIL | PERSPECTIVES
38
FIGURE 24: ENERGY INTENSITY OF TRANSPORT
INTENSITÉ ÉNERGÉTIQUE DU TRANSPORT
Source: Enerdata
Because of the difficulty of separating out the energy used for road transport, the dominant
mode in the energy consumption (around 90%), by type of vehicles (cars, trucks etc.), the
energy efficiency of road vehicles can only be measured globally for most countries on the
basis of a specific indicator of unit consumption of road transport per car equivalent (Box 4).
The decreasing trend of this indicator shows that the energy efficiency of road transport is
improving (Figure 25).
FIGURE 25: FUEL CONSUMPTION OF ROAD TRANSPORT PER CAR
EQUIVALENT
CONSOMMATION DU TRANSPORT ROUTIER PAR ÉQUIVALENT VOITURE
Source: Enerdata

ENERGY EFFICIENCY : A STRAIGHT PATH TOWARDS ENERGY
SUSTAINABILITY
39
BOX 4 : CONSUMPTION OF ROAD TRANSPORT PER CAR EQUIVALENT
The consumption of road transport per car equivalent relates the total consumption
of road transport to the total fleet of vehicles measured in car equivalent. With this
indicator, the total fleet of vehicles is not calculated by adding all types of vehicles
(i.e. cars, bus, trucks and light vehicle, and two-wheelers) but by adding their
number measured in car equivalent. For instance, if a bus consumes on average 15
times more fuel per year than a car it is equivalent to 15 cars. The default values
used for the calculation are: 1 bus = 15 cars; 1 truck and light vehicle = 4 cars; 1 two-
wheeler = 0.15 cars.
Energy efficiency improvements can be evaluated more accurately with the variation
of the unit consumption per car-equivalent, as it discounts the effect of changes in
the vehicle fleet (Figure 26).
FIGURE 26: TRENDS IN ROAD TRANSPORT CONSUMPTION (2000-2013,
PERCENT PER ANNUM)
TENDANCES DE CONSOMMATION DU TRANSPORT ROUTIER PAR
ÉQUIVALENT VOITURE
Source: Enerdata
There is a rapid decrease in the specific consumption of new cars in many countries thanks
to the implemented measures: mandatory standards in many OECD countries and
emerging countries (e.g. China, Mexico), labelling, fiscal and financial incentives and
voluntary agreements (Figure 27). For instance, in EU and Japan, the specific consumption
of new cars has decreased regularly since 1995 (by about 20%). This trend is expected to
continue because of the ambitious targets set for 2020 and 2025.

WORLD ENERGY COUNCIL | PERSPECTIVES
40
FIGURE 27: SPECIFIC CONSUMPTION OF NEW CARS (LITRES/100KM)32
CONSOMMATION SPÉCIFIQUE DES AUTOMOBILES NEUVES
Source: Enerdata, from ODYSSEE, ICCT. Data for year 2015 correspond to national targets.
Due to their higher energy efficiency and lower carbon emissions compared to road
transport, railways are an important for sustainable mobility and energy efficiency. The
promotion of rail transport around the world to meet current and future challenges of
mobility is becoming important. Today, there are large differences between countries in the
mobility by train reflecting different priorities given to development of rail infrastructures and
availability of high-speed trains. Japan is by far the country with the highest mobility by rail,
with 3,000 km per annum per capita on average, followed by France, with 1,500 km per
capita (Figure 28). Almost everywhere, this type of mobility is growing.
FIGURE 28: PER CAPITA RAIL MOBILITY33 (KM PER INHABITANT)
MOBILITÉ FERROVIAIRE PAR TÊTE (KM PAR HABITANT)
Source: Enerdata
32 Test values. 33 This indicator corresponds to the rail passengers transport in passengers-km divided by the population.

ENERGY EFFICIENCY : A STRAIGHT PATH TOWARDS ENERGY
SUSTAINABILITY
41
2.5 ENERGY EFFICIENCY ACHIEVEMENTS IN BUILDINGS
Improvement in specific consumption for residential buildings at
global level
The average amount of energy consumed per household is decreasing almost everywhere
(by approximately 0.4% per annum at world level since 2000), except in the Middle East,
where air conditioning is driving energy use and in China due to fast growth in electrical
appliances ownership and increased thermal comfort (Figure 29). In OECD countries, the
main driver is energy efficiency improvement for space heating and electrical appliances
thanks to the implementation of tightening building codes and minimum energy
performance standards (MEPS) for appliances, coupled with financial incentives to promote
thermal retrofitting of existing dwellings and the use of more efficient heating appliances
(e.g. gas condensing boilers, heat pumps). In Latin American and African countries, the
main driver of the reduction in the energy consumed per household is the substitution of
biomass with modern fuels for cooking.
FIGURE 29: ENERGY CONSUMPTION PER HOUSEHOLD
CONSOMMATION D’ÉNERGIE PAR MÉNAGE
Source: Enerdata
The average consumption of electricity for appliances and lighting per electrified household
is very diverse depending on the level of ownership of electrical appliances34: from
1,000 kWh/ household in India to 8,000 kWh in North America. For countries with a similar
level of development, and thus assumed similar level of appliance ownership, there is no 34 The electricity consumption per household exclude thermal uses (mainly space heating): so it mainly corresponds to appliances and lighting. It is related to the number of electrified households to make the comparison more meaningful between OECD and non OECD countries.

WORLD ENERGY COUNCIL | PERSPECTIVES
42
obvious correlation between the electricity consumption per electrified dwelling and the
electricity price level. For the same price level, measured at purchasing power parities (for
example around 20U$c/kWh), the range is quite large, from 2,000 kWh in Italy to above
4,000 kWh in Japan (Figure 30). However, the high price of electricity in Germany explains
partly its lower specific consumption compared to other OECD countries with a similar level
of development.
This specific consumption is generally growing in emerging countries with the spread of
appliances, whereas in OECD countries it is stable or even decreasing because of the strict
policies for appliances and also because of a relative saturation in appliance ownership.
For instance, the specific consumption has been decreasing by 0.8% per annum in the EU
between 2010 and 2014 and by more than 2% per annum in UK and Canada35. Emerging
countries also have implemented the same policies later, but the impact can already be
seen from a slowdown in the consumption growth in recent years.
FIGURE 30: ELECTRICITY CONSUMPTION PER ELECTRIFIED HOUSEHOLD*
AND PRICE OF ELECTRICITY(2014)
CONSOMMATION D’ÉLECTRICITÉ PAR MÉNAGE ÉLECTRIFIÉ ET PRIX
D’ÉLECTRICITÉ
Source: Enerdata;* excluding space heating.
35 https://www.World Energy Council-indicators.enerdata.eu/secteur.php#/specific-electricity-use.html

ENERGY EFFICIENCY : A STRAIGHT PATH TOWARDS ENERGY
SUSTAINABILITY
43
In the service sector (public administration, commerce and other service activities), where
electricity is generally the main source of energy, the electricity required to generate one
unit of value added (the electricity intensity) is increasing in most regions. This trend is
mainly linked to the development of information and communication technologies (ICTs)
and air conditioning. There is still a large discrepancy among countries: by a factor 3.5
between North America and India or Africa (Figure 31).
FIGURE 31: ELECTRICITY INTENSITY OF SERVICE SECTOR
CONSOMMATION D’ÉLECTRICITÉ PAR EMPLOYÉ DANS LE TERTIAIRE
Source: Enerdata

WORLD ENERGY COUNCIL | PERSPECTIVES
44
2.6 CO2 EMISSIONS FROM ENERGY COMBUSTION
Significant and increasing share of China and India in world CO2
emissions
With the strong economic growth in emerging countries, and thus in their CO2 emissions,
the share of OECD countries and CIS in world CO2 emissions from energy combustion has
dropped from 71% in 1990 to 44% in 2014. China’s contribution to these global emissions
increased by 17% (from 12% to 29%) and India’s 4% (Figure 32).
FIGURE 32: DISTRIBUTION OF WORLD CO2 EMISSIONS FROM ENERGY USE
(1990 AND 2014)
RÉPARTITION DES ÉMISSIONS DE CO2 MONDIALES LIÉES À L’ÉNERGIE
Source: Enerdata
CO2 emissions from energy use have increased by 51% at world level since 1990
(Figure 33). Trends in CO2 emissions vary significantly between regions: China and India
have registered a very rapid increase (above 130% since 2000) because of their high
economic growth with a tripling of emissions in both countries. On the other hand, there is a
reverse trend in Europe where the emissions were 22% lower in 2014 than in 1990 (and
16% lower than in 2000), mainly thanks to the effective energy efficiency and renewables
policies and since 2008, because of the economic recession. There is a low increase in

ENERGY EFFICIENCY : A STRAIGHT PATH TOWARDS ENERGY
SUSTAINABILITY
45
-50%
0%
50%
100%
150%
200%
250%
300%
350%
China India MiddleEast
Africa OtherAsia*
LatinAmerica
World AsiaOECD
CIS NorthAmerica
Europe
2000-2014 1990-2014
North America, with a 9% reduction since 2007, due to the replacement of coal by gas in
power generation, as a result of the boom of shale gas. In China, India and at world level,
the increase is even more rapid increase since 2000 than between 1990 and 2000.
FIGURE 33: VARIATION OF CO2 EMISSIONS FROM ENERGY USE
VARIATION DES ÉMISSIONS DE CO2- ÉNERGIE
Source: Enerdata
CO2 emissions per capita (from energy combustion) vary by a factor 17 between North
America and the less developed region, Africa (Figure 34), where they are below 1 tonne
CO2/cap in Africa, less than 2 tonnes in other Asia and India, 6 tonnes for Europe and
China, 8 tonnes for the Middle East and the CIS, 10 tonnes in Asia & Pacific OECD and
near 16 tonnes in North America.
FIGURE 34: EMISSIONS CO2 PER CAPITA FROM ENERGY COMBUSTION36
EMISSIONS DE CO2-ÉNERGIE PAR HABITANT
36
The size of colored area represents the total emissions of countries or regions.
Source: Enerdata

WORLD ENERGY COUNCIL | PERSPECTIVES
46
There is a reduction in CO2 intensity all over the world. And most of this reduction was
driven by a decrease in energy intensity and not by a change in the fuel mix, especially in
Africa, at world level, in CIS and in Europe (Figure 35). In Asia, substitutions to fuels with
higher CO2 content (e.g. coal) have offset part of the effect of the energy intensity
reduction.
FIGURE 35: VARIATION IN CO2 INTENSITY (2000-2014): IMPACT OF ENERGY
EFFICIENCY AND FUEL SUBSTITUTIONS
VARIATION DE L’INTENSITÉ EN CO2 (2000-2014) : IMPACT DE
L’EFFICACITÉ ÉNERGÉTIQUE ET DE LA SUBSTITUTION D’ÉNERGIE
Source: Enerdata

ENERGY EFFICIENCY : A STRAIGHT PATH TOWARDS ENERGY
SUSTAINABILITY
47
Chapter 3 Energy efficiency policies: common, current and innovative practices

WORLD ENERGY COUNCIL | PERSPECTIVES
48
3.1 A STRONGER INSTITUTIONAL CONTEXT
There are two main questions related to the institutional setting of energy efficiency policies
and their implementation.
Firstly, what is the degree of commitment to energy efficiency? This can be
monitored by quantitative targets to be achieved in the framework of the energy
efficiency programme, as well as by energy efficiency laws.
Secondly, are there institutions supporting the implementation of programmes in the
different countries? This can be assessed through the existence of national and
regional energy efficiency specific institutions (e.g. agencies).
3.1.1 MORE THAN 50% OF COUNTRIES HAVE IMPLEMENTED NATIONAL ENERGY EFFICIENCY LAWS
The adoption of energy efficiency laws or energy laws with a strong component related to
energy efficiency is becoming a common approach worldwide to consolidate the
institutional commitment to energy efficiency. A law gives a more durable status to energy
efficiency policies as changing an existing law may often be a complex process. Energy
efficiency laws may avoid to a certain extent the “stop and start” on energy efficiency
policies linked to political changes.
Often these laws provide a legal framework for the adoption of targets or other regulations,
such as labelling, MEPS (e.g. Kenya, New Zealand, Singapore, etc.), obligations for large
consumers (e.g. India) or even energy savings obligation for utilities (e.g. France, China) or
energy audits (e.g. Ireland). Energy efficiency law may also provide a legal framework for
setting up an energy efficiency fund (e.g. Thailand, Uruguay). 50 World Energy Council’s
member countries have implemented energy efficiency laws and four countries are
developing the law (Figure 36); compared to the previous survey in the 2013 edition of the
report there are ten additional countries.

ENERGY EFFICIENCY : A STRAIGHT PATH TOWARDS ENERGY
SUSTAINABILITY
49
FIGURE 36: COUNTRIES IMPLEMENTING ENERGY EFFICIENCY LAW
PAYS AYANT UNE LOI SUR L’EFFICACITÉ ÉNERGÉTIQUE
Source: World Energy Council’s energy efficiency policies database 2016
3.1.2 TARGETS: 90% OF SURVEYED COUNTRIES SET QUANTITATIVE OBJECTIVES
The adoption of national energy efficiency programmes with quantitative targets is now
fairly common: 90% of the countries surveyed37 in 2015 had set at least one target, which
represents 4% more compared to 2012.
The targets are expressed in different ways and vary across regions. They can refer first of
all, to a rate of energy savings or efficiency improvement, which is the most common target
used in 2016 (Figure 37). This is the case in all EU countries covered by the Energy
Efficiency Directive (EED)38. Objective of energy consumption reduction compared to a
reference historical year is a much stricter target that is now also required by EED in EU
countries. Targets for energy intensity reduction are more common in other regions such as
Asia (e.g. China where targets are set at provincial level in the Five Year Plan 2011-2015,
New Zealand, South Korea, Sri Lanka, Thailand, etc.).
37 For the rest of the report we call the surveyed countries the 54 countries that participate to the survey (equivalent to participation rate of 56% of the 96 WORLD ENERGY COUNCIL countries). 38 The Energy Efficiency Directive of 2012 imposes to all member countries a rate of 1.5% per year additional energy savings between 2014 and 2020 (based on historical energy sales).

WORLD ENERGY COUNCIL | PERSPECTIVES
50
0%
10%
20%
30%
40%
50%
60%
70%
80%
90%
100%
Asia America Total Europe Africa & Middle East
Energy savings in rate or volume Energy intensity reductionEnergy efficiency improvement Energy consumption reduction
FIGURE 37: MAIN QUANTITATIVE TARGETS OF ENERGY EFFICIENCY
PROGRAMMES
PRINCIPAUX OBJECTIFS DES PROGRAMMES D’EFFICACITÉ
ÉNERGÉTIQUE
Source: WORLD ENERGY COUNCIL energy efficiency 2016 survey
At world level, about 75% of targets are related to total energy consumption (either primary
or final) and half of the surveyed countries have end-use sector targets (i.e. targeting
residential, industry or transport), and the remaining targets are for energy suppliers (e.g.
Poland, South Korea, South Africa and USA (Figure 38). Different world regions focus on
different measures. In Europe targets for the total final consumption are more important
because of the EED Directive. Most surveyed countries have implemented several targets
(e.g. two on average in Europe) and in total half of the targets are for primary energy and
30% for end-use sectors.

ENERGY EFFICIENCY : A STRAIGHT PATH TOWARDS ENERGY
SUSTAINABILITY
51
0%
20%
40%
60%
80%
100%
Asia Africa & MiddleEast
Europe America Total
Primary Final consumption End-use sectors Energy Suppliers
0%
20%
40%
60%
80%
100%
Europe America Total Africa & MiddleEast
Asia
Residential Industry Services Transport
FIGURE 38: DISTRIBUTION OF POLICY TARGETS BY REGION
MODE D’EXPRESSION DES OBJECTIFS POLITIQUES
Source: World Energy Council Energy Efficiency Survey 2016
In total, 10 of the surveyed countries in Europe had sectoral targets, 6 in Africa/Middle-
East, 5 in Asia and 4 in America. On average more than half of the sectoral targets concern
the residential sector (thermal retrofitting, new buildings, solar water heaters, lighting, or
electrical appliances) and around 21% the industrial sector (energy audits or targets on
energy intensity, or energy consumption reduction). Targets in industry are particularly
important in Asia (Sri Lanka, South Korea, New Zealand, Japan), while targets for the
residential sector are dominant in Europe and America (Figure 39).
FIGURE 39 : TARGETS FOR ENERGY EFFICIENCY PROGRAMMES BY END-
USE SECTOR
RÉPARTITION DES OBJECTIFS D’EFFICACITÉ ÉNERGÉTIQUE PAR
SECTEUR
Source: World Energy Council Energy Efficiency Survey 2016

WORLD ENERGY COUNCIL | PERSPECTIVES
52
3.1.3 60% OF COUNTRIES HAVE SET UP A NATIONAL ENERGY EFFICIENCY AGENCY
Some measures, such as energy pricing or introduction of international standards may be
implemented without a specific energy efficiency institution. But most of the time the
implementation of energy efficiency programmes requires a dedicated technical body able
to reach scattered and multiple energy consumers.
An energy efficiency agency is defined here as “a body with strong technical skills,
dedicated to implementing the national energy efficiency policy”39. Such agencies are
usually separate from ministries, but may be part of a ministry, e.g. in Denmark, Canada or
the US. Energy efficiency agencies are increasingly recognised as necessary instruments
to foster energy efficiency policies. As a whole, 60% of countries (i.e. 58 countries) have a
national energy agency (Figure 40). Energy efficiency agencies have the mission and
capabilities to design, implement and evaluate programmes and measures, contract a
range of stakeholders, such as companies, local authorities, or NGOs and, finally ensure
coordination with all levels of authorities (international, national, regional and local).
These agencies are usually public institutions funded by the state budget, and in
developing countries they are often supported by overseas technical assistance funds. In
an increasing number of countries, part of the budget is based on a tax on energy (e.g.
Denmark, Norway, Spain, Switzerland, Thailand, Tunisia), whilst others are expected to
operate as a partially private body that has to earn income. In countries with a federal or
decentralised structure (e.g. Spain, Germany, Belgium, the US, Canada, Russia, China or
India) energy efficiency agencies have been set up by regional administrations. In addition,
many other countries have set up local or regional agencies40. More than three quarters of
the 58 surveyed countries have local or regional agencies. It is estimated that there are
now around 800 local or regional agencies at world level, 400 of which are in Europe.
These regional and local agencies aim at providing more targeted information and
measures, as they are closer to consumers and are better able to take into account
regional circumstances (climate, energy resources, etc.). The primary objective of all these
institutions is to provide technical expertise to governments and consumers, which cannot
always be found in existing institutions. As the lack of quality of energy efficiency equipment
and services is often seen as an obstacle to their effective deployment, energy agencies
can play an ongoing role in that field by certifying those which have the required quality.
Government ministries do not always have the required expertise to carry out the activities
of energy agencies.
39 In some countries they have a broader scope and cover renewables as well as environmental policy (e.g. France, the Netherlands). 40 In some countries with a national energy agency, there exist regional offices of the national agency (e.g. ADEME in France with 28 offices).

ENERGY EFFICIENCY : A STRAIGHT PATH TOWARDS ENERGY
SUSTAINABILITY
53
0%
10%
20%
30%
40%
50%
60%
70%
80%
Europe Asia Total Africa & MiddleEast
America
Another important function for agencies is to act as a coordinator of all governmental
initiatives in the field of energy efficiency to avoid scattered and uncoordinated actions by
different ministries. In particular, such agencies have proved very useful in negotiating
sectoral agreements with groups of consumers, equipment producers or energy utilities to
reach specific targets for efficiency improvements. In countries that receive funding from
international development assistance programmes, such agencies can in addition act as
the national representative with whom donors can negotiate the implementation of financial
packages for energy efficiency.
FIGURE 40: COUNTRIES WITH AN ENERGY EFFICIENCY AGENCY
PAYS DISPOSANT D’UNE AGENCE D’EFFICACITÉ ÉNERGÉTIQUE
Source: World Energy Council energy efficiency policies database 2016
3.1.4. THE POLICIES AND MEASURES IMPLEMENTATION TOOLBOX
Scaling up energy efficiency needs an integrated enabling environment where regulations
are necessary but finance is also part of the project. Public stakeholders use various types
of policy instruments (P&Ms) to improve energy efficiency. These include most often
regulations, financial and fiscal instruments and information. P&Ms target several sectors
(or end-uses) and can be implemented or be relevant at the different phases of
development. For instance, phasing-out programmes are necessary to remove old and
inefficient stocks, while MEPS provide minimum energy performance standards for new
appliances or buildings and energy efficiency labels guide consumers towards the more
efficient appliances and buildings.

WORLD ENERGY COUNCIL | PERSPECTIVES
54
For example, policies and measures for electric motors must cover all phases of the motor
lifecycle, ranging from product development and marketing to procurement and use.
Figure 41 shows the lifecycle stages and some applicable policies and measures in each of
them. The majority of policies and measures are addressing the efficiency of new motors.
Minimum Energy Performance Standards (MEPS), energy labels, procurement tools as well
as subsidies and tax rebates all address energy efficiency. If properly enforced, MEPSs are
a strong policy tool for new motors, but the number of motors replaced or new investments
in motors constitute only a fraction of the total motor stock. Moreover, MEPSs have no
influence on correct sizing, installation and running time. Therefore, a balanced portfolio of
supplementing policies and measures is needed. The use phase is very important as well
and special situations, since they all have efficiency implications. This phase can be
addressed by energy inspection management and energy services (e.g. energy audits),
information measures and electricity taxation. One noteworthy fact is that motors are quite
often used beyond their planned service lives. The service life of motors has generally been
estimated at between 10-20 years but Swiss surveys have found a large proportion of older
motors still in use, with some units up to 60 years old. If this finding is applicable to other
markets, it suggests that the turnover of the stock will be slower than has often been
foreseen (IEA 2015). Therefore, measures addressing only procurement do not suffice.
Figure 41 summarises the different P&M covered in the World Energy Council’s survey
according to their type and relevant phase of development. However, most of the time a
“package of measures” is used to ensure the compliance or acceptability of measures: for
instance, a regulatory framework is often linked to or accompanied by a financial incentive.
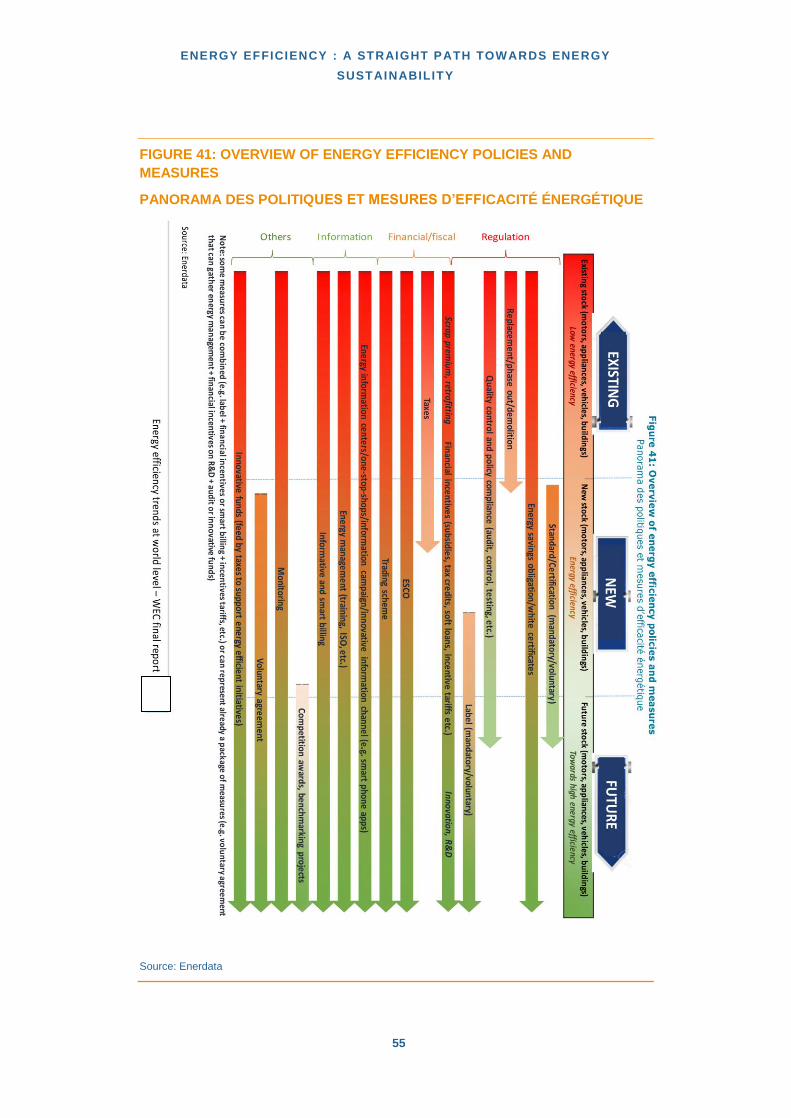
ENERGY EFFICIENCY : A STRAIGHT PATH TOWARDS ENERGY
SUSTAINABILITY
55
FIGURE 41: OVERVIEW OF ENERGY EFFICIENCY POLICIES AND
MEASURES
PANORAMA DES POLITIQUES ET MESURES D’EFFICACITÉ ÉNERGÉTIQUE
Source: Enerdata

WORLD ENERGY COUNCIL | PERSPECTIVES
56
FIGURE 42: POLICIES BY PRODUCT CYCLE PHASE – CASE OF ELECTRIC
MOTORS
POLITIQUES PAR PHASE DU CYCLE DE VIE -CAS DES MOTEURS
ÉLECTRIQUES
OEM = Original Equipment Manufacturer41
Source: based on IEA 2011, modified by Motiva for the World Energy Council’s case study on electric motors
Results of the 2016 World Energy Council survey show that regulations are still widely used
and accounted for more than 50% of all measures in 2015 (Figure 43)42 because they have
been proven effective in reducing energy consumption of specific appliances and
equipment and speeding up the deployment of energy efficient equipment, energy savings
investments and practices.
Regulations are more powerful than traditional incentives to transform the market as they
are mandatory for the consumers. The effect of incentives is often weak as it depends on
the changes of behaviour of millions of consumers most of whom lack information and
resources. However, the impact of regulations depends on their enforcement or on the
accompanying measures making enforcement more acceptable. In most regions the share
of regulations in the policy toolbox is decreasing (e.g. Africa and the Middle East), leading
other measures such as financial/fiscal measures or Energy Service Company (ESCO),
particularly in Asia.
41 OEM is a company that makes a part that is marketed by another company typically as a component of the second company's product. In the case of motors, it means a manufacturer of equipment that uses a motor. 42 As explained above, measures on information are not included here.

ENERGY EFFICIENCY : A STRAIGHT PATH TOWARDS ENERGY
SUSTAINABILITY
57
2009
2012
2015
2009
2012
2015
2009
2012
2015
2009
2012
2015
2009
2012
2015
Africa & middleEast
Europe Asia America Total
0%
20%
40%
60%
80%
100%Regulation Financial Fiscal Others*
0%
20%
40%
60%
80%
100%
Household Services Industry Transport
Financial Fiscal Regulation Others
FIGURE 43: DISTRIBUTION OF MEASURES BY TYPE
RÉPARTITION DES MESURES PAR TYPE
Source: World Energy Council’s energy efficiency 2016 survey
* Others correspond to voluntary agreements, ESCO and certification
If regulations are important in the residential and service sectors (appliances, labelling,
building codes & certificates), financial incentives are more important in industry or
transport (e.g. grants for energy audits) where competitiveness should not be affected by
regulations (Figure 44). Fiscal incentives are less common and are shared between
transport (e.g. tax exemption on efficient car or malus/tax on least efficient or pollutant
vehicle) and households.
FIGURE 44 : DISTRIBUTION OF MEASURES BY END-USE SECTOR AND BY
TYPE - RÉPARTITION DES MESURES PAR SECTEUR ET PAR TYPE
Source: World Energy Council’s energy efficiency survey 2016

WORLD ENERGY COUNCIL | PERSPECTIVES
58
0%
20%
40%
60%
80%
100%
Afr
ica
&M
idd
leEa
st Asi
a
Euro
pe
Am
eric
a
Tota
l
Transport Industry Services Households
In all regions, buildings (households and services) account for 75% of all measures, of
which around half are for households (46% on average). In Europe there is an increasing
focus on services, the only sector where energy demand is still growing. Measures in
transport are limited and not in line with its share of the consumption.
FIGURE 45 : DISTRIBUTION OF MEASURES BY SECTOR AND BY REGION
RÉPARTITION DES MESURES PAR SECTEUR ET PAR TYPE
Source: World Energy Council’s energy efficiency survey 2016

ENERGY EFFICIENCY : A STRAIGHT PATH TOWARDS ENERGY
SUSTAINABILITY
59
3.2 LARGE SCALE DEPLOYMENT OF ENERGY EFFICIENCY REGULATIONS TO TRANSFORM THE MARKET
Considering the size and continuous growth of household appliances market worldwide,
equipment efficiency is a very significant aspect of energy efficiency strategies.
Governments often resort to establishing MEPS and promoting energy labels for electrical
appliances, motors or buildings to remove the inefficient products from the markets. These
regulations force producers to replace their current product portfolio by more efficient
devices. At the same time, consumer awareness is raised and focused on efficient and cost
saving solutions.
3.2.1. LABELS TO GUIDE CONSUMERS AND MOTIVATE MANUFACTURERS
Among regulations, mandatory energy efficiency labels are widely implemented and are
important to guide consumers and motivate manufacturers. Energy labels increase the
number of efficient appliances or stocks by raising awareness about energy performance,
and allowing comparison across all models and technologies. Some countries have
however favoured a voluntary approach which is usually just a transition phase before
making measures mandatory.
Labels are often among the first measures to be introduced, generally for refrigerators.
Labelling encourages consumers to purchase more efficient appliances (refrigerators,
washing machines, air conditioning, lamps, etc.) and manufacturers to remove inefficient
appliances from the market. Labels are now extended from new electrical appliances to
cars, buildings (residential and public or commercial buildings) and electric motors. Labels
enable consumers to identify the energy efficiency performance or CO2 emissions of new
equipment and appliances.
There are essentially two types of energy labels in use: comparative energy efficiency
labels and endorsement labels. Energy labels are typically comparative with several
categories (e.g. 1-5 stars or alphabetical rating).
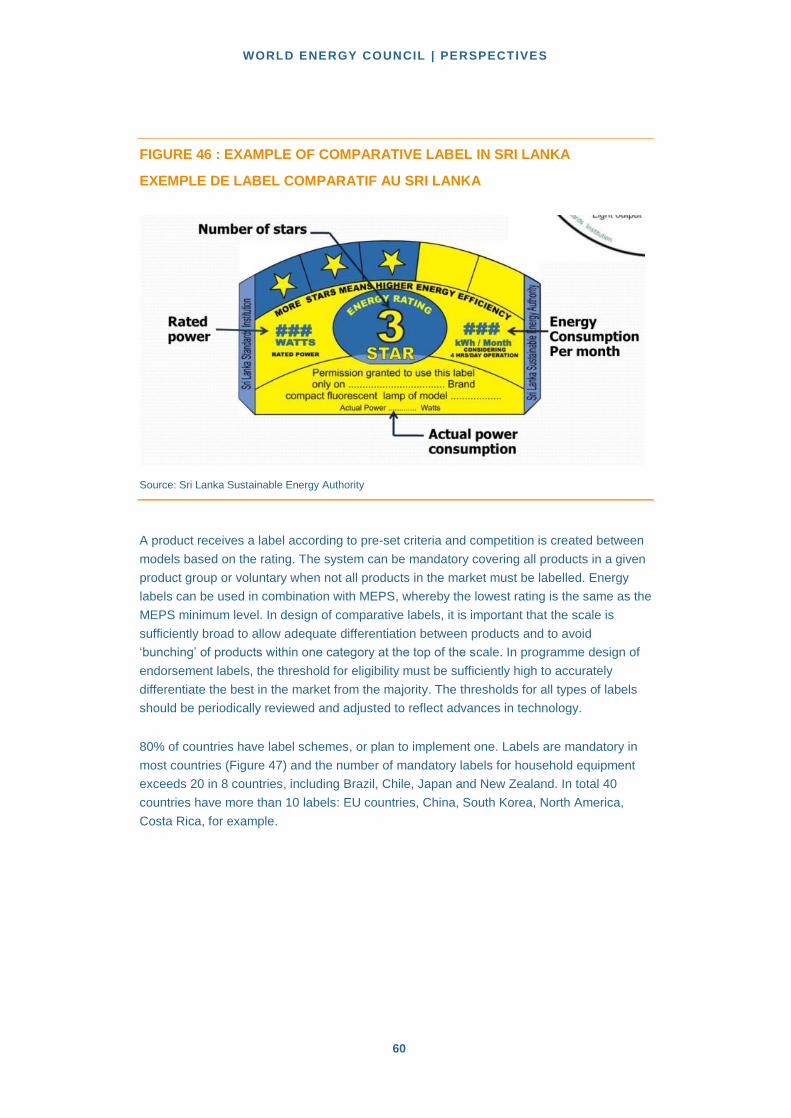
WORLD ENERGY COUNCIL | PERSPECTIVES
60
FIGURE 46 : EXAMPLE OF COMPARATIVE LABEL IN SRI LANKA
EXEMPLE DE LABEL COMPARATIF AU SRI LANKA
Source: Sri Lanka Sustainable Energy Authority
A product receives a label according to pre-set criteria and competition is created between
models based on the rating. The system can be mandatory covering all products in a given
product group or voluntary when not all products in the market must be labelled. Energy
labels can be used in combination with MEPS, whereby the lowest rating is the same as the
MEPS minimum level. In design of comparative labels, it is important that the scale is
sufficiently broad to allow adequate differentiation between products and to avoid
‘bunching’ of products within one category at the top of the scale. In programme design of
endorsement labels, the threshold for eligibility must be sufficiently high to accurately
differentiate the best in the market from the majority. The thresholds for all types of labels
should be periodically reviewed and adjusted to reflect advances in technology.
80% of countries have label schemes, or plan to implement one. Labels are mandatory in
most countries (Figure 47) and the number of mandatory labels for household equipment
exceeds 20 in 8 countries, including Brazil, Chile, Japan and New Zealand. In total 40
countries have more than 10 labels: EU countries, China, South Korea, North America,
Costa Rica, for example.
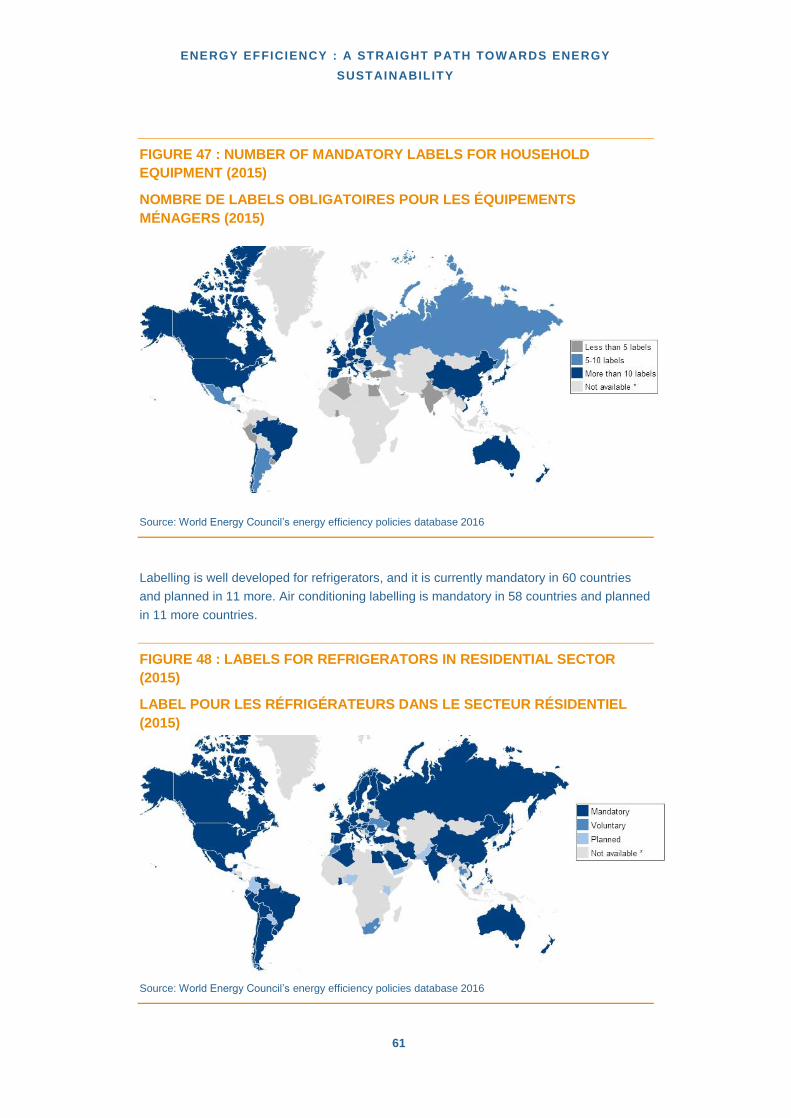
ENERGY EFFICIENCY : A STRAIGHT PATH TOWARDS ENERGY
SUSTAINABILITY
61
FIGURE 47 : NUMBER OF MANDATORY LABELS FOR HOUSEHOLD
EQUIPMENT (2015)
NOMBRE DE LABELS OBLIGATOIRES POUR LES ÉQUIPEMENTS
MÉNAGERS (2015)
Source: World Energy Council’s energy efficiency policies database 2016
Labelling is well developed for refrigerators, and it is currently mandatory in 60 countries
and planned in 11 more. Air conditioning labelling is mandatory in 58 countries and planned
in 11 more countries.
FIGURE 48 : LABELS FOR REFRIGERATORS IN RESIDENTIAL SECTOR
(2015)
LABEL POUR LES RÉFRIGÉRATEURS DANS LE SECTEUR RÉSIDENTIEL
(2015)
Source: World Energy Council’s energy efficiency policies database 2016

WORLD ENERGY COUNCIL | PERSPECTIVES
62
Building Energy Ratings or Energy Performance Certificates
Labelling programmes are now common for new residential buildings: 30 of the surveyed
countries have a labelling programme already in place and nine more plan to introduce
label on dwellings in the coming years, as well as a significant extension of building codes
and standards. These labels, known also as “energy performance certificates” or “building
energy rating” (BER), are designed to show the energy performance of buildings based on
how much energy they consume (Figure 49). While building codes are widely enforced in
new buildings, BERs target both existing and new buildings: 23 countries have labels on
existing residential buildings. They evaluate the energy use of buildings, rate them on a
particular scale and communicate this information to public through energy efficiency labels
or certificates. The labels ensure transparency and the opportunity to compare similar
buildings. The overall aim is to raise awareness and push the market towards an increased
demand for energy efficient buildings. BERs are mandatory in 18 or in about one-third of
surveyed countries, for instance most EU countries, Mexico, Japan Tunisia, China, Turkey
and certain cities in USA. In all these countries and in EU member states, the energy rating
information has to be disclosed during sale and lease. Real estate advertisements must
include the energy performance information in Australia, France, Germany and UK.
Other countries, for example, Brazil, Canada, India and Republic of Korea have voluntary
building energy rating systems. In all countries, the rating is done by a governmental
department or agency, except in France, UK and certain US and EU states where the rating
is done by an accredited expert or organization. Chile has an innovative energy efficiency
label with two dimensions: building shell efficiency and heating appliance efficiency.

ENERGY EFFICIENCY : A STRAIGHT PATH TOWARDS ENERGY
SUSTAINABILITY
63
Energy efficiency label for new buildings:case of Chile
9
Double label: on building shell and on heating appliance
FIGURE 49 : EXAMPLES OF BUILDING ENERGY RATING LABELS
EXEMPLES DE LABEL DE PERFORMANCE ÉNERGÉTIQUE DU BÂTIMENT
CHILE
Source: BuildingRating.org
Some countries do not yet have building energy efficiency labels. The countries who have
introduced their energy efficiency standards after 2000 might be lacking the information,
infrastructure and resources to develop proper building rating tools. However green building
rating systems, which assess the full environmental effects of buildings rather than focusing
on energy consumption have become the main rating tool in some of these countries and
seem to be an efficient tool for implementing energy building code, such as Korea (Green
Building Certification KGBC), Australia (Green star), India (Green Rating for Integrated
Habitat Assessment-GRIHA or Japan (Comprehensive Assessment System for Building
Environmental Efficiency-CASBEE). Thailand shows a good example by making Green
Rating Mark mandatory. Also Turkey gives a good example of implementation of Energy
Performance Certificate (ECP). China has recently developed green building and building
energy-efficiency labelling programmes tailored to its national context in addition to
mandatory building codes. These labelling programmes represent the central (and in some
cases local) governments’ recognition of the need for market-based as well as regulatory
measures to promote building energy efficiency. China’s MOHURD has taken the lead in

WORLD ENERGY COUNCIL | PERSPECTIVES
64
establishing a domestic green building label and a building energy efficiency label, both of
which are voluntary but beginning to emerge in the building market. The green building
labelling programme, in particular, is growing rapidly in coverage and is likely to continue,
with concerted government efforts to establish demonstration projects and financial
incentives. Both labelling programmes evaluate theoretical and operational energy
consumption, but the limited availability of building experts and high transaction costs
hinder greater adoption of these labels. In addition, both labelling programmes are new and
face the typical challenges of a new programme, including lack of public awareness as well
as ambiguity and unclear distinction between the two programmes and resulting consumer
confusion between the two labels (more information available on 2016 Energy Building
Code World Energy Council’s case studies).
BOX 5: THE INDIAN RATING SYSTEMS
India’s GRIHA (Green Rating for Integrated Habitat Assessment) and the LEED green
building rating systems are the most popular building labelling systems in the
country. Both rely on Energy Conservation Building Code (ECBC) guidelines to
assess a building’s energy efficiency in the commercial sector. Between the two, the
GRIHA system is more closely linked with typical India building operational
characteristics such as significantly reduced demand for cooling. The national
government and several state governments support GRIHA, with four states
requiring GRIHA rating for government buildings and the national government
requiring GRIHA compliance in all new national government buildings.
The BEE’s Star Rating System evaluates buildings based on operational energy use
and is the only energy-use-specific building label used in India.
LEED buildings are still more costly than regular buildings. However, despite high
costs, LEED received strong initial support and, in 2010, India ranked second in
LEED-registered building floor space only to the United States. LEED has registered
more than 1.1 billion m2 of LEED building projects until 2013.
ECBC is having a positive effect. Commercial buildings certified for energy efficiency
now account for 1.2bn square feet (about 111 Mm2) of space. Although experts say
the true impact of the ECBC’s implementation may be greater because some building
owners are willing to simply secure energy savings rather than going through
multiple procedures to become certified.
Source: World Energy Council’s case study on Energy Building Code, ECOTECH
Among the lessons learned, the EU experience demonstrates how long time it takes to train
the work force necessary to implement a building labelling programme. It took member
states from a few to up to six years to implement the EU directive on labelling, in part due to
the need to establish a political consensus. Government and industry associations can
facilitate training and ensure future high-quality energy assessments by providing well-
designed training and guidance tools and software. European experience also shows that
labelling programme benefits are enhanced when these programmes operate in tandem

ENERGY EFFICIENCY : A STRAIGHT PATH TOWARDS ENERGY
SUSTAINABILITY
65
with other policies and as part of a package of measures. Many countries have financial
incentive schemes in which the performance criteria are determined by a label requirement.
Labelling for electric motors
Electric motors and electric motor-driven systems (EMDS) in industry absorb almost half of
the total electricity use. EMDS are estimated to account for approximately 70% of the
electricity consumption in the industry. The cost‐effective potential to improve energy
efficiency of motor systems is roughly 20% to 30%, which would reduce the total global
electricity demand by about 10%. Many policies and measures are in place to increase the
efficiency of new motors, in particular their labelling.
Comparative or endorsement labels for electric motors on a mandatory (most EU countries,
China, Brazil, Japan, Mexico, New Zealand, Korea, USA, Vietnam) or voluntary basis
(Argentina, India) are in place in numerous markets. These increase the visibility of energy
efficient alternatives. International awards on efficient motors have the same effect,
however, they are not as well known by those making procurement decisions. Endorsement
labels given to products fulfilling pre-set criteria create market advantage for producers
whose products are labelled. An example is the Procel Seal in Brazil (see case studies on
electric motors43) which is part of the Procel Programme. As of November 2015, 183
models had the label.
In China, to qualify for the label, small and medium motors must meet the requirements
specified in the Chinese National Standard GB 18613-2012. The grades are in line with the
classes in international standards IEC 60034-30 (IE2/IE3 motors-see Box 6) and IEC
60034-31 (IE4 motors). Motor efficiency must meet the specified level both at 100% and
75% loads. The labelling scheme complements a MEPS scheme whereby the minimum
acceptable level is IE2.
In India, the label consists of 1-5 stars depending on the efficiency. The labelling scheme
complements a voluntary standard (and a forthcoming MEPS in 2016) whereby the
minimum acceptable level is IE2.
The Extended Motor Product Label Initiative (EMPLI) is a US based collaborative effort to
develop voluntary labels for motor-driven systems (e.g., a fan, pump, or compressor and
the motor and associated controls) based on test standards, metrics and MEPS
concurrently being developed by the US DOE. EMPLI involves over two dozen
representatives from the motor-drive equipment manufacturing sector, trade organizations,
utilities, energy efficiency programme administrators, and energy efficiency
nongovernmental organizations. The American Council for an Energy-Efficient Economy
(ACEEE) has functioned as the convening organization. The performance metric has not
been decided yet and it could be numerical (e.g., 40, 50, 60, and so on) or strictly
comparative (e.g., “good,” “better,” “best”). It is anticipated that companies could require the
forthcoming label as a purchasing specification as is the case with the NEMA Premium
level for motors. The new labels can also be combined with energy efficiency programmes 43 http://www.worldenergy.org/data/energy-efficiency-policies-and-measures/

WORLD ENERGY COUNCIL | PERSPECTIVES
66
by utilities as they will simplify the measurement and verification (M&V) for incentive
programmes by establishing straightforward eligibility requirements and the associated
deemed energy savings.
BOX 6: TECHNICAL DEFINITION OF IE CLASSES
The efficiency of an electric motor is the ratio of mechanical output power to
electrical input power. IEC 60034-30 is an international standard of the International
Electrotechnical Commission for rotating electrical machinery (IEC 2014). It specifies
four classes: IE1 (standard), IE2 (high), IE3 (premium) and IE4 (super premium). A
new class IE5 is not yet defined in detail but is envisaged for potential products in a
future edition of the standard. The following graph shows the nominal efficiencies
(%) of different motor sizes in each efficiency class depending on motor size. A
motor of a given size is labelled in an efficiency class based on its nominal
efficiency.
Source: IEA 2011, fig. 3.
Labelling for cars and trucks
As for electrical appliances or motors, energy labels aim to increase the number of efficient
cars by raising awareness about vehicle energy performance, and allowing comparison
across all models and technologies. The fuel consumption and CO2 emission of car (per
kilometre) are displayed on these labels during sale. Around 40% of surveyed countries
have set mandatory energy efficiency labels for cars, and labels are voluntary in 10% of
surveyed countries like in Brazil or Nigeria and planned in 15% (e.g. Algeria, Ecuador,
Kenya, Swaziland, Thailand, United Arab Emirates or Uruguay).

ENERGY EFFICIENCY : A STRAIGHT PATH TOWARDS ENERGY
SUSTAINABILITY
67
FIGURE 50 : EXAMPLE OF SOME ENERGY LABELS FOR CARS
EXEMPLES DE LABEL ÉNERGÉTIQUE POUR LES VOITURES
Source: Enerdata from various national websites
3.2.2. MEPS TO REMOVE INEFFICIENT EQUIPMENT OR PRACTICES
Unfortunately, labels are not sufficient to transform the market alone: they are the first step
but need to be complemented with MEPS (Mandatory Energy Performance Standards) to
remove inefficient equipment or practices. The effect of labels and MEPS is however linked
to the amount of equipment replaced or new investments, which is only a fraction of the
total stock.
Almost all surveyed countries (53 countries) have implemented at least one MEPS.
Efficiency standards for new buildings are implemented in 85% of surveyed countries (and
planned in 13%): they are becoming the most common standards, behind MEPS on
refrigerators (see Figure 51), lamps, electric motors and other appliances (washing
machines and AC) that are still widely implemented (up to 80% of surveyed countries).
MEPS on vehicles and solar water heaters are less common. Japan has opted for a slightly
different approach with its well-known Top Runner Programme. This programme triggers
race to the top among manufacturers because the product on the market with the highest
energy efficiency (the Top Runner) sets the standard (energy efficiency improvement
target) for others. In each product group the standard is revised every 3-4 years.

WORLD ENERGY COUNCIL | PERSPECTIVES
68
0%
20%
40%
60%
80%
100%
Mandatory Voluntary Planned
FIGURE 51 : SURVEYED COUNTRIES WITH MEPS (2015)
PROPORTION DE PAYS AVEC DES NORMES DE PERFORMANCES PAR
TYPE D’ÉQUIPEMENT (2015)
Source: World Energy Council’s energy efficiency 2016 survey
MEPS on electrical appliances
The aim of performance standards is to improve the energy efficiency of new appliances
(see Box 7 on the impact of standard and labels on the market) either by imposing a
minimum energy efficiency rating to remove the least efficient products from the market –
MEPS - or by requiring sales-weighted average energy efficiency improvements ("target
values") (e.g. "Top Runner Programme” in Japan). Target values are more flexible as they
allow the sale of less efficient equipment provided that other models with a higher efficiency
rating are also offered for sale. A majority of surveyed countries have implemented at least
one MEPS (Figure 51).

ENERGY EFFICIENCY : A STRAIGHT PATH TOWARDS ENERGY
SUSTAINABILITY
69
FIGURE 52 : MEPS FOR REFRIGERATORS
NORMES DE PERFORMANCES IMPLÉMENTÉES DANS LE MONDE POUR
LES RÉFRIGÉRATEURS (2015)
Source: World Energy Council’s energy efficiency policy database 2016/world overview
Air conditioning (AC) is an important use of electricity in both emerging and industrialized
countries, particularly in the service sector. Traditional measures targeting air conditioning
include regulations (i.e. label and MEPS) and financial incentives (subsidies and soft
loans). Regulations to promote the adoption of efficient AC and remove the least efficient
products from the market, or an obligation of maintenance have been introduced in many
countries (e.g. all EU countries), MEPS for air conditioning in residential buildings are
mandatory in 48 countries (i.e. 50% of analysed countries), voluntary in 2 and planned in 17
countries. MEPS are often linked to label class as presented in the previous section.
A number of countries (e.g. Austria, Denmark, France, Estonia and Poland) have
introduced minimum requirements for specific ventilation power (generally expressed in
W/l.s or kW/m3.s.). Given the increasing use of mechanical ventilation system, the
ventilation power requirement in low energy buildings is becoming an important issue.
Additionally, most countries have requirements associated with the minimum performance
of air conditioning systems, and more and more standards on AC are integrated in the
building codes and building certificates. MEPS and energy labelling programme for new
buildings (and extensions to existing buildings) have a direct impact on AC loads. General
regulations applying to large buildings, such as mandatory audits or mandatory energy
managers also have an impact on electric use for air conditioning.

WORLD ENERGY COUNCIL | PERSPECTIVES
70
FIGURE 53 : MEPS FOR AIR CONDITIONING (2015)
NORMES DE PERFORMANCES POUR LES CLIMATISEURS (2015)
Source: World Energy Council’s energy efficiency policies database 2016
Around 75% of surveyed countries have implemented a phase-out of incandescent lighting
that is replaced by CFL (Compact Fluorescent Lamps) and increasingly LEDs. While LEDs
may offer significant additional savings as their market share increases, current costs and
efficiencies do not make them cost effective for most lighting applications. These
developments change the lighting market as a whole, but often include a leadership role for
the public sector through the use of efficient lighting in public facilities, spaces and
infrastructures. In India there is also a public programme (based on ESCO model) under
which energy efficient LED bulbs are distributed to all citizens by Energy Efficiency
Services Limited (EESL) (see more details in Box 7).
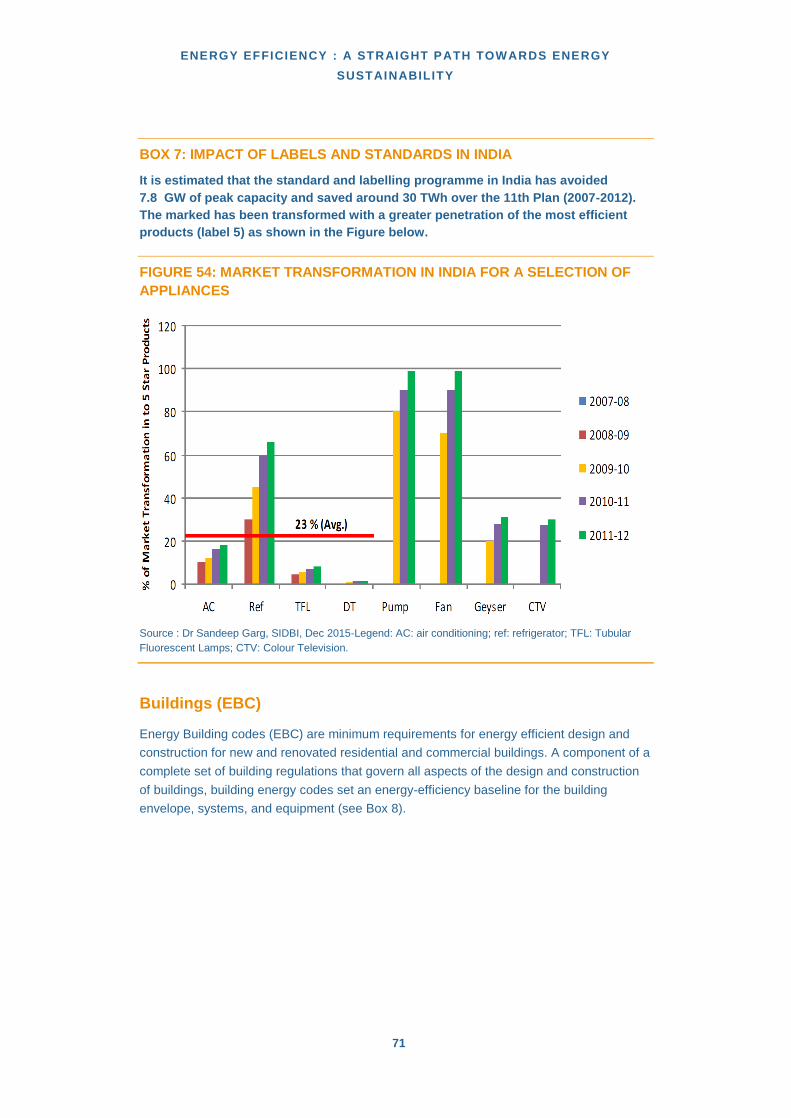
ENERGY EFFICIENCY : A STRAIGHT PATH TOWARDS ENERGY
SUSTAINABILITY
71
BOX 7: IMPACT OF LABELS AND STANDARDS IN INDIA
It is estimated that the standard and labelling programme in India has avoided
7.8 GW of peak capacity and saved around 30 TWh over the 11th Plan (2007-2012).
The marked has been transformed with a greater penetration of the most efficient
products (label 5) as shown in the Figure below.
FIGURE 54: MARKET TRANSFORMATION IN INDIA FOR A SELECTION OF
APPLIANCES
Source : Dr Sandeep Garg, SIDBI, Dec 2015-Legend: AC: air conditioning; ref: refrigerator; TFL: Tubular
Fluorescent Lamps; CTV: Colour Television.
Buildings (EBC)
Energy Building codes (EBC) are minimum requirements for energy efficient design and
construction for new and renovated residential and commercial buildings. A component of a
complete set of building regulations that govern all aspects of the design and construction
of buildings, building energy codes set an energy-efficiency baseline for the building
envelope, systems, and equipment (see Box 8).

WORLD ENERGY COUNCIL | PERSPECTIVES
72
BOX 8: ENERGY BUILDING CODE – DIFFERENT APPROACHES
Measure Content
Performance Approach Energy building code based on the total energy performance:
in primary energy
in final energy
End-use uses included: heating but increasingly other uses (e.g.
cooling, lighting, ventilation/ auxiliaries, water heating)
Prescriptive Approach Minimum performance by component (walls, windows etc.) (maximum
U value)
Minimum supply from
renewables
Maybe explicit (e.g. Spain, Portugal) or implicitly imposed with very
severe regulations (e.g. France)
Source: Energy Building Code World Energy Council’s case study, 2016, ECOTECH
Today, mandatory minimum energy efficiency requirements in the form of building codes or
standards for new buildings exist in nearly all OECD countries. Regulations for energy
efficiency in buildings in emerging countries, and especially in countries with rapid
economic development, such as India, China and Egypt, are introduced to improve comfort
and to reduce the dramatic increase in energy consumption in this sector linked to the
spread of cooling or heating systems. Generally, energy building codes target new
buildings but sometimes are applied also to existing buildings, as under certain conditions
in EU countries. These buildings code address all types of buildings (residential,
commercial and public) in OECD countries, but may be restricted to specific type of
buildings, such as government buildings in Brazil, large commercial buildings in India and
Thailand, or new building size or renovation size for existing buildings.
Figure 55 shows the countries that already have a mandatory building code in place, and in
which other countries EBC’s are becoming common. 65 countries (or 80% of the surveyed
countries) have implemented building codes for new dwellings, and in the great majority the
standards are set as mandatory. Indeed, the advantage of mandatory requirements
compared to voluntary codes is that mandatory enforcement is the only way to guarantee
energy savings. In addition, building designers and construction companies are more likely
to comply with the code if they know that everyone else must. Finally, manufacturers will
provide more widely energy-efficient products if they know that there is a market.

ENERGY EFFICIENCY : A STRAIGHT PATH TOWARDS ENERGY
SUSTAINABILITY
73
FIGURE 55 : BUILDING ENERGY CODES FOR NEW DWELLINGS IN
RESIDENTIAL
CODES DE L’ÉNERGIE DES BÂTIMENTS IMPLÉMENTÉS DANS LE MONDE
Source: World Energy Council’s energy efficiency policies database 2016
There is an urgent need to assist fast growing developing economies where active space
heating and/or space cooling are normal practices and where the formal building
construction sector plays a large role in urban development. Once a building is constructed,
it is more expensive and complicated to reduce its energy consumption. That is why energy
efficient actions have to be done from the outset. Energy efficiency requirements in building
codes can ensure that the energy efficiency measures are taken into account from the very
beginning, i.e. already at the building’s design phase.
The objective of energy codes is to protect consumers, improve occupant comfort and
business productivity, save energy and money. Altogether, this can result in potential large-
scale carbon emissions reductions through reduced energy demand of buildings.
Buildings codes for new buildings should be regularly enforced to take into account
technical progress. To avoid that some countries lag behind, the EU regulation requires re-
enforcement every 5 years and includes a fixed target for 2020 when all new construction
should near Zero Energy Buildings (nZEB). To prepare these revisions, many countries
encourage construction to go beyond minimum performance requirements with specific
labels e.g. EU countries, USA, Tunisia, Lebanon, Morocco (Box 9).
For more developed countries with an older building stock major renovations of existing
buildings are also tackled, as is the case in the EU with the Energy Performance of
Buildings Directive (EPBD) requirement. Switzerland has adopted a very progressive
approach to improve the performance of existing buildings, where the thermal performance
of renovated buildings must not exceed 125% of the new building limit. A number of EU
Member States have introduced minimum component performance standards when
building elements (e.g. windows, doors etc.) or energy using plant (boilers, a/c

WORLD ENERGY COUNCIL | PERSPECTIVES
74
equipment etc.) are being replaced. Good examples include countries which have a
performance-based requirement as well as requirements for any component that is
replaced or refurbished.
How effective an EBC can be, does not only depend on its design and content, but also its
enforcement and compliance as well as the tenants’ behaviour that can have a huge
influence on the success of the code (see Box 9 on USA best practice and next section
3.2.3).
BOX 9: GOOD PRACTICES
Key regulation on buildings codes in the EU (EPBD 1 and 2)
Implementation of a harmonised calculation methodology to push-up MS minimum
energy performance requirements towards a cost-optimal level;
Minimum energy efficiency standards with mandatory strengthening every 5 years
for both existing and new buildings;
New thermal regulation for major renovation
All new buildings shall be nZEB (nearly «Zero Energy Buildings » by 2020 (2018 for
public buildings);
Minimum standard performance of new building calculated according to cost
optimality basis;
USA EBC: The United States has established a robust infrastructure of policies,
programmes, and tools for energy-efficient buildings. Recent code revision cycles
have produced increasing levels of energy savings with some leading jurisdictions
working towards very low and net-zero energy capable new construction. The
number of states adopting or updating building codes has increased significantly in
recent years, and new efforts are under way to better evaluate code compliance and
improve understanding of compliance deficiencies. Energy rating and labelling
programmes are generating a high level of interest and are viewed as trusted
sources of information, increasingly influencing purchase and retrofit decisions. In
the commercial sector, building rating and labelling have become a core component
of many ratepayer-funded efficiency programmes and are part of emerging
mandatory energy- use- disclosure programmes. In the residential market, ratings
and endorsement labels have a growing presence, particularly for new homes. New
rating programmes targeting existing homes are being introduced to spur greater
investment in energy-efficiency retrofits. State- level energy- efficiency policies and
energy-savings targets are driving ever greater investment of ratepayer funds in
efficiency and encouraging innovation in programme design. Beyond ratepayer-
funding, federal, state, and local policies are increasing public investment and
encouraging greater private financing of efficient new construction and retrofit
projects.
Source: Energy Building Codes, World Energy Council’s case study, 2016, ECOTECH

ENERGY EFFICIENCY : A STRAIGHT PATH TOWARDS ENERGY
SUSTAINABILITY
75
MEPS for electrical motors
MEPS are a legislative instruments used by national governments to remove the most
inefficient electric motors and electric motor-driven systems from the markets. Already
about 70% of electricity consumed by electric motors occurs in countries with motor MEPS.
When properly enforced, they are a potentially very strong instrument. However, change
takes some time, typically 4-6 years for the complete transition to new MEPS. MEPS most
often refer to the label class (Box 6).
Globally, the regulations on electric motors were first introduced in and around North
America. The United States implemented standards in 2007 (EPAct 92 comparable to the
IE2 class) but the US has already initiated the IE3/NEMA Premium Motors shift in 2010. In
Canada the first requirements came into force in 1997 and Mexico adopted the US EPAct
standard in 1998. Brazil and China issued the first MEPS in 2002 for standard efficiency
motors. MEPS for IE2 level took force in Brazil in 2009 and in China in 2011 and Brazil is
considering shift to the IE3 level in 2017. Australia and New Zealand have set the MEPS at
the IE2 level since 2006. In the EU, the first MEPS took effect in 2011 (Eco-design
Directive) at the IE2 level with further requirements in 2015. Other countries with MEPS at
the level of at least IE2 include Chile (2011), Israel (2008), South Korea (2013/IE2 level,
2015/partly IE3 level), Switzerland (2011/IE2, 2015/same level as Eco-design in Europe),
Taiwan (2015) and Turkey (2015, same level as Eco-design in Europe). In addition, a
number of countries have implemented requirements at IE1 level. In 2015, Japan included
electric motors into its Top-runner Programme. In EU countries, the existing regulation only
covers part of the electric motors and the European Commission is considering an
extension to motors outside the current power range and to technologies other than three-
phase induction motors.
In India a voluntary motor standard was first adopted in 2004 and revised in 2011 covering
IE2 and IE3 motors. MEPS at the level of IE2 are under preparation and expected to be
adopted during 2016. At present, IE1 motors or those with lower efficiency are imported to
India from countries which themselves have issued MEPS and manufacturers take the
opportunity to export lower efficiency motors to India as these products cannot be sold in
the domestic market anymore. Indian manufacturers of efficient IE3 and IE4 motors usually
export their products instead of selling them in the domestic market.
Figure 56 shows the annual realised and expected motor sales by efficiency class in
relation to the introduction of MEPS in some large markets. Sales of IE1 motors are
expected to decline somewhat by 2018 while the sales of IE2 and IE3 motors are expected
to grow strongly. As the total volume of sales is growing, the proportion of more efficient
motors in total is increasing.

WORLD ENERGY COUNCIL | PERSPECTIVES
76
FIGURE 56 : POLICY IMPACT ON THE SALES OF MORE EFFICIENT
ELECTRIC MOTORS
IMPACT DES POLITIQUES SUR LA VENTE DE MOTEURS ÉLECTRIQUES
ÉNERGÉTIQUEMENT EFFICACES
Source: EMSA 2014
As an alternative to the regulatory process, agreements with appliance manufacturers
(voluntary or negotiated) are used to improve the energy efficiency of appliances. Some
countries even moved from unsuccessful voluntary agreements to MEPS (e.g. EU, Brazil).
The relatively late introduction of the MEPS in Europe (2011) followed a period of Voluntary
Agreement with the industry, which had had a limited impact on the market. Voluntary
agreements can be an effective alternative to minimum energy efficiency standards. Since
they have the support of manufacturers, they can be implemented more rapidly than
regulations. Nevertheless, their effectiveness is still dependent on the possibility of
imposing precise requirements corresponding to genuine additional efforts from industry.

ENERGY EFFICIENCY : A STRAIGHT PATH TOWARDS ENERGY
SUSTAINABILITY
77
3.2.3. EFFECTIVENESS AND COMPLIANCE OF STANDARDS AND LABELS
Standards are necessary to remove certain inefficient but inexpensive products from the
market, which labelling programmes alone cannot do. They are also needed in areas where
the selection criteria of consumers totally exclude energy efficiency (television sets for
example). Basically, labelling stimulates technological innovation and the introduction of
new more efficient products, while standards organise the gradual removal from the market
of the least energy efficient appliances.
Labelling programmes and performance standards are effective instruments, which enable
authorities to obtain energy savings at a low-cost for the public budget, consumers to spend
less on electricity and manufacturers to improve their products and become more
competitive against imported, less efficient products. As shown by various studies, the
increased diffusion of more efficient appliances did not result in a price increase for the
consumers, as producers were able to adapt and to benefit from the increased sales
(“learning effect”) and there is no correlation between the price of an appliance and its
energy rating.
To be effective, labelling programmes and MEPS must be regularly revised, tested and
upgraded as a way of stimulating technical progress and ensuring a steady improvement in
energy efficiency. However, in practice, the process can be too long and delayed.
Electrical appliances
The "Top Runner" programme in Japan has been designed to integrate the dynamic aspect
of regulations and make it easier to define new targets: as the most efficient appliances on
the market at a given time are used to set the future standards, there is no need for
extensive market or techno-economic analysis to set the minimum energy efficiency
standards. With this type of approach, the preparatory work may be shortened and the
negotiations between manufacturers and public authorities facilitated as the target
corresponds to existing appliances that are already available on the market. Another
interesting approach is the one developed by ASEAN (Association of South-East Asian
Nations) SHINE that implemented harmonized testing methods of MEPS for air conditioning
(see Box 10).

WORLD ENERGY COUNCIL | PERSPECTIVES
78
BOX 10: PROMOTION OF EFFICIENT EQUIPMENT IN ASEAN THANKS TO
HARMONISED TESTING METHODS
In line with the priorities of the ASEAN (Association of South-East Asian Nations) Plan of
Action for Energy Cooperation and more particularly with the objectives of the ASEAN
EE&C SSN, a Strategic framework for the Promotion of higher Efficiency Appliances was
developed with the technical assistance of the UNEP and the International Copper
Association (ICA).
This framework describes a holistic approach to foster a market transformation in favour
of higher efficient appliances: harmonization of ASEAN standard (testing methods) to
facilitate intra-ASEAN trade on higher efficient appliances, developments and adoption of
regional policy roadmaps setting long-term aspirational goals and objectives in
increasing progressively MEPS, capacity buildings for local manufacturers and testing
laboratories and consumer awareness campaigns.
In 2012, the ASEAN SHINE programme (managed in a public private partnership) was
launched and focused first on room air conditionings in Cambodia, Indonesia, Laos,
Malaysia, Myanmar, Philippines, Thailand and Vietnam. From 2013 to 2016, the following
outputs have been achieved:
* ASEAN standards for the testing methods have been harmonized to ISO5151-2010: only
one standard is now applicable to test the energy efficiency of AC, reducing cost of
compliance for AC manufacturers. This method paves the way for a future harmonization
of standards in ASEAN.
* In 2015, the ASEAN Ministers of Energy Meeting (AMEL AMEM) has endorsed the
“ASEAN Regional Policy Roadmap for Harmonisation of Energy Performance Standards
for Air conditioning” to provide clear guidelines for the adoption of policies and to define
targets with regards to the adoption of harmonized standards of ACs by 2020; to agree on
a uniform testing method derived from ISO 5151-2010 (to be adopted and notified by
countries by 2016-2018); to set a common evaluation method namely CSPF by 2020; to
notify ASEAN countries a minimum EER as mandatory MEPS to be reviewed and revised
at least every 5 years.
*ASEAN energy ministries are now developing their national policy roadmaps (to be
endorsed by September 2016);
*Capacity of local AC manufacturers has been built on designing higher efficient ACs
* Capacity of testing laboratories has been built
* National consumers’ awareness campaigns are being designed and will be launched in
2016.
However, a lot still needs to be done to support ASEAN Member States efforts to promote
higher efficient appliances and equipment such as lighting, refrigerators, TV,
transformers, electric motors. The ASEAN SHINE has already started to work on efficient
lighting in 2016 and intends in the near future to evaluate the energy savings potential of
market transformation of refrigerator, transformers and electric motors. The ASEAN
SHINE Advisory Committee is chaired by IEA, and includes UNEP, UNDP, US Department
of State, SEAD, Australian government, Underwriters Laboratories, the ASEAN Centre for
Energy, and the International Copper Association.
Source: Pierre Cazelles, International Copper Association ([email protected])

ENERGY EFFICIENCY : A STRAIGHT PATH TOWARDS ENERGY
SUSTAINABILITY
79
Energy Building Code compliance and effectiveness
The World Energy Council’s survey shows that the building code is one of the most
implemented energy efficiency regulations over the world. These policies have been
implemented from many decades in OECD countries, as an answer to the first oil shock.
Previous evaluations including those by the World Energy Council and more recently by
IPEEC in G20 countries have demonstrated that the impact of these policies is important
particularly in the long term due to the low but structuring rhythm of new constructions.
These policies are still on top of the agenda in OECD as can be seen from the
implementation of the European directive EPBD.
However, many barriers still exist such as the lack of compliance or the lack of skills,
especially when the building codes become more stringent. The situation in emerging
countries is unfortunately less favourable despite many initiatives to implement building
codes. Recently some important emerging countries have adopted building codes (e.g.
China, India, Brazil, Thailand, Turkey, Egypt and Tunisia). The barriers encountered in
OECD countries are rather similar to the ones of the emerging countries. However, it is
clear that the national circumstances in emerging countries may largely influence the
conditions of implementation of this kind of regulation (lack of skills, lack of construction
material etc.). Compared to OECD countries building codes in emerging countries are
implemented more often in the service sector and target above all air conditioning rather
than space heating. From experience, we know that there are huge delays between the
political decision to implement building codes and the real and concrete implementation.
There is also some evidence that the level of compliance is far below expectations.
There is lack of available information on the rate of compliance with energy building codes,
which reflects a general failure to monitor compliance in a systematic manner and to
evaluate the existing policy measures. Infringements that occur can range from significant
to minor, which also complicates the task of estimating additional savings opportunities
from enhanced compliance. However, indicative levels of non-compliance span
approximately 25% for appliance programmes to 50% for building regulations.
Carrots and sticks can be used to increase the rate of compliance with buildings codes:
Introduction of specific policy packages and incentives that complement or motivate
compliance (e.g. green loan programmes, financial incentives, including for some
countries relaxed building height and size restrictions (e.g. Japan and Lebanon).
Penalties or refusal of permission for occupancy or construction.
Strict enforcement is thus essential to ensure that new buildings are fulfilling the EBC
requirements (Figure 57). The World Energy Council’s case studies show that in some
emerging countries (e.g. Jordan, Egypt) enforcement is not rigorous and the impacts of the
EBC are negligible. Strict checks during the construction permitting and construction phase
are needed to verify the implementation of the EBC (Turkey is a good example). Penalties
for non-compliance secure energy savings during operation of the building (cost-)
effectively. Thailand and Singapore can be referenced in this case but most of the studied
emerging countries do not apply any penalties for non-compliance.
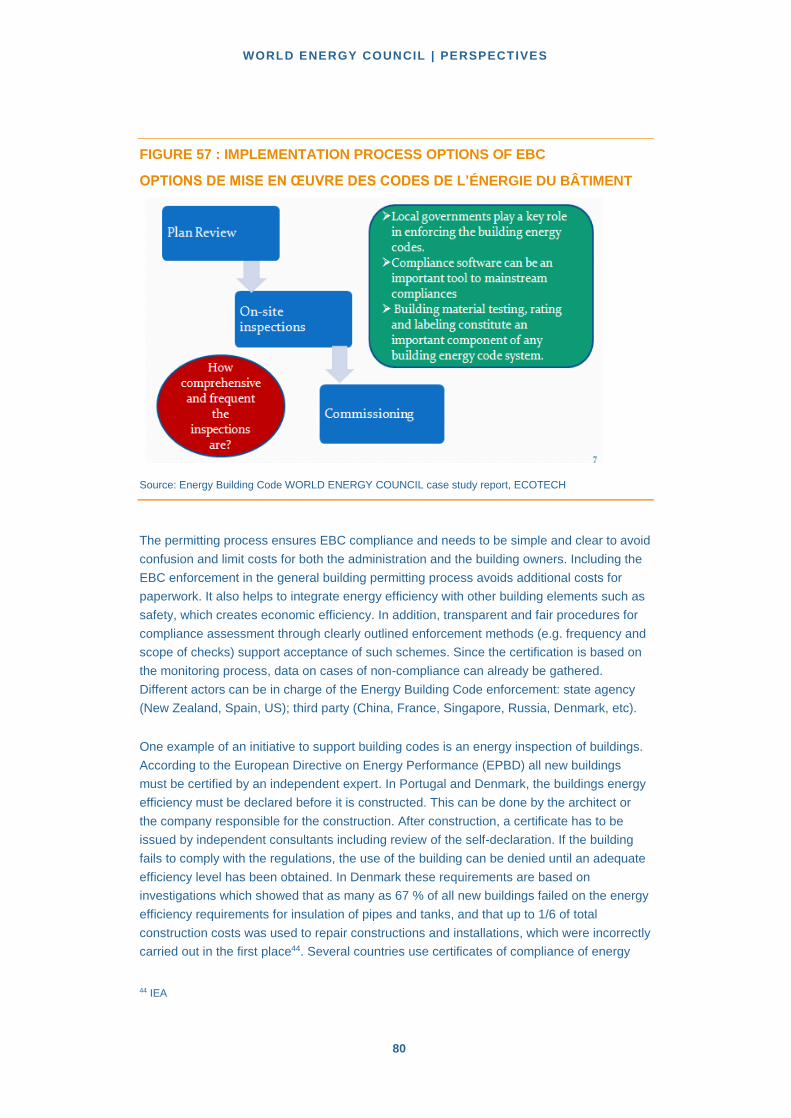
WORLD ENERGY COUNCIL | PERSPECTIVES
80
FIGURE 57 : IMPLEMENTATION PROCESS OPTIONS OF EBC
OPTIONS DE MISE EN ŒUVRE DES CODES DE L’ÉNERGIE DU BÂTIMENT
Source: Energy Building Code WORLD ENERGY COUNCIL case study report, ECOTECH
The permitting process ensures EBC compliance and needs to be simple and clear to avoid
confusion and limit costs for both the administration and the building owners. Including the
EBC enforcement in the general building permitting process avoids additional costs for
paperwork. It also helps to integrate energy efficiency with other building elements such as
safety, which creates economic efficiency. In addition, transparent and fair procedures for
compliance assessment through clearly outlined enforcement methods (e.g. frequency and
scope of checks) support acceptance of such schemes. Since the certification is based on
the monitoring process, data on cases of non-compliance can already be gathered.
Different actors can be in charge of the Energy Building Code enforcement: state agency
(New Zealand, Spain, US); third party (China, France, Singapore, Russia, Denmark, etc).
One example of an initiative to support building codes is an energy inspection of buildings.
According to the European Directive on Energy Performance (EPBD) all new buildings
must be certified by an independent expert. In Portugal and Denmark, the buildings energy
efficiency must be declared before it is constructed. This can be done by the architect or
the company responsible for the construction. After construction, a certificate has to be
issued by independent consultants including review of the self-declaration. If the building
fails to comply with the regulations, the use of the building can be denied until an adequate
efficiency level has been obtained. In Denmark these requirements are based on
investigations which showed that as many as 67 % of all new buildings failed on the energy
efficiency requirements for insulation of pipes and tanks, and that up to 1/6 of total
construction costs was used to repair constructions and installations, which were incorrectly
carried out in the first place44. Several countries use certificates of compliance of energy 44 IEA

ENERGY EFFICIENCY : A STRAIGHT PATH TOWARDS ENERGY
SUSTAINABILITY
81
efficiency requirements for new buildings, including many European countries, Japan and
Australia.
In case of non-compliance some countries enforce penalties, for instance in
Belgium/Flanders regions where fines are set for owners (builders, constructors or
installers) who fail the compliance test. This fine is based on the failure in U-values
multiplied by the surface area. For example, a one family house with non-compliant glazing
was fined €2,500.
BOX 11: GOOD OR POOR PRACTICES OF EBC COMPLIANCE FROM
EMERGING COUNTRIES
Egypt: The enforcement rate of building codes is still very low. The new building law
of 2008 has created a scheme to include the EBC in the licensing process, but by
itself will not solve the enforcement problem.
Chile: Thanks to the mandatory EBC for new residential buildings introduced two
decades ago, Chile is a pioneer in Latin America. Since 2000, the compliance for all
new residential buildings in Chile is required by the Municipal Works Department
(DOM) in every municipality, all over the country. In this way, concepts regarding
housing thermal insulation are introduced in the field of architects, builders, and
realtors, generating knowledge about the insulation of building elements and its
application is regulated by the DOM. The Housing Energy Rating (CEV) implies the
fulfilment of two consecutive energy performance certificates: first, a provisional
certificate for the architectural design on the design stage; and a second one after
construction.
Turkey: Municipalities check projects regarding Code compliance, as well as
verification and enforcement of thermal regulation. Construction inspection
companies control Code compliance during construction phase of residential and
commercial buildings. The Ministry of Environment and Urbanization controls the
code compliance during the construction phase for public buildings.
China: The compliance rates reported by the Ministry of Housing and Urban Rural
Development (MOHURD) have increased significantly from 5% design compliance
and 2% construction compliance in 2001 to 54% design compliance and 20%
construction compliance in 2004, to over 90% compliance for both construction and
design in 2010, based on annual inspection surveys in selected urban areas. The
improved compliance can be linked to strengthening the loop inspection system for
code implementation, instituting a detailed Code of Acceptance checklist for
inspections in final approval phase for projects, and establishing strict
noncompliance penalties.
Source: World Energy Council’s 2016 case study on Energy Building Codes, ECOTECH

WORLD ENERGY COUNCIL | PERSPECTIVES
82
3.2.4 OTHER REGULATORY MEASURES FOR CONSUMERS
The other regulations are mandatory requirements for designated consumers that are
usually large consumers, identified from energy consumption thresholds, in selected
sectors. Among these other regulations, energy audits, either in the form of walk-through
audits45 or detailed energy audits, are necessary to have a better understanding of the
current status of energy use and to identify potential actions for energy savings. Other
regulations also include mandatory maintenance, mandatory installation of solar water
heaters and obligation of energy savings imposed on utilities. Some other regulations, not
directly linked to energy efficiency that can also have a significant impact on energy use
(e.g. speed limit for vehicles), are not included in this review.
Mandatory energy audits have been implemented mainly in Europe and Asia. In Europe,
there is a greater focus on commercial, public and residential buildings compared to
mandatory energy audits in industry. The energy efficiency directive has made mandatory
energy audits in companies of certain size in industry and services from December 2015
(Article 8). The definition of large enterprises is left to the countries46. In Asia, audits are
imposed in several countries, mainly in industry and to a lesser extent in commercial
buildings. In Africa and The Middle East, few countries require mandatory energy audits
and they apply to large consumers in all sectors (e.g. Algeria, Tunisia).
Mandatory energy audits for buildings, especially in the residential sector, are more widely
spread and exist in many countries and regions. In South Korea, energy audits are
mandatory for energy-intensive companies whose annual energy consumption is over 2
000 toe. Small businesses consuming less than 10 000 toe of energy annually are eligible
for a 70% discount on the energy audit fees as charged by the government. Energy audits
do not lead to energy savings per se: the realisation of the measures proposed during the
audits is another critical point, unless there is a legal requirement to carry out the measures
found (Norway for instance). Quite frequently, the mandatory audits are therefore
accompanied by supporting measures such as subsidies for the audits or for investments,
training and seminars for the auditors and the staff of companies (both management and
technical staff).
The mandatory training of professionals increases the quality of audits or energy
management: 27 surveyed countries have implemented mandatory training for
professionals, more than half in the EU.
In the building sector in EU, the recast Directive makes several references to the
importance of training. In most countries, energy building codes call for changes in
conventional construction practice. Architects and engineers who know how to design safe,
sturdy, and attractive buildings may not know how to incorporate energy-efficient measures. 45 A walk-through audit is a basic and cost-effective exercise to identify opportunities for energy cost saving. 46 For instance, in UK, large enterprises are defined as companies >250 employees or >€50m turnover and >€43m balance sheet. Audits have to be done every 4 years.

ENERGY EFFICIENCY : A STRAIGHT PATH TOWARDS ENERGY
SUSTAINABILITY
83
Most countries have training programmes including written guidelines and example
calculations. Almost all of these countries also organized seminars, conferences, or
workshops on the topic. But usually this training tends to be focused on introducing the
standard rather than providing ongoing support for its use and is most of the time done on a
voluntary basis. The European Commission, through its Intelligent Energy Europe
programme, is providing support for training programmes.
Mandatory energy consumption reporting implies that designated large consumers
report their energy consumption, either directly to the government or in their annual report.
This measure is seen as an incentive to companies to monitor closely their energy
performance. Such measures exist in about 37% of the surveyed countries and are more
frequent in Europe and other OECD countries than in the other regions. This measure is
mainly applied in industry and public buildings.
Mandatory energy managers are imposed in companies above a certain size in about
25% of the countries surveyed. This measure usually applies to large consumers in industry
(14 surveyed countries) and in the service sector (20 surveyed countries). In some
surveyed countries, transport companies are also included (e.g. Japan, Romania, Vietnam
and Portugal).
Mandatory energy saving plans are required in slightly fewer than 25% of the surveyed
countries for large consumers, generally in industry. This measure exists for several
sectors, including in some countries municipalities.
Mandatory maintenance of energy-consuming equipment is another important field of
regulation. The concern is that without proper maintenance, the efficiency of some energy
consumers’ equipment (e.g. boilers, vehicles) decreases over time: the objective of the
regulation is to maintain as long as possible the initial efficiency of the equipment. This
measure concerns mainly EU countries, as a building directive (EPBD) makes mandatory
the maintenance of heating boilers and air conditioners above a certain size. In a few
countries (Italy, Romania), regulations on maintenance exist for the transport sector. The
mandatory technical controls for cars that exist in many countries may to some extent
contribute to save energy, depending on the items that have to be controlled.
Energy savings obligations for consumers
Several major energy efficiency programmes are based on an obligation on some part of
the energy supply chain to save energy in their customers’ premises, or to pay a levy for
energy efficiency, see Box 12 for Chinese and Box 13 for Indian example.

WORLD ENERGY COUNCIL | PERSPECTIVES
84
BOX 12: CHINA’S TOP-10,000 ENTERPRISES ENERGY EFFICIENCY
PROGRAMME.
Building on a previous, successful programme for the top 1,000 enterprises, the 12th
FYP highlights the Top-10,000 Enterprises Energy Efficiency Programme (Top-10,000
Programme) as a central approach to helping China achieve its energy intensity
reduction target. The Top-10,000 Programme actually covers more than 16,000 of
China’s biggest energy using enterprises, including more than 14,000 industrial
enterprises. These enterprises account for 85% of China’s total industrial energy use
and more than 60% of total national energy use. The Programme aims to achieve a
cumulative savings of 250 Mtce (625 Mt CO2e) by 2015. Energy savings agreements
between enterprises and the government set out responsibilities for both parties and
include mandatory, quantified energy savings targets for each enterprise.
Enterprises are also required to report on energy use patterns in specified formats,
assign energy management personnel, and meet minimum energy efficiency
performance standards for certain processes and equipment, as well as achieve their
savings targets.
Source: ACEEE
BOX 13: PAT SCHEME IN INDIA
Perform Achieve and Trade (PAT) scheme was established in India in 2012 under the
Nation Mission for Enhanced Energy Efficiency (NMEEE) as to contribute to energy
efficiency improvement in large energy intensive industries. The scheme consists of
a regulated market based certification trading system, where the certificates
(ESCerts, see explanation below) indicate the excess energy savings that can be
exchanged. In this way the specific energy consumption can be reduced while
improving cost effectiveness. The nine sectors that are notified under the scheme
are aluminium, cement, chlor-alkali, fertilizers, iron & steel, pulp & paper, railways,
textiles and thermal power plants with 478 industrial units in total at the first cycle
(2012-2013 to 2014-2015); these nine sectors accounted for about 36% of the total
consumption (or 60% of electricity’s industrial consumption) in India in 2010.
Energy Saving Certificates (ESCerts) show specific energy consumption (SEC)
savings achieved compared to a baseline level and a target level. These targets are
tailored for each facility on a relative basis of energy efficiency: more efficient plants
have lower targets, while less efficient ones have higher targets on specific
consumption. There is a different target range in % and in absolute consumption
values for each sector. The period for achieving the target is three years. 1 Mtoe is
equal to 1 ESCert. When the target is surpassed in an industrial facility, the ESCerts
are earned and can be sold on the power exchange market (e.g. Indian Energy
Exchange-IEX) to other facilities which have not fulfilled their SEC target
requirements. There is a penalty in case of non-compliance with the trading system.

ENERGY EFFICIENCY : A STRAIGHT PATH TOWARDS ENERGY
SUSTAINABILITY
85
FIGURE 58: PAT SCHEME AND ESCERTS – INDIA
SYSTÈME PAT ET CERTIFICATS D’ECONOMIE D’ENERGIE - INDE
The registration and trading process of ESCerts is supervised by BEE and the Central
Electricity Regulatory commission (CERC) functions as the market regulator. The ESCerts
can be exchanged only through the power markets. The ESCerts can be banked in each
cycle to be used in the next cycle. Currently the scheme is in the second cycle (2016-2017
to 2018-2019) and the number of industrial facilities covered is expected to double.
Source: Enerdata from BEE India
3.2.1. REGULATION WITH ENERGY COMPANIES: ENERGY SAVINGS OBLIGATION
Energy saving or efficiency obligation was initiated at the end of the 2000’s and is an
innovative measure in which energy companies (supplier/retailer or distributor) have a legal
obligation to undertake energy efficiency activities with their customers. If this obligation
can be met by trading energy saving certificates, this is usually called “White Certificates”.
In North America it is often called Energy Efficiency Resource Standards
As a consequence of the EU Energy Efficiency Directive (article 7), there are now 16
countries in Europe that have implemented or are planning to establish energy efficiency
obligation schemes: Austria, Bulgaria, Croatia, Denmark, Estonia, France, Ireland, Italy,
Latvia, Lithuania, Luxembourg, Malta, Poland, Slovenia, Spain, United Kingdom. Energy
saving obligations also exist for electricity suppliers in Kenya, Korea (where no quantitative
targets are set but the total investment budget for Demand Side Management programmes
implemented by energy utilities must exceed the total investment budget of the previous
year), South Africa, Brazil, Uruguay, Australia and USA.

WORLD ENERGY COUNCIL | PERSPECTIVES
86
The characteristics of energy savings obligation schemes depend on several factors that
explain differences among countries and change over time for a country:
Who are the obliged parties? And in the case of trading, who can participate in the
trading?
Who are the eligible consumers?
The volume of the targets and its mode of expression
What are the eligible energy saving measures?
The obliged parties are usually electricity and gas utilities; they also include district heating
in France, Denmark and Poland, as well as the distributors of motor fuels in France or Italy.
The eligible consumers are only households in UK, but cover all end-use sectors in other
countries (including transport in France or Italy). In Poland, energy producers, and
distributors are also included (mainly for district heating and electricity grid). The energy
intensive industries under the Emissions Trading System scheme in EU countries are
excluded. More and more the obliged energy companies are required to ensure that there
are savings for low income households (e.g. UK, France).

ENERGY EFFICIENCY : A STRAIGHT PATH TOWARDS ENERGY
SUSTAINABILITY
87
BOX 13: PAT SCHEME IN INDIA
Usually the size of the target and the sectors to be covered are decided by government.
The targets are allocated by companies in relation to the volume of energy supplied or
distributed. The targets are either expressed in lifetime savings or annual savings and in
different units: final (e.g. France) or primary energy47 (e.g. Italy since 2005), MtCO248 (e.g.
UK), US$ (e.g. Brazil)49. The savings are even discounted in some countries (e.g. France)
to account for the decrease of the economic value of the certificate and the gradual
decrease of savings over time.
The eligible measures are only actions or equipment better than the market average and/or
the performance level required by legislation (e.g. installation of refrigerators or freezers
with an energy label A+ or A++).
Most countries have penalties for those energy companies which do not fulfil their energy
efficiency obligation (e.g. UK). In practice, no penalty has been issued as virtually all
companies have met their targets50.
The energy savings are evaluated ex-ante for standard operations/equipment (“deemed
savings”). This approach greatly simplifies the monitoring and verification process which in
effect becomes the equivalent of counting the number of energy efficiency measures
implemented and can be verified using random sampling controls. To make the deemed
energy savings or engineering estimate approach work successfully, there needs to be
transparent and public information of the energy saving values, that needs to be published
well in advance of the obligation starting51. The counterpart of this approach is that it is
difficult to properly assess the reality of savings.
The targets have been increasing over time and are becoming more ambitious52; the initial
targets were deliberately low to leave time to market actors to get familiar with the
schemes. These schemes are just one component of the policy: most of the equipment and
operations benefit from various financial or fiscal incentives (e.g. France). The scheme acts
as an accelerator of decisions that households or other consumers are always hesitant to
undertake; utilities also contribute to inform consumers about actions they can take and
about the existence of these incentives.
47 Primary equivalent is usually taken to be 2.5 times final energy for electricity with the other fossil fuels being taken as equivalent to the final energy. For countries concerned about reducing their energy imports, the use of primary energy is often preferred. 48 For UK, since 2008, the target is explicitly set in CO2 savings: the UK Department Energy & Climate Change requires the largest energy suppliers to install measures in homes that will cumulatively reduce CO2 emissions by a certain amount. 49 In Brazil the target is in terms of annual expenditure; each distribution company submits proposals to ANEEL with estimates of the expected energy savings. 50 The targets have been for instance exceeded by 20% in France over 2006-2009 and by 30% for the second period 2011-2014. 51 In France, standardized technical file have been prepared to specify the amount of savings linked to all eligible energy savings actions or equipment. See http://www.developpement-durable.gouv.fr/Le-secteur-du-batiment-residentiel,42724.html (in French). 52 The present targets have been multiplied by 2 in France for the third period and by 2 in UK compared to the previous target.

WORLD ENERGY COUNCIL | PERSPECTIVES
88
The impact of the schemes, but also of the other incentives, is significant, in terms of
economic impacts: induced investments53, employment, reduced imports (balance of
payment) and lower expenditures for consumers.
The savings have been obtained mainly in the household sector (about 80% in France or
Italy and 40% in Denmark), from actions with low investment cost or taking advantages of
existing financial incentives: simple insulation (about 75% of savings with cavity wall
insulation in UK), CFL (about 75% of savings in Italy), heating appliances (efficient boilers)
(about 2/3 in France and Denmark).
But some certification programmes also target the industrial sector; one of the eligible
measures in Italy54 is improving the efficiency of electric motors in industry. Each of the
eligible projects is expected to issue tradable white certificates for a period of five years. In
Poland55, investors prepare investments and take part in a tender procedure organised by
the Energy Regulatory Office. The right to issue tradable white certificates based on
projects savings is liked to success in the tendering procedure. For example, the
replacement of electric motors and installation of variable speed drives to industrial motors
is listed among the eligible project types.
The cost is shared by consumers, companies and public budget, as these obligations are
combined with other measures (e.g. incentives). The cost for companies may be passed to
end customers in liberalised markets; for regulated consumers, the cost may be passed to
the regulated tariff (planned by most laws but not effective as long as costs are low for
companies).
Clearly the UK with its long experience and improvement of the scheme over time is among
the best practices; in particular, the requirement to get half of the saving obligation with low
income households is quite innovative, as these households do not take advantage of usual
financial incentive schemes and have a strong constraint for the upfront cost. Its
combination with a financial scheme (the “Green Deal”), enables them to tap more
expensive investments. In total the UK Department of Energy spent £240m on the Green
Deal between 2011 and 2015, it cost £3m to energy suppliers of meeting their energy
consumption obligations between 2013 and 2014, £94 overall cost per tonne of carbon
saved by the schemes compared to £34 for the previous set of scheme, and 2.3 million of
fuel poor households benefited from this programme56.
53 For instance: around €25bn estimated in France over 2011-2014. 54 The Italian white certificates scheme, which has been in operation since 2005, imposes obligations on electricity and natural gas distributors with more than 50 000 customers. 55 The Energy Efficiency Act of 2011 introduced a white certificate scheme and it started at the end of December 2013, an obligation is placed on suppliers of electricity, heat and gas fuels to end-users. 56 https://www.nao.org.uk/wp-content/uploads/2016/04/Green-Deal-and-Energy-Company-Obligation-Summary.pdf

ENERGY EFFICIENCY : A STRAIGHT PATH TOWARDS ENERGY
SUSTAINABILITY
89
Under an energy saving obligation scheme energy suppliers or distributors are obliged to
achieve certain energy savings among their customer. White certificates are documents
certifying that this saving has been achieved and the certificates can be traded.
Energy savings certificates can also be traded by direct contract between an Accredited
Certificate Provider and a buyer. Contracts and prices vary and there are currently no
standard contracts or a recognised exchange for trading energy savings certificates. This
market based mechanism enhances the cost effectiveness of improvements in energy
efficiency such as in energy intensive large industries in India (Box 13: PAT Scheme in
India). It requires the control and registration of savings. Although trading may be allowed in
the absence of formal certification, certificates enable and add a layer or credibility to the
trade.

WORLD ENERGY COUNCIL | PERSPECTIVES
90
3.3 INCENTIVES ARE STILL NECESSARY TO SUPPORT INVESTMENTS AND REGULATIONS
3.3.1. TRADITIONAL INCENTIVES: FINANCIAL AND FISCAL INSTRUMENTS
These are economic incentives aimed at encouraging investment in energy efficient
equipment and processes by reducing the investment cost, either directly (financial
incentives) or indirectly (fiscal incentives). Financial incentives include subsidies for energy
audits or investments and soft loans. Fiscal incentives include tax reduction, tax credit or
accelerated depreciation, as well as tax on inefficient equipment (appliances and cars).
Economic incentives can be defined as a fixed amount, as a percentage of the investment
(with a ceiling), or as a sum proportional to the amount of energy saved.
Even a moderate financial support (e.g. a subsidy or tax rebate) can be the final trigger for
an energy efficiency investment being implemented as they tend to be of secondary
importance in decision making compared to investments in production - regardless of their
cost-effectiveness. For instance, in industry, the requirements for pay-back times of energy
efficiency projects are usually between 1 and 2 years, and depend on the type of
investment (shorter for pure energy efficiency investments and longer for process
investments). And despite typically very short pay-back times for some industrial motors
(e.g. Variable Speed Driver) and relatively short pay-back times of efficient motors in
comparison to their lifetimes, financial incentives still have an important role in the
implementation of improvements.
In buildings, the pay-back times are much longer and can exceed 10 years and even 20
years with deep renovations. Without economic incentives and well-designed financing
schemes only few investments are done.
More than two thirds of surveyed countries have implemented some kind of fiscal or
financial measures. Financial incentives are dominant compared to fiscal measures in all
regions (87%, Figure 59).

ENERGY EFFICIENCY : A STRAIGHT PATH TOWARDS ENERGY
SUSTAINABILITY
91
0%
20%
40%
60%
80%
100%
Europe Africa & ME Asia America Total
Financial Fiscal
FIGURE 59: SURVEYED COUNTRIES WITH ECONOMIC INCENTIVES
PAYS AYANT DES INCITATIONS ÉCONOMIQUES
Source: World Energy Council’s energy efficiency survey 2016
Financial and fiscal incentives may be costly for the public budget if they concern a large
volume of equipment or investments over a long period of time. However, the exact cost for
the public budget has to take into account other positive feedback, such as increasing
investment that will bring additional tax revenues for the State as well as reduction in
employment benefits and thus in social expenses57.
Economic incentives have several well-known drawbacks:
They often attract consumers who would have carried out the investments even
without the incentive, the so-called “free riders” (e.g. high income households or
energy intensive industries).
Consumers that are targets of the schemes (small to medium industries, and low
income households) do not take advantage of them because they are unaware of
their existence. This demonstrates the challenges of informing a multitude of
consumers adequately about the existence of incentives. For instance, energy
subsidies (electricity or fuel) provide more benefit to higher social classes in
emerging countries that have access to energy- in addition energy subsidies can be
counter intuitive (economically speaking) as they are implemented to lower higher
price while these kind of incentives should be offered to encourage consumers
when prices are low.
57 The World Bank (WB) looked at energy efficiency financing and leverage effect than went up to a factor 9 for China: when WB invested USD0.4bn in energy efficiency, investments from private sector or any counterpart were equivalent to USD5bn.

WORLD ENERGY COUNCIL | PERSPECTIVES
92
Subsidy schemes may have a negative impact on the market by leading to an
increase in the cost of equipment, if manufacturers or contractors raise their prices
in anticipation of the rebates that purchasers will be granted;
Economic incentives may result in the spread of poor quality equipment (e.g.
CFL58).
These drawbacks lead to regular adaptations of the schemes. Economic incentives are now
better targeted to limit the number of beneficiaries (e.g. low income households59, tenants).
They are also restricted to certain types of investments (from a selected list of equipment),
with a long payback time but high efficiency gains (e.g. renewables, co-generation), or to
innovative technologies (demonstrative or exemplary investments60).
In areas where the cost effectiveness of energy efficient technologies is not too high,
subsidies are viewed as a temporary measure to mobilise consumers, to prepare for new
regulations, or to promote these technologies by creating a larger market than would
otherwise exist, with the objective of a cost reduction for the subsidised technologies. Once
the critical mass has been reached, economic incentives can be reduced and even stopped
without slowing down the diffusion dynamics.
However, the experience of several countries (e.g. Tunisia and Taiwan) with subsidies for
solar heaters shows that, if subsidies are discontinued prematurely, sales drop suddenly
when the market is not sufficiently mature. To limit these drawbacks, it is necessary to
avoid changing the subsidy schemes too often and in an inconsistent way. Subsidies
should also be reduced progressively and not stopped suddenly so that market actors can
anticipate their phase out.
In areas where the payback times are too high and not motivating investors (e.g. the
retrofitting of dwellings) financial incentives are necessary and cannot be removed before
investments become cost effective.
Financial and fiscal incentives are increasingly conditional upon quality label as a way of
promoting the use of high quality equipment. In practical terms, this means that economic
incentives are only granted for equipment that has an approved quality label (e.g. in Spain
the Plan RENOVE for efficient electrical appliances where the level of grants depends on 58 Since a few years back lighting subsidy programmes focus essentially on support for LED or efficient CFL like in Nigeria where a total of 1 million high quality CFL have been distributed free of charge to selected households across the country. This saved about 40MW of electricity. 59 UK has had for several years a strong programme targeted on low-income households. In Brazil, power utilities must invest at least 60% of the 0.5% of their net revenue (mandatory investment in energy efficiency) in low income households. Most of these resources are used for the replacement of old refrigerators by new certified by INMETRO. 60 In Australia, the Clean Technology Innovation Programme offers grants of AUD 50,000 - 5 million (€33,300- 3.3 million) to companies investing in R&D in energy efficiency. In addition, merit-based grants provide support for investment in energy efficient capital equipment and low emissions technologies and products.

ENERGY EFFICIENCY : A STRAIGHT PATH TOWARDS ENERGY
SUSTAINABILITY
93
0%
20%
40%
60%
80%
100%
Africa Asia Europe America Total
Energy audit Subsidies Soft loan
Tax reduction Tax credit Tax on inefficient equip.
Accelerated depreciation
the type of appliance and energy label)61. In the same way these incentives can be granted
to encourage the use of qualified installation contractors62.
To be effective, financial and fiscal incentives need to be combined with public information
and awareness campaigns to stimulate public interest in energy efficient equipment (see
next section on information measures). Where regulations have been introduced, additional
economic or fiscal incentives may be necessary to ensure that the initial extra costs
involved (at least during the early stages) do not give rise to increased costs for consumers.
Financial incentive programmes
Financial incentives fall into three broad categories: subsidies for audits, investment
subsidies and soft loans. According to the survey, among financial measures, subsidies are
dominant, except in Africa and Asia, and represent on average 50% of financial measures,
followed by soft loans (33%, Figure 60).
FIGURE 60: DISTRIBUTION OF FINANCIAL/FISCAL MEASURES BY TYPE
AND WORLD REGION
RÉPARTITION DES MESURES FINANCIÈRES / FISCALES PAR TYPE ET PAR
RÉGION DU MONDE
Source: World Energy Council’s energy efficiency survey 2016
Investment subsidies
Investment subsidies are popular in OECD countries where more than 80% of the surveyed
countries have subsidy schemes.
61 In South Africa, subsidies for replacing old motors are conditioned to a purchase of highly-efficient motors through motor suppliers registered with Eskom and for the motors technical specifications to be verified and approved. 62 For instance, in the Netherlands, the amount of the subsidy is determined by the performance of the installation.

WORLD ENERGY COUNCIL | PERSPECTIVES
94
Investment subsidies exist to retrofit existing buildings, dwellings or industrial facilities, and
thus shorten the payback times. In some countries incentives to fulfil the energy building
code are given through encouragement systems, which support compliance with
requirements. There are subsidies, which can only be obtained if certain energy efficiency
requirements are fulfilled. These are based on the pure compliance with requirements in
the codes or on measures stricter than the energy efficiency requirements in these codes.
In different regions of Austria there are subsidies combined with energy efficiency
requirements, which are stricter than the minimum requirements in the building codes. This
can be additional insulation, improved windows or installation of renewable energy sources
such as solar collectors, photo voltage or biomass ovens or boilers. In some Austrian
provinces this has led to nearly all buildings being constructed with an energy efficiency
which is better than the requirements in the codes, but as a minimum the requirements are
fulfilled.
Subsidies are also used to lower the price of efficient equipment that is usually more
expensive than the market average price (e.g. CFL, efficient motors or boilers, solar water
heaters), and are often conditional on old inefficient equipment being replaced:
Boilers in Denmark: subsidies for old oil-fired boilers (if replaced either by a heat
pump (geothermal heating or air-to-water), solar heating in combination with a new
oil/natural gas/wood pellet boiler, or if the residence is connected to district heating).
Electric motors in South Africa: Eskom launched an Energy Efficient Motors
Programme in mid-2007 to subsidise the replacement of old motors with highly-
efficient motors63. Efficient motor suppliers registered with Eskom are directly paid
by the subsidy, resulting in an immediate discount for the consumer. The purchaser
must trade in their old motor, along with all components, for scrapping.
Subsidies may also be given to equipment producers to encourage the development and
marketing of energy efficient equipment, to improve the quality and the cost of production.
Subsidies for energy audits
Spreading energy audits is a way of providing well targeted information to consumers to
help them undertake investments. Audit is a service where the energy efficiency of factories
or buildings is evaluated with the aim to suggest the best ways to improve energy
efficiency. Thus subsidies for energy audits aim at making them more attractive to
consumers, if they are not mandatory.
The subsidy is either a fixed amount or a percentage of the audit cost (e.g. 30%). Audit
subsidies are more frequently distributed in industry and public/commercial buildings than
in residential buildings.
63 Subsidies ranging from ZAR 400 to 3 500 (27-233 euros) are offered for premium efficiency motors. Eskom regularly performs random process compliance audits, while an independent measurement and verification body verifies the savings achieved by the programme.

ENERGY EFFICIENCY : A STRAIGHT PATH TOWARDS ENERGY
SUSTAINABILITY
95
The Energy Audit Programme (EAP) is one of Finland’s longest standing energy efficiency
grant schemes (since 1992). The EAP is a voluntary programme supported by a 40% to
50% subsidy by the Ministry of Employment and Economy. The implementation and
operation of the EAP is run by Motiva Oy (the Operating Agent), a state owned company.
Its duties include the promotion of audit activities, development of auditing models,
monitoring, the training of energy auditors and the quality assurance of audits. Audits are
carried out mainly by private consulting companies, which send all audit reports to Motiva,
who systematically controls the quality of the first audits undertaken by newly certified
auditors and also regularly controls the quality of audits through representative sampling.
Soft loans
Easy access to credit with appropriate conditions for financing the initial investment is a
fundamental measure to overcome the initial cost barrier. This is achieved by proposing to
consumers who invest in energy efficient technologies and equipment soft loans which are
loans at subsidised interest rates, i.e. lower than the market rate. Soft loans have the
advantage of being easily implemented by banking institutions. Specific credit lines with the
help of donors and the establishment of credit guarantee scheme by the State will
encourage banks to be more active by providing soft loans to finance energy efficiency
investments. Typically, soft loan programmes target small and medium sized enterprises
(SMEs). According to the World Energy Council’s database on Energy Efficiency Policies
and Measures, these programmes are equally common both in OECD and non-OECD
countries. In non-OECD countries loans are often provided by international development
organisations. Example of soft loans programmes include:
In Brazil, soft loans for commercial and public buildings have been provided by
BNDES - National Bank for Economic and Social Development. Those for
dwellings, mostly low income, have been provided by Caixa Econômica Federal
(Main federal housing agency).
In Taiwan low-interest loans are provided for SMEs for the purchase of energy
conservation machinery and equipment, including high-efficiency motors and
compressed air systems. The low-interest loans can cover up to 80% of the
investment cost. Up to 90% of interests are supported by the Small and Medium
Businesses Foundation. The loan period is seven years including a 3-year grace
period.
In France the Eco-Energy Loan Programme, running since 2012, is designed for
SMEs to finance certain particularly energy-intensive technologies including electric
motors. Loans have a 2% interest rate and range from 10 000 to 50 000 euros for a
period of five years, including one-year grace period. No additional guarantees may
be required.
In France again, the 0% Eco Loan supported by the French government to finance
energy-saving works in "old" properties (i.e. built before 1990). The purpose of
renovation work done under this programme is to reduce energy consumption and
greenhouse gases and promote the use of renewable energy sources. In order to
ensure that this is the case, the Eco Loan must, except for special circumstances,

WORLD ENERGY COUNCIL | PERSPECTIVES
96
be used to finance either a "package" of at least 2 renovation actions, or,
alternatively, work to improve the overall energy performance of a property, as
measured by an approved expert. The Eco Loan can be granted either to private
individuals or, as from January 2015, to a collective body (i.e. the residents
association).
In the same way, the German KfW bank offers soft loans to private buyers and
homeowners, landlords and housing companies. The programme promotes the energy-
efficient refurbishment of older residential buildings with loans at favourable conditions (the
loan is conditioned by the energy standard met after refurbishment; e.g. loan up to
100,000€ per housing unit for energy-efficient refurbishment plus a repayment bonus
calculated on the loan amount).
Fiscal incentive programmes
Fiscal incentives include first of all measures to reduce the annual income tax paid by
consumers who invest in energy efficiency: they comprise accelerated depreciation
(industry, commercial sector), tax credits and tax deductions (households)64.
Another form of fiscal incentive is to reduce the tax to be paid when purchasing energy
efficient equipment (VAT, import duties65 or purchase for cars) or when investing to improve
energy efficiency in buildings (reduction in VAT rate on labour cost). In the US, tax
incentives have been given in recent years to increase the level of insulation and to
encourage the constructer and building owners to go further than the minimum
requirements. These incentives have probably also helped to increase compliance with the
codes.
VAT reduction on labour costs to reduce the investment in building renovation is in use in
several European countries.
Accelerated depreciation is used mainly in industry and it is relevant for less than 7% of
surveyed countries. Fiscal measures also include tax reduction for the use of efficient cars
(annual registration tax). Reduction on the purchase tax and/or annual registration tax for
cars has been introduced in several European countries to promote the uptake of efficient
cars: they are usually linked to the CO2 emission of cars and therefore indirectly to their
energy efficiency. The objective is to offer consumers incentives to buy more efficient cars.
Tax concessions for companies that make concrete commitments to energy efficiency
gains/ CO2 reduction and meet their target are also another innovative way to promote
investment in energy efficiency. In Sweden, a possibility for a tax rebate on electricity tax
has been used as a ‘carrot’ in the voluntary energy efficiency agreements provided that
energy management system is implemented and savings are achieved. Singapore allows
one-year depreciation instead of the normal three years to replace old, energy-consuming 64 With tax credit, households can deduct part of the purchase cost of equipment from their income tax. With tax deduction they reduce the cost of equipment from their taxable income. 65 In Sri Lanka, energy efficient CFLs enjoy a lower import duty.

ENERGY EFFICIENCY : A STRAIGHT PATH TOWARDS ENERGY
SUSTAINABILITY
97
equipment in its scheme ‘One-Year Accelerated Depreciation Allowance for Energy
Efficient Equipment and Technology’ (ADAS).
The list of eligible equipment includes high efficiency electric motors. Similarly, in the United
Kingdom, the Enhanced Capital Allowance (ECA) scheme provides businesses with a first
year 100% tax allowance on designated energy efficient equipment investments, including
energy efficient motors and VDSs. The list of eligible products (the Energy Technology
Product List, ETPL) is updated monthly. In the Netherlands, an asset is eligible for 41.5%
deduction from the taxable profit when it is more energy efficient than standard equipment
used; this means a net discount of approximately 10% of the investment costs given the
25% taxation level for Dutch businesses.
Tax on inefficient equipment (appliances and cars) can discourage and thus incentivize
end-users to purchase new efficient products. Road charges are also considered as a fiscal
measure with an effect on energy use although their primary goal is to reduce congestion
and pollution. Several cities have implemented such schemes66.
Tax on electricity consumption can make the use of electricity more expensive and give an
incentive for energy efficiency, such as in Sweden where a general tax on electricity
consumption is set (about 0.03 $/kWh) on which VAT is also charged.
Fiscal measures on income tax or company tax work well if the tax collection rate is
sufficiently high. They usually have a poor performance in an economy in recession or in
transition and are more suitable for well-developed countries. However, unlike subsidies,
tax credits do not lower the barrier of the initial upfront payment.
3.3.1. ENERGY EFFICIENCY FUNDS TO SUPPORT INCENTIVE PROGRAMMES
Energy efficiency funds provide resources to support economic incentives. These funds are
usually implemented jointly by energy efficiency agencies, financial institutions or dedicated
institutions. Energy efficiency funds can also be supplied partially or totally from
international financing institutions (i.e. multilateral funds). Developing countries and
economies in transition mainly benefit from external finance in the form of special credit
lines with soft loans. The World Bank, Global Environment Facility (GEF)67, UNFCCC (see
UNDP, regional development banks (EBRD, ADB where energy efficiency is becoming the
first type of investment project), AFDB, EIB, national development banks (e.g. KfW, AFD,
CAF and national aid agencies (GIZ, USAID) are very active in financing energy efficiency
programmes. These funds are often set up as revolving funds (a good example is the
Thailand Energy Efficiency Revolving Fund or other revolving funds in Eastern Europe)
66 Singapore, the pioneer since 1975, several. Norwegian cities (e.g. Oslo, Trondheim and Bergen), London in 2003 and Stockholm in 2006. 67 The Romanian Energy Efficiency Fund is financed by the World Bank and GEF (US$ 2M/per annum). Or in Vietnam the Loan Guarantee Fund for energy efficiency in SME is financed thanks to GEF grants.

WORLD ENERGY COUNCIL | PERSPECTIVES
98
Different types of funds can be identified. Funds can be supplied partially or in total from
dedicated taxes to have more stable funding and be less dependent on annual budget
allocations. Funding from energy tax exist in different countries. For example, in Tunisia,
the Energy Transition Fund (aiming at promoting and encouraging renewable energies and
the industrial sector) is funded by tax on the sale of AC or by tax collected during the first
registration of tourist cars; or in Switzerland the building refurbishment programme is
financed through and earmarking CO2 tax. In Thailand the ENCON fund is supplied by a tax
on gasoline68.
To involve national banks a guarantee mechanism should be put in place. In Uruguay, a
trust fund for Energy Efficiency (FEE) projects is expected to operate by 2016. This fund
will guarantee up to 50% of bank loans for energy efficiency projects. Commercial and
public buildings will be able to apply to this scheme.
In Brazil, there is tax reduction on energy efficient appliances or investments, using a
specific funding (Financial Support Facility for Energy Efficiency Projects – PROESCO) in
the National Bank of Social and Economic Development (BNDES). In Austria, the Industrial
energy conservation is promoted through the Environmental Support Programme. This
initiative is managed by a special-purpose bank called Kommunalkredit Austria on behalf of
the Federal Ministry for Agriculture, Forestry, the Environment and Water Management.
Under this federal scheme, companies can obtain subsidies for thermal improvement of
buildings, other energy efficiency measures, or connection to the municipal district heating
and/or CHP systems.
BOX 14: THE UNFCCC GREEN CLIMATE FUND
The financial mechanism Green Climate Fund (GCF, adopted in 2011 and fully
operational since 201569) is a fund within the framework of the UNFCCC founded as a
legally independent institution to assist developing countries in adaptation and
mitigation practices to counter climate change. More precisely the GCF was
established by 194 governments to limit or reduce greenhouse gas emissions in
developing countries, and to help adapt vulnerable societies to the unavoidable
impacts of climate change. Over time it is expected to become the main multilateral
financing mechanism to support climate action in developing countries.
Heading into COP 21 in Paris, this Climate Finance Fundamental provides a
snapshot of the operationalisation and functions of the Fund. The Fund’s role in a
post-2020 climate regime as the major finance channel under the Convention as well
as the scale of its resourcing remain to be clarified and confirmed in Paris. Past
editions of this Climate Finance Fundamental detail the design and
operationalisation phases of the Fund.
Source: Overseas Development Institute
68 A similar fund exists in Thailand; the ENCON fund collects the revenue from a tax of 0.07 THB/l (0.002 US$) on all petroleum products (annual revenue US$200 m). 69 Approving USD 168 million for its first eight projects just weeks before COP 21.

ENERGY EFFICIENCY : A STRAIGHT PATH TOWARDS ENERGY
SUSTAINABILITY
99
Renewable energy; 961.7
Energy efficiency; 1370
Cleaner fuel; 146
FIGURE 61: ADB’S CLEAN ENERGY INVESTMENT BY PROJECT TYPE (IN
US$ MILLION)
INVESTISSEMENT EN ÉNERGIES PROPRES DE L’ADB PAR TYPE DE
PROJET (EN MILLION DE DOLLARDS)
Source: ADB, ACEF in Manila, 2016
Although a large volume of external finance to date has been invested in increasing the
efficiency of energy supply and distribution (e.g. upgrading district heating networks,
reducing T&D losses), an increasing share is now going to end consumers or demand side
management (Box 12 and 13).

WORLD ENERGY COUNCIL | PERSPECTIVES
100
BOX 15: DEVELOPMENT BANK OF LATIN AMERICA-THE CORPORACION
ANDINA DE FOMENTO
CAF’s Financial and Technical Assistance for demand side energy efficiency
In partnership with KfW, the Government of Germany, and the European Union´s
Latin American Investment Facility (LAIF), CAF has begun structuring an Energy
Efficiency Regional Programme that seeks to mobilize support for energy efficiency
measures in Latin America, both on the supply and demand side. The programme
has two main tools: a credit line and a technical assistance fund. The technical
assistance fund aims to help mitigate the complexity of the proposed projects. It will
provide assistance for the identification, structuring and pre-feasibility studies of
energy efficiency projects. The fund will allocate non reimbursable resources
provided by the Government of Germany, the Latin American Investment Facility
(LAIF) of the European Union and CAF. Once the projects have been identified as
feasible, they will be financed through a credit lines made available by local banks.
While CAF´s main focus has historically been on providing funds and technical
assistance to supply side players, it is now developing expanded regional
programmes and working with multilateral, regional and local institutions, to boost
its financial and technical assistance for demand side projects as well.
Source: International Development Finance Club

ENERGY EFFICIENCY : A STRAIGHT PATH TOWARDS ENERGY
SUSTAINABILITY
101
BOX 16: THE JESSICA FUND IN LITHUANIA
JESSICA - Joint European Support for Sustainable Investment in City Areas, is an
initiative of the European Commission developed in co-operation with the European
Investment Bank (EIB) and the Council of Europe Development Bank (CEB). It
supports sustainable urban development and regeneration through financial
engineering mechanisms.
During the period (2010–13), the Joint European Support for Sustainable Investment
in City Areas (JESSICA) financing mechanism was introduced, which provided €227
million from EU structural funds and state budget in the form of renovation loans
administered by financial intermediaries and subsidies to cover 15 percent of
investments. For several years, utilization of this mechanism and its implementation
were slow. However, project applications began to accelerate after the introduction
of municipal renovation programmes based on the EnerVizija model, an energy
service company (ESCO)–type investment model that created an additional
alternative for city- or district-wide renovation programmes (a) initiated by
municipalities and (b) managed by authorized building administrators, who became
borrowers of the renovation loans instead of apartment owners. It is supported with
up to a 15 percent subsidy; later, further incentives were introduced, including an
additional 25 percent subsidy from the Climate Change Fund and soft loans with a 3
percent fixed interest rate from the JESSICA funds.
On 18 February of 2015 the Ministry of Finance and the Ministry of Energy together
with the Public Investment Development Agency established the Energy Efficiency
Fund. The Fund will provide investments in energy efficiency projects using the
following financing tools: loans for the modernization of central government
buildings and guarantees for loans from commercial banks for the modernization of
street lighting projects. The Fund manages 79.65 million EUR. The first loans and
guarantees from the Fund were provided in the summer of 2015.
Source: World Energy Council, 2016 case study on Energy Building Codes,
ECOTECH
Energy efficiency funds can be entirely supported by the state budget, as in India where the
government has launched a new fund aiming at providing state governments with financial
help to promote energy efficiency. The Energy Conservation Fund is formed by
contributions from the state governments which can later request grants to promote energy
efficiency programmes.
3.3.2. ESCO AND PUBLIC PRIVATE PARTNERSHIPS TO ALLEVIATE THE PUBLIC FINANCING
An increasing and widely keen interest for ESCOs
Due to the pressures on public budgets, there is an increasing involvement of the private
sector in supporting investments in energy efficiency, through energy service companies
(ESCOs) and energy utilities.
An Energy Service Company (ESCO) is a company delivering energy efficiency services
WORLD ENERGY COUNCIL | PERSPECTIVES
102
that is wholly or partially paid based on the achievement of energy savings and/or on the
meeting of other performance criteria. ESCO’s generally cover a wide range of services
from energy audits, feasibility studies, engineering design, equipment procurement,
subcontractor management, construction, measurement and verification, operation and
maintenance and project financing. Experiences with ESCO financing have highlighted the
importance of contractual details, which reinforces the need for technical expertise in
contractual issues and a sufficient legal framework to support it. Performance contracting is
becoming increasingly popular in both industrialised countries and economies in transition.
ESCO activities exist in many countries to different degrees: introduced in 78% of surveyed
countries, e.g. 5,000 in China, over 1,000 in Spain, or around 500 in USA or Germany. In
China, the ESCO market has grown very rapidly and now represents a US$10 billion
business; it has been pushed by several measures that have been already mentioned in
this report, e.g. the five Year National Plan that sets energy efficiency targets, the 10.000
enterprises energy efficiency programme, mandatory energy efficiency standard for
buildings, etc. The other large emerging countries, such as India, Turkey and Thailand, etc.
have seen a limited development of ESCOs so far.

ENERGY EFFICIENCY : A STRAIGHT PATH TOWARDS ENERGY
SUSTAINABILITY
103
FIGURE 62: ESCO GLOBAL EXPERIENCES AND RESULTS-EXAMPLE OF
SUCCESS
EXEMPLES DE SOCIÉTÉS DE SERVICES ÉNERGÉTIQUES ET LEUR
RÉSULTAT
Country Market size Results Projects
United States
(FEMP)
US$3.8 billion - 18 trillion BTU/year
(2006)
- US$7.1 billion energy cost
savings
460 ESPC projects
Canada (FBI) US$240 million - 20% energy intensity
reduction
- US$30 million energy cost
savings
- 285 kit CO2 reduction
85 EPC projects (7,500
+ buildings)
Germany ~US$220
million
- 20-30% energy cost
reduction
- US$30-50 million energy
savings/year
2,000 properties
Japan ~US$100
million
- 12% energy intensity
reduction
- 265 kt CO2 reduction
50 ESPC projects in
FY06
South Korea ~US$190
million n/a
n/a ~1,400 public ESCO
projects
Source: World Bank, ACEF in Manila, 2016.
ESCO’s are widely promoted by the European Commission, the European Investment
Bank, the European Bank for Reconstruction and Development and the International
Energy Agency, as they provide a framework to encourage private funding to support
energy efficiency investments with a minimum role for governments. Article 18 of the
European Energy Efficiency Directive of 2012 contains a list of measures that Member
States shall adopt in order to promote energy services market, including the ESCO market.
Innovative packages have been implemented mixing the involvement of ESCOs to share
the burden and the risk or the combination of ESCOs with public subsidies (e.g. EESL or
PRSF in India or even an ESCO type approach within public administrations (see section
below on public-private partnership).
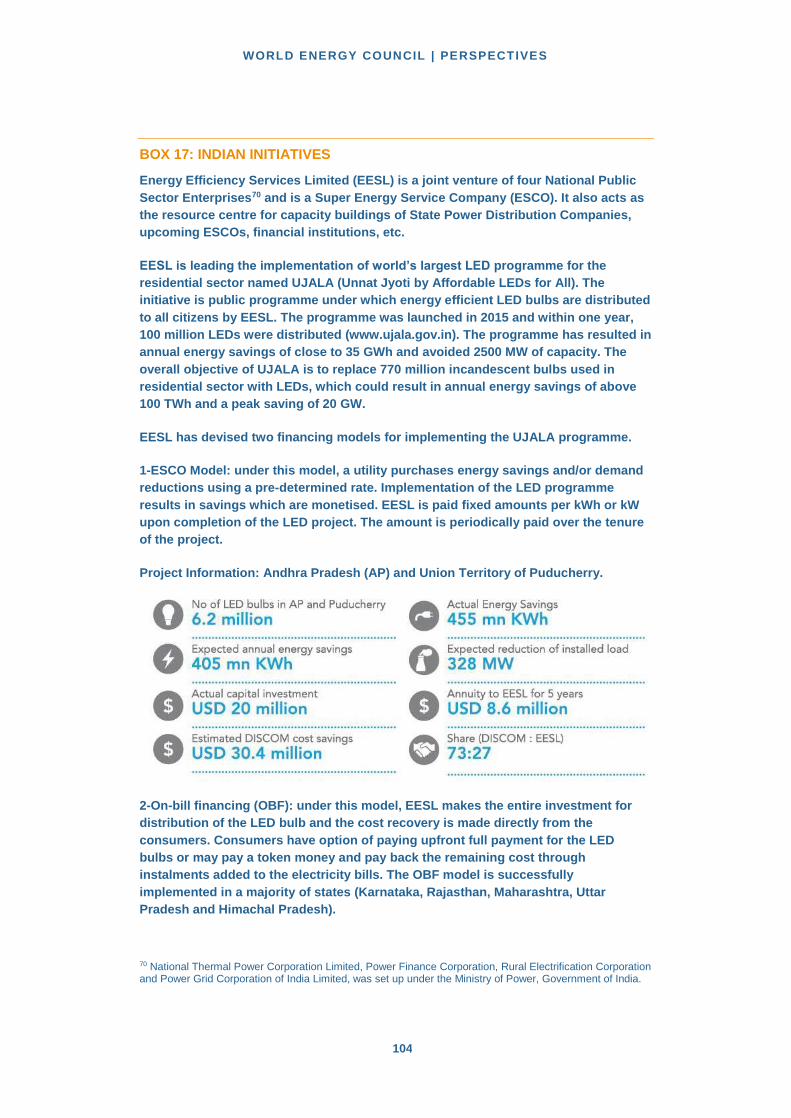
WORLD ENERGY COUNCIL | PERSPECTIVES
104
BOX 17: INDIAN INITIATIVES
Energy Efficiency Services Limited (EESL) is a joint venture of four National Public
Sector Enterprises70 and is a Super Energy Service Company (ESCO). It also acts as
the resource centre for capacity buildings of State Power Distribution Companies,
upcoming ESCOs, financial institutions, etc.
EESL is leading the implementation of world’s largest LED programme for the
residential sector named UJALA (Unnat Jyoti by Affordable LEDs for All). The
initiative is public programme under which energy efficient LED bulbs are distributed
to all citizens by EESL. The programme was launched in 2015 and within one year,
100 million LEDs were distributed (www.ujala.gov.in). The programme has resulted in
annual energy savings of close to 35 GWh and avoided 2500 MW of capacity. The
overall objective of UJALA is to replace 770 million incandescent bulbs used in
residential sector with LEDs, which could result in annual energy savings of above
100 TWh and a peak saving of 20 GW.
EESL has devised two financing models for implementing the UJALA programme.
1-ESCO Model: under this model, a utility purchases energy savings and/or demand
reductions using a pre-determined rate. Implementation of the LED programme
results in savings which are monetised. EESL is paid fixed amounts per kWh or kW
upon completion of the LED project. The amount is periodically paid over the tenure
of the project.
Project Information: Andhra Pradesh (AP) and Union Territory of Puducherry.
2-On-bill financing (OBF): under this model, EESL makes the entire investment for
distribution of the LED bulb and the cost recovery is made directly from the
consumers. Consumers have option of paying upfront full payment for the LED
bulbs or may pay a token money and pay back the remaining cost through
instalments added to the electricity bills. The OBF model is successfully
implemented in a majority of states (Karnataka, Rajasthan, Maharashtra, Uttar
Pradesh and Himachal Pradesh).
70 National Thermal Power Corporation Limited, Power Finance Corporation, Rural Electrification Corporation and Power Grid Corporation of India Limited, was set up under the Ministry of Power, Government of India.

ENERGY EFFICIENCY : A STRAIGHT PATH TOWARDS ENERGY
SUSTAINABILITY
105
BOX 17 INDIAN INITIATIVES CONTINUED
EESL followed a principle of aggregation of demand and undertook large e-
procurements for LEDs in a transparent and efficient manner to ensure that there are
economies of scale and there is continuity in demand generation. This has had a
positive impact on bulk and retail prices of LED bulbs – the bulk prices have reduced
by 83% (from $4.7 in January, 2014 to $0.84 in March, 2016). The retail prices have
reduced from $6-9 range in 2014 to $ 2-3 in 2016.
Source: EESL

WORLD ENERGY COUNCIL | PERSPECTIVES
106
BOX 17 INDIAN INITIATIVES CONTINUED
PRSF (Partial Risk Sharing Facility for Energy Efficiency): it provides commercial banks
with a partial coverage of risk involved in extending loans for energy efficiency projects
Source : Dr Sandeep Garg, SIDBI, Dec 2015

ENERGY EFFICIENCY : A STRAIGHT PATH TOWARDS ENERGY
SUSTAINABILITY
107
Replacement of electric motors, installation of variable speed drives (VSD) and
compressed air systems can be among the technologies covered by ESCOs. More recently
there has been increasing interest by VSD manufacturers to install VSDs in industrial
facilities using the ESCO model. In some cases, the VSD manufacturers have teamed up
with an existing ESCO serving industry. For instance, in Finland, the ESCO has provided
an energy audit, arranged financing, provided technical guarantees and monitored the
savings.
BOX 18: KEMIRA IN FINLAND
In Finland, VSDs were installed in five industrial fans (1 290 kW) in a fertilizer factory.
Power demand was cut down to 480-580 kW and annual energy savings totalled 4
000 MWh per annum The savings opportunity was identified in an energy audit and
implemented through the ESCO model. An investment subsidy of 25% was given to
the investment. The contract period with the ESCO company was three years during
which the ESCO received 80% of the avoided costs of electricity.
Source: World Energy Council, 2016 case on Electric Motors, MOTIVA
An increasing interest for public-private partnership in particular
for municipalities
Public-private partnerships (PPP) include private sector provision of a government
service, normally coupled with public oversight of the contracted entity. This way, private
money is used for investments and operational budgets. There is a spectrum of possible
contractual arrangements between public and private entities: these can range from
relatively short term service contracts to long-term joint venture arrangements. PPP offers a
range of risk-sharing mechanisms, it recognises the differing characteristics of public and
private stakeholders, and seek to optimise the effectiveness of public service delivery by
allocating risks to parties most suited to address them. And in line with contractual
conditions and risk-sharing arrangements, PPP proposes financial reward for private
parties.
PPPs can be considered as part of the range of policy and financial instruments available to
public authorities to “leverage” private finance. Municipal governments provide many
essential and basic infrastructure services, for example the delivery and management of
electricity, urban passenger transport, and street lighting services. And as the proportion of
the world’s population living in urban areas continues to grow (according to the United
Nations, 66% of the world’s population will live in urban areas in 2050 up from 54% in
2014), municipalities will face increasing demand for new and improved infrastructure
services.
Traditional sources of financing are often inadequate to fund local investment needs and
municipal governments often lack the capacity and resources to deliver quality services
alone. Thus urban environments provide interesting context for the design, testing and
implementation of PPPs, for example with regard to infrastructure development, such as
public lighting. They are characterised by the proximity and interaction of public and private
stakeholders to deliver highly context-specific services.

WORLD ENERGY COUNCIL | PERSPECTIVES
108
BOX 19: STREETLIGHT NATIONAL PROGRAMME (SLNP) IN INDIA
Streetlight National Programme (SLNP) is another initiative of EESL, where it
replaces the conventional streetlights with LED streetlights at its own cost (without
any need for urban local bodies or municipalities to make upfront investment in the
project) and consequently reduction of energy and maintenance cost of the ULB or
municipalities is used to repay EESL over a period of time. The contracts between
EESL and municipalities are typically 7 years long where it not only guarantees a
minimum energy saving of 50% but also provides free replacement and maintenance
of lights at no additional costs to the municipality.
EESL has implemented several streetlight projects in various states and cumulative
LED streetlight installations have reached 0.8 million units
(http://www.eeslindia.org/slnp). These streetlight installations are fitted with smart
centralised control and monitoring systems to enable remote operation with features
for real time energy monitoring and fault logic controls. The overall objective of the
SLNP is to replace 35 million conventional streetlights with LEDs, which would result
in annual energy savings of 9 TWh and peak reduction of 1500 MW.
Project information: EESL has implemented the LED streetlight project in Greater
Visakhapatnam Municipal Corporation (GVMC), where around 92,000 traditional
streetlights were replaced with LEDs. The project has resulted in a 50% reduction of
energy consumption.
Source: EESL, India

ENERGY EFFICIENCY : A STRAIGHT PATH TOWARDS ENERGY
SUSTAINABILITY
109
ESCO’s are however facing several barriers
The Joint Research Centre of the European Commission (JRC) has studied the general
barriers for ESCOs including e.g. low awareness, lacking motivation and small project size
particularly in SMEs. In addition, the following specific barriers were identified:
Difficulty to predict energy consumption and assess the project risk for consumers
High transaction costs for consumers
High technical risk perceived and concerns over the safety and reliability of
equipment
Fear of job losses
Energy savings are “not tangible” and payment of savings are perceived as full of
risks for banks. Lack of trust in ESCOs from banks
Because of those barriers, the ESCO market in India has struggled to develop and expand
in part due to its inability to obtain commercial financing from local banks and financial
institutions. The Partial Risk Sharing Facility for Energy Efficiency (PRSF) seeks to
overcome the barriers to commercial financing for ESCOs. The first component of PRSF
supports establishing and operating the facility to provide sub-guarantees to sub-financiers
and developing energy efficiency markets through end-to-end solutions and measurement
and verification activities. The partial risk sharing facility for energy efficiency is managed
by Small Industries Development Bank of India (SIDBI), funded from a Global Environment
Facility (GEF) contribution and backstopped by a Clean Technology Fund (CTF)
Guarantee, in the form of contingent finance71. Component two supports technical
assistance, capacity building, and operations support comprising.
The JRC proposes to alleviate the problem particularly in the SME segment of industry by
creating “mini-ESCOs” of the mechanical/electrical service contractors who already work
with SMEs. Most SMEs already have trusted service contractors who know their facilities
well and there is an on-going working relationship. The contractors provide preventive
maintenance, breakdown repairs and sometimes small capital upgrades. Small contractors
are particularly sensitive to maintaining good customer relations meaning that complex
contracts are not necessarily needed to cover contingencies of savings being less than a
guaranteed level.
A larger role of ESCO’s is still limited by the price being too low in many countries (due to
subsidies and low international prices), the reluctance of consumers to outsource energy
efficiency investments and the low involvement of the local banking system that is needed
to support the ESCO’s projects. Several actions can be implemented to raise the private
sector participation: ESCO facilitators to act as an intermediate between ESCO’s and
consumers (e.g. Thailand) and guarantee mechanisms attached to energy efficiency funds.
To overcome the barriers linked to the ESCO’s risky investment, technical advisors are
required to evaluate or guarantee the expected savings (e.g. Johnson Controls).
71 $25 million in Clean Technology Fund resources to develop a Partial Risk Sharing Facility for Energy Efficiency in India to leverage the market for implementing energy efficiency through risk sharing mechanisms.

WORLD ENERGY COUNCIL | PERSPECTIVES
110
3.4 INFORMATION DISSEMINATION TO MOTIVATE CONSUMER TO UNDERTAKE ACTIONS
Information and communication are key components of an energy efficiency policy to
motivate consumers and inform them about the technical and financial solutions to improve
energy efficiency. Beyond the traditional information campaigns and energy awards, more
targeted modes of information and communications have recently been developed, such as
energy efficiency platforms, information centres and their new form of “one stop-shops”,
and mobile applications.
3.4.1. ENERGY EFFICIENCY PLATFORMS
Energy efficiency platforms have been developed at different scales to create common
places of exchange. These platforms provide information on main topics of energy
efficiency and bring together industrial stakeholders, research organizations, academic
stakeholders, representatives of governments (national or regional), regulators, civil society
and NGOs. The collective knowledge within the platforms will generate new perspectives
which can strengthen the key energy efficiency policies.
The Global Energy Efficiency Accelerator Platform72 launched by the Sustainable
Energy for All (SE4ALL) offers a public-private collaboration to expand and create actions
to accelerate energy efficiency in five areas: vehicles, lighting, appliances, buildings and
district energy. The platform gives countries the opportunity to assess their needs and
priorities through a standardized menu of policy options and technical support leveraging
best-in-class toolkits, databases and subject matter experts.
The European Commission’s Joint Research Centre launched recently its European
Efficiency Platform73 (E3P). The platform intends to overcome the fragmentation of data
and knowledge of energy efficiency and foster cooperation among relevant stakeholders.
The core features are 4 collaborative tools:
The data hub, a one-stop-shop for the collection of data;
The wikEE for experts’ collaboration;
The Community to work in groups, where any specific can be discussed;
The Calls: if specific data, content or an expert is needed, a request can be
published on the platform.
72 http://www.se4all.org/energyefficiencyplatform 73 http://ec.europa.eu/environment/resource_efficiency/re_platform/index_en.htm

ENERGY EFFICIENCY : A STRAIGHT PATH TOWARDS ENERGY
SUSTAINABILITY
111
Sectoral platforms have been developed to go further on specific issues of energy
efficiency, especially for buildings, such as:
In Europe, the BUILD UP platform74 that is the official European portal for energy
efficiency in buildings. The comprehensive database of information covers news,
events, case studies, webinars, links to publications and other resources on energy
efficiency in buildings. Its interactive web portal catalyses and releases Europe’s
collective intelligence for an effective implementation of energy-saving measures in
buildings.
The Global Buildings Performance Network (GBPN75) platform is a worldwide
platform dedicated to buildings. The web-based tool stimulates collective research
and analysis from experts worldwide to promote better decision-making and help
the building sector to effectively reduce its impact on climate change. It is composed
of four exclusive online interactive and collaborative tools, including a Policy
Comparative Tool enabling comparison of the world’s best practices on policies for
new buildings (residential and commercial), by reviewing 25 state of the art building
energy efficiency codes and using 15 criteria developed with some of the world's
leading experts in the field.
3.4.2. SIMPLIFYING CONSUMER ACCESS TO INFORMATION: ONE-STOP SHOPS
To inform households on energy efficiency actions many countries have set up information
centres in the main cities to be as closed as possible of the consumers. In OECD countries,
the main target is to increase the rate of renovation of existing dwellings. It was found after
some years of operation that providing technical solutions was not enough and that these
centres should also provide financial solutions including information on existing public
support in terms of subsidies, tax credit or soft loans, information which was often
previously scattered among different organisations. Thus these information centres were
turned into the single place where households and small consumers can obtain
information on the existing technical and financial solutions in order to simplify consumer
access to the information necessary to enable energy saving actions. This new form of
energy efficiency information centres is often called “one-stop shops”.
Energy efficiency information centres and one-stop-shop services allow governments or
other information providers to provide better and more cost-effective services to their target
audiences. The centre or shop can be a physical place (permanent or mobile) or it can be
virtual, using telephone services, Internet services or increasingly a smart phone.
There are different types of one stop shop depending on their information level:
74 http://www.buildup.eu/en 75 http://www.gbpn.org/

WORLD ENERGY COUNCIL | PERSPECTIVES
112
FIGURE 63 ONE STOP SHOPS CATEGORIES BY LEVEL OF INFORMATION
CATÉGORIES DES GUICHETS UNIQUES PAR NIVEAU D’INFORMATION
Centre Type Explanation
Information One-way communication (generic)
Advice Two-way communication between” expert” and client
Practical services Offering/facilitating implementation services that save energy
Source: Energy information centre/one stop shop case study, 2016, ECEEE
The one stop shops allow to:
simplify the process of information gathering by supplying relevant materials to
users in one, easy to use place;
advise one or more groups, more often but not limited to end users. Advice may be
about energy efficient purchases or purchasing, available programmes, installation
or technical. That advice can be pre-prepared (e.g. booklets) or bespoke
(individualised to meet specific needs of consumer or person/organisation seeking
advice);
navigate the landscape of support, finance, technical and service provision, at the
very least signposting these services;
translate technical content;
motivate the energy user to take action to reduce energy use;
build capacity in the market to deliver both technical and non-technical services;
empower consumers or audience to take action by providing related services, such
as installation and/or financial and may link to other available government or utility
programmes.
The objective of the one-stop-shop measure is to address barriers, such as lack of
awareness and visibility, lack of information and knowledge in both client and supply chain,
fragmented offers from the commercial sector and in public sector incentives for
sustainable building renovations, the absence of more singular and universal opportunities
to which a service can be attached and the diversity of financial assistance and eligibility.
The efficiency of one-stop-shops can be evaluated through a survey of people who
received advice. A case study on the evaluation of one-stop-shops done by ECEEE reveals

ENERGY EFFICIENCY : A STRAIGHT PATH TOWARDS ENERGY
SUSTAINABILITY
113
conversion rates of different countries (number of clients who contact the service that go on
to undertake concrete measures) can be high and varied: 30% (Vietnam), 60% (France);
and 78% (Austria’s business focussed energy audit programme). However, it is not clear
from the reporting to what extent pre-disposition has been taken into account, if at all, in
these figures. A small number of cases evaluate and report on headline energy savings
from the service:
USA reports savings of 43 GWh in 2014 compared to a target of 38 GWh, with a
budget of US$11.8 bn).
France reports in its latest assessment of the direct environmental impact of EIE
carried out in 2011 by the ADEME a reduction of GHG emissions of 134 kt CO2 per
annum.
3.4.3. INNOVATIVE SMART PHONE APPLICATION
One of the newest innovations in energy efficiency policies is using mobile applications for
tracking labels. Some countries have been very innovative in making use of mobile
applications to provide consumers with clear and easily accessible information about the
energy saving properties of various types of equipment, such as white goods, lighting
equipment, water heaters etc. The consumers get real-time information and can compare
the products characteristics in a fast and user-friendly way, which is expected to increase
the market penetration speed of efficient appliances, as well as to overcome the barriers
related to consumers understanding the information on the label. Another important aspect
of mobile applications is to gain consumer feedback and thus better market surveillance
and information about compliance. India and China are the two big pioneers in this area
(Box 20).

WORLD ENERGY COUNCIL | PERSPECTIVES
114
BOX 20: MOBILE APPLICATIONS FOR EFFICIENT APPLIANCES IN INDIA
AND CHINA
In India, 21 types of appliances were regulated by standards and labels in 2015. The
Bureau of Energy Efficiency maintains a product database where relevant
information on labels for different brands is registered and can be explored. In 2015,
it launched a mobile application with a link to the product database providing daily
updated information. Users can filter products, see the energy saving and cost
saving and make comparisons between products. In the near future, the application
plans to include information on prices and product availability in retailer’s stores.
This feature will especially help to boost the sales of efficient appliances as in this
way customers can have easy access to the best performing products with the best
prices available.
FIGURE 64 MOBILE APPLICATION FOR LABELS – INDIA
APPLICATION MOBILE POUR LES LABELS - INDE
The China Energy Label (CEL) (also known as the Energy Efficiency Label-EEL) covers 29
products in 5 categories and features on products from over 9.000 manufacturers since
2005. To support the mandatory energy labelling programme a smart phone application
together with a QR code was added to the labels in 2013. The QR code is a detachable
part of the label, which can be scanned and contains a web link. providing all registered
data and information by product model.
Source: Enerdata from BEE India and http://www.energylabel.gov.cn/

ENERGY EFFICIENCY : A STRAIGHT PATH TOWARDS ENERGY
SUSTAINABILITY
115
3.5 GOING BEYOND CLASSICAL ENERGY EFFICIENCY POLICIES AND MEASURES
The efficiency of equipment and electrical appliances can be raised by adopting MEPS.
However, the age, maintenance and mode of use of the equipment are also very important
and have efficiency implications.
One important factor is the advanced replacement of old equipment to raise the
effectiveness of existing regulations because much equipment, especially in developing
countries, is used well beyond its planned service life.
Another important factor is the maintenance of equipment that can be crucial to avoid bad
practices. Since 2003, the inspection of heating boilers and air conditioning systems is
mandatory in EU (EPBD). Maintenance of cars and other vehicles is also mandatory in
many countries.
Governments also have to tackle the rebound effect that offsets the impact of policies.
Rebound effect can be defined by the phenomenon that an increase in energy efficiency
may lead to less energy savings than expected because of behavioural changes, mainly
increase use of the equipment. Communication, information campaign and trainings can
limit such behaviours.
Energy management systems to promote best practices in industry
Energy management systems (EMS) comprise a systematic and structured approach for
reviewing the energy needs of a company and for implementing measures to reduce
consumption, including putting in place monitoring and reporting systems. EMSs also cover
organizational issues, like purchasing rules for buying and installing highly efficient
equipment, maintenance procedures, training personnel and tracking and evaluation of
suggested and implemented energy saving opportunities.
Energy audits are an important energy management tool providing data on possible
energy efficiency improvements and their cost-effectiveness. They can also pave the way
for better commitment for implementing improvements. On the other hand, energy audits
are often also classified as an information instrument. A certified energy management
system necessitates the implementation of an audit.
The success of auditing schemes is closely linked with training of energy experts
conducting audits. Therefore, particularly in developing countries, audit schemes

WORLD ENERGY COUNCIL | PERSPECTIVES
116
should be accompanied by capacity development programmes. Among other activities,
energy audits are part of the Brazilian National Electricity Conservation Programme
(PROCEL) for industry. Recently, PROCEL Industry has focused particularly on measures
for optimising motor driven systems. In addition to energy diagnoses, the programme has
had a strong focus on capacity development. Training in motor system optimization has
been given to multipliers like university professors and consultants, and motor system
laboratories and education centres have been established in different universities.
Next, multipliers trained industry staff in order for them to be able to conduct energy audits
within their own companies. A project implemented by Unido in Indonesia aims to promote
pilot industries to have ISO 50001 certification during the project period from 2012 to 2017.
The project is also building capacity through tools and training on energy management,
including industrial systems optimization, to enable industries comply with ISO standards.
Over 70 projects on system optimizations were identified during the pilot assessments,
many of them involving motor driven systems with improvement potentials of 20% to 25%.
Box 21 describes an example of an innovative new approach developed in Sweden to help
in energy management. The novelty of the MOVE Model is that it involves visualization,
mutual learning, knowledge and experience sharing and can be implemented for identifying
continuous improvement actions. The method involves a "train the trainer" concept which
implies that corporate and process managers are trained by the project manager leading
MOVE workshops. In this way, the knowledge stays within the company at the end of the
project. 76
76 Svensson and Paramonova, 2015

ENERGY EFFICIENCY : A STRAIGHT PATH TOWARDS ENERGY
SUSTAINABILITY
117
BOX 21: THE MOVE MODEL IN SWEDEN
The MOVE Model (Method for optimizing system efficiency in electric motor systems)
was developed as an analytical methodology for identifying and addressing energy
efficiency improvement opportunities in existing and new industrial electric motor
systems. This participatory approach allows information acquired and knowledge
gained by industrial personnel working with energy issues, maintenance, and
production processes to be immediately used for improvement suggestions.
MOVE is a four-step chronological model. An energy audit may be needed in order to
define possible areas for improvement but it is not a requirement.
Start: An external ‘process leader’ coordinates the process. It provides an overview
of the methodology to the ‘process owner’ from the company. The process owner is
a person employed by the manufacturing company and has formal major
responsibilities in the manufacturing process analysed.
In step 1, the company organizes and sets up a ‘case study team’ consisting of at
least of four experts with knowledge and expertise in the relevant field, collects
critical data for the chosen manufacturing process and determines an internal
strategy to carry out the activities in the following steps. The collected data is
summarized and analysed by the external process leader. This is followed by a
feedback procedure involving the process owner and experts.
In step 2, a process mapping visualizes the process requirements affecting energy
use, the product value flow and how it contributes to internal customer satisfaction.
During this process mapping, the most interesting requirements are identified and
make up the overall criteria to identify new energy efficiency measures. Process
mapping is followed by brainstorming to involve all the participants and to capture
efficiency measures which are outside the system boundary.
In step 3, data is collected to describe the current system routines, automation
controls and technical components and sort them out into seven motor system
levels ranging from the motor (level 1) to full motor systems (level 3) and human
factor (level 7). The existing system is described and the data are evaluated in three
energy efficiency categories. Step 3 concentrates on internal efficiency by choosing
the best technology and methodology to meet the requirements identified for
external efficiency.
Step 4 combines solutions into a list of summarized energy efficiency measures. The
measures are analysed, evaluated and placed on an evaluation matrix. Measures
from different levels are combined to create new system solutions, meaning that
improvements from multiple levels are merged into system efficiency measure. The
matrix considers two important aspects of each measure, the impact and complexity
of implementation. Finally, the measures are voted for and the highest-rated
measures represent the area for the implementation process.
Source: Svensson and Paramonova 2015

WORLD ENERGY COUNCIL | PERSPECTIVES
118
Energy efficiency training to share best practices
Training courses for building sector professionals can help to enhance energy efficiency in
buildings or in industry and transport companies. For instance, the FEE Bat scheme
“Energy savings training for building firms and craftsmen” launched in 2008 in France offers
companies and individual craftsmen in the building sector the cross-disciplinary knowledge
and tools needed for:
a comprehensive analysis of energy performance when constructing or renovating
residential or commercial buildings.
more relevant advice for clients, including trades which the firm does not offer itself.
proposal and implementation by the firm or craftsman either alone or in conjunction
with other trades, of more comprehensive solutions in terms of energy savings,
incorporating building insulation, ventilation, high-performance equipment,
renewable energies, maintenance, etc.
The aim of the scheme is to increase and systematise the degree to which energy-related
aspects are taken into account in all building renovation work, based on high-performance
technologies and innovative solutions. ADEME measured energy savings from renovation
when the craftsman has received the Fee Bat training and estimated 5% gains.
Drivers can also significantly impact fuel efficiency of a tractor-trailer. For example, a report
completed by the American Trucking Associations’ (ATA) Technology and Maintenance
Council found a 35% difference between the most and least efficient drivers77. Drivers can
also influence fuel consumption through appropriate route selection and by ensuring proper
tire pressure. Training for drivers is a promising opportunity to improve the driver’s impact
on fuel costs. This training can take the form of courses in a classroom, online training
tools, or messages via phone or telematics systems to the truck, among others.
Studies from other countries have demonstrated that driver training can benefit carriers by
increasing fuel efficiency and reducing costs. For example, a study conducted by the
European Commission found that a one-day driver training course could result in a fuel
efficiency increase of five percent. In addition, Canadian researchers found that for
combination truck drivers, training and driver monitoring could result in a 10 percent fuel
efficiency increase78. Many driver incentive strategies are being deployed by fleets to
improve fuel economy and driver retention. Drivers can receive pay bonuses, per-mile pay
increases, or prizes for attaining predefined fleet-wide efficiency goals or out-achieving
other drivers.
77 Technology and Maintenance Council, A Guide to Improving Commercial Fleet Fuel Efficiency, American Trucking Associations, Arlington, VA (2008). 78 Whistler, D., “Fuel Economy 101,” FleetOwner Magazine, http://fleetowner.com/fuel_economy/fuel-economy-0701 (2011).

ENERGY EFFICIENCY : A STRAIGHT PATH TOWARDS ENERGY
SUSTAINABILITY
119
Inform consumers on benefits of replacement of equipment
To improve the energy efficiency of vehicles, boilers, windows, etc., scrappage
programmes are largely used because they are efficient for removing high polluters (section
3.3.1). The measure is a government budget programme to promote the replacement of old
products with modern and efficient ones. To encourage the replacement of equipment, the
Bonus-Malus is also a well-known measure to subsidize products that generate an
environmental benefit while taxing those that generate a negative impact. For example,
according to the Ministry of Ecology in France, the automobile bonus-malus had significant
impact on new vehicle sales:
the average emissions from new vehicles fell to 127gCO2/km in 2011 (compared to
149.3 in 2007);
over the first ten months of 2012, although the overall market shrank by 13.6%
compared with the same period of 2011, each of the tranches eligible for the bonus
saw its new vehicle registrations increase strongly (+75%) whilst those subject to
the "malus" saw their registrations fall (-28%).
Public benefit campaigns to drive or educate consumer’s usage
Public benefit campaigns aimed at raising consumer awareness of the costs and
environmental impacts associated with energy consumption address a variety of
stakeholders, primarily energy consumers, but also children (future energy consumers),
educators (educating/ training/ propagating consumer values/ attitudes and consumptions
patterns in future will-be energy users), manufacturers and other businesses, as well as
government agencies.
The Irish Power of One campaign (http://www.powerofone.ie) builds mainly on Education
and Communication. The campaign focuses on three issues: awareness of energy sources,
costs and environmental impacts. The campaign informs consumers about inefficient
energy uses that have an impact on costs and environment and calls on the responsibility
of the individual. An innovative approach is the presentation of examples:
In the “Power of One Street” project, the energy efficiency of 8 families from
different geographical and social backgrounds is tracked. Every month, the
participants were set a challenge to improve their energy efficiency. The savings
measured were announced to the media.
Another example is the “Power of One at Work” initiative, encouraging employers
and employees to be more energy efficient in the workplace. The initiative provides
basic guidance on energy efficiency for employees, business owners and managers
through an advertising campaign, a website and a toolkit for implementing a
workplace energy awareness campaign at the local level.
WORLD ENERGY COUNCIL | PERSPECTIVES
120
Rebound effect
The “rebound effect” is the phenomenon that an increase in energy efficiency may lead to
smaller energy savings than would be expected by simply multiplying the change in energy
efficiency by the energy use prior to the change. Rebound effects are normally expressed
as a percentage of the expected energy savings from an energy efficiency improvement, so
a rebound effect of 20% means that only 80% of the expected energy savings are
achieved. In the transport sector, e.g. for a trucking company, this could be the increase in
vehicle-kilometres driven after improved fuel efficiency in the vehicles used. In buildings the
saving after insulation of a dwelling may be less than expected because consumers will
raise their heating temperature after the insulation. The existence of the rebound effect has
been clear for a long time. However, the size of the rebound effect is much less clear.
This rebound effect corresponds to the direct rebound effect.
There is also an indirect rebound effect79. For example, drivers of fuel-efficient cars may
spend the money saved by buying other energy-intensive goods and services, such as an
overseas flight. Similarly, large reductions in energy demand will alleviate the tension
between demand and supply and translate into lower energy prices which encourage
increased energy consumption.
Both direct and indirect effects appear to vary widely between different technologies,
sectors and income groups and in most cases they cannot be quantified with much
confidence. There have been several studies published that attempt to estimate direct
rebound effects for specific energy efficiency programmes. These studies indicate that
direct rebound effects will generally be about 10% or less80. A literature review from the
same ACEEE study estimates that the indirect rebound effect amounts to 11%.
Smart energy systems require certain behaviour from users and extensive maintenance. If
the users are inadequately trained to use the new systems or to replace equipment, the
energy savings expected will not be achieved. To prevent this rebound effect resulting from
improper use, environmental certifications in the building sector increasingly contain a new
section that informs and trains users of the building on energy management systems set up
and maintenance. For example, in the French certification HQE, the section “care and
maintenance management” requires users to take into account and plan maintenance
during the construction of the project.
79 The sum of direct and indirect rebound effects represents the economy-wide rebound effect. When the rebound exceeds the savings, resulting in increased energy consumption from efficiency, the rebound effect is called backfire. 80 The Rebound Effect : Large or Small ?, An ACEEE White Paper, Steven Nadel, August 2012.

ENERGY EFFICIENCY : A STRAIGHT PATH TOWARDS ENERGY
SUSTAINABILITY
121
Chapter 4 The international dimension and the spill over effect of energy efficiency: multiple benefits
WORLD ENERGY COUNCIL | PERSPECTIVES
122
4.1 THE INTERNATIONAL DIMENSION OF ENERGY EFFICIENCY In the European Union, as part of its strategy, the European Commission presented
proposals to deliver a new deal for energy consumers, to launch a redesign of the
European electricity market, to update energy efficiency labelling and to revise the EU
Emissions Trading System. The package is an important step towards implementing the
Energy Union strategy with a forward looking climate change policy. The strategy gives
prominence to the "energy efficiency first" principle and puts households and business
consumers at the heart of the European energy market.
When the government of China took over the G20 presidency in 2016, it was clearly stated
that energy efficiency would remain a priority on the agenda of the G20 Energy
Sustainability Working Group (ESWG). The final communiqué by Energy Ministers
recognizes that “energy efficiency, including energy conservation, is a long-term priority for
G20. Improving energy efficiency brings social, economic, environmental and other
benefits, and plays a key role in shaping a sustainable future.” In a major step for energy
efficiency cooperation, G20 Energy Ministers adopted the G20 Energy Efficiency Leading
Programme (EELP), thereby “[agreeing] to take the lead in promoting energy efficiency.”
The EELP encourages countries in the G20 and beyond to pursue collaborative activities
on energy efficiency. It also opens new areas of cooperation: The Energy Ministers called
for International Partnership for Energy Efficiency Cooperation (IPEEC81) to work closer
with the International Energy Agency and other international organizations to “strengthen
the global voice for energy efficiency” and to “explore the feasibility of innovative
collaborative arrangements for international cooperation on energy efficiency.”
In Asia where the potential of energy savings is a top priority, during the plenary sessions of
the ACEF 2016 conference, Rachel Kyte, CEO of the Sustainable Energy for All and
Special Representative of the UN Secretary General said that, “We are ready for an
extraordinary new era of clean energy. The industrial revolution started in Europe, but the
future of clean energy is in Asia,” […]. “In order to turn around climate momentum, we need
to have GHG emissions peak in 2020, and not 2025. Efficiency must come first. It is the
cheapest fuel source and is available to everyone. Access need to be placed at the heart of
any clean energy transition. We need to delink ourselves from the carbon intensity of a
centralized power system that is failing and not providing the energy services people need.”
The declaration of the Energy and Mining Commission of the Latin American Parliament set
stated in November 2012 in Panama that “Energy efficiency must be part of energy policy,
and integrated in sustainable development strategy “… and that the following actions
should be promoted:
Correcting price distortions that undermine demand management
Approve national energy efficiency financing programmes
Improve government leadership-in its role of implementer, developer and regulator
Monitor data management based indicators 81 http://www.ipeec.org/

ENERGY EFFICIENCY : A STRAIGHT PATH TOWARDS ENERGY
SUSTAINABILITY
123
The fifth edition of the Sustainable Development Report on Africa (SDRA) produced by the
Economic Commission for Africa in collaboration with partner institutions states in its key
messages that ….“Energy efficiency and demand-side management practices need to be
enhanced” and that “African governments should capitalize on the under-tapped renewable
energy and energy efficiency opportunities, to meet sustainable energy requirements for
increased valorisation of its natural resource endowment and generate productive
employment and income for its citizens, particularly the young82”.
After COP21: high potential of energy efficiency improvement
Ban Ki-moon, UN Secretary-General emphasized at COP21 that "energy efficiency is our
best tool to reduce CO2 emissions".
Hundreds of governments, businesses and financial institutions pledged major action on
energy efficiency at COP 21 (Paris, December 2015), recognizing it as the basis of the
energy transition. The mobilisation of all actors around energy efficiency is gaining
attraction because it delivers significant economic and environmental gains:
Some 775 companies from 33 countries, more than 130 national, regional and local
governments and over 100 financial institutions are committing to ramping up
energy efficiency measures and investments under the Sustainable Energy for All
(SE4All) initiative's '100/100/100' campaign.
Of these, 75 companies have made specific commitments to increase their energy
efficiency in action that will save up to 62 TWh over the next five years.
As said previously more and more financial institutions are committing to better financing of
the energy transition. And during the COP21, 106 banks from 42 countries with a financial
capacity of US$ 250 billion and a group of Investors, managing close to US$ 4 trillion in
assets, have committed to a major increase in energy efficiency lending in their portfolios.
Led by the European Bank for Reconstruction and Development (EBRD) and the UNEP
Finance Initiative, this is a major undertaking toward the four-fold increase needed to
realize the full energy efficiency potential for climate change. According to ADB, by 2020
“Investment needed to meeting national targets in PRC, India and Southeast Asian
countries totalled $943 Billion; of which, 92% in PRC, 7% in India and 1% in Southeast
Asia.” And by 2030 “Investments of 1%-4% of overall energy sector spending can meet up
to 25% of the projected increase in primary energy consumption”.
The potentials for energy savings gained thanks to energy efficiency actions is tremendous,
and is becoming a priority in energy policies. For instance, UNEP estimated energy savings
in top 6 high consuming products83 can reduce global electricity use by over 2.500 TWh (or
the equivalent to 600 large power plants, see Figure 3).
82 http://www.uneca.org/sites/default/files/PublicationFiles/sdra_5_keymessages_eng.pdf 83 Lighting, air conditioning, refrigerator, computer, electric motors and transformers.
WORLD ENERGY COUNCIL | PERSPECTIVES
124
4.2 THE SPILL OVER EFFECT OF ENERGY EFFICIENCY: MULTIPLE BENEFITS
Independence and supply security
A crucial contribution on the road to energy independence is energy efficiency. At a time of
rising and volatile oil and natural gas prices, Europe is the largest importer of energy
worldwide. The EU currently imports approximately 50% of its energy consumption. This
ratio may increase to 70% in 2030 if no further measures are taken. Given the very limited
opportunities for increasing domestic natural gas production, increased energy savings and
development of local renewable sources are the main options for decreasing imports over
the long term. Ukraine is particularly reliant on natural gas in its energy balance, and most
of this gas is imported. It is particularly dependent on Gazprom, the Russian gas company,
for the supply to 14 million of households. Since the military conflict over Crimea, energy
efficiency measures are the priority of Ukrainian government to help ensure its supply
security.
Climate
Energy savings contribute directly to reduce GHG emissions and mitigate climate change.
Energy efficiency measures became one of the main tools used by climate policies.
Worldwide, the COP21 negotiations have resulted in agreement on which energy efficiency
is the main driver to keep the increase in global average temperature to well below 2°C
above pre-industrial levels. Energy efficiency is taking its place as a major energy resource,
the “first fuel” (as presented in Figure 1), in the worldwide context. Energy efficiency
measures also contribute to the overall resilience to climate change as they play a
protective role against extreme weather events. Energy efficiency improvements may be
considered as part of a strategy to pursue and expand the scope of climate change
adaptation measures.
Job creation
An investment in energy efficiency will first create opportunities for workers in industries
that are more labour intensive than average (for example a retrofit project will create jobs in
the construction sector). Many of the assessments include direct employment (directly
related to on-site operations), indirect employment (resulting from the supply of materials to
on-site operations), and induced employment (employment that arises from the generation
of revenue by the direct and indirect workers). Additionally, energy efficiency generates
energy bill savings over the life of the investment, which releases funds to support more
jobs in the economy by shifting jobs in the energy generation and distribution industries
(lower labour intensity) to jobs in all other industries (higher labour intensity). According to
the IEA, the potential for job creation ranges from 8 to 27 job years per €1 million invested
in energy efficiency measures. The American Council for an Energy-Efficient Economy
(ACEEE) estimates in its last available analysis (2010) that there were 830.000 energy
efficiency jobs in the United States (approximately 0.5% of the labour force of U.S), and
predicts numbers were increasing at a 3% annual rate some figures are given by sector:

ENERGY EFFICIENCY : A STRAIGHT PATH TOWARDS ENERGY
SUSTAINABILITY
125
FIGURE 65 JOB CREATION FIGURES BY SECTOR
NOMBRE D’EMPLOIS CRÉÉS PAR SECTEUR D’ACTIVITÉS
Sector Job creation figure Source
Appliances 2010 federal appliance standard had
generated 340.000 jobs and should increase
to 380.000 by 2030
Environmental
Entrepreneurs
Buildings Green building sector will support more than
3.3 million jobs by 2018 (1/3 of all U.S.
construction jobs).
U.S. Green
Building Council
Public Transportation In 2013, newly announced projects, projects
under construction and projects in operation
created 11.449 new jobs.
Environmental
Entrepreneurs
Smart grid and
Demand
management
The smart grid programme, part of the 2009
American Recovery and Reinvestment Act,
supported a minimum of 47.000 jobs
U.S Department of
Energy
Deforestation (indirect effect)
According to the IEA, 2.5 billion people or 52% of the population in developing countries
depend on biomass as their primary fuel for cooking (Figure 66). Over half of these people
live in India, China and Indonesia. However, in many parts of sub-Saharan Africa region,
more than 90% of the rural population relies on fuelwood and charcoal.

WORLD ENERGY COUNCIL | PERSPECTIVES
126
FIGURE 66 : SHARE OF TRADITIONAL BIOMASS IN RESIDENTIAL
CONSUMPTION BY COUNTRY
PART DE LA BIOMASSE TRADITIONNELLE DANS LA CONSOMMATION DU
SECTEUR RÉSIDENTIEL PAR PAYS
Source: IEA
Inefficient and unsustainable cooking devices, such as open fires (15 to 30% of efficiency),
can have serious implications for the environment, such as deforestation. Clearing land for
timber is one of the main causes of deforestation in developing countries. Fuel substitution
and improved stove efficiencies would help relieve the environmental damage of biomass
use.
Industry and services competitiveness and productivity
In the industrial sector, energy use is a significant operational cost for the paper industry
that energy savings can make the difference between operating or shutting down a plant.
Analysis of the most important industrial energy efficiency technologies has shown that a
productivity increase can be expected if energy efficient process technologies are
introduced (Walz, 1999).
Improving the energy efficiency of commercial building can result in gains in worker
productivity in addition to generating energy cost savings. Staff costs, including salaries and
benefits, generally account for about 90% of business operating costs. Considering this,
even a small percentage gain in productivity, multiplied by the number of employees, can
result in considerable savings. Comfort in offices through temperature, indoor air quality,
lighting, acoustics, physical space and humidity plays a key role in productivity as well. A
study used by the World Building Green Building Council estimated for example a reduction
in performance of 4% at cooler temperatures in offices and a reduction of 6% at warmer
temperatures.

ENERGY EFFICIENCY : A STRAIGHT PATH TOWARDS ENERGY
SUSTAINABILITY
127
Energy prices
Reducing consumption of the energy product reduces automatically the amount of energy
that participants must purchase. The same demand reduction also slides the market-
clearing point on the supply curve, backing down the most expensive supplies, resulting in
lower prices for all the remaining loads.
According to a study from Ecofys, the main effects of energy savings in energy prices in
Europe are:
the reduction of fossil fuel prices (1% for every 1% of energy saved),
lower electricity prices due to lower electricity demand,
infrastructure investments could be cancelled and will reduce prices further.
Income effect
When the enhancement in energy efficiency reduces the cost of a particular good or
service, consumers need to spend less on it to get the same output as before. This saving
represents an extra disposable income.
Energy/Electricity access
Over one billion people globally lack access to electricity and more than half of them are
located in Sub-Saharan Africa.

WORLD ENERGY COUNCIL | PERSPECTIVES
128
FIGURE 67 : POPULATION ACCESS TO ELECTRICITY IN 2012
POPULATION AYANT ACCÈS À L’ÉLECTRICITÉ EN 2012
Source: World Bank Global Electrification database 2015 (World Bank 2015)
Efficient and high quality energy services and applications can reduce the total cost of
providing off-grid energy by as much as 50% and decrease the need for expensive peak
capacities. Super-efficient appliances, income-generating equipment and other end-use
technologies can provide access to other energy services such as communication, cooling
or water pumping and also reduce the required energy supply investment to make off-grid
energy services more affordable. So energy efficiency can enable expanded energy
access.
Energy poverty
Recent estimates suggest more than 10% of the European population are unable to keep
their homes adequately warm (indicators from the EU Statistics on Income and Living
Conditions - EU-SILC). Other evidence points to particularly high levels of energy poverty in
specific regions of Europe, including Central Eastern Europe and Southern Europe.
Research suggests that energy poverty has important consequences if not addressed, such
as impacting health, further entrenching poverty and making other objectives less
attainable, e.g. addressing climate change.
Under the Third Energy Package, the EC put obligations on Member States to define
vulnerable consumers in the energy markets, and put in place measures to provide for their
adequate protection. Specifically, the Directives in question (2009/72/EC & 2009/73/EC)
state, “Member States shall take appropriate measures to protect final customers, and
shall, in particular, ensure that there are adequate safeguards to protect vulnerable
customers. In this context, each Member State shall define the concept of vulnerable
customers which may refer to energy poverty.

ENERGY EFFICIENCY : A STRAIGHT PATH TOWARDS ENERGY
SUSTAINABILITY
129
The Directives also state, “Member States which are affected and which have not yet done
so should therefore develop national action plans or other appropriate frameworks to tackle
energy poverty, aiming at decreasing the number of people suffering such situation.”
Energy efficiency retrofits of low-income housing offer a more enduring solution to these
problems than energy tariff subsidies or fuel payments because they address the cause of
fuel poverty, rather than the symptoms. A study using data from New Zealand’s Warm Up
NZ: Heat Smart programme evaluation indicated significantly higher monetised benefits
among families on low to modest incomes of USD 519 per year after the retrofitting
compared to USD 183 for higher-income families (Telfar et al., 2011).
Promotion of innovation
Minimum Energy Performance Standards and energy efficiency labels encourage but also
speed up research programmes and the development of innovative equipment in all
sectors. For example, in the building sector, the specific consumption of light has been
improved with the emergence of LED lamps. Smart grids are also a good illustration of
innovation to enhance the energy management of cities.
Governments have integrated that low-carbon or energy efficient technologies are part of
economic growth and job creation drivers and that innovation allow the emergence of
leader companies at national level.
Health effects
Changes of buildings that increase energy efficiency, for example improved insulation and
ventilation control, can reduce indoor air pollution with corresponding health benefits,
particularly for respiratory conditions, such as asthma. During extreme heat period or in
areas of warmer climates, efficient cooling devices can help reduce mortality. Improving the
energy efficiency of light allows lighting systems in cities and roads to be expanded. The
number of road accidents is reduced and cities are safer. Several studies that quantified
total outcomes found benefit-cost ratios as high as 4:1 when health and well-being impacts
were included. Apart from influencing residential well-being, from a public health point of
view such measures also reduce public health expenditure.
Focus on the multiple benefits of deep retrofitting

WORLD ENERGY COUNCIL | PERSPECTIVES
130
BOX 22: DRIVERS FOR HOME ENERGY RENOVATION: A WHOLE SET OF
BENEFITS TO BE CONSIDERED
The benefits coming from energy efficiency improvements in buildings are many and
affect different socio-economic levels. At the macro-level, deep renovation of the existing
building stock in the EU has multiple positive impacts:
the potential to reduce CO2 emissions by 80% by 2050, thus contributing to
climate change mitigation;
every investment of €1 million in upgrading the building stock in the EU can create
19 new direct jobs in the construction sector, of which the vast majority is local and
non-transferable, thus leading to economic vibrancy in the EU84;
in terms of improvements in energy security, the EU could gain up 130 days of
additional energy independence: the EU is importing nearly 54% of its primary
energy per year, spending more than €400 billion each year85 – and buildings
account for over one-third of the total final energy consumption in the EU. This
means that for a large part of the year, the EU is 100% dependent on foreign
energy imports. In 2011, the EU became fully dependent on imports as early as
June 18. But, by unlocking the energy efficiency potential in its buildings, the EU
could reduce the energy imports and keep its independence until October 26
each year86.
At the micro-level, as people spend almost 90% of their life in buildings, the benefits of
deep renovation are numerous as well:
the improved indoor climate of renovated buildings with better ventilation systems
leads to clear health benefits (such as the relief from symptoms of respiratory and
cardiovascular diseases, allergies and rheumatism);
the lower energy bills from renovated buildings reduce the stress that often arises
from the concern of not being able to pay (the so-called “heat or eat” problem87),
this way addressing fuel poverty at the same time;
84 Janssen and Staniaszek, 2012 85 Eurostat, 2013 86 EuroACE, 2014 87 IEA, 2014
ENERGY EFFICIENCY : A STRAIGHT PATH TOWARDS ENERGY
SUSTAINABILITY
131
days off work and associated productivity impacts can be monetized through a
calculation of lost earnings88. Including the value of reduced absenteeism of the
workforce due to better indoor climate has been shown to increase the NPV of
overall benefits (e.g. comfort, energy savings, enhanced cognitive ability) by
11.5%.In order to take into account the multiple benefits of building renovation,
governmental and financing instruments should therefore follow the “total cost of
ownership” principle, taking a systematic approach to balancing: maintenance
costs, operating costs (annually budgeted expenses for all activities necessary for
the routine, day-to-day use, support, and maintenance of a building or physical
asset, energy consumption, etc.) and replacement/refurbishment costs over the life
of the asset. This way, investments in renovation would be assessed by taking into
account the whole range of costs and revenues of the building's entire use phase,
having a holistic view that includes the multiple benefits.
Source: BPIE from literature89
88 Chapman et al, 2009 89 Buildings Performance Institute Europe (BPIE). Atanasiu B., Kontonasiu E., Mariottini F. (2014). Alleviating Fuel Poverty in The EU – Investing in Home Renovation, a Sustainable and Inclusive Solution. Brussels.
Buildings Performance Institute Europe (BPIE). Kunkel S., Kontonasiou E., Arcipowska A., Mariottini F., Atanasiu B. (2015). Indoor Air Quality, Thermal Comfort and Daylight - An analysis of residential building regulations in 8 Member States. Brussels.
Chapman, R. et al. (2009), Retrofitting housing with insulation: A cost benefit analysis of a randomised community trial, Journal of Epidemiology and Community Health, Vol. 63, No. 4, BMJ Publishing Group Ltd., London, pp. 271-277, www.ncbi.nlm.nih.gov/pubmed/19299400 (accessed 25 June 2014).
Copenhagen Economics. (2012). Multiple benefits of investing in energy efficient renovation of buildings. Copenhagen: Renovate Europe.
EnergieSprong. (2014). What we do. http://www.energiesprong.eu/index.php/what-we-do/
International Energy Agency. (2014). Capturing the multiple benefits of Energy Efficiency. Paris: OECD/IEA.
Janssen and Staniaszek (2012), How many jobs? A survey of the Employment Effects of Investment in Energy Efficiency of Buildings
VELUX. Rasmussen M. K., Wegener B., Fedkenheuer M. (2016). Healthy Homes Barometer 2016.
World Green Building Council. Alker J., Malanca M., Pottage C., O’Brien R. (2014). Health, Wellbeing & Productivity in Offices.

ENERGY EFFICIENCY : A STRAIGHT PATH TOWARDS ENERGY
SUSTAINABILITY
132
Chapter 5 Conclusions and recommendations

ENERGY EFFICIENCY : A STRAIGHT PATH TOWARDS ENERGY
SUSTAINABILITY
133
5.1 ENERGY EFFICIENCY TRENDS The primary energy intensity is decreasing in 80% of World Energy Council’s member
countries and most regions. However, the world economic crisis lowered the energy
productivity improvement (1.6% per annum between 2000 and 2008 compared to 1.3%
per annum since 2008).
The energy productivity improved more rapidly at the level of final consumers than at the
overall level for the world and in half of the regions since 2000 (1.7%per annum decrease
in final intensity vs 1.5% per annum for the primary intensity at world level)90.
Without these energy productivity improvements since 2000, world energy consumption
would have been 3.1 Gtoe higher in 2014, which avoided 7 GtCO2.
Since 2000, the average efficiency of thermal power generation has generally increased
slowly, except in China (addition of more efficient coal plants) and Latin America (adoption
of CCGT) where there was a rapid progress.
Since 2008, there has been a net slowdown in the intensity reduction in most regions
and at world level, because of the global crisis (-1.6% per annum between 2000 and 2007
and only 1% per annum since 2007).
The energy consumption of transport is generally growing much slower than GDP.
There is a decreasing trend in energy consumption per household. In OECD
countries, the main driver is energy efficiency improvement for space heating and
appliances. In emerging countries, it is the substitution of biomass with modern fuels for
cooking.
Everywhere there is trend towards more efficient electrical appliances because of
the regulations in place (MEPS and labels), which almost stop the growth in electricity
demand in OECD countries and is slowing down the progression in emerging countries.
There is however a rapid increase in electricity consumption per value added in
some countries in which the service sector is expanding with the diffusion of AC and
ICTs.
North America, Europe, CIS and Pacific OECD represent a decreasing share of total world
CO2 emissions from energy combustion (44% in 2014, compared to 63% in 2000). This
reduction is explained by the large increase in CO2 emissions in China (+ 14% for the share
of China in world emissions) and to a lesser extent in India (+ 3%) and the decrease of
these emissions in Europe and a relative moderation in other OECD countries.
90 This trend is mainly the result of growing losses in energy conversion, a phenomenon that is linked to two factors: on the one hand, the increasing use of electricity by final consumers and, on the other hand, the fact that electricity is predominantly produced from thermal or nuclear power plants, i.e. with losses. In other regions (like North America, Europe or Africa) reverse trends are observed thanks to the development of high efficiency power generation (mainly renewables with 100% efficiency).

WORLD ENERGY COUNCIL | PERSPECTIVES
134
5.2 ENERGY EFFICIENCY POLICIES AND MEASURES TO CONSIDER
The increasing number of countries with an energy efficiency law (+ 10 countries compared
to 2012 survey) can be considered as a sign of a strengthening and consolidation of the
institutional commitment on energy efficiency.
At world level, there is a global convergence of P&Ms (in particular for regulations that are
becoming widely implemented in some sectors) with local specificities.
Wide introduction of energy efficiency regulations (labels and
MEPS) to transform markets
Among regulations, energy efficiency labels are widely implemented and are important to
guide consumers and motivate manufacturers on energy efficiency products, Labels are not
sufficient to transform the market alone: they are the first step but need to be
complemented with MEPS to remove inefficient equipment or practices.
Information dissemination to motivate consumers to undertake
actions
To inform households on energy efficiency actions many countries have set up information
centres. Some of these information centres were turned into the single place where
households and small consumers can obtain information, so called “one-stop shops”.
Spreading energy audits is also a way to provide well targeted information to consumers to
help them undertake investments. Audit is a service where the energy efficiency of factories
or buildings is evaluated with the aim to suggest the best ways to improve energy
efficiency.
Financial incentives are still necessary to support investment
Regulations cannot address all areas of energy efficiency and economic incentives are still
crucial to encourage investment in energy efficient equipment and processes by reducing
the investment cost, either directly (financial incentives) or indirectly (fiscal incentives).
The role of ESCOs and EPC (Energy Performance Contract) should also be enhanced.
Users need to be pushed to avoid inefficient practices (human
factors)
The efficiency of equipment and electrical appliances can be raised by adopting MEPS.
However, the age, maintenance and mode of use of the equipment are also very important
and have efficiency implications.

ENERGY EFFICIENCY : A STRAIGHT PATH TOWARDS ENERGY
SUSTAINABILITY
135
One important factor is the advanced replacement of old equipment to raise the
effectiveness of existing regulations because much equipment, especially in developing
countries, is used well beyond its planned service life.
The multiple benefits of energy efficiency
In addition to promoting sustainable development and saving energy, energy efficiency
implies several positive side effects that have been described in this report.
WORLD ENERGY COUNCIL | PERSPECTIVES
136
5.3 RECOMMENDATIONS
Recommendations Implemented In progress Status quo Comment
Energy
prices
reflecting
real costs
Subsidized energy prices need to be adjusted to reflect
the real cost of energy supply in order to give the right
signals to the consumers. Although most countries
realize the need for this (e.g. in Mexico91), the
deregulation of energy prices is often a long process
due to public opposition and the need to change
progressively. Due to the decrease of oil recipes, many
oil producer countries in the Gulf region are increasing
energy prices (since 2014, Qatar, Kuwait, Egypt,
Bahrain, Angola, Saudi Arabia, Nigeria and Oman) but
also India, Argentina and Venezuela have removed part
of their fuel subsidies. In Tunisia as well, the
government did not pass the recent decline in energy
prices at international level on the domestic prices to
lower subsidies. As G7 nations recently pledge to end
fossil fuel subsidies by 2025, the countries should set
deadlines to gradually reform energy pricing. In
addition, a wider strategy is needed to enforce the price
reform through an independent body (e.g. regulatory
commission) responsible for pricing and explicitly linking
the additional revenue with specific public expenditure
goals introducing a “safety net” to protect the
economically disadvantaged part of the population.
Consumers
better
informed
As information is one of the main drivers of habits, it is
necessary to simplify messages on energy efficiency
actions and integrate information channels to reach
the majority of consumers. Advice to households
should be simplified by establishing contact/entry points
and harmonizing messages for instance through local
energy information centres, in particular one stop shops.
To facilitate consumer actions, updated lists of local
service and equipment suppliers could be provided if
possible in these local centres. The guidance for
possible actions, through audits for instance, is also a
key to facilitate consumer action. A larger audience can
be reached by using innovative ways of communication
(e.g. mobile applications in India and China).
The training of professionals through guidelines,
91 In Mexico, the prices of gasoline and diesel have been increased each month in 2014 to bring them closer to international levels.

ENERGY EFFICIENCY : A STRAIGHT PATH TOWARDS ENERGY
SUSTAINABILITY
137
Recommendations Implemented In progress Status quo Comment
example calculations, seminars and workshops aims at
increasing the quality of audits and energy
management.
Smart billing
and meters
Smart billing and meters represent a significant
potential for energy savings, as it improves
consumers’ ability to monitor and control their electricity
and gas use, ultimately leading to reduction in
consumption. During recent years, smart meters have
been widely deployed worldwide: China became the
leader of the smart metering market (250 million of
smart meters) and Asia planned to reach 70% in
coverage rate; 40% of American households have a
smart meter; at European level, Italy and Sweden are
the best examples (close to 90% of consumers with a
smart meter) and the Energy Efficiency directive
requires EU Member countries to deploy smart meters
by 2020. To realize savings, smart meters must be
used in conjunction with in-home (or on-line) displays or
web applications and well-designed programmes that
inform, engage and motivate people (feedback meters).
Innovative
financing
tools
Financial and fiscal incentives are still necessary to
support investment. However, financial measures are
relatively expensive for the public budget, especially
when a large share of equipment is covered or for long-
term investments. Thus to alleviate the public financing,
private investments in energy efficiency should be
facilitated by supporting the development of
intermediate third parties (e.g. ESCO’s, PPP) playing
a role of aggregator and filling the gap between
projects and finance. ESCOs are spreading all over the
world: especially in Europe, U.S., Canada but also in
Asia where China recorded a very fast spread.
However, for some regions (e.g. India), their
development is still limited. A larger role of ESCO’s is
still limited by the prices being too low in many countries
(due to subsidies and low international prices), the
reluctance of consumers to outsource energy efficiency
investments and the low involvement of the local
banking system that is needed to support the ESCO’s
projects. Several actions can be implemented to raise
the private sector participation: ESCO facilitators to act
as an intermediate between ESCO’s and consumers
(e.g. Thailand) and guarantee mechanisms attached to
energy efficiency funds.
Control of
Even if regulations are widely implemented over the
world, their impact depends on effective compliance.

WORLD ENERGY COUNCIL | PERSPECTIVES
138
Recommendations Implemented In progress Status quo Comment
compliance Policy and programme effectiveness should be
evaluated during and after implementation. For
instance, strict checks during the construction permitting
and construction phases are needed to verify the
implementation of the energy building code.
Strengthene
d and wider
regulation
To be effective, labelling programmes and MEPS
should be regularly revised and upgraded, as a way
of stimulating technical progress and ensuring steady
energy efficiency improvements.
In emerging and developing countries, regulations need
to be more much widely implemented, including in the
power generation sector (e.g. India, China where the
electricity demand grows significantly with the
increasing use of thermal power plants) and in electricity
transmission (egg Latin America). With the sharp rise of
annual construction rate in these regions, the building
sector also require the development of regulations.
Monitoring
Monitoring achievements and the impact of measures is
necessary to check the real impact of energy efficiency
policies. The monitoring and assessment tools include:
development of end-use data collection; development of
energy efficiency indicators; evaluation of measures that
work and do not work; promotion and use of
standardized procedures for measuring energy savings
(e.g. ISO 257); development of Energy Management
Systems; development of regular mandatory energy
audits. In that sense, the G20 IPEEC Building Energy
Efficiency Task Group (BEET) work to promote uptake
of best practices in the field of building energy
performance codes and to develop and track building
energy efficiency metrics.
Policies should also incorporate in their implementation
and evaluation the positive side effects of energy
efficiency. These multiple benefits include: climate
change, energy independence, opportunities for
workers, productivity increase, lower prices, energy
access, development of innovative equipment, health
benefits etc.
One additional barrier to energy efficiency is the multi-
level and multi -sectoral context of policy measures. For
instance, improving energy efficiency in transport falls
under the responsibility of multiple public stakeholders
including the Energy Ministry, but also the Transport
Ministry and the administrations of cities and regions for
urban and regional transport. In buildings, the control of

ENERGY EFFICIENCY : A STRAIGHT PATH TOWARDS ENERGY
SUSTAINABILITY
139
Recommendations Implemented In progress Status quo Comment
building permits, including building codes fall under the
responsibility of cities that often lack the resources and
expertise to carry out the necessary control; public
support may come from the Energy Ministry but also the
Housing Ministry, as well as again the administrations of
cities and regions. This institutional setting should be
taken into account when designing energy efficiency
policies; any coordination or simplification in the
decision making can only have positive effects.
International
cooperation
The development of international or multi-national
standards could help enhance international and
regional cooperation, in addition to regional testing
and harmonization facilities and certifications. For
instance, the harmonization of ASEAN standard (testing
methods) facilitates intra-ASEAN trade on higher
efficient appliances. Moreover, energy efficiency
platforms (e.g. SE4ALL, BUILD UP and GBPN) should
be used to exchange experiences in order to
benchmark policies and identify best practices

WORLD ENERGY COUNCIL | PERSPECTIVES
140
Chapter 6 References Figures Tables Acknowledgements

ENERGY EFFICIENCY : A STRAIGHT PATH TOWARDS ENERGY
SUSTAINABILITY
141
REFERENCES
IEA-2014-ENergy Efficiency Market Report
Sustainable for Energy- http://www.se4all.org/
ACEF CLEAN ENERGY FORUM- http://www.asiacleanenergyforum.org/
Sustainable Development Report on Africa (SDRA)
http://www.uneca.org/publications/sustainable-development-report-africa-iii
COP 21 http://www.cop21.gouv.fr/
UNEP, 2014 (estimated annual figure for 2030) Potential of improving energy efficiency in top 6
high consuming products
UNFCC definitions http://unfccc.int/ghg_data/online_help/definitions/items/3817.php
ODYSSEE www.odyssee.indicators.org
EUROSTAT http://ec.europa.eu/eurostat/data/database
CEDIGAZ http://www.cedigaz.org/
WORLD BANK database http://www.worldbank.org/
World Steel Association https://www.worldsteel.org/
UNIDO http://www.unido.org/unido-united-nations-industrial-development-organization.html
USGS http://minerals.usgs.gov/minerals/pubs/commodity/cement/
FAO http://www.fao.org/home/en/
IRF International Road Federation https://www.irfnews.org/
HDI from UNDP: http://hdr.undp.org/en/countries
BIEE project of UN ECLAC: http://www.cepal.org/drni/biee
WBCSD, Global Cement Database on CO₂ and Energy Information "Getting the Numbers Right"
(GNR), http://www.wbcsdcement.org/GNR-2013/index.html
The ICCT (for specific consumption of new cars): http://www.theicct.org/
The Energy Efficiency Directive for EU countries: https://ec.europa.eu/energy/en/topics/energy-
efficiency/energy-efficiency-directive
Estimations of the turnover of the stock of motors, IEA, 2015:
https://www.iea.org/media/openbulletin/4e_roadmap_for_motors_and_vfd_oct2015.pdf
Examples of building energy rating label: http://buildingrating.org/
Green Rating for Integrated Habitat Assessment-GRIHA, India: http://grihaindia.org/
WORLD ENERGY COUNCIL Case Studies: http://www.worldenergy.org/data/energy-efficiency-
policies-and-measures/
IEA 2011 Energy-Efficiency Policy Opportunities for Electric Motor-Driven Systems

WORLD ENERGY COUNCIL | PERSPECTIVES
142
Dr Sandeep Garg, SIDBI, Dec 2015, Delhi, India, World Energy Council Regional Meeting,
Energy Efficiency
EMSA 2014: https://www.motorsystems.org/
Promotion of efficient equipment in ASEAN thanks to harmonised testing methods, Pierre
Cazelles, International Copper Association
Overcoming Implementation Gaps Through a Business-Oriented Energy Management System
Support Package in China, Zach Friedman, Amelie Goldberg, and Wan Yang, Institute for
Industrial Productivity; Han Wei, Energy Foundation; China Bob Taylor, Energy Pathways:
http://aceee.org/files/proceedings/2015/data/papers/1-196.pdf
BEE (Bureau of Energy Efficiency), India:
https://beenet.gov.in/(S(yhl430bb1iky1halghmhnegl))/GuideLine/Introduction%20to%20ESC
erts%20Trading%20under%20PAT%20Scheme.pdf
Energy savings evaluation in France: http://www.developpement-durable.gouv.fr/Le-secteur-du-
batiment-residentiel,42724.html
Green Deal, UK Department of Energy: https://www.nao.org.uk/wp-
content/uploads/2016/04/Green-Deal-and-Energy-Company-Obligation-Summary.pdf
Overseas Development Institute https://www.odi.org/ // http://www.greenclimate.fund/home
International Development Finance Club: https://www.idfc.org/
World Bank, ACEF Manila conference 2016
Energy Efficiency Services Limited, India: http://www.eeslindia.org/Home.aspx?ReturnUrl=%2f
Global Energy Efficiency Accelerator Platform: http://www.se4all.org/energyefficiencyplatform
European Efficiency Platform:
http://ec.europa.eu/environment/resource_efficiency/re_platform/index_en.htm
BUILD UP platform: http://www.buildup.eu/en
The Global Buildings Performance Network Platform: http://www.gbpn.org/
Case study on evaluation of energy efficiency information centres and one-stop shops, ECEEE,
2016 https://www.World Energy Council-policies.enerdata.eu/Documents/cases-
studies/WORLD ENERGY COUNCIL-case-study-one-stop-shop.pdf
China Energy Label: http://www.energylabel.gov.cn/
The MOVE Model in Sweden, Svensson and Paramonova 2015:
http://www.eemods15.info/midcom-serveattachmentguid-
1e55deb49bde2cc5deb11e59efec78a7612ef6cef6c/policy1_anders_svensson.pdf
Technology and Maintenance Council, A Guide to Improving Commercial Fleet Fuel Efficiency,
American Trucking Associations, Arlington, VA (2008)
Whistler, D., “Fuel Economy 101,” FleetOwner Magazine,
http://fleetowner.com/fuel_economy/fuel-economy-0701 (2011)
The Rebound Effect : Large or Small? An ACEEE White Paper, Steven Nadel, August 2012
IEA: https://www.iea.org/publications/freepublications/publication/cooking.pdf
ENERGY EFFICIENCY : A STRAIGHT PATH TOWARDS ENERGY
SUSTAINABILITY
143
Saving energy: bringing down Europe’s energy prices, Ecofys, 2012:
http://www.ecofys.com/files/files/ecofys_can_foe_2012_saving_energy.pdf
World Bank Global Electrification database 2015:
http://data.worldbank.org/indicator/EG.ELC.ACCS.ZS
Warming Up New Zealand: Impacts of the New Zealand Insulation Fund on Metered Household
Energy Use, Arthur Grimes, Chris Young, Richard Arnold, Tim Denne, Philippa Howden-
Chapman, Nicholas Preval and Lucy Telfar-Barnard, 2011: http://www.mbie.govt.nz/info-
services/sectors-industries/energy/energy-efficiency-environment/documents-library/energy-
efficiency-docs/nzif-energy-report.docx.pdf
Buildings Performance Institute Europe (BPIE). Atanasiu B., Kontonasiu E., Mariottini F. (2014).
Alleviating Fuel Poverty in The EU – Investing in Home Renovation, a Sustainable and
Inclusive Solution. Brussels.
Buildings Performance Institute Europe (BPIE). Kunkel S., Kontonasiou E., Arcipowska A.,
Mariottini F., Atanasiu B. (2015). Indoor Air Quality, Thermal Comfort and Daylight - An
analysis of residential building regulations in 8 Member States. Brussels.
Chapman, R. et al. (2009), Retrofitting housing with insulation: A cost benefit analysis of a
randomised community trial, Journal of Epidemiology and Community Health, Vol. 63, No. 4,
BMJ Publishing Group Ltd., London, pp. 271-277, www.ncbi.nlm.nih.gov/pubmed/19299400
(accessed 25 June 2014).
Copenhagen Economics. (2012). Multiple benefits of investing in energy efficient renovation of
buildings. Copenhagen: Renovate Europe.
EnergieSprong. (2014). What we do. http://www.energiesprong.eu/index.php/what-we-do/
International Energy Agency. (2014). Capturing the multiple benefits of Energy Efficiency. Paris:
OECD/IEA.
Janssen and Staniaszek (2012), How many jobs? A survey of the Employment Effects of
Investment in Energy Efficiency of Buildings
VELUX. Rasmussen M. K., Wegener B., Fedkenheuer M. (2016). Healthy Homes Barometer
2016.
World Green Building Council. Alker J., Malanca M., Pottage C., O’Brien R. (2014). Health,
Wellbeing & Productivity in Offices.

WORLD ENERGY COUNCIL | PERSPECTIVES
144
LIST OF FIGURES
Figure 1: % of fuels in primary consumption including avoided consumption (world level) ....... 8
Figure 2: Emissions Reductions (ER) commitments in NAZCA................................................. 9
Figure 3: Potential of improving energy efficiency in top 6 high consuming products.............. 11
Figure 4: Countries covered by the WORLD ENERGY COUNCIL survey on energy efficiency
policies .................................................................................................................................... 15
Figure 5 : Primary energy intensity: purchasing power parities vs. exchange rates (2014) ..... 20
Figure 6: Variation of primary energy intensity by world region ............................................... 21
Figure 7: Trends in primary energy intensity (2000-2014) (% per annum) .............................. 22
Figure 8 : Influence of climatic corrections on the primary energy intensity (2010-2014) ........ 23
Figure 9: Avoided energy consumption from energy intensity decrease at world level ........... 23
Figure 10: Primary energy intensity levels by world region (2014) .......................................... 24
Figure 11: Primary energy intensity levels by country (2014) .................................................. 24
Figure 12 : Contribution of sectors to primary energy intensity (2014)* ................................... 25
Figure 13 : Variation of primary and final energy intensity (2000-2014) .................................. 26
Figure 14 : Final energy intensity, HDI, energy consumption/capita (2014) ............................ 27
Figure 15 : Role of structural changes in the GDP (2000-2014) .............................................. 28
Figure 16 : Primary energy intensity adjusted at EU power mix (2014) ................................... 29
Figure 17 : Trends in the average efficiency of thermal power production .............................. 30
Figure 18 : Average efficiency of thermal power production by country (%) (2014) ................ 31
Figure 19: Share of renewable in electricity production ........................................................... 31
Figure 20 : Rate of electricity transport and distribution losses (2014) .................................... 32
Figure 21: Energy consumption of industry per unit of value added ........................................ 33
Figure 22: Average energy consumption per ton of steel (2014) ............................................. 35
Figure 23 : Energy consumption per ton of cement (2013) ..................................................... 36
Figure 24: Energy intensity of transport ................................................................................... 38
Figure 25: Consumption of road transport per car equivalent ................................................. 38
Figure 26: Trends in road transport consumption (2000-2013, % per annum) ........................ 39
Figure 27: Specific consumption of new cars (litres/100km) ................................................... 40
Figure 28: Per capita rail mobility (km per inhabitant) ............................................................. 40
Figure 29: Energy consumption per household ....................................................................... 41
Figure 30: Electricity consumption per electrified household* and price (2014) ...................... 42
Figure 31: Electricity intensity of service sector (to value added) ............................................ 43
Figure 32: Distribution of world CO2 emissions from energy use (1990 and 2014) ................. 44
Figure 33: Variation of CO2 emissions from energy use .......................................................... 45
Figure 34: CO2 emissions per capita from energy combustion................................................ 45
Figure 35: Variation in CO2 intensity (2000-2014): impact of energy efficiency and fuel
substitutions ............................................................................................................................ 46
Figure 36: Countries implementing energy efficiency law ....................................................... 49
Figure 37: Main quantitative targets of energy efficiency programmes ................................... 50
Figure 38: Mode of expression of policy targets by region ...................................................... 51
Figure 39 : Targets of energy efficiency programmes by end-use sector ................................ 51
Figure 40: Countries with an energy efficiency agency ........................................................... 53
Figure 41: Overview of energy efficiency policies and measures ............................................ 55
Figure 42: Policies by product cycle phase – case of electric motors...................................... 56
Figure 43: Distribution of measures by type ............................................................................ 57
Figure 44 : Distribution of measures by end-use sector and by type ....................................... 57
ENERGY EFFICIENCY : A STRAIGHT PATH TOWARDS ENERGY
SUSTAINABILITY
145
Figure 45 : Distribution of measures by sector and by region ................................................. 58
Figure 46 : Example of comparative label in Sri Lanka ........................................................... 60
Figure 47 : Number of mandatory labels for household’s equipment (2015) ........................... 61
Figure 48 : Labels for refrigerators in residential (2015) .......................................................... 61
Figure 49 : Examples of building energy rating label ............................................................... 63
Figure 50 : Example of some energy labels for cars .............................................................. 67
Figure 51 : Surveyed countries with MEPS (2015) .................................................................. 68
Figure 52 : MEPS for refrigerators ........................................................................................... 69
Figure 53 : MEPS for air conditioning (2015) .......................................................................... 70
Figure 54: Market transformation in India for a selection of appliances................................... 71
Figure 55 : Building energy codes for new dwellings in residential ......................................... 73
Figure 56 : Policy impact on the sales of more efficient electric motors .................................. 76
Figure 57 : Implementation process’ options of EBC ............................................................... 80
Figure 58: PAT Scheme and ESCerts – India ......................................................................... 85
Figure 59: Surveyed countries with economic incentives ........................................................ 91
Figure 60: Distribution of financial/fiscal measures by type and world region ......................... 93
Figure 61: ADB’s Clean Energy Investment by Project Type (in $ million) .............................. 99
Figure 62: ESCO global experiences and results-example of success ................................. 103
Figure 63 One stop shops categories by level of information ................................................ 112
Figure 64 Mobile Application for Labels – India ..................................................................... 114
Figure 65 Job creation figures by sector ............................................................................... 125
Figure 66 : Share of traditional biomass in residential consumption by country .................... 126
Figure 67 : Population access to electricity in 2012............................................................... 128

WORLD ENERGY COUNCIL | PERSPECTIVES
146
LIST OF BOXES
Box 1: Sources of data used to calculate the energy efficiency indicators .............................. 13
Box 2 : Energy intensities at purchasing power parities .......................................................... 20
Box 3 : Influence of climatic corrections .................................................................................. 22
Box 4 : Consumption of road transport per car equivalent ...................................................... 39
Box 5: The Indian rating systems ............................................................................................ 64
Box 6: Technical definition of IE classes ................................................................................. 66
Box 7: Impact of labels and standards in India ........................................................................ 71
Box 8: Energy Building Code – different approaches .............................................................. 72
Box 9: Good practices ............................................................................................................. 74
Box 10: Promotion of efficient equipment in ASEAN thanks to harmonised testing methods .. 78
Box 11: Good or poor practices of EBC compliance from emerging countries ........................ 81
Box 12: in China, the Top-10,000 Enterprises Energy Efficiency Programme. ....................... 84
Box 13: PAT Scheme in India ................................................................................................. 84
Box 14: The UNFCCC Green Climate Fund ............................................................................ 98
Box 15: Development Bank of Latin America-The Corporacion Andina de Fomento ............ 100
Box 16: The JESSICA fund in Lithuania ................................................................................ 101
Box 17: Indian initiatives ........................................................................................................ 104
Box 18: Kemira in Finland ..................................................................................................... 107
Box 19: Streetlight National Programme (SLNP) in India ...................................................... 108
Box 20: Mobile applications on efficient appliances in India and China ................................. 114
Box 21: The MOVE Model in Sweden ................................................................................... 117
Box 22: Drivers for home energy renovation: a whole set of benefits to be considered ........ 130
ENERGY EFFICIENCY : A STRAIGHT PATH TOWARDS ENERGY
SUSTAINABILITY
147
ACKNOWLEDGEMENTS
The project team would like to thank the individuals who informed the project’s approach,
supplied information, provided ideas, and reviewed drafts. Their support and insights have
made a major contribution to the development of the report.
PROJECT TEAM
François Moisan, Chair of the World Energy Council Energy Efficiency Knowledge Network
Policies & Indicators, Didier Bosseboeuf, General Secretary of the World Energy Council
Energy Efficiency Knowledge Network Policies & Indicators, Bruno Lapillonne, Enerdata,
Carine Sebi, Enerdata, Nehir Samci, Laura Sudries, Nathalie Desbrosses, Guillaume
Routin, Elena Virkkala Nekhaev, Director & Senior Advisor, Technical Programmes, World
Energy Council, Didier Sire, Senior Advisor to the Secretary General, Head of Sectoral
Programmes, World Energy Council, Catriona Nurse, Senior Manager, World Energy
Council
CASE STUDIES Lea Gynther; Sirpa Mustonen and Erja Saarivirta from Motiva, Jason Erwin, Borg & Co. and
Eceee; Rod Janssen; Catrin Maby and Louise Sunderland (energy information centres and
one stop shops in buildings) and Adel Mourtada, Ecotech
KNOWLEDGE NETWORK MEMBERS, CONTRIBUTORS AND PARTICIPANTS OF WORKSHOPS Abdallah Khellaf, Centre for Renewable Energy Development, Algeria; Djamila Mohammedi, Sonelgaz, Algeria; Martin Palazzo,National University of Technology,
Argentina; Joao Carlos Oliveira, Petrobras Distribuidora S.A., Brazil; Renata Falcao,
Eletrobras, Brazil; Diego Sanchez Ochoa, Corporación Centro de Investigación y
Desarrollo del Sector Eléctrico, Colombia; Enrique C. Quispe, Universidad Autónoma de
Occidente, Colombia; Luis Nieto, Electrificadora del Meta S.A. ESP, Colombia; Magdalena
Urhan Rojas, Universidad Autónoma de Occidente, Colombia; Gert Preegel, Tallinn
University of Technology, Estonia; Tiina Koljonen, Technical Research Centre of Finland
(VTT), Finland; Alexandre Jeandel, GDF SUEZ, France; Bruno Lapillonne, Enerdata SA,
France; Didier Bosseboeuf, ADEME, France; François Moisan, ADEME, France; Jean-
Eudes Moncomble, Conseil Français de l'Energie/CME, France; Stéphane Taupin,
Electricité de France (EDF), France; Sylvain Hercberg, EDF Energy plc, France; Yann
Ménager, Ministry of Ecology, Sustainable Development and Energy, France; Bernd
Schnittler, MEW, Germany; Jan Witt, BDEW German Association of Energy and Water
Industries, Germany; Katja Freitag, Marquard & Bahls AG, Germany; Klaus Willnow,
Siemens AG, Germany; Matthias Boehm, Covestro Deutschland AG, Germany; Victoria
Orioli, Siemens AG, Germany; Alok Ranjan Behera, NTPC Ltd., India; Dharmendra
Parmar, Gujarat Electricity Regulatory Commission, India; Prabhat Varshney, PTC India
Ltd, India; Sameer Aggarwal, NTPC Ltd., India; Sethuraman Chandrasekaran, Bharat
Heavy Electricals Ltd. (BHEL), India; Saeed Mohazeb Torabi, Niroo Consulting Engineers
Co., Iran; Seyed Mohammad Sadeghzadeh, Iranian Member Committee/WEC, Iran;
Agostino Iacobazzi, ENEA, Italy; Raffaele Avella, Italian Association of Chemical

WORLD ENERGY COUNCIL | PERSPECTIVES
148
Engineering, Italy; Kazutomo Irie, Asia Pacific Energy Research Center (APERC), Japan;
Cynthia Kahumbura, Philips, Kenya; Namejs Zeltins, Latvian Academy of Sciences, Latvia;
Ali Berro, Beta Engineering, Lebanon; Antoine Skayem, FREE sarl: Free Renewable
Electric Energy, Lebanon; Aistija Vaišnorienė, National Commission for Energy Control and
Prices, Lithuania; Israel Jàuregui, National Commission for Energy Efficiency (CONUEE),
Mexico; Odón de Buen, National Commission for Energy Efficiency (CONUEE), Mexico;
Abdelmonim Chentouf, Ministry of Energy, Mines, Water and Environment, Morocco; Mina
Ouattassi, Ministry of Energy, Mines, Water and Environment, Morocco; Zohra Ettaik,
Ministry of Energy, Mines, Water and Environment, Morocco; Abraham Hangula, Desert
Research Foundation of Namibia, Namibia; Charity Nsofu, Electricity Control Board (ECB),
Namibia; Helvi Ileka, Solar Age Namibia; Namibia; Ishuna-Niita Amakutsi, Ministry of
Mines and Energy, Namibia; Ndakema Hamunghete, Renewable Energy and Efficiency
Institute Polytechnic of Namibia, Namibia; Petronella Kapolo, Electricity Control Board
(ECB), Namibia; Zivayi Chiguvare, Renewable Energy and Efficiency Institute Polytechnic
of Namibia, Namibia; Greg Visser, Energy Efficiency and Conservation Authority,New
Zealand; Mike Underhill,Energy Efficiency and Conservation Authority, New Zealand;
Rabiou Hassane Yari, Société Nigérienne de Charbon de l'Azawak, Niger; Abbas Musa,
Energy Commission of Nigeria (ECN), Nigeria; Adeola I. Eleri, Energy Commission of
Nigeria, Nigeria; B. G. Danshehu, Usmanu Danfodiyo, University, Nigeria; Godwin O.
Unachukwu, University of Nigeria, Nigeria; Arif Alauddin, National Energy Conservation
Centre - Pakistan, Pakistan; Asad Mahmood, ENERCON, Pakistan; Janusz Bąk, PSE
S.A., Poland; Eurico Correia, Associação Portuguesa de Energia, Portugal; Mohammed
Alazba, Qatar Environment and Energy Research Institute , Qatar; Emil Calota, ANRE,
Romania; Anna Illarionova, Enel Russia, Russian Federation; Georgy Ryabov, All-Russia
Thermal Engineering Institute, Russian Federation; Naif M. Al-Abbadi, King Abdulaziz City
for Science and Technology, Saudi Arabia; Andrew Etzinger, Eskom Holdings, South
Africa; Theo Covary, Unlimited Energy, South Africa; Antonio Lopez-Rodriguez, Repsol,
Spain; Juan Carlos Borhi, Universidad Tecnologica Nacional, Spain; Khetsiwe Khumalo,
Swaziland; Lukas Gutzwiller, Federal Department of the Environment, Switzerland;
Amaraporn Achavangkool, Department of Alternative Energy Development & Efficiency
(DEDE), Thailand; Janelle Spencer, Central Bank, Trinidad and Tobago; Subodh Chawla,
Emerson Electric Company, United Arab Emirates; Carolina Mena, Ministry of Industry,
Energy and Mining, Uruguay; Mauricio Zunino; Ministry of Industry, Energy and Mining,
Uruguay;
CONTRIBUTING NATIONAL MEMBER COMMITTEES
Algeria
Argentina
Brazil
Colombia
Estonia
Finland
France
Germany
India
Iran
Italy
Japan
Kenya
Latvia
Lebanon
Lithuania
Mexico
Morocco
Namibia
New Zealand
Niger
Nigeria
Pakistan
Poland
Portugal
Qatar
Romania
Russian Federation
Saudi Arabia
South Africa
Spain
Swaziland
Switzerland
Thailand
Trinidad and Tobago United Arab Emirates
Uruguay

ENERGY EFFICIENCY : A STRAIGHT PATH TOWARDS ENERGY
SUSTAINABILITY
149
SPECIAL MENTION ODYSSEE MURE Project in the EU, ECLAC, Latin America
REMERCIEMENTS
Ce rapport a été effectué sous le patronage du Comité des Programmes du Conseil
Mondial de l’Energie. Plus de 50 comités nationaux et équipes nationales ont participé
activement au bon déroulement de cette étude, particulièrement en répondant au
questionnaire sur les politiques et mesures nationales d’efficacité énergétique. Nous
voudrions adresser nos remerciements à tous les experts sans qui ce travail n’aurait pu
être accompli. Cette étude a également bénéficié de la contribution de plus de 100 experts
lors de plusieurs séminaires régionaux organisés au Royaume-Unis, en inde et au
Philippines par les comités nationaux du Conseil Mondial de l’Energie. Cette étude a
également tiré bénéfices des présentations et idées proposées lors de séminaires
régionaux sur les politiques d’efficacité énergétique, tels que les nombreuses réunions du
projet ODYSSEE MURE dans l’Union Européenne, les dialogues sur les politiques
énergétiques du CEPAL en Amérique Latine, ou encore lors du Forum 2016 Asian Clean
Energy. Ces participations ont contribué à davantage refléter les spécificités régionales
dans la mise en œuvre des politiques d’efficacité énergétique.
Nous tenons à remercier l’équipe de coordination technique d’ENERDATA qui nous a aidé
à élaborer des indicateurs homogènes pour le rapport et à synthétiser l’enquête, et plus
particulièrement Bruno Lapillonne et Carine Sebi qui ont dirigé cette étude, Nehir Samci et
Laura Sudries pour leur assistance dans la rédaction du rapport, Nathalie Desbrosses, pour
les indicateurs et Guillaume Routin pour le développement des deux bases de données
interactives sur les indicateurs et sur les politiques. Nous voudrions également remercier
les auteurs des études de cas: Lea Gynther; Sirpa Mustonen et Erja Saarivirta from Motiva
(études moteurs électriques), Jason Erwin from Borg & Co. et Eceee; Rod Janssen; Catrin
Maby et Louise Sunderland (étude guichet unique) et Adel Mourtada from Ecotech (étude
sur les réglementations thermiques)
Nos remerciements vont également à Elena Nekhaev du Secrétariat de la WORLD
ENERGY COUNCIL qui nous a beaucoup encouragés et conseillés dans notre travail.
François Moisan
Président du comité CME sur les politiques d’efficacité énergétique
Didier Bosseboeuf
Secrétaire Général du comité CME sur les politiques d’efficacité énergétique

WORLD ENERGY COUNCIL | PERSPECTIVES
150
OFFICERS OF THE WORLD ENERGY COUNCIL
YOUNGHOON DAVID KIM
Chair
JEAN-MARIE DAUGER
Co-chair
IBRAHIM AL-MUHANNA
Vice Chair – Special Responsibility
Gulf States/Middle East
NUER BAIKELI
Vice Chair – Asia
KLAUS-DIETER BARBKNECHT
Vice Chair – Finance
LEONHARD BIRNBAUM
Vice Chair – Europe
OLEG BUDARGIN
Vice Chair – Responsibility for Regional Development
JOSÉ DA COSTA CARVALHO NETO
Chair – Programme Committee
JOSÉ ANTONIO VARGAS LLERAS
Chair – Communications & Strategy Committee
MATAR AL NEYADI
Vice Chair – 2019 Congress, Abu Dhabi
ELHAM MAHMOUD IBRAHIM
Vice Chair – Africa
SHIGERU MURAKI
Vice Chair – Asia Pacific/South Asia
ROBERT HANF
Vice Chair – North America
JEAN-MARIE DAUGER
Chair – Studies Committee
CLAUDIA CRONENBOLD
Vice Chair – Latin America/Caribbean
--------------------------------------------------
CHRISTOPH FREI
Secretary General

ENERGY EFFICIENCY : A STRAIGHT PATH TOWARDS ENERGY
SUSTAINABILITY
151
PATRONS OF THE WORLD ENERGY COUNCIL
Accenture Strategy Marsh & McLennan Companies
Bloomberg New Energy Finance Masdar
Electricité de France Oliver Wyman
Emirates Nuclear Energy Corporation PricewaterhouseCoopers
ENGIE Siemens AG
GE Power Swiss Re Corporate Solutions
Hydro-Québec Tokyo Electric Power Co.
Korea Electric Power Corp. VNG – Verbundnetz Gas AG
World Energy Perspectives Energy Efficiency : a Straight Path Towards Energy
Sustainability published by the World Energy Council (2016) in partnership with ADEME.
Copyright © 2016 World Energy Council. All rights reserved. All or part of this publication
may be used or reproduced as long as the following citation is included on each copy or
transmission: ‘Used by permission of the World Energy Council’.www.worldenergy.org
World Energy Council, Company Limited by Guarantee No. 4184478
Registered in England and Wales No. 4184478, VAT Reg. No. GB 123 3802 48Registered
Office 62–64 Cornhill, London EC3V 3NH, United Kingdom
ISBN: 978 0 946121 55 7

ENERGY EFFICIENCY : A STRAIGHT PATH TOWARDS ENERGY
SUSTAINABILITY
152
Algeria
Argentina
Armenia
Austria
Bahrain
Belgium
Bolivia
Botswana
Brazil
Bulgaria
Cameroon
Canada
Chad
Chile
China
Colombia
Congo (Dem. Rep.)
Côte d’Ivoire
Croatia
Cyprus
Czech Republic
Denmark
Ecuador
Egypt (Arab Rep.)
Estonia
Ethiopia
Finland
France
Germany
Ghana
Greece
Hong Kong, China
Iceland
India
Iran (Islamic Rep.)
Iraq
Ireland
Israel
Italy
Japan
Jordan
Kazakhstan
Kenya
Korea (Rep.)
Kuwait
Latvia
Lebanon
Libya
Lithuania
Luxembourg
Malaysia
Mexico
Monaco
Mongolia
Morocco
Namibia
Nepal
Netherlands
New Zealand
Niger
Nigeria
Pakistan
Paraguay
Peru
Poland
Portugal
Qatar
Romania
Russian Federation
Saudi Arabia
Senegal
Serbia
Singapore
Slovakia
Slovenia
South Africa
Spain
Sri Lanka
Swaziland
Sweden
Switzerland
Tanzania
Thailand
Trinidad & Tobago
Tunisia
Turkey
Ukraine
United Arab Emirates
United Kingdom
United States
Uruguay
Zimbabwe
62–64 Cornhill
London EC3V 3NH
United Kingdom
T (+44) 20 7734 5996
F (+44) 20 7734 5926
www.worldenergy.org | @WECouncil